1. Introduction
The northern Gulf of Mexico (GOM) coastal circulation results from a combination of astronomical tides, GOM deep water eddies impinging against the shelf, the local atmospheric wind stress and heat flux, and riverine discharges through a vast stretch of wetlands and marshes into the coastal waters. Numerous studies including observations, analytical basic researches, reanalysis, and numerical simulations have been done for either the entire or part of the GOM at basin, regional, and local scales. A recent published book, edited by Sturges and Lugo-Fernandez [
1], collected a series of GOM circulation studies. Papers addressing the northern GOM coastal circulation in this book are the analysis of long term mooring data on the Louisiana and Texas continental shelf (LATEX) by Nowlin
et al. [
2] and a numerical model study by Morey
et al. [
3] of the northern and western GOM. With the advancement of oceanographic knowledge through start-of-the-art observational systems of the atmosphere, surface water, and deep water, each study represents successive steps in an understanding the circulation of the GOM. These studies indicated the coastal shelf circulation in the northern GOM has a large degree of variance in both space and time.
NOS Physical Oceanographic Real-Time System (PORTS
®) along the northern coast of the Gulf of Mexico provides real-time oceanographic data to promote safe and efficient navigation. These PORTS
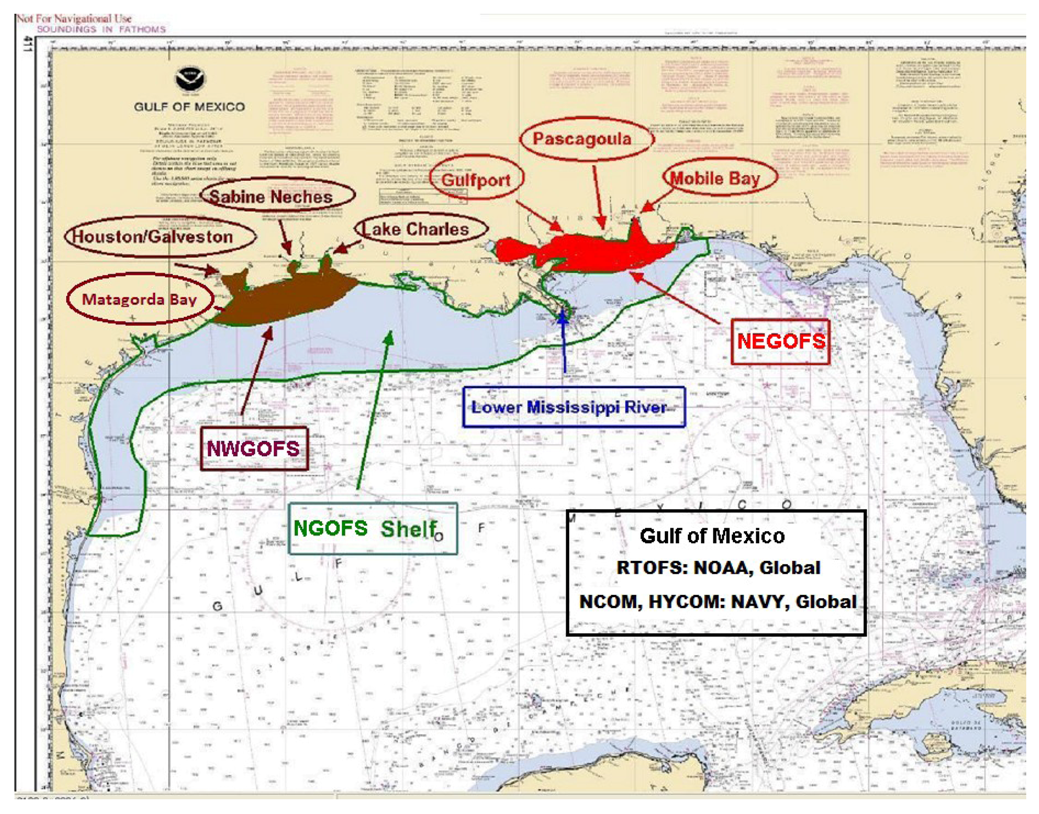
® in this region currently include Mobile Bay, Pascagoula, Gulfport, Lake Charles, Sabine Neches, Houston/Galveston Bay, and the proposed Matagoda Bay (
Figure 1). In conjunction with these real-time local observing networks, NOS has been tasked to develop numerical oceanographic prediction systems to accurately provide short-term forecast guidance of water levels, currents, salinity, and water temperature to primarily support safe and efficient maritime navigation in this region. The NGOFS, based on the three-dimensional unstructured-grid, free-surface primitive equation FVCOM [
4,
5,
6], was then developed by NOS and implemented operationally in March 2012 to provide forecast guidance out to two days for the northern Gulf of Mexico shelf region [
7] from South Padre Island, TX (west) to Panama City, FL (east). With the shelf circulation properly modeled by NGOFS, its predictions can be used for emergency responses and to support water quality, biological and ecological forecast activities.
Figure 1.
Schematic NOS PORTS® locations and nested Northern Gulf of Mexico model domain.
Figure 1.
Schematic NOS PORTS® locations and nested Northern Gulf of Mexico model domain.
In order to capture the spatial and temporal variability especially in inland bays and intra-coastal waterways where the commercial and recreational mariners require detailed forecasts for safe and efficient navigation, two higher resolution forecast systems were nested in the operational NGOFS. The NWGOFS covers Lake Charles, Sabine-Neches, Houston/Galveston, and proposed Matagoda Bay PORTS
® (
Figure 1). The NEGOFS covers Mobile Bay, Pascagoula, and Gulfport PORTS
® (
Figure 1).
2. Model and Grid Configuration
The FVCOM has been successfully applied in several coastal ocean regions to simulate the hydrodynamics using an unstructured grid. The governing equations and detail formulation has been documented in [
4,
5,
6]. Publications based on FVCOM applications can be found from this web page [
8]. In particular, the Northeast Coastal Ocean Forecast System (NECOFS) has been implemented by the University of Massachusetts at Dartmouth (UMASSD) in a real-time mode since 2007 with high resolution grid nesting functionality [
9]. FVCOM was chosen by NOS for the northern GOM region to simulate features such as the meso-scale eddies, the wind-driven coastal circulation, and the smaller scale coastal and estuarine circulation associated with complex shorelines, topography, tidal dynamics, and fresh water inputs.
The FVCOM Version 3.1.6 was used in the NGOFS regional shelf modeling system and also the nested NWGOFS and NEGOFS. The NWGOFS and NEGOFS focus on inland and coastal water dynamics of seven NOS’s PORTS
® in the area. Two rows of node from the NGOFS model grid with the corresponding elements are defined as the nesting boundary for the nested models. For NWGOFS, the nesting boundary node near NOS’s National Water Level Observation Network (NWLON) gage locations Port O’Connor, Texas (NOS ID 8773701) on the west and Freshwater Canal Locks, Louisiana (8766072) on east were selected as the nested boundary locations (
Figure 2). For NEGOFS, the nested boundary locations selected were near the Shell Beach, Louisiana (8761305) gage on the west and Pensacola, Florida (8729840) gage on the east (
Figure 3).
Figure 2.
Northwest Gulf of Mexico Operational Forecast System (NWGOFS) model grid.
Figure 2.
Northwest Gulf of Mexico Operational Forecast System (NWGOFS) model grid.
Figure 3.
Northeast Gulf of Mexico Operational Forecast System (NEGOFS) model grid.
Figure 3.
Northeast Gulf of Mexico Operational Forecast System (NEGOFS) model grid.
The shoreline data are taken from NOAA’s National Geophysical Data Center (NGDC) high resolution shoreline/coastline resources data base. The nested model domains with corresponding NOS’s PORTS
® are shown as
Figure 2 and
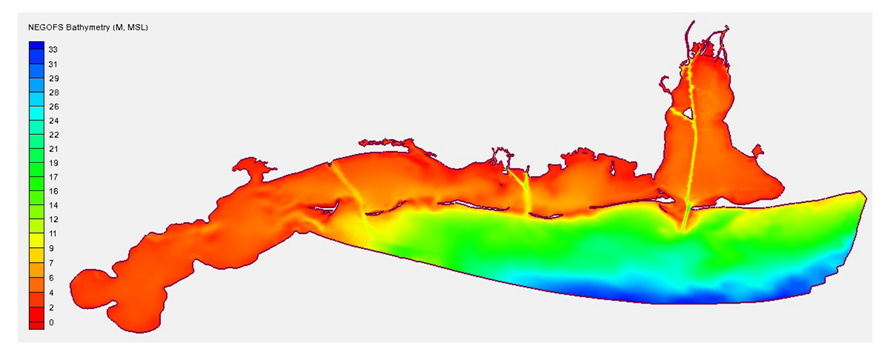
Figure 3. Note that the smallest grid size has been set to 60 m and 45 m for NWGOFS and NEGOFS, respectively. The model bathymetry is obtained by interpolating the most recent NOAA hydrographic survey data and US Army Corps of Engineers (USACE) bathymetry database onto each unstructured NGOFS model grid node. The minimum water depth (for wetting and drying) of the grid is defined as 0.13 m below mean sea level and the land topography is not considered. The deepest water depths are 37 m and 25 m for NWGOFS and NEGOFS, respectively, shown as bathymetry plots in
Figure 4 and
Figure 5. The most recent bathymetry from NOAA’s Vertical Datum (VDatum) projects and USACE’s channel and beach restoration project information (e.g., Lake Calcasieu Channel) are also used to update the nest model bathymetry.
Figure 4.
Northwest Gulf of Mexico Operational Forecast System (NWGOFS) bathymetry map.
Figure 4.
Northwest Gulf of Mexico Operational Forecast System (NWGOFS) bathymetry map.
Figure 5.
Northeast Gulf of Mexico Operational Forecast System (NEGOFS) bathymetry map.
Figure 5.
Northeast Gulf of Mexico Operational Forecast System (NEGOFS) bathymetry map.
The freshwater discharges from 22 and 23 major rivers flows to NWGOFS and NEGOFS model domain, respectively, modifying the circulation including the density flow in the inland bay and near shore coastal waters. The nested models extend the grid domain upstream to the nearest United States Geological Survey (USGS) river gage location for accurate river boundary conditions.
Navigation channels of four bays within NWGOFS (Matagoda Bay, Galveston Bay, Sabine Lake, and Lake Calcasieu) are protected by solid jetties at the entrance. The flow near the entrance is regulated by these jetties. Although the circulation pattern at the bay entrance may not have an effect on the far field circulation, it does plays an important role for the navigation and circulation induced sediment transportation in the local area, especially when the jetties are submerged due to a high wind or storm event. The “Thin Dam” numerical approach [
10] in FVCOM to the coastal jetty is therefore applied to NWGOFS at the entrance of these four bays to accurately simulate the flow at and near the entrance channel. Duplicated nodes are added to the model along the jetty to separate the elements inside and outside the channel thus the water surface elevation may be different and no flow crosses the emerged jetty. When the jetty submerges the flow is free for crossing over the top portion of the submerged jetty. The sensitivity test shows the flow at the entrance is confined within the emerged jetties while the velocity vectors are along the shoreline without the jetties present (
Figure 6).
Figure 6.
Velocity vectors at Lake Calcasieu entrance without (left) and with (right) jetties.
Figure 6.
Velocity vectors at Lake Calcasieu entrance without (left) and with (right) jetties.
3. Model Hindcast
The NWGOFS and NEGOFS model verification have been conducted using similar approach of NGOFS hindcast simulation. The 2nd hindcast simulation period for NGOFS from 14 September 2010 to 1 April 2011 has been repeated to provide open ocean boundary conditions for the nested model hindcasts.
The salinity and temperature initial condition for NWGOFS and NEGOFS were obtained by interpolating the Navy’s global Navy Coastal Ocean Model (NCOM) three-dimensional salinity and temperature field at hour 0, 14 September 2010. The surface elevations and velocity fields are specified as zero. The surface forcing data required for the NWGOFS and NEGOFS hindcast simulations consists of meteorological parameters from NAM model. Forecast guidance from 12-km NAM model at three-hour time intervals include surface wind velocity at 10 m above ground level (AGL), air pressure at mean sea level, surface air temperature at 2 m AGL, surface relative humidity at 2 m AGL, and short- and long-wave radiation are interpolated onto the NWGOFS and NEGOFS model domains at each node. The sensible heat, latent heat, and the net heat flux at each model grid node are then calculated based on the bulk flux parameterization empirical formula. River forcing including freshwater discharge and temperature are obtained at 22 (for NWGOFS) and 23 (for NEGOFS) river locations from the USGS, USACE, or CO-OPS.
Observations of water level, current, salinity and water temperature are collected from NOS, Texas Automated Buoy System (TABS), and Integrated Ocean Observed System (IOOS)/National Data Buoy Center (NDBC) for model verification and skill assessment. However, due to the lack of salinity data for the hindcast period, only water level, current and temperature are analyzed and presented in this study.
The approach of running nesting NWGOFS and NEGOFS is through one-way coupling with NGOFS. First, the NGOFS simulation was run to output water surface elevation, three-dimensional velocities, temperature and salinity at nesting boundary nodes and elements. The nested model simulations are then conducted with the atmospheric surface forcing, river forcing, and the nesting boundary information from NGOFS as the open ocean boundary.
Several sensitivity tests have been conducted to calibrate parameters in the FVCOM applied to the NWGOFS and NEGOFS. The constant and variable bottom roughness logarithm scale length (z
0b) [
11,
12] and bottom friction coefficient (C
d) were tested and found insignificant effects to the surface elevations and velocity compared with observations. The NGOFS uses 41 sigma levels to resolve the vertical structure in shelf and shelf break area. For shallow water NWGOFS and NEGOFS, both 41 and 21 sigma levels are tested to evaluate the effect of the number of vertical layers to water level and velocity at stations with observations. Test results also show insignificant difference (less than 0.01 m in surface elevation and 0.02 m s
−1 in horizontal velocity at all levels). Therefore, the nested models use 21-sigma level in the vertical and the information of velocity, salinity, and temperature from NGOFS at every other layer are extracted as the nesting boundary conditions for NWGOFS and NEGOFS.
The hindcast starts at hour 0, 14 September 2010. Forced with nesting open ocean boundary information from NGOFS, the NWGOFS and NEGOFS take about seven days for water level and tidal currents to spin-up and about 1.5 month for salinity and temperature to reach quasi-equilibrium. Simulated water level, current, salinity and temperature are saved at stations with observations during the hindcast period for model verification. Surface elevation and three-dimensional fields for the entire NWGOFS and NEGOFS domains are also outputs for model verification.
The comparisons of model simulated water level, temperature, and current velocity time series with observations at representative locations are shown in
Figure 7,
Figure 8 and
Figure 9. Water level time series show predominated diurnal and mixed tide with wind event effect (
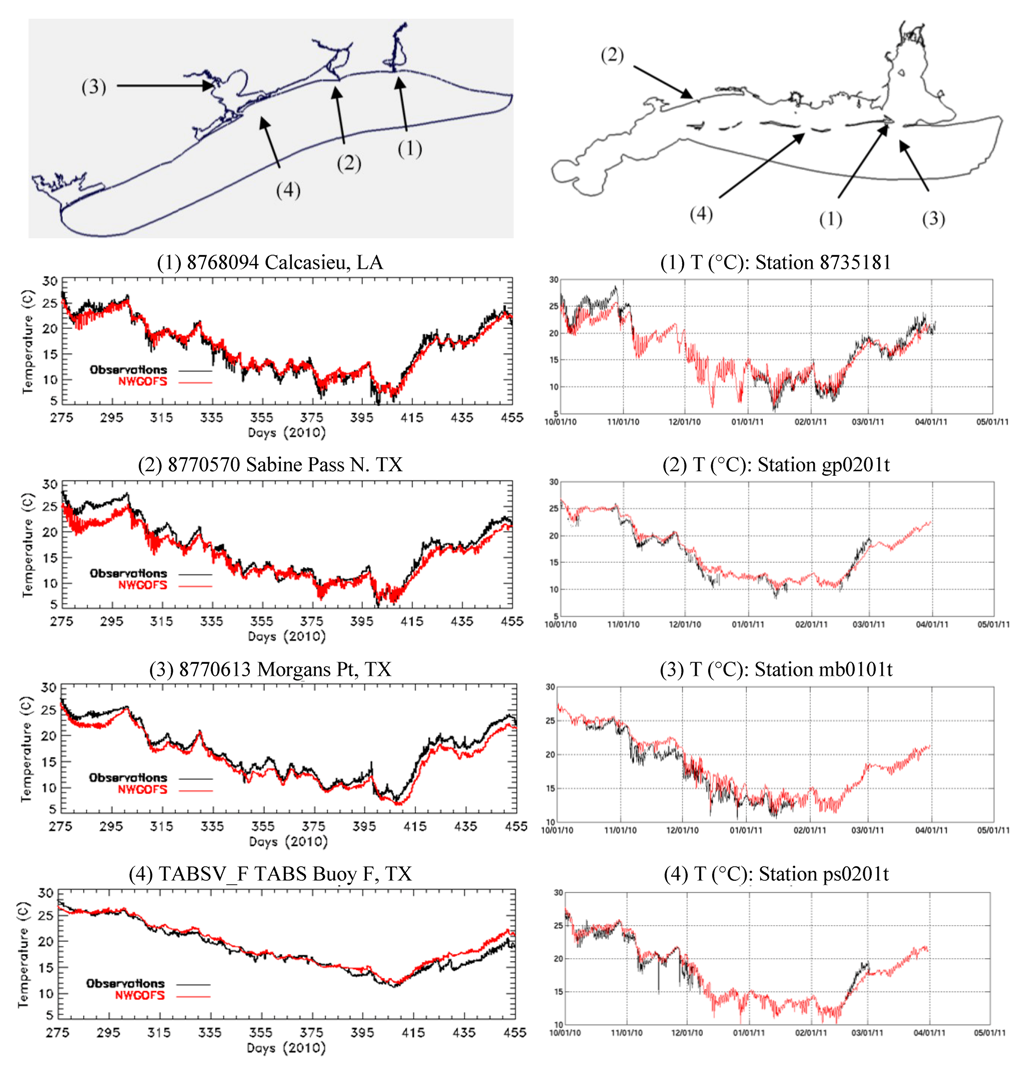
Figure 7). Simulated water levels follow the observation tidal and event signal very well except underestimate the low surge from a storm event by approximately 0.4 m at NWGOFS coast and 0.2 m at NEGOFS coast on 13 December 2010. The simulated near surface water temperature matches with observations throughout the 2010–2011 winter (
Figure 8). This agreement can also be seen in the NGOFS temperature hindcast from August 2008 to August 2009 [
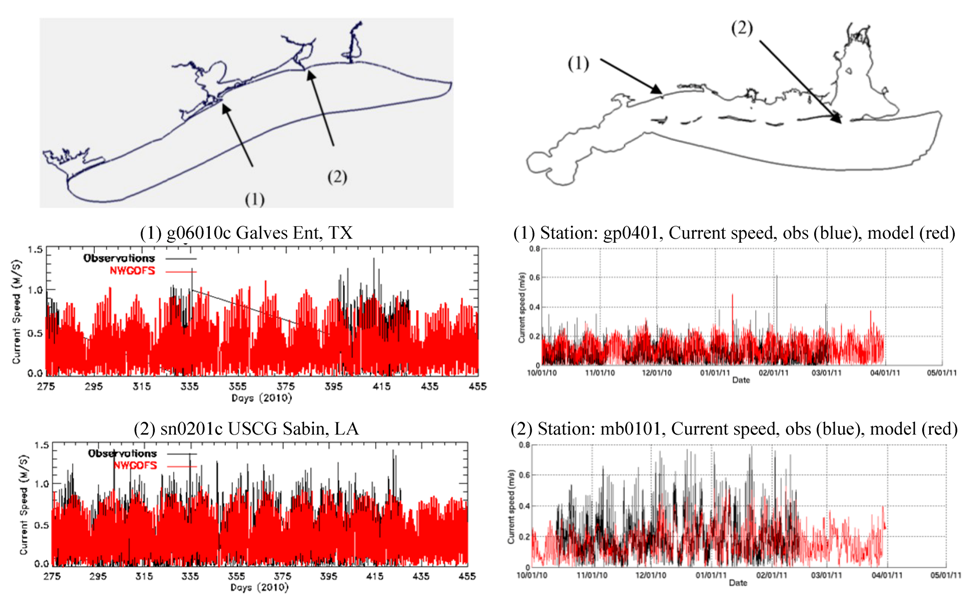
7]. Model simulated and observed current speed time series at station g0601 (Galveston Bay entrance, Galveston, TX, USA) and sn0201 (USCG Sabine, Sabine, LA, USA) are shown in
Figure 9. The maximum tidal currents over 1.0 m s
−1 at the bay entrance of NWGOFS are shown in
Figure 9, left column. Weaker currents are observed at Gulfport PORTS
® in NEGOFS domain (gp0401,
Figure 9, right column). At the Mobile Bay entrance (mb0101), the model underestimated the peak tidal current speed.
Figure 7.
Simulated (red) and observed (black) water level time series at stations in NWGOFS (left column) and NEGOFS (right column) from 1 November 2010 to 31 December 2010.
Figure 7.
Simulated (red) and observed (black) water level time series at stations in NWGOFS (left column) and NEGOFS (right column) from 1 November 2010 to 31 December 2010.
Figure 8.
Simulated (red) and observed (black) temperature time series at stations in NWGOFS (left column) and NEGOFS (right column) from 1 November 2010 to 31 December 2010.
Figure 8.
Simulated (red) and observed (black) temperature time series at stations in NWGOFS (left column) and NEGOFS (right column) from 1 November 2010 to 31 December 2010.
Figure 9.
Simulated (red) and observed (black) near surface current speed time series at stations in NWGOFS (left column) and NEGOFS (right column) from 1 October 2010 to 1 April 2011.
Figure 9.
Simulated (red) and observed (black) near surface current speed time series at stations in NWGOFS (left column) and NEGOFS (right column) from 1 October 2010 to 1 April 2011.
4. Skill Assessment
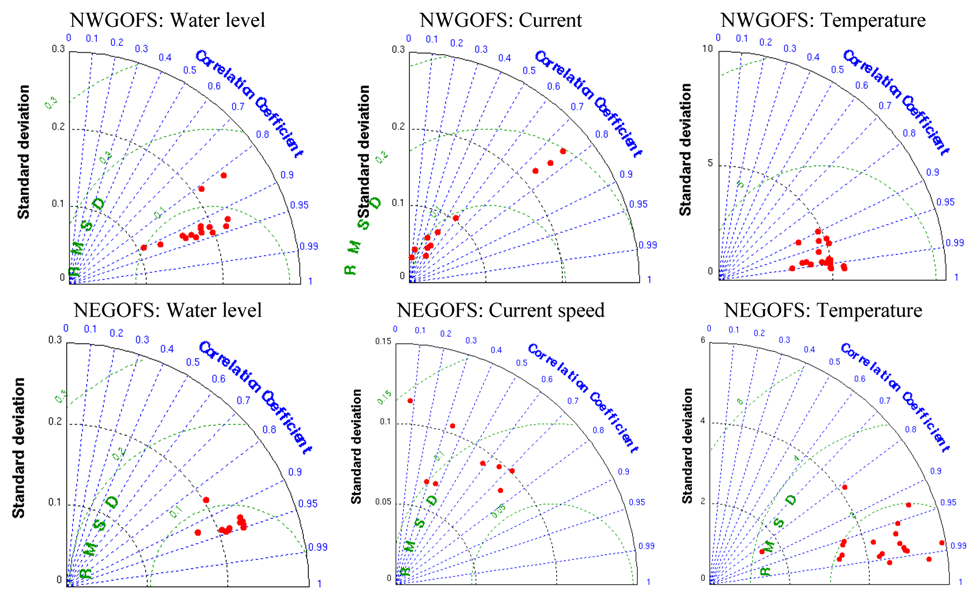
The model hindcast performance has been evaluated with the skill assessment by comparing simulated water level, current, and temperature time series with observation. The Root Mean Squared Deviation (RMSD), Standard Deviation, and Correlation Coefficient are calculated and plotted as concise Taylor Diagrams shown in
Figure 10. The RMSD for water level is less than 10 cm for both NWGOFS and NEGOFS except at three locations. High correlation over around 0.95 for water level and temperature indicates good model hindcast skills. The current velocity correlation coefficient is under-performed compared to the water level and temperature.
The NWGOFS and NEGOFS model hindcast are also analyzed using NOS standard skill assessment software [
13] to further quantify the model performance. Statistic parameters in the NOS skill assessment for operational forecast systems [
14,
15] include the Root Mean Squared Error (RMSE), Central Frequency (CF), and Positive Outlier Frequency (POF) and Negative Outlier Frequency (NOF). The NOS standard criteria (0.15 m for water level and 0.26 m s
−1 for current speed) are greater than 90% for CF and less than 1% for NOF and POF. More detailed definitions of the above parameters can be found in Hess
et al. [
15].
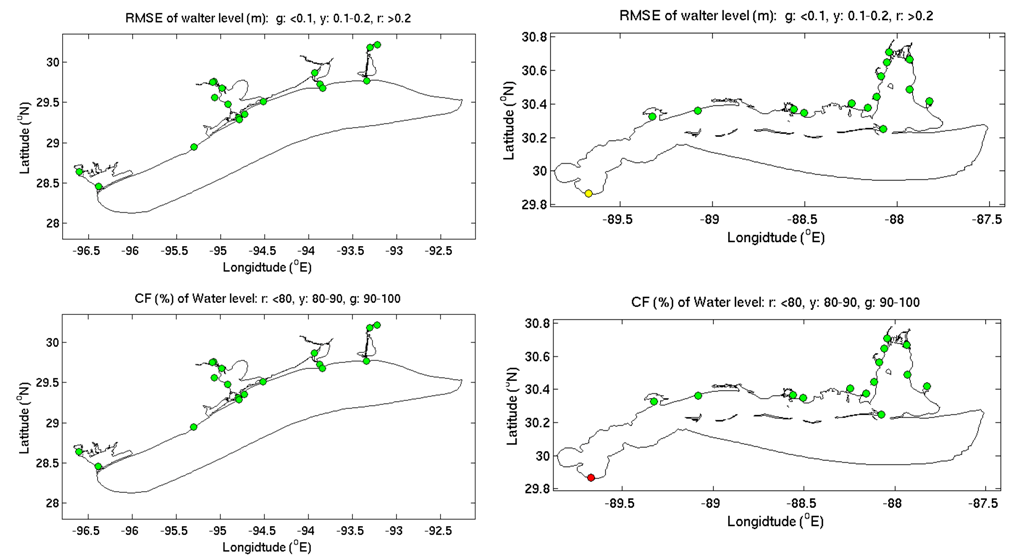
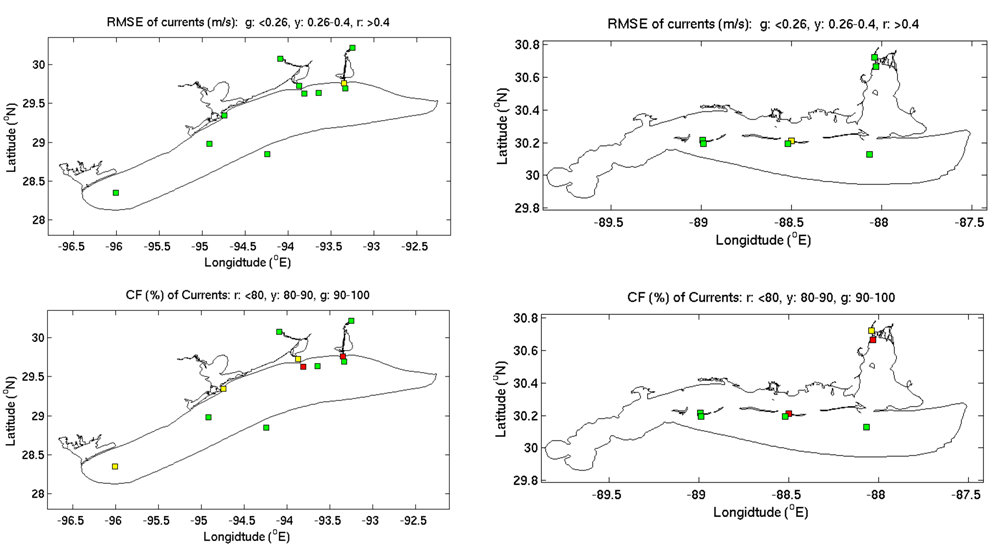
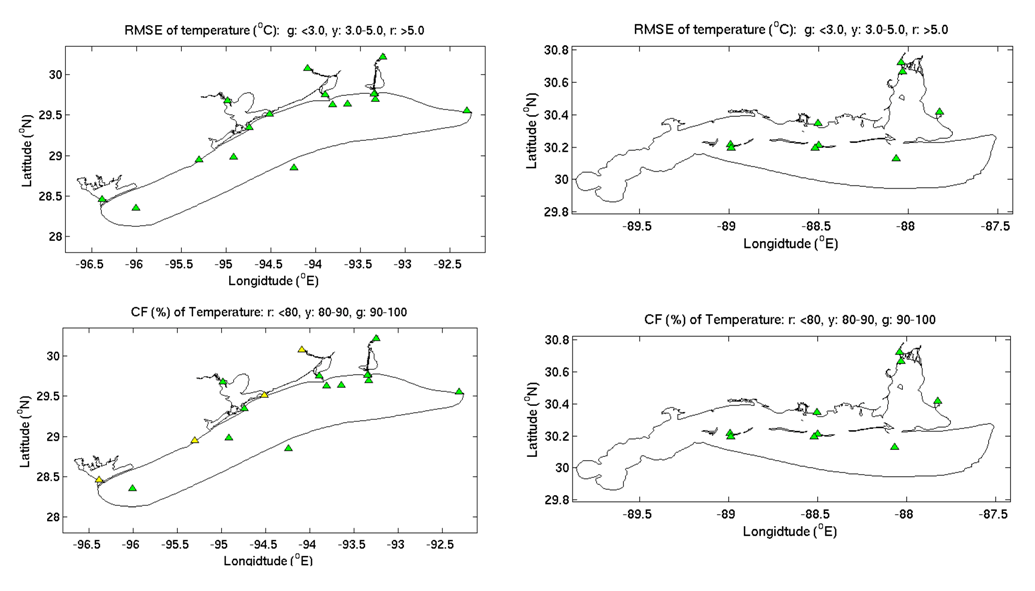
The RMSE and CF for water level, current and temperature extracted from the detail skill assessment report can be presented as a skill summary map as shown in
Figure 11,
Figure 12 and
Figure 13 convenient for users and decision makers. The range of RMSE and CF are presented in three color categories; green (g), yellow (y), and red (r) with corresponding skill ranges shown in the figures. The water level CF satisfies the 90% NOS criteria except for one location west of Mississippi Sound where the sounding survey is not well covered. The temperature CF also exceeds 90%.
Figure 10.
Taylor Diagrams of water level, current, and temperature for NWGOFS (upper row) and NEGOFS (bottom row). Standard deviation, Correlation coefficient, and The Root Mean Squared Deviation (RMSD) are presented in one diagram.
Figure 10.
Taylor Diagrams of water level, current, and temperature for NWGOFS (upper row) and NEGOFS (bottom row). Standard deviation, Correlation coefficient, and The Root Mean Squared Deviation (RMSD) are presented in one diagram.
Figure 11.
Hindcast water level RMSE and Central Frequency (CF) skill assessment summary map for NWGOFS (left column) and NEGOFS (right column).
Figure 11.
Hindcast water level RMSE and Central Frequency (CF) skill assessment summary map for NWGOFS (left column) and NEGOFS (right column).
Figure 12.
Hindcast current velocity RMSE and CF skill assessment summary map for NWGOFS (left column) and NEGOFS (right column).
Figure 12.
Hindcast current velocity RMSE and CF skill assessment summary map for NWGOFS (left column) and NEGOFS (right column).
Figure 13.
Hindcast temperature RMSE and CF skill assessment summary map for NWGOFS (left column) and NEGOFS (right column).
Figure 13.
Hindcast temperature RMSE and CF skill assessment summary map for NWGOFS (left column) and NEGOFS (right column).
The water level and water temperature skill assessments from the nested NWGOFS and NEGOFS are compared with the parent model system NGOFS and listed in
Table 1 and
Table 2. The station locations are shown in
Figure 14 and
Figure 15. The nested NWGOFS and NEGOFS water level RMSEs (
Table 1) are either comparable with or better than the parent NGOFS with NEGOFS water level skill show slight edge over NGOFS. No significant difference between the nested model temperature skill and the parent model.
Table 1.
Water level hindcast skill comparison between nested NGOFS and NGOFS.
Table 1.
Water level hindcast skill comparison between nested NGOFS and NGOFS.
| | RMSE (m) | CF (%) |
|---|
| Station Name | Nested | NGOFS | Nested-NGOFS | Nested | NGOFS | Nested-NGOFS |
|---|
| 1. Freshwater Canal Docks, LA | 0.12 | 0.12 | 0.00 | 80.6 | 82.0 | −1.4 |
| 2. Calcasieu Pass, LA | 0.12 | 0.12 | 0.00 | 81.0 | 79.9 | 1.1 |
| 3. Sabine Pass North, TX | 0.11 | 0.13 | −0.02 | 83.6 | 73.0 | 10.6 |
| 4. Morgans Point, TX | 0.13 | 0.14 | −0.01 | 75.3 | 69.5 | 5.8 |
| 5. Rollover Pass, TC | 0.11 | 0.10 | 0.01 | 82.5 | 84.5 | −2.0 |
| 6. Eagle Point, TC | 0.10 | 0.08 | 0.02 | 85.0 | 95.6 | −9.4 |
| 7. Galveston Pleasure Pier, TX | 0.11 | 0.10 | 0.01 | 80.3 | 85.5 | −5.2 |
| 8. USCG Freeport, TC | 0.10 | 0.09 | 0.01 | 86.6 | 90.5 | −5.9 |
| 9. Weeks Bay, AL | 0.10 | 0.12 | −0.02 | 85.7 | 76.9 | 8.8 |
| 10. CG Mobile, AL | 0.12 | 0.15 | −0.03 | 79.8 | 67.7 | 12.1 |
| 11. Mobile St Dock, AL | 0.13 | 0.15 | −0.02 | 73.8 | 68.3 | 5.5 |
| 12. Pascagoula Dock, MS | 0.08 | 0.10 | −0.02 | 95.1 | 88.6 | 6.5 |
| 13. Pascagoula NOAA, MS | 0.08 | 0.10 | −0.02 | 94.0 | 89.7 | 4.3 |
| 14. Gulfport Harbor, MS | 0.09 | 0.12 | −0.03 | 92.0 | 80.7 | 11.3 |
| 15. Bay Waveland, MS | 0.10 | 0.14 | −0.04 | 88.8 | 70.9 | 17.9 |
| 16. Shell Beach, LA | 0.12 | 0.16 | −0.04 | 79.0 | 62.1 | 16.9 |
Table 2.
Temperature hindcast skill comparison between nested NGOFS and NGOFS.
Table 2.
Temperature hindcast skill comparison between nested NGOFS and NGOFS.
| | RMSE (m) | CF (%) |
|---|
| Station Name | Nested | NGOFS | Nested-NGOFS | Nested | NGOFS | Nested-NGOFS |
|---|
| 1. Calcasieu Pass, LA | 1.01 | 0.96 | 0.05 | 99.2 | 99.6 | −0.4 |
| 2. Sabine Pass North, TX | 1.23 | 1.06 | 0.17 | 90.6 | 98.8 | −8.2 |
| 3. Morgans Point, TX | 1.42 | 1.62 | 0.20 | 99.6 | 98.7 | 0.9 |
| 4. Galves. Bay Channel LB 11, TX | 0.73 | 0.71 | 0.02 | 100. | 100. | 0.0 |
| 5. USCG Freeport, TX | 2.26 | 2.32 | −0.06 | 89.4 | 87.9 | 1.5 |
| 6. Calcasieu Channel LB 36, TX | 0.94 | 1.20 | −0.26 | 100. | 99.9 | 0.1 |
| 7. Sabine Channel LBB 34, LA | 1.84 | 1.05 | 0.79 | 86.4 | 100. | −13.6 |
| 8. CG Mobile, AL | 3.51 | 3.74 | −0.23 | 37.7 | 50.0 | −12.3 |
| 9. Mobile St Dock, AL | 1.95 | 2.22 | −0.27 | 89.0 | 81.0 | 8.0 |
| 10. Pascagoula Dock, MS | 2.85 | 2.41 | 0.44 | 61.2 | 71.4 | −10.2 |
| 11. Pascagoula NOAA, MS | 1.12 | 1.21 | −0.09 | 100.0 | 98.6 | 1.4 |
| 12. Bay Waveland, MS | 1.24 | 1.69 | −0.45 | 97.7 | 94.4 | 3.3 |
| 13. Shell Beach, LA | 1.07 | 1.37 | −0.30 | 99.8 | 96.5 | 3.3 |
| 14. Gulfport, LB22 MS | 0.93 | 0.84 | 0.09 | 99.7 | 100.0 | −0.3 |
| 15. Gulfport, LB26 MS | 1.03 | 1.19 | −0.16 | 99.5 | 99.2 | 0.3 |
| 16. GP Harbor WP, MS | 0.83 | 1.45 | −0.62 | 99.4 | 98.6 | 0.8 |
| 17. MB Buoy M, AL | 1.49 | 1.44 | 0.05 | 96.9 | 98.0 | −1.1 |
| 18. MB St Pier E, AL | 3.44 | 1.85 | 1.58 | 46.9 | 94.5 | −47.6 |
| 19. MB Container Term, AL | 1.28 | 1.76 | −0.48 | 98.1 | 99.8 | −1.7 |
| 20. Pascaga, LB17, MS | 0.86 | 1.06 | −0.20 | 100 | 99.4 | 0.6 |
Figure 14.
Station location maps for water level skill assessment comparison between nested NGOFS and NGOFS.
Figure 14.
Station location maps for water level skill assessment comparison between nested NGOFS and NGOFS.
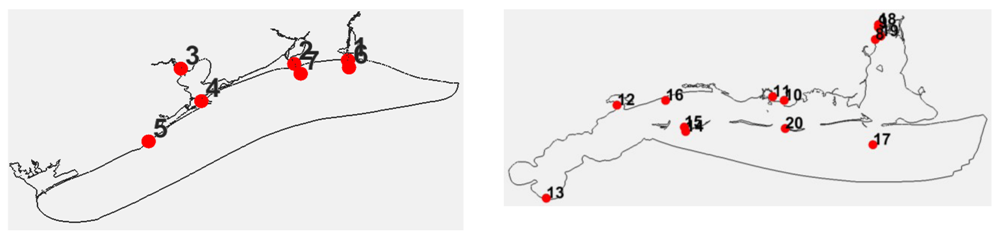
Figure 15.
Station location maps for temperature skill assessment comparison between nested NGOFS and NGOFS.
Figure 15.
Station location maps for temperature skill assessment comparison between nested NGOFS and NGOFS.
6. Summary and Conclusions
The nested NOGFS models NWGOFS and NEGOFS have been developed at NOS to provide days short term nowcast and forecast guidance of water level, current velocity, salinity and temperature over the model grid domain of the northwest and northeast Gulf of Mexico inland and coastal. The NWGOFS and NEGOFS cover six NOS PORTS® systems (Houston/Galveston, Sabine/Neches, Lake Charles, Gulfport, Pascagoula, and Mobile Bay) and one proposed PORTS® (Matagoda Bay) where NOS provides real-time information to the navigation community. The NWGOFS and NEGOFS are two inland forecast systems using the unstructured grid FVCOM developed by UMASS Dartmouth. A synoptic hindcast simulation covering the period of September 2010 to April 2011 has been conducted. The performance of NWGOFS and NEGOFS model hindcasts were evaluated through the NOS skill assessment software to compare the model simulated water level, current, temperature and salinity with the observations available from NOAA, TABS, and IOOS. The skill assessment has been briefly synthesized in graphics and presented in this paper. In general, the simulated water levels, current velocity, and water temperature meet the skill requirement of NOS. The average RMSE ranges from: 0.07 to 0.12 m for water level, 0.06 to 0.26 m s−1 for current speed, and 0.5 to 3.8 °C for water temperature, respectively.
The skill assessment results comparison between NWGOFS and NEGOFS hindcasts and NGOFS’s hindcast for the same period indicates a slight skill edge to the nested models over the parent NGOFS model. However, nested models’ higher resolution assists resolving detailed features that were unable to be resolved in NGOFS. Since the nesting approach in this application requires more computation resources to maintain three model systems, an alternative approach is replacing three models with a large model covering the entire nested and the parent model domain with same grid resolution. A future study will be carried out to evaluate the computation resource and skill differences between two approaches.


