1. Introduction
Florida’s First Coast beaches have experienced occurrences of oil tar ball wash-up as anecdotally evidenced by the local beach communities of Jacksonville. There has also been the question and concern of the local port (Mayport—St. Johns River) contributing to oil tar ball wash-up on the beaches of Florida’s First Coast, and, historically, it was practice of ships to dump their bilge (containing fresh and used oil) just offshore before entering the inlet to port into Jacksonville. In addition to this local societal context, there is also a scientific purpose to generate a sample of baseline conditions of beached oil tar balls for Florida’s First Coast. This scientific purpose is motivated by the speculation of Cuba drilling for oil [
1] and the possibility of an oil spill disaster that would directly affect Florida’s First Coast [
2,
3].
Much previous work on oil tar ball transport and wash-up came about from the post-evaluation of the Deepwater Horizon oil spill (2010) in the Gulf of Mexico, as related to various aspects including tar ball characterization [
4] and spill tracking via beach observation [
5]. Tar ball characterizations have been done for other regions of the world (e.g., California, USA [
6] and Malaysia’s east coast [
7]). However, there is no previous work related to oil tar ball transport and wash-up along Florida’s First Coast. The objective of this study was to define baseline conditions of beached oil tar balls along Florida’s First Coast. Defining these baseline conditions will provide a dataset to use for comparison for future oil spill/tar ball events.
2. Field Methods
Two stretches of Florida’s First Coast beaches were selected for field observation (
Figure 1):
- (1)
north of the St. Johns River inlet—Little Talbot Island—hereafter referred to as the north site; and
- (2)
south of the St. Johns River inlet—Atlantic Beach to Mayport—hereafter referred to as the south site.
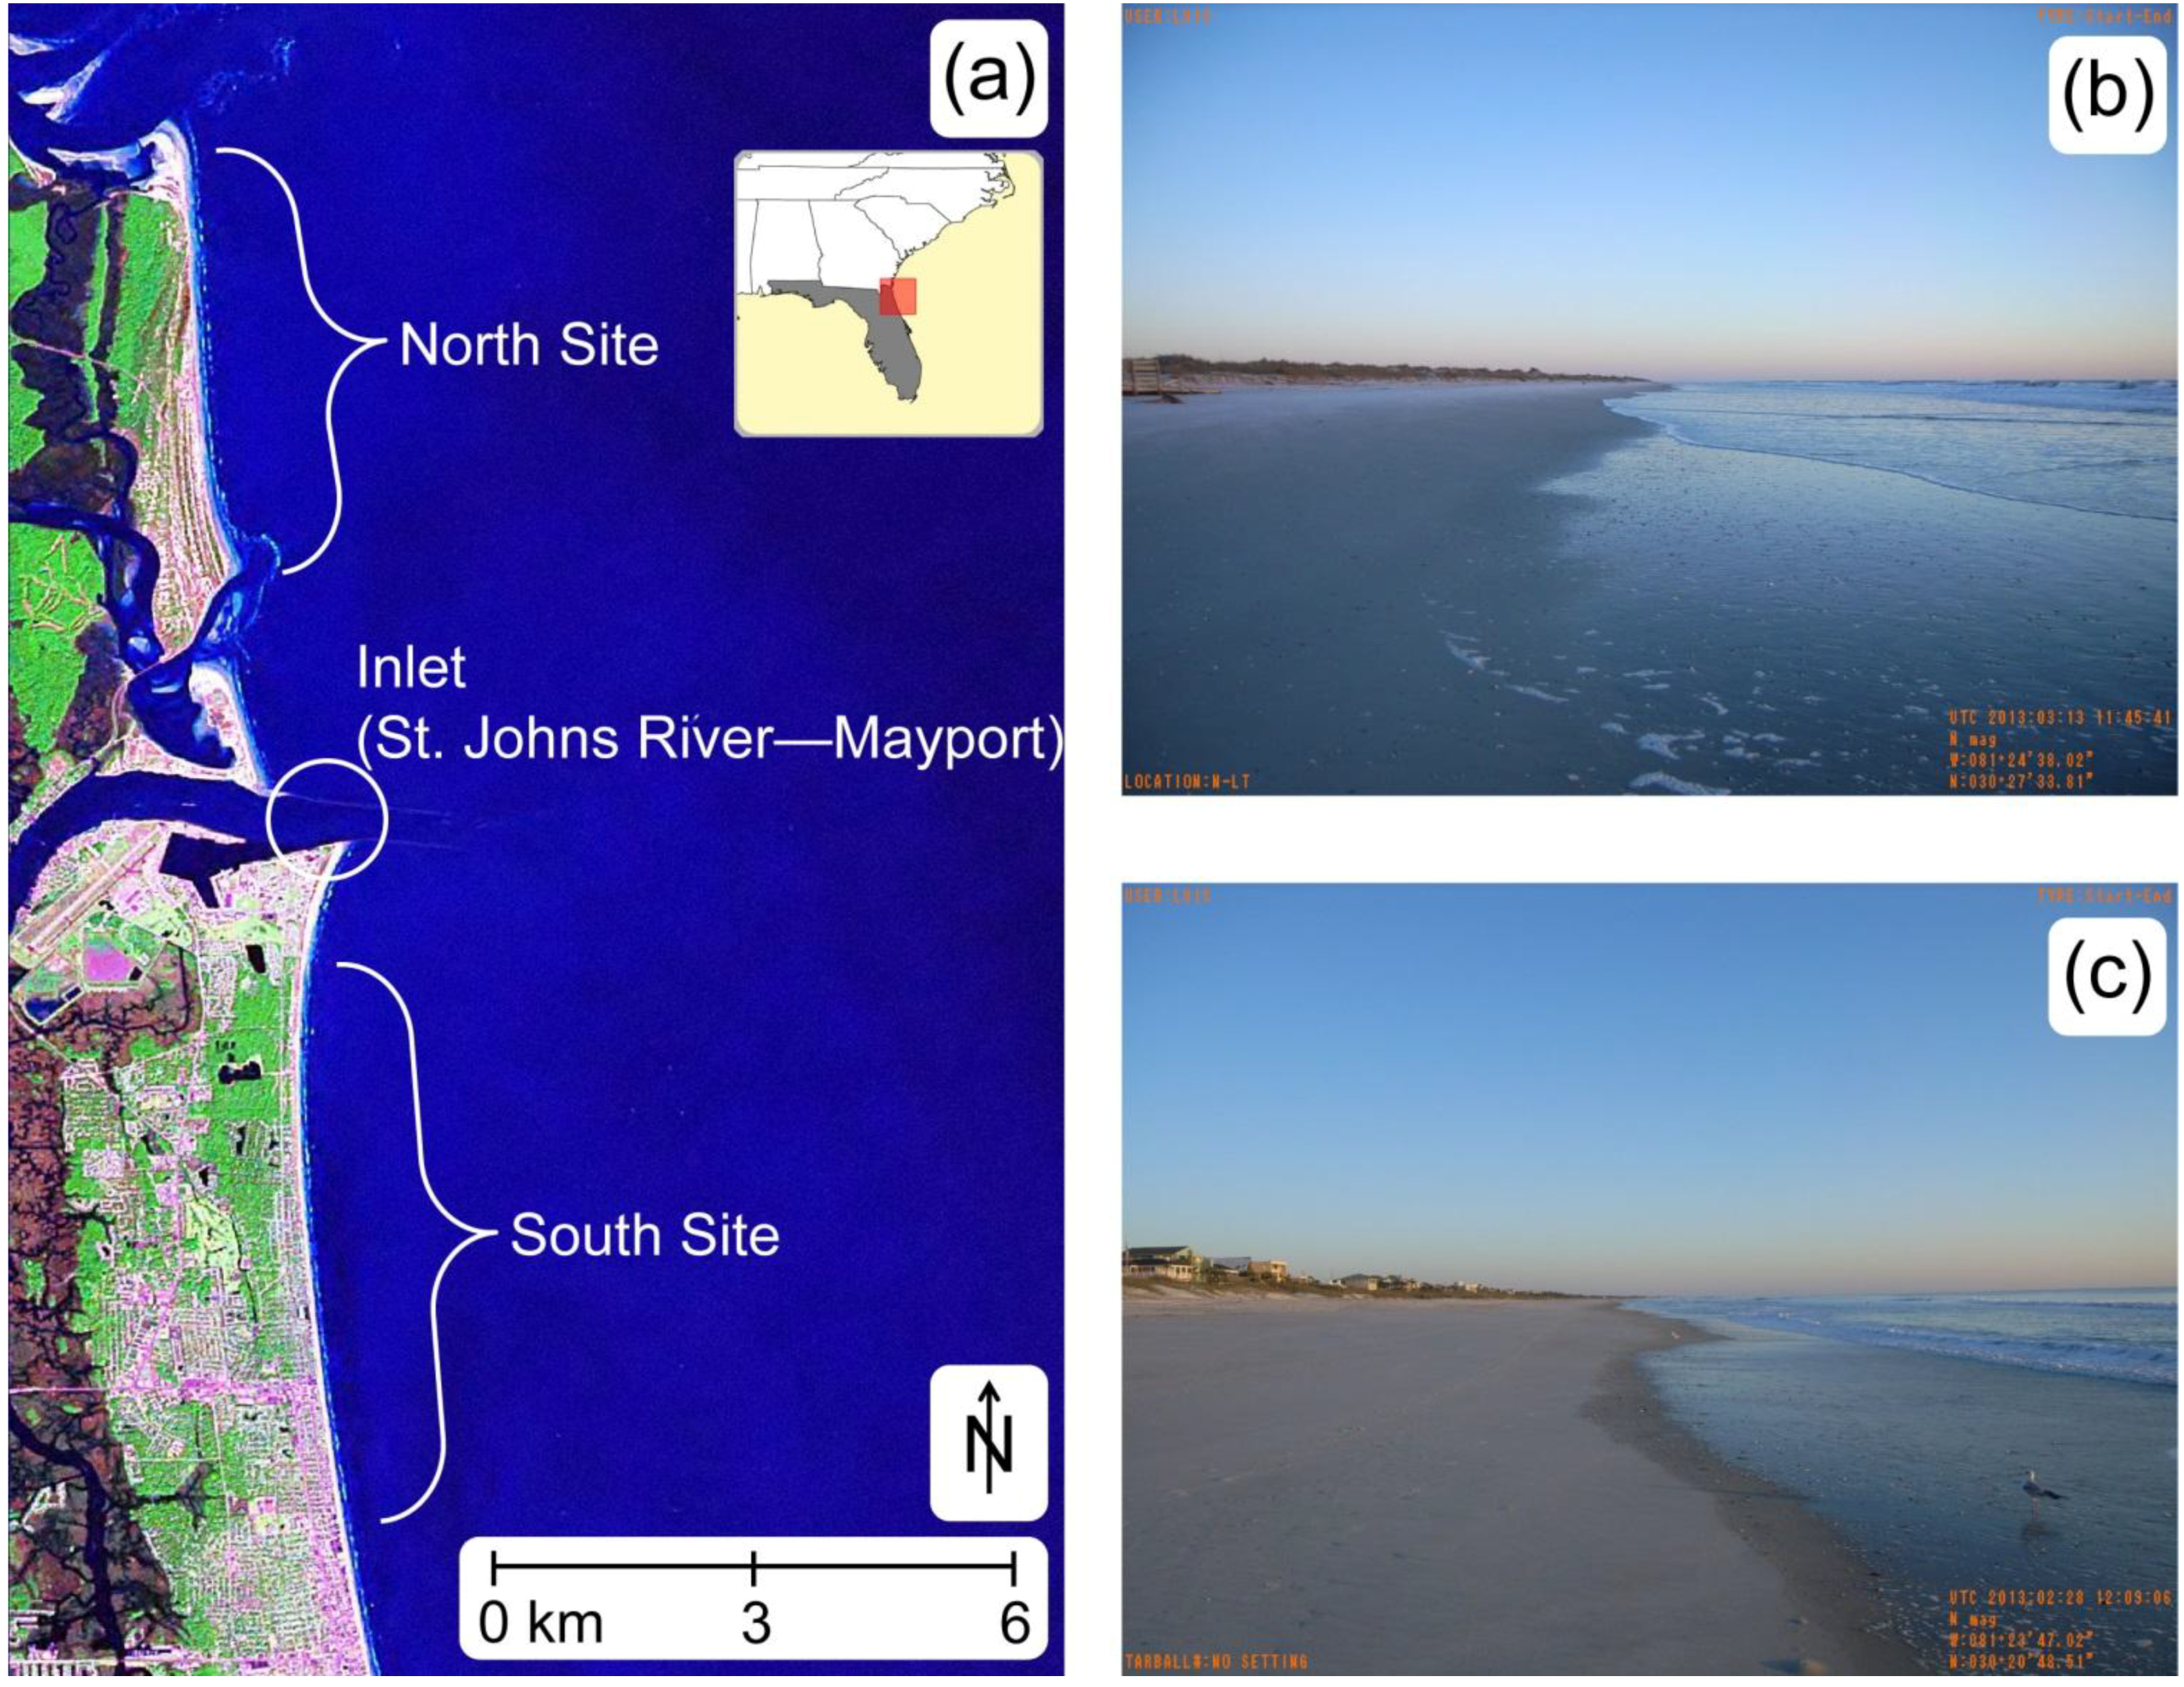
Teams of two walked the stretches of beach, each 6 km in length (
Figure 1). The team would arrive at the site, in the middle of the 6-km-long beach stretch, split up so that one walked north 3 km and the other walked south 3 km, and then turn around and back-track the 3-km-long walk to arrive back at the site. If the tide was going out, the team would walk the first track along the debris line and walk the second track (the back-track) along the waterline, and vice versa for an incoming tide.
Figure 1.
(a) The two stretches of Florida’s First Coast beaches, the north site being north of the inlet and the south site being south of the inlet, selected for field observation. (b) View of the beach for the north site. (c) View of the beach for the south site.
Figure 1.
(a) The two stretches of Florida’s First Coast beaches, the north site being north of the inlet and the south site being south of the inlet, selected for field observation. (b) View of the beach for the north site. (c) View of the beach for the south site.
Both sites were visited roughly once a week over two months (
Table 1). Each site visit required, on average, 3 h of walking the beach stretch. For the beach walks, the following flotsam was photographed with timestamp and GPS location: Trash; seashells; seaweed; and oil tar balls. In addition, the start and end of each beach walk was photographed with timestamp and GPS location. In the field, suspected oil tar balls were recognized by their deep black color, shiny and sooty appearance with varying range of sizes and consistencies (from smaller dime-sized pellets to larger racquetball-sized blobs). Additionally, the tidal condition (high/flood or low/ebb), weather (wind/storm) and wave climate (flat, knee-high, head-high or overhead-high) were noted for each beach walk; however, those data will not be used in this present study and are being reserved for future work related to understanding the temporal patterns of oil tar ball wash-up.
All samples were handled with non-powdered gloves, individually stored in separate air-tight baggies, brought to the laboratory and collectively stored in an air-conditioned environment for subsequent physical and chemical analyses. The GPS data, including the photographs of the samples in situ, were organized into a GIS database for subsequent analysis.
Table 1.
Schedule of the beach walks.
Table 1.
Schedule of the beach walks.
| Visit Number (Site Location) | Date (mm/dd/yyyy) | Start and End Times (EST) (hh:mm:ss) | Number of Suspected Oil Tar Balls Collected |
|---|
| 1 (south site) | 02/28/2013 | 07:09:06 and 11:12:10 | 61 |
| 2 (north site) | 03/05/2013 | 07:54:33 and 11:14:07 | 20 |
| 3 (south site) | 03/10/2013 | 06:28:12 and 09:40:58 | 30 |
| 4 (north site) | 03/13/2013 | 06:45:41 and 08:04:59 | 3 |
| 5 (south site) | 03/14/2013 | 06:55:29 and 10:24:09 | 47 |
| 6 (north site) | 03/15/2013 | 06:59:25 and 09:11:56 | 10 |
| 7 (north site) | 03/29/2013 | 06:55:42 and 08:30:03 | 12 |
| 8 (south site) | 04/08/2013 | 06:25:38 and 09:35:37 | 5 |
| 9 (north site) | 04/11/2013 | 06:40:30 and 08:29:57 | 7 |
| 10 (south site) | 04/15/2013 | 06:12:34 and 08:42:03 | 0 |
| 11 (north site) | 04/17/2013 | 07:02:38 and 08:59:40 | 0 |
| 12 (south site) | 04/21/2013 | 08:24:00 and 10:35:05 | 0 |
| 13 (north site) | 04/23/2013 | 07:11:06 and 08:27:33 | 0 |
3. Laboratory Testing
Physical analysis involved categorizing all of the samples according to their suspected composition.
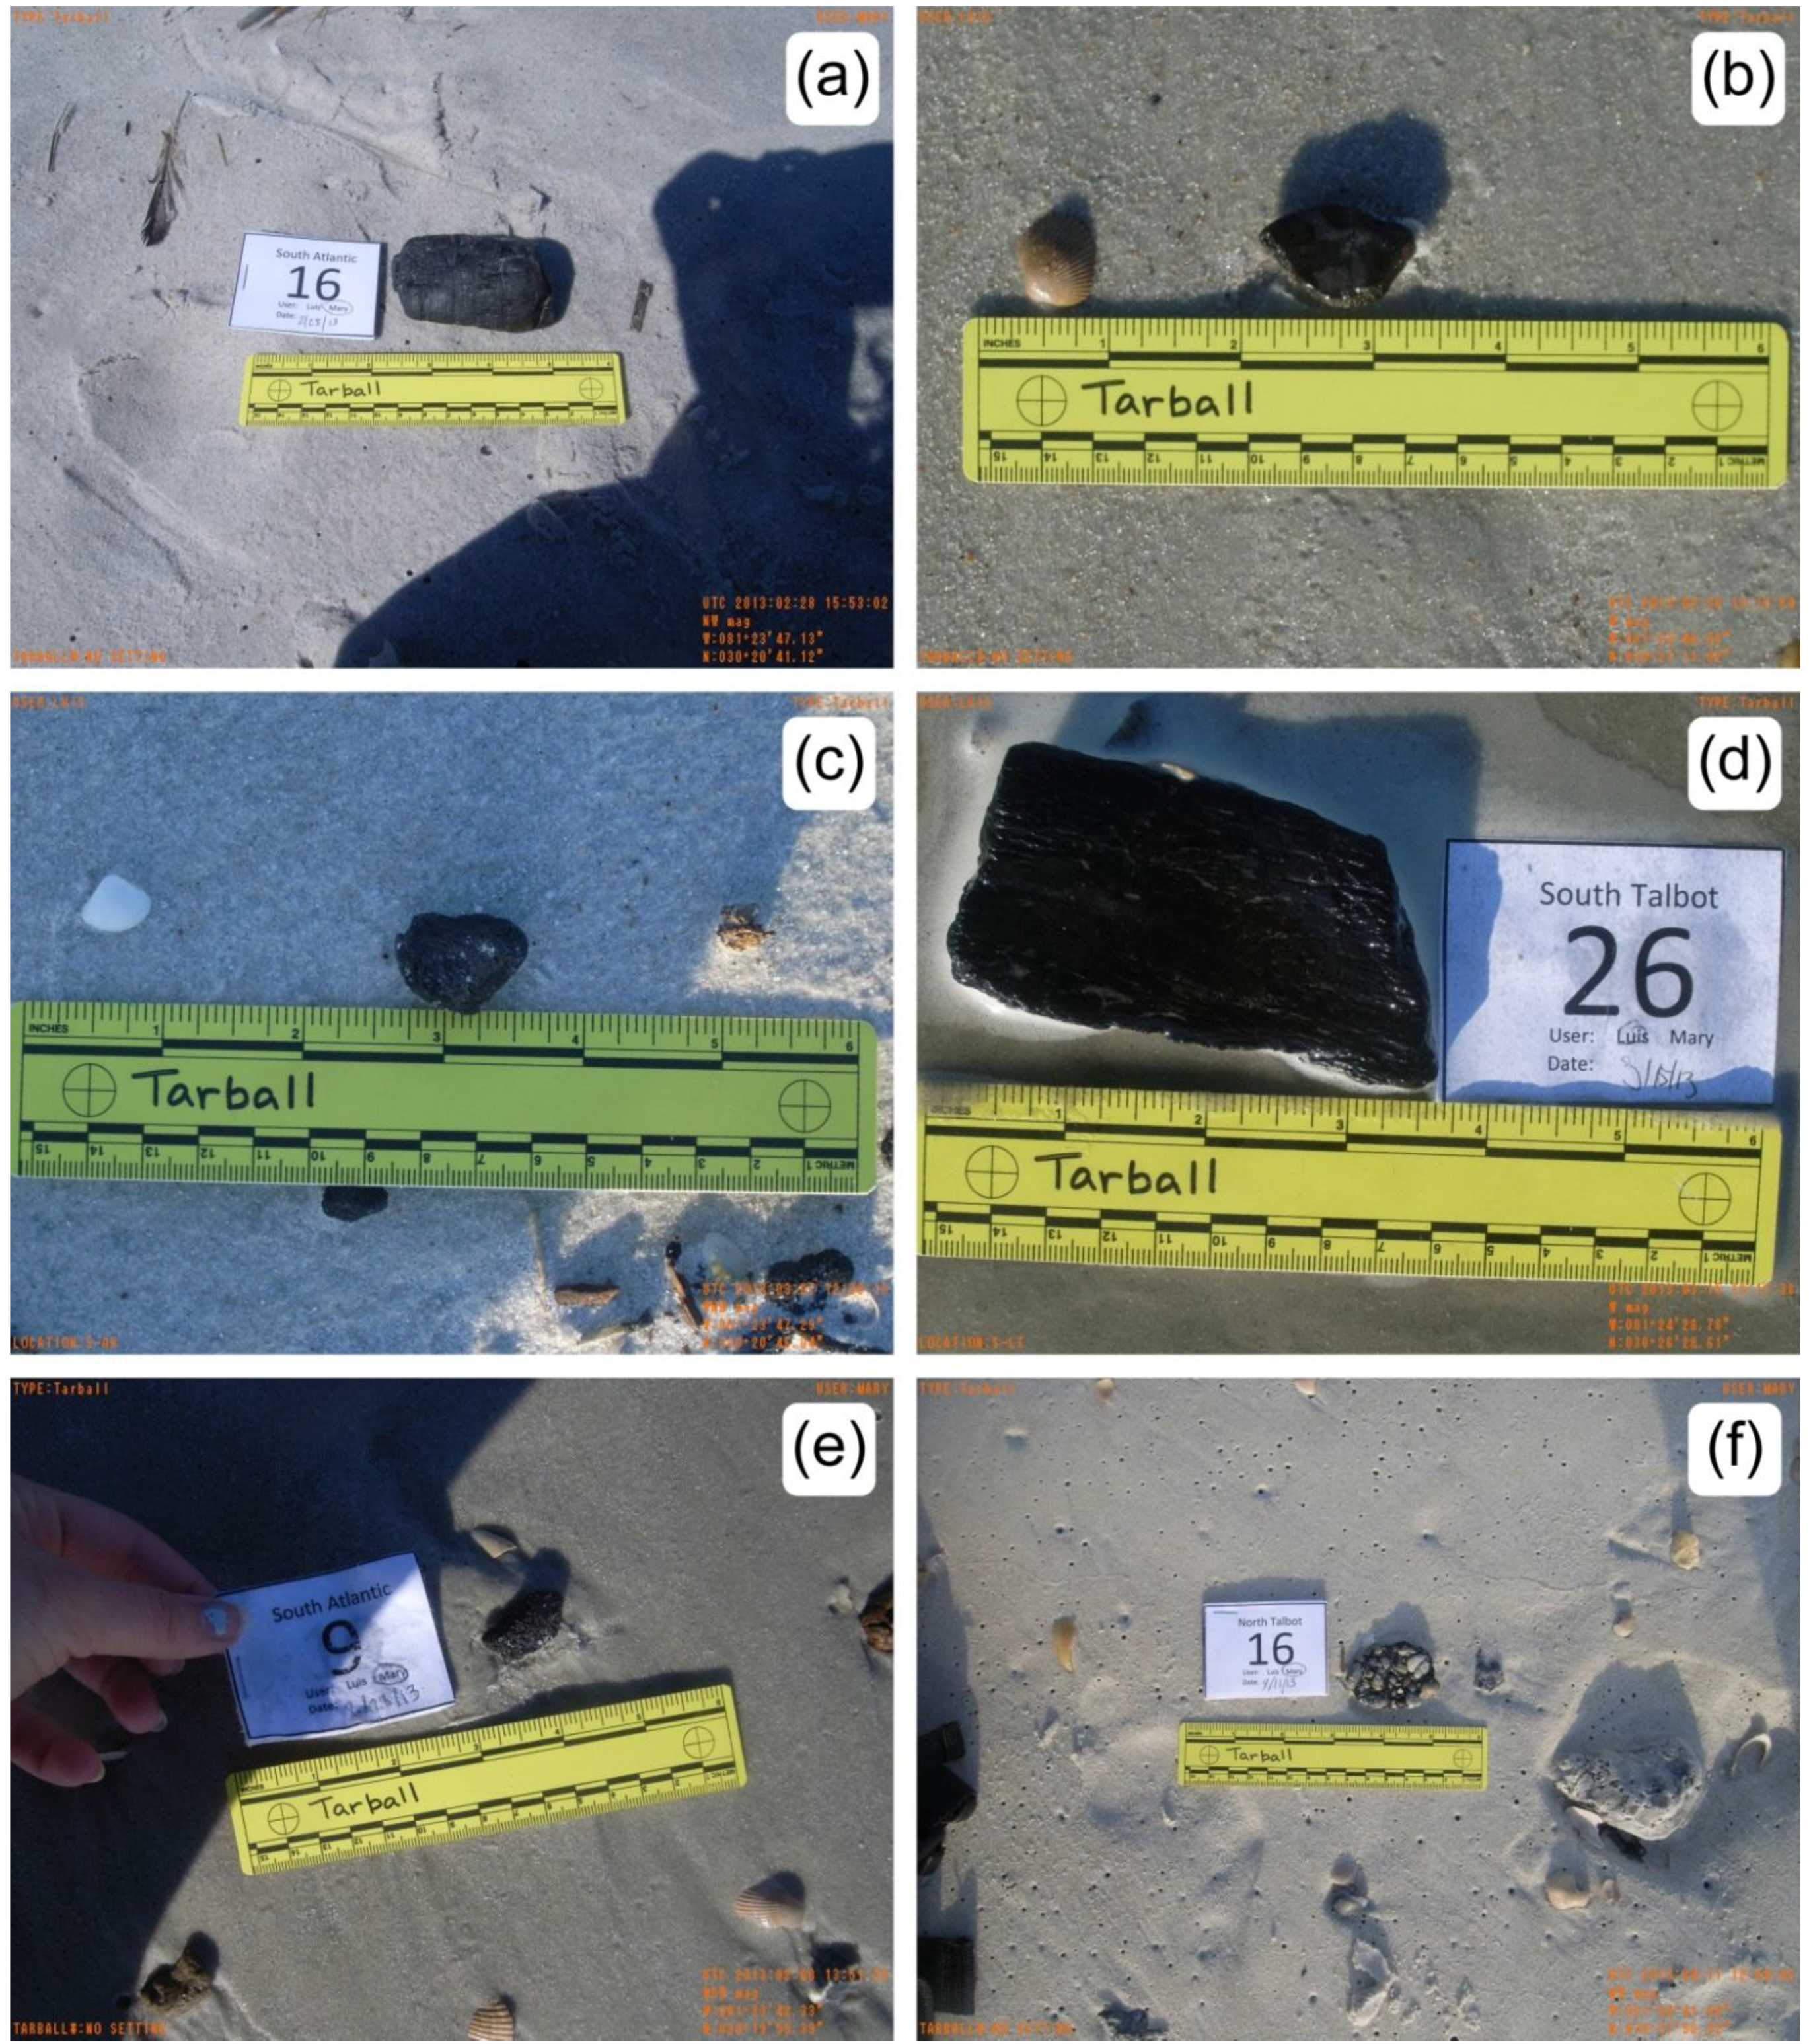
Table 2 lists the seven different categories of physical composition that cover the range of the collected samples: coal; bone; lava; wood; rock; tar ball; and other.
Figure 2 shows samples typifying the physical character of coal, bone, lava, wood, rock and tar ball.
Table 2.
Categorization of the collected samples based on physical composition.
Table 2.
Categorization of the collected samples based on physical composition.
| Category | Sample Features | Number of Suspected Oil Tar Balls Falling into Category |
|---|
| Coal | Sooty, brittle, shiny facets | 58 |
| Bone | Smooth exterior with highly porous center | 13 |
| Lava | Very lightweight porous rock | 34 |
| Wood | Visible wood grain | 20 |
| Rock | Sturdy, variable porosity | 44 |
| Tar ball | Tar-like smell, pliable, embedded debris | 15 |
| Other | Does not fit into any of the other categories | 11 |
The literature is widely varying per how to characterize oil tar balls using chemical tests [
8,
9,
10,
11,
12], but nonetheless guided us to conduct three chemical tests on the collected samples. The objectives of the chemical tests were to provide a first-order (low-level) identification of the collected samples, which was due to the minimal budget of the project, in that for future work and when the associated higher costs can be afforded, higher order (more detailed) chemical tests will be conducted. Thus, three chemical tests (each detailed below) were attempted to characterize the chemical makeups of the collected samples and identify them as containing oil (tar ball) or as not containing oil (anything other than a tar ball; examples, in addition to coal, bone, lava, wood and rock, would include shells, jellyfish, man-o-war, fish kill, and netting/string entanglements). Additional samples obviously containing oil were obtained from Navarre Beach (Florida Panhandle) and Ponte Vedra Beach (Florida’s First Coast), where these samples were collected on an
ad hoc basis for the purpose of serving as control measures in the chemical tests.
Figure 2.
Example samples typifying the physical character of (a) coal, (b) bone, (c) lava, (d) wood, (e) rock and (f) tar ball. Disregard the “tar ball” script on the forensic ruler.
Figure 2.
Example samples typifying the physical character of (a) coal, (b) bone, (c) lava, (d) wood, (e) rock and (f) tar ball. Disregard the “tar ball” script on the forensic ruler.
The first test attempted was gas chromatography-mass spectrometry (GC-MS) and gas chromatography/flame ionization detector (GC/FID). The GC-MS and GC/FID tests failed because, with the low-budget instrument used, temperatures were not capable of gasifying the sample compositions and producing a chemical signature. Only solvent peaks for samples obviously containing oil were obtained, which was most likely due to insufficient temperatures of the GC columns used. Columns suggested by manufacturers to characterize crude oil sludge were beyond the available budget of the study. It is hypothesized that the majority of oil obtained from tar balls are the high molecular weight portions of crude oil, commonly referred to as tar. Compounds of high molecular weight have higher melting points than lighter compounds. In order for GC techniques to be applied, the instrument must reach sufficient temperatures for the compound of interest to reach a gaseous state, pass through the column and produce a reading.
The second test attempted was solubilization of samples in DCM (dichloromethane) which is a commonly used solvent for isolating oils from particulate solid masses. A small piece from a sample in each of the categories of physical composition (
Table 2) was placed into a 20-mL scintillation vial containing roughly 10 mL of DCM. This test was applied by observing if any oil residue became isolated from the sample and floated to the top of the vial. No oil residue was observed to come off any sample except for all the samples that belonged to the tar ball category where there were obvious collections of oil residue floating in the vial. Results of this test allow us to conclusively state that the members of the five categories not suspected to be tar balls indeed do not contain crude oil. However, extraction of a substance using DCM does not lead to a certain conclusion that the samples in the tar ball category do indeed contain crude oil, since DCM is a commonly used organic solvent and will dissolve many nonpolar compounds. As a result, this test can only be used to eliminate possible tar ball samples, not confirm them.
The third test attempted was evaluation of melting point. In hopes to confirm the presence or absence of crude oil in the samples, we had desired to measure a melting point of bits of “oil” from the samples in the tar ball category. For all the samples in the tar ball category, a portion of each sample was powderized and the “oil” particles were separated from the larger pieces of rock and debris via mechanical processing. Separation of the “oil” from the surrounding sand particles was impractical (although it was attempted, again via mechanical processing). It was eventually determined that the “oil” particles would melt at a much lower temperature than the sand, therefore the presence of the sand should not make a difference. The “oil”/sand mixture was heated in a test tube using a Bunsen burner which quickly revealed that the “oil” simply softened slightly and turned the sample into a gooey mess, accompanied with the smell of hot asphalt. While these results strongly suggest the sample was indeed a tar ball, the lack of quantitative evidence leaves it undetermined.
4. Spatial Analysis
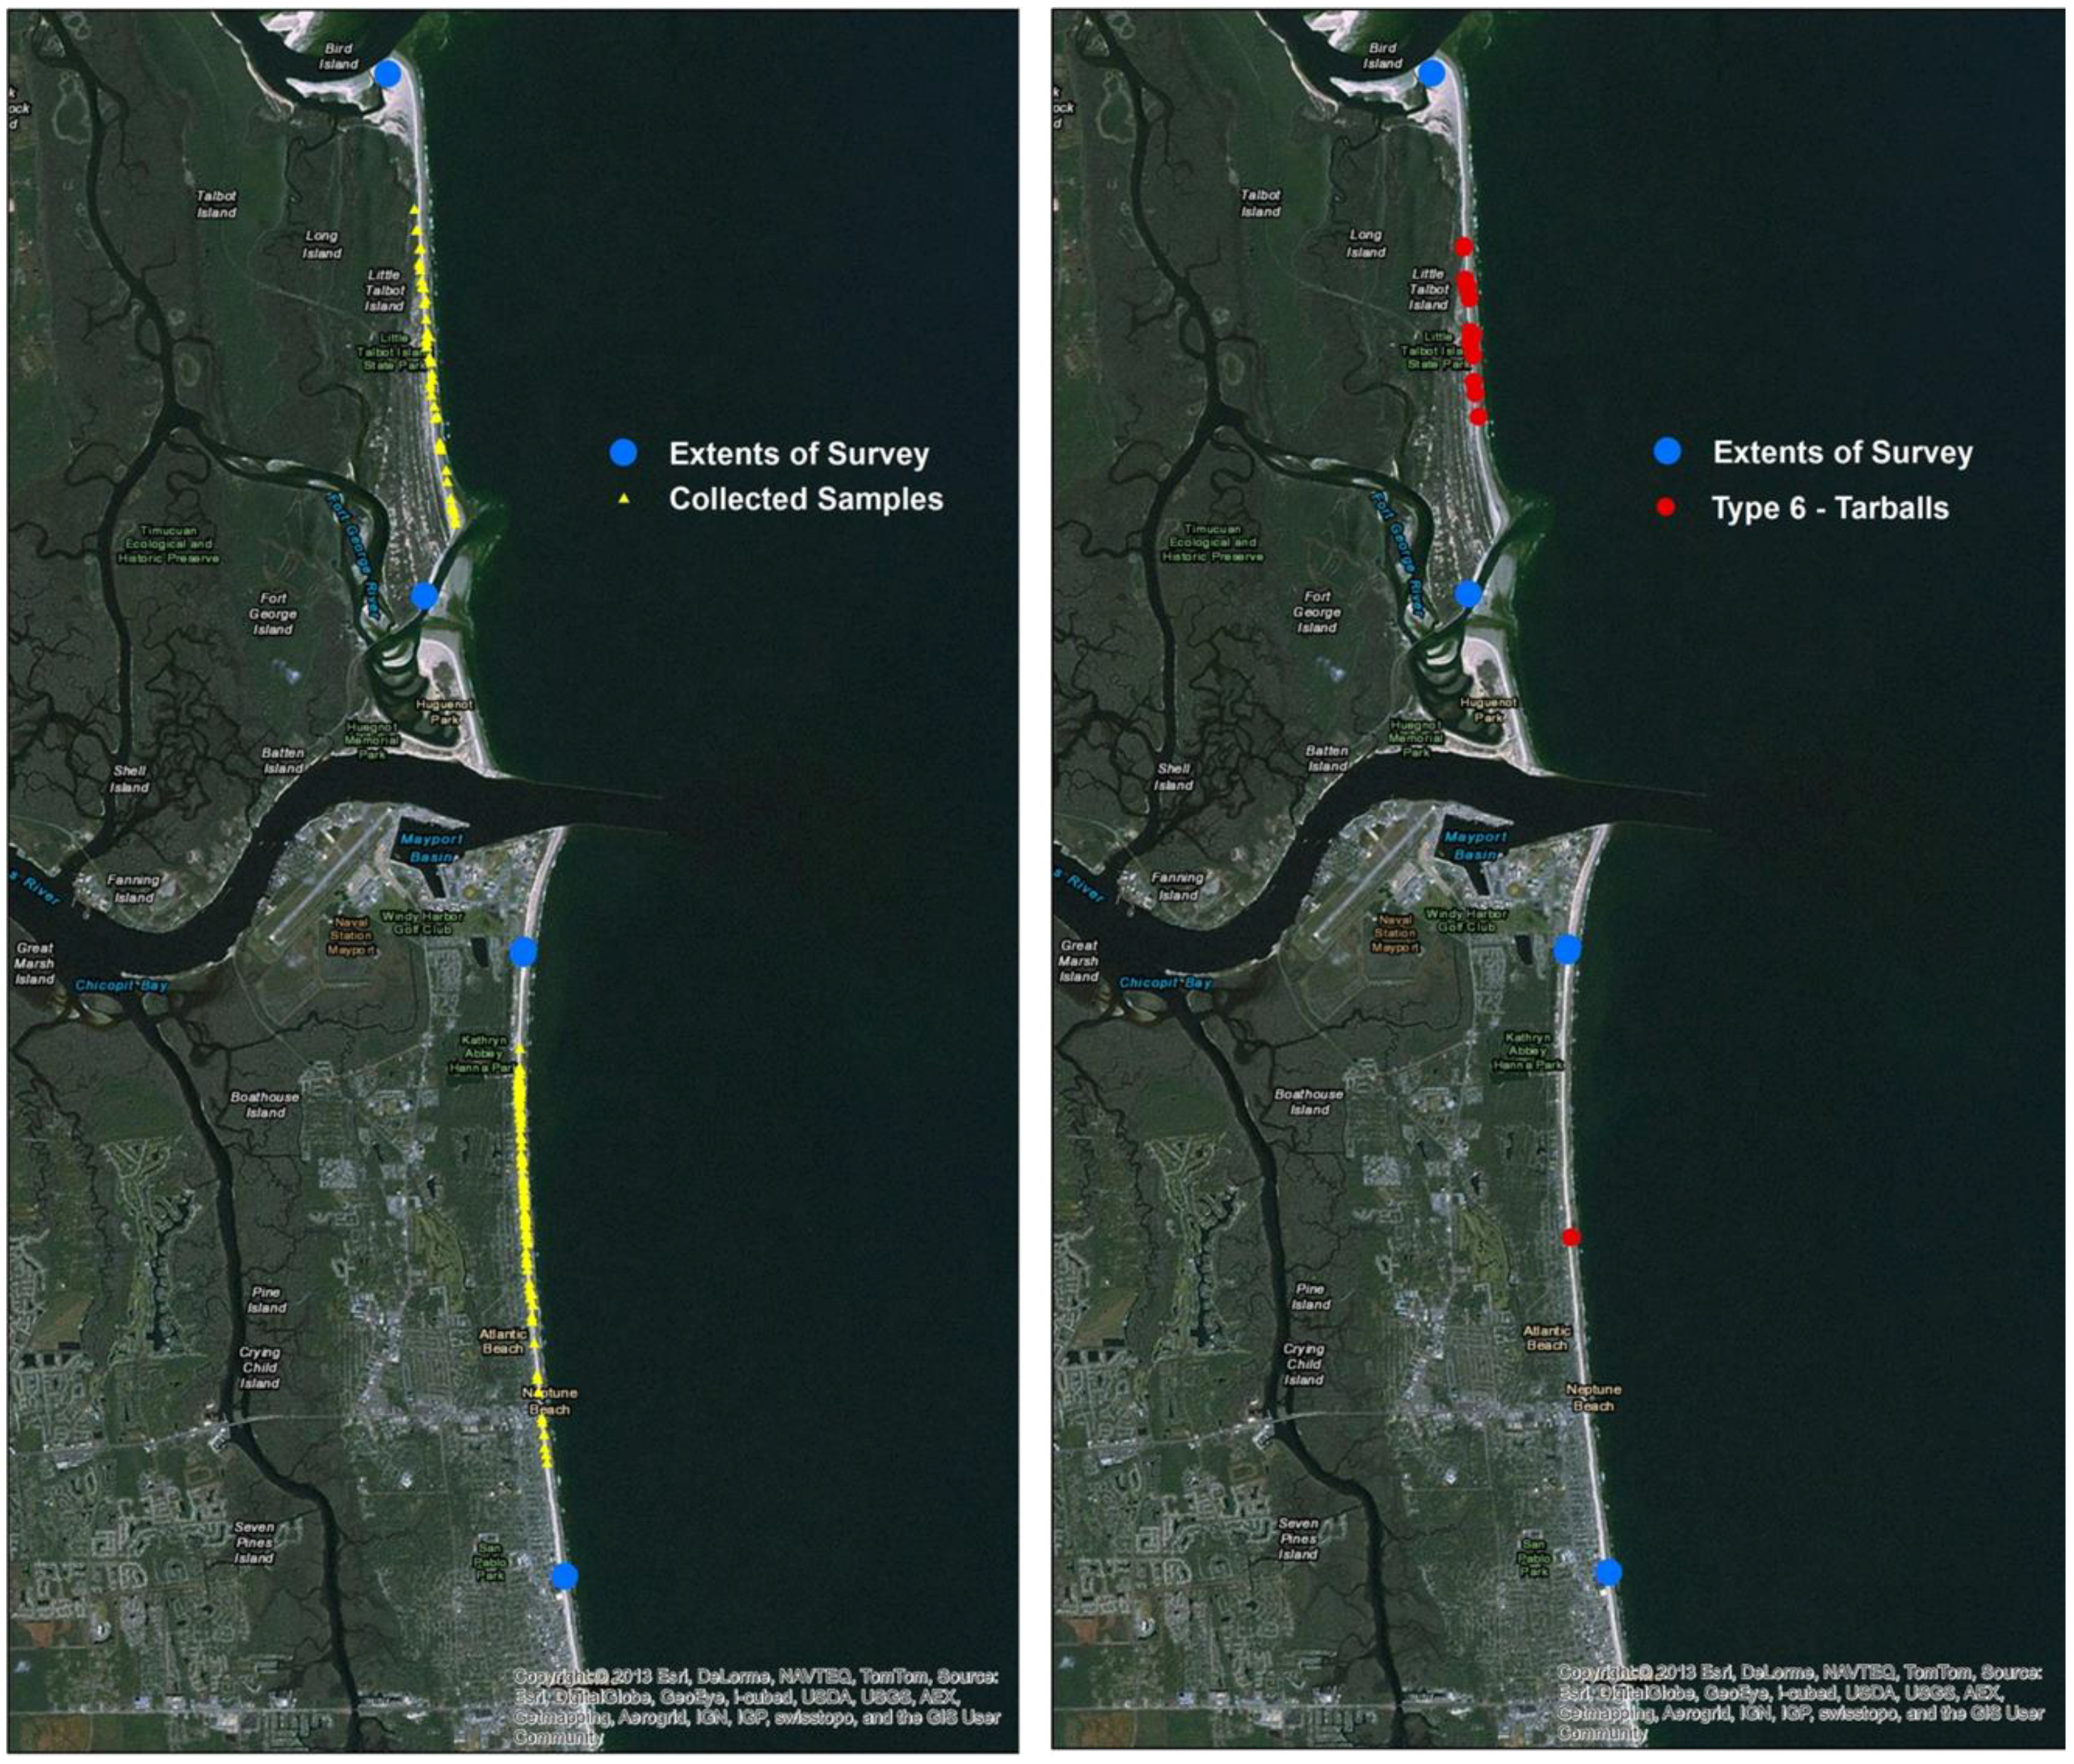
The maps shown in
Figure 3 are direct outputs of the developed GIS database showing the GPS-based locations of the furthest extents of the survey, all the collected samples and just the samples that were categorized as tar balls.
Figure 3a shows the spatial distribution of all the collected samples, as an indication of all the flotsam that washes up on Florida’s First Coast beaches, with additional points indicating the furthest extent of ground covered by the team over the full duration of the fieldwork.
Figure 3b shows the spatial distributions of all the samples that were categorized as tar balls, as an indication of baseline conditions of oil tar ball wash-up on Florida’s First Coast beaches, again with same extent of survey points for reference.
Figure 3.
GPS-based locations of (a) all the collected samples and (b) just the samples that were categorized as tar balls.
Figure 3.
GPS-based locations of (a) all the collected samples and (b) just the samples that were categorized as tar balls.
5. Numerical Modeling
The ADvanced CIRCulation (ADCIRC) code was used for the numerical modeling in this study. The model is depth-integrated, and it is assumed that the simulated two-dimensional hydrodynamics are a major contributor to the transport of suspended materials, including oil tar balls contained within the water column. The model does not account for resuspension of settled materials or for the chemical evolution of oil tar balls. A previously developed model for the South Atlantic Bight [
13], including Florida’s First Coast and the St. Johns River, was utilized. Boundary conditions included tides on the open-ocean boundary located in the deep ocean along the 60°W meridian. In this implementation of the model, only tides and tidal circulation were considered as the hydrodynamic driving force. In future implementations, the model will be additionally forced with winds, which are important to circulation, transport and waves whereby the wave-driven hydrodynamics will be fed back into the circulation and transport. The purpose of excluding winds in the current model implementation was to be able to obtain a picture of the tidally driven transport, before we explore the transport driven by tides plus winds and waves.
Tidally driven transport is closely related to the velocity residuals at tidal and subtidal frequencies;
i.e., tidally time-averaged velocities [
14,
15]. Tidal currents are the dominant driver of seawater movement in coastal seas; however, to study tidally driven transport, it becomes necessary to extract the velocity residuals from the oscillating tidal currents. Eulerian velocity residuals are the rectification of transiently oscillating tidal velocities at a fixed position using a time-averaging scheme [
16]. Calculation of the Eulerian velocity residuals in this work is performed using the concept of the tidal cycle mean operator [
17].
Figure 4.
Tidally driven velocity residuals: (a) vectors and (b) the associated contours of magnitudes for the offshore waters of Florida’s First Coast.
Figure 4.
Tidally driven velocity residuals: (a) vectors and (b) the associated contours of magnitudes for the offshore waters of Florida’s First Coast.
Figure 4 shows vectors of velocity residuals, and the associated contours of magnitudes, computed from a harmonic analysis of 45 days of simulated (fully dynamic) tidal currents. The velocity residuals shown correspond to the STEADY constituent (frequency of zero/period of infinity) vector in the harmonically analyzed velocity (fort.54) file of ADCIRC [
18]. The velocity residuals exhibit an ebb pattern through the inlet, with counter-rotating eddies spinning off the inlet. The ebb tidal velocities through the throat of the inlet reach as high as 15 cm/s in magnitude. The north eddy is approximately 3 km in diameter and produces velocity residuals of 0.5–2.5 cm/s. The north eddy directs velocity residuals toward Little Talbot Island (the north site). The south eddy is approximately 6 km in diameter and produces velocity residuals of 0.5–2.5 cm/s. The south eddy directs velocity residuals toward Atlantic Beach to Mayport (the south site).
There were 14 oil tar balls found on the north site and there was 1 oil tar ball found on the south site (
Figure 3b). The north and south sites are located in the face of the shoreward components of the counter-rotating eddies of tidally driven velocity residuals ebbing from the inlet (Mayport) of the St. Johns River (
Figure 4a). It is interesting that only 1 oil tar ball was found on the south site, compared to 14 oil tar balls that were found on the north site, which cannot be explained by the numerical modeling as implemented in this study. Future work will impose wind forcing on the model as well as can explore the wave climate and resulting field of wave radiation stresses that could drive oil tar ball transport toward the shore. Local sources of oil (likely relic oil from historical bilge dumping that would take place offshore before ships would port into Jacksonville) could also be more prevalent north of the inlet and sparser south of the inlet. In this implementation of the model, it can only be concluded that there is a tendency in the tidal circulation for transport to be directed onto the north and south sites via tidally driven eddies.
6. Conclusions
This study was spawned as a pilot project to define a methodology for establishing baseline conditions of beached oil tar balls along Florida’s First Coast. As a result of the pilot project, a research team (local to Jacksonville) of mappers, modelers and field experts has been formed. In addition, the pilot project has established fieldwork protocols for collecting oil tar balls on Florida’s First Coast beaches, modeling methods for simulating hydrodynamics in the St. Johns River and offshore waters and laboratory tests for confirming or negating collected samples as being oil tar balls.
The methodology presented in this paper for defining baseline conditions of beached oil tar balls along Florida’s First Coast was designed with up-scaling in mind. The project could be scaled spatially by including a longer stretch of beach. In temporal scope, the project could involve more frequent site visits or the collection period could be extended. In the laboratory, there could be more extensive testing with the goal of more conclusively identifying oil tar balls.
The study concludes that a limited amount of oil tar balls wash up during normal conditions, suggesting that the port activity in the St. Johns River is not a major contributor of oil tar ball wash-up on Florida’s First Coast beaches. Future work will be to conduct a temporal analysis of the data to discover any trends or causative factors (e.g., storms) to oil tar ball wash-up. Finally, the numerical modeling will be extended to incorporate transport into the hydrodynamic simulation as well as to explore the effect of waves and wave-induced current as transport mechanisms.


