1. Introduction
During the period when Hurricane Irene was moving northward along the U.S. east coast, the storm was encountering increasing wind shear and cooler sea surface temperatures and was slowly weakening as it tracked from the Carolinas to New England. Despite this, Irene brought widespread and significant impacts along the east coast, causing severe flooding from the mid-Atlantic states into eastern New York and western New England, widespread wind damage and power outages across a large portion of southern and central New England, and a major storm surge along portions of the Long Island coast. The objective of this study was to perform retrospective numerical simulations with the Advanced Research Weather Research and Forecast model (WRF-ARW) and evaluate how to use the WRF modeling system [
1] as a tool for reconstructing the surface wind field for historical storm events to support storm surge studies. The WRF wind and pressure fields can be used to drive a storm surge model such as the Advanced Circulation model (ADCIRC) as part of a storm surge analysis. WRF output may represent a potential source of data for storm surge analysis especially for regions with limited or no observational data.
Storm surge studies typically use a variety of approaches to re-analyze historical storms. These include parametric wind models [
2,
3] to develop a radial profile of the storm winds based on available data typically issued in National Hurricane Center advisories, including storm central pressure, maximum wind speed, and radius of maximum wind. These parametric-based approaches have been modified recently to account for storm asymmetries by allowing for storm quadrant specific profiles, again using data from available advisories that contain information about wind radii in each quadrant of the storm. Other approaches include hurricane boundary layer models [
4] and objective analysis systems such as the Interactive Objective Kinematic Analysis (IOKA) system from Ocean Weather [
5] and the HWIND analysis (also denoted as H*WIND) from the National Oceanic and Atmospheric Administration’s (NOAA’s) Hurricane Research Division [
6]. Data from the HWIND product is dependent on the density and quality of observational data, and to some extent relies on wind speeds extrapolated from flight level observations or dropsonde measurements, so the quality of the analysis may vary throughout a storm’s history. Typically, a hurricane’s inner core region is well sampled through reconnaissance flights and dropsonde data, while observational data may be more sparse at large distances from the center. Finally, use of non-steady state dynamic models such as WRF offers another approach to storm reanalysis. There has been some work already done to study the use of the WRF model to drive the ADCIRC model for purposes of providing an improved storm surge prediction system [
7]. However, to this author’s knowledge, there have been no further applications of WRF as a tool to reanalyze historical storms events specifically for storm surge modeling studies.
WRF has a number of advantages over steady state and objective analysis approaches. The model simulates the evolution of atmospheric systems including tropical cyclones using full physics. It employs a range of physics options to account for cloud microphysics, atmospheric radiation processes, planetary boundary layer and surface layer processes, and parameterization of sub-grid scale moist convection. These capabilities allow WRF to simulate far field winds, spiral rainband structures, and supergradient flow in the inner core region [
7], structures generally not resolved by other approaches. The WRF model also has full data assimilation capabilities including four-dimensional data assimilation (FDDA) and three-dimensional variational (3DVAR) approaches for blending the model fields with a diverse set of observational data [
8,
9]. Other more advanced data assimilation techniques such as four-dimensional variational (4DVAR) and Ensemble Kalman Filter (EnKF) techniques can also be applied to improve the analysis. Unlike HWIND or IOKA, the WRF model is not reliant on observations alone to simulate a storm event, but can use observations when available to help refine the model solutions by adjusting the model fields towards the observed data. The data assimilation process helps to constrain the model fields while preserving important structural features of the storm. Additionally, the model can output wind and pressure fields at both high spatial and temporal resolutions, thus eliminating the need for interpolating between analysis periods. Finally, the application of the WRF model is not limited to tropical cyclones but can also be used to simulate extra-tropical cyclones and hybrid type events such as Superstorm Sandy, where use of parametric modeling approaches are extremely limited. This study presents some results of an ongoing effort to optimize the WRF model for storm surge modeling applications. The focus of the work in this study was on WRF simulations of Hurricane Irene during the period 27–29 August 2011.
2. Methodology
The WRF model configuration consisted of a 12-km resolution parent domain and a 4-km nested grid with 40 vertical levels from the surface to 100 millibars. The model was configured with a Lambert Conformal (LCC) projection, NWS-84 datum centered at 38.5N, 83.0W, and with standard parallels of 28.5N and 48.5N. A third nest was used for Advanced Hurricane WRF (WRF-AHW) simulations at a spatial resolution of 2 km.
Figure 1 shows the modeling domains for the WRF simulations with the inner nested domains focused over the northeastern United States and over the North Carolina region. The Kain-Fritsch cumulus parameterization scheme was used on the 12-km domain only, while convection was explicitly simulated on the 4-km and 2-km nested domains. The WSM5 microphysics scheme, the Yonsei University (YSU) PBL scheme, and the NOAH land surface model were implemented on all domains. The National Centers for Environmental Prediction (NCEP) 1-degree final analysis (FNL) data was used for the initial and lateral boundary conditions along with the NCEP Real Time Gridded 1/12 degree sea surface temperature data. Four-dimensional data assimilation was applied in all simulations. There are two types of FDDA available in the WRF modeling system: Analysis nudging and observation nudging. In these WRF simulations, analysis nudging was performed on the 12-km domain only using the FNL gridded analysis data. Several sensitivity simulations were also conducted with just the 4-km nested domain to examine the sensitivity of the model to the PBL and cumulus parameterization schemes. The schemes tested were based in part on previous WRF modeling studies [
10,
11]. In addition, simulations were conducted using three different initialization times at both 0000 and 1200 Universal Coordinated Time (UTC) on 27 August 2011, and another at 1200 UTC on 26 August 2011.
Figure 1.
Weather Research and Forecast (WRF) modeling domains. Note the inner domains over the northeast United States and the North Carolina Region. Domain 2 uses a spatial resolution of 4 km while Domain 3 uses a spatial resolution of 2 km.
Figure 1.
Weather Research and Forecast (WRF) modeling domains. Note the inner domains over the northeast United States and the North Carolina Region. Domain 2 uses a spatial resolution of 4 km while Domain 3 uses a spatial resolution of 2 km.
After some initial evaluation of the 4-km resolution WRF simulations, two new sets of simulations were conducted with the WRF-AHW settings with the introduction of a 2-km resolution nested domain. One WRF-AHW simulation focused over the northeast United States and the other simulation was conducted with the 4-km and 2-km nested domains centered on the North Carolina region. These WRF-AHW simulations used a specific selection of data and physics options that were designed to improve the WRF model’s performance specifically for hurricanes. The WRF-AHW configuration consists of initializing the model with HYCOM ocean model data and selecting the surface ocean physics option. This allows the model to evolve the sea surface temperature in response to the storm. The Donelan surface flux option was selected for handling surface fluxes and surface drag. For the WRF-AHW simulations, available surface observations and upper air soundings from the National Centers for Environmental Predictions Automated Data Processing (ADP) data were blended with the FNL analysis data and used for the analysis nudging. The ADP surface and upper air data consist of land-based surface observations, buoy data, and ship reports as well as radiosonde measurements, data from pibals, and aircraft reports. For the WRF-AHW simulations, the WSM5 microphysics, Kain-Fritsch cumulus parameterization, YSU planetary boundary layer scheme, and NOAH land surface model were used. The microphysics, cumulus parameterization, and surface and planetary boundary layer schemes used in the WRF-AHW simulations were the same as the initial WRF simulations conducted on the 4-km nested domain.
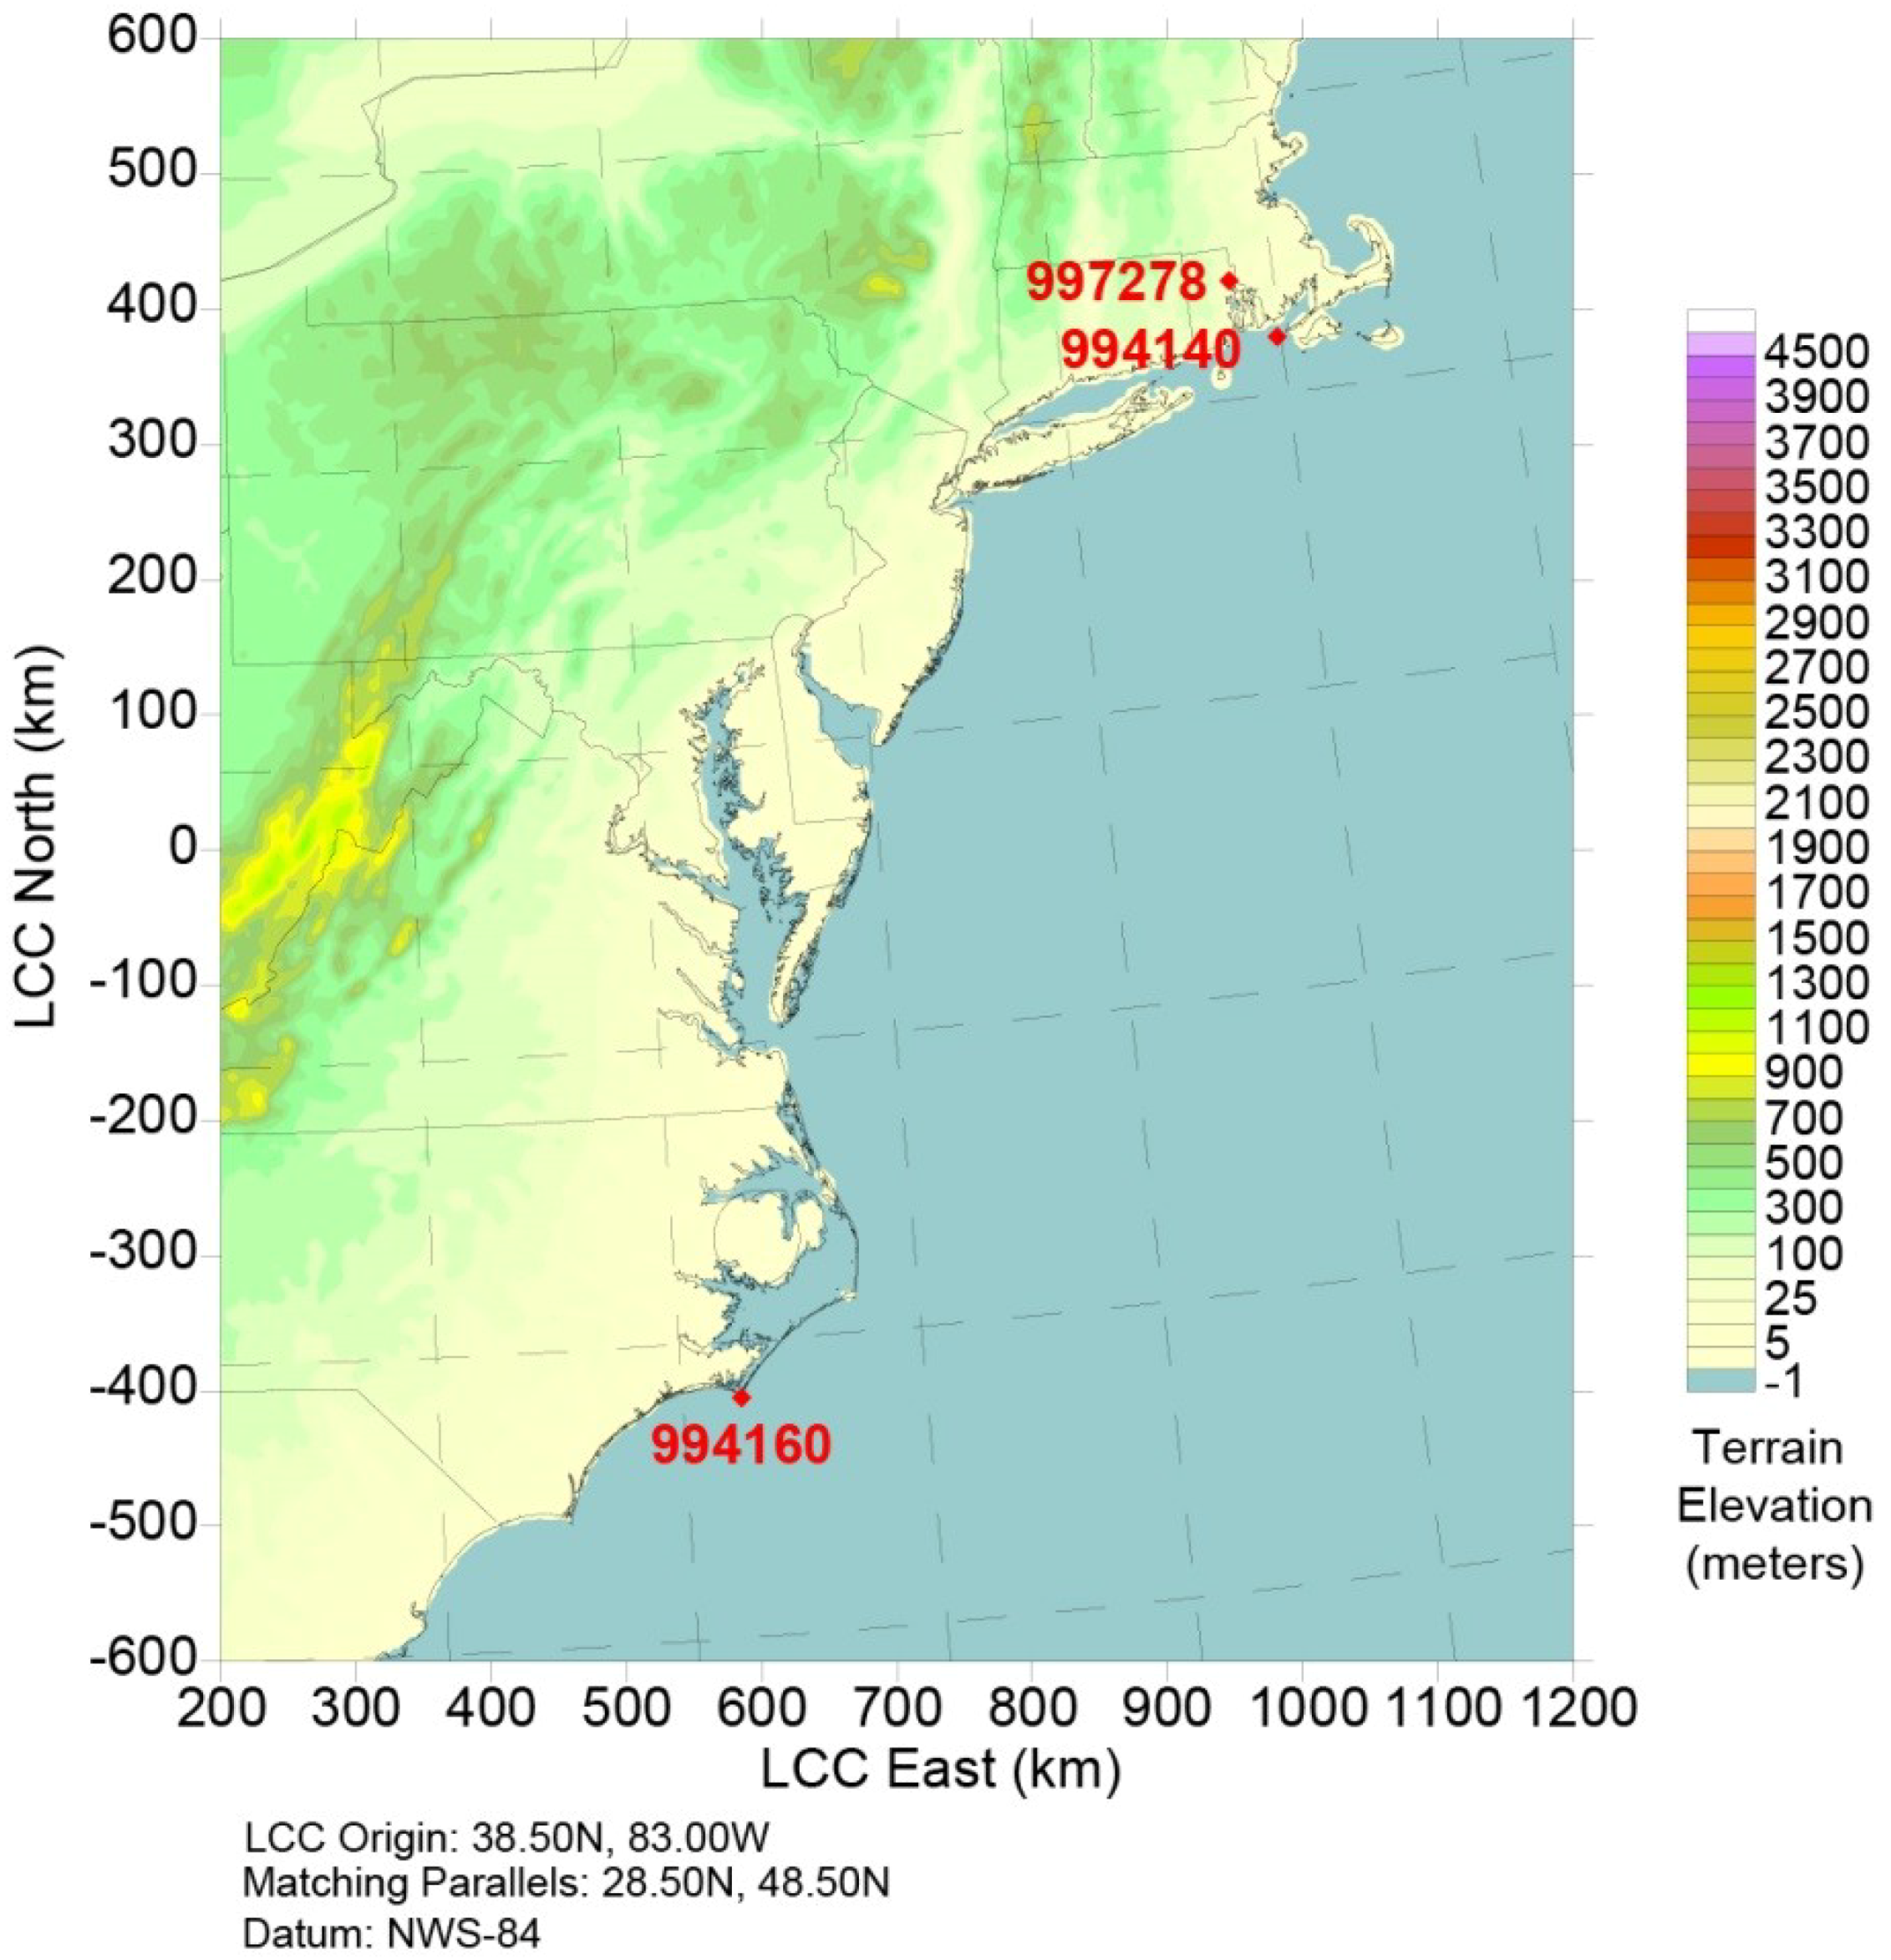
Figure 2 shows a plot of the surface stations used for validation. They include Cape Lookout, North Carolina (Station 994160), Buzzards Bay, Massachusetts (Station 994140), and Providence Rhode Island (Station 997278). For comparisons with direct observations, time series plots were constructed from the observations and compared against time series from the WRF simulation at the observation locations.
Figure 2.
Plot of surface meteorological stations.
Figure 2.
Plot of surface meteorological stations.
3. Results
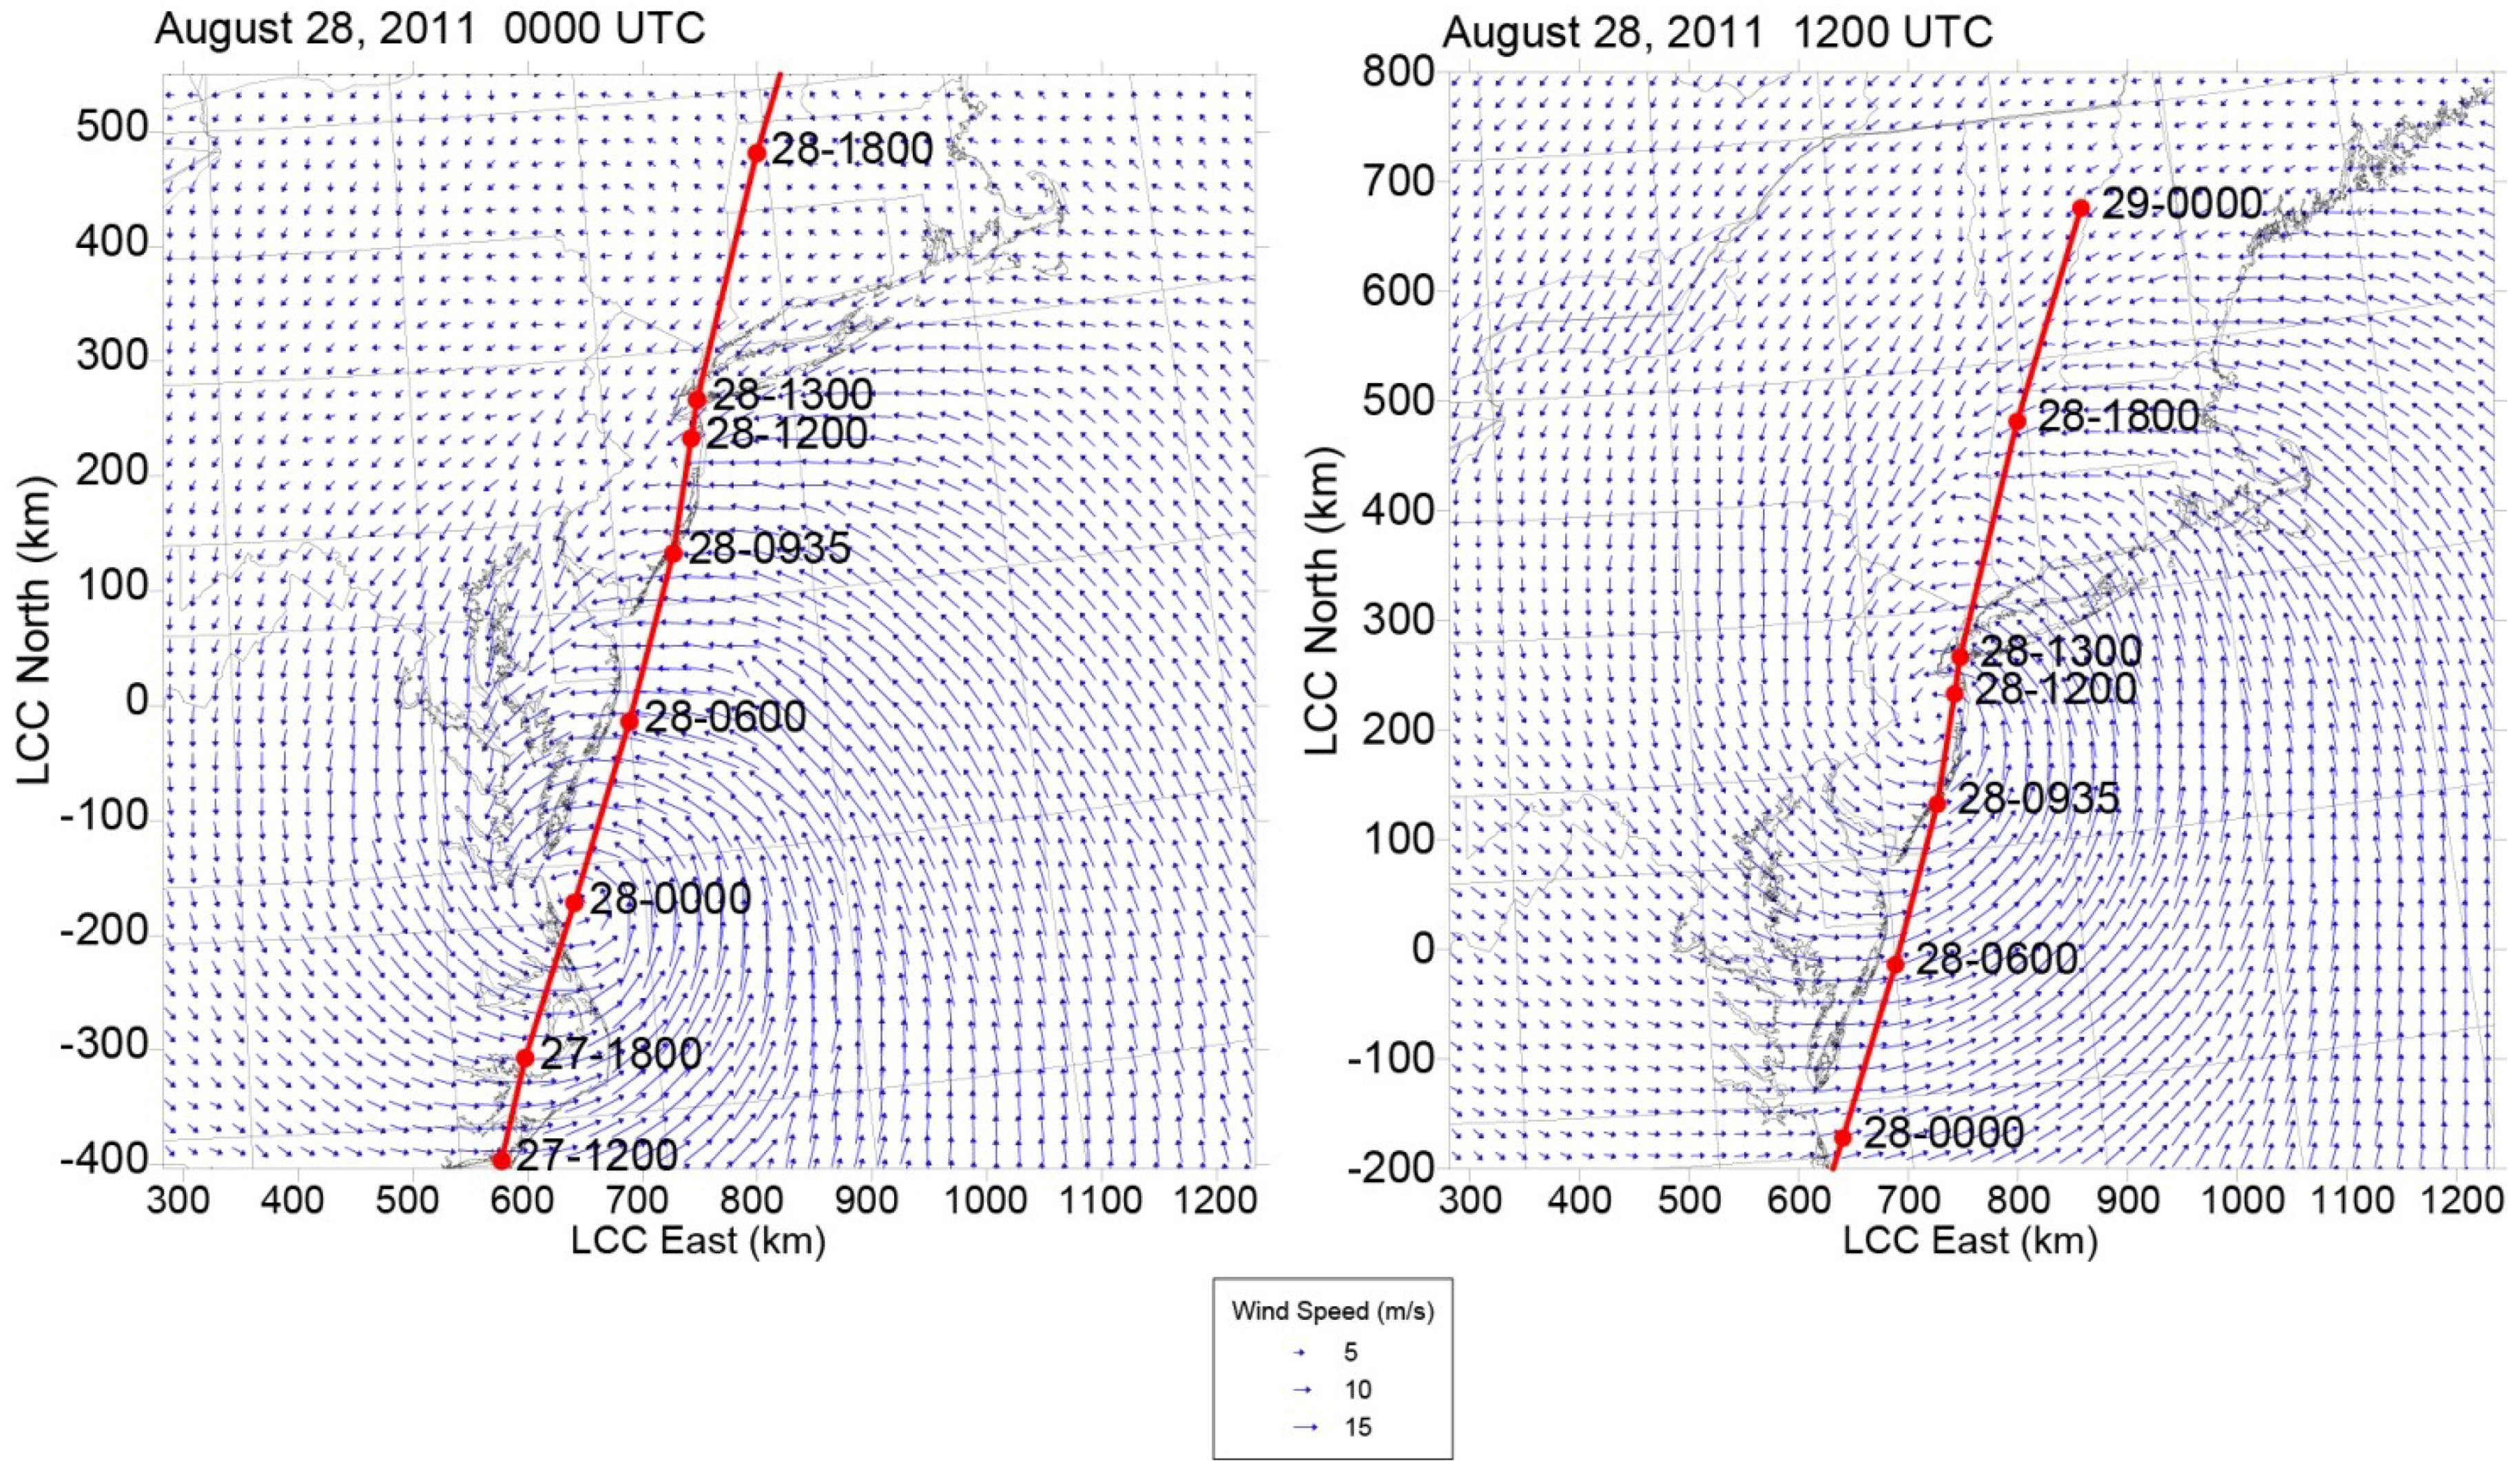
Figure 3 shows wind vector plots from the 4-km modeling domain from the initial WRF simulation which are compared to the National Hurricane Center Best Track data. This figure shows that the WRF track of Irene fits quite well with the best track data. At 1200 UTC on August 28 (right plot of
Figure 3), there is a small southwestward displacement by about 30 km compared to the best track data suggesting the model storm was slightly slower than indicated by the observed data.
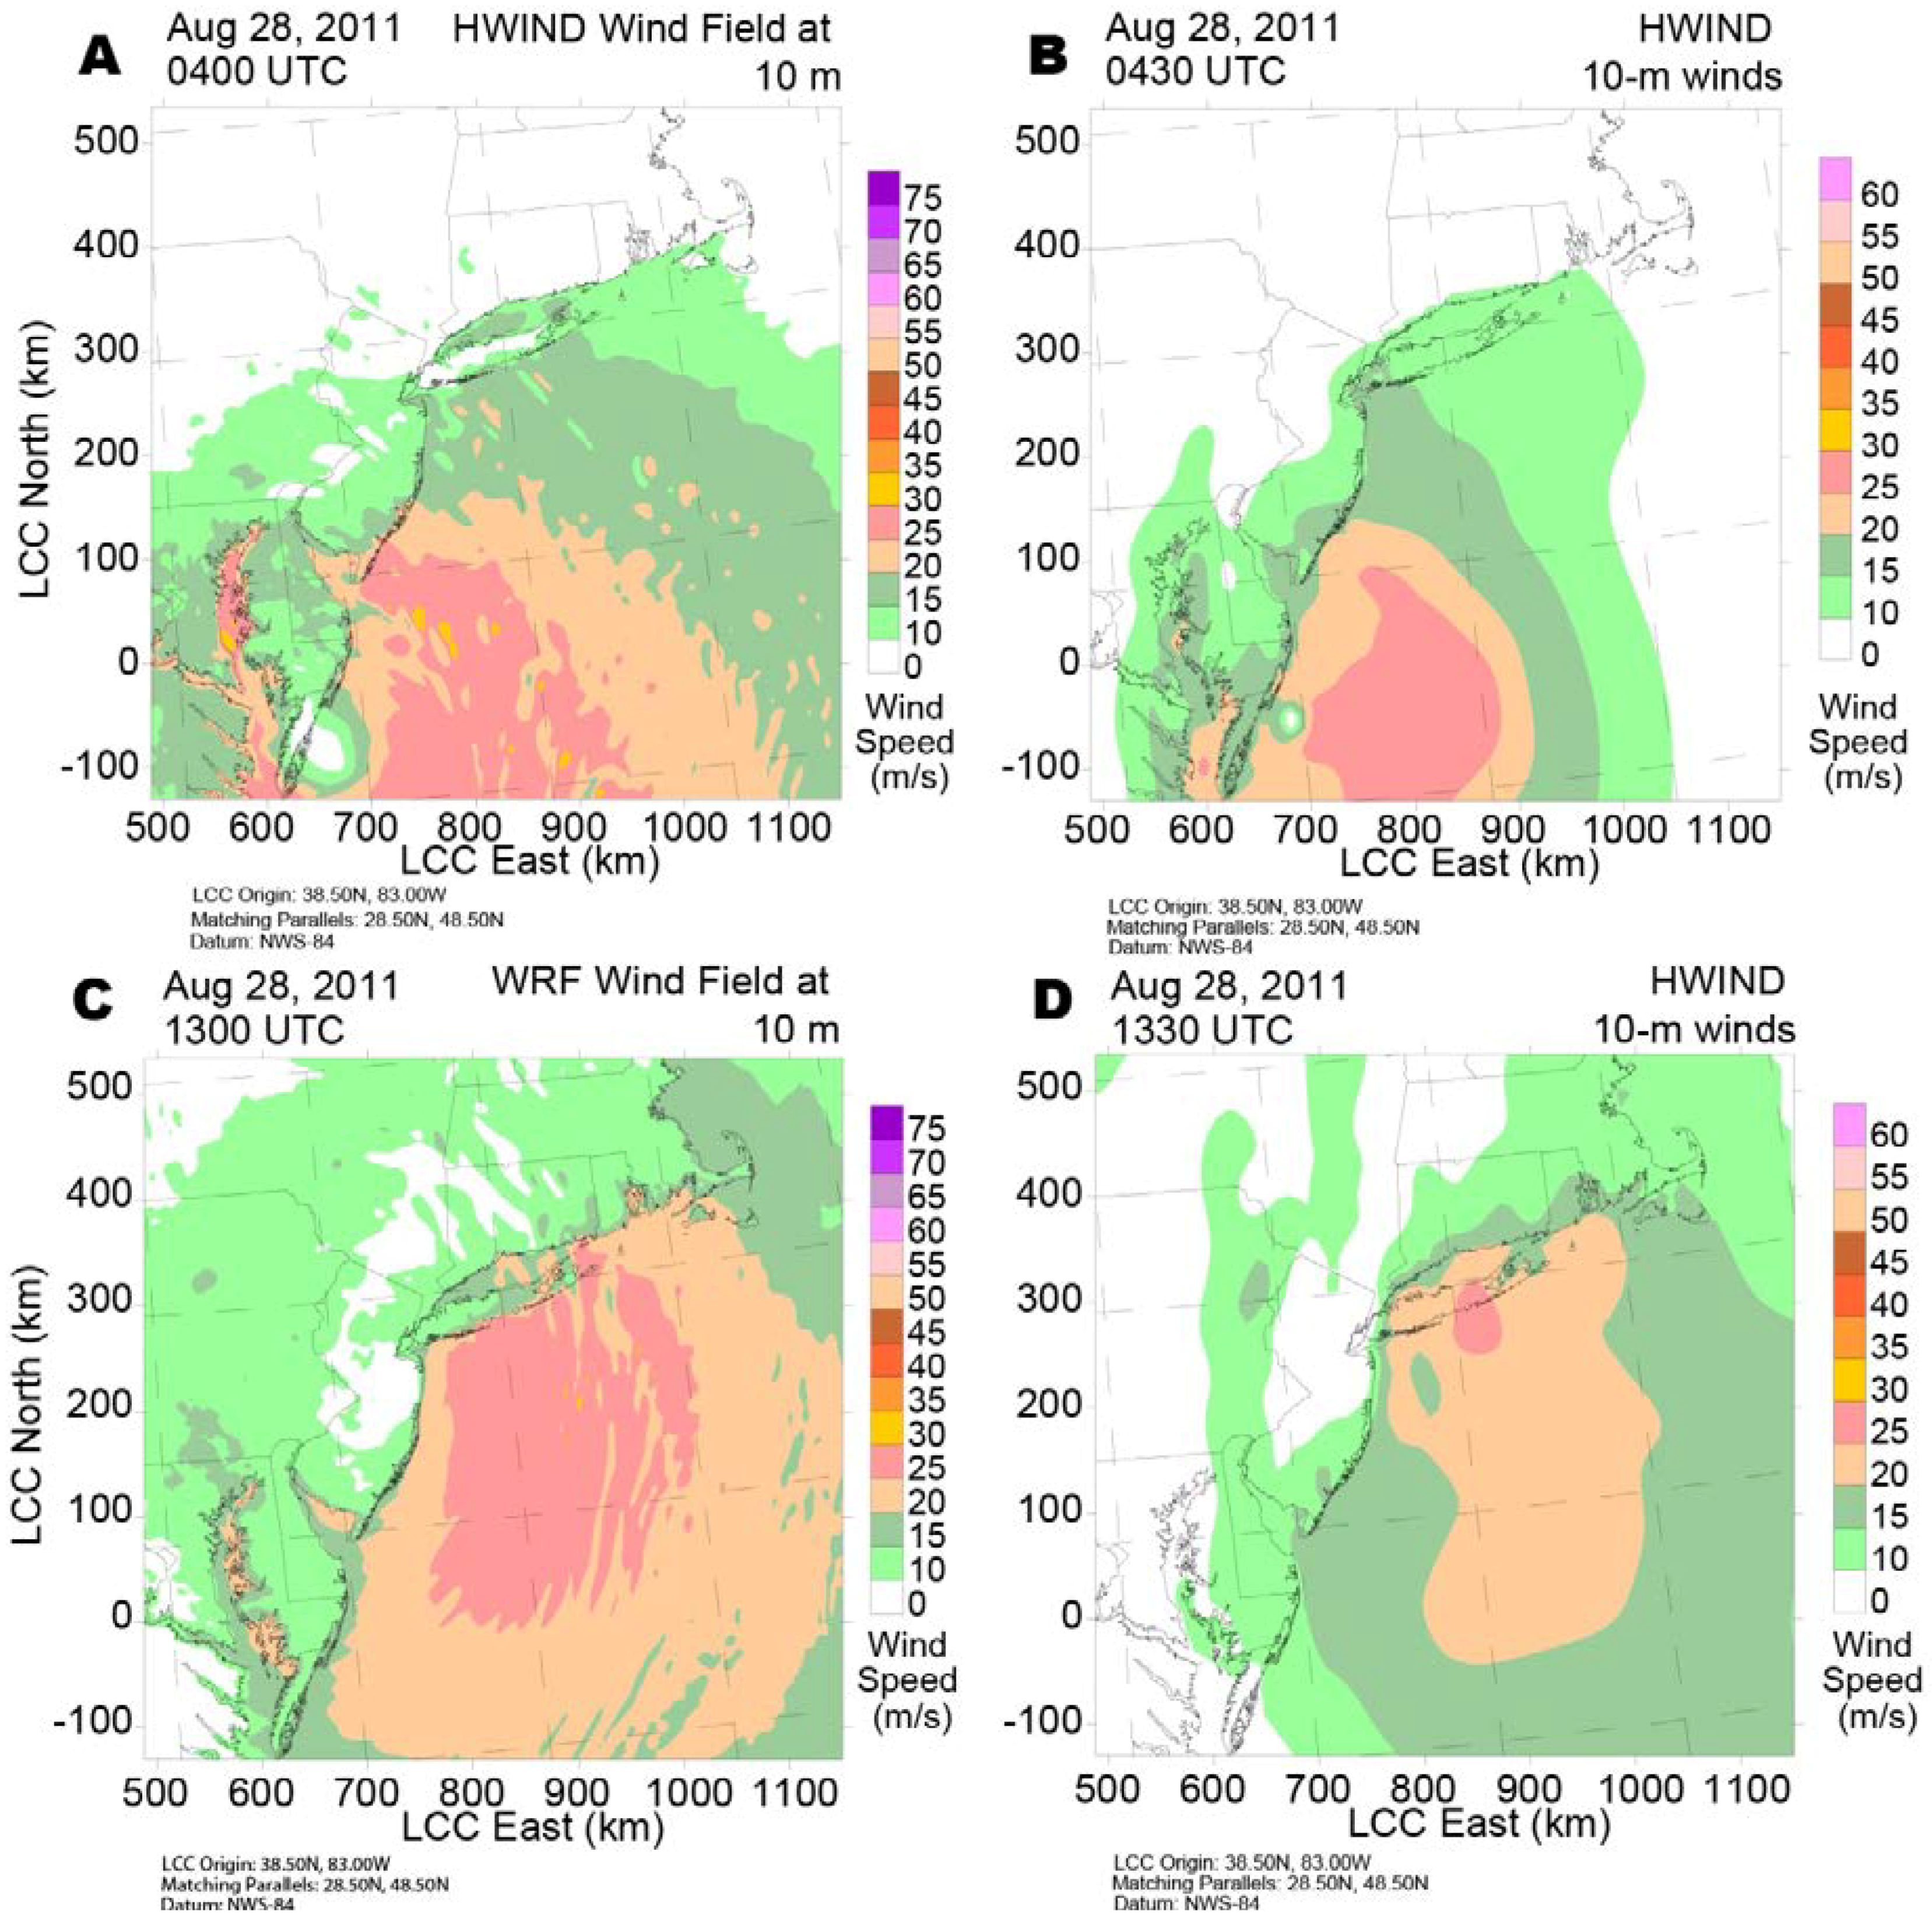
Figure 4 shows the WRF 10-m wind speed plots on the 4‒km resolution modeling domains from the initial WRF simulations and compares these to the HWIND 10-m wind speed analysis. This indicates that at a resolution of 4 km, the shape and orientation of the surface wind field agreed well with HWIND, but the WRF wind speeds were larger overall compared to the HWIND analysis. At this resolution, the WRF model was able to resolve key structural aspects of Hurricane Irene. For modeling classic hurricanes with a compact and well developed inner core, grid resolutions of at least 2 km would be needed to properly resolve the inner core structure.
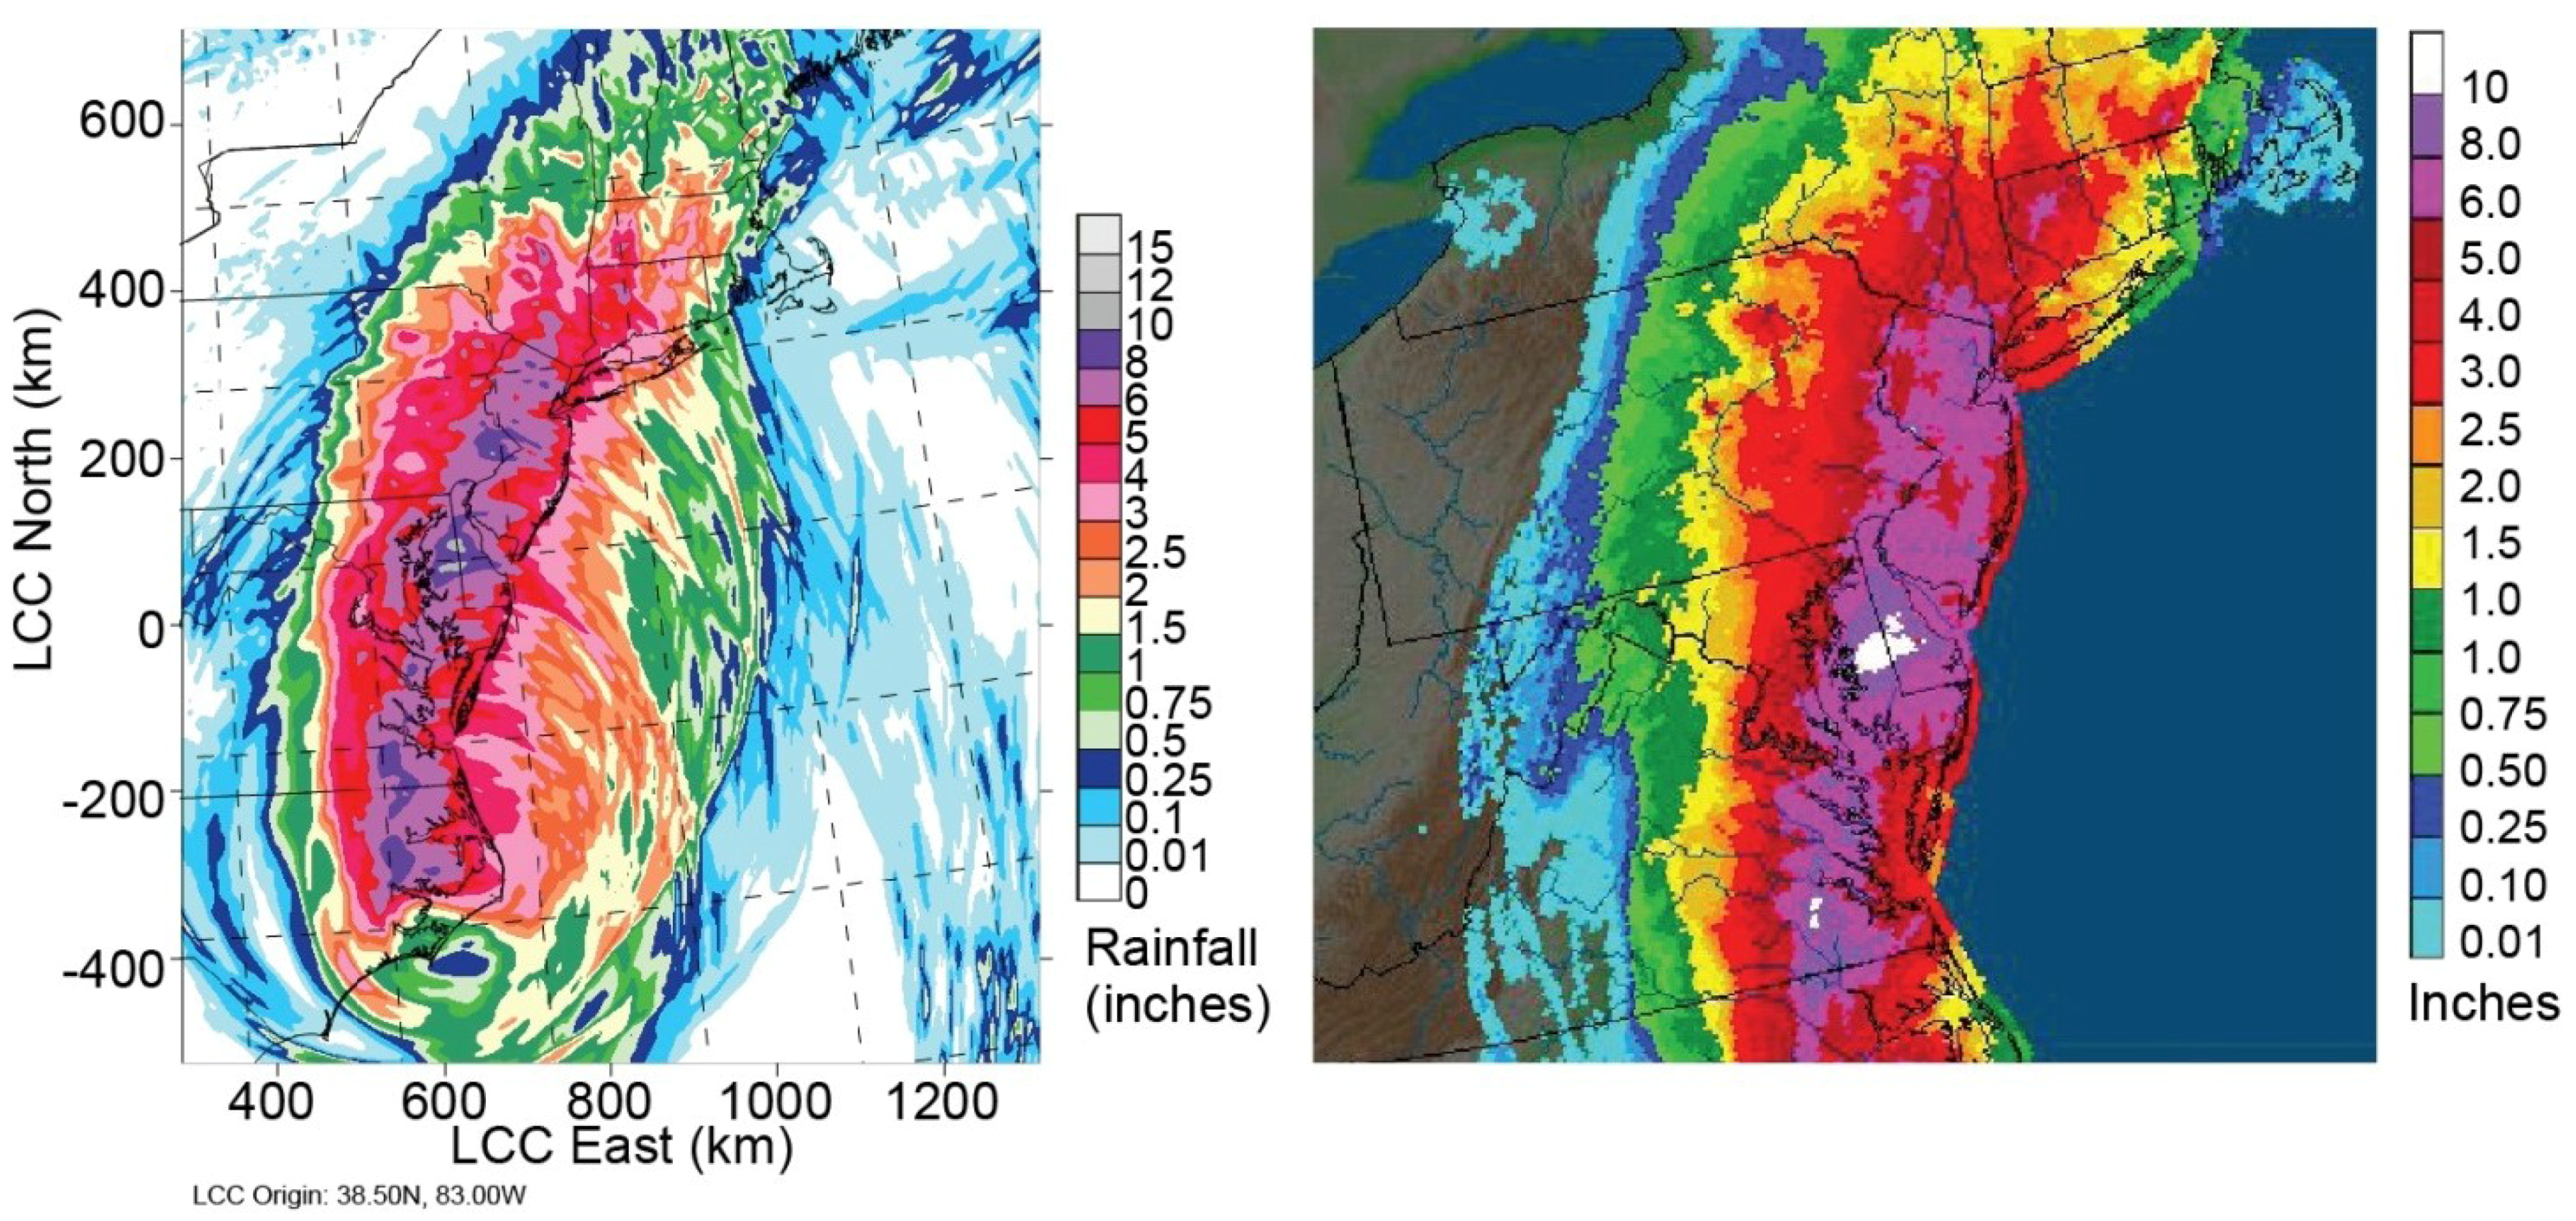
In order to assess how well the WRF simulations reproduced the overall storm structure and dynamics, a plot of total precipitation from the WRF simulation was compared against the NOAA Advanced Hydrologic Prediction System (AHPS) multi-sensor precipitation analysis product.
Figure 5 shows the total rainfall for the 24-h period ending on 28 August 2011, from the WRF simulation for the 4-km resolution domain compared to the AHPS analysis for the same period. The results show that the spatial pattern of total storm rainfall along the U.S. east coast was well simulated by WRF. This plot shows a distinct southwest to northeast axis of 6- to 8-in. rainfall totals extending from the Carolinas into western New England and eastern New York in both the WRF simulation and the observed rainfall analysis. Pockets of rainfall greater than 10 in. are evident both in the WRF simulation and the observed data. This suggests the WRF model properly simulated the storm structure and dynamics.
Figure 3.
WRF 10-m wind vectors on the 4-km domain over the northeast United States (see left plot in
Figure 1) at 0000 UTC (
left) and 1200 Universal Coordinated Time (UTC) (
right) 28 August 2011. The red line shows the observed track of Hurricane Irene.
Figure 3.
WRF 10-m wind vectors on the 4-km domain over the northeast United States (see left plot in
Figure 1) at 0000 UTC (
left) and 1200 Universal Coordinated Time (UTC) (
right) 28 August 2011. The red line shows the observed track of Hurricane Irene.
Figure 4.
WRF 10-m wind speed analysis on the 4-km resolution domain (A) at 0400 UTC and (C) at 1300 UTC compared to the HWIND 10-m wind speed analysis (B) 0430 UTC and (D) at 1330 UTC on 28 August 2011 (Courtesy of the Hurricane Research Division).
Figure 4.
WRF 10-m wind speed analysis on the 4-km resolution domain (A) at 0400 UTC and (C) at 1300 UTC compared to the HWIND 10-m wind speed analysis (B) 0430 UTC and (D) at 1330 UTC on 28 August 2011 (Courtesy of the Hurricane Research Division).
Figure 5.
Twenty four-hour total rainfall ending on 28 August 2011, at 1200 UTC from WRF simulation on the 4-km domain (left) and observed rainfall from the National Oceanic and Atmospheric Administration (NOAA) Advanced Hydrologic Prediction System (AHPS) Multi-Sensor Precipitation Analysis (right).
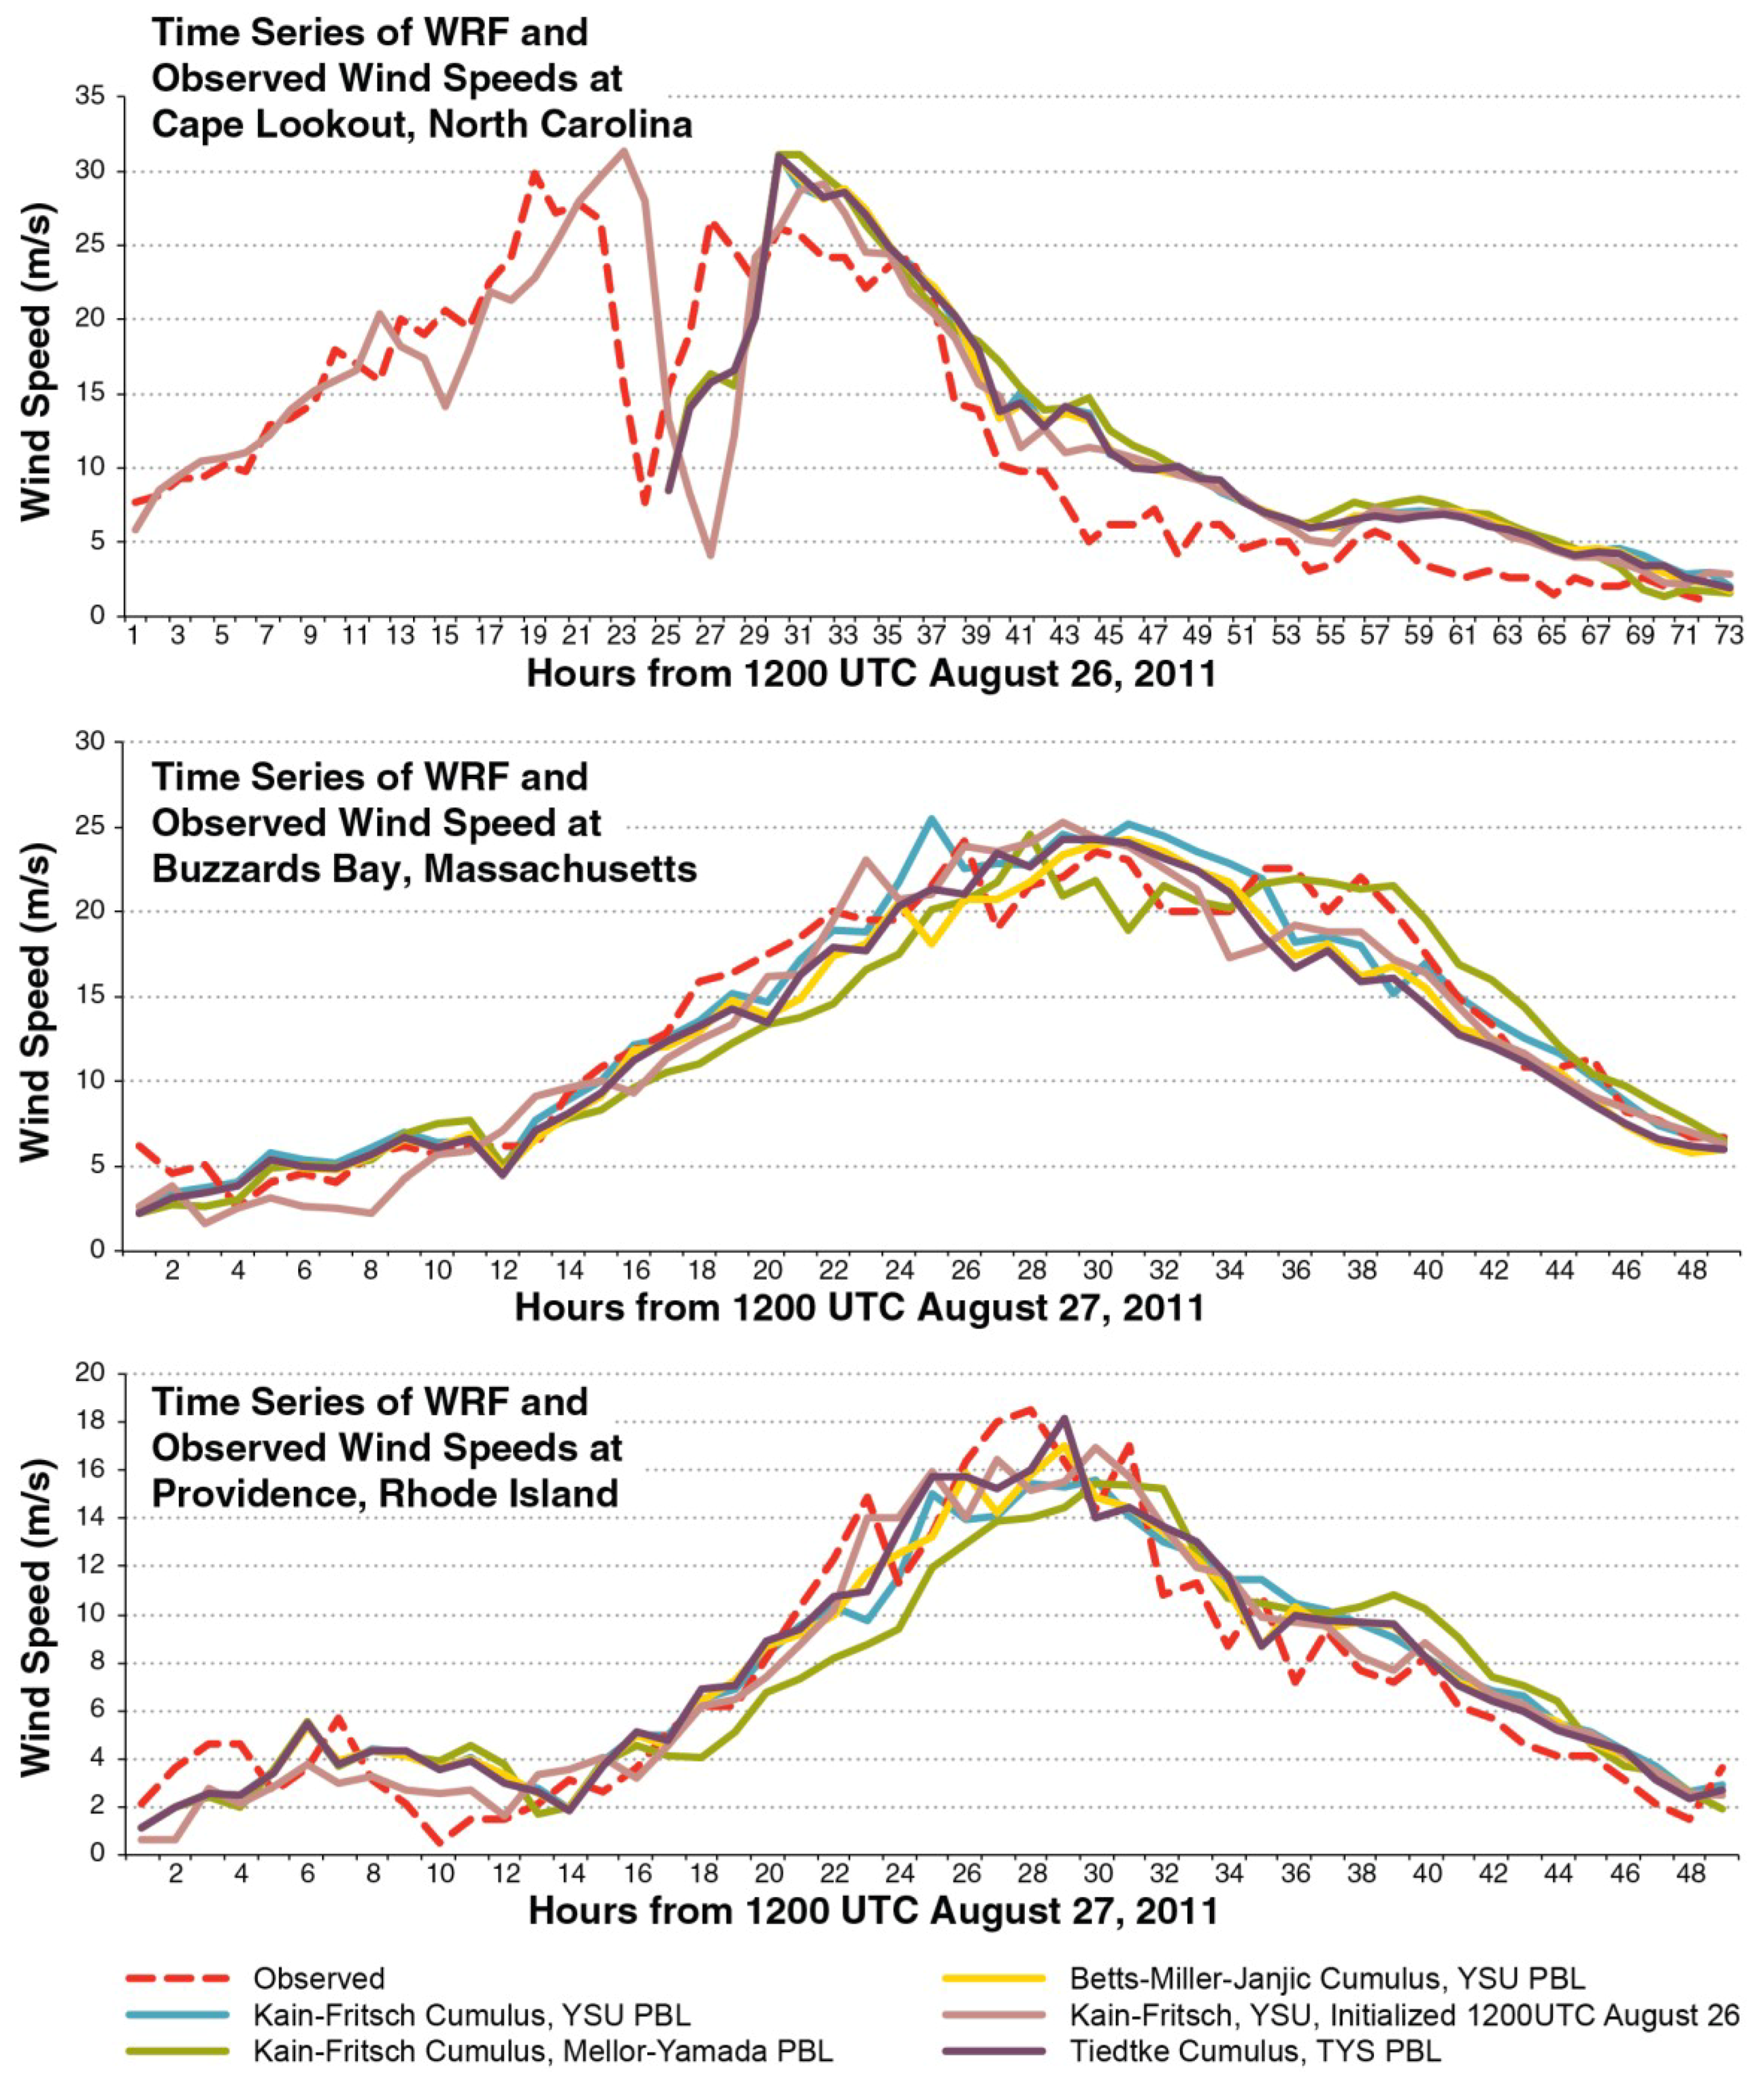
Time series plots of 10-m wind speed for several of the initial WRF sensitivity simulations on the 4-km nested domain only are compared to time series of the observed wind speeds and are provided in
Figure 6. The time series at Cape Lookout shows that the WRF simulations captured the wind speed signature of the storm’s eye as it passed over Cape Lookout. The WRF simulations were a little slower, bringing the eye into Cape Lookout later by a couple of hours compared to the observed data. The peak wind speeds were higher than the observed winds at Cape Lookout, but as a whole, the time evolution of the WRF wind speeds was in general agreement with the observed data. Note that after about 36 h, when the eye region is northeast of Cape Lookout, the WRF wind speeds are higher for all simulations compared to the observed data. The time series at Providence and Buzzards Bay both show the WRF wind speeds in close agreement with the observed winds. Overall there is some variability between the different simulations, but all the simulations show wind speeds that cluster near the observed values. Computed root mean square error (RMSE) values were on the order of about 2 m/s for Providence and Buzzards Bay and about 4 m/s at Cape Lookout. The larger error at Cape Lookout is likely due to the tighter gradients near the storm core at a period when the storm had a more well-defined inner core structure. Thus, small timing errors in the WRF simulation can result in increased RMSE values.
Figure 6.
Time series plots of WRF 10-m wind speeds compared to observed data for several WRF simulations using different physics, cumulus parameterization, and initialization times for Cape Lookout, North Carolina (top), Buzzards Bay, Massachusetts (middle), and Providence, Rhode Island (bottom).
Figure 6.
Time series plots of WRF 10-m wind speeds compared to observed data for several WRF simulations using different physics, cumulus parameterization, and initialization times for Cape Lookout, North Carolina (top), Buzzards Bay, Massachusetts (middle), and Providence, Rhode Island (bottom).
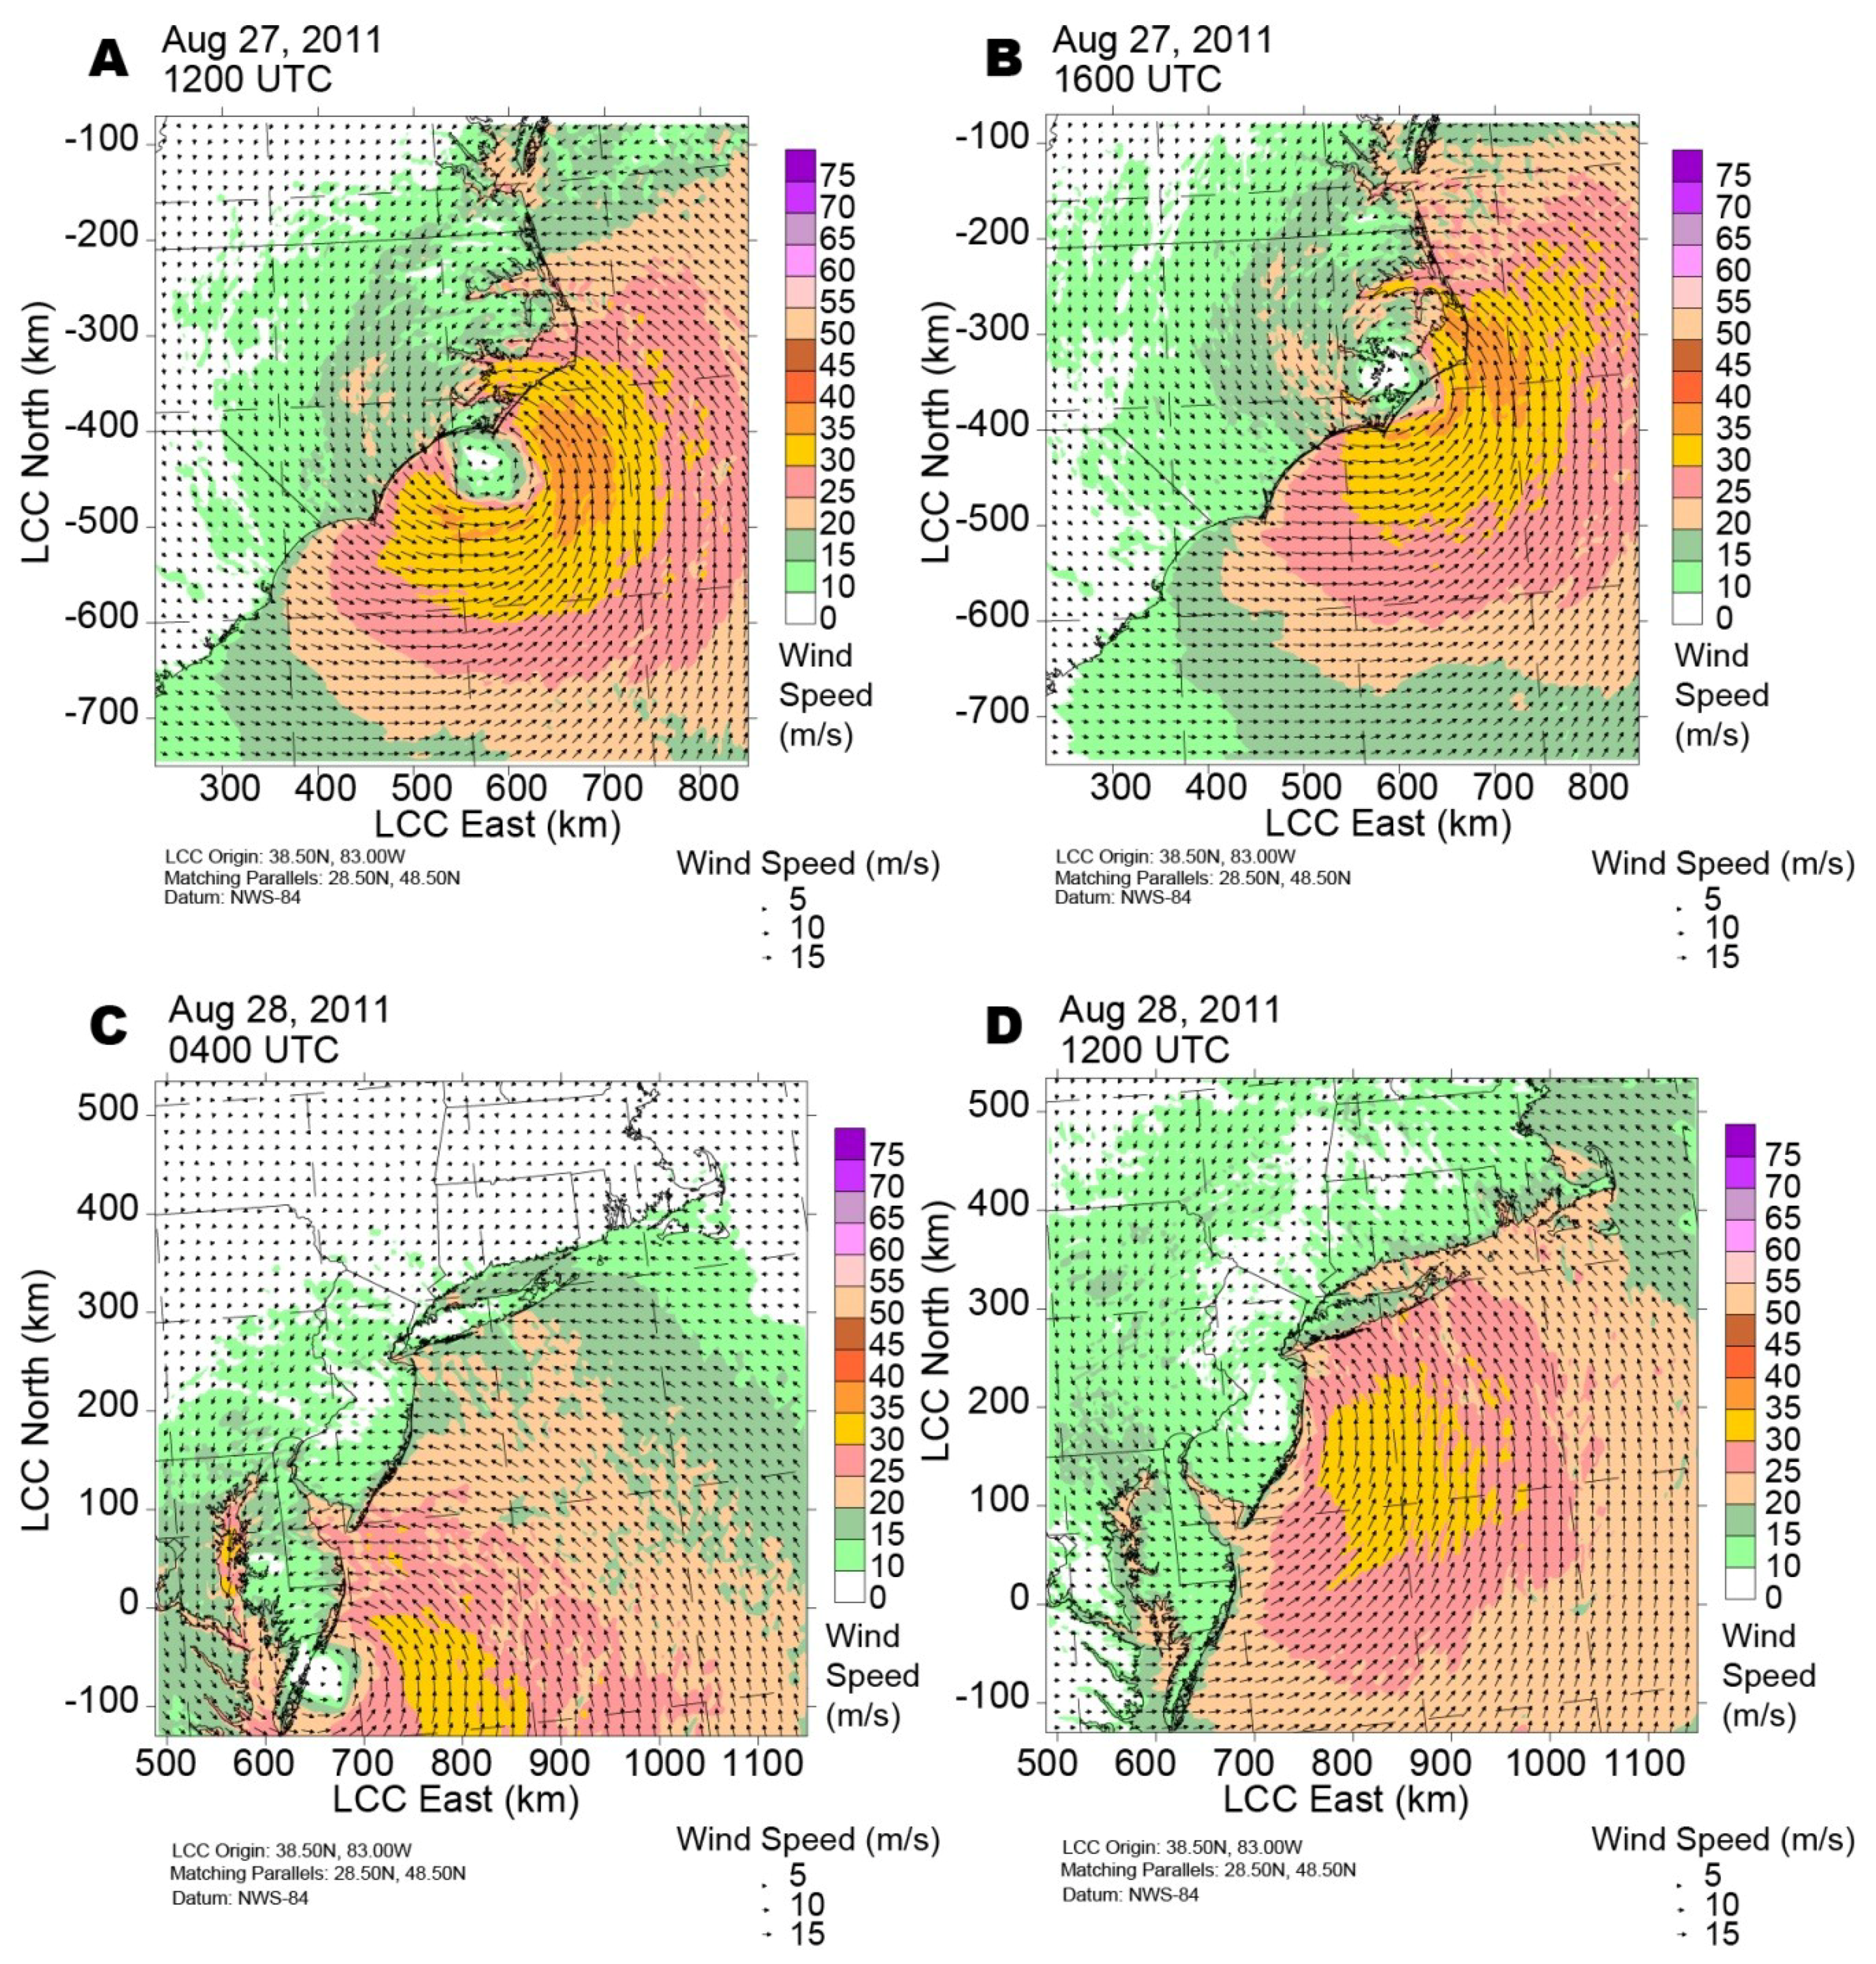
Figure 7 shows both wind vectors and color-filled, 10-m wind speed contours for the two WRF-AHW simulations on the 2-km resolution domain, one for the North Carolina region (top) and the other for the Northeast region (bottom).
Figure 7 shows that the 2-km resolution WRF model presents a realistic representation of Hurricane Irene’s spatial wind field structure. While the storm was evolving south of the North Carolina coast, the WRF model shows a more well defined but still asymmetric wind field structure. The asymmetry was more pronounced as the storm moved northward along the Northeast coast and into western New England on 28 August 2011. Most of the strong surface winds were east of the center and covered a larger spatial region. Note that the WRF-AHW simulations on the 2-km nested domain show a somewhat stronger storm (compared to the 4-km resolution simulations shown in
Figure 4). This is, at least in part, due to the increased grid resolution.
Figure 7.
WRF-AHW wind vectors and 10-m wind speed analysis on the 2-km resolution domain (A) at 1200 UTC on 27 August 2011, (B) at 1600 UTC on 27 August 2011, (C) 0400 UTC on 28 August 2011, and (D) at 1200 UTC on 28 August 2011.
Figure 7.
WRF-AHW wind vectors and 10-m wind speed analysis on the 2-km resolution domain (A) at 1200 UTC on 27 August 2011, (B) at 1600 UTC on 27 August 2011, (C) 0400 UTC on 28 August 2011, and (D) at 1200 UTC on 28 August 2011.
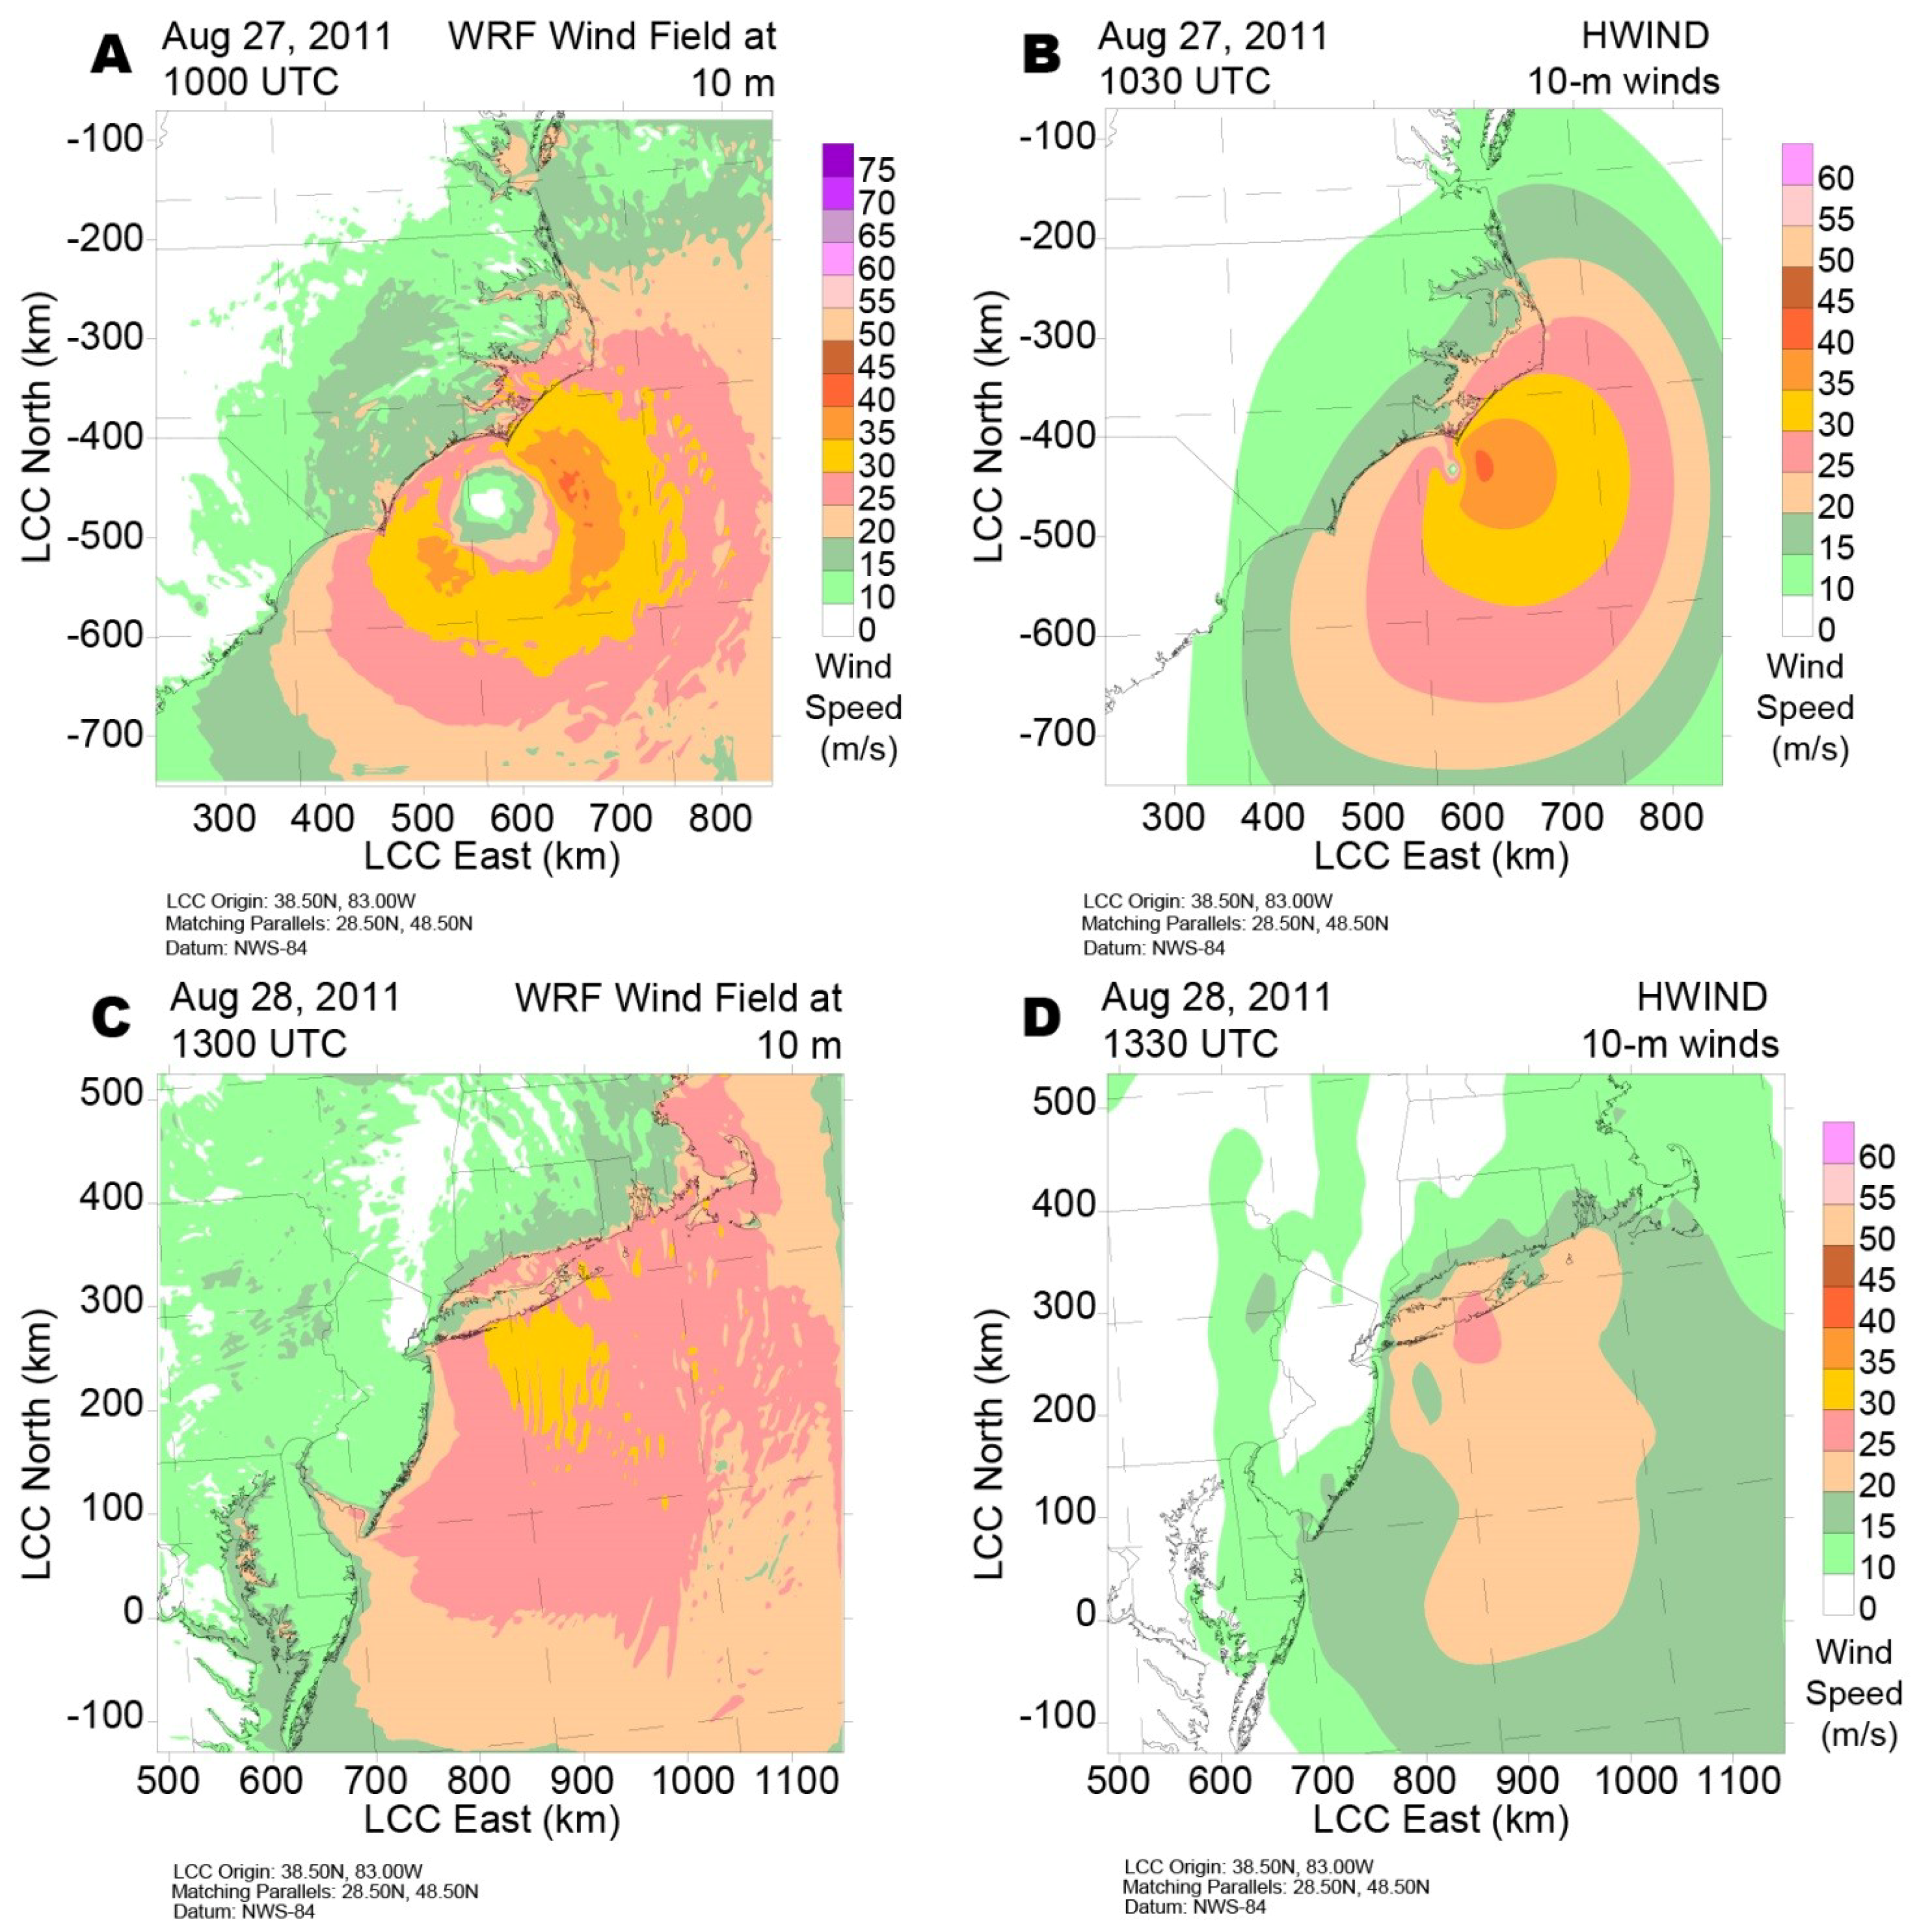
Figure 8 shows the WRF-AHW simulation 10-m wind speed analysis (2-km resolution domain) compared to the HWIND analysis product. These results show close agreement with the shape and location of the maximum wind speed axis depicted by the HWIND analysis. The WRF wind speeds were higher in both the inner core and outer regions relative to HWIND. Some preliminary analysis (not shown) suggests that the higher wind speeds are due to the central pressures being too low in WRF compared to the observed data. Further sensitivity simulations are being explored to understand this issue.
Figure 8.
WRF-AHW 10-m wind speed analysis on the 2-km resolution domain (A) at 1000 UTC compared to the HWIND 10-m wind speed analysis (B) at 1030 UTC on 27 August 2011, (C) WRF at 1300 UTC, and (D) HWIND at 1330 UTC on 28 August 2011 (HWIND data Courtesy of the Hurricane Research Division).
Figure 8.
WRF-AHW 10-m wind speed analysis on the 2-km resolution domain (A) at 1000 UTC compared to the HWIND 10-m wind speed analysis (B) at 1030 UTC on 27 August 2011, (C) WRF at 1300 UTC, and (D) HWIND at 1330 UTC on 28 August 2011 (HWIND data Courtesy of the Hurricane Research Division).
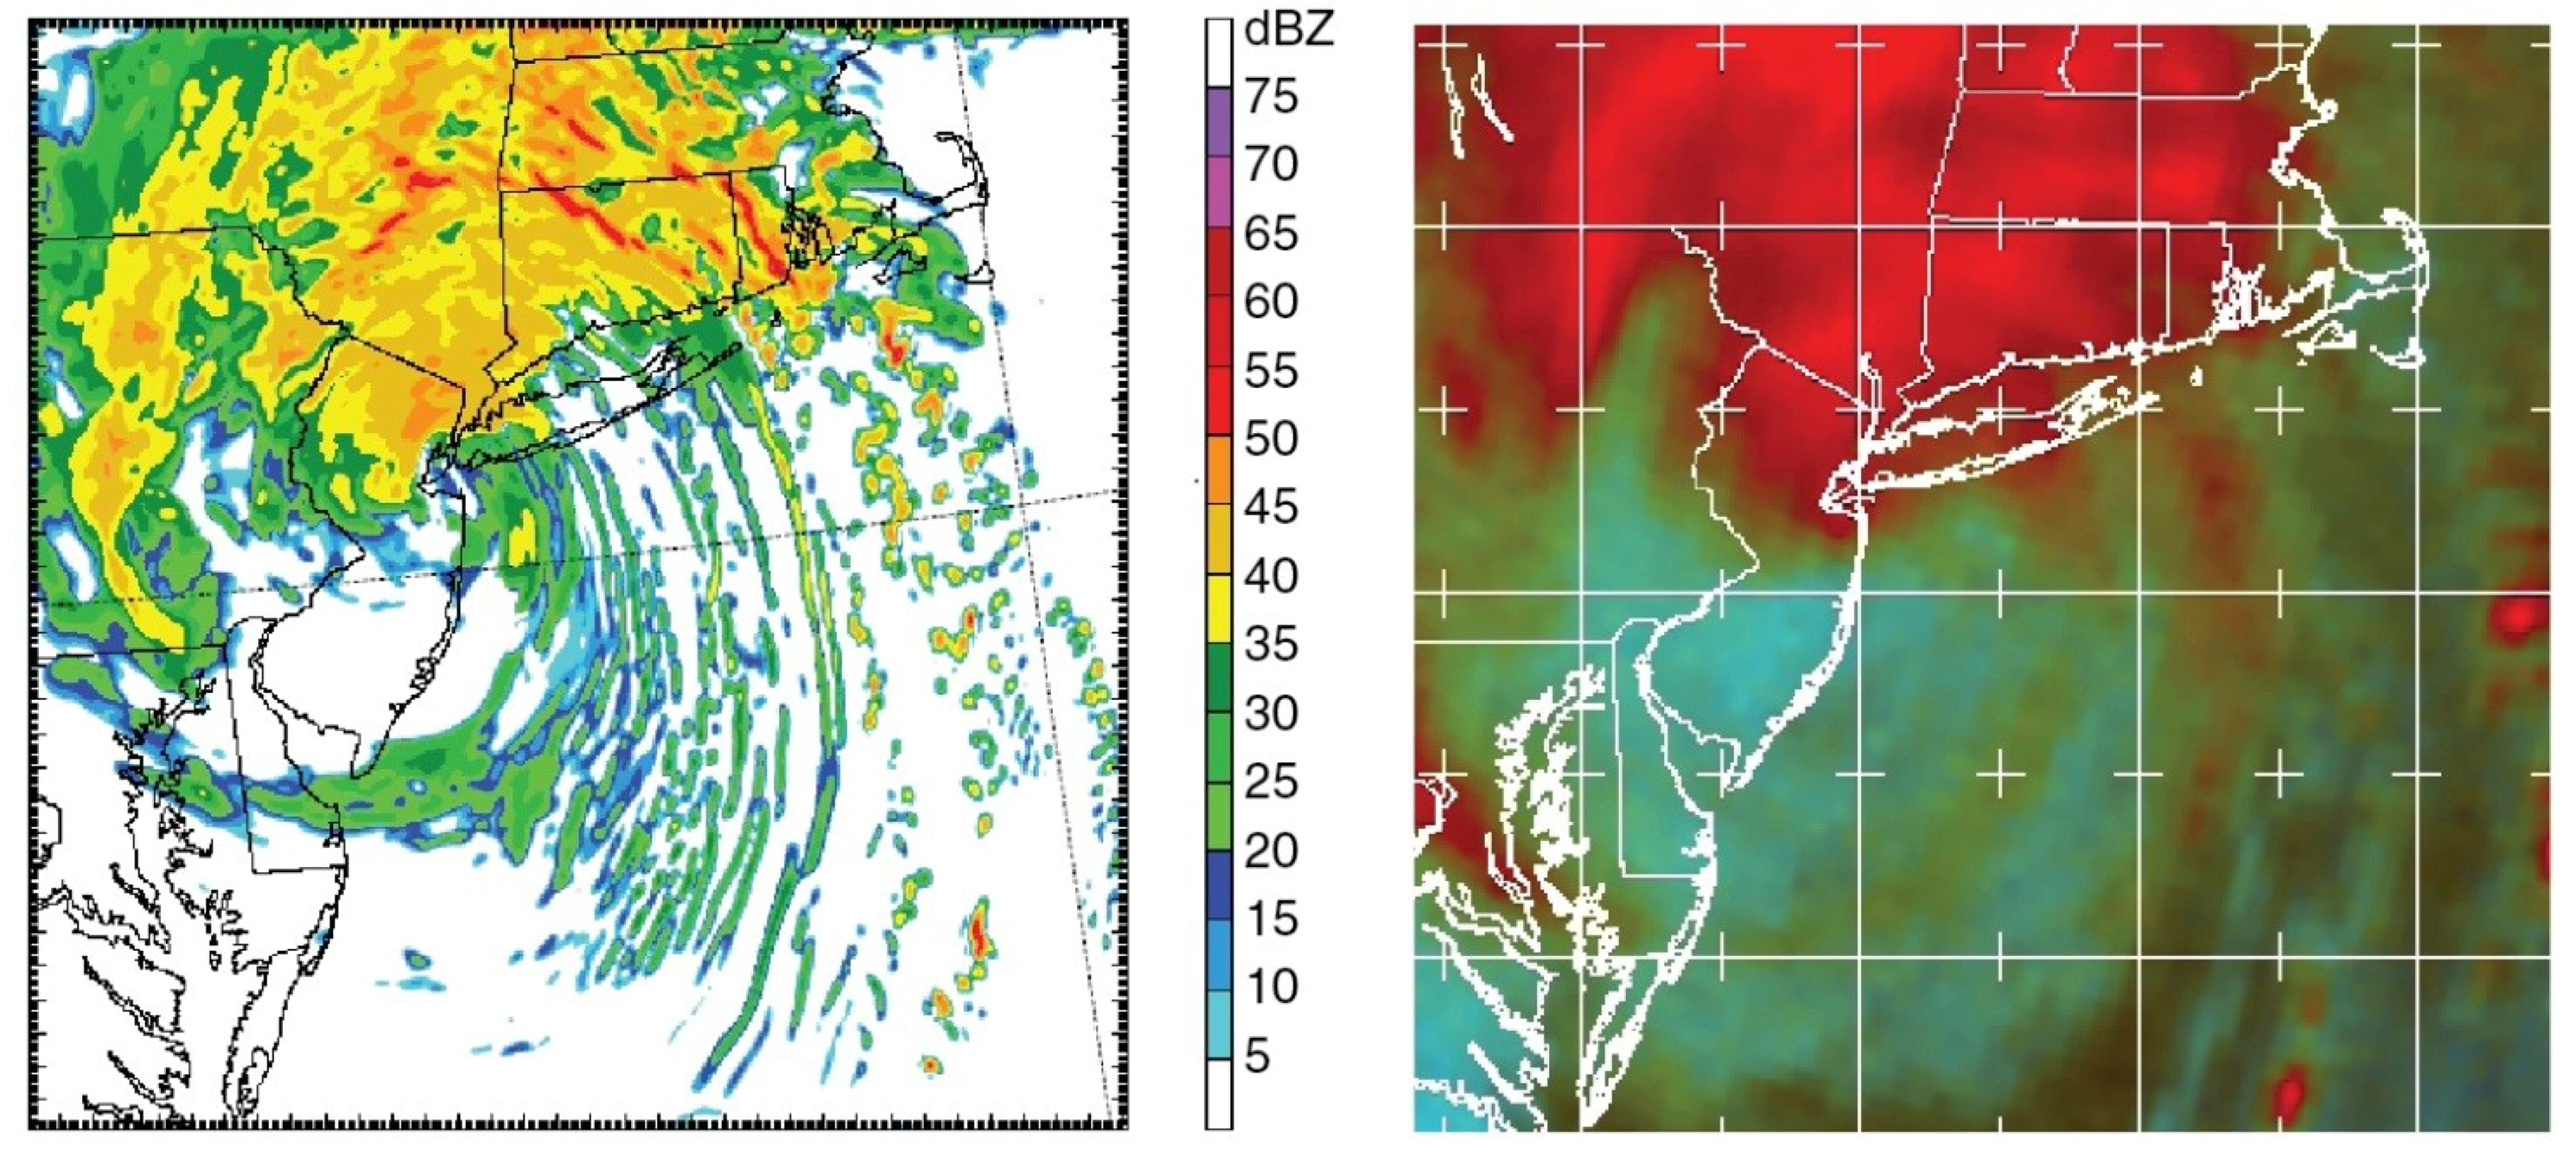
Figure 9 shows a comparison of the WRF-AHW simulated radar reflectivity run with the Special Sensor Microwave Imager Sounder (SSMIS) microwave image from the Defense Meteorological Satellite Programs F-16 satellite obtained from the U.S. Naval Research Laboratory. The SSMIS imagery is sensitive to precipitation particles rather than cloud top temperature and as a result has some similarities to a radar image. The simulated WRF-AHW reflectivity is from the 2-km resolution nested grid. These plots show excellent agreement between the WRF reflectivity field and the SSMIS imagery. Note that the WRF simulation correctly resolved the large intense precipitation region north and northwest of the storm center as well as the cyclonically curved rainband structures to the east and southeast of the center of Irene.
Figure 9.
Simulated radar reflectivity from WRF-AHW simulation on the 2-km resolution domain for 28 August 2011, at 1200 UTC (left) and the special sensor microwave imager Sounder (SSMIS) photo (right) for 28 August 2011, at 1136 UTC from the Defense Meteorological Satellite Programs F-16 Satellite (SSMIS image courtesy of the U.S. Naval Research Laboratory).
The results of both the initial WRF simulations on the 4-km resolution nested domain and the WRF-AHW simulations on the 2-km nested domain suggest that with even modest data assimilation applied to these simulations, the model was able to resolve the detailed structure of the storm, the storm track, and the spatial surface wind field pattern very well.


