Article

Basin Testing of Wave Energy Converters in Trondheim: Investigation of Mooring Loads and Implications for Wider Research

1
School of Geosciences, Edinburgh University, Edinburgh EH9 3JN, UK
2
School of Built Environment, Heriot Watt University, Edinburgh EH14 4AS, UK
*
Author to whom correspondence should be addressed.
J. Mar. Sci. Eng. 2014, 2(2), 326-335; https://doi.org/10.3390/jmse2020326
Submission received: 31 December 2013 / Revised: 28 February 2014 / Accepted: 3 March 2014 / Published: 1 April 2014
(This article belongs to the Special Issue Marine Energy Systems)

Abstract

:
This paper describes the physical model testing of an array of wave energy devices undertaken in the NTNU (Norwegian University of Science and Technology) Trondheim basin between 8 and 20 October 2008 funded under the EU Hydralabs III initiative, and provides an analysis of the extreme mooring loads. Tests were completed at 1/20 scale on a single oscillating water column device and on close-packed arrays of three and five devices following calibration of instrumentation and the wave and current test environment. One wave energy converter (WEC) was fully instrumented with mooring line load cells, optical motion tracker and accelerometers and tested in regular waves, short- and long-crested irregular waves and current. The wave and current test regimes were measured by six wave probes and a current meter. Arrays of three and five similar WECs, with identical mooring systems, were tested under similar environmental loading with partial monitoring of mooring forces and motions. The majority of loads on the mooring lines appeared to be broadly consistent with both logistic and normal distribution; whilst the right tail appeared to conform to the extreme value distribution. Comparison of the loads at different configurations of WEC arrays suggests that the results are broadly consistent with the hypothesis that the mooring loads should differ. In particular; the results from the tests in short crested seas conditions give an indication that peak loads in a multi WEC array may be considerably higher than in 1-WEC configuration. The test campaign has contributed essential data to the development of Simulink™ and Orcaflex™ models of devices, which include mooring system interactions, and data have also been obtained for inter-tank comparisons, studies of scale effects and validation of mooring system numerical models. It is hoped that this paper will help to draw the attention of a wider scientific community to the dataset freely available from the Marintek website.

1. Introduction

Owing to the increasing cost and shortage of energy resources, there has been a growing interest in renewable alternative sources of energy [1]. An increasing effort should therefore be made towards resolving the problems of extracting energy from the world’s oceans, as they represent a vast potential source of renewable energy.
Wave drift forces acting on floating wave energy converters (WEC) are arguably one of the most important loading components for the design of the mooring system [2]. The results of previous research indicate that moorings may have a significant impact on the performance of energy extracting devices, both beneficial and detrimental [2]. These points are particularly relevant to the arrays of wave energy converters, as they have to be installed in a spatially dense manner to make appropriate use of sea space and improve the economics of installation and maintenance. The main requirement for moorings is reliable station keeping [3]. Constraining the “footprint” of the mooring to ensure that the moorings from each device do not interfere with one another may have great significance for the loading experienced by the line [4].
A prime concern in the design of an array is that devices, or their moorings, do not come in contact [5]. Compliant (soft) mooring arrangements can result in large excursion from the equilibrium position and increase the chance of collision.
This paper deals with the physical model testing of an array of wave energy devices undertaken in the NTNU Trondheim basin between 8th and 20th October 2008, funded under the EU Hydralabs III initiative. The aim of the tests was to provide data for the validation of numerical models of the device motions, power recovery and mooring components when moored in a closely spaced array; the tests were not intended to be proof-of-concept tests for a particular device and none of the tests were designed to study survival response under extreme loading.
The specific objectives of this paper are:
(1)
To give an overview of the experimental set up and the range of tests completed;
(2)
To examine the hypothesis that for the same sea state and other environmental conditions, mooring line loads in an array of WECs will differ from those in a one WEC installation;
(3)
To discuss the implications of the results obtained in a wider context of ongoing studies of moored renewable energy devices and potential environmental implications;
(4)
To draw the attention of a wider scientific community to the data set freely available from the Marintek website.

2. Materials and Methods

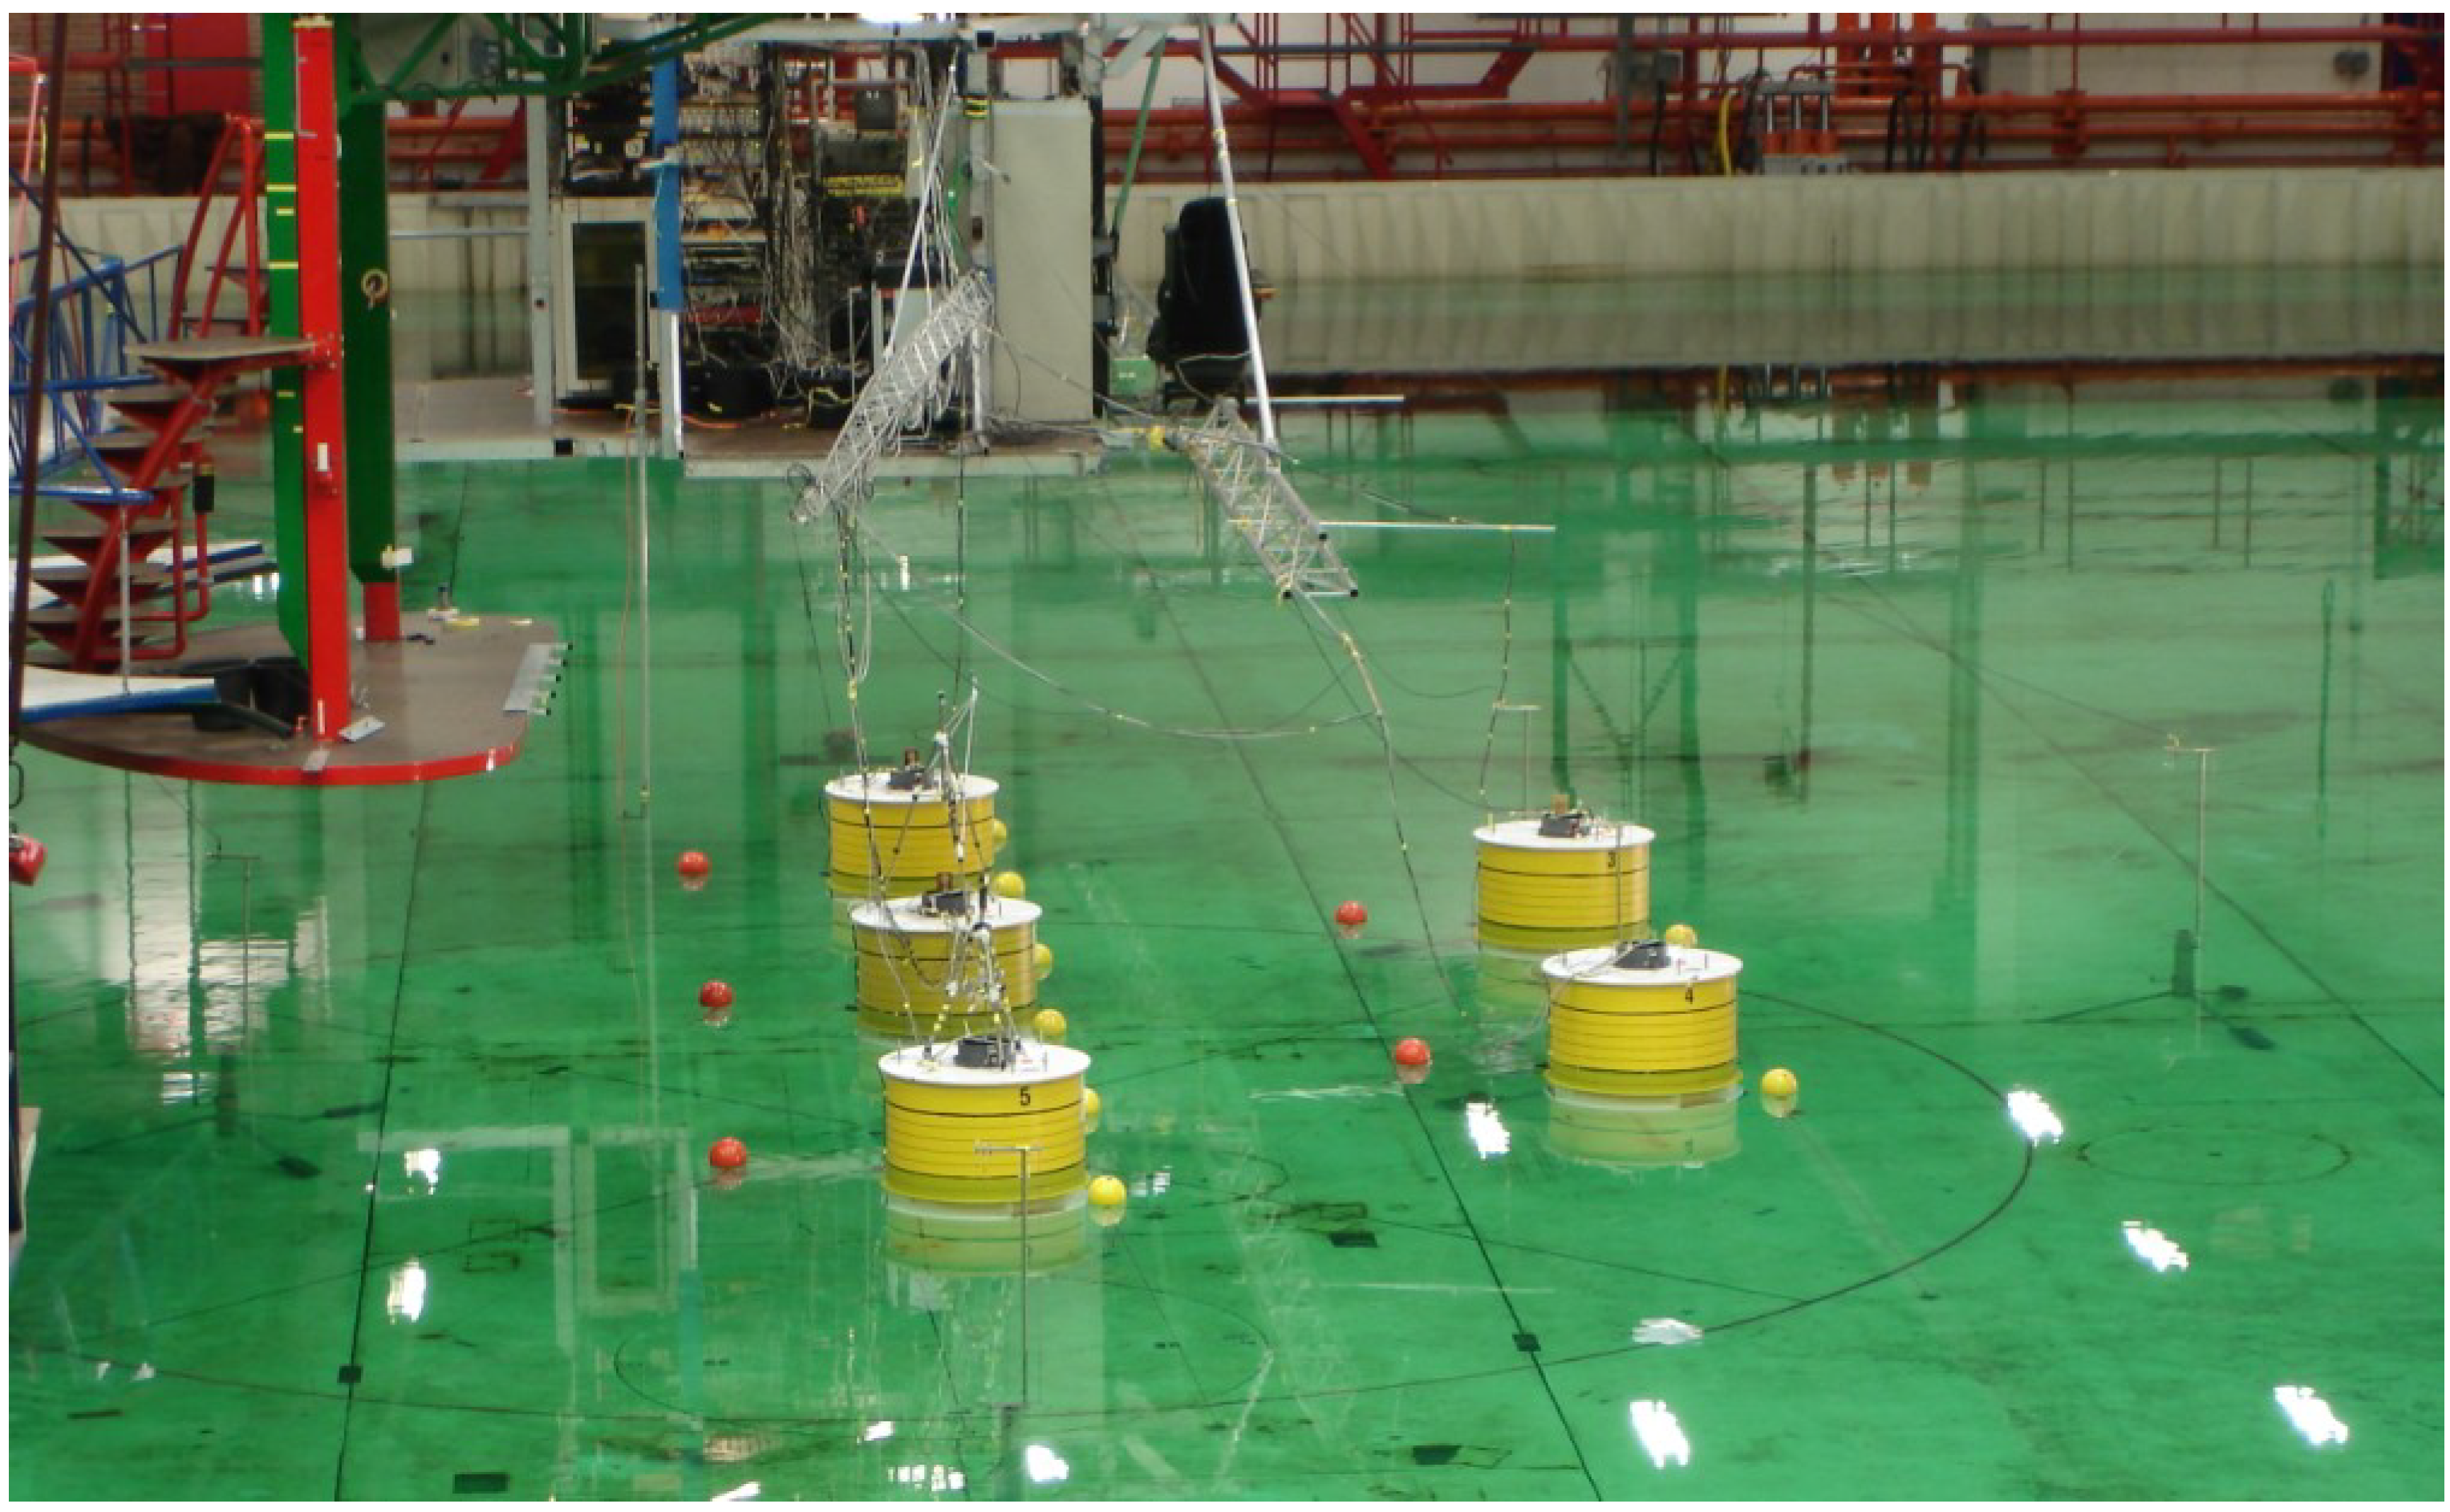
2.1. Ocean Basin NTNU

The NTNU Ocean Basin, Trondheim, Norway has lateral dimensions of 80 m by 50 m and a total depth of 10 m (variable). The basin has 144 flap generators on the 80 m side and a double-flap generator on the 50 m side. The 80 m long multi-flap generators were used in these experiments and current was generated across the basin parallel to these flaps. Two sides of the basin have fixed beaches. The floor of the basin was set at 2.8 m below the free surface for all tests to correspond to the depth in the 12 m by11 m basin at Heriot-Watt University which had been used for preliminary tests on the device dynamics prior to the Trondheim campaign.

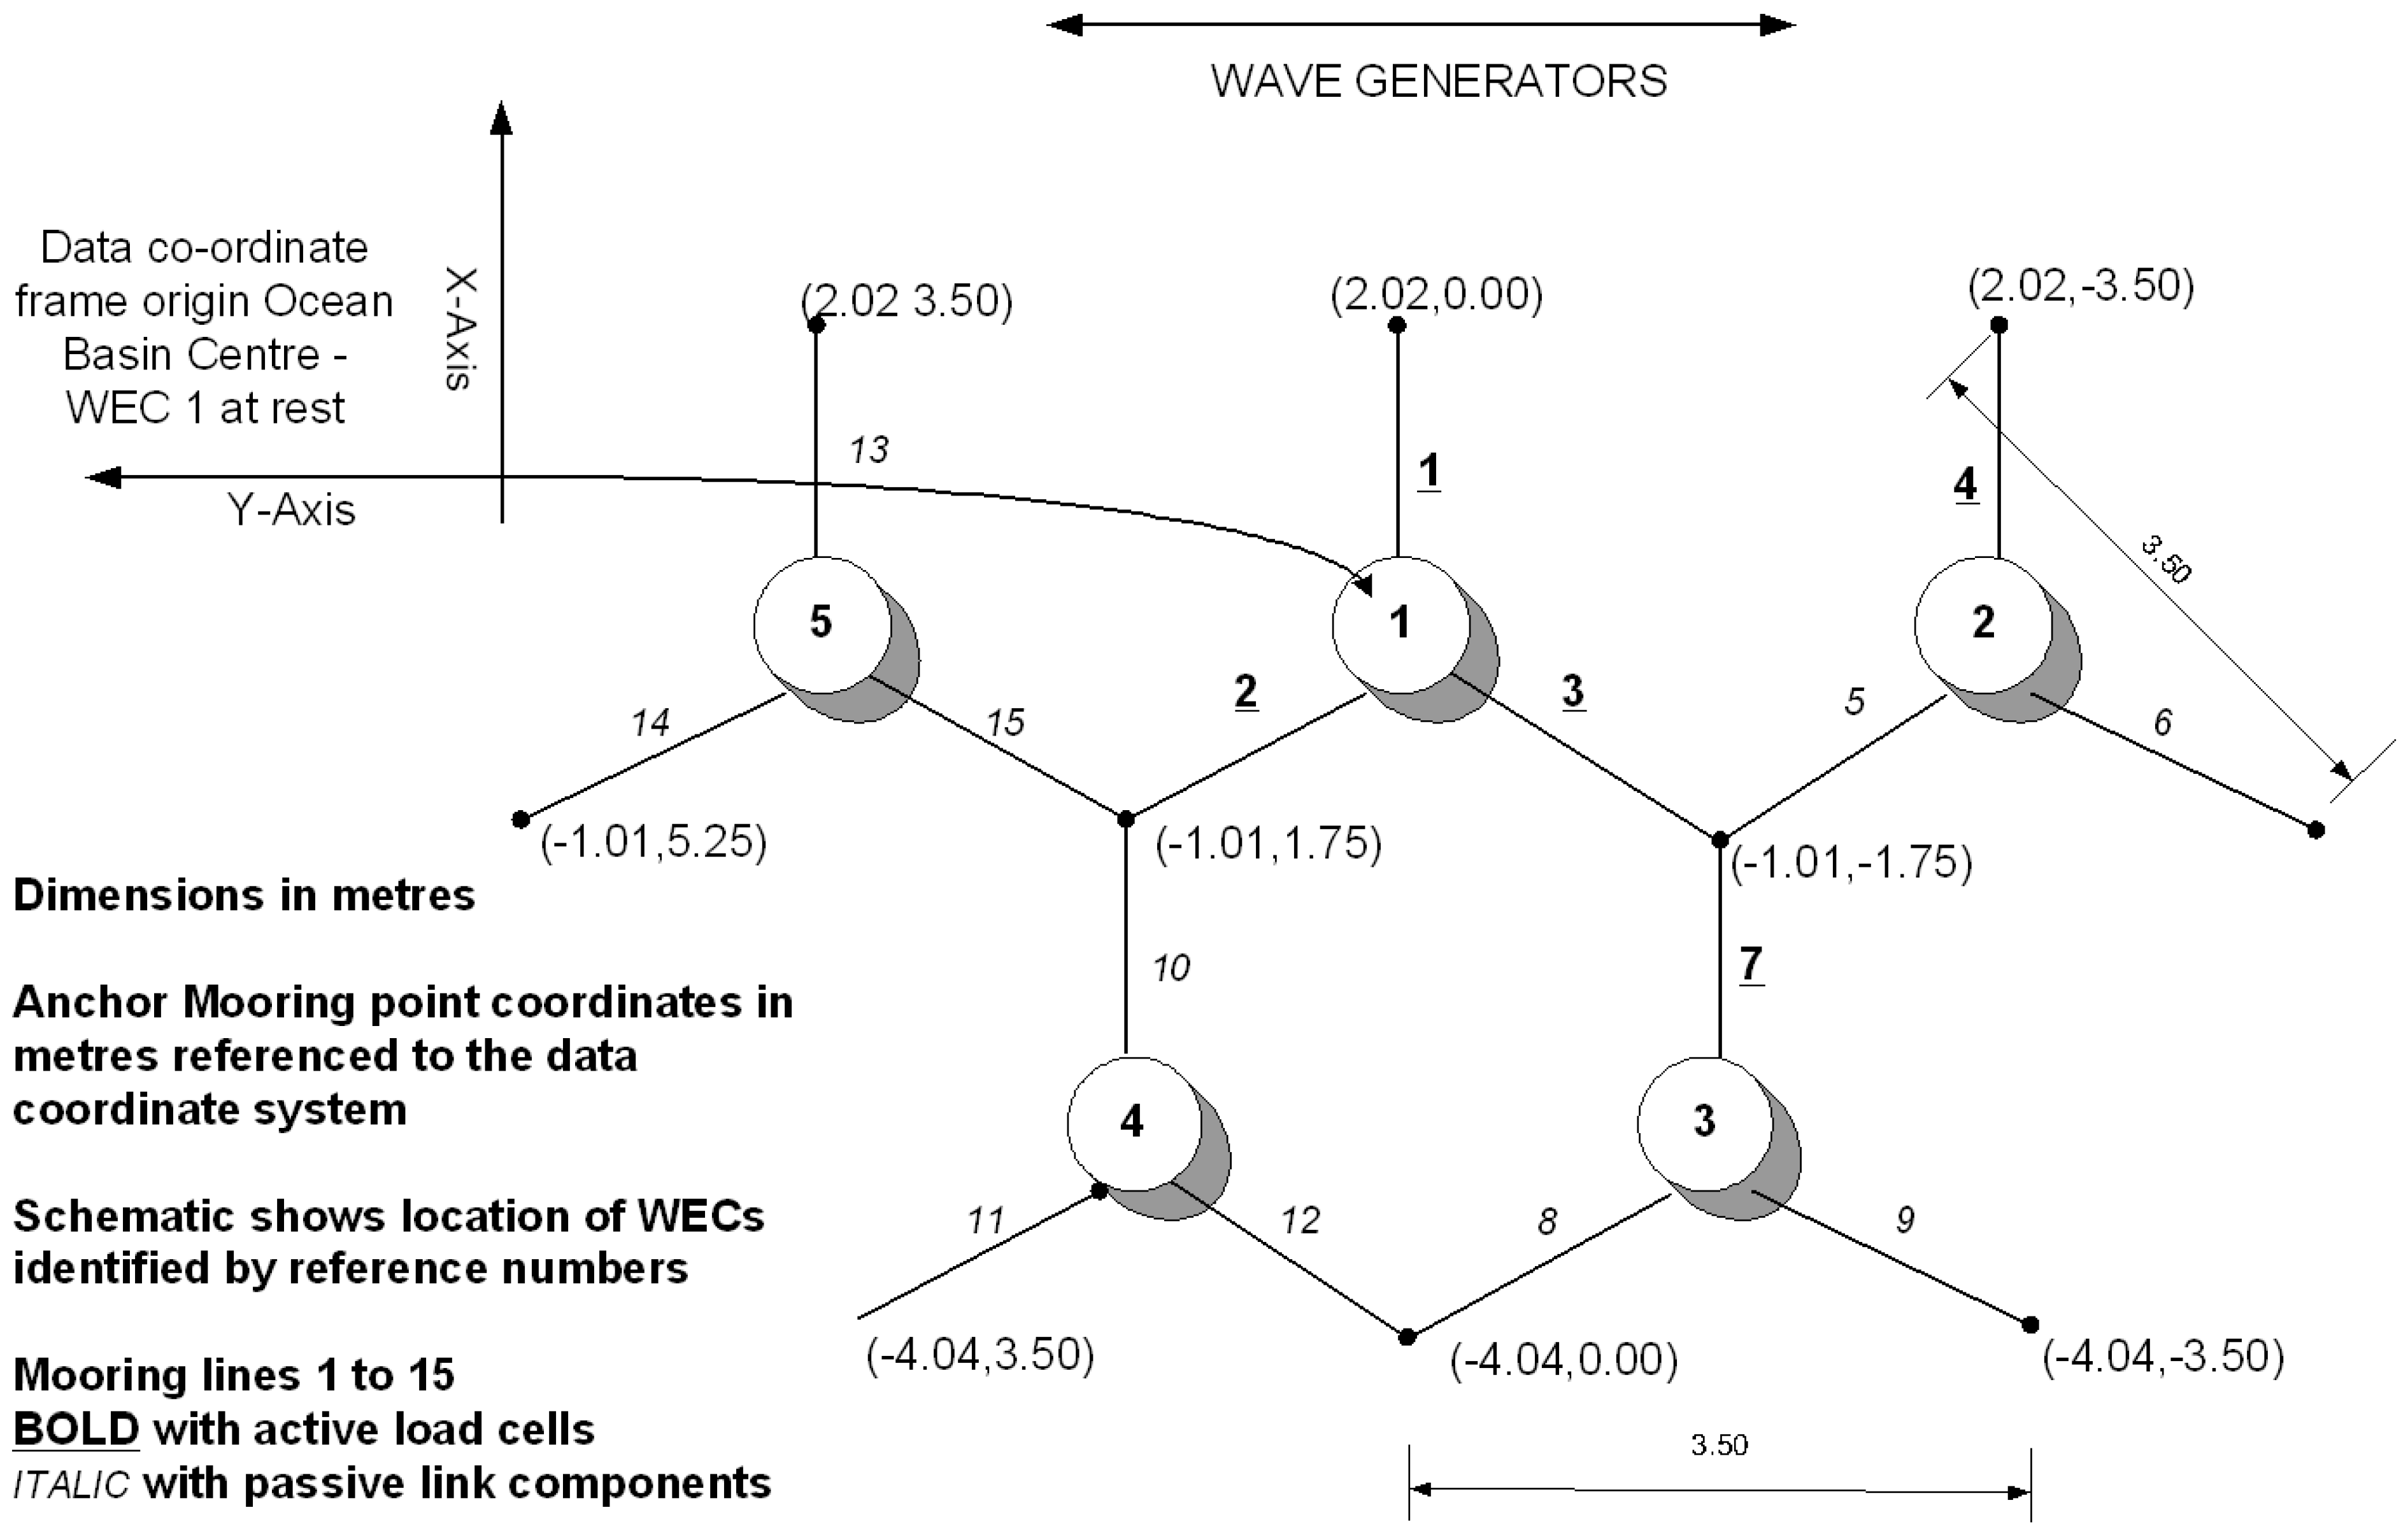
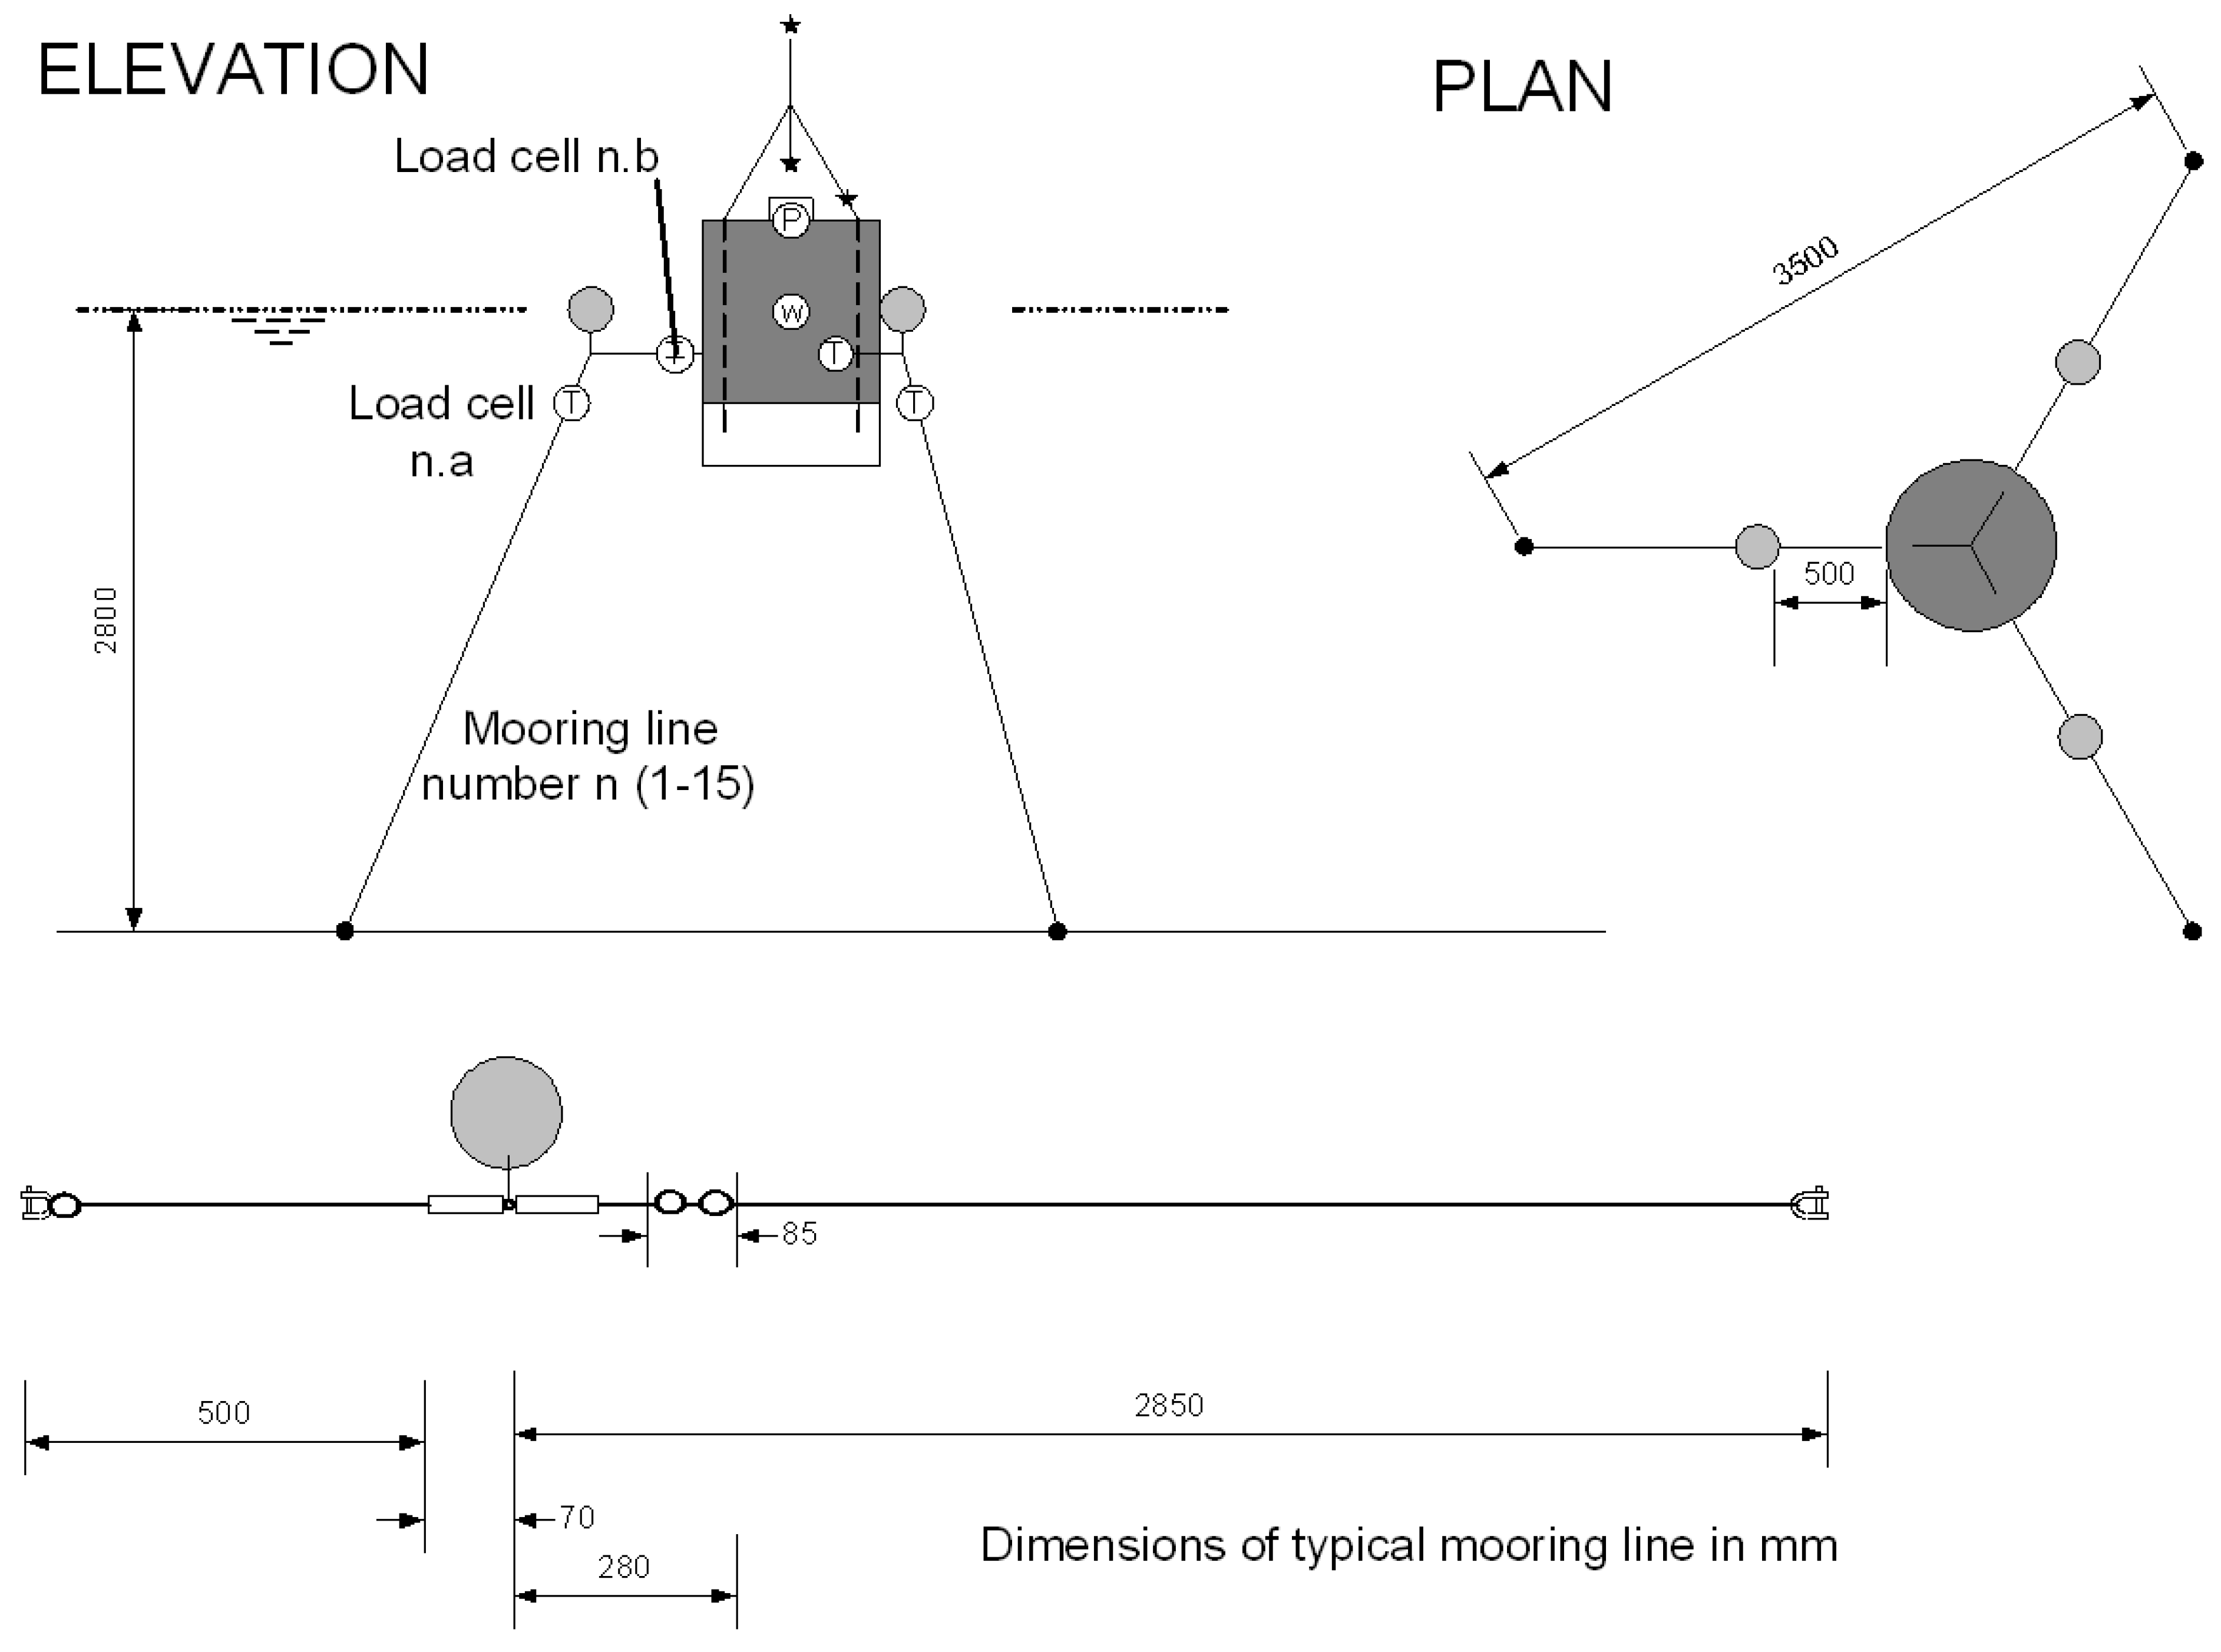
2.2. Wave Energy Converters and Mooring Layout

The wave energy devices tested were generic oscillating water column devices each fitted with an adjustable damping orifice plate (Figure 1). Each WEC model has a displacement weight of 850 N. Mooring points were welded to the floor of the basin on the grid shown in Figure 2. The co-ordinates are shown relative to the data frame which has its origin at the centre of the basin (nominal centre of WEC1 at rest). The mooring system is shown in Figure 3.
Figure 1. Wave Energy Converter Model (WEC) showing principal dimensions.
Jmse 02 00326 g001
Figure 2. Layout of mooring points showing WEC and mooring line numbers.
Jmse 02 00326 g002
Figure 3. Arrangement and dimensions of mooring lines.
Jmse 02 00326 g003

2.3. Overview of the Experiments and Instrumentation

Five sets of experiments were conducted as follows (in chronological order):
-
Basin calibration
-
Tests on WEC 1 in regular and irregular waves and current
-
Tests on WECs 12345 in regular and irregular waves and current
-
Tests on WECs 123 in regular and irregular waves and current
-
Tests on damping and mooring stiffness of WEC1
During the experiments the following instruments were deployed to collect measurement data: 6 wave height gauges (WHM1 to WHM6); 5 internal water level gauges (average internal water level relative to WEC); 5 internal air pressure transducers (gauge pressure); 2 current velocity meters sensing y velocity component; 10 mooring line proving ring tension gauges; 5 mooring-line angle sensors in leading mooring lines (unfortunately the signals were clipped at very large-amplitude pitch excursions); 5 heave accelerometers; 5 pitch accelerometers; 1 optical body motion tracker with active targets on WEC1; 1 under water video camera viewing along x axis in positive direction; 2 video cameras viewing along x and y axes in positive directions. Two mooring line load cells numbered n.a and n.b were located on each of lines n = 1, 2, 3, 4 and 7 in the positions shown in Figure 3. The five WEC array is shown in Figure 4.
Figure 4. Five WEC array viewed along the Y axis towards the origin.
Jmse 02 00326 g004
During the tests, data were acquired synchronously using the Marintek CATMAN data acquisition system, filtered, scaled and output at 80 Hz real-time (corresponding to 17.8889Hz at full scale). The experiments were conducted according to Froude scaling laws at 1:20 scale. Results reported here are at full scale.

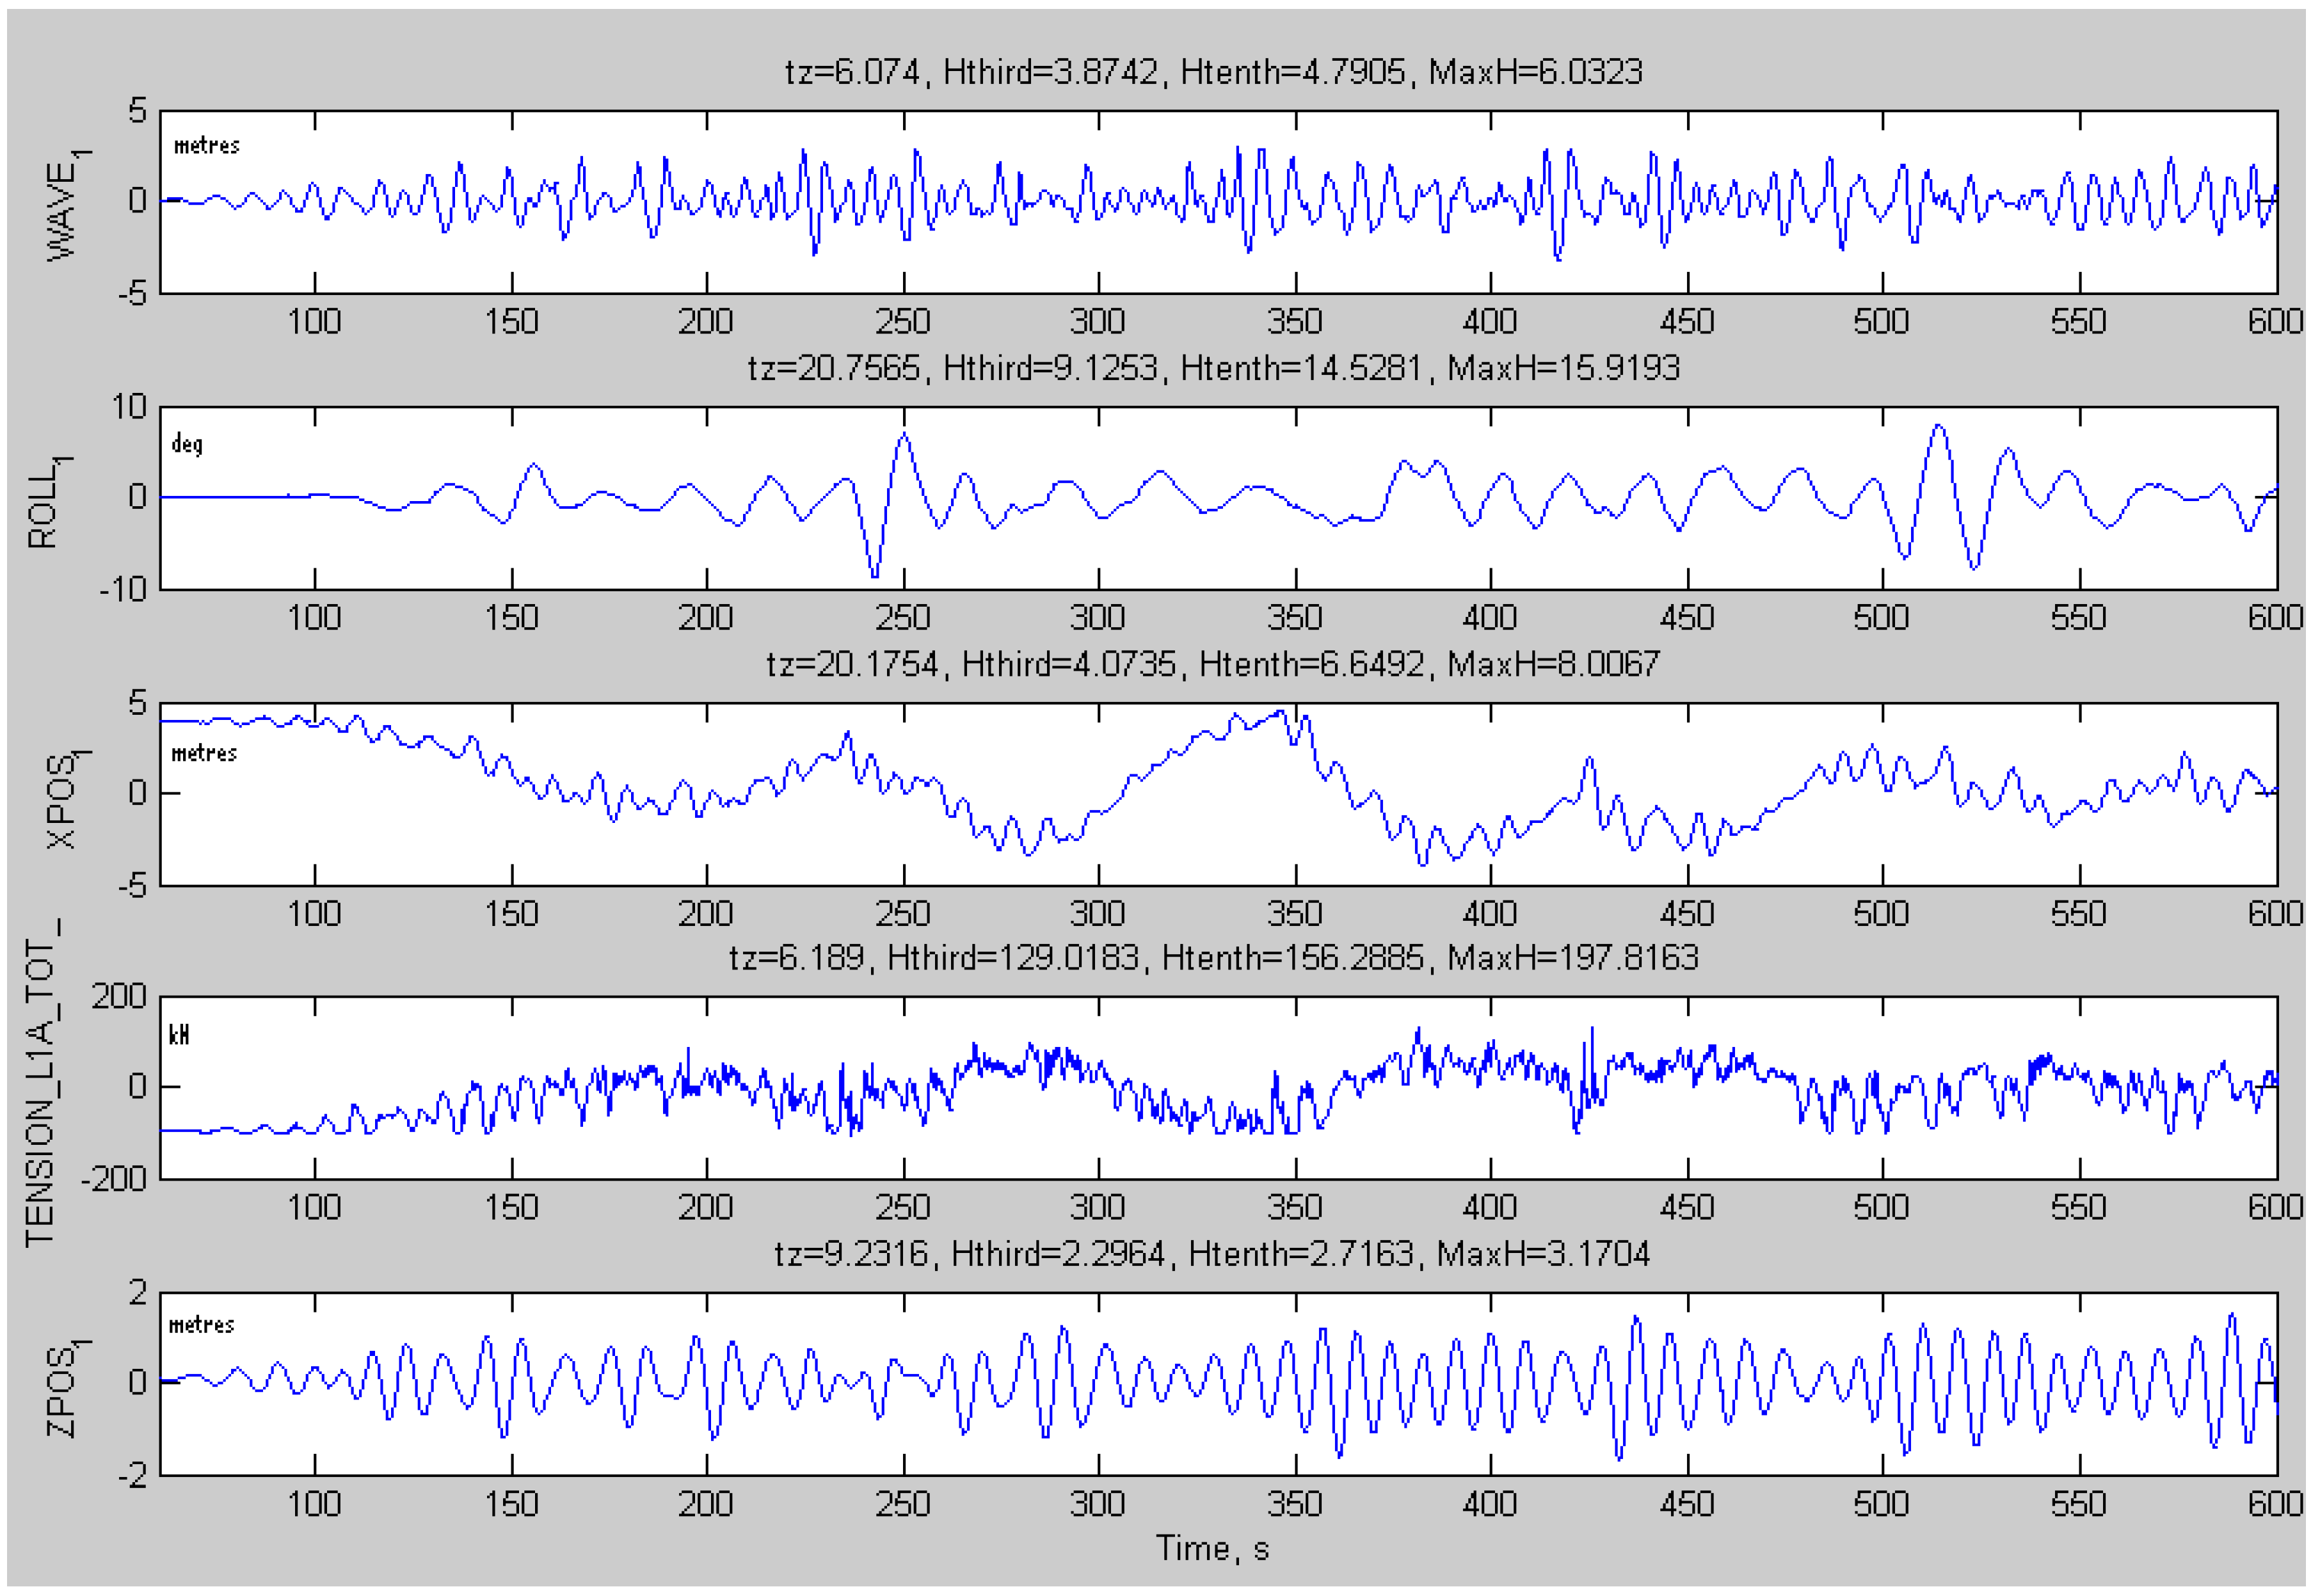
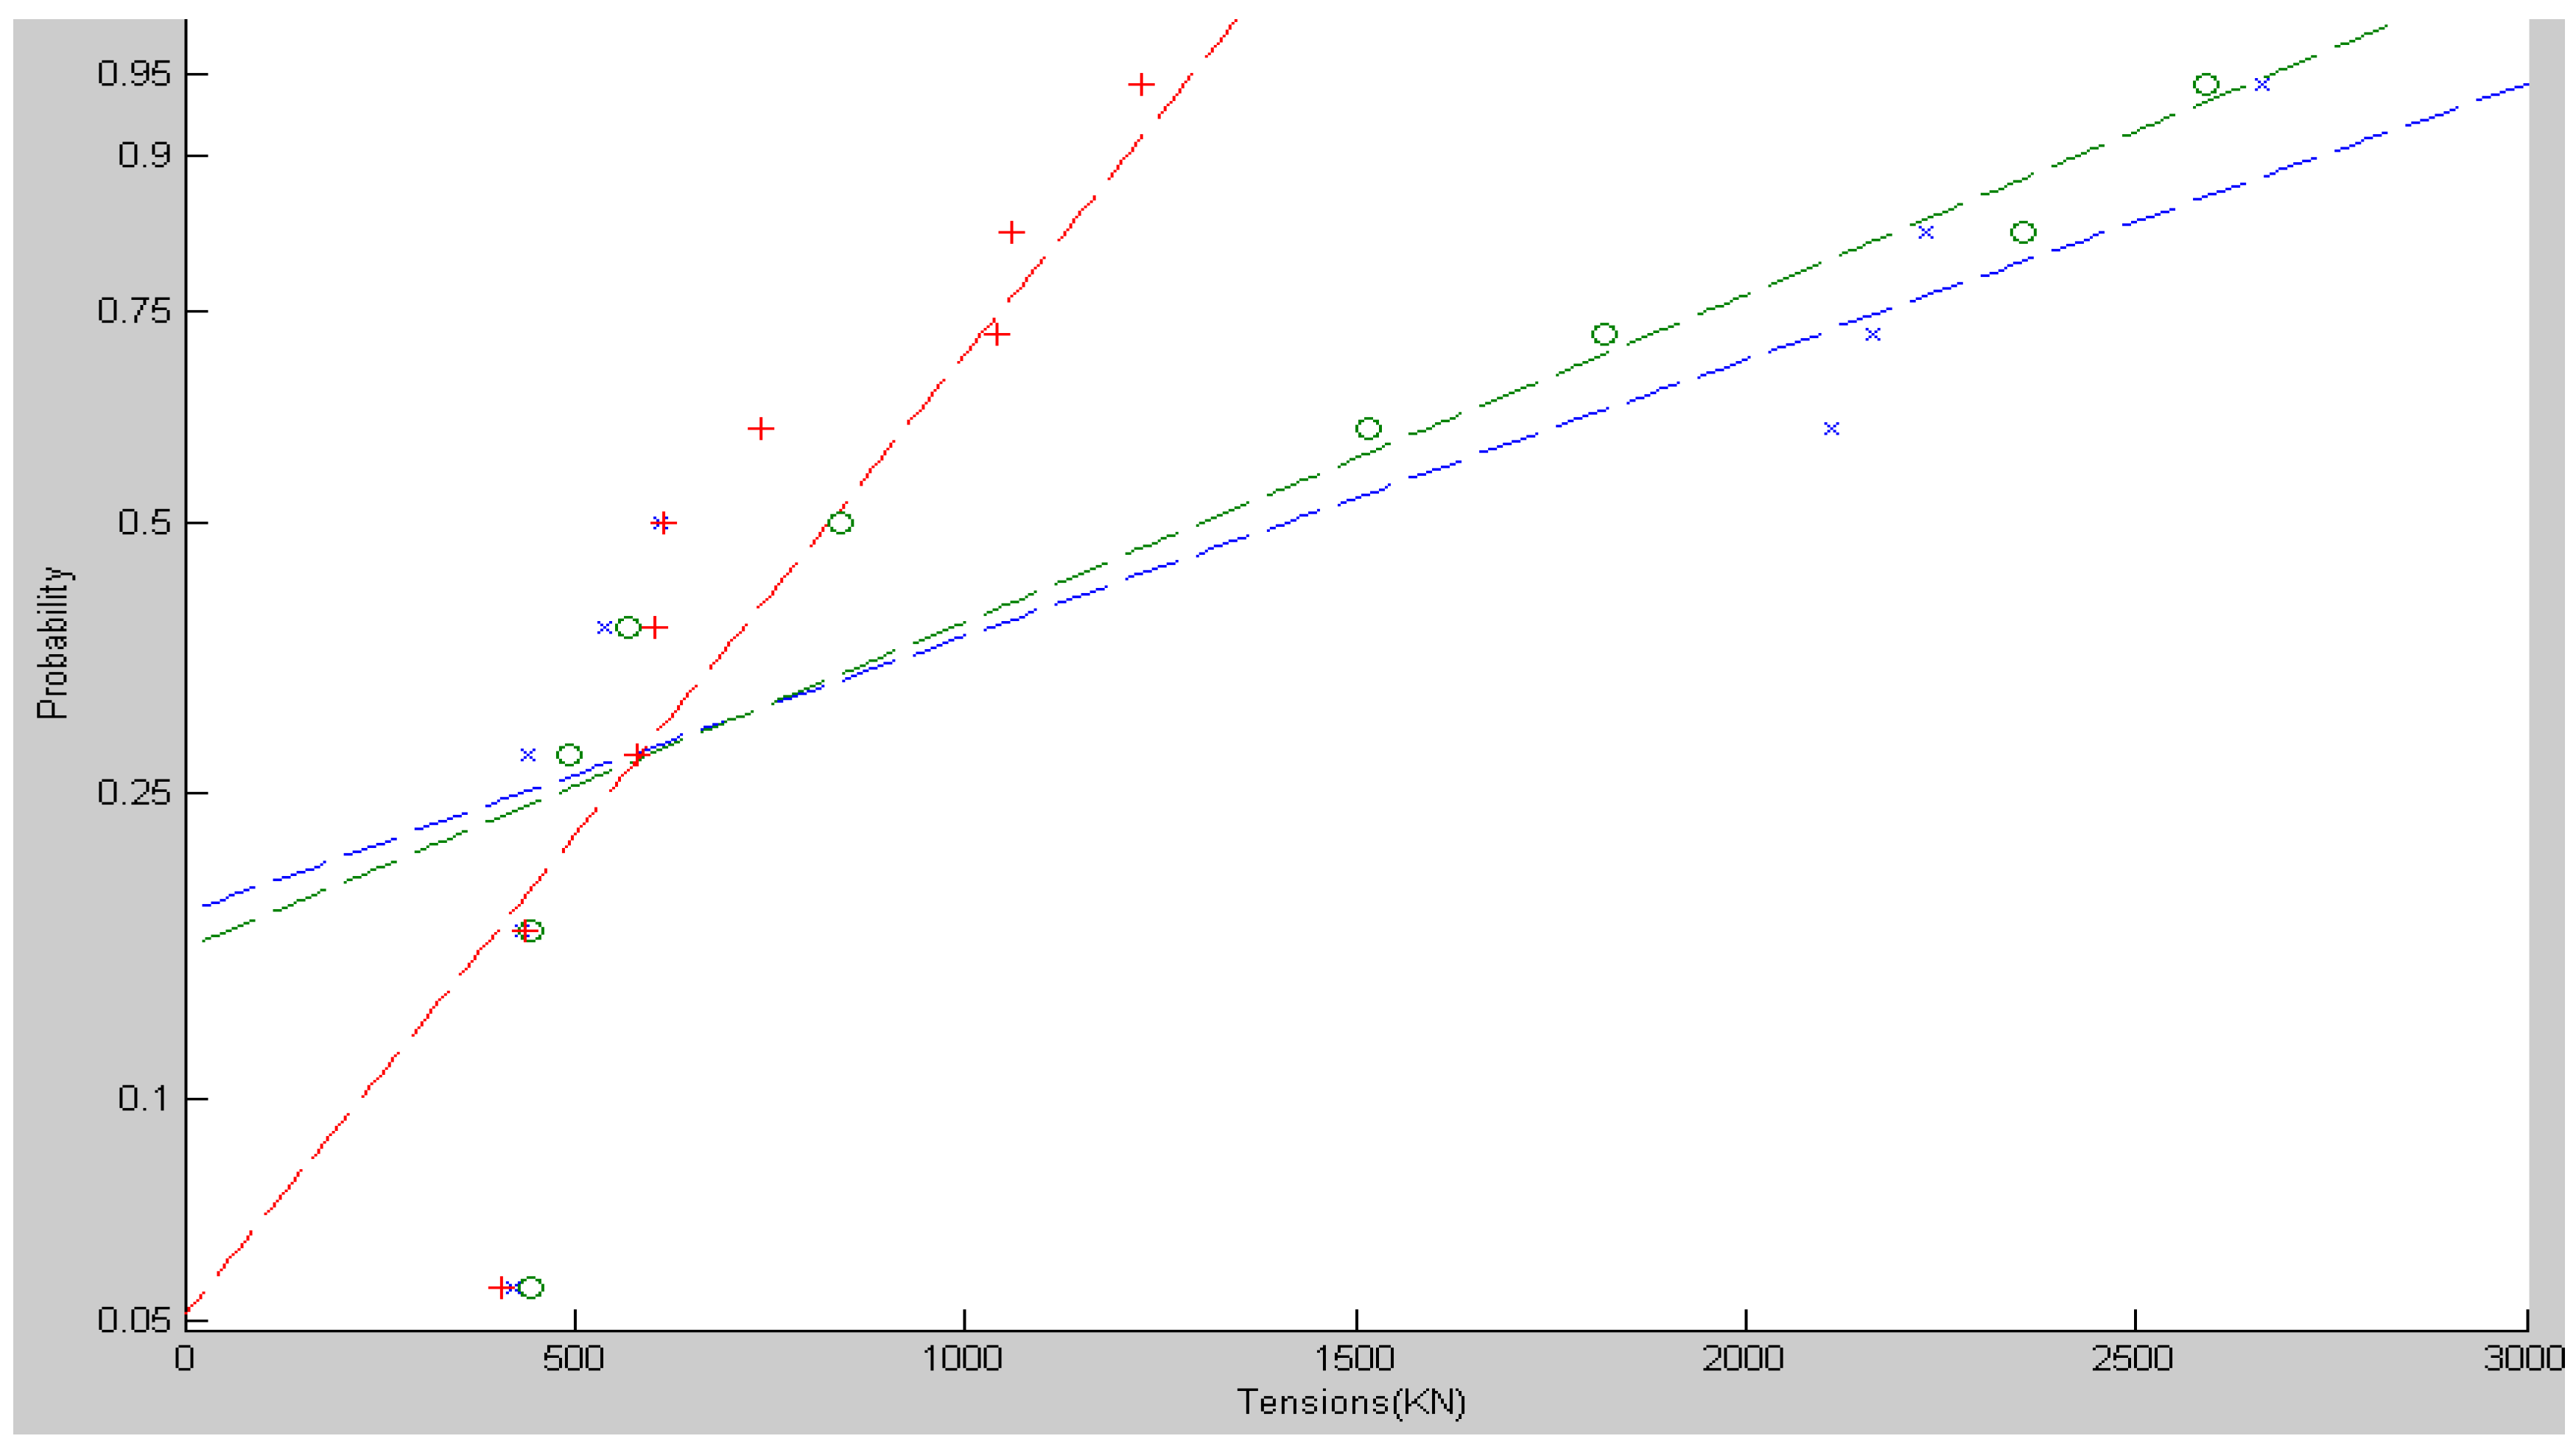
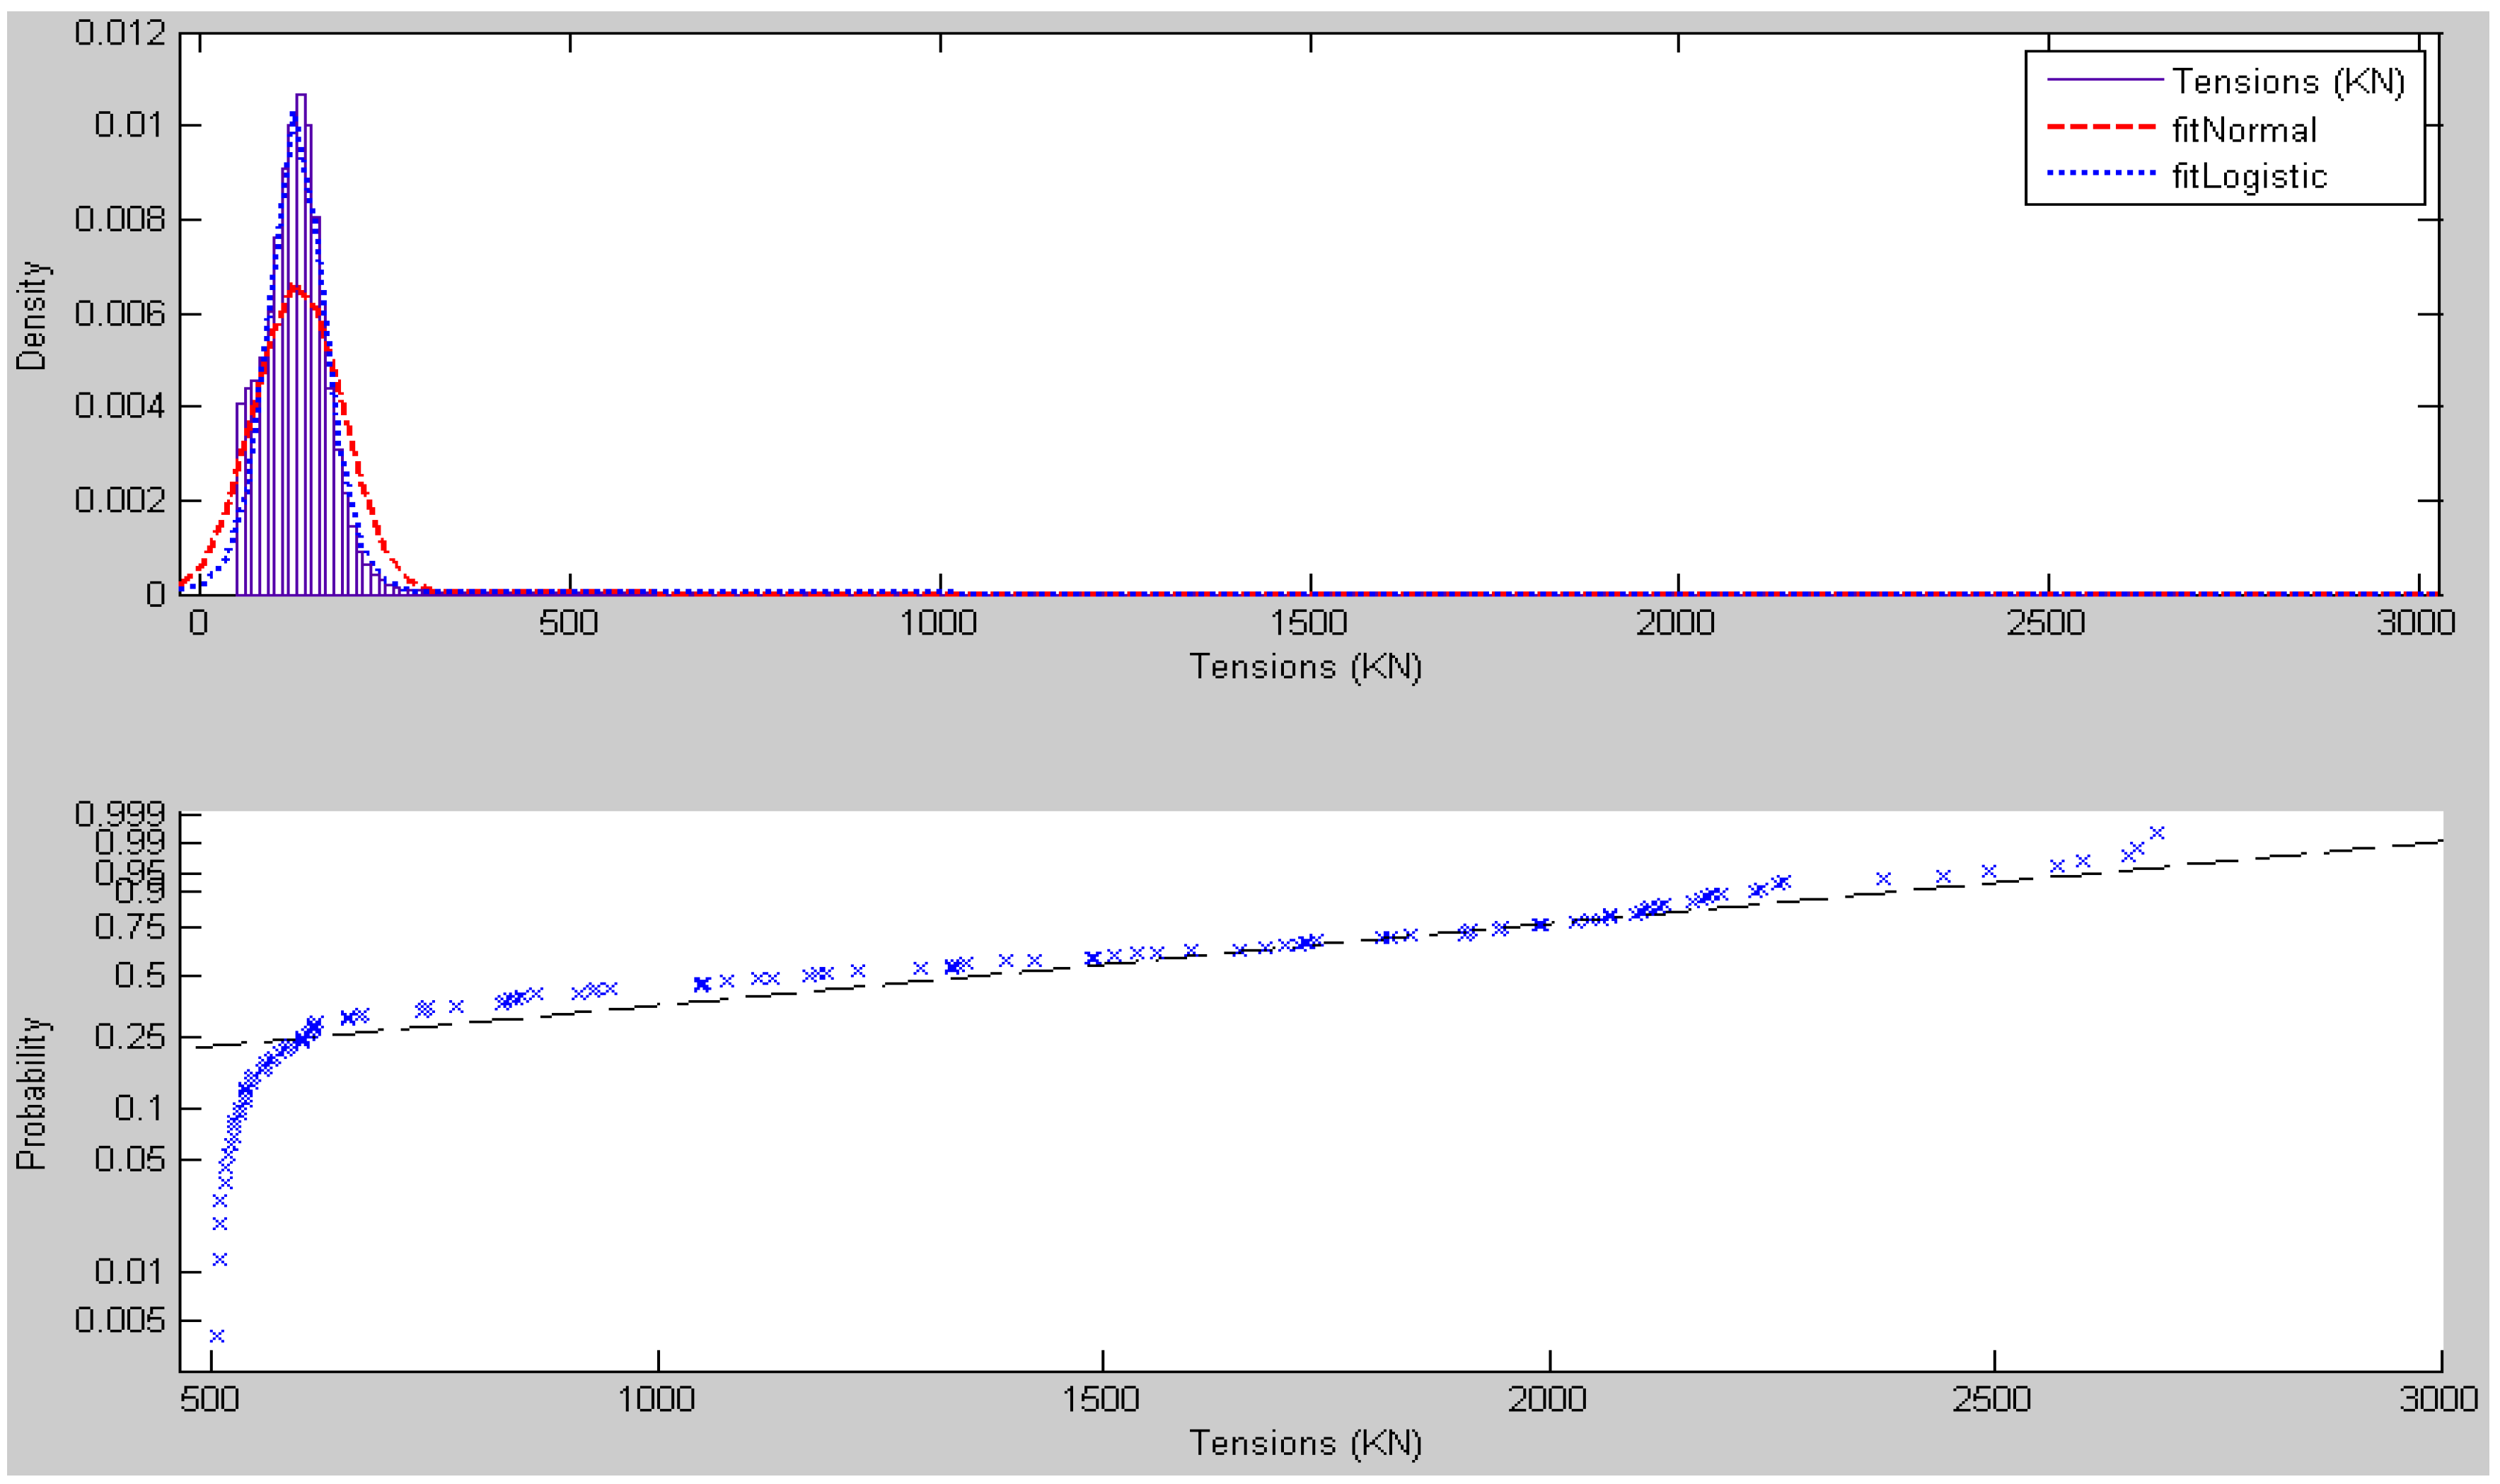
3. Results and Discussion

Figure 5 shows an example of results showing the incident wave and motions of WEC1 in a 5-WEC array in a short-crested sea. It can be clearly seen that the wave motion induces a complex motion dynamics of the device, consisting of both wave-frequency and low-frequency components approximating to the natural frequency of mooring system. This interplay is particularly apparent in the surge (XPOS) motion, and in the loads in the leading mooring line. Complex effects involving low-frequency motions are known to be a matter of concern for commercial mooring installations [6].
Figure 5. Example results for WEC1 in short-crested seas (test 7020).
Jmse 02 00326 g005
The majority of loads on the mooring lines appeared to be broadly consistent with the logistic distribution, whilst the right tail appeared to conform to the extreme value distribution (see Figure 6 and Figure 7). Comparison of the loads at different configurations of WEC arrays suggests that the results are broadly consistent with the hypothesis that the mooring loads should differ. In particular, the results from the tests in short crested sea conditions indicate that peak loads in a multi WEC array may be considerably higher than in a single WEC configuration (Figure 7) but may be less frequent. It can be clearly seen (Figure 6) that the trend line fitted to the data from a single WEC installations has the steepest slope (and consequently lower values for extreme loads) of all the configurations tested, whilst the 5 WEC configuration is characterized by the smallest slope of the trend line, and consequently higher values for extreme loads.
Figure 6. An example of distributional fits to the mooring loads (test 7020). Upper panel: all data except pretension values (Tensions ≥ 50 KN) with fitted Normal and Logistic distributions. Lower panel: extreme value distribution showing a reasonable fit to the tail (Tensions ≥ 500 KN).
Jmse 02 00326 g006
Figure 7. Comparison of extreme peak mooring tensions induced at different WEC array configurations in short crested seas. Data < 400 KN were excluded from this analysis. Crosses and Blue Line: 5 WEC array (test 7020); Circles and Green Line: 3 WEC array (test 5020); Pluses and Red Line: single WEC installation (test 3030).
Jmse 02 00326 g007
The radiation pattern of an array of WECs may provide useful insight into the array’s hydrodynamics [7]. It is reasonable to expect that the characteristics of WEC motions will depend on the number of WECs deployed in an array, as well as their positioning. Ashton et al. have demonstrated that in the Trondheim experiments power capture of WEC1 was considerably enhanced in a 5-WEC array compared to a single WEC deployment [8]. This effect was explained as additional capturing of the incident wave’s energy, with its consequent release by radiative damping. The results presented here appear to be consistent with these findings, and show the corresponding increase in the mooring forces. This effect might be indicative of non-linear interaction between the WECs and the incident wave field.
The importance of mooring line dynamics for WECs has been addressed previously [5]. It was shown in SuperGen Marine 1 that soft moorings can be subject to “line-stretching” and “top-end” dynamics that can lead to significant dynamic loadings, increasing the probability of direct or longer term fatigue failure of mooring components. Additionally the negative effect of dynamic loads on the conversion efficiency of a floating device was described. Considering the above, potential increases in mooring loads in a multi WEC array should be considered when designing any moored wave energy installations. Analysis of the Trondheim dataset by Ashton et al. (2009) indicated that close-packed arrays of energy converters may be more efficient in energy capture than the same number of similar devices [8]. However, the results presented here indicate that higher energy efficiency may be accompanied by increased mooring loads. Studies of Vickers and Johanning (2009), and Krivtsov et al. (2012) are also relevant in that respect [9,10].
It should be noted that investigations of mooring loads in renewable energy devices are important not only in relation to the issues of reliability and power take off [11], but also in terms of minimizing the adverse effects of mooring lines on bottom sediments [12], as well as indirect effects of the eroded particles on a wide range of aquatic processes [13,14,15,16]. The results presented here will become particularly relevant in the future, as more wave energy devices are deployed at sea in open water conditions [17].

4. Conclusions

The experiments reported here have shown that the testing of mooring systems for WEC arrays should include short-crested seas so that the hydrodynamic interaction between the devices can be quantified. The extreme peak mooring loads in the leading mooring line were approximately doubled in similar environmental conditions in comparison to those in a single device. The results have implications for further studies related to the durability, design and installation of moored renewable energy devices, as well as the assessment of their ecological impact and environmental impact assessment.
The experiments presented here provided valuable information on a number of important issues. The data gathered during the experiments contributed to the objectives of four workstreams of Phase 2 of the UK SuperGen Marine Energy Research Consortium Project which had the aim of increasing knowledge and understanding of the device-sea interactions of energy converters from model-scale in the laboratory to full size in the open sea. The test campaign has contributed essential data to the development of Simulink™ and Orcaflex™ models of devices, which include mooring system interactions, and data have also been obtained for inter-tank comparisons, studies of scale effects and validation of mooring system numerical models. It is hoped that this paper will draw the attention of a wider scientific community to the data set freely available from the Marintek website.

Acknowledgements

Access to the Trondheim facility was supported by the European Community’s Sixth Framework Programme through the grant to the budget of the Integrated Infrastructure Initiative HYDRALAB III within the Transnational Access Activities, Contract no. 022441. The team was assisted by A Neyts, Department of Biological Sciences NTNU and Csaba Pákozdi, project manager for Marintek. The SuperGen Marine II consortium is supported by the UK Engineering and Physical Sciences Research Council under grant EP/E040136/1.

Author Contributions

B.T.L devised and planned the test programme in the NTNU Trondheim Ocean Basin. V.K. and B.T.L. carried out the experiments and analysed the data with the assistance of the NTNU staff together with members of the SuperGen II Consortium from the Universities of Edinburgh, Belfast and Exeter.

Conflicts of Interest

The authors declare no conflict of interest.

References

  1. Kim, Y.C. Assessment of California’s ocean wave energy recovery. In California and the World Ocean ’97: Ocean Resources: An Agenda for the Future; Magoon, O.T., Converse, H., Baird, B., Miller-Henson, M., Eds.; American Society of Civil Engineers: Reston, VA, USA, 1998; pp. 175–182. [Google Scholar]
  2. Fitzgerald, J.; Bergdahl, L. Including moorings in the assessment of a generic offshore wave energy converter: A frequency domain approach. Mar. Struct. 2008, 21, 23–46. [Google Scholar] [CrossRef]
  3. Johanning, L.; Smith, G.H.; Wolfram, J. Measurements of static and dynamic mooring line damping and their importance for floating WEC devices. Ocean Eng. 2007, 34, 1918–1934. [Google Scholar] [CrossRef]
  4. Johanning, L.; Smith, G.H.; Wolfram, J. Interaction between Mooring Line Damping and Response Frequency as a Result of Stiffness Alteration in Surge. In Proceedings of the 25th International Conference on Offshore Mechanics and Arctic Engineering, Hamburg, Germany, 4–9 June 2006; pp. 403–412.
  5. Johanning, L.; Smith, G.H.; Bullen, C. Large Scale Mooring Line Experiments and Comparison with a Fully Dynamic Simulation Program with IMPORTANCe to WEC Installation. In Proceedings of the Seventeenth (2007) International Offshore and Polar Engineering Conference, Lisbon, Portugal, 1–6 July 2007; pp. 455–462.
  6. Grant, R.; Holboke, M. Shallow Water Effects on Low-Frequency Wave Excitation of Moored Ships. In Proceedings of Offshore Technology Conference, Houston, TX, USA, 3–6 May 2004.
  7. Folley, M.; Whittaker, T.J.T. The effect of sub-optimal control and the spectral wave climate on the performance of wave energy converter arrays. Appl. Ocean Res. 2009, 31, 260–266. [Google Scholar] [CrossRef]
  8. Ashton, I.; Johanning, L.; Linfoot, B. Measurement of the Effect of Power Absorption in the Lee of a Wave Energy Converter. In Proceedings of the 28th International Conference on Ocean, Offshore and Arctic Engineering, Honolulu, HI, USA, 31 May–5 June 2009.
  9. Vickers, A.; Johanning, L. Comparison of Damping Properties for Three Different Mooring Arrangements. In Proceedings of the 8th European Wave and Tidal Energy Conference, Uppsala, Sweden, 7–10 September 2009.
  10. Krivtsov, V.; Linfoot, B.T.; Harris, R.E. Investigation of the effects of mooring line surface buoys on the extreme mooring loads of wave energy converters. In Proceedings of the 4th International Conference on Marine Research for Environmental Sustainability, ENSUS2011, Newcastle, UK, 12–14 September 2011.
  11. Krivtsov, V.; Bryden, I.; Linfoot, B.T.; Wallace, R. Measurements of WEC Motions and Mooring Loads. In Proceedings of the 4th International Conference on Ocean Energy, Dublin, Ireland, 17–19 October 2012.
  12. Krivtsov, V.; Linfoot, B.T. Modelling of Disruption to Benthic Habitats and Overall Ecosystem Functioning by Marine Renewable Energy Installations. In Proceedings of the 16th European Conference on Eye Movements, Marseille, France, 20–24 August 2011; pp. 121–124.
  13. Krivtsov, V.; Howarth, M.J.; Jones, S.E. Characterising observed patterns of suspended particulate matter and relationships with oceanographic and meteorological variables: Studies in Liverpool Bay. Environ. Model. Softw. 2009, 24, 677–685. [Google Scholar] [CrossRef]
  14. Krivtsov, V.; Howarth, M.J.; Jones, S.E.; Souza, A.J.; Jago, C.F. Monitoring and modelling of the Irish Sea and Liverpool Bay: An overview and an SPM case study. Ecol. Model. 2008, 212, 37–52. [Google Scholar] [CrossRef]
  15. Krivtsov, V.; Mikkelsen, O.; Jones, S. Entropy analysis of SPM patterns: case study of Liverpool Bay. Geo-Mar. Lett. 2012, 32, 195–204. [Google Scholar] [CrossRef]
  16. Krivtsov, V.; Mikkelsen, O.A. Regression Tree Analysis of SPM Entropy Groups: Case Study from the Irish Sea. Univers. J. Geosci. 2014, 2, 109–115. [Google Scholar]
  17. Krivtsov, V.; Bryden, I.; Linfoot, B.T.; Wallace, R. Sea trials of a wave energy converter in Strangford Lough, Northern Ireland. J. Shipp. Ocean Eng. 2013, 3, 11–20. [Google Scholar]

