Article

On the Optimization of Point Absorber Buoys

Division for Electricity, Uppsala University, Box 534, SE-75121 Uppsala, Sweden
*
Author to whom correspondence should be addressed.
J. Mar. Sci. Eng. 2014, 2(2), 477-492; https://doi.org/10.3390/jmse2020477
Submission received: 15 January 2014 / Revised: 28 March 2014 / Accepted: 28 April 2014 / Published: 26 May 2014
(This article belongs to the Special Issue Marine Energy Systems)

Abstract

:
A point absorbing wave energy converter (WEC) is a complicated dynamical system. A semi-submerged buoy drives a power take-off device (PTO), which acts as a linear or non-linear damper of the WEC system. The buoy motion depends on the buoy geometry and dimensions, the mass of the moving parts of the system and on the damping force from the generator. The electromagnetic damping in the generator depends on both the generator specifications, the connected load and the buoy velocity. In this paper a velocity ratio has been used to study how the geometric parameters buoy draft and radius, assuming constant generator damping coefficient, affects the motion and the energy absorption of a WEC. It have been concluded that an optimal buoy geometry can be identified for a specific generator damping. The simulated WEC performance have been compared with experimental values from two WECs with similar generators but different buoys. Conclusions have been drawn about their behaviour.

1. Introduction

In the Lysekil project a wave energy converter (WEC) concept, developed by Uppsala University, is being tested at the test site offshore Lysekil on the Swedish west coast. The WEC concept consists of a point absorbing buoy floating on the water surface and a linear generator placed on the seabed. The translator inside the generator is directly driven by the buoy. The buoy motion depends on the buoy geometry and dimensions, and on the damping force from the generator, as well as on the weight of the moving parts of the system. The damping force is dependent on translator velocity. The electromagnetic damping in the generator can to some extent be controlled with power electronics during operation, but in this study a constant resistive load is assumed in the simulations and have been used in the experiments. The aim of the study presented in this paper is to investigate how the buoy geometry and dimensions affect the power absorption of the system. The study is restricted to cases with a resistive load connected to the generator. The most accurate method available to analyze the dynamics of this system is to use a computational fluid dynamics (CFD) tool coupled with a generator model which should be applied in the time domain [1]. This is very time consuming and demands high computational power, which does not make it suitable when dealing with large amounts of experimental data. Coupled CFD computations are still necessary for studying events that can not be considered as time harmonic, such as when a slackened buoy line is rapidly stretched or when the translator hits the upper end stop and the buoy is entirely submerged in an extreme wave. But when analyzing the large amount of data that is needed for optimizing a WEC for a wave climate during its full operational time rather than for just one characteristic wave, a different method is needed. A method (developed by Cummins in 1962 [2]) simulates the time-dependent system by integro-differential equations involving hydromechanical parameters that can be obtained from the time-harmonic problem [3]. The time domain problem can also be Fourier transformed and solved for all frequencies using the boundary integral method, and then inverse Fourier transformed back to the time domain [4]. The coupled time dependent system can also be solved numerically, using simulation software such as Simulink [5]. The theoretical absorption of point absorbing buoys connected to WECs is a subject that has been extensively studied [6,7,8,9,10,11,12], however this paper is focusing on the engineering application. The results have been used to analyze two WECs that were operated offshore, and conclusions have been drawn about their behaviour, conclusions that were not visible when they were previously analyzed using capture width ratio (CWR). CWR is derived as the ratio between the power absorbed by the WEC’s generator and the total time average incident wave power that is traveling through the buoy. The incident wave power is assumed to be the wave energy transport per meter wave front multiplied by the buoy diameter [5,13,14]. But the study presented in this paper aims to investigate how the buoy geometry and dimensions affect the power absorption, which then should be expressed as independent of buoy dimensions. In this paper the performance of the WEC is analyzed using the ratio between the average squared vertical velocity of the buoy and the average squared vertical velocity of the water surface. The buoy size is optimized by maximizing this parameter for three constant damping coefficients.

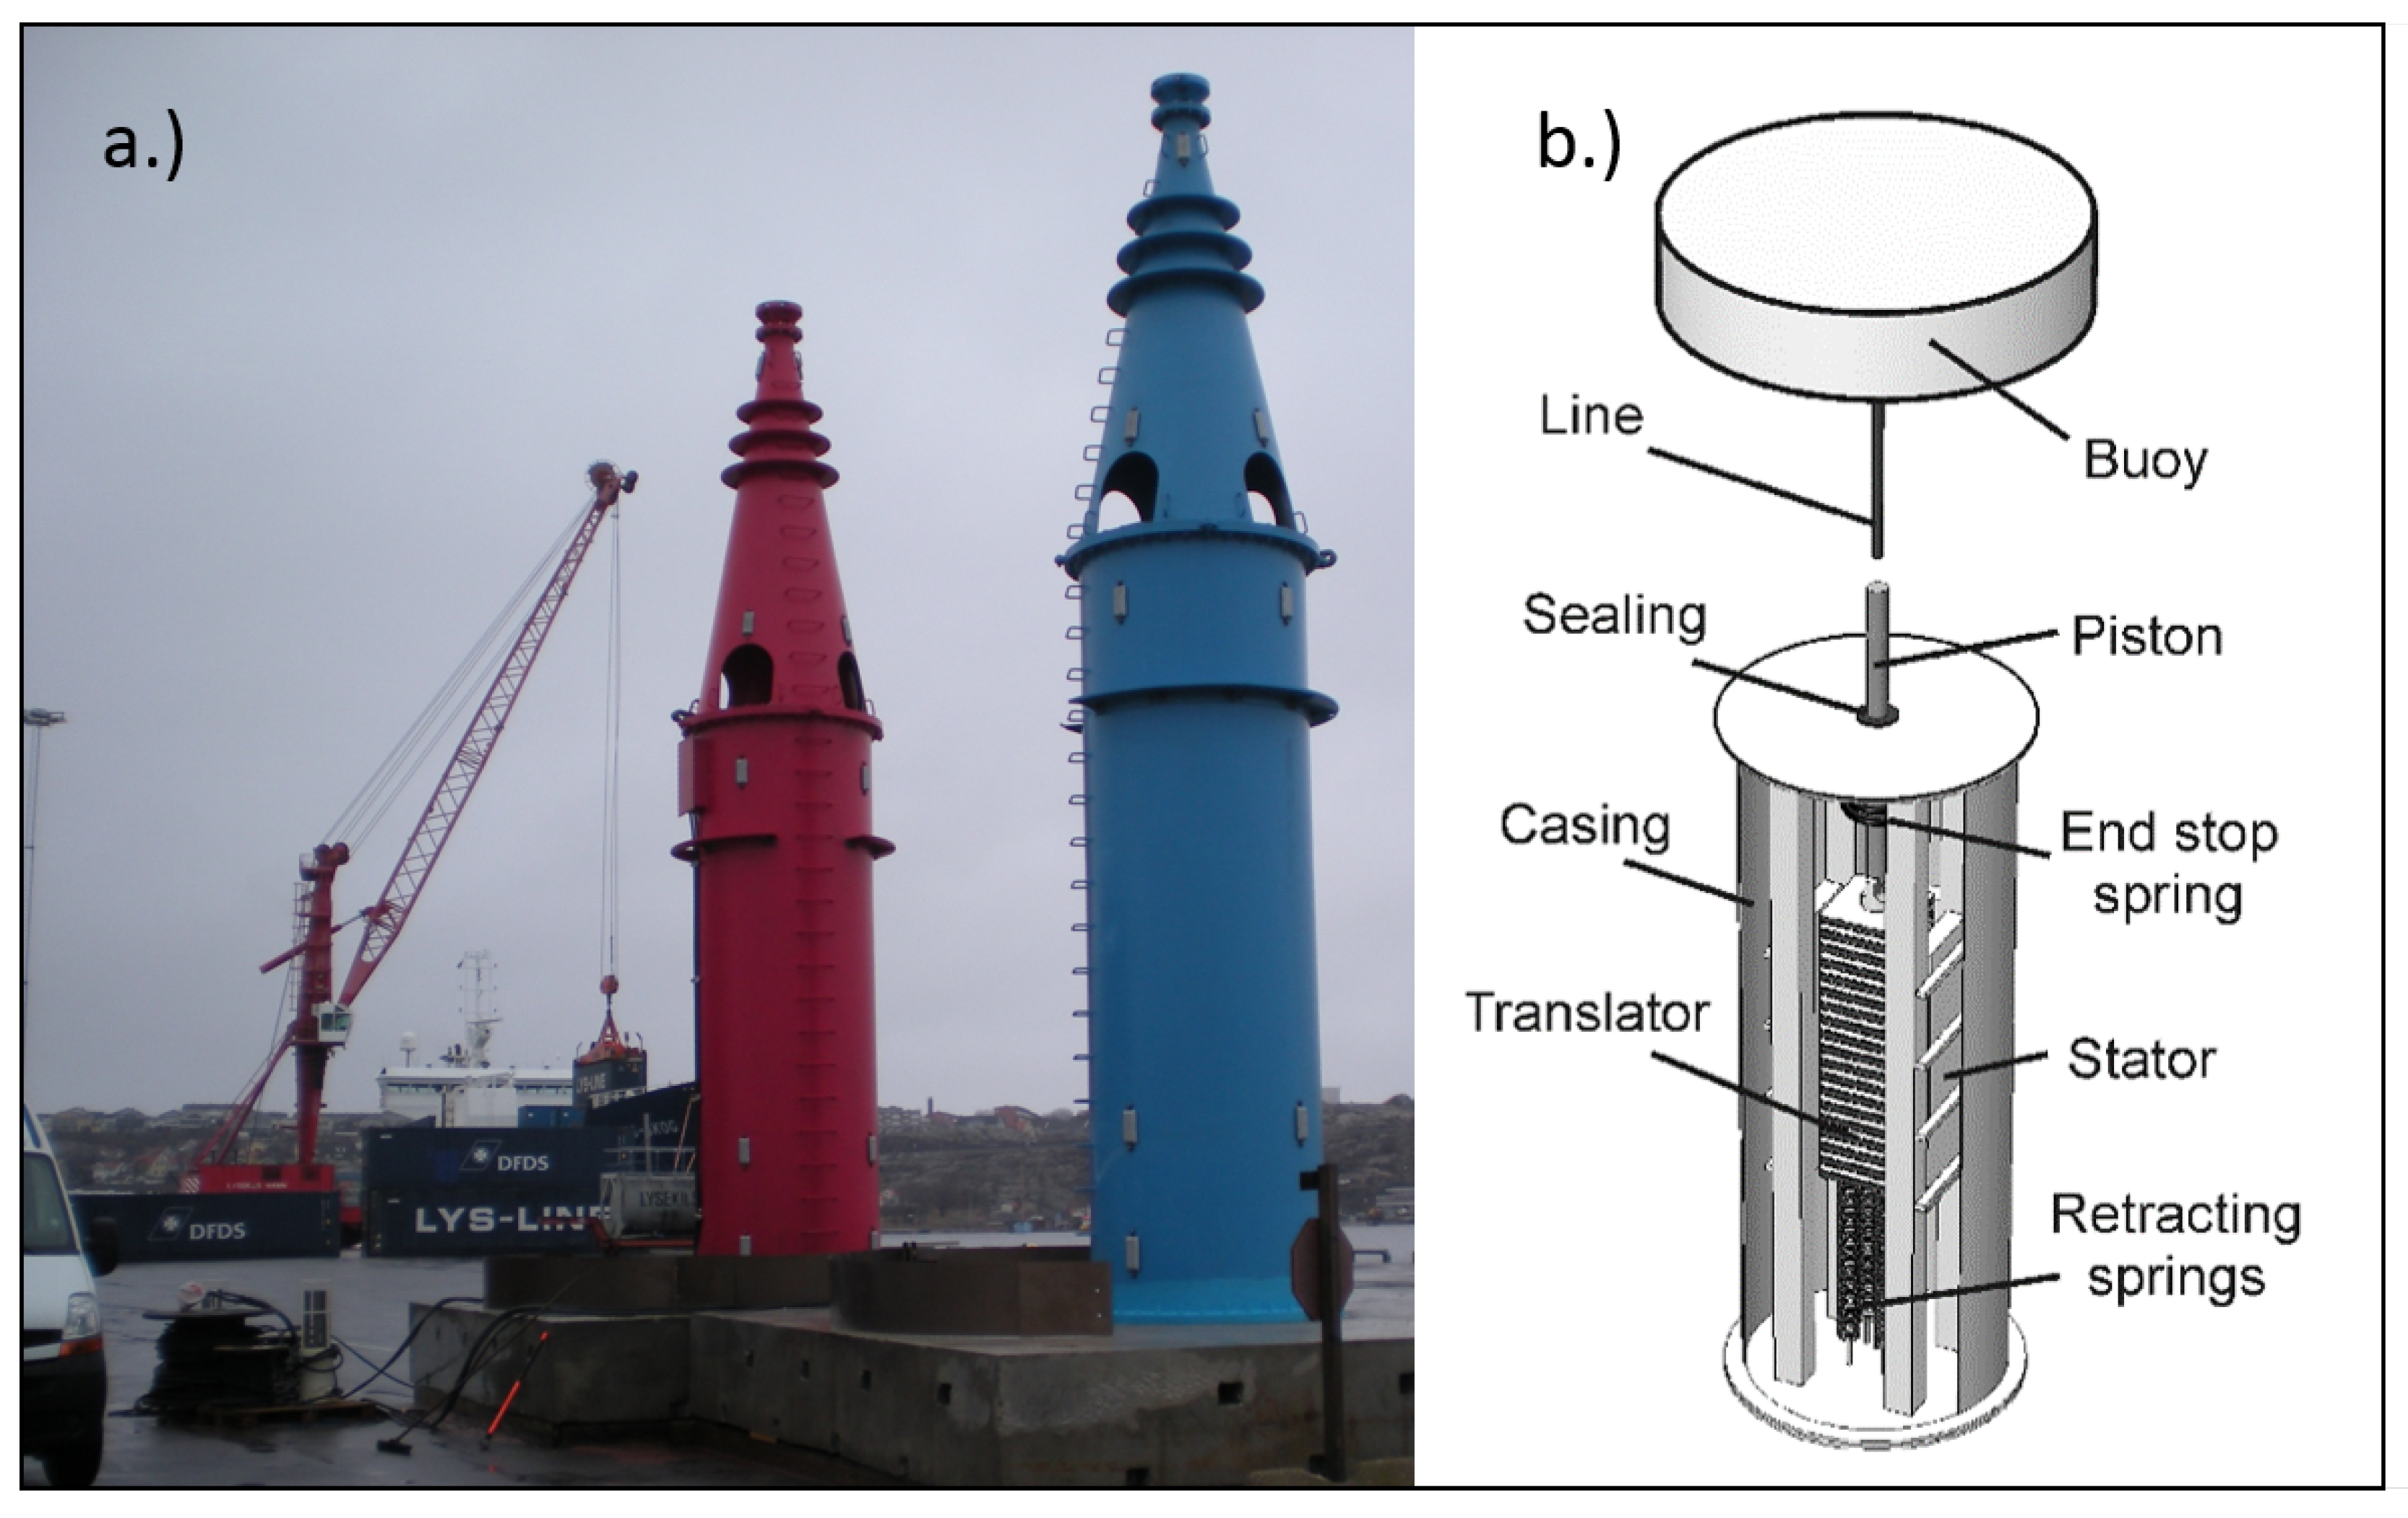
2. The WEC Concept of the Lysekil Project

Within the Lysekil project Uppsala University is testing prototypes of a point absorbing WEC concept at the test site. The site is relatively sheltered with a wave climate with an average energy flux of 2.6 kW/m [15].
Figure 1. (a) The WECs L2 and L3 are standing on the bay before deployment. (b) The main parts of a WEC.
Jmse 02 00477 g001
The first prototype, L1, was deployed in 2006. In this paper data from L2 and L3, deployed in 2009, has been analyzed. In Figure 1 a schematic figure of the WEC concept is shown. The WEC can be described by the equations of motion:
( m a + m b ) y ¨ ( t ) = f e * η ( t ) - h ( t ) * y ˙ ( t ) - ρ g π a 2 y ( t ) - F l
m p y ¨ ( t ) = F l - F e m - k s y ( t ) ± F e n d s t o p
Here m a , m b and m p are the added mass, buoy mass and translator mass respectively. F l is the force in the line, ρ g π a 2 y = F h is the hydrostatic force, and k s y = F s is the spring force. ρ is the water density and a is the buoy radius. The convolutions f e * η ( t ) and h ( t ) * y ˙ ( t ) represent the excitation force and the radiation damping. The electromagnetic damping force F e m is:
F e m = γ ( y ˙ ) A f a c ( y ) y ˙ ( t )
where γ A f a c is the damping coefficient. A f a c is the ratio between the active generator area which is the stator area that at each time instant is covered by the translator and the total stator area. In the simulations in this paper A f a c has been assumed to be 1, so that γ is the damping coefficient. γ is dependent on the internal generator voltage drop and the resistance in the cable and load. The impedance of the inductance, Z L , is calculated as Z L = j ω L , where ω is the electrical frequency and L is the inductance. This is introducing a dependence of γ on ω, resulting in a dependence on the translator velocity. The velocity dependence of γ for a WEC is described by Eriksson et al. [16], where it can be seen that γ is velocity dependent for low resistive loads, while γ is almost constant for higher resistive loads. For the experiments made in this paper ω is low and the inductance is low in the generator, and the reactance X L is thereby negligible ( X L < 0 . 75 Ω ) compared to the circuit resistance ( 12 . 44 Ω ), hence the velocity dependence can be neglected. This is motivating the assumption of constant γ.
The average power absorbed by the WEC for a time interval [0, t] is calculated by:
P = 1 t 0 t γ y ˙ 2 A f a c d t
In the experiment in this paper P is the sum of the electrical power in the resistive load and the copper loss in the sea cable and generator, neglecting iron losses and mechanical losses in the generator. Experimental studies of optimum damping factor for a WEC have been performed by Stålberg et al. and Waters et al. [14,17]. In [14] a capture width ratio (CWR) was used as a measure of absorbed power in relation to available power. CWR was suggested by Hagerman and Bedard in 2003 [18], to be used as a way of presenting performance data for different wave energy devices. According to linear wave theory, the average power transported by the wave per meter wave front is described by:
J = ρ g 2 32 π T E H s 2
where T E is the energy period of the incoming wave and H s is the significant wave height. The average power J has the dimension W/m. This incident power is used to derive the capture width ratio (CWR):
C W R = 100 P a v e r a g e J D
P a v e r a g e is the average electrical power and D is the buoy diameter. However, the studied WEC is a point absorber and is consequently not only absorbing wave power from the wave front that is covered by the buoy, but from a larger water surface area. To study how the electric damping affects the power absorption it is important that the available power is constant, and the CWR can be used as long as the buoy geometry is not changed. But this paper is instead focusing on the buoy dimensions and how the energy absorption is affected by the buoy diameter, and a performance ratio that is independent of buoy geometry is needed. According to Equation (4) the power delivered by the linear generator is proportional to the square of the translator velocity, and if a stiff connection is assumed the absorbed power is then proportional to the square of the buoy velocity. In this paper it is therefore suggested to use the time average of a ratio between the squared buoy velocity in heave and the squared vertical water surface velocity as a measure of performance instead of the capture width ratio. The velocity ratio B is defined as:
B = | v | b u o y 2 | v | w a v e 2
Since the output power is proportional to the square of the translator velocity (Equation (4)), the output power will be proportional to the velocity ratio B, if γ can be considered to be constant.
P a v e r a g e B · γ
It should be noted that a higher B leads to a higher output power only if γ is constant. If B is simulated for two different γ, then they can not be compared.

3. Method

This study has been performed to discuss how the buoy dimensions affect the WEC performance, and to find an optimum buoy dimension for one wave climate. Measured wave data has been used to simulate the velocity ratio B for buoys with different dimensions and damping factors. The wave data that has been used in this study was chosen so that the significant wave height and the energy period are among the most commonly occurring at the Lysekil test site [15]. The wave data was measured on 11 July 2009, during 30 min using a Waverider wave measuring buoy with a sampling frequency of 2.56 Hz. The significant wave height during this 30 min was H s = 1.05 m, the energy period was T e = 4.59 s and the average energy flux was 2.4 kW/m. The sea level during this experiment was +0.2 m, which was measured by The Swedish Meteorological and Hydrological Institute (SMHI) at the meteorological station of Smögen, close to the Lysekil research site.

3.1. Simulation Model

The motion of the WEC system can be studied in the frequency domain using the response amplitude operator, H, derived from the equations of motion assuming rigid connection between the buoy and the translator:
H ^ ( ω ) = f ^ e - ω 2 ( m a + m ) + i ω ( γ + R ^ ) + ρ g π a 2 + k s
The caret denotes the Fourier transform. H is used to attain the buoy response:
y ^ = H ^ ( ω ) G ^ ( ω )
where G is the amplitude of the incoming wave. The position y in time domain is given by the inverse Fourier transform. The hydromechanical parameters m a , f ^ e and R ^ have been calculated using the boundary integral equation software WAMIT.

3.2. Optimizing Buoy Geometry

To find an optimum buoy dimension the simulation was run for the 30 min of wave data assuming constant γ and for one buoy dimension at the time. The motion was restricted to heave only. The velocity ratio B has been calculated for each run. It is assumed that a higher value B can be assumed to be more favourable for this sea state and this γ, since the output power is proportional to the square of the translator velocity. In the first study the draft was kept constant while the radius of the buoy was increased in each run. In the second study the radius was kept constant while the draft was varied in each run, and in the third study both the draft and the radius were changed. This was repeated for three different damping factors. The damping factors used in the simulations are γ = 7.4 kNs/m, γ = 20 kNs/m and γ = 30 kNs/m. The lowest γ was chosen to match the damping factor used in the experiment in 2009.

3.3. Experimental Verification

The experimental data used in this paper was measured at the Lysekil research site in July 2009. Three WECs were operated at the time, two of those, denoted L2 and L3, had similar generators which are described in Table 1. The generator damping coefficients were experimentally measured to 7.4 kNs/m for L2 and 7.3 kNs/m for L3, both with an accuracy of ± 5 % . During their operational time L3 had a higher power production than L2, a fact that in previous articles from the group has been explained by their different buoy radii. Both WECs had cylinder buoys but with different radius, draft and mass. Moreover, the connection lines of L2 and L3 had incorrect lengths. This caused an offset of the translator position for both generators, i.e., the translator was not in the middle of the stator at mean sea level. In order to determine these deviations, the average position of each translator has been analyzed. L2 and L3 were equipped with draw-wire sensors installed in the generators with the purpose of measuring the instantaneous position of the translator [19]. The measurements plotted in Figure 2 show the averages of the translator position over 10 min of recorded data for L2 and L3. The complete set of data that has been analyzed covers 24 h of translator motion: between 12:00 of the 27th of May 2009 and 14:00 of the 28th with a lack of data between 20:00 and 22:00 of the first day (UTC time). The solid line in Figure 2 represents the sea water level at the meteorological station of Smögen.
Table 1. Generator and buoy specifications for L2 and L3. The translator position offset and the pretension will vary with the sea level, here given for mean water level.
WECL2L3
Nominal power10 kW10 kW
Rated voltage (line-to-line)200 V200 V
Rated speed0.67 m/s0.67 m/s
Free strokelength1.797 m1.797 m
Total strokelength2.21 m2.21 m
Stator length1.26 m1.26 m
Translator length1.87 m1.87 m
Translator mass1200 kg1200 kg
Buoy radius1.5 m2.0 m
Bouy height1.2 m0.7 m
Buoy draft0.65 m0.4 m
Buoy mass2000 kg2500 kg
Mass of lines and chains340 kg360 kg
Retraction spring constant6200 N/m6200 N/m
Pretension10,620 N8760 N
Translator position offset+0.1 m−0.2 m
It can be noticed that the average position of the translators correspond well with the variation in the sea level, but the measurements, marked with asterisks, do not overlap the solid line suggesting that the translators have not been centred properly when the generators were deployed. It can be seen that the connection line was 0.1 m too short for L2 and 0.2 m too long for L3. This results in a decrease of the active area, and it also affects the pretension of the retraction springs. The pretension in Table 1 has been recalculated with the actual line lengths and is given for mean water level in Table 1. It should be noted that the pretension will vary with the sea level, and this is causing a variation of the draft with the sea level. The translator position offset has been given for mean water level in Table 1. The sea level was +0.2 m during the experiment.
Figure 2. Comparison between the sea level at Smögen (courtesy of SMHI) and the position of the translator for L2 and L3. Each point in the figure represents the 10 min average of the translator position. It can be seen that the translator is in phase with the sea level.
Jmse 02 00477 g002

4. Results

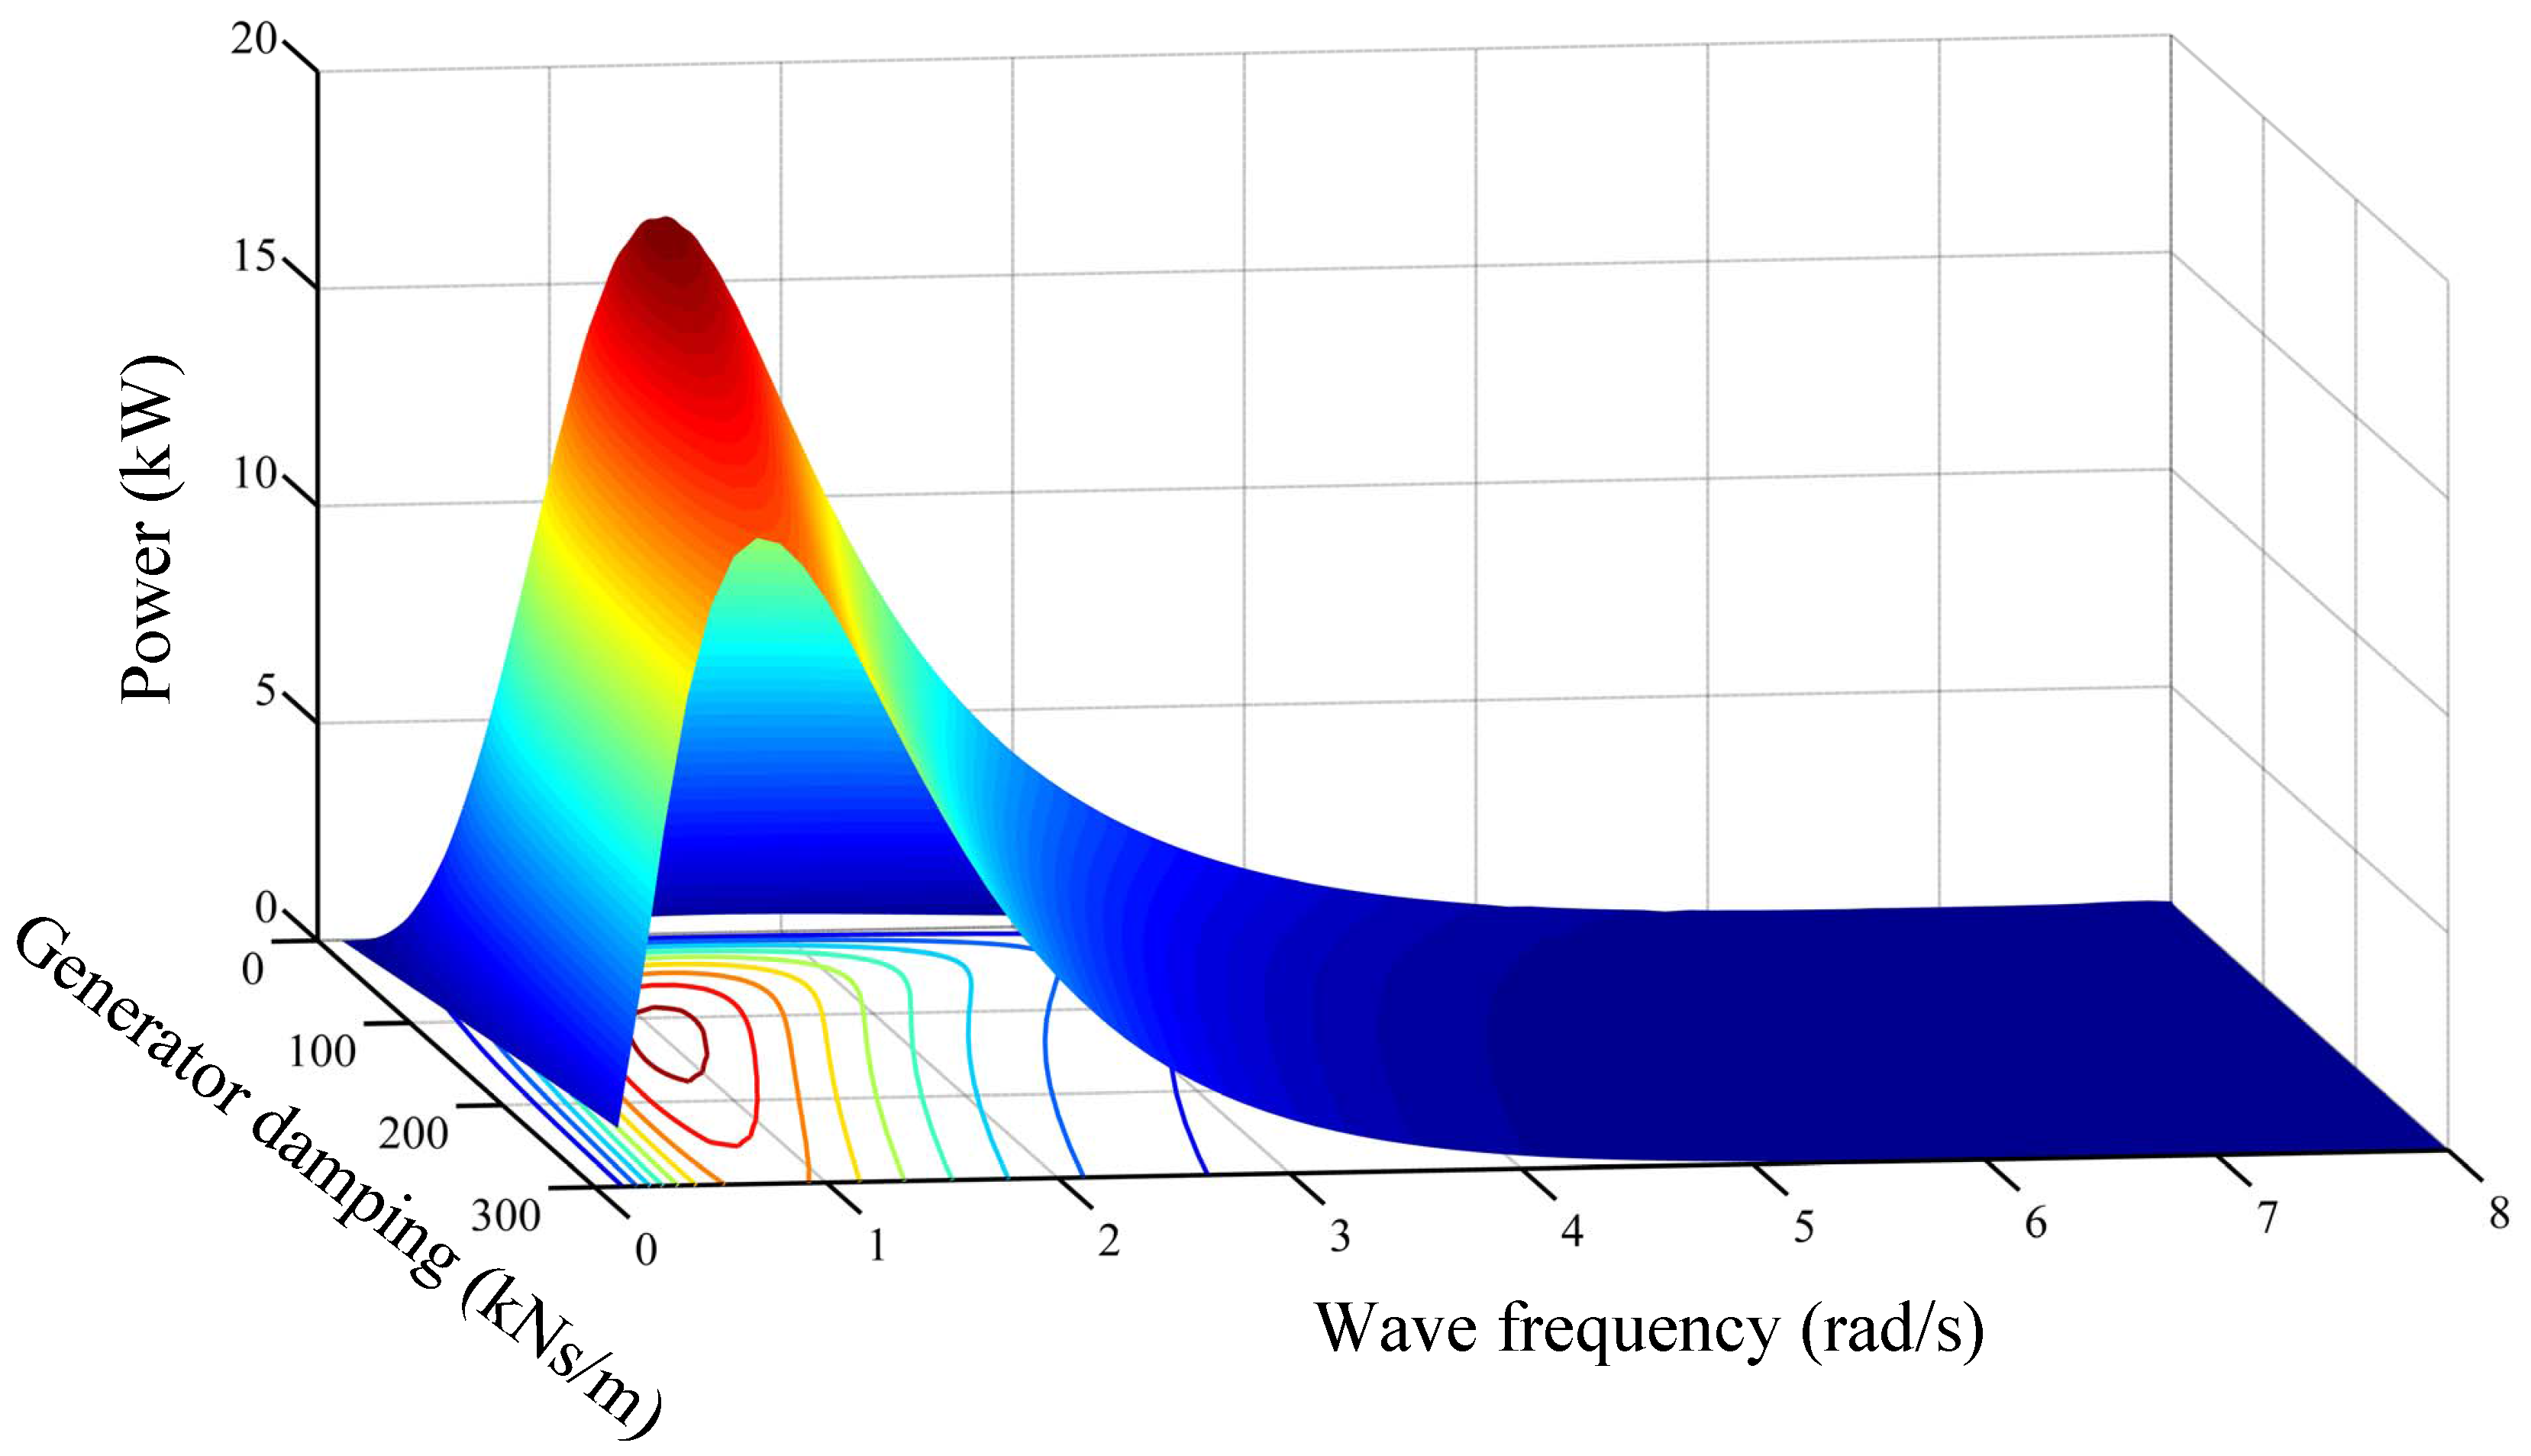
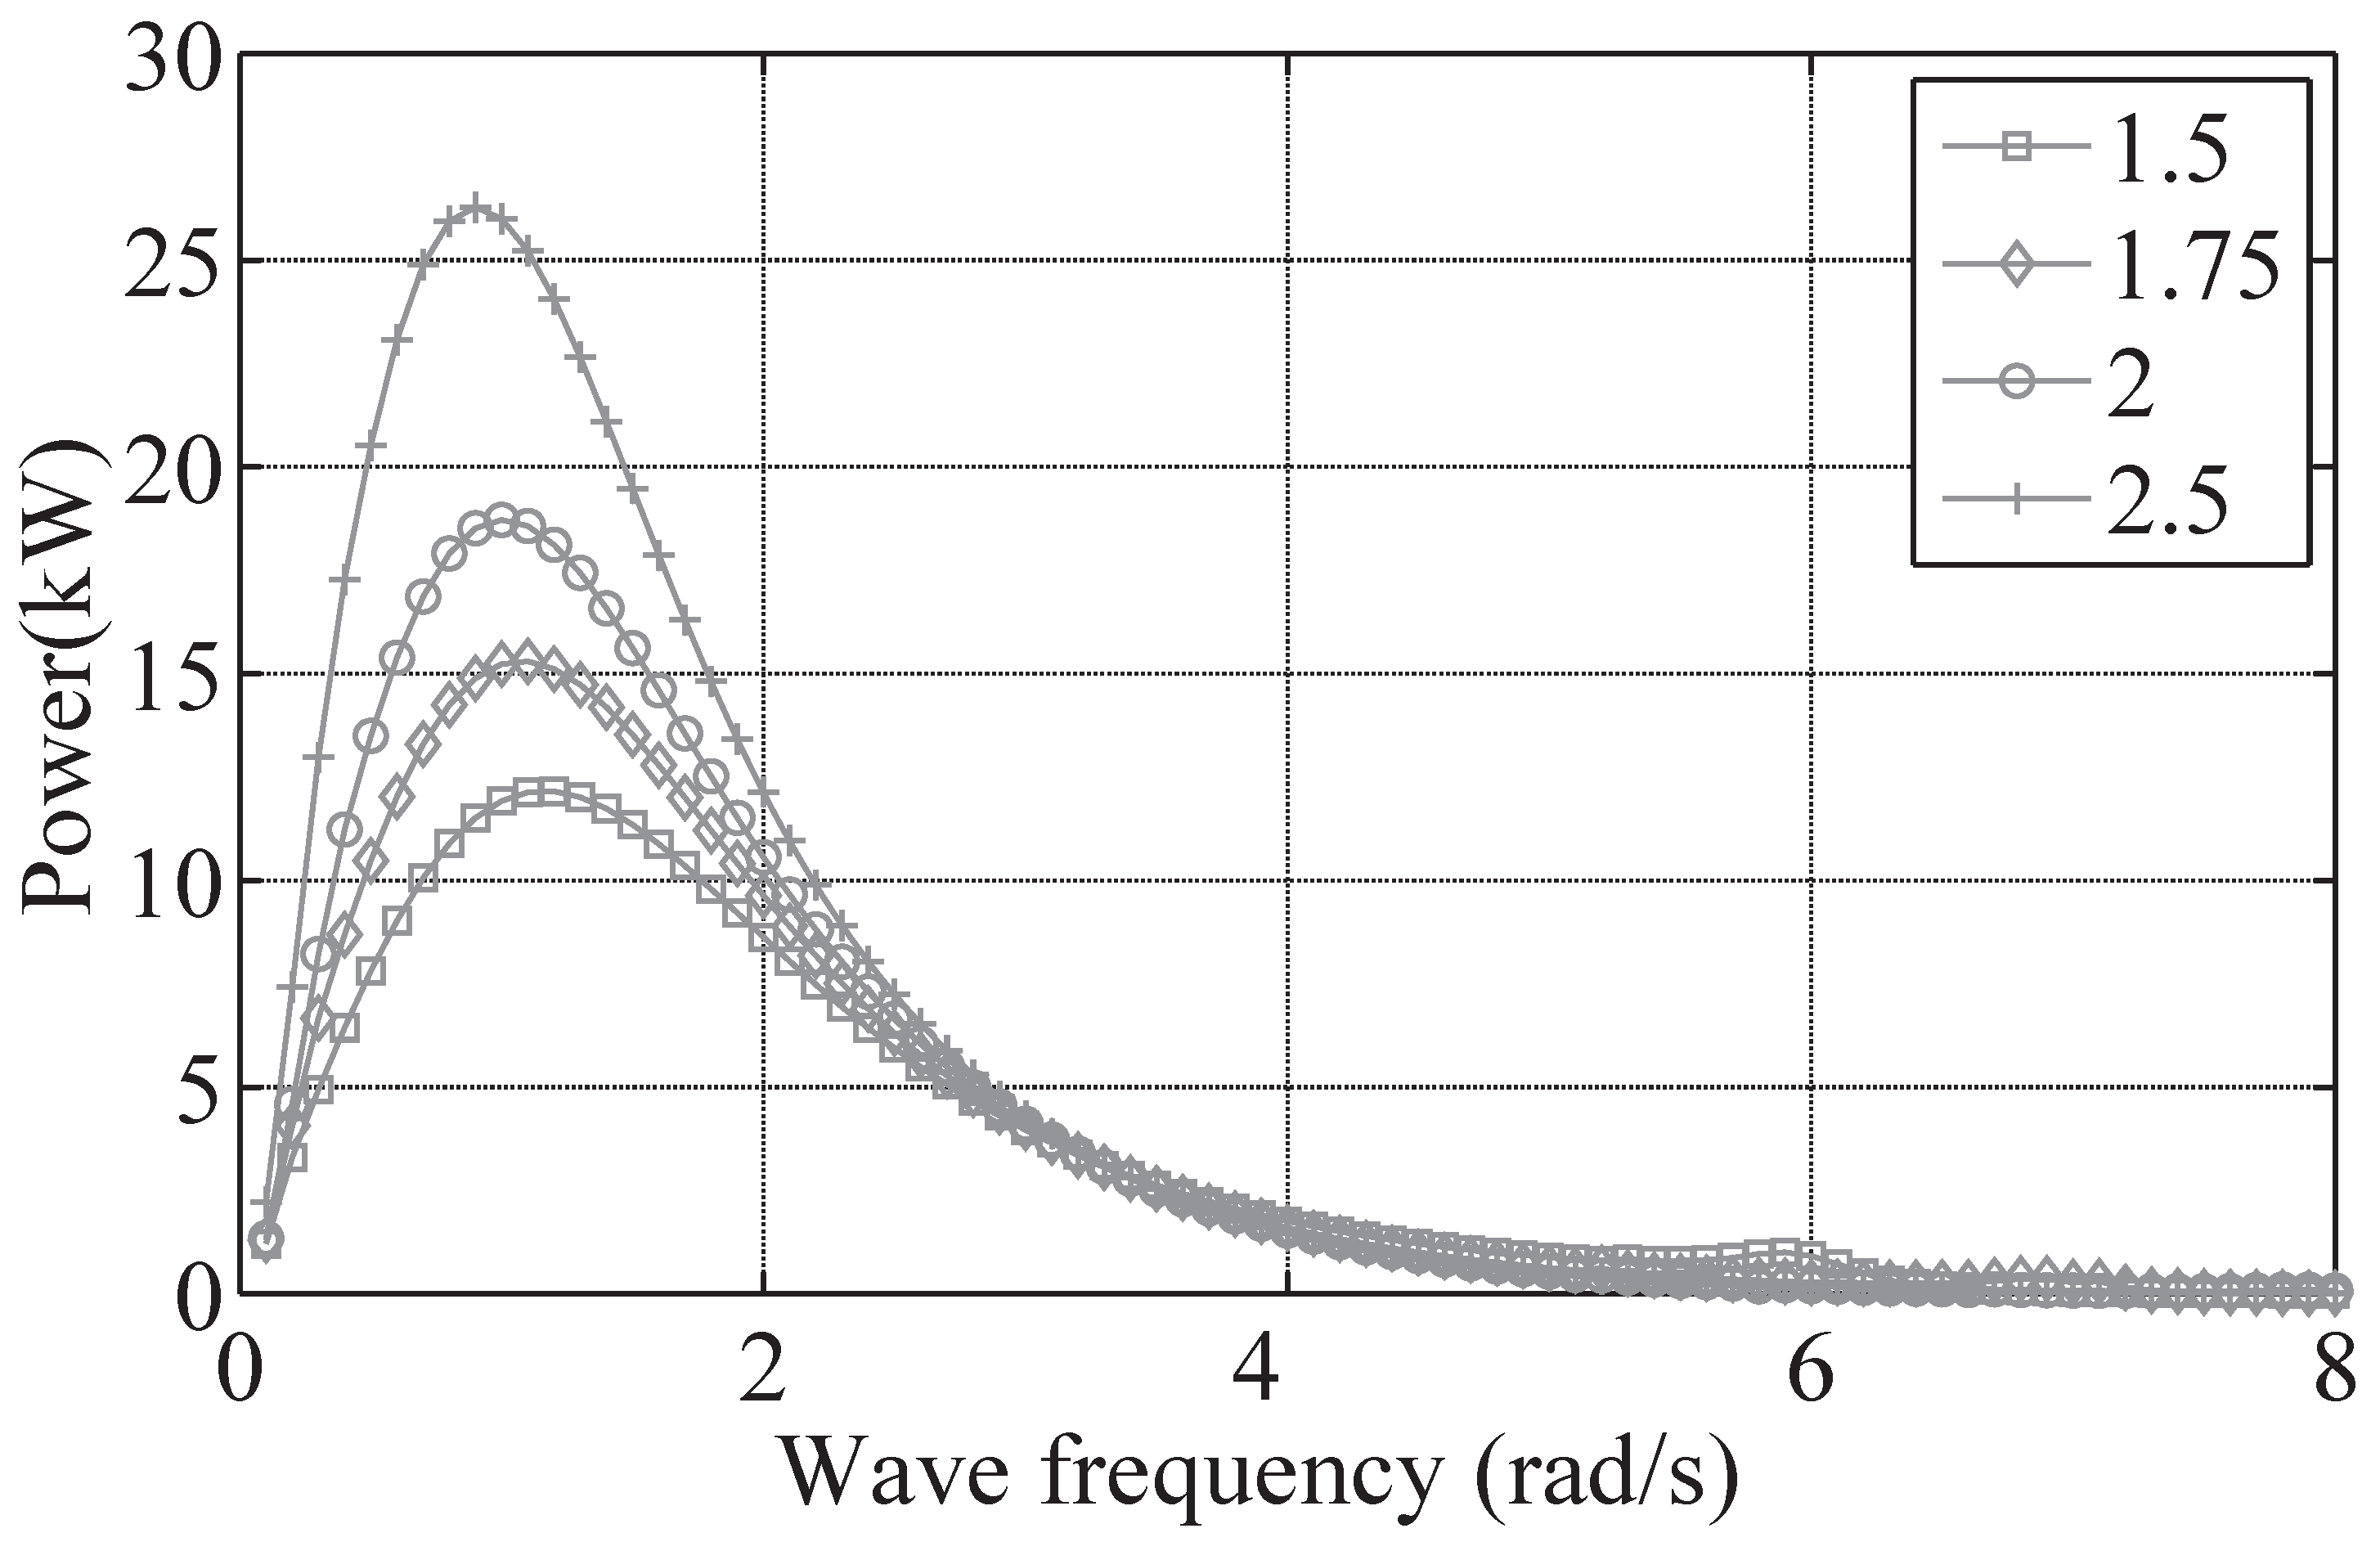
4.1. Analysis in Frequency Domain

Theoretical optimum power absorption was studied in the frequency domain for cylindrical buoys with varied radius. In Figure 3 the power absorption is shown as a function of the wave frequency and the generator damping coefficient for a buoy with radius a = 2 m. The buoy response y b to a wave has been calculated for chosen wave frequencies, the power has then been calculated as :
P ( ω ) = 1 2 γ | y b ˙ ( ω ) | 2
The power has been plotted in Figure 3. Four buoys with different radius have been studied in this way. It can be seen that for each buoy an optimum damping coefficient and wave frequency can be identified, for which the maximum absorbed power is found. The average absorbed power at optimum conditions for each buoy is given in Figure 4, where the optimum γ has been identified for each buoy and the absorbed power is shown as a function of the buoys oscillating velocity. It is observed that the absorbed power increases with increased radius, since a higher γ can be used. The optimum damping coefficient is varying between 57 kNs/m and 218 kNs/m for the buoy radii of 1.5 m to 2.5 m. The optimum buoy oscillating velocity is varying from 0.9 rad/s to 1.2 rad/s.
Figure 3. Theoretical absorbed power studied in the frequency domain, for a cylindrical buoy with radius a = 2 m. The theoretical maximum power was found to be 19 kW for this buoy, for γ = 124 kNs/m and at a wave oscillating velocity of 1.0 rad/s.
Jmse 02 00477 g003
Figure 4. Absorbed power studied in the frequency domain as a function of wave oscillating velocity, shown for four different buoy sizes and at there corresponding optimum γ. Optimum values of γ were 57 kNs/m, 86 kNs/m, 124 kNs/m and 218 kNs/m, for the buoys with radii 1.5 m, 1.75 m, 2 m and 2.5 m respectively.
Jmse 02 00477 g004

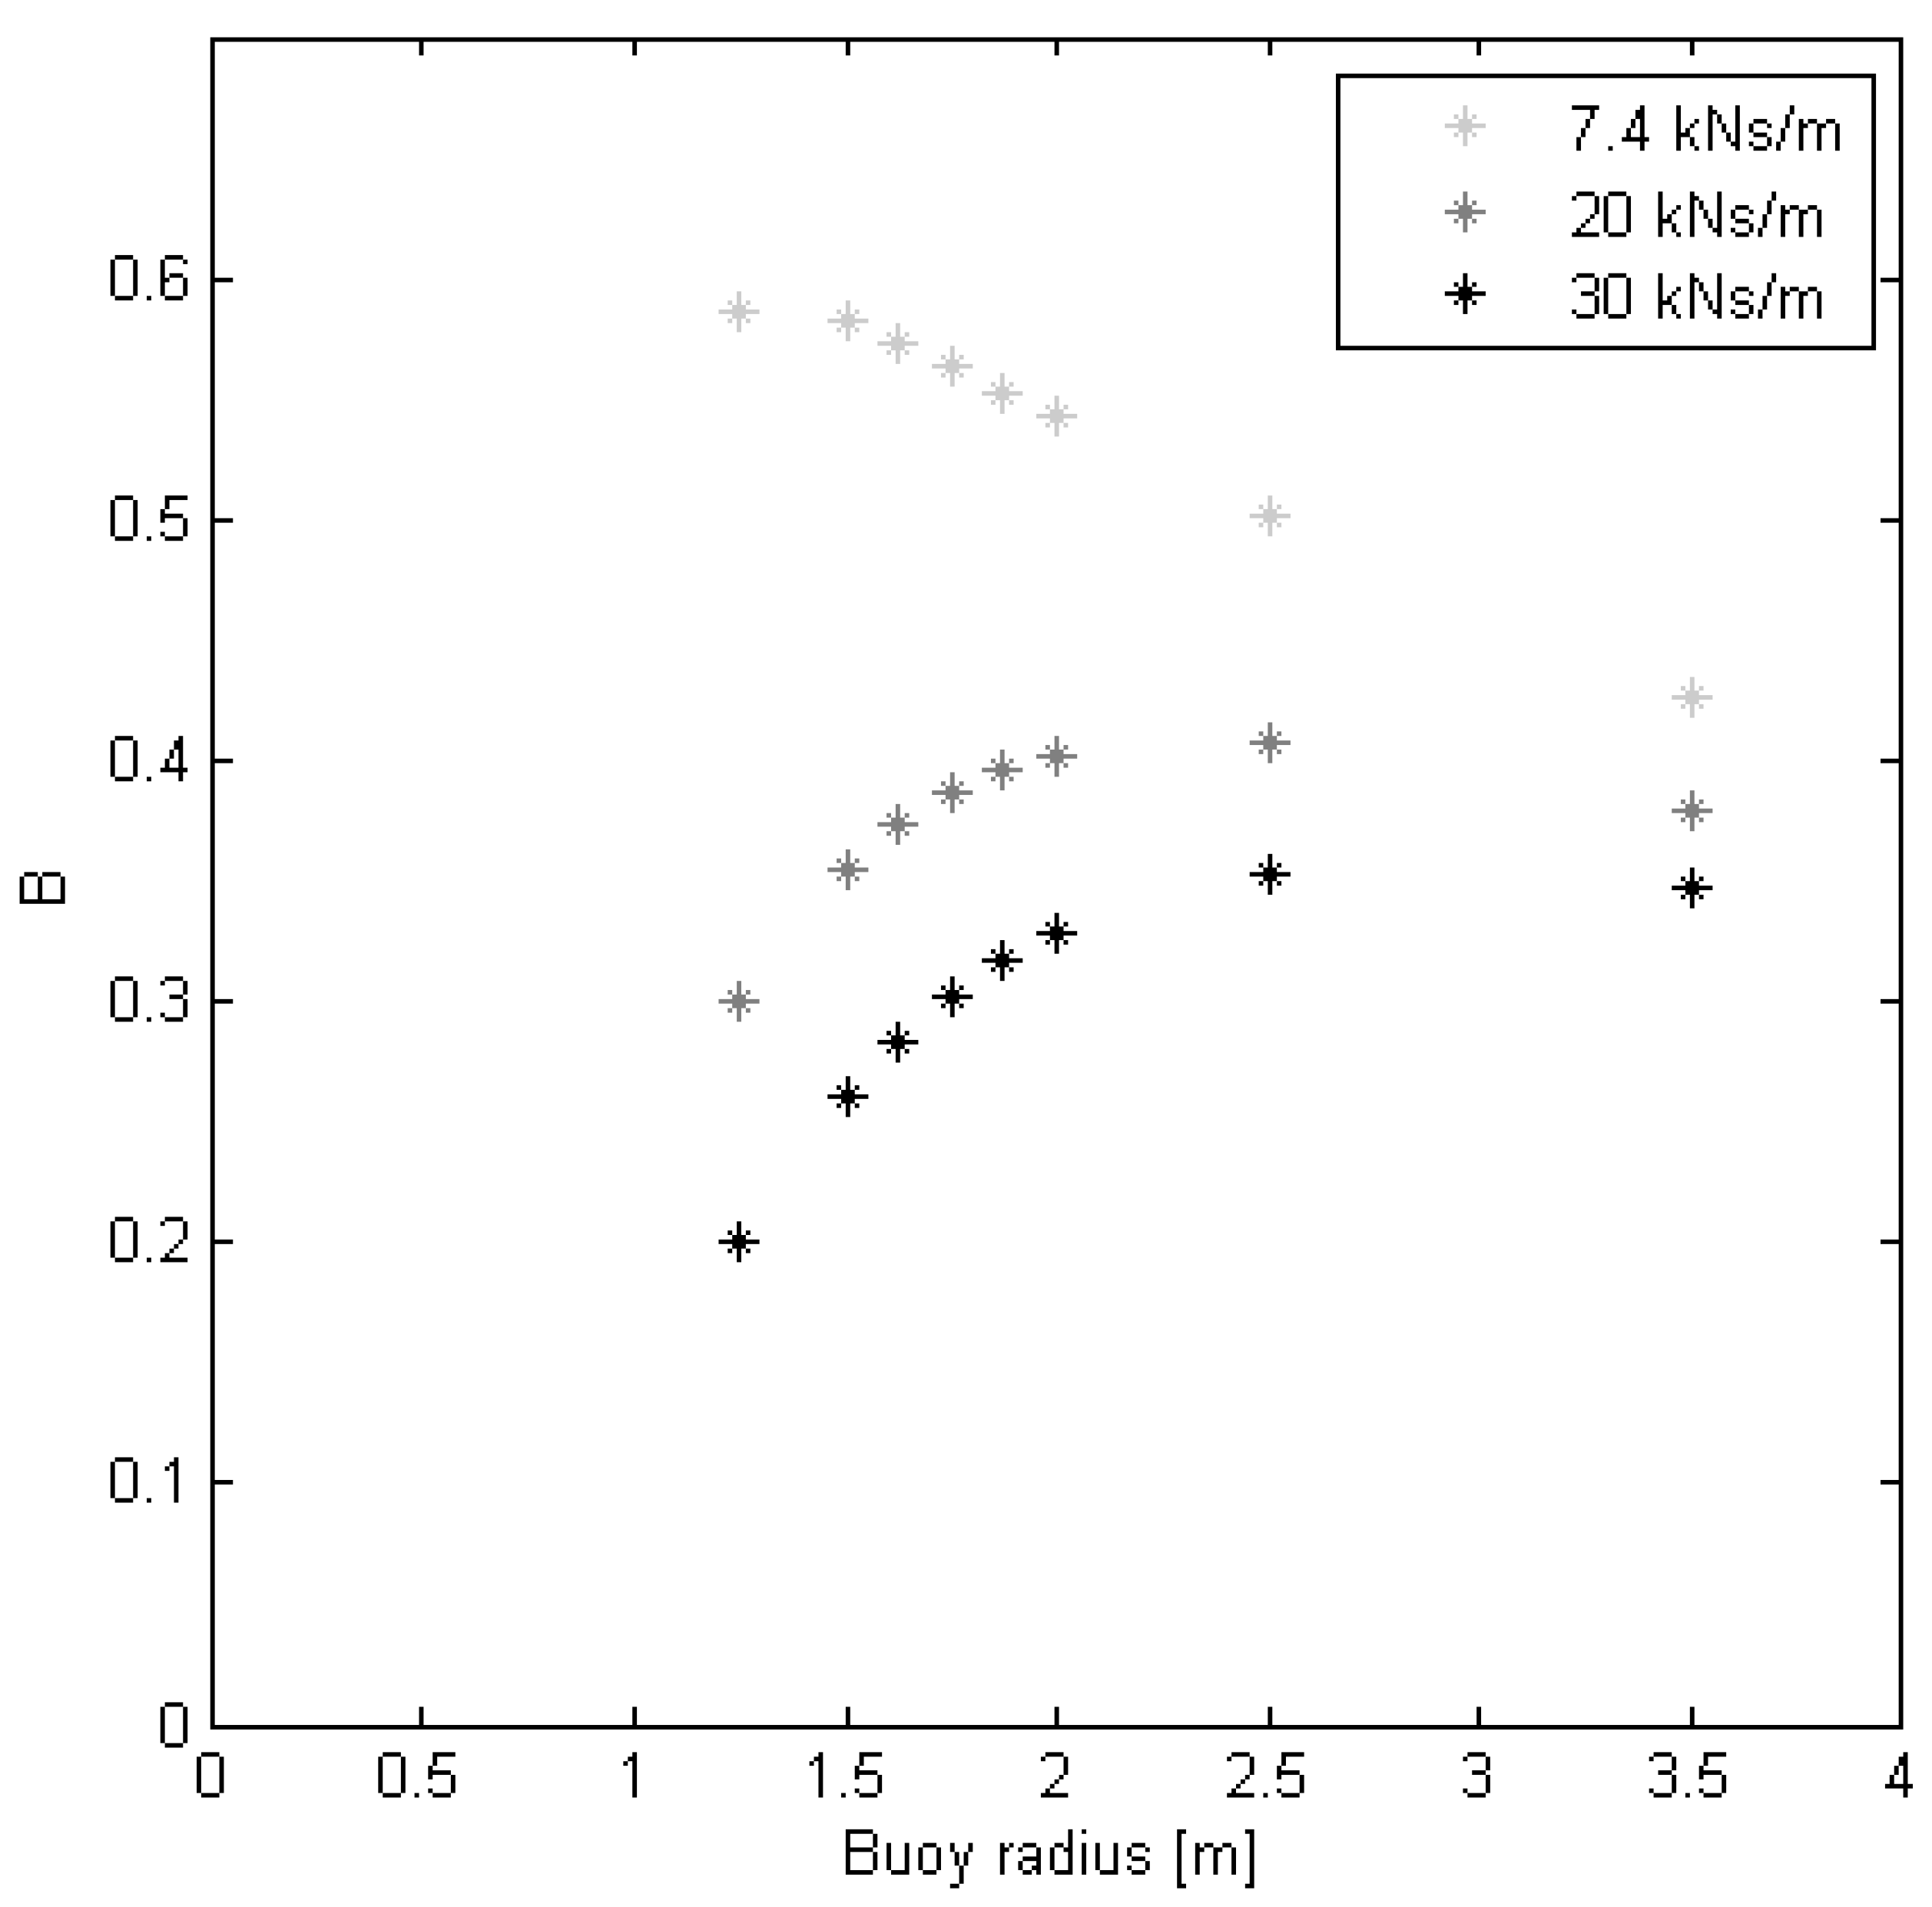
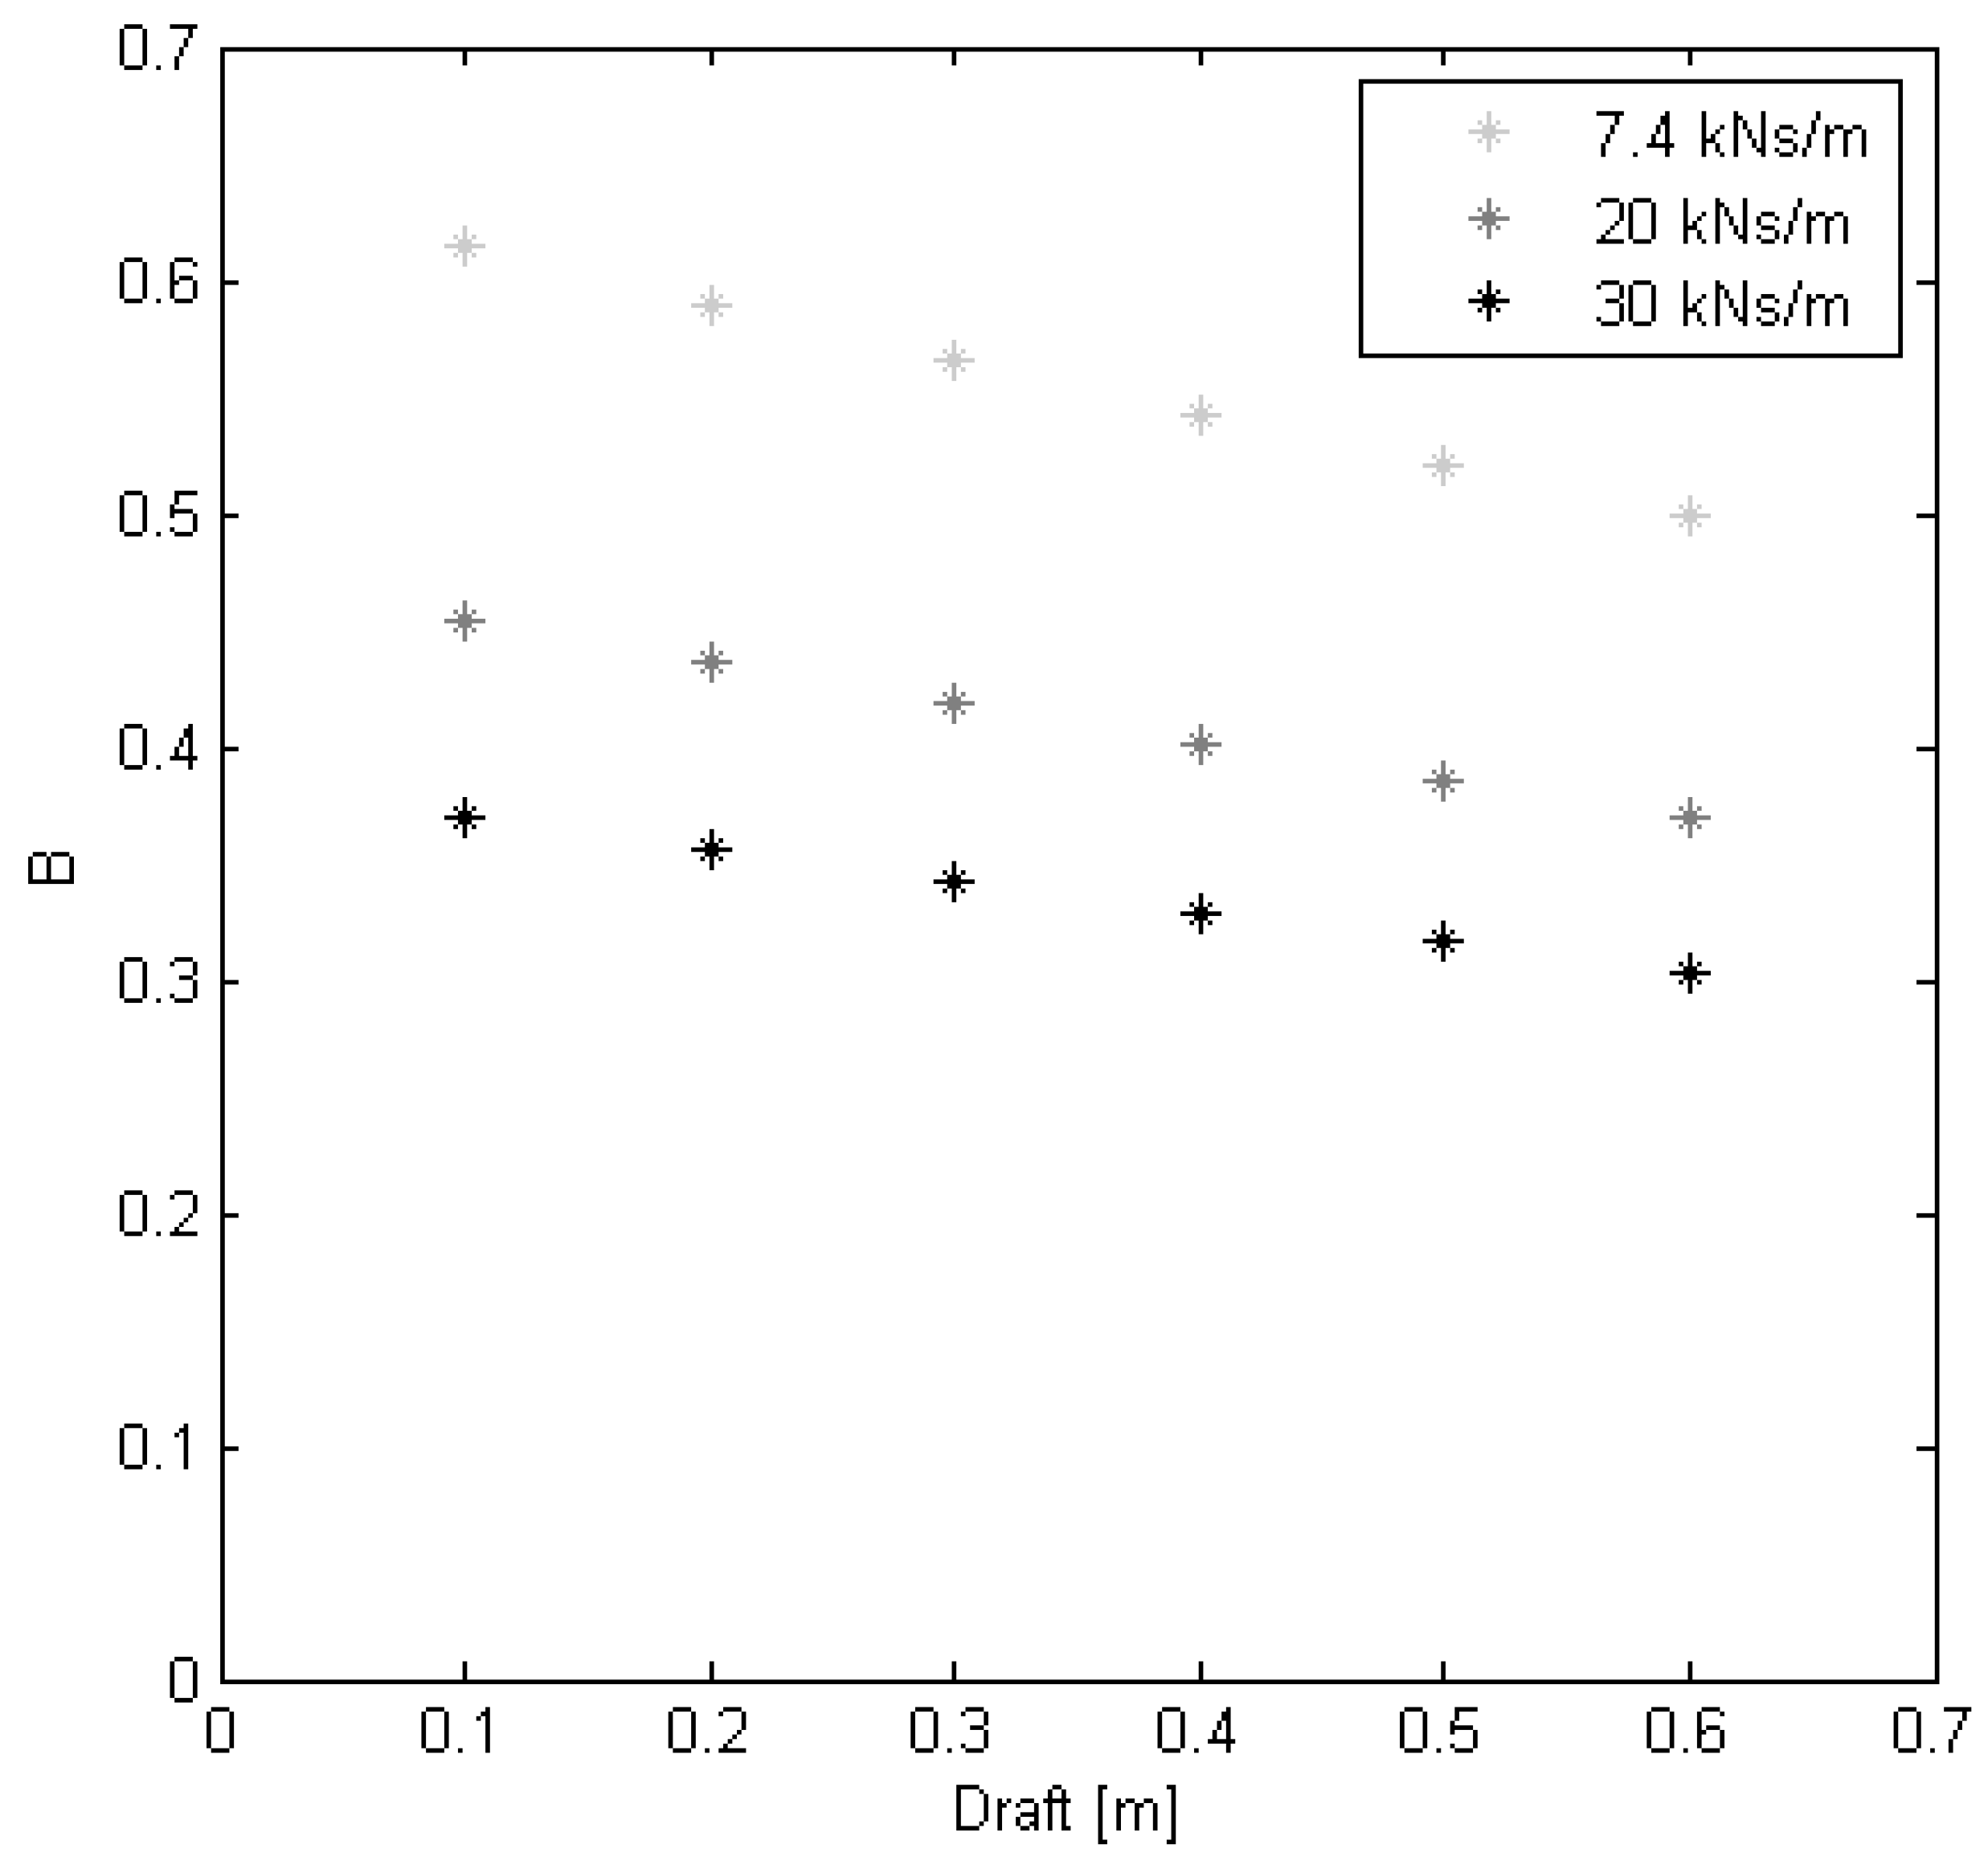
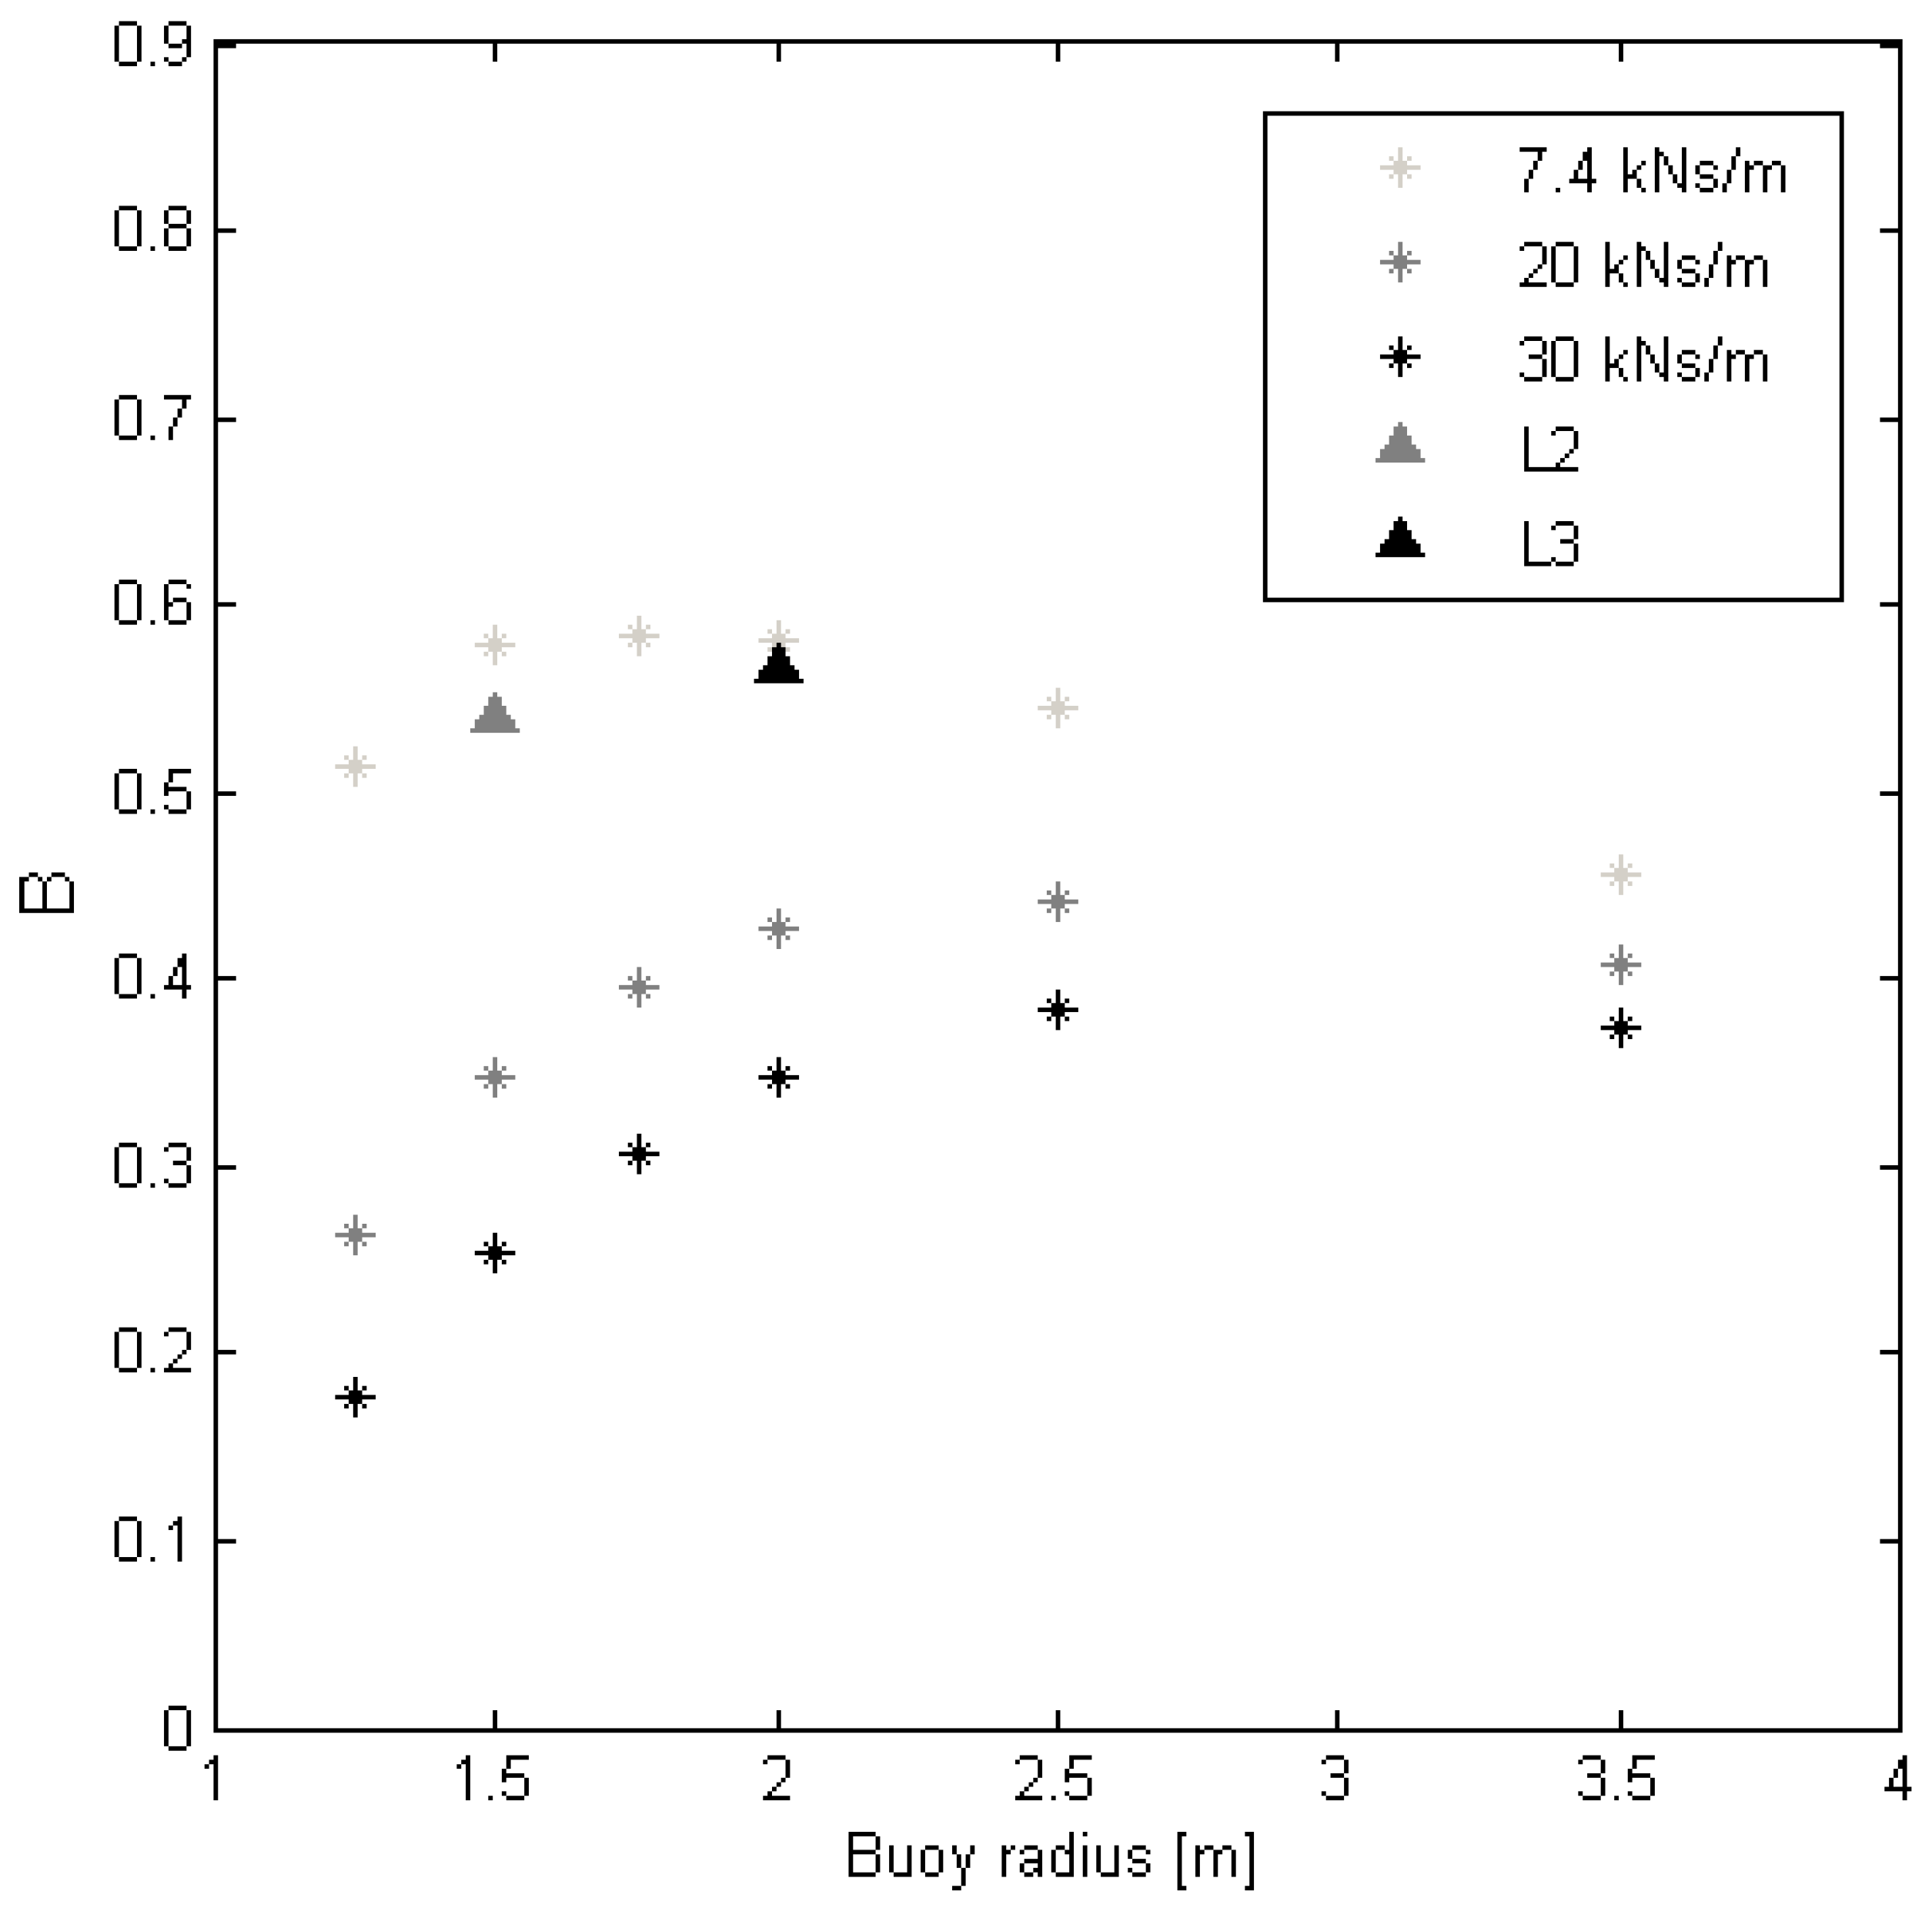
4.2. Optimization of Buoy Geometry

In Figure 5 the velocity ratio B is simulated as a function of buoy radius for three different γ. The draft was kept constant at 0.4 m in all simulations. By comparing B for the different γ it is clear that the buoy velocity decreases with increased damping. It should however be noted that the absorbed power is increasing with increased γ (Equation (4)), and if γ is decreased in order to increase B then the system would be suboptimized and the absorbed power would decrease. For the lowest γ it can be seen that B is decreasing when the radius increases, while for the higher γ it can be seen that B will increase to a maximum value before decreasing. An optimal value of buoy radius has been identified to be around 2.5 m. It is known [20] that the excitation force will increase with increased water plane area. The radiation damping, the added mass and the hydrostatic stiffness are also increasing with increased water plane area. An increased radiation damping is moving energy out of the system and decreases the buoy velocity. The radiation damping is proportional to the buoy velocity. This parameter is thus of great importance for a WEC with low damping and a high velocity.
Figure 5. Velocity ratio B as a function of buoy radius has been simulated for three levels of γ. The draft has been kept constant at 0.4 m.
Jmse 02 00477 g005
In Figure 6, B has been simulated as a function of buoy draft and for the same γ as in the radius study. The radius was constant, set to a value of a = 2 m, in all the simulations. The mass was constant in all simulations, set to a value of m = 2000 kg. Similar to the results in Figure 5, the buoy velocity decreases with increased damping. The excitation force decreases with increasing depth and B therefore decreases with increasing draft. The increased draft is also increasing the added mass, ( m a = 11,800 kg and m a = 13,500 kg for the drafts 0.1 m and 0.6 m respectively) which will affect the reactance of the WEC and thereby affect the resonance behaviour. This can have increased the velocity factor B, but since it did in total decrease, it is assumed that the decreased excitation force had a larger influence. The behaviour described here is only dependent on the draft, and the mass of buoy and translator has been kept constant. The drafts simulated in Figure 6 could be achieved by increasing the pretension in the retraction spring. However, if the draft is increased due to an increased mass, the mass variation will affect the reactance and the resonance behaviour, which could increase B instead.
Figure 6. Velocity ratio B as a function of buoy draft. The radius was simulated as constant, a = 2 m, while the draft was varied. The mass was simulated as constant, m = 2000 kg.
Jmse 02 00477 g006
For a real WEC an increased buoy radius would lead to a decreased draft if the mass was kept constant, and the radius study and the draft study should be seen as theoretical examples. In Figure 7, the simulated mass has been kept constant, m = 2500 kg, while the radius has been varied and the draft recalculated according to the corresponding case. The results in Figure 7 show that an optimum value of B can be found when varying the buoy radius. The optimal radius is dependent on the damping. For the lowest damping the buoy should have a radius between 1.5 m and 2 m, while for the higher damping factors it should be in the range from 2 m to 3.5 m.

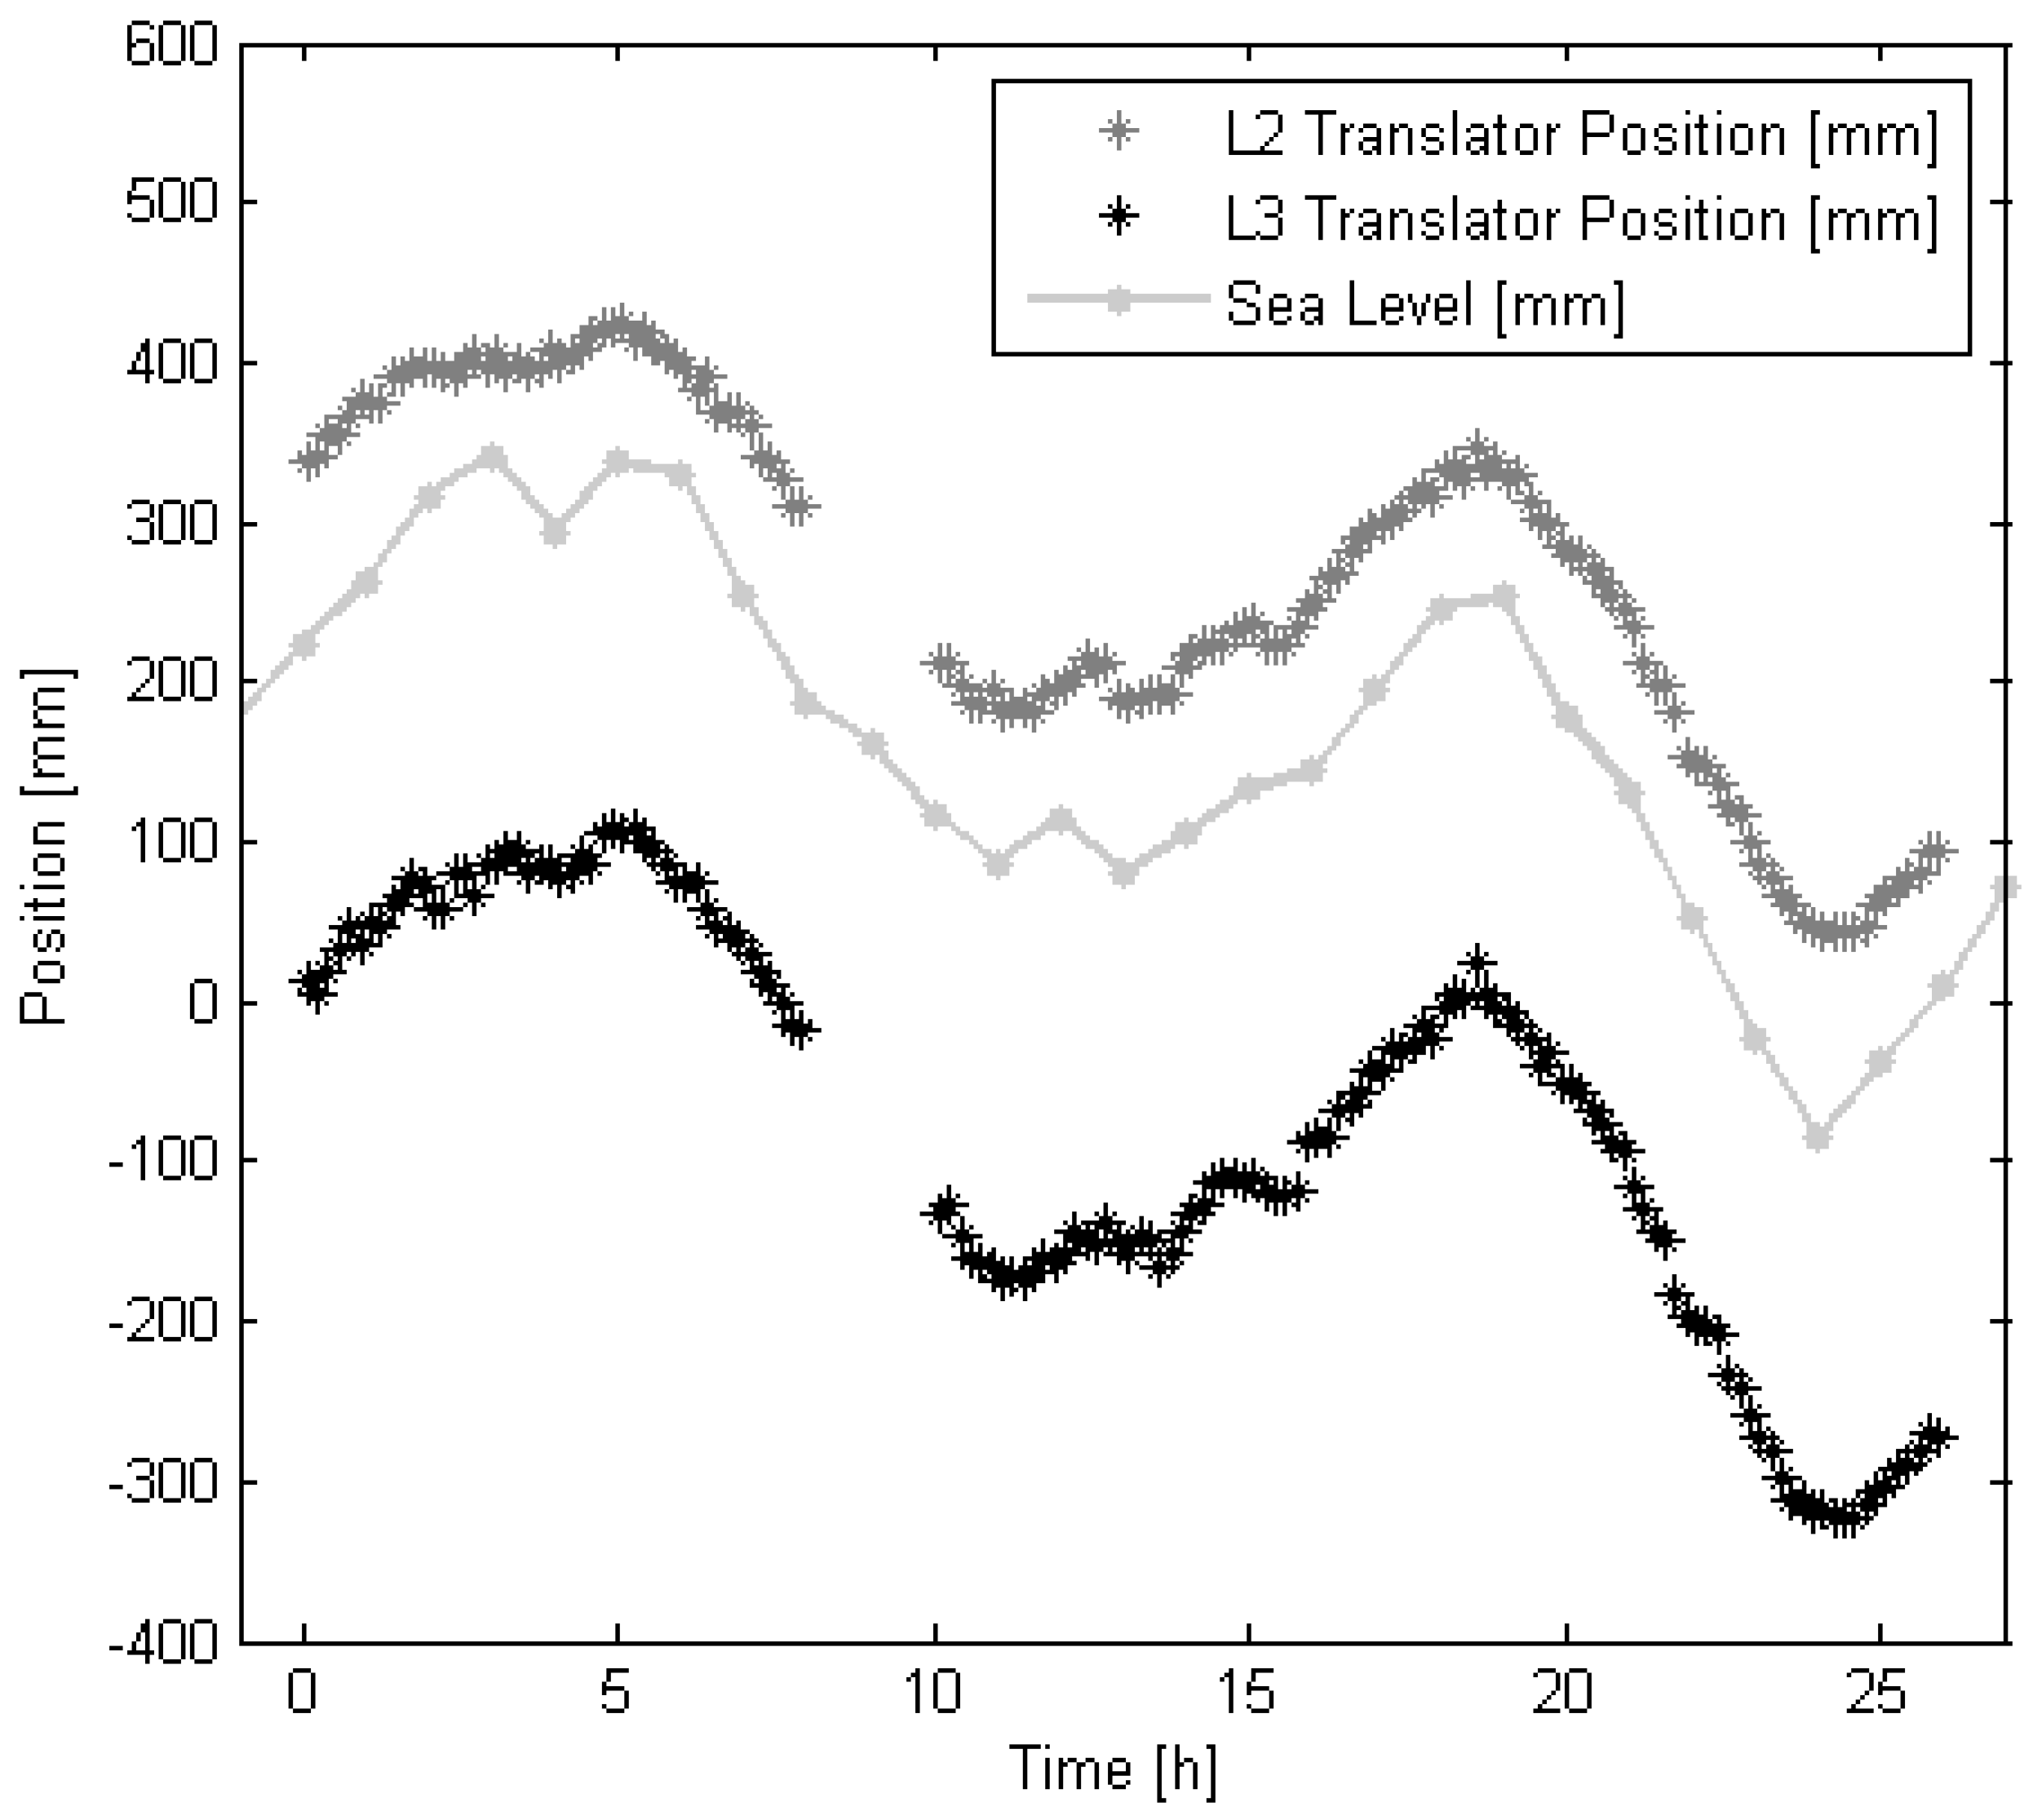
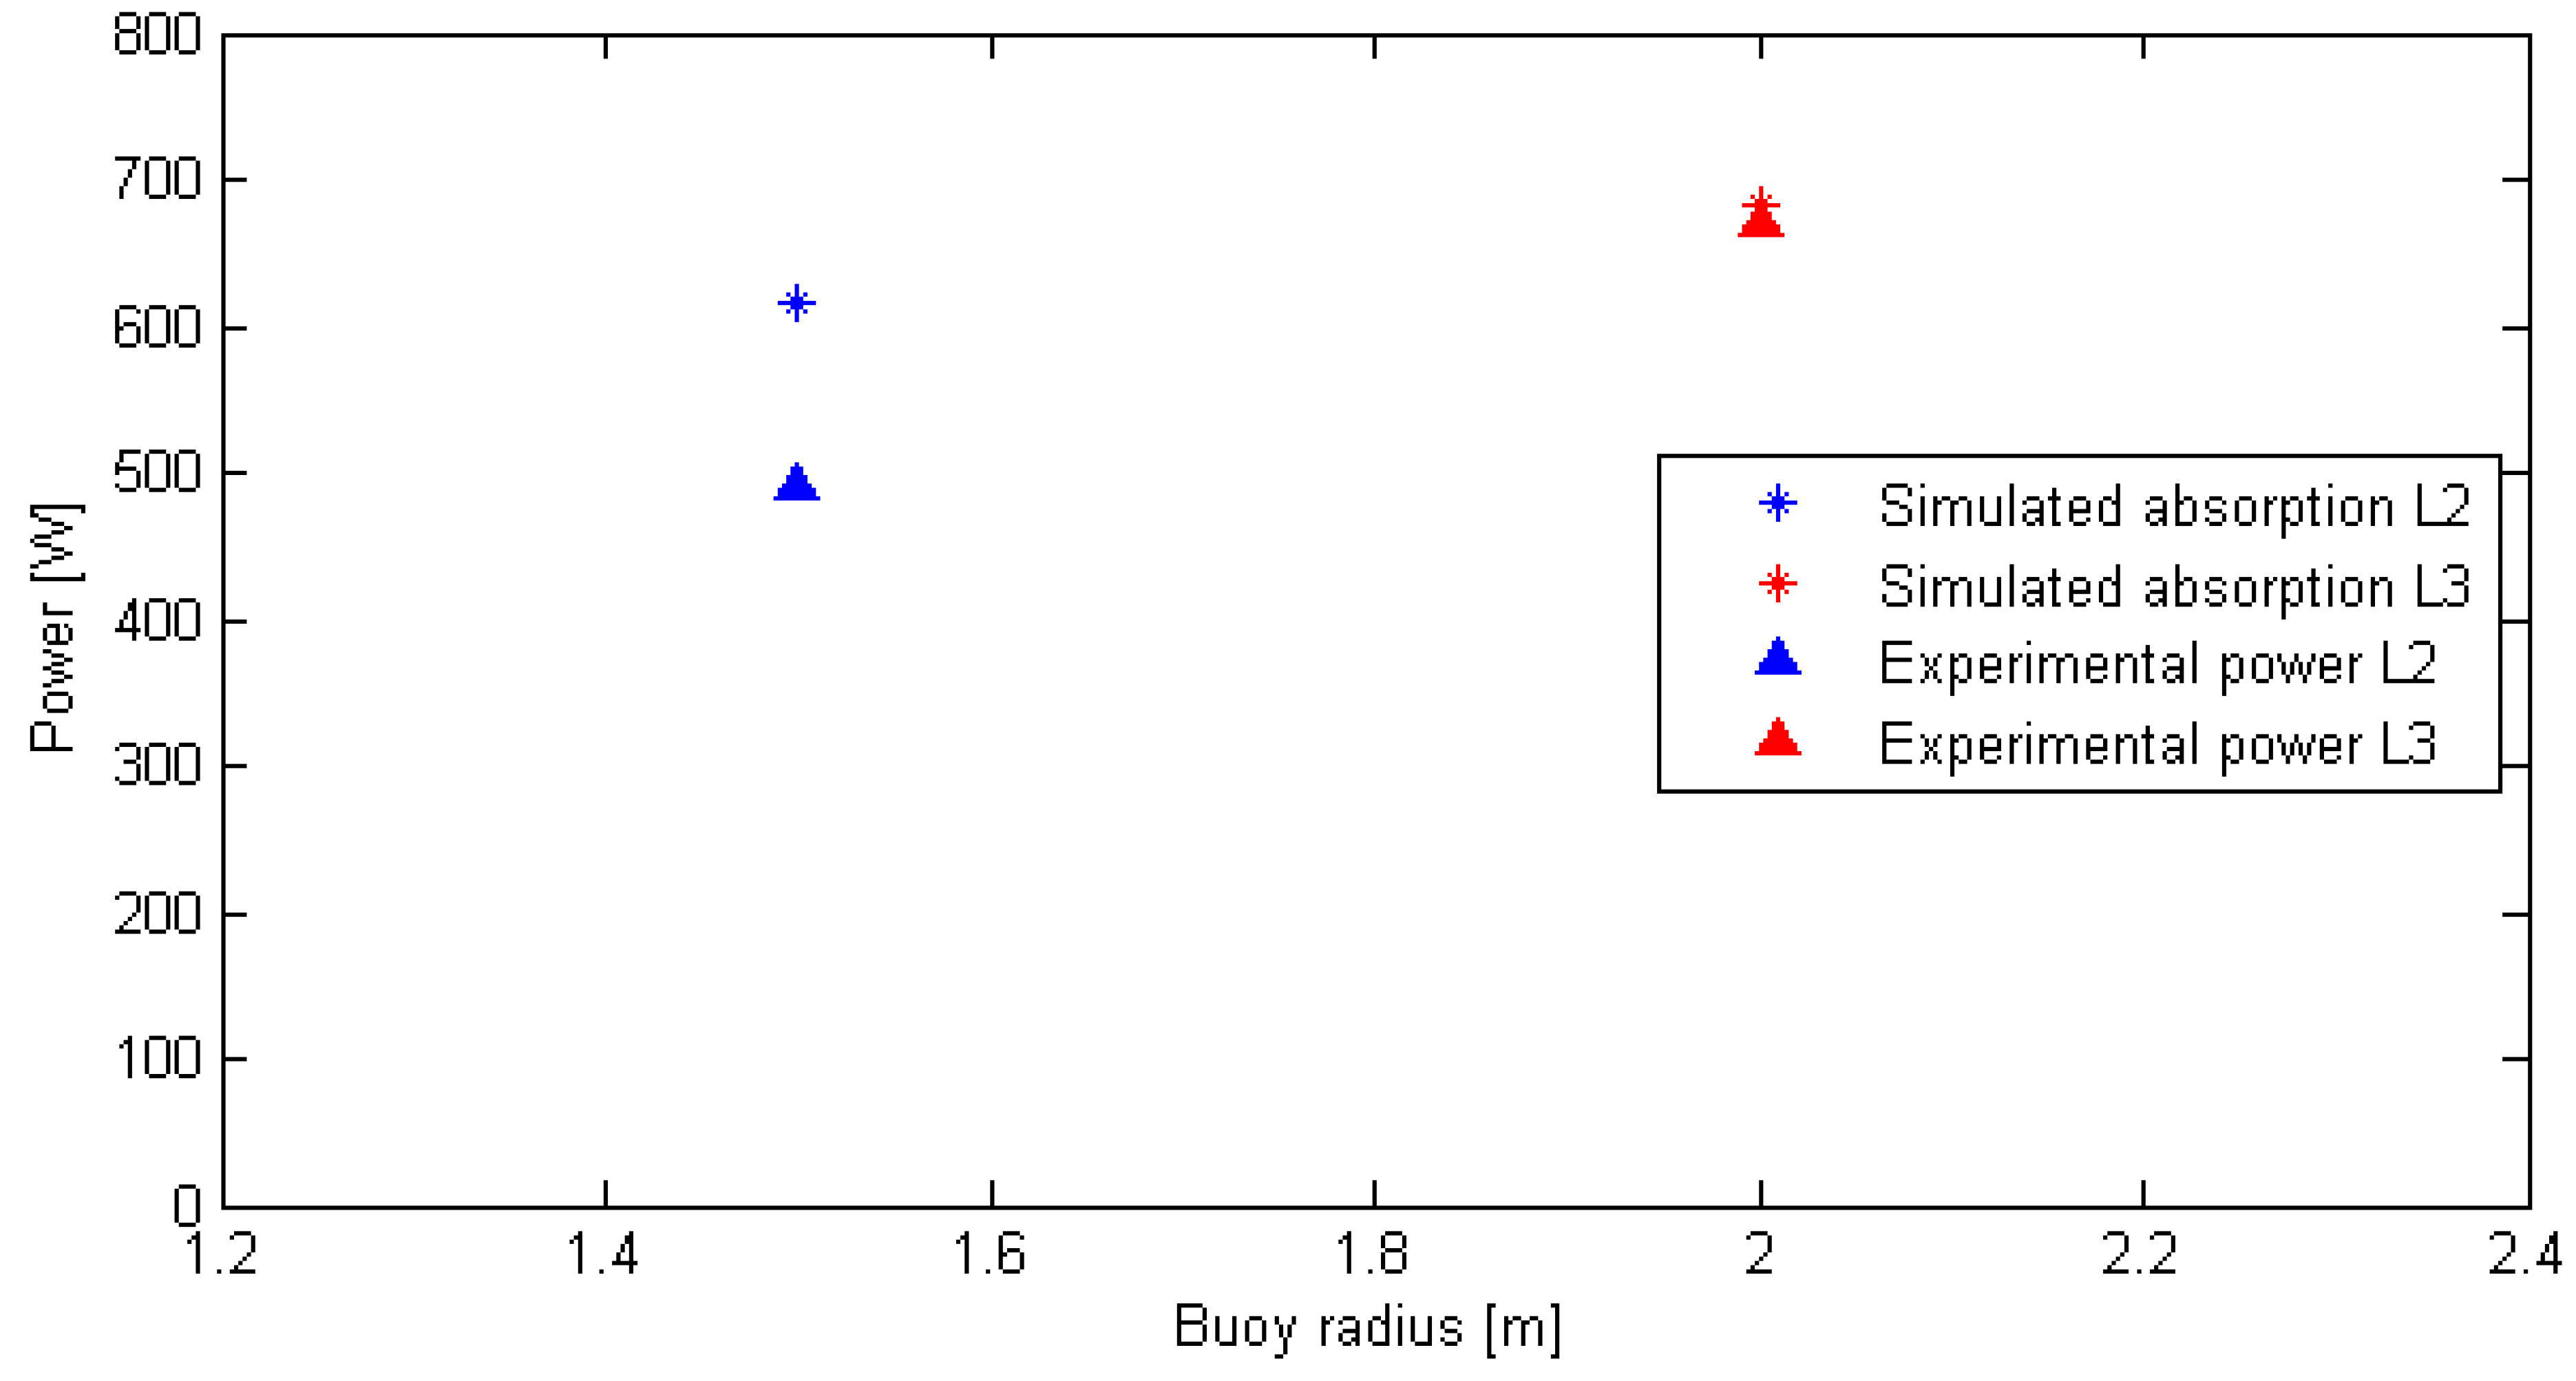
4.3. Comparing with Experiment

B was simulated for L2 and L3 with the specifications from Table 1. Since the pretension of the retraction springs varies with the sea level, the pretension was recalculated for the actual sea level (+0.2 m) and used in the simulation, see Table 2. The result was plotted in Figure 7 for comparison. L3 had a higher value of B than L2, as was expected from the experimental result since L3 had a higher average power production. The simulated value of B for L2 (gray triangle in Figure 7) is lower than the corresponding value for the simulated buoy with the same radius. This should mainly be due to the higher draft that L2 had due to the pretension in the retraction spring. L3 (black triangle in Figure 7) also has a lower value of B than the corresponding simulated buoy. This is due to the higher draft of L3 than the corresponding simulated buoy.
Figure 7. Velocity ratio B as a function of buoy radius and draft. The radius of the simulated buoy is shown, the corresponding draft to each simulated buoy has been calculated assuming a constant buoy mass, m b = 2500 kg. Simulated results of B for the WECs L2 and L3 are shown as triangles.
Jmse 02 00477 g007
Table 2. Simulated absorption and experimental power for L2 and L3.
WEC L2L3
Translator offset during experiment +0.3 m0 m
Pretension in retraction spring 11,860 N10,000 N
Damping coefficient, experimentγ74007300
Simulated average velocity v b u o y 0.23 m/s0.24 m/s
Simulated velocity 2 v b u o y 2 0.083 m 2 s 2 0.093 m 2 s 2
Velocity ratioB0.480.54
Simulated power P s i m = v b u o y 2 · γ 617 W682 W
Simulated power · Q P s i m · Q 537 W634 W
Experimental average power P e x p 490 W670 W
Deviation, simulation to experiment ( P s i m Q - P e x p ) / P e x p +9%−5%
When studying Figure 5 and Figure 6, it is clear that the higher value of B for L3 is due to the lower draft and not to the larger radius of the buoy. A higher damping factor would result in a larger difference in the value of B between L2 and L3 than with a low damping factor, since B in that case increases with the increased radius of L3 (as seen in Figure 5).
The simulated and experimental results for L2 and L3 are shown in Figure 8, and are presented in Table 2. The simulated output power is calculated as:
P = γ · | v | b u o y 2
Figure 8. The simulated and experimental power absorption of the WECs L2 and L3.
Jmse 02 00477 g008
It was expected to find that the simulated power absorption would be higher than the measured output power, since the iron losses and the mechanical losses in the generator were neglected, and the active area was considered to be 1. However, the deviation between simulated and experimental results was expected to be the same for L2 and L3. From the simulations 10% higher power was expected from L3 than from L2. But during the 30 min of experiment, L3 had 37% higher average output power than L2. This deviation between simulations and experiment can partly be explained by the offset of the translator position. During this 30 min of experiment the tide was +0.2 m, which compensated for the offset in L3, while the offset for L2 was increased. This means that L3 had no offset during the experiment while L2 had +0.3 m. The offset is decreasing the active area which according to Equation (4) will decrease the absorbed power. The impact of the active area on absorbed power has been investigated by Tyrberg et al. [21], where a factor Q was introduced to describe the expected deviation from optimal performance caused by decreased active area due to an offset. It was assumed that the integral of the function y ( t ) divided by the active stator length l s , over one period, describes the deviation from optimal performance. The factor Q was defined as:
Q = Q ( H , u ) = 1 T 0 T y ( t ) l s d t
In this paper the factor Q has been calculated in the same way: Q L 2 = 0 . 87 and Q L 3 = 0 . 93 . The Q factor is calculated analytically to compensate for the decreased active area when the stator is not completely overlapped by the translator, but it does not consider how the translator velocity is best used. Due to the wave motion, the translator velocity will be zero at the top position and the lowest position, and maximized in between. To achieve the highest energy absorption for the WEC, the top translator velocity should occur when the active area is maximized. But an offset of translator position will lead to that the top velocity will occur when the stator is not fully overlapped by the translator. This will further decrease the possible absorption of the WEC.
The factor Q was multiplied with the simulated absorbed power, and the new simulated absorption with adjustment for decreased active area was 537 W for L2 and 643 W for L3. The simulated difference between L2 and L3 is now 20%. Part of the deviation between simulation and experiment is assumed to derive from that the translator top velocity, due to the offset, occurred when the stator was not fully overlapped by the translator. However, the experimental damping factor γ was only calculated with an accuracy of ± 5 % , and the output power can never be simulated with higher accuracy than this.
It should be noted that the low power production of L2 and L3 partly depends on an unnecessarily low load, partly by the incorrect line lengths and partly on the fact that both these generators were by mistake incorrectly connected to the load, so that one of the three phases was phase shifted 180 . With the resistive loads and the inductance of the generators, a 78% higher power production can be achieved at rated translator velocity if the phases would have been connected correct.

5. Discussion

In this paper, we have made optimizations of buoy radius assuming a fixed size of the linear damper. Assuming linearity of the damper is of course a simplification though representing a modelling approach that can be considered state of the art in the wave energy area. Optimization of a wave energy converter (WEC) system should, to be optimal, contain simultaneous optimization of buoy size and damper size, but this study aims to identify details of importance regarding the size of buoy in relation to a fixed damper size. The question at hand is whether the difference in power production, which has been identified when operating identical linear generators in irregular seas, can be assigned mainly to the difference in buoy radius between the WECs, as has been previously assumed. Our results when comparing offshore experiment with simulations show that it may not and that the difference between the WECs L2 and L3 is more dependent on the buoy draft than on the radius. The largest part of the measured difference did however derive from the incorrect line lengths. That the difference did not derive from the buoy radius is a motivation for not using the capture width ratio (CWR) as a parameter of comparison, but instead defining the velocity factor B in this study.
The factor B as a velocity ratio between buoy speed and vertical water surface speed makes it transparent to which extent the absorption of power increases as a result mainly of increased damping or as a result mainly of increased oscillation velocity. By introducing the factor B, the need for scaling the available power with the buoy diameter, as is done using the CWR, is not necessary. In the comparison of heaving buoys of different radii, the B-factor, just like the absolute absorption in kW per WEC, uses an available power that is constant and only referred to through the wave energy transport, J. The factor B takes both the diameter and draft into account and thus visualizes the absorption characteristics of the concept in a way that is useful for the designer. B offers a useful tool to visualize isolated parameters, and is still possible to use for comparing performance in different sea states. When B was used to analyze the experimental data from the full scale WEC prototypes L2 and L3, the dependence on the incorrect line lengths were found, a result that was overseen in previous papers where CWR was used [22].
The length and the pretension of the buoy line upon installation should, as a starting point, be adjusted so that the translator is positioned in the middle of the stator at the conditions corresponding to mean sea level. The results presented here indicate that there is a need for better control of this parameter during the deployment procedures to ensure correct adjustment of the length of the buoy line (which determines the buoy line pretension which in turn determines the position and possible offset of the translator). Great consideration of added complexity to the construction and an increased capital expenditures in relation to increased electricity production should be taken before adding buoy line length adjustment equipment to the WECs installed, at least those installed in Swedish waters or in the Baltic Sea or elsewhere where the sea level variations are small. Such equipment is however more likely to be needed or even vital for WECs deployed off most other European coastlines exposed to larger sea level variations.

6. Conclusions

When working with improvements of a part of a dynamic system, such as buoy geometry and/or dimensions, it is important to keep a holistic view. When deciding on a buoy design, it must be remembered that the WEC performance is also dependent on both the load and the sea state in order to avoid sub-optimization. It should however also be remembered that improved performance is possible if it is known how the system will behave when the buoy is changed. In this paper, the parameters radius and draft have been studied using a velocity ratio called B, which did offer a helpful tool to visualize how the buoy geometry affects the WEC as a dynamic system. When B was used to analyze experimental results from two WECs with identical generators but different buoys, it was found that the difference in output power derived partly from the buoy draft, and not from the buoy radius. The larger part of the difference did however derive from the incorrect line lengths. Since those results were earlier overseen when the same WECs were analyzed with CWR, it has been concluded that B is to prefer over CWR when analyzing data from and when designing point absorber WECs.
It has also been concluded that there is an optimum buoy radius for each level of damping. This is a result that has been shown in part previously but rather from an analyzis of delivered or absorbed power. It has been seen that the optimal buoy radius for the 7.4 kNs/m damping is around 1.75 m. The optimal buoy radius for the 20 kNs/m damping is around 2.5 m and the optimal buoy radius for the 30 kNs/m damping is around 3 m. The trend for the 20 kNs/m and 30 kNs/m damping is that the optimum is flat and so it would not make a large difference if the buoy radius was chosen to be 2.5 m, 3 m or 3.5 m. Taking cost of manufacturing into account, one would probably choose a buoy with a radius in the lower end of that range. A buoy that is smaller will be more favourable for lower damping, while a larger buoy will be more favourable if the damping is increased. As was seen in Figure 3 and Figure 4, a higher damping would be favourable for this system, and a buoy with a larger radius should then be chosen. In this paper, increased maximum forces, fatigue and wear have not been considered.

Acknowledgments

This work was supported by the Centre for Natural Disaster Science (CNDS) in Sweden, by Beijer foundation, Swedish Research Council grant no. 821-2011-6312 and STandUP. The authors would also like to acknowledge Jens Engström for support regarding WAMIT. The authors gratefully acknowledge Cecilia Boström, Rafael Waters, Erland Strömstedt, Andrej Savin and Olle Svensson for their contribution to the experimental setup.

Author Contributions

L.S. and M.R planned the studies performed in this paper. L.S. and R.K. performed the hydromechanical simulations. L.S made the comparison between the theoretical and experimental results and analyzed the data. M.R. carried out the experiment at the Lysekil research site. V.C. performed the analysis of how long the line lengths were in the experiment. A.H. and M.R. performed electrical analysis. M.L. is the project manager of the Lysekil project.

Conflicts of Interest

The authors declare no conflict of interest.

References

  1. Palm, J.; Eskilsson, C.; Paredesy, G.M.; Bergdahl, L. CFD simulation of a moored floating wave energy converter. In Proceedings of the 10th European Wave and Tidal Energy Conference, Aalborg, Denmark, 2–5 September 2013.
  2. Cummins, W. The impulse response function and ship motions. Schiffstechnik 1962, 9, 101–109. [Google Scholar]
  3. McIver, M.; McIver, P. Water waves in the time domain. J. Eng. Math. 2011, 70, 111–128. [Google Scholar] [CrossRef]
  4. Eriksson, M.; Isberg, J.; Leijon, M. Hydrodynamic modeling of a direct drive wave energy converter. Int. J. Eng. Sci. 2005, 43, 1377–1387. [Google Scholar] [CrossRef]
  5. Engström, J.; Kurupath, V.; Isberg, J.; Leijon, M. A resonant two body system for a point absorbing wave energy converter with direct-driven linear generator. J. Appl. Phys. 2011, 110, 124904:1–124904:8. [Google Scholar] [CrossRef]
  6. Evans, D.V. A theory for wave-power absorption by oscillating bodies. J. Fluid Mech. 1975, 77(Part 1), 1–25. [Google Scholar] [CrossRef]
  7. Evans, D.V.; Jeffrey, D.C.; Salter, H.; Taylor, J.R.M. Submerged cylinder wave energy device: Theory and experiment. Appl. Ocean Res. 1979, 1, 3–12. [Google Scholar] [CrossRef]
  8. Falnes, J. Radiation impedance matrix and optimum power absorption for interacting oscillators in surface waves. Appl. Ocean Res. 1980, 2, 75–80. [Google Scholar] [CrossRef]
  9. Evans, D.V. Maximum wave-power absorption under motion constraints. Appl. Ocean Res. 1981, 3, 200–204. [Google Scholar] [CrossRef]
  10. Pizer, D.J. Maximum wave-power absorption of point absorbers under motion constraints. Appl. Ocean Res. 1993, 15, 227–234. [Google Scholar] [CrossRef]
  11. Falnes, J. A review of wave-energy extraction. Mar. Struct. 2007, 20, 185–201. [Google Scholar] [CrossRef]
  12. Falcao, A. Wave energy utilization: A review of the technologies. Renew. Sustain. Energy Rev. 2010, 14, 899–918. [Google Scholar] [CrossRef]
  13. Boström, C.; Leijerskog, E.; Tyrberg, S.; Svensson, O.; Waters, R.; Savin, A.; Bolund, B.; Eriksson, M.; Leijon, M. Experimental results from an offshore wave energy converter. J. Offshore Mech. Arct. Eng. 2010, 132. [Google Scholar] [CrossRef]
  14. Waters, R.; Rahm, M.; Eriksson, M.; Svensson, O.; Strömstedt, E.; Boström, C.; Sundberg, J.; Leijon, M. Ocean wave energy absorption in response to wave period and amplitude—Offshore experiments on a wave energy converter. IET Renew. Power Gener. 2011, 5, 465–469. [Google Scholar] [CrossRef]
  15. Waters, R.; Engström, J.; Isberg, J.; Leijon, M. Wave climate off the Swedish west coast. Renew. Energy 2009, 34, 1600–1606. [Google Scholar] [CrossRef]
  16. Eriksson, M.; Waters, R.; Svensson, O.; Isberg, J.; Leijon, M. Wave power absoption: Experiments in open sea and simulation. J. Appl. Phys. 2007, 102, 084910:1–084910:5. [Google Scholar] [CrossRef]
  17. Stålberg, M.; Waters, R.; Danielsson, O.; Leijon, M. Influence of generator damping on peak power and variance of power for a direct drive wave energy converter. J. Offshore Mech. Arct. Eng. 2008, 130, 031003:1–031003:4. [Google Scholar] [CrossRef]
  18. Hagerman, G.; Bedard, R. Guidlines for Preliminary Estimation of Power Production, by Offshore Wave Energy Conversion Devices; EPRI Report. 297213; Electric Power Research Institute: Palo Alto, California, CA, USA, 2003. [Google Scholar]
  19. Strömstedt, E.; Svensson, O.; Leijon, M. A set-up of 7 laser triangulation sensors and a draw-wire sensor for measuring relative displacementof a piston rod mechanical lead-through transmission in an offshore wave energy converter on the ocean floor. ISRN Renew. Energy 2011, 2012, 746865:1–746865:32. [Google Scholar]
  20. Mei, C.; Stiassnie, M.; Yue, D. Floating body dynamics. In Theory and Applications of Ocean Surface Waves—Part 1: Linear Aspects; Liu, P.L.-F., Ed.; World Scientific Publishing Co. Pte. Ltd.: Singapore, Singapore, 2005; pp. 337–450. [Google Scholar]
  21. Tyrberg, S.; Waters, R.; Leijon, M. Wave power absorption as a function of water level and wave height: Theory and experiment. IEEE J. Ocean. Eng. 2010, 35, 558–564. [Google Scholar] [CrossRef]
  22. Rahm, M.; Svensson, O.; Boström, C.; Waters, R.; Leiojon, M. Experimental results from the operation of aggregated wave energy converters. IET Renew. Power Gener. 2012, 6, 149–160. [Google Scholar] [CrossRef]

