
A Methodology for a Comprehensive Probabilistic Tsunami Hazard Assessment: Multiple Sources and Short-Term Interactions

Abstract
:1. Introduction
- (a)
- (b)
- (c)
- (d)
2. A Comprehensive TotPTHA Methodology
2.1. TotPTHA: The Effects of Multiple Source Types of dIfferent Potentially Tsunamigenic Source Events
- (a)
- the propagations of different tsunami waves are independent in the case of almost simultaneous events,
- (b)
- the sizes of different STs are independent in the case of triggering events (see paragraph 2.2), and
- (c)
2.2. Source Interactions and Triggering Events
- (1)
- the triggering mechanisms are independent, meaning that two or more TEs sum their effects in term of probability, but the combined effects do not result in a further amplification of the tsunami parameters at the coast;
- (2)
- only first order interactions are modeled and second order (or higher) are assumed negligible.
2.3. Catalogue Completeness and Source Representativeness
- Source representativeness (SErepres)It is related to the fact that some SEs of a given ST may be not considered in the PTHA. Given a set of SEij, we may evaluate the source representativeness for the target site computing M1/T1, where M1 is the number of tsunamis generated by the SEij and T1 is the total number of tsunamis due to that ST.For example, in the case of the seismic ST let us assume that the sources SEij (i = earthquakes, and j = 1,…, Ni numbers of events) are located in a delimited study area at given distance from a target site. In this case, the most distant seismic sources are neglected and only near sources are assumed representative of all seismic sources, meaning that the PTHA cannot be influenced by far earthquakes. However, tsunami are known to travel long distances and excluding far-field sources may lead to underestimations of the tsunami hazard. M1 is the number of tsunamis from seismic sources belonging to the study area and T1 the total number of tsunamis due to the earthquakes. If the ratio M1/T1 is close to 1, we might have chosen a good subset of all possible SEs of the STi to evaluate the PTHA at the target site. For simplicity in the example we assume that all sources are well represented with respect to one source parameter, that is the location. In a complete discussion, the source representativeness should include all other parameters describing the source (magnitude, depth, focal mechanism, fault geometry).
- Source-type representativeness (STrepres)In this case, several STs may be neglected in the PTHA. A source-type representativeness can be estimated by M2/T2 where M2 is the number of tsunami events at the target sites as reported by catalogues and and T2 is the total number of tsunami events from any possible ST.For example, in the case of different STs like earthquakes, submarine mass failures and eruptions we need to evaluate the bias introduced by neglecting sub-aerial slides and meteorites. If the number M2/T2 is close to 1, it is reasonable to neglect other STs.
- Interaction-source representativeness (TErepres)The interactions of the sources may significantly modify the PTHA, especially in short-term applications. This implies that if one (among many) interaction-source is not considered, the resulting PTHA is biased.An interaction-source representativeness can be formulated by M3/T3, where M3 is the number of tsunami due to cascade effects known by experimental or modeled interaction-source cases, and T3 the total number of all possible tsunami. However, this ratio is subject to underestimation, since the identification of all the interactions is difficult and in many cases the evaluation of T3 may be subjective ([39,40]).
2.4. Source Interactions in Long- and Short-Term TotPTHA
3. The TotPTHA Application: Naples and Ischia (Italy)
- Submarine Seismic Sources (SSSs),
- Submarine Mass Failures (SMFs).

3.1. SSSs
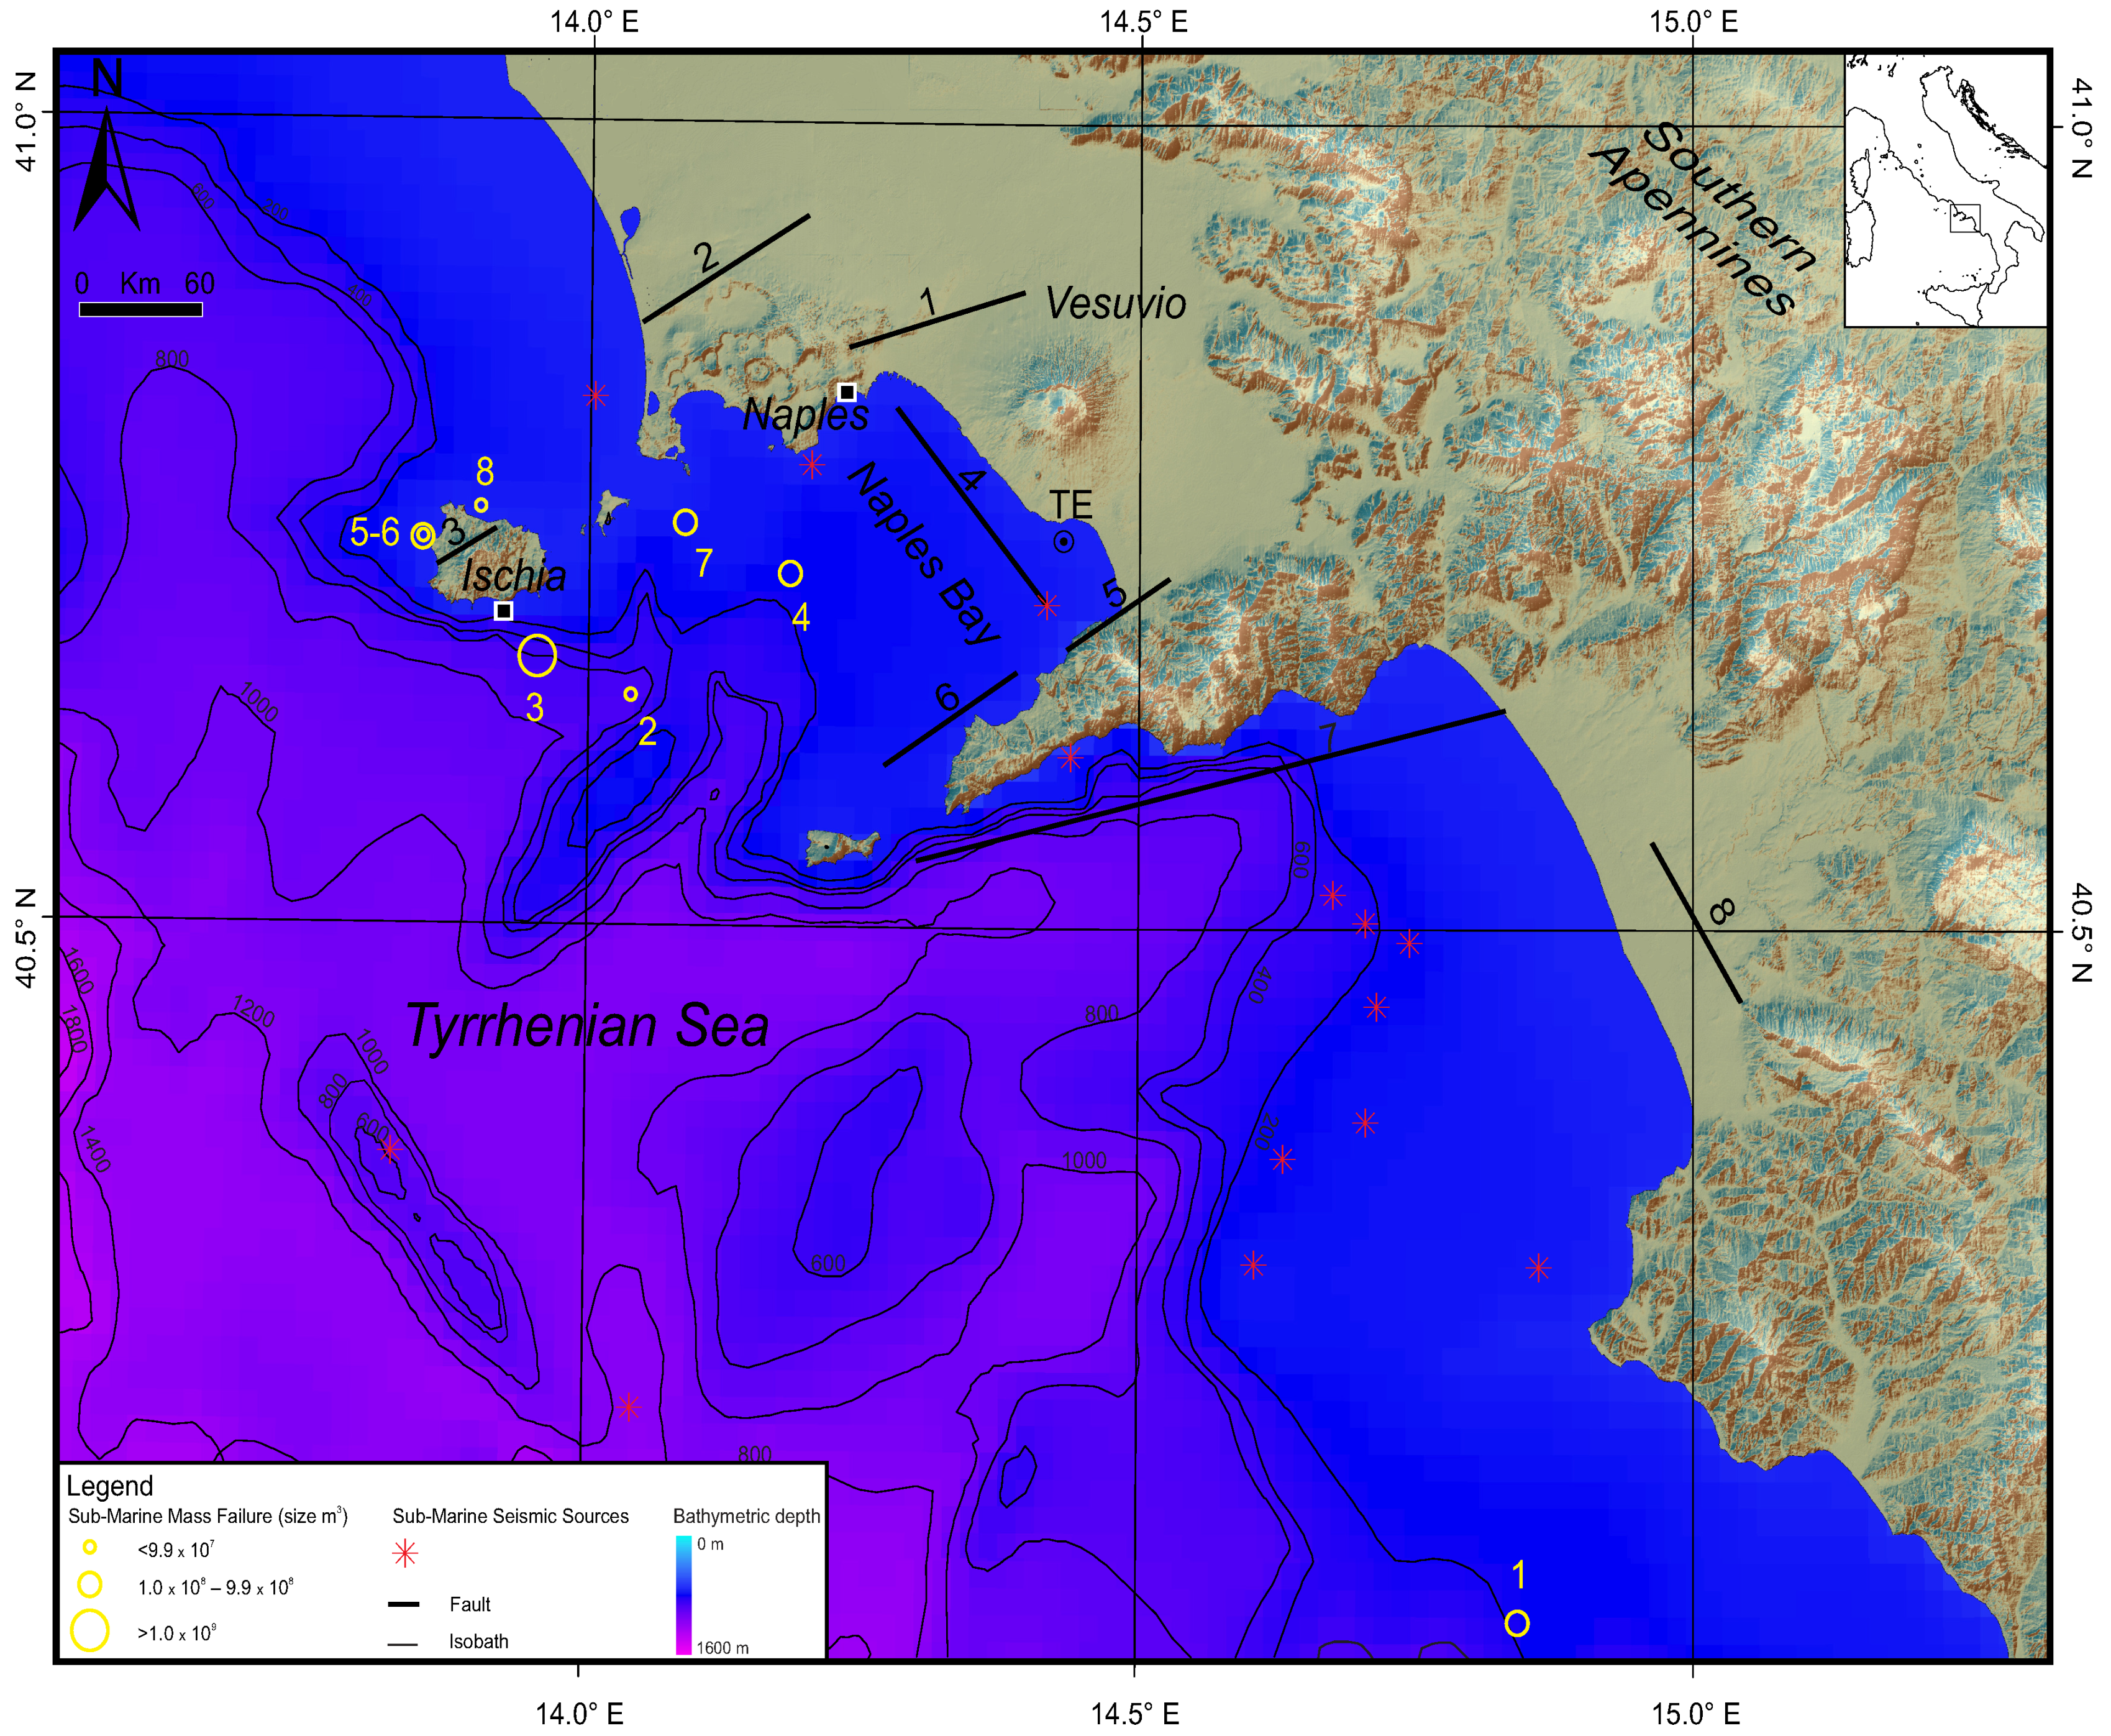
- Spatial Identification. The seismic sources are spatially identified on the active seismic areas and we consider that even small seismicity indicates the presence of major faults ([50]). So that, epicenters are defined considering the recorded seismic events. We extracted the locations of the seismic events in the application region from the Italian Seismological Instrumental and Parametric Database (ISIDe, http://iside.rm.ingv.it/) available for the period 1983–2009. From the database we selected the latitudes and longitudes of those seismic events occurred with magnitude above the completeness magnitude (Mw = 2.3) in the upper ocean crust at depth (<15 km). In the exemplified study 14 submarine earthquakes occurred in that period and their locations are the SSSs locations (Figure 1).
- Magnitudes and sizes. The moment magnitudes Mw associated to each seismic source location are hypothetic in the interval [5.5–7.5] sampled with 0.1 magnitude increment. The introduction of hypothetic magnitudes was necessary because in the ISIDe database the maximum Mw recorded in the area was 5.4 and did not caused tsunami. The lower limit was chosen considering the Mediterranean instrumental tsunami observations: a tsunami occurred in the Gulf of Corinth in 11-02-1987 ([51]) after an earthquake of 5.5 magnitude and the concomitant submarine slide. The upper limit was chosen on the basis of the background knowledge of the Tyrrhenian sismo-tectonics indicating that there are no evidence of earthquakes larger than 7.5 in this area in the last two millennia ([52]).
- Geometric Parameters. The geometric parameters of the faults are associated to each SSS location. According to the hypothetic Mw, the lengths L , widths W and slips S of the fault are scaled by Wells and Coppersmith’s formulas ([53]). To introduce a certain variability the fault parameters were sampled twice considering different values (randomly chosen) in the relative interval determined by the standard deviation of the fault parameters provided by Wells and Coppersmith. Orientation angles (strike, dip, and rake) are predefined for each location by associating the angles of the nearest submarine fault coherently with the geological/tectonic setting of the area considering also inland faults (Figure 1 and Table 1). The choice of faults is based on the current knowledge of Holocenic active faults even in terms of kinematics and geometry in the vicinity of the study area. Indeed, we considered existing catalogs of Holocenic active faults (DISS) and relevant published papers ([54,55]).
- Tsunami Initial Wave and Tsunami Wave Propagation. Two widely accepted assumptions in tsunami modeling are: (i) setting the tsunami initial condition to be equal to the vertical sea floor deformation and (ii) using the linear shallow water theory to describe tsunami propagation in deep waters, where non-linear effects are still negligible. The former is computed by Okada’s analytical formulas ([56]) using the source parameters described in the previous section. The latter solves numerically, the conservation of mass and momentum equations for an incompressible fluid expressed bywhere t is the time variable, x and y are the horizontal space coordinates, g is the gravity, D is the total water column (D = η + H, being H the average water fluid height at the undisturbed level), η is the surface water elevation and M and N are the discharged fluxes, defined as the product of the total water column D and the corresponding horizontal components of the velocity u and v directions, respectively in the x and y directions, i.e., M = Du and N = Dv. Equations (15)–(17) are used to propagate the tsunami waves in waters deeper than the 50m isoline, since in shallower water depths the contribution of the non-linear terms cannot be neglected. Similarly, the frictional terms are not included in this formulation, since their importance become relevant as the waves reach the shallower areas close to the coast.The computational grid is a regular mesh (composed by squared cells having side length = 50 m) and it has been set up by matching the GEBCO (http://www.gebco.net/) 30 arc-second bathymetry and the SRTM (http://srtm.sci.cgiar.org/) 90 meters topography datasets.The two assumptions defined above are still a powerful compromise that allows us to represent the most relevant tsunami features (i.e., the main front height and its directivity) with a relatively low computational time cost for each simulation.
- Coastal Effects and Tsunami Impact Evaluation. The final number of initial tsunami waves is NSSS = 588 according to the described SSSs. The tsunami amplification at the coast is estimated for each tsunami wave using the Green’s law based on the energy conservation law. By considering that (i) the wave front is almost parallel to the coast because wave refraction is towards the directions of the down-gradient depth and (ii) the convergence and/or divergence of the rays can be neglected we apply the formula:where H1,50 and d1,50 are respectively the tsunami amplitude and the sea depth and the suffixes 50 and 1 refer respectively to the 50 m and 1 m depth isolines. Here, run-up estimation is found by setting H1 = 1m as the last wet point, in order to avoid singularity in Equation (17). The use of the Green’s law close to the coasts is a common approach for rapid estimation of the maximum tsunami wave height for both probabilistic hazard ([11]) and warning purposes ([57]) and its good agreement with computational results has been demonstrated by [57]. Despite the limit of neglecting the wave reflection that somehow the coast may introduce, an overestimation of the run-ups resulted not relevant. As a consequence, we consider the H1 values equivalent to the run-ups Z at the coastal points of the target sites.
3.2. PSSS
- Spatial probability . The locations of the submarine epicenters associated to the instrumental records are considered equiprobable and the relative depths of the hypocenters are assigned randomly between 0 and 15 km of the crust. If necessary, the depths of the hypocenters are conveniently lowered for consistency with the Wells and Coppersmith’s formulas.
- Frequency-Size probability . Large earthquakes are less likely to occur compared to events of smaller magnitude. The SSSs frequency-size relation, known as the Gutenberg-Richter’ slaw ([58]) is computed using a large set of instrumental data in the Tyrrhenian Sea. The events are extracted from the ISIDe database (with location at sea and epicenter depths ≤ 15 km). The completeness magnitude is Mw = 2.3 for this database and the resulting b-value is equal 1.059. Each 0.1 interval of magnitude in the range [5.5–7.5] identifies a class of magnitude which is weighted using the SSSs frequency-size relation and is associated to each seismic source.
- Temporal probability . The annual probability is calculated by the Poisson occurrence that is , where λ is the annual rate of occurrence of the potential tsunamigenic SSSs and Δt is the exposure window. The λ is computed in the Tyrrhenian Sea using the ISIDe instrumental data and is 0.01059.

| Id | Fault Name | Length | Width | Min Depth, Max Depth | Strike | Dip | Rake |
|---|---|---|---|---|---|---|---|
| 1 | Posillipo 1 | 30.0 | 13.0 | 1.0, 9.8 | 74 | 60 | 270 |
| 2 | Neaples1 | 30.0 | 13.0 | 1.0, 9.8 | 74 | 60 | 270 |
| 3 | Nord Campi Flegrei 1 | 13.0 | 13.0 | 1.0, 9.8 | 58 | 60 | 270 |
| 4 | Casamicciola Terme 2 | 5.0 | 4.0 | 0.0, 3.5 | 235 | 85 | 270 |
| 5 | Castellamare 1 | 5.0 | 13.0 | 1.0, 9.8 | 58 | 60 | 270 |
| 6 | V ico Equense 1 | 15.0 | 13.0 | 1.0, 9.8 | 58 | 60 | 270 |
| 7 | Golfo di Salerno 1 | 48.0 | 13.0 | 1.0, 9.8 | 78 | 60 | 270 |
| 8 | Ponte Barizzo 1 | 10.0 | 13.0 | 1.0, 9.8 | 150 | 60 | 270 |
3.3. SMFs
- Spatial Identification. The spatial failure probability of a SMF to occur is identified on the basis of some predominant controlling factors deduced by previous background studies: (1) statistical analysis indicated that the slope angle and the depth of the centre of mass are principal controlling factors ([61]); (2) scars observations indicated that the past mass failures left unstable margins ([62]); (3) earthquake occurrences increase the slide instability ([63]).In order to compute the spatial probability, the Tyrrhenian Sea was divided in square cells of 1′. The length of the cells is of the same order of magnitude of the major slide indicated by the past events referred in Table 1. Each cell is designed by a weight that is the sum of scores that quantify the informative features. On the basis of points (1), (2) and (3) the proposed scores in the Tyrrhenian Sea are:
- (a)
- 1 in the deep basin or in the coastal zones,
- (b)
- 10 where the average depth of the cell is in the range 1000–1300 m,
- (c)
- 10 where the mean slope of the cell is between 3°–5°
- (d)
- 10 where a factor of safety indicates slide instability in the case of earthquakes,
- (e)
- 20 where the mean slope is >5°
where ϕ is the slope angle, γ and γ′ are the total and buoyant unit weights of the sediment (typical values are chosen considering the sediment distributions in the Tyrrhenian Sea by [65]), and are the horizontal and vertical ground acceleration due to the earthquakes expressed in terms of % of gravity, (=) is related to the exceeded pore pressure and the sediment thickness ζ, tan ρ′ is the coefficient of friction (ρ′ generally ranges between 20° and 35°).We simplify by eliminating the terms containing and because the vertical acceleration may be neglected. Also, the excess pore pressure is considered equal nil. This simplification does not take into account the excess pore pressure development for the slides during a seismic event ([66]). The use of the value requires a specific knowledge of the accumulated materials at sea that is not available. The case indicates instability, is the limit equilibrium and indicates stability. The horizontal peak ground acceleration (PGA) is set from the best estimate values of the Italian Hazard Map (2004 - http://zonesismiche.mi.ingv.it/). In each cell we consider the PGA values with the probability of excedence of 16% and 84% in 50 years. The correspondent median value is used in Equation (14) with the underlying assumption that such a value represents a reliable indication of the earthquake load that can increase the slide instability and the subsequent probability of mass failure. The highest scores are used for the steep slopes because often they belong to flanks of volcanic structures in the Tyrrhenian Sea. The cell weights range from 1 (the case of cells presenting low mass failure probability to occur where the slope is <3°, the depths are either <1000 m or >1300 m and the seismicity is low) up to 40 (the case of cells presenting high mass failure probability to occur where the slope gradient is sharp and the depths are between 1000 m and 1300 m in an area of high seismicity). The geological records indicating past failures are reckoned by additional weights. The increment corresponds to the number of the past SMFs (Table 2). Finally, based on the cell weights we compute by normalization the SMF probability of occurrence, that is predominant: (1) on open continental margins; (2) on the flanks of volcanic islands; and (3) in the areas of high earthquakes occurrence. - Magnitudes and sizes. The mass failure volumes V are chosen in the interval [5 × 10⁵ − 5 × 10¹⁰] m3 which was divided in 5 classes of reasonable sizes considering that the tsunami heights and run-ups are related to the volume of the slides ([67]). The classes are chosen on the basis of the past regional events. The lower class is set according to the mass failure of the Stromboli volcano in December 2002 estimated about 5 × 10⁵ m3 by [68]. The upper class is derived from historical slide sizes mapped using marine geological technique by [69]. A wide set of potential mass failures is produced associating each SMF class to each square cell of 1′ in the Tyrrhenian Sea. For practical reasons, we consider the SMF geometrical parameters in two separate dataset: slides (generally defined as thin, translational failures traveling long distances) and slumps (generally defined as thick, rotational failures occurring with minimal displacement). The slump failures span in the first 4 classes for a total number of events Nslump = 10, 000, whereas the slides span in the full range of the 5 volume classes for an equivalent number of Nslide = 10, 000. The total number of SMF events are NSMF = 20, 000.
- Geometric Parameters. On the basis of the rigid body approximation the length l, thickness s and width w deduced by the hypothetic volumes of the mass failures are the basic parameters describing the mass failures. Their regular shape is further simplified as a function of the SMF length, following [70,71]. In other words, it is s ≈ 0.01 l and w ≈ 0.25 l in the case of submarine slides, and s ≈ 0.1 l and w ≈ l in the case of submarine slumps. As a consequence, having set the mass failure volumes we simply computed the related parameters l.
- Tsunami Initial Wave and Tsunami Wave Propagation. It is calculated by empirical laws that represent approximations at the first order of the initial tsunami wave amplitude η′ ([71]) in the case of slidesand in the case of slumpwhere ϕ is the incline angle, d is the depth of the centre of mass of the submarine slide or slump, is the difference between the initial and the final angles of the centre of mass. For specific values we refer to previous application in [13].
- Coastal Effects and Tsunami Impact Evaluation. The initial wave is propagated by the empirical run-up law by [72]where ϕ′ is the average coastal sea-bottom slope angle in front of the target sites, η (=2η′) is the tsunami wave height, and d is the water depth at the source.This empirical law does not consider: (i) wave propagation effects (refraction, diffraction, etc.) and (ii) nonlinear process (breaking, dispersion, etc.). Here, we produce a first order tsunami hazard assessment of mass failures that has to be compared with the tsunami hazard assessment of the seismic type in order to apply the methodology in the region.
3.4. PSMF
- Spatial probability . The spatial domain is divided in cells where the spatial probability is calculated. The score parameters associated to each cell (see previous paragraph) are converted in spatial probability and normalized to 1, following [73].
- Frequency-Size probability . A power law is calculated for the SMFs similarly to the SSSs case by considering known submarine mass failures in the Tyrrhenian Sea ([13,74,75,76]). The corresponding b-value (= 1.3114) is computed in order to weight the mass failure classes. Considering the wide range of events the volumes of the SMFs were grouped in 4 (slump cases) or 5 (slide cases) classes weighted by the frequency-size relation.
- Temporal probability . Also in this case the annual probability is calculated by the Poisson occurrence , where λ is the annual rate of occurrence of potential tsunamigenic SMFs in the Δt exposure window. The λ is 0.013, computed using the available geological background knowledge.
| Id | SMF Name | Size m3 | Time, Years Before Present |
|---|---|---|---|
| 1 | Capo Licosa 1 | 3.2 × 10⁸ | 14,000 |
| 2 | Baia Napoli (Gaia Bank) 2 | 3.8 × 10⁶ | 15,000−6000 |
| 3 | Baia Napoli (Dohrn Canion)2 | 100 × 106 | 15,000−6000 |
| 4 | Baia Napoli (Miseno Bank) 2 | 200 × 106 | 15,000−6000 |
| 5 | Ischia Nord 3 | 15−20 × 106 | 3000−2400 |
| 6 | Ischia Sud 3 | 1.5 × 10⁹ | 23,000 |
| 7 | Ischia West 3, 4 | 80−150 × 106 | 5500 |
| 8 | Ischia West 3, 4 | 1 × 10⁶ | 5500 |
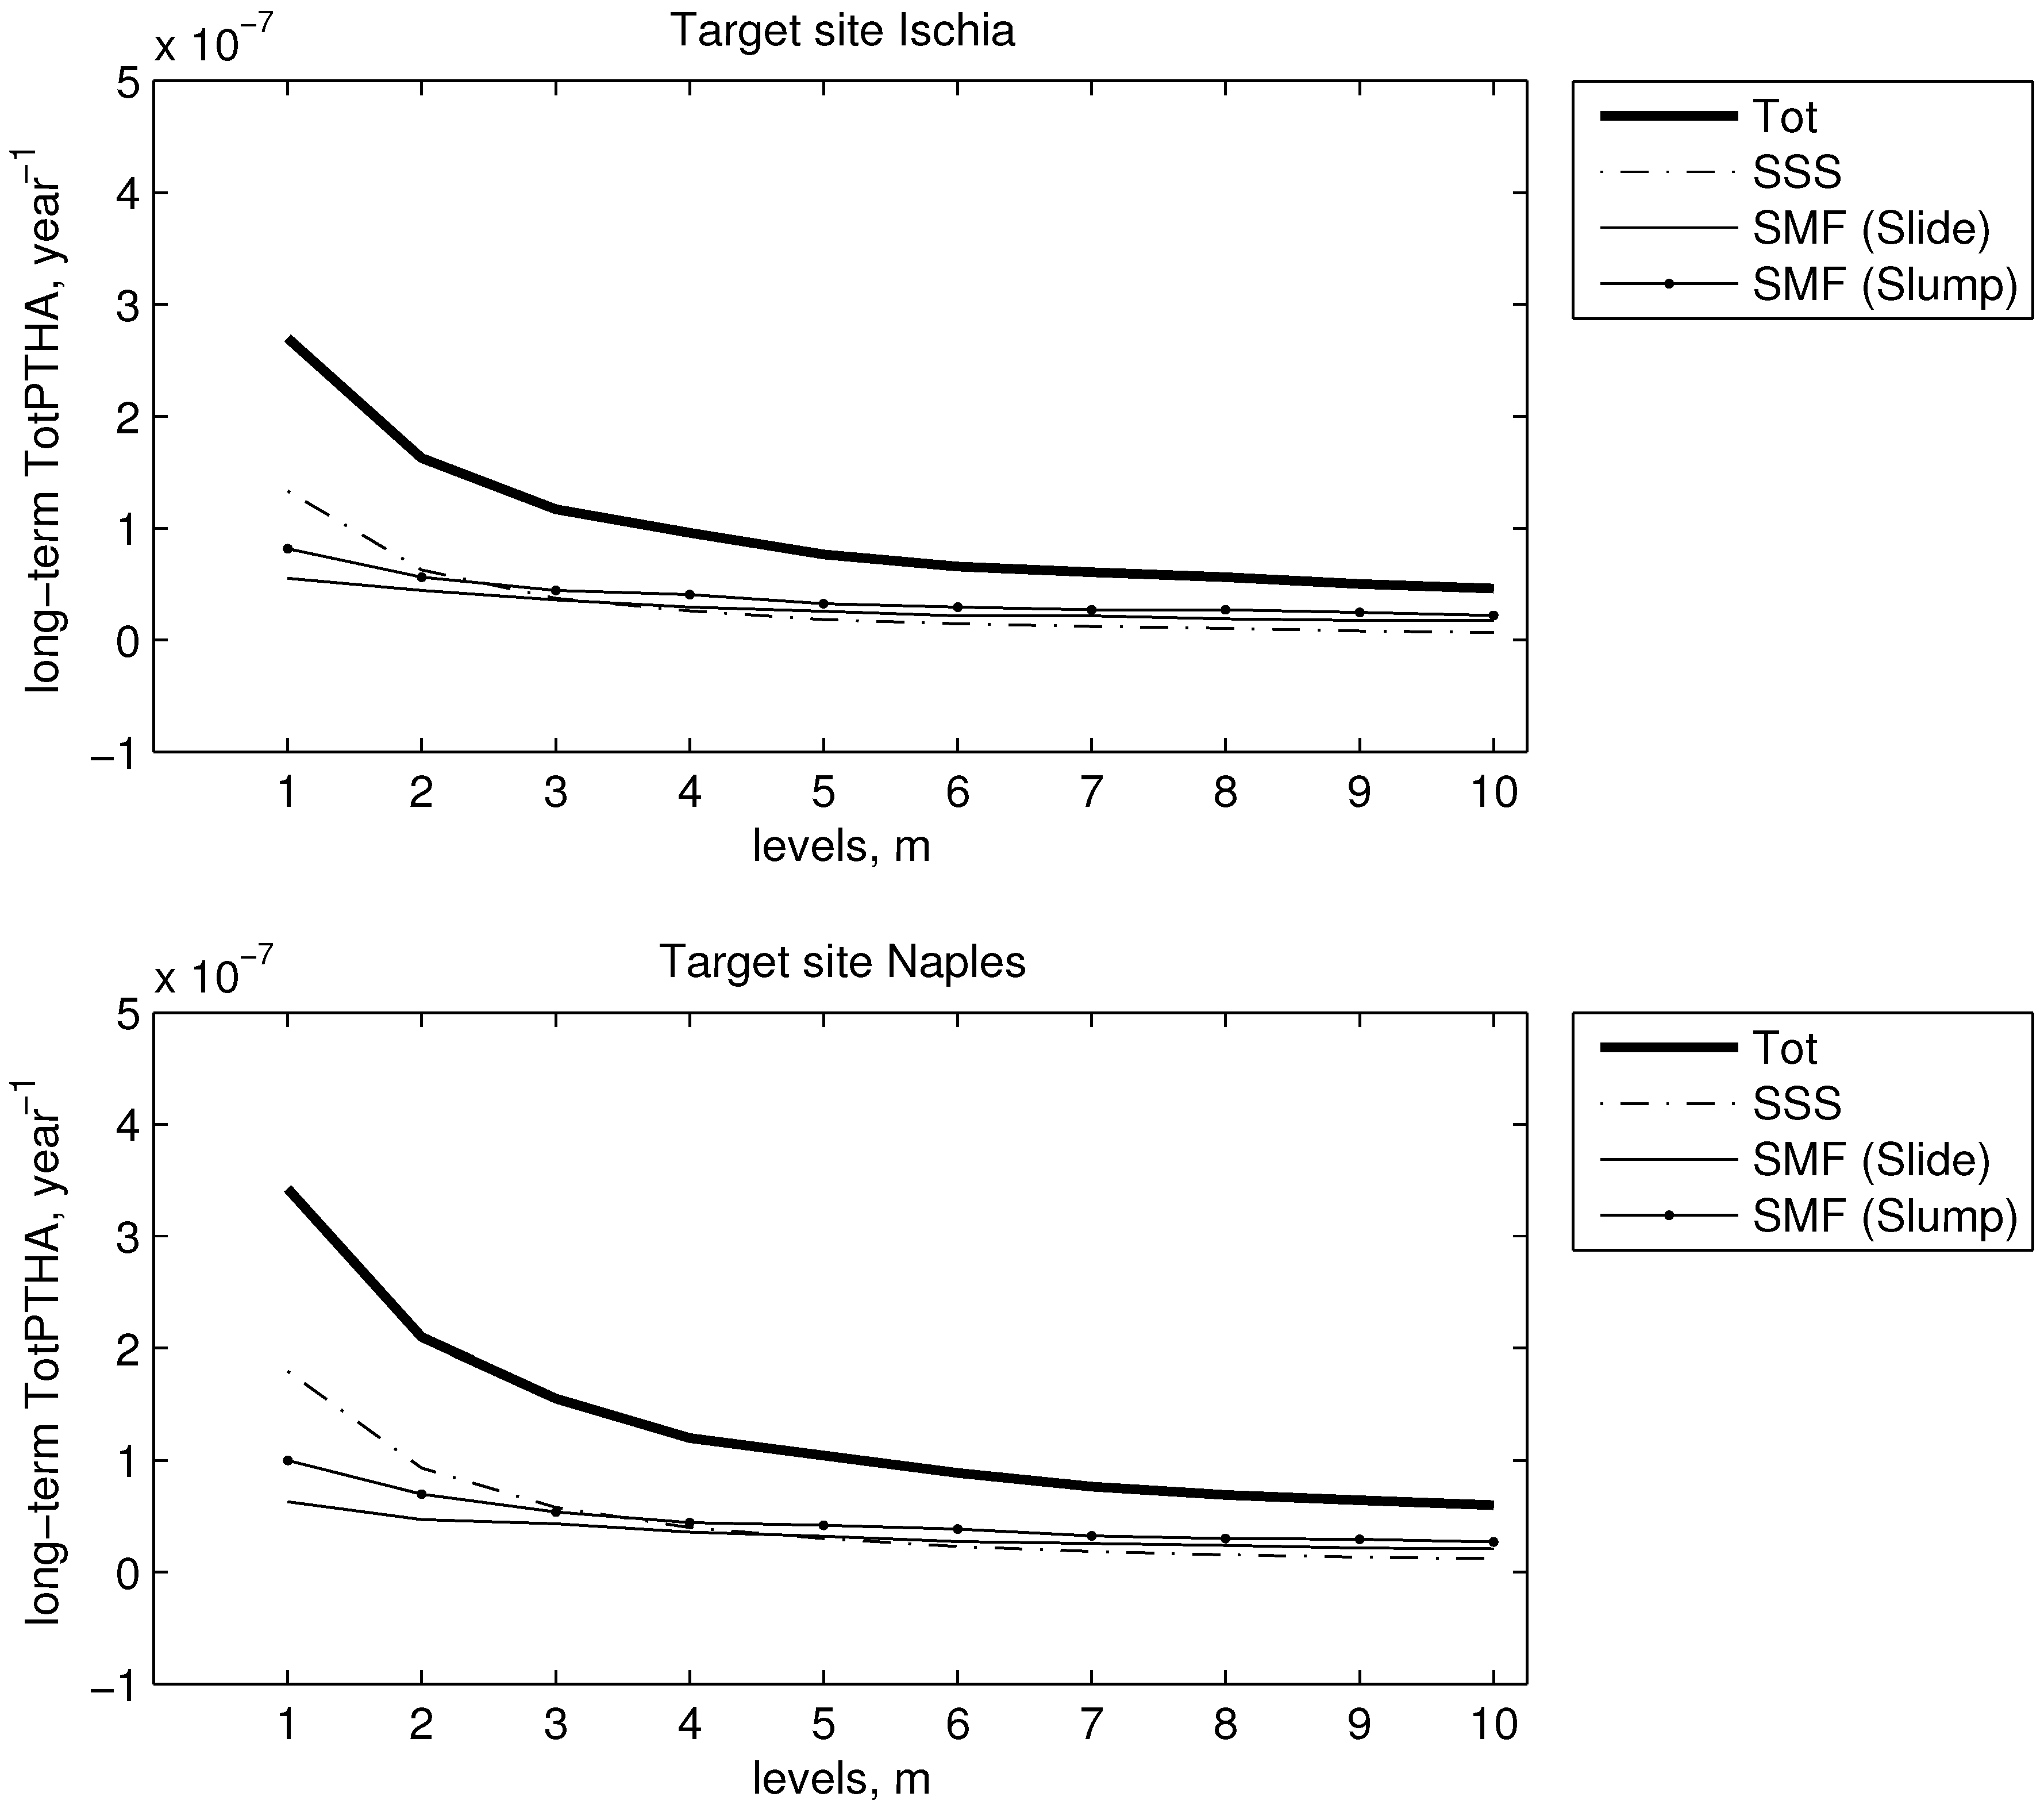
4. The TotPTHAlong-term
| Ischia: 0.5 m | 1 m | Naples: 0.5 m | 1 m | |
|---|---|---|---|---|
| SSS | 1.353 × 10⁻⁶ | 3.915 × 10⁻⁷ | 2.400 × 10⁻⁶ | 1.230 × 10⁻⁶ |
| SMF (slide) | 1.121 × 10⁻⁷ | 8.222 × 10⁻⁸ | 1.342 × 10⁻⁷ | 9.344 × 10⁻⁸ |
| SMF (slump) | 1.625 × 10⁻⁷ | 1.274 × 10⁻⁷ | 1.837 × 10⁻⁷ | 1.422 × 10⁻⁷ |
| TotPTHAlong-term | 1.627 × 10⁻⁶ | 6.011 × 10⁻⁷ | 2.718 × 10⁻⁶ | 1.466 × 10⁻⁶ |
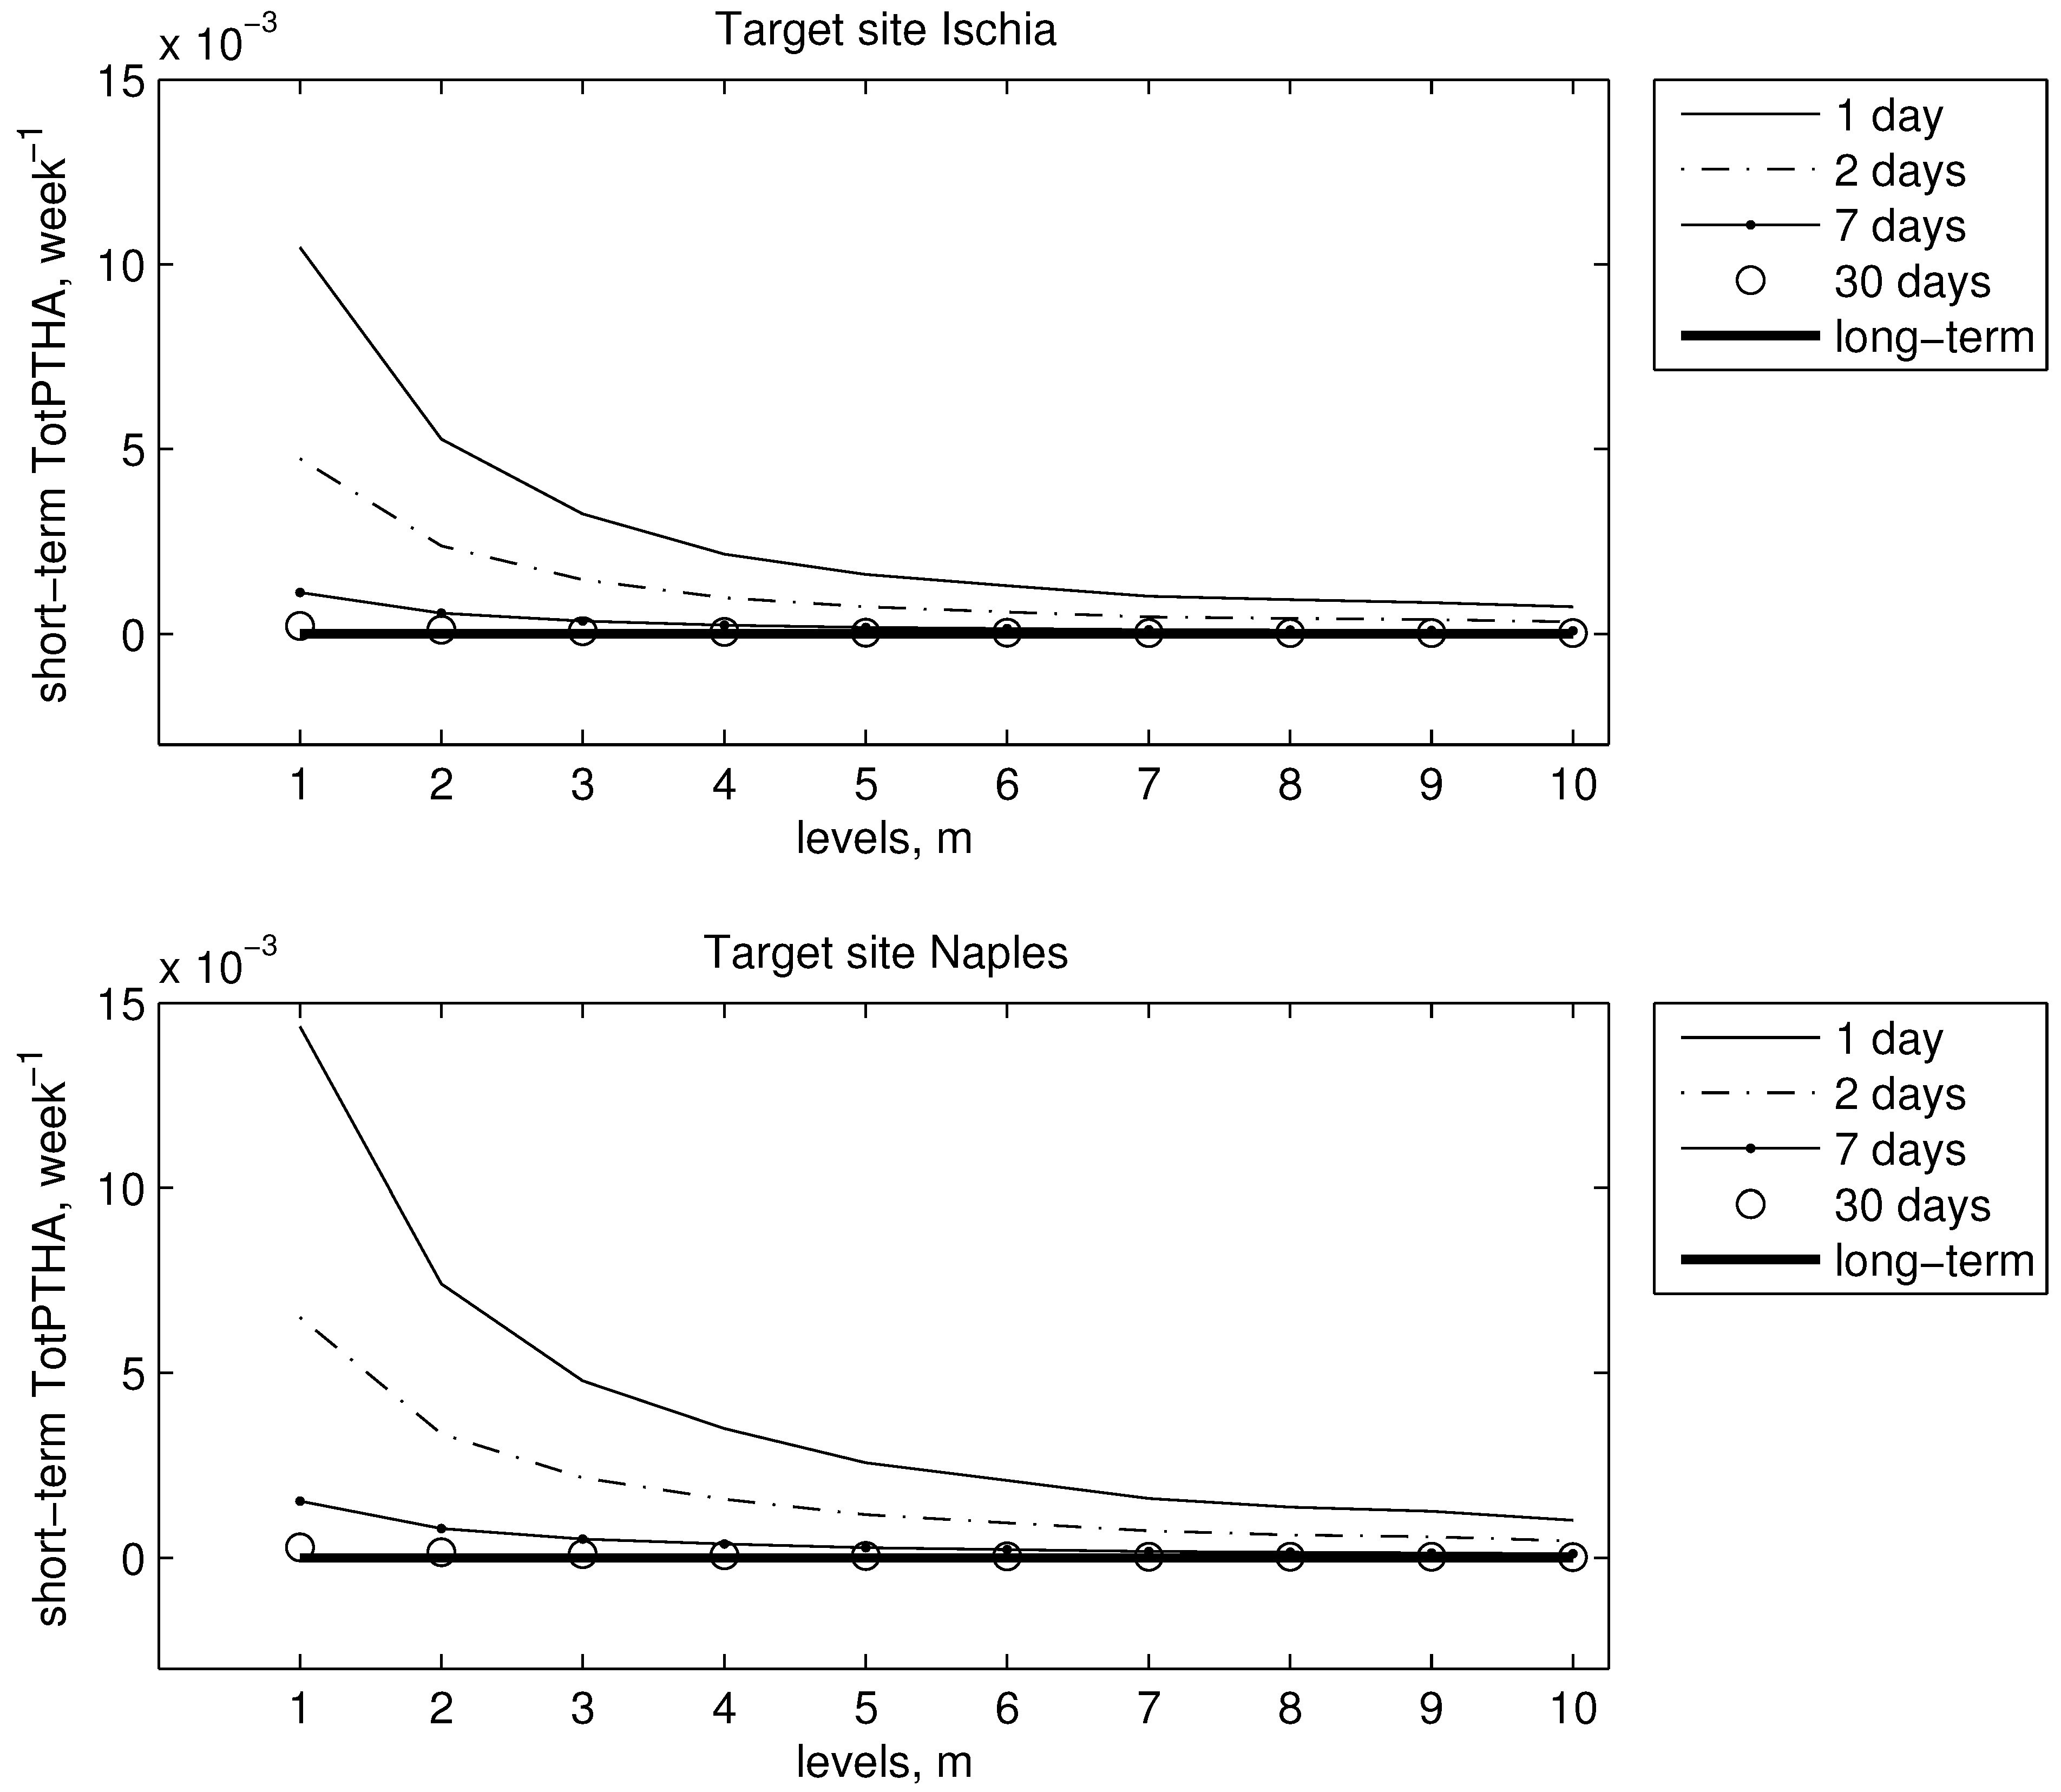
5. The TotPTHAshort-term in the Case of the TEs
| TotPTHAshort-term | Ischia: 0.5 m | 1 m | Naples: 0.5 m | 1 m |
|---|---|---|---|---|
| Day 1 | 1.624 × 10⁻² | 5.786 × 10⁻³ | 7.333 × 10⁻² | 2.412 × 10⁻² |
| Day 2 | 7.363 × 10⁻³ | 2.615 × 10⁻³ | 3.378 × 10⁻² | 1.096 × 10⁻² |
| Day 7 | 1.737 × 10⁻³ | 6.158 × 10⁻⁴ | 8.052 × 10⁻³ | 2.588 × 10⁻³ |
| Day 30 | 1.155 × 10⁻³ | 8.556 × 10⁻⁴ | 1.496 × 10⁻³ | 4.799 × 10⁻⁴ |
6. Discussion, Limitations and Further Work
7. Conclusions
- We demonstrate the applicability of the proposed comprehensive TotPTHA to treat the interactions among different tsunami hazards. Indeed, in the selected region the tsunami waves may be generated by different types of sources (near submarine seismic events SSSs and submarine mass failures SMFs) at the target sites. We computed the TotPTHAlong-term × year−1 and we show that the hazard curve increases when non-seismic STs are included in the analysis and formally considered together rather than separately;
- We compute the TotPTHAshort-term by considering a submarine earthquake as triggering event TE. In other words, a seismic event (external to the seismic dataset used to produce the hazard) acts as a perturbation of the regional seismicity. We show that the TotPTHAshort-term changes remarkably compared to the TotPTHAlong-term and increases for a limited time window (few days).
Acknowledgments
Author Contributions
Conflicts of Interest
Abbreviations/Nomenclature
| α | parameter to determine the triggering capability depending on magnitude |
| αx | horizontal ground acceleration |
| αy | vertical ground acceleration |
| β | parameter of the the Gutenberg − Rchter’s law |
| b | coefficient of the Gutenberg − Rchter’s law |
| c | parameter of the modified Omori Law |
| d | depth |
| D | height of the total water column |
| ϕ | slope and/or incline angle |
| ϕ′ | coastal sea-bottom slope angle |
| Fs | factor of safety |
| γ | total unit weight of the sediment |
| γ′ | buoyant unit weight of the sediment |
| g | gravity |
| G | parameter characterizing the spatial probability density function of the triggered event |
| H | average water fluid height |
| K | parameter of the modified Omori Law |
| λ | annual rate of occurrence |
| λ′ | rate of background |
| λETAS | rate of the triggering event |
| l | slide and/or slump length |
| L | fault length |
| M | discharged water fluxes in the eastward direction |
| M1,2,3 | number of generated tsunami events |
| Mc | magnitude threshold for Italian territory in ETAS model |
| MTE | magnitude of the triggering event |
| Mw | Moment Magnitude |
| η | tsunami surface elevation |
| η′ | tsunami wave amplitude |
| N | discharged water fluxes in the northward direction |
| Nslide | number of slides |
| Nslump | number of slumps |
| NSMF | number of Submarine Mass Failures |
| NSSS | number of Submarine Seismic Sources |
| NTE | number of Triggering Events |
| NTOT | total number of events |
| П | parameter of the modified Omori Law |
| Pi | probability |
| PSHA | Probabilistic Seismic Hazard Assessment |
| PTHA | Probabilistic Tsunami Hazard Assessment |
| PVHA | Probabilistic V olcanic Hazard Assessment |
| q | parameter characterizing the spatial probability density function |
| ρ′ | coefficient of friction |
| τi | distance between the potential tsunamigenic seismic sources and the epicenter of the triggering event |
| τu | parameter of the exceeded pore pressure |
| s | slide and/or slump thickness |
| S | slip fault |
| SI | Source Interaction |
| SE | Source Event |
| SErepres | Source Event representativeness |
| SMF | Submarine Mass Failure |
| SSS | Submarine Seismic Source |
| ST | Source Type |
| STrepres | Source Type representativeness |
| t | time |
| tob | observation time after the triggering event |
| tTE | time of the triggering event |
| Δt | exposure time window |
| T1,2,3 | number of total tsunamis |
| TE | Triggering Event |
| TotPTHA | Total Probabilistic Tsunami Hazard Assessment |
| u | x-component of the horizontal velocity |
| ue | exceeded pore pressure |
| v | y-component of the horizontal velocity |
| V | slide and/or slump volume |
| w | slide and/or slump width |
| W | fault width |
| ζ | sediment thickness |
| z | thresholds of the level run-ups |
| Z | run-ups |
References
- Liu, Y.; Santos, A.; Wang, S.M.; Shi, Y.; Liu, H.; Yuen, D.A. Tsunami hazards along Chinese Coast from potential earthquakes in South China Sea. Phys. Earth Plan. Int. 2007, 163, 233–244. [Google Scholar] [CrossRef]
- Power, W.; Downes, G.; Stirling, M. Estimation of tsunami hazard in New Zealand due to South American earthquakes. Pure Appl. Geophys. 2007, 164, 547–564. [Google Scholar] [CrossRef]
- Rikitake, B.T.; Aida, I. Tsunami hazard probability in Japan. Bull. Seismol. Soc. Am. 1988, 78, 1268–1278. [Google Scholar]
- Tonini, R.; Pagnoni, G.; Tinti, S. Modeling the 2004 Sumatra tsunami at Seychelles Islands: site-effect analysis and comparison with observations. Nat. Haz. 2014, 70, 1507–1525. [Google Scholar] [CrossRef]
- Burbidge, D.; Cummins, P.R.; Mleczko, R.; Thio, H.K. A probabilistic tsunami hazard assessment for Western Australia. Pure Appl. Geophys. 2008, 165, 2059–2088. [Google Scholar] [CrossRef]
- Burroughs, S.M.; Tebbens, S.F. Power-law scaling and probabilistic forecasting of tsunami runup heights. Pure Appl. Geophys. 2005, 162, 331–342. [Google Scholar] [CrossRef]
- Tinti, S.; Armigliato, A.; Tonini, R.; Maramai, A.; Graziani, L. Assessing the hazard related to tsunamis of tectonic origin: A hybrid statistical-deterministic method applied to Southern Italy coasts. ISET J. Earthq. Tech. 2005, 42, 189–201. [Google Scholar]
- Orfanogiannaki, K.; Papadopoulos, G. Conditional probability approach of the assessment of tsunami potential: Application in three tsunamigenic regions of the Pacific Ocean. Pure Appl. Geophys. 2007, 164, 593–603. [Google Scholar] [CrossRef]
- Geist, E.L.; Parsons, T. Probabilistic Analysis of Tsunami Hazards. Nat. Haz. 2006, 37, 277–314. [Google Scholar] [CrossRef]
- Gonzalez, F.L.; Geist, E.L.; Jaffe, B.; Kanoglu, U.; Mofjeld, H.; Synolakis, C.E.; Titov, E.E.; Arcas, D.; Bellomo, D.; Carlton, D.; et al. Probabilistic Tsunami Hazard Assessment at Seaside, Oregon, for near- and far-field seismic sources. J. Geophys. Res. 2009, 114, 1–19. [Google Scholar] [CrossRef]
- Sörensen, M.B.; Spada, M.; Babeyko, A.; Wiemer, S.; Grünthal, G. Probabilistic tsunami hazard in the Mediterranean Sea. Geophys. Res. Lett. 2012, 117, B01305. [Google Scholar] [CrossRef]
- Grezio, A.; Marzocchi, W.; Sandri, L.; Gasparini, P. A Bayesian procedure for Probabilistic Tsunami Hazard Assessment. Nat. Haz. 2010, 53, 159–174. [Google Scholar] [CrossRef]
- Grezio, A.; Sandri, L.; Marzocchi, W.; Argnani, A.; Gasparini, P. Probabilistic Tsunami Hazard Assessment for Messina Strait Area (Sicily-Italy). Nat. Haz. 2012, 64, 329–358. [Google Scholar]
- Tatsumi, D.; Calder, C.A.; Tomita, T. Bayesian near-field tsunami forecasting with uncertainty estimates. J. Geophys. Res. Oceans 2014, 119, 2201–2211. [Google Scholar] [CrossRef]
- Annaka, T.; Satake, K.; Sakakiyama, T.; Yanagisawa, K.; Shuto, N. Logic-tree approach for Probabilistic Tsunami Hazard Analysis and its applications to the Japanese Coasts. Pure Appl. Geophys. 2007, 592, 164–577. [Google Scholar]
- Heidarzaed, M.; Kijko, A. A Probabilistic Tsunami Hazard Assessment for the Makran subduction zone at the Northwestern Indian Ocean. Nat. Haz. 2011, 56, 577–593. [Google Scholar] [CrossRef]
- Grilli, S.T.; Taylor, S.O.; Baxter, C.D.P.; Maretzki, S. A probabilistic approach for determining submarine landslides tsunami hazard along the upper East Coast of the United States. Mar. Geol. 2009, 264, 74–97. [Google Scholar] [CrossRef]
- ten Brink, U.S.; Geist, E.L.; Andrews, B.D. Size distribution of submarine landslides and its implication to tsunami hazard in Puerto Rico. Geophys. Res. Lett. 2006, 33, L11307. [Google Scholar] [CrossRef]
- Gisler, G.; Weaver, R.; Mader, C.; Gittings, M. Two-dimensional simulations of explosive eruptions of Kick’emjenny and other submarine volcanoes. Sci. Tsunami Haz. 2006, 25, 34–41. [Google Scholar]
- Heinrich, P.; Mangeney, A.; Guibourg, S.; Roche, R. Simulation of water waves generated by a potential debris avalanche in Montserrat, Lesser Antilles. Geophys. Res. Lett. 1998, 25, 3697–3700. [Google Scholar] [CrossRef]
- Lövholt, F.; Pedersen, G.; Gisler, G. Oceanic propagation of a potential tsunami from the La Palma Island. J. Geophys. Res. 2008, 113, 9–26. [Google Scholar] [CrossRef]
- Mader, C. Modeling the La Palma Landslide. Sci. Tsunami Haz. 2008, 19, 150–170. [Google Scholar]
- Strunz, G.; Post, J.; Zosseder, K.; Wegscheider, S.; Muck, M.; Riedlinger, T.; Mehl, H.; Dech, S.; Birkmann, J.; Gebert, N.; et al. Tsunami risk assessment in Indonesia. Nat. Haz. Earth Syst. Sci. 2004, 11, 67–82. [Google Scholar] [CrossRef] [Green Version]
- Ward, S.N.; Day, S. Cumbre Vieja volcano � Potential collapse and tsunami at La Palma, Canary Islands. Geophys. Res. Lett. 2003a, 28, 3397–3400. [Google Scholar] [CrossRef]
- Poisson, B.; Pedreros, R. Numerical modelling of historical landslide-generated tsunamis in the French Lesser Antilles. Nat. Haz. Earth Syst. Sci. 2010, 10, 1281–1292. [Google Scholar] [CrossRef]
- Choi, B.H.; Pelinovsky, E.S.; Kim, K.O.; Lee, J.S. Simulation of the trans-oceanic tsunami propagation due to the 1883 Krakatau volcanic eruption. Nat. Haz. Earth Syst. Sci. 2003, 3, 321–332. [Google Scholar] [CrossRef]
- Ward, S.N.; Day, S. Ritter Island volcano: Lateral collapse and tsunami of 1888. Geophys. J. Int. 2003b, 154, 891–902. [Google Scholar] [CrossRef]
- Braathen, A.; Blikra, L.H.; Berg, S.; Karlsen, F. Rock-slope failures in Norway; type, geometry and hazard. Nor. J. Geol. 2004, 84, 67–88. [Google Scholar]
- Fritz, H.M.; Hager, W.H.; Minor, H.E. Lituya bay case: Rockslide impact and wave run-up. Sci. Tsunami Haz. 2001, 19, 3–22. [Google Scholar]
- Fritz, H.; Mohammed, F.; Yoo, J. Lituya Bay landslide impact generated mega-tsunami 50th anniversary. Pure Appl. Geophys. 2009, 175, 166–153. [Google Scholar]
- Harbitz, C.; Pedersen, G.; Gjevik, B. Numerical simulations of large water waves due to landslides. J. Hydr. Eng. 1993, 119, 1325–1342. [Google Scholar] [CrossRef]
- Miller, D. Giant waves in Lituya Bay, Alaska. U.S. Geol. Surv. 1960, 354-C, 51–84. [Google Scholar]
- Bondevik, S.; Lövholt, F.; Harbitz, C.; Mangerud, J.; Dawson, A.; Svendsen, J. The storegga slide tsunami comparing field observations with numerical simulations. Ormen Lange Spec. Issue Marine Petrol. Geol. 2005, 208, 22–195. [Google Scholar]
- Fine, I.V.; Rabinovich, A.B.; Bornhold, B.D.; Thompson, R.E.; Kulikov, E.A. The Grand Banks landslide-generated tsunami of November 18, 1929: Preliminary analysis and numerical modelling. Mar. Geol. 2005, 215, 45–57. [Google Scholar] [CrossRef]
- Haflidason, H.; Sejrup, H.P.; Nygard, A.; Mienert, J.; Bryn, P.; Reidar, L.; Forsberg, C.F.; Berg, K.; Masson, D. The Storegga Slide: Architecture, geometry and slide development. Mar. Geol. 2004, 213, 201–234. [Google Scholar] [CrossRef]
- Tappin, D.; Watts, P.; Grilli, S. The Papua New Guinea tsunami of 17 July 1998: Anatomy of a catastrophic event. Nat. Haz. Earth Syst. Sci. 2008, 8, 243–266. [Google Scholar] [CrossRef]
- Leonard, L.J.; Rogers, G.C.; Mazzotti, S. Tsunami hazard assessment of Canada. Nat. Haz. 2014, 70, 237–274. [Google Scholar] [CrossRef]
- Chesley, S.; Ward, S. A quantitative assessment of the human and economic hazard from impact-generated tsunami. Nat. Haz. 2006, 38, 355–374. [Google Scholar] [CrossRef]
- Marzocchi, W.; Garcia-Aristizabal, A.; Gasparini, P.; Masellone, M.L.; di Ruocco, A.; Novelli, P. Basic principles of multi-risk assessment: A case study in Italy. Nat. Haz. 2012, 62, 551–573. [Google Scholar] [CrossRef]
- Selva, J. Long-term risk assessment: Statistical treatment of interaction among risks. Nat. Haz. 2013, 67, 701–722. [Google Scholar] [CrossRef] [Green Version]
- Grünthal, G.; Thieken, A.H.; Schwarz, J.; Radtke, K.S.; Smolka, A.; Merz, B. Comparison Risk Assessments for the city of Cologne - Storm, Floods, Earthquakes. Nat. Haz. 2006, 30, 21–44. [Google Scholar] [CrossRef]
- Gusiakov, V. Tsunami History: Recorded. In The Sea; Bernard, E.N., Robinson, A.R., Eds.; Harvard University Press: Boston, MA, USA, 2009; p. 15. [Google Scholar]
- McGuire, R. Probabilistic seismic hazard analysis: Early history. Earthq. Eng. Struct. Dyn. 2008, 37, 329–338. [Google Scholar] [CrossRef]
- Marzocchi, W.; Sandri, L.; Selva, J. BET_VH: A probabilistic tool for long term volcanic hazard assessment. Bull. Volcan. 2010, 72, 705–716. [Google Scholar] [CrossRef] [Green Version]
- Cornell, C.A. Engineering seismic risk analysis. Bull. Seismol. Soc. Am. 1968, 58, 1583–1606. [Google Scholar]
- Geist, E.L.; Parson, T. Distribution of tsunami inter-event times. Geophys. Res. Lett. 2008, 35, L02612. [Google Scholar]
- Titov, V.; Moore, C.; Greenslade, D.; Pattiaratchi, C.; Badal, R.; Synolakis, C.; Kânoğlu, U. A new tool for inundation modeling: Community modeling interface for tsunamis. Pure Appl. Geophys. 2011, 168, 2121–2131. [Google Scholar] [CrossRef]
- Marzocchi, W.; Lombardi, A. A double branching model for earthquake occurrence. J. Geophys. Res. 2008, 113, B08317. [Google Scholar]
- Tinti, S.; Maramai, A.; Graziani, L. The new Catalogue of Italian Tsunamis Nat. Haz. 2004, 33, 439–465. [Google Scholar] [CrossRef]
- Helmstetter, A.; Kagan, Y.Y.; Jackson, D.D. Comparison of short-term and time-dependent earthquake forecast models for Southern California. Bull. Seism. Soc. Am. 2006, 96, 90–106. [Google Scholar] [CrossRef]
- Papadopoulos, G.A. Tsunami hazard in the eastern Mediterranean: strong earthquakes and tsunamis in the Corinth Gulf, Central Greece. Nat. Haz. 2003, 29, 437–464. [Google Scholar] [CrossRef]
- Basili, R.; Valensise, G.; Vannoli, P.; Burrato, P.; Fracassi, U.; Mariano, S.; Tiberti, M.; Boschi, E. Database of individual seismogenic sources (DISS), version 3: Summarizing 20 years of research on Italy’s earthquake geologys. Tectonophysics 2008, 20, 20–43. [Google Scholar] [CrossRef] [Green Version]
- Wells, D.L.; Coppersmith, K.J. New empirical relationships among magnitude, rupture length, rupture width, rupture area and surface displacement. Bull. Seismol. Soc. Am. 1994, 84, 974–1002. [Google Scholar]
- Ascione, A.; Caiazzo, C.; Cinque, A. Recent faulting in Southern Apennines (Italy): Geomorphic evidence, spatial distribution and implications for rates of activity. Boll. Soc. Geol. Ital. (Ital. J. Geosci.) 2007, 126, 293–305. [Google Scholar]
- Galadini, F.; Meletti, C.; Vittori, E. Major active faults in Italy: Available surficial data. Neth. J. Geosci. 2001, 80, 273–296. [Google Scholar]
- Okada, Y. Internal deformation due to shear and tensile faults in a half-space. Bull. Seismol. Soc. Am. 1982, 82, 1018–1040. [Google Scholar]
- Kamigaichi, O. Tsunami forecasting and warning. In Encyclopedia of Complexity and System Science; Springer: New York, NY, USA, 2009; pp. 9592–9617. [Google Scholar]
- Gutenberg, B.; Richter, C. Seismicity of the Earth and Associated Phenomena, 2nd ed.; Princeton University Press: Princeton, NJ, USA, 1954. [Google Scholar]
- Cinque, A.; Ascione, A.; Caiazzo, C. Distribuzione spazio-temporale e caratterizzazione della fagliazione quaternaria in Appennino meridionale. Volume: Le ricerche del GNDT nel campo della pericolosita’ sismica (1996–1999). A cura di Galadini 2003, 160, 1–16. [Google Scholar]
- DISS-Working-Group. Database of individual seismogenic sources (DISS), version 3.1.1: A compilation of potential sources for earthquakes larger than M 5.5 in Italy and surrounding areas. INGV 2010 - Istituto Nazionale di Geofisica e Vulcanologia - All rights reserved. Available online: http://diss.rm.ingv.it/diss/ (accessed on 1 March 2012). [CrossRef]
- Masson, D.; Harbitz, C.; Wynn, R.; Pedersen, G.; Lovholt, F. Submarine landslides: processes, triggers and hazard prediction. Phil. Trans. R. Soc. A 2006, 364, 2009–2039. [Google Scholar] [CrossRef] [PubMed]
- Martel, S. Mechanism of landslide initiation as a shear fracture phenomenon. Mar. Geol. 2004, 203, 319–339. [Google Scholar] [CrossRef]
- Biscontin, G.; Pestana, J.; Nadim, F. Seismic triggering of submarine slides in soft cohesive soil deposits. Mar. Geol. 2004, 354, 203–341. [Google Scholar] [CrossRef]
- Booth, J.; Sangrey, D.; Fugate, J. A nomogram for interpreting slope stability of fine-grained deposits in modern and ancient marine environments. J. Sediment Petrol. 1985, 36, 29–36. [Google Scholar] [CrossRef]
- Kastens, K.; Mascle, J.; Auroux, C.; Bonatti, E.; Broglia, C.; Channel, J.; Curzi, P.; Emeis, K.; Glacon, G.; Hasegawa, S.; et al. ODP leg 107 in the Tyrrhenian Sea: Insights into passive margin and back-arc basin evolution. Geol. Soc. Am. Bull. 2012, 7, 1140–1156. [Google Scholar] [CrossRef]
- Biscontin, G.; Pestana, J.M. Factors affecting seismic response of submarine slopes Nat. Haz. Earth Syst. Sci. 2006, 6, 97–107. [Google Scholar] [CrossRef]
- Murty, T.S. Tsunami wave height dependence on landslide volume. Pure Appl. Geophys. 2003, 160, 2147–2153. [Google Scholar] [CrossRef]
- Calvari, S.; Spampinato, L.; Lodato, L.; Harris, A.L.; Patrick, M.; Dehn, J.B.; Andronico, D. Chronology and complex volcanic processes during the 2002–2003 flank eruption at Stromboli volcano (Italy) reconstructed from direct observations and surveys with a handheld thermal camera. J. Geophys. Res. 2005, 110, B02201. [Google Scholar] [CrossRef]
- Fabbri, A.; Gallignani, P.; Zitellini, N. Geologic Evolution of the Peri-Tyrrhenian Sedimentary Basins; Wezel, F.C., Ed.; Sedimentary basins of the Mediterranean margins, Technoprint: Bologna, Italy, 1981; pp. 101–126. [Google Scholar]
- Grilli, S.T.; Watts, P. Tsunami generation by submarine mass failure. I: Modeling, experimental validation, and sensitivity analyses. J. Waterway Port Coast. Ocean Eng. 2005, 131, 283–297. [Google Scholar]
- Watts, P.; Grilli, M.; Tappin, D.R.; Fryer, G.J. Tsunami generation by submarine mass failure. II: Predictive equations and case studies. J. Waterway Port Coast. Ocean Eng. 2005, 131, 298–310. [Google Scholar]
- Synolakis, C.E. The run-up of solitary waves. J. Fluid Mech. 1987, 185, 523–545. [Google Scholar] [CrossRef]
- Selva, J.; Orsi, G.; di Vito, M.; Marzocchi, W.; Sandri, L. Probability hazard map for future vent opening at the Campi Flegrei caldera, Italy. Bull. Volcanol. 2012, 74, 497–510. [Google Scholar] [CrossRef]
- Milia, A.; Torrente, M.; Giordano, F. Gravitational instability of submarine volcanoes offshore Campi Flegrei (Naples Bay, Italy). In Volcanism in the Campania Plain: Vesuvius, Campi Flegrei and Ignimbrites; De Vivo, B., Ed.; Elsevier, Developments in Volcanology, Universita’ di Napoli Federico II: Naples, Italy, 2006; pp. 69–83. [Google Scholar]
- de Alteriis, G.; Insinga, D.; Morabito, S.; Morra, V.; Chiocci, F.; Terrasi, F.; Lubritto, C.; di Benedetto, C.; Pazzanese, M. Age of submarine debris avalanches and tephrostratigraphy offshore Ischia Island, Tyrrhenian Sea, Italy. Marine Geol. 2010, 278, 1–18. [Google Scholar] [CrossRef]
- Della Seta, M.; Marotta, E.; Orsi, G.; de Vita, S.; Sansivero, F.; Fredi, P. Slope instability induced by volcano-tectonics as an additional source of hazard in active volcanic areas: The case of Ischia Island (Italy). Bull. Volcanol. 2012, 106, 74–79. [Google Scholar] [CrossRef]
- Kagan, Y. Likelihood analysis of earthquake catalogues. Geophys. J. Int. 1991, 106, 135–148. [Google Scholar] [CrossRef]
- Kagan, Y.; Knopoff, L. Stocastic synthesis of earthquake catalogues. Geophys. J. Int. 1981, 86, 2853–2862. [Google Scholar] [CrossRef]
- Ogata, Y. Statistical models for earthquake occurrences and residual analysis for point processes. J. Am. Statist. Assoc. 1988, 83, 9–27. [Google Scholar] [CrossRef]
- Ogata, Y. Space-time-point-process for earthquake occurence. Ann. Inst. Statist. Math. 1998, 50, 379–402. [Google Scholar] [CrossRef]
- Console, R.; Murru, M.; Lombardi, A. Refining earthquake clustering models. J. Geophys. Res. 2003, 108, 2468–2473. [Google Scholar] [CrossRef]
- Lombardi, A.M.; Marzocchi, W. Evidence of clustering and non-stationarity in the time distribution of large worldwide earthquakes. J. Geophys. Res. 2007, 112, B02303. [Google Scholar]
- Omori, F. On the aftershocks of earthquakes. J. Coll. Sci. Imp. Univ. Tokio 1894, 7, 111–120. [Google Scholar]
- Utsu, T. A statistical study on the occurrence of aftershocks. Geophys. Mag. 1961, 30, 521–605. [Google Scholar]
- Lombardi, A.M.; Marzocchi, W. The ETAS model for daily forecasting of Italian seismicity in the CSEP experiment. Ann. Geophys. 2010, 53, 3. [Google Scholar]
- Chiocci, F.L.; de Alteriis, G. The Ischia debris avalanche: First clear submarine evidence in the Mediterranean of a volcanic island prehistorical collapse. Terra Nova 2006, 18, 202–209. [Google Scholar] [CrossRef]
- Tinti, S.; Chiocci, F.L.; Zaniboni, F.; Pagnoni, G.; de Alteriis, G. Numerical simulation of the tsunami generated by a past catastrophic landslide on the volcanic Island of Ischia, Italy. Mar. Geophys. Res. 2011, 32, 287–297. [Google Scholar] [CrossRef]
- Okal, E.A.; Synolakis, C.E. Source discriminants for near-field tsunamis. Geophys. J. Int. 2004, 158, 899–912. [Google Scholar] [CrossRef]
© 2015 by the authors; licensee MDPI, Basel, Switzerland. This article is an open access article distributed under the terms and conditions of the Creative Commons Attribution license ( http://creativecommons.org/licenses/by/4.0/).
Share and Cite
Anita, G.; Tonini, R.; Sandri, L.; Pierdominici, S.; Selva, J. A Methodology for a Comprehensive Probabilistic Tsunami Hazard Assessment: Multiple Sources and Short-Term Interactions. J. Mar. Sci. Eng. 2015, 3, 23-51. https://doi.org/10.3390/jmse3010023
Anita G, Tonini R, Sandri L, Pierdominici S, Selva J. A Methodology for a Comprehensive Probabilistic Tsunami Hazard Assessment: Multiple Sources and Short-Term Interactions. Journal of Marine Science and Engineering. 2015; 3(1):23-51. https://doi.org/10.3390/jmse3010023
Chicago/Turabian StyleAnita, Grezio, Roberto Tonini, Laura Sandri, Simona Pierdominici, and Jacopo Selva. 2015. "A Methodology for a Comprehensive Probabilistic Tsunami Hazard Assessment: Multiple Sources and Short-Term Interactions" Journal of Marine Science and Engineering 3, no. 1: 23-51. https://doi.org/10.3390/jmse3010023