
A Numerical Modelling Study on the Potential Role of Tsunamis in the Biblical Exodus

Abstract
:1. Introduction

2. Materials and Methods
2.1. Model Description

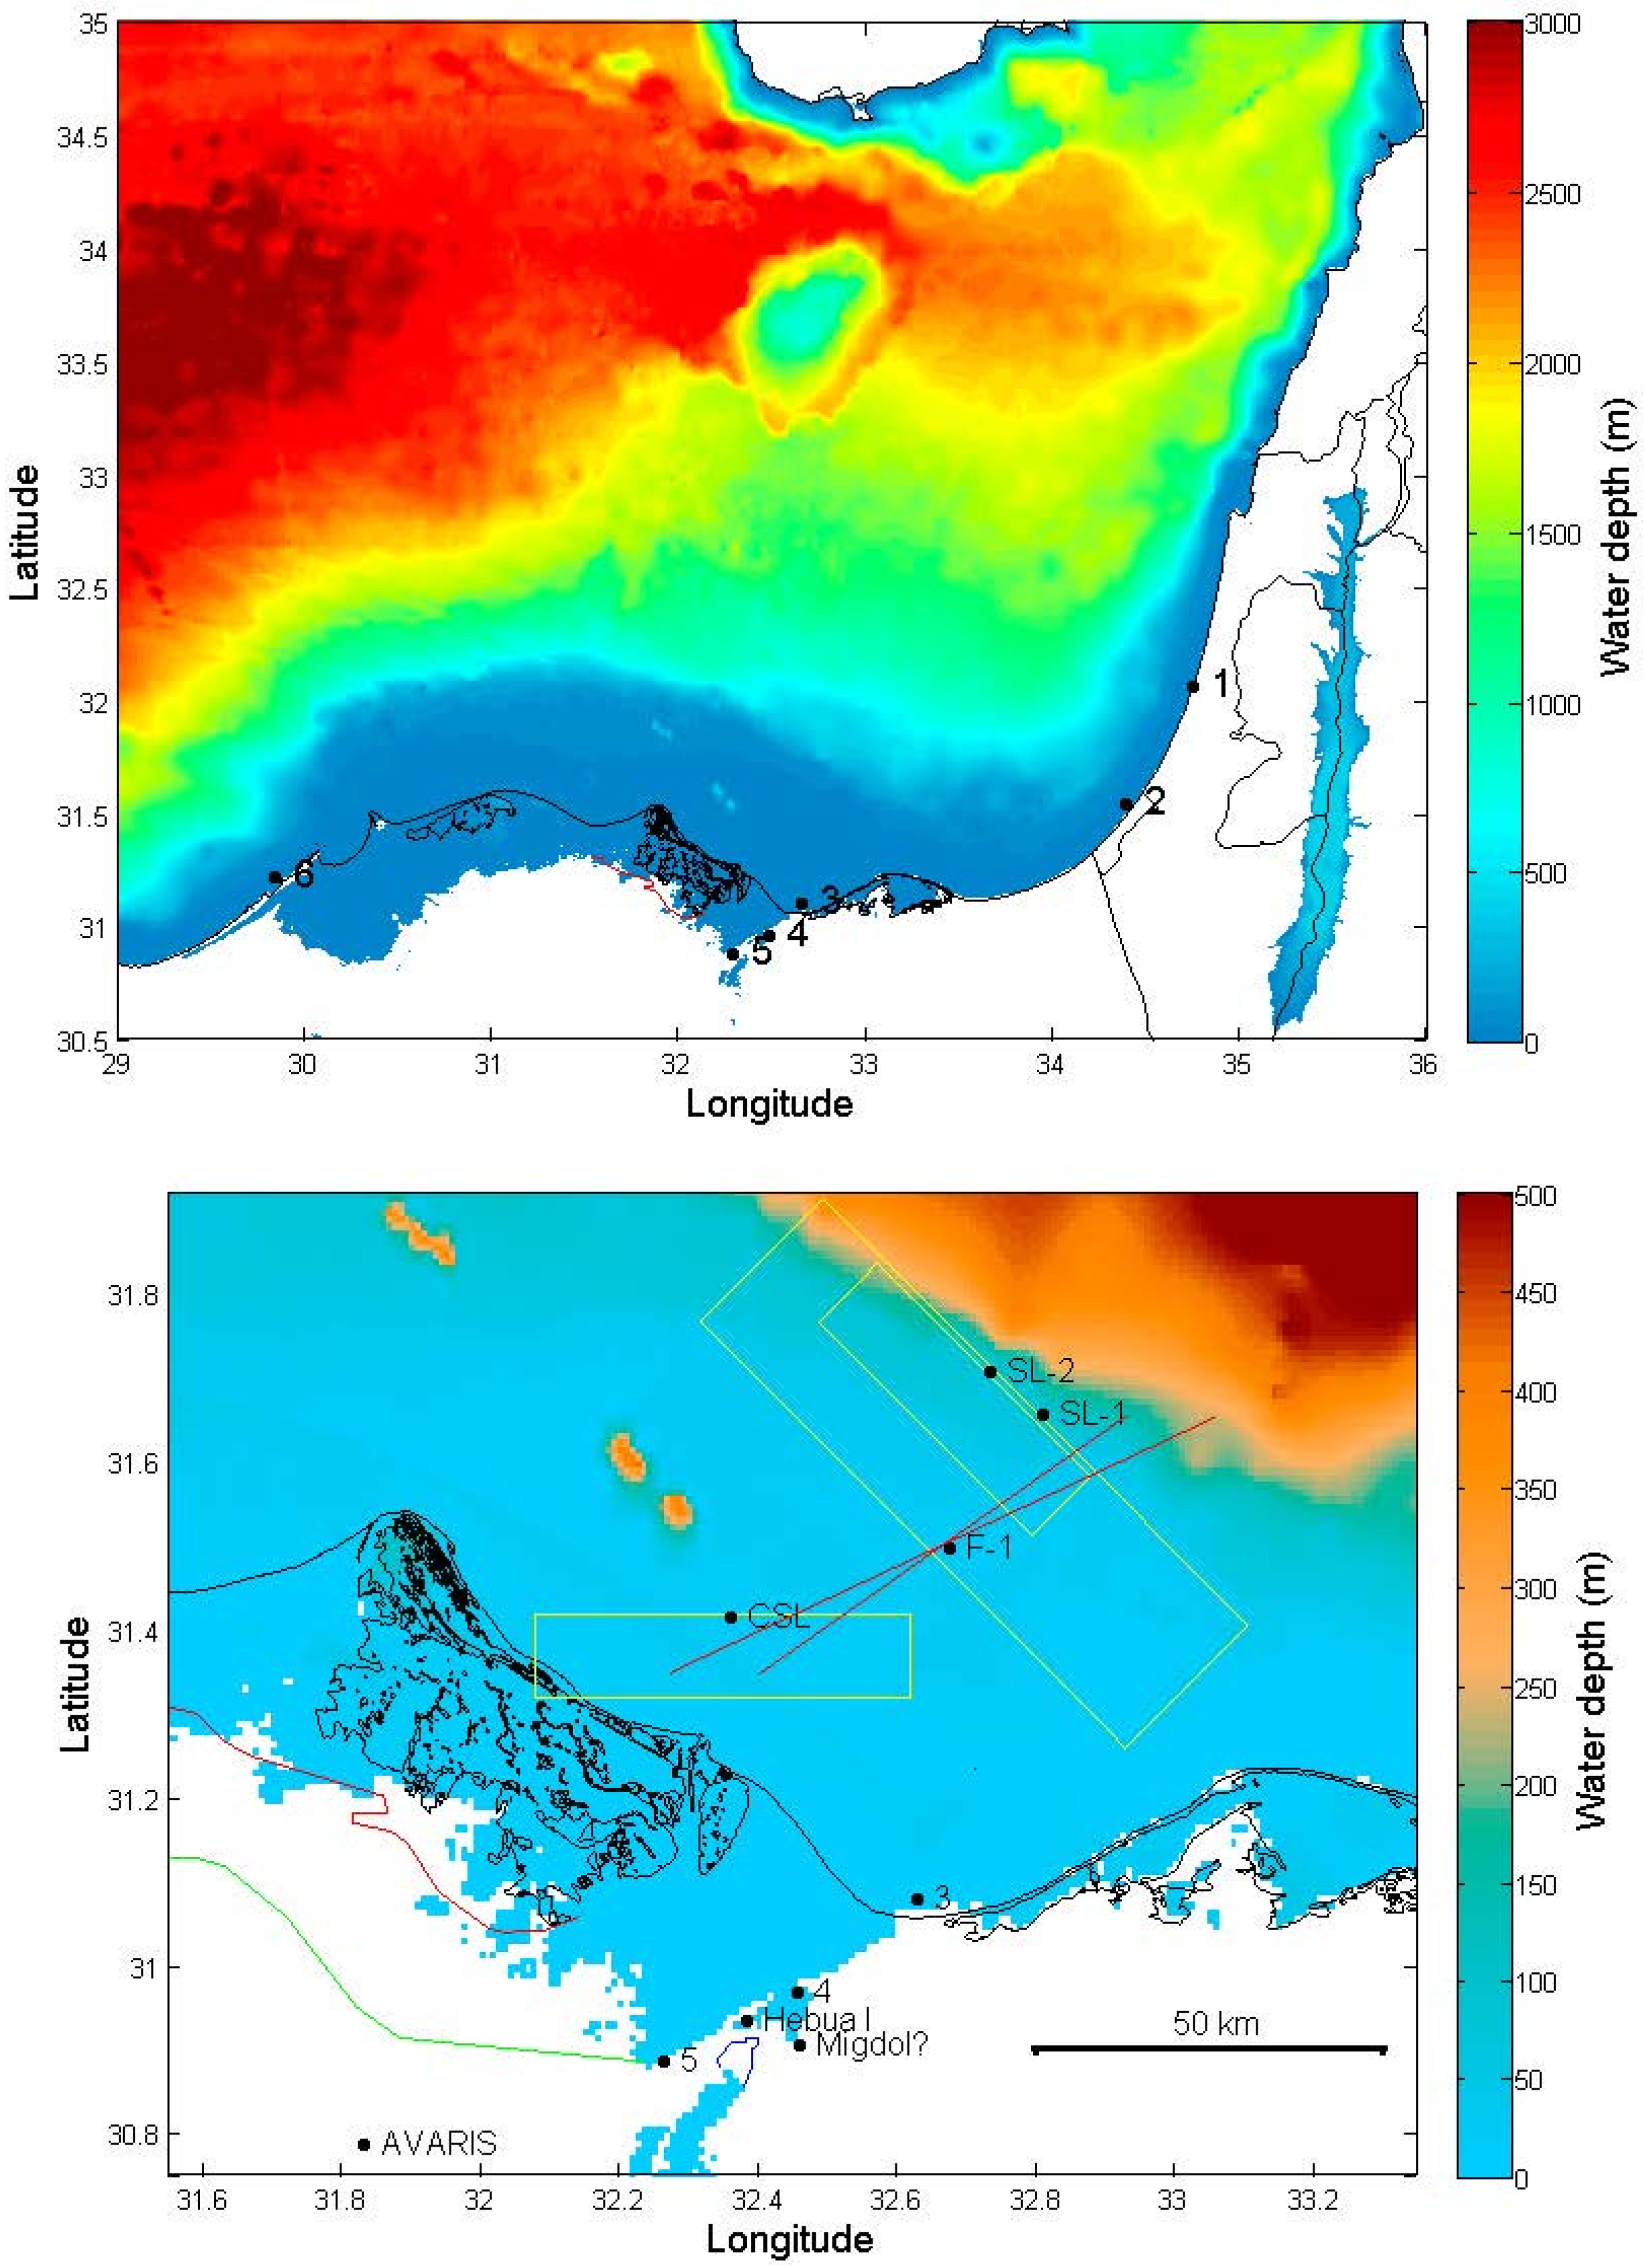
2.2. Model Domain and Bathymetric Map of the Former Eastern Nile Delta

2.3. Tsunamingenic Sources in the Eastern Nile Delta

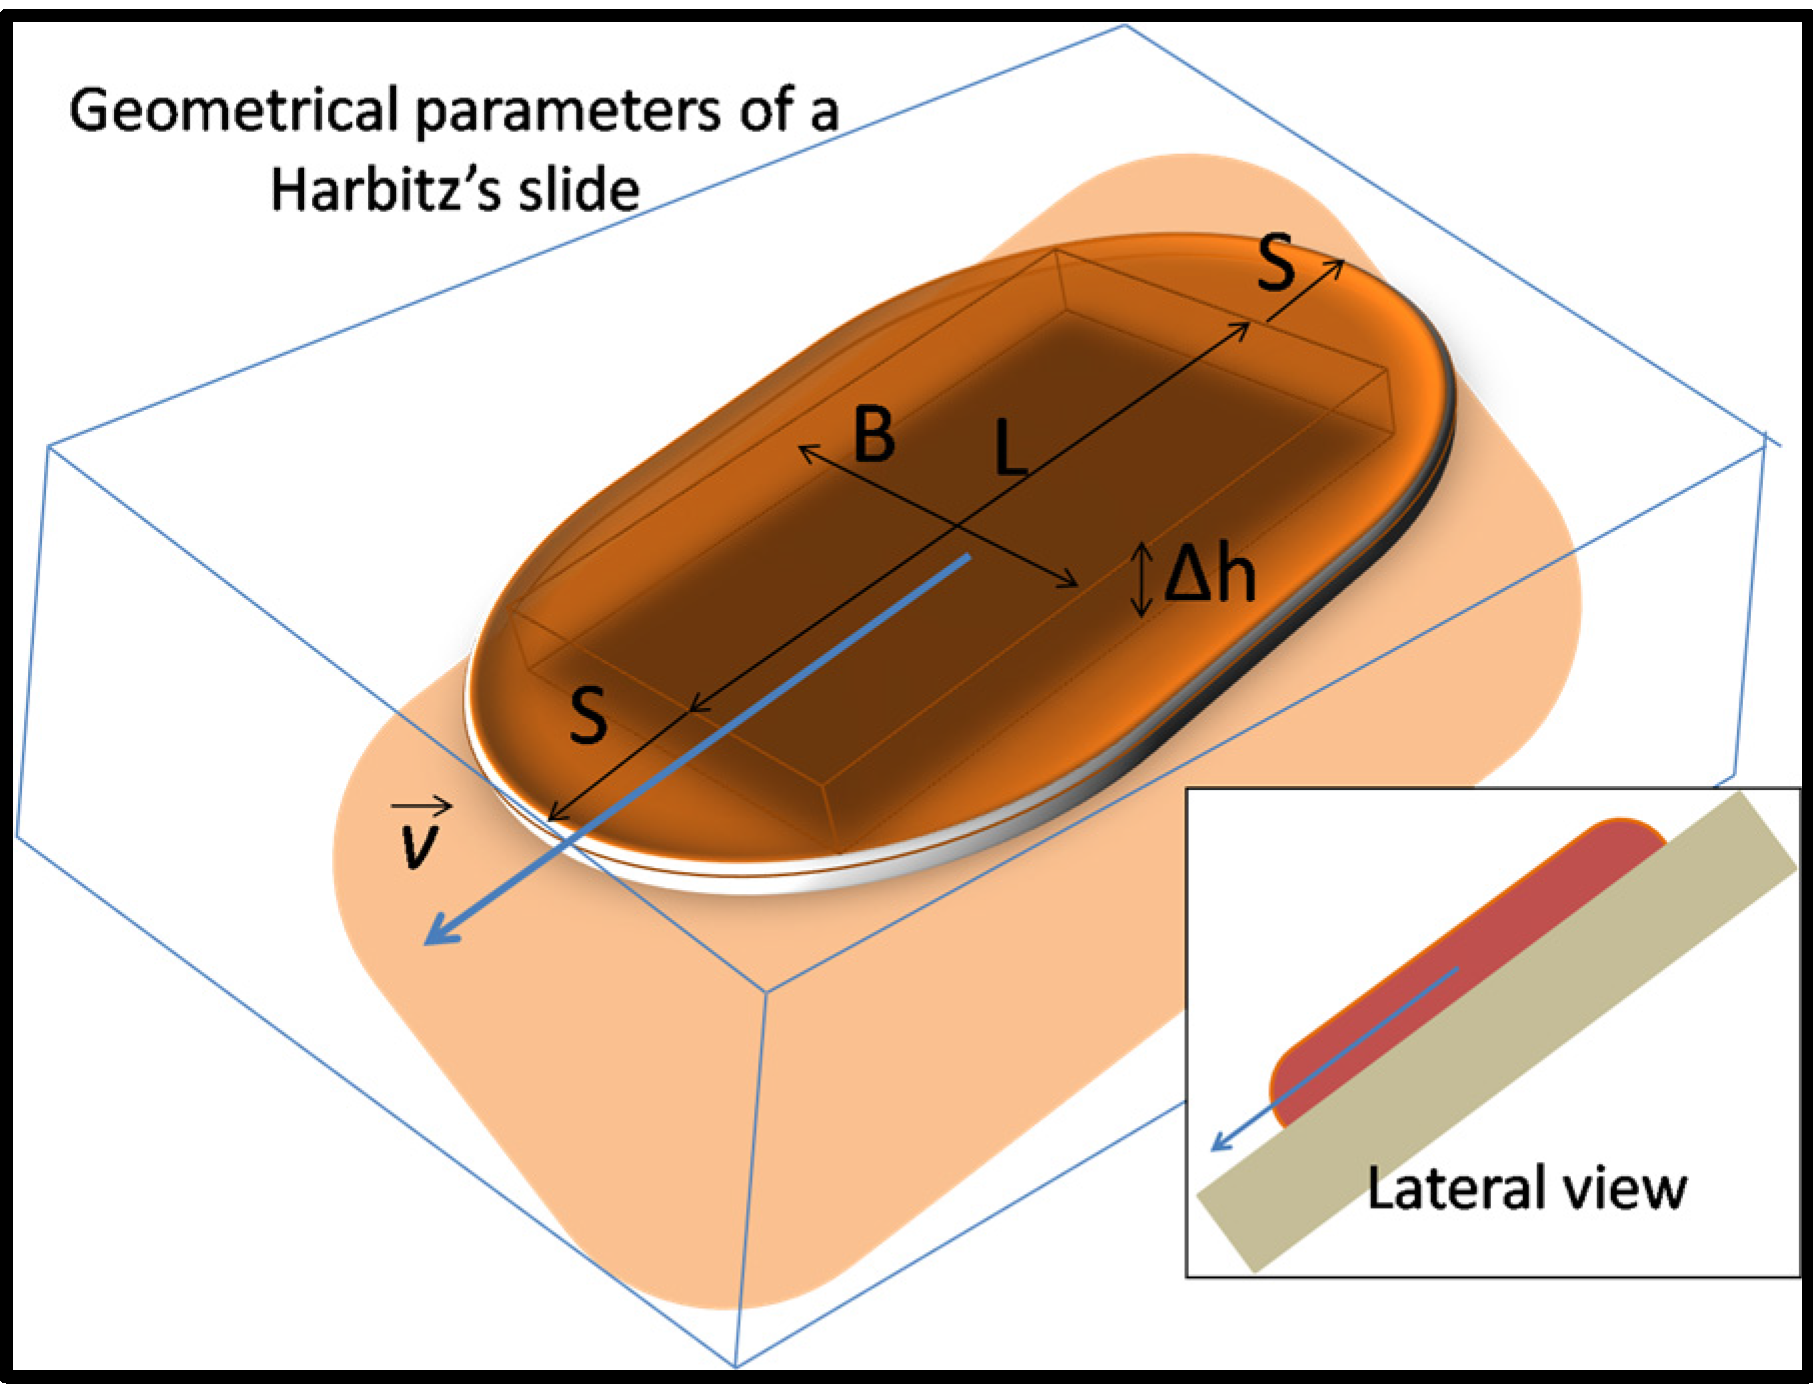
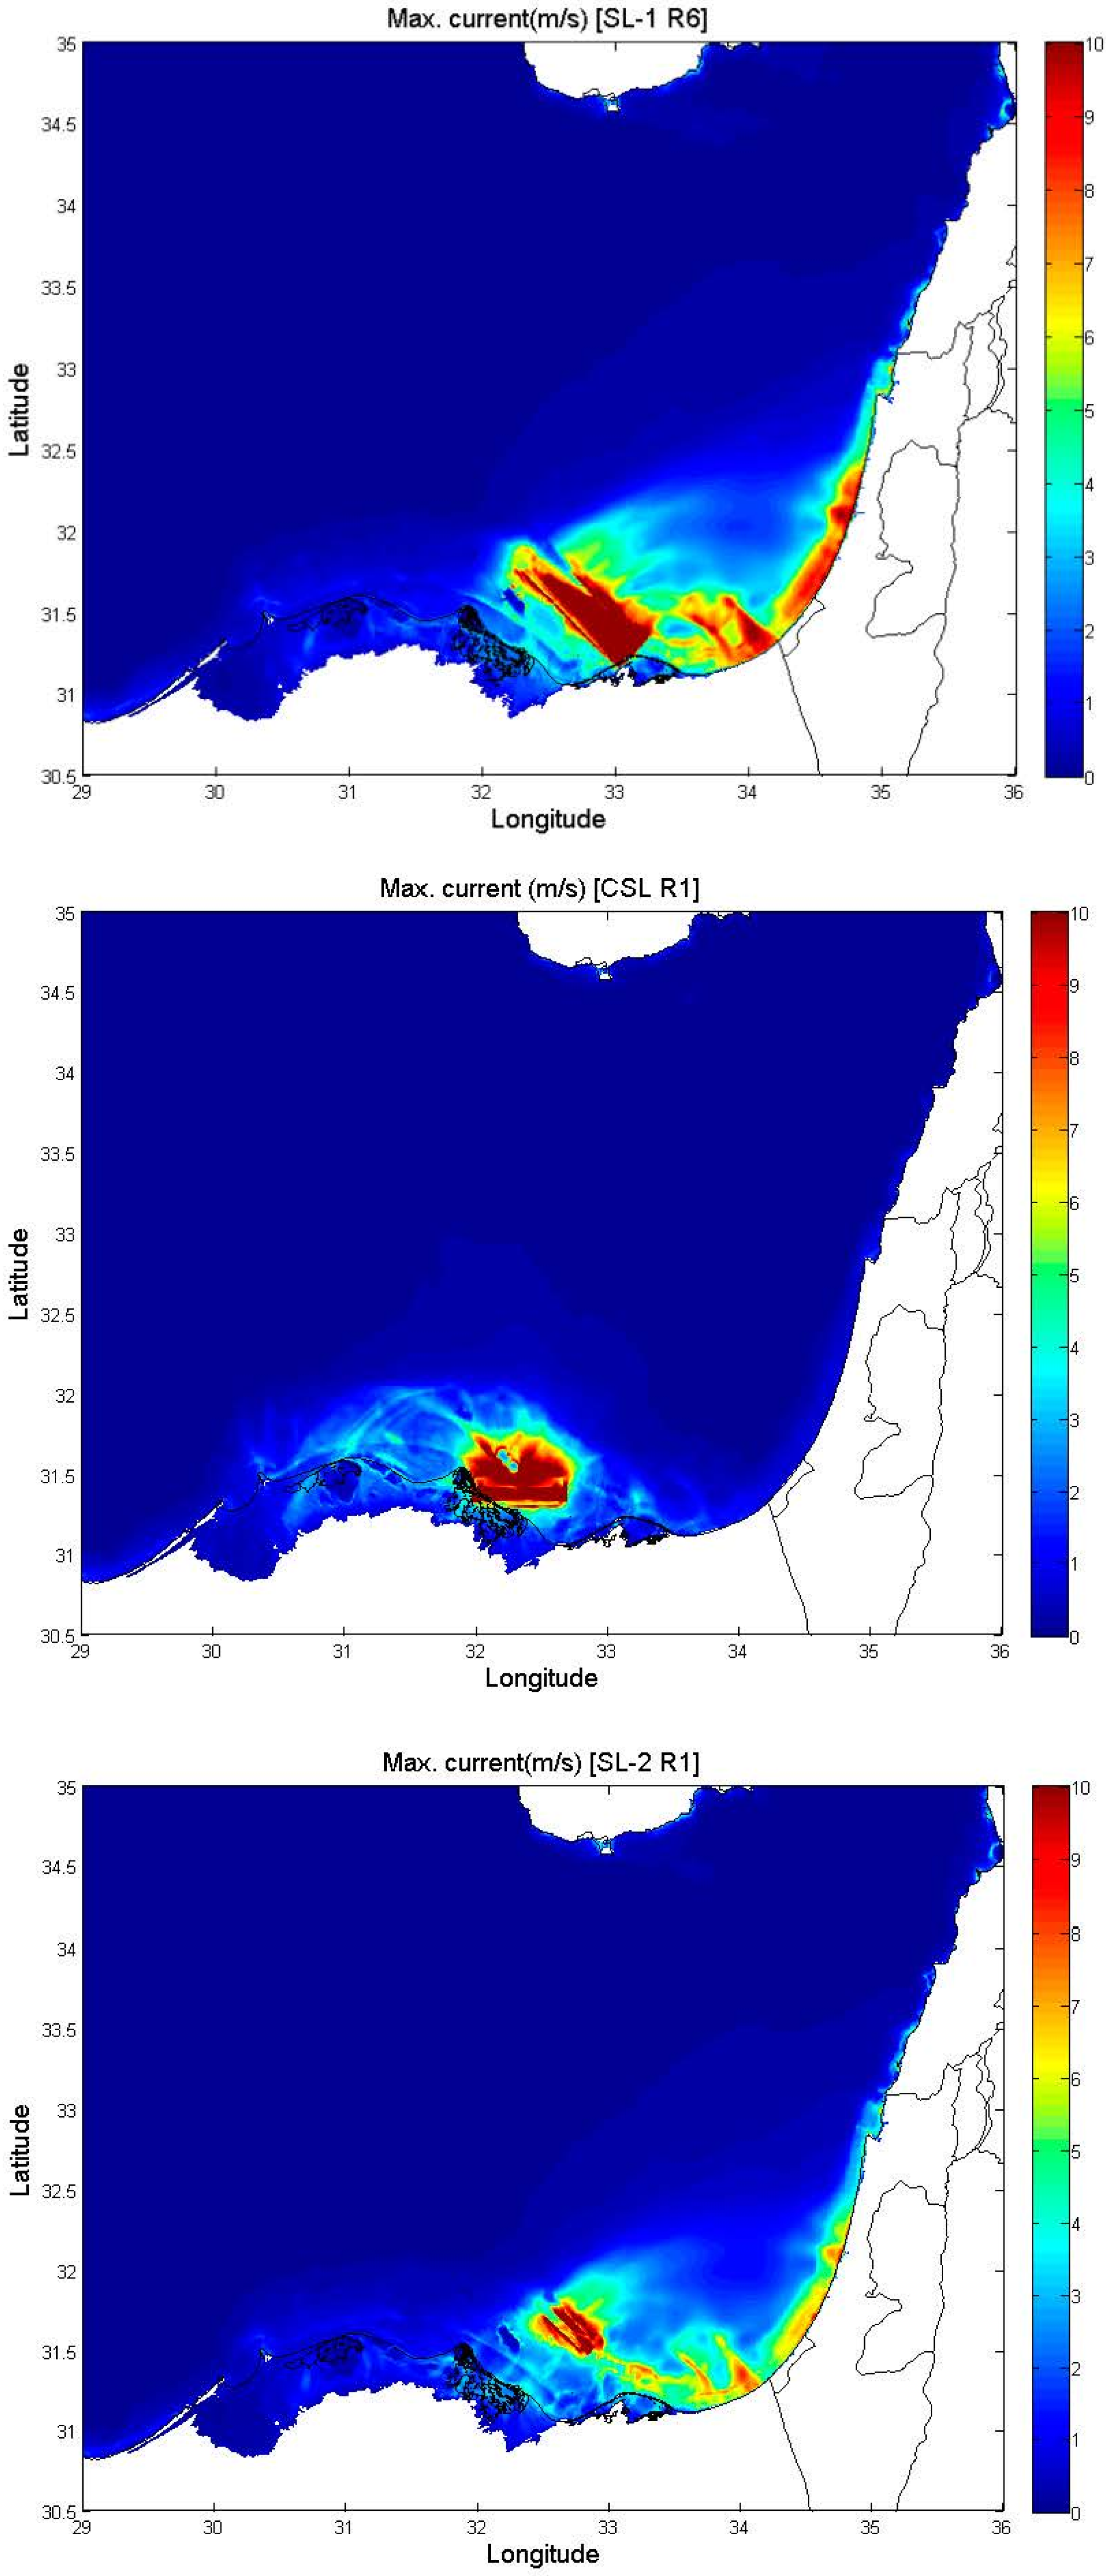
| Landslide | Run | Geometrical Parameters | Front Position | Direction $ | Kinematics ¶ | |||||||||||
|---|---|---|---|---|---|---|---|---|---|---|---|---|---|---|---|---|
| L (km) | S (km) | B (km) | hm (m) | V (km3) | λE° | ΦN° | θ° | R1 (km) | α1 (°) | µ/µst | Umax,1 (m/s) | R2 (km) | α2 (°) | Umax,2 (m/s) | ||
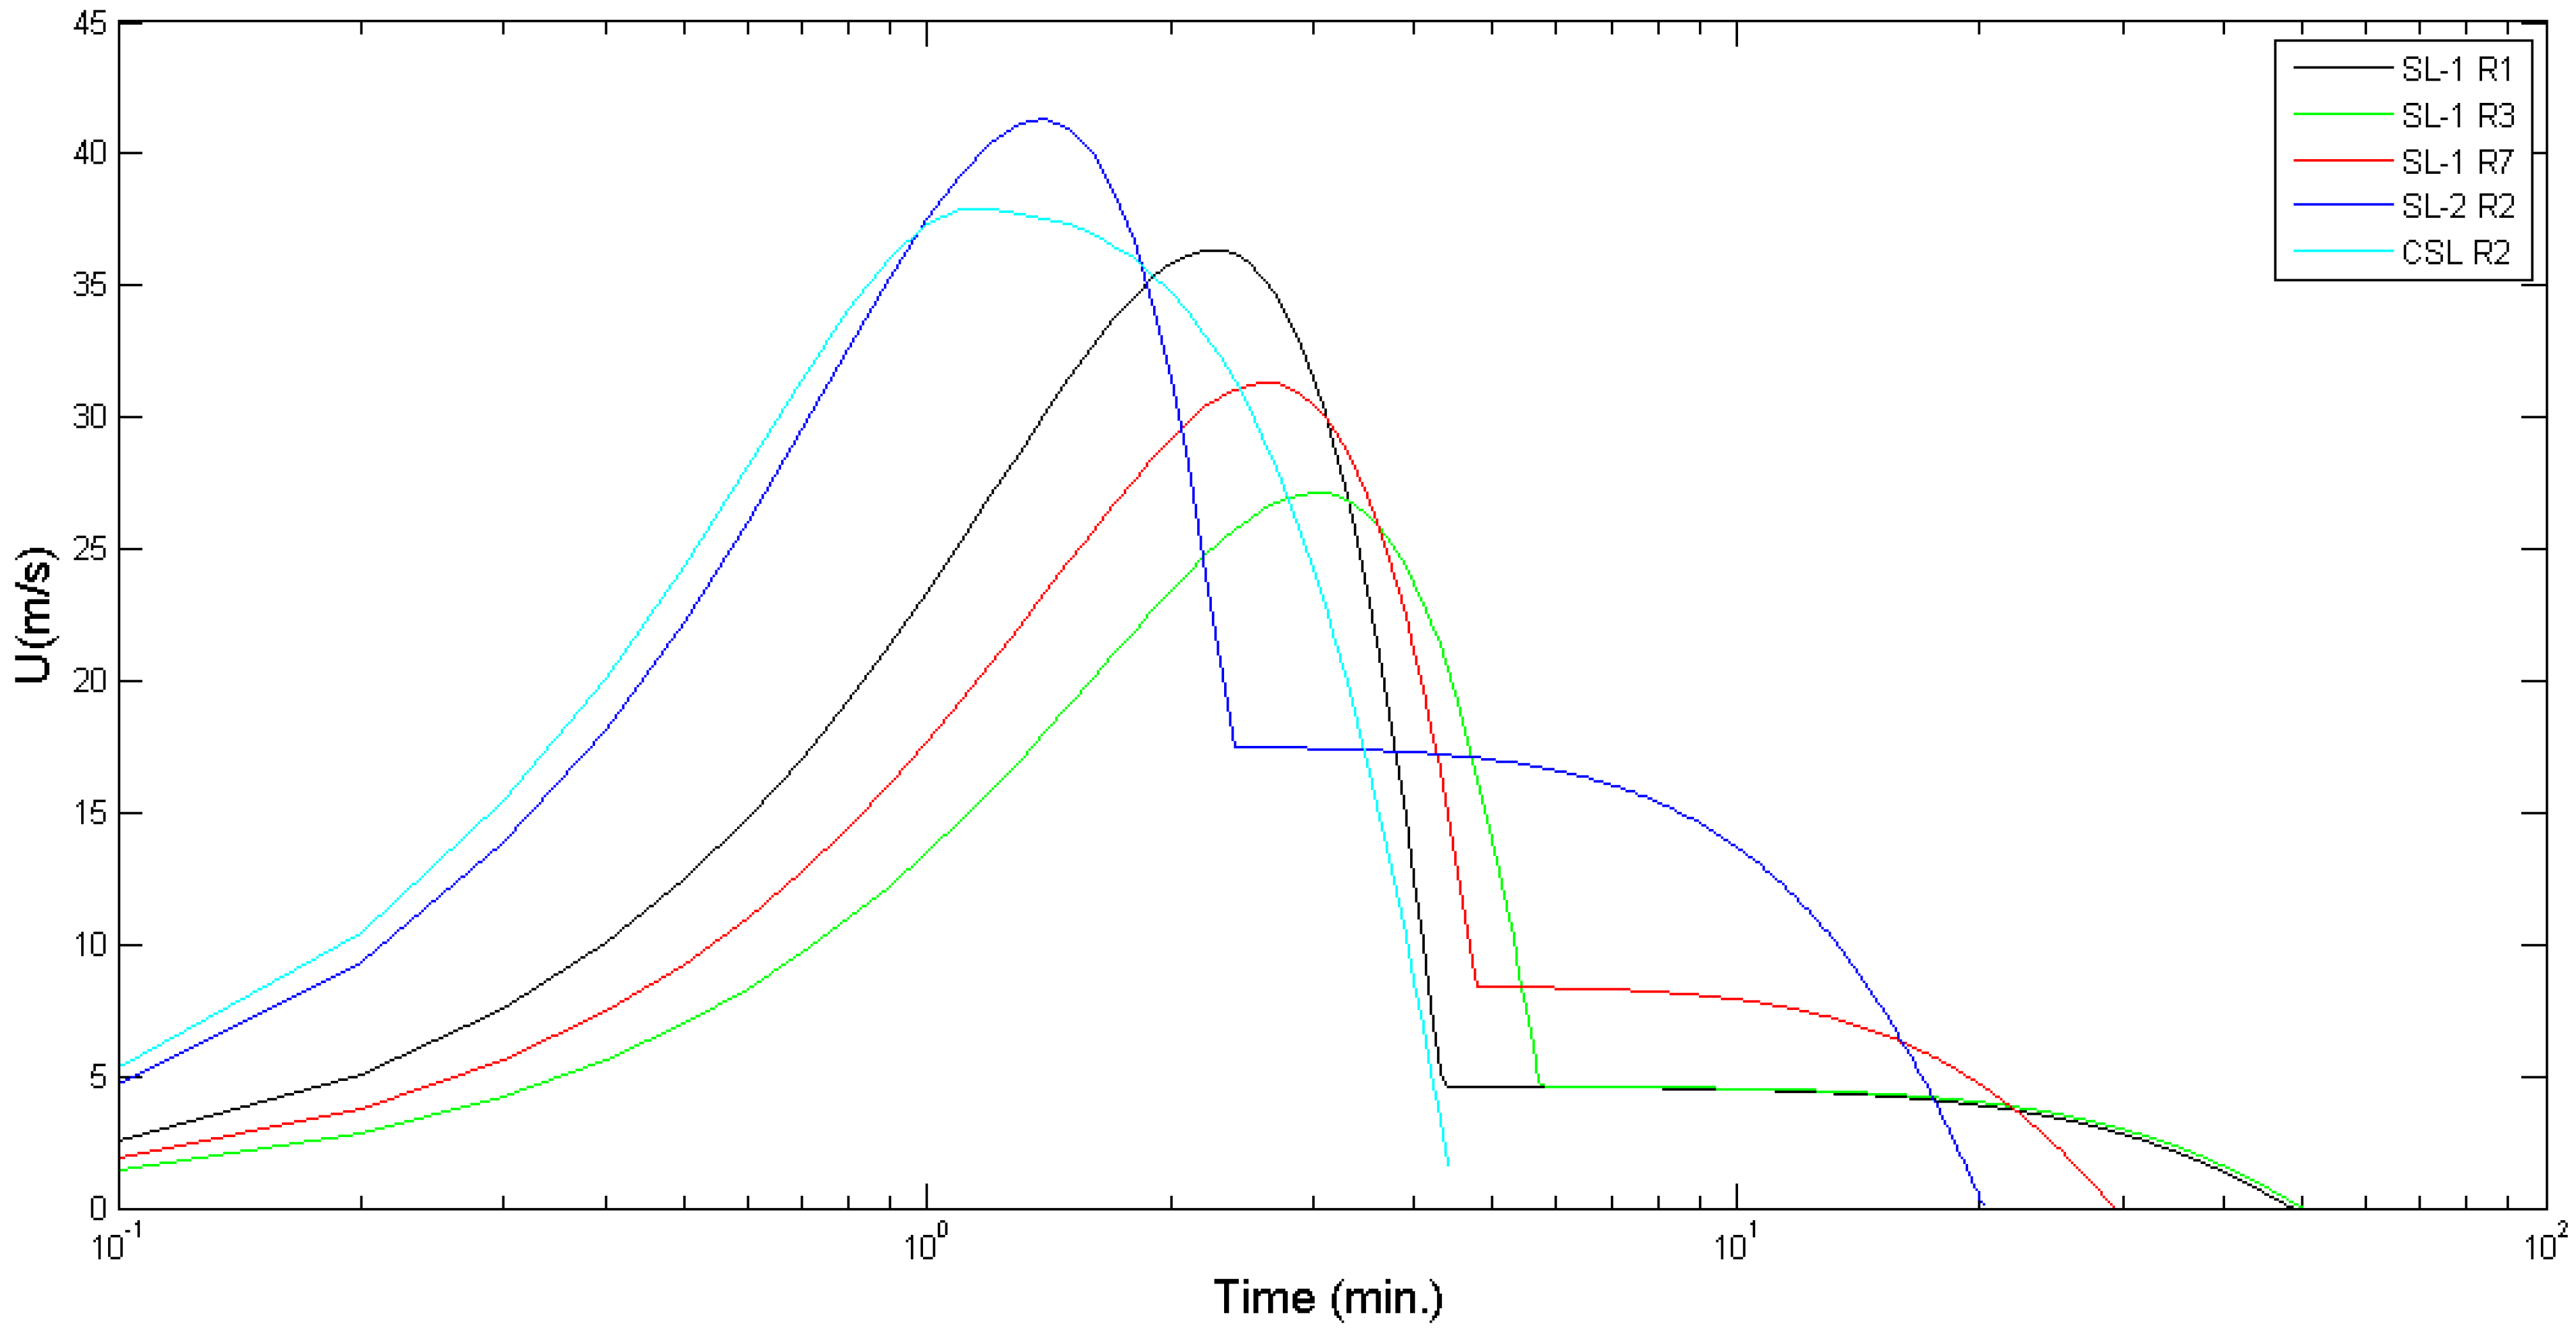
| SL-1 | R1 | 20.0 | 3.0 | 80.0 | 6.0 | 9.80 | 32.800 | 31.658 | 45 | 6.26 | 2.8 | 0.1 | 38.6 | 7.73 | 0.16 | 4.6 |
| R2 | 0.3 | 32.1 | ||||||||||||||
| R3 | 0.5 | 27.1 | ||||||||||||||
| R4 | 0.8 | 17.1 | ||||||||||||||
| R5 | 0.9 | 12.1 | ||||||||||||||
| R6 | 20.0 | 32.7 | 0.5 | 49.5 | 8.4 | |||||||||||
| R7 | 20.0 | 32.7 | 0.8 | 31.3 | 8.4 | |||||||||||
| SL-2 | R1 | 8.0 | 3.0 | 40.0 | 26.0 | 10.0 | 32.725 | 31.708 | 45 | 4.36 | 2.8 | 0.6 | 47.7 | 11.73 | 0.6 | 17.5 |
| R2 | 0.7 | 41.3 | ||||||||||||||
| R3 | 0.8 | 33.7 | ||||||||||||||
| R4 | 0.9 | 23.9 | ||||||||||||||
| CSL * | R1 | 10.0 | 1.0 | 50.0 | 20.4 | 10.0 | 32.350 | 31.417 | 90 | 3.25 | 3.0 | 0.5 | 48.9 | 3.25 | 3.0 | 48.9 |
| R2 | 0.7 | 37.9 | 37.9 | |||||||||||||
| R3 | 0.9 | 21.9 | 21.9 | |||||||||||||
| Tsunami | λE° | ΦN° | Length (km) | Width (km) | Slip (m) | Strike (degree) | Dip (degree) | Potential Energy # (J) |
|---|---|---|---|---|---|---|---|---|
| F-1 | 32.667 | 31.500 | 60.0 | 20.0 | 8.0 | 55.0 | 45.0 | 4.6 × 10¹³ |
| F-2 | 32.667 | 31.500 | 80.0 | 24.0 | 12.0 | 65.0 | 35.0 | 1.8 × 10¹⁴ |
| F-2 + SL-2 R2 * | 32.667 | 31.500 | 80.0 | 24.0 | 12.0 | 65.0 | 35.0 | 1.8 × 10¹⁴ |
3. Results and Discussion


4. Conclusions
Supplementary Materials
Author Contributions
Conflicts of Interest
Appendix
Electronic Supplementary Material


References
- Friedrich, W.L. The Minoan Eruption of Santorini around 1613 B.C. and its consequences. Tagung en des Landesmuseums für Vorges chichte Halle. Band 2013, 9, 37–48. [Google Scholar]
- Stanley, J.D.; Sheng, H. Volcanic shards from Santorini (Upper Minoan ash) in the Nile Delta, Egypt. Nature 1986, 320, 733–735. [Google Scholar] [CrossRef]
- Bruins, H.J.; van der Plicht, J. The Exodus enigma. Nature 1996, 382, 213–214. [Google Scholar] [CrossRef]
- Sivertsen, B.J. The Parting of the Sea. How volcanoes, Earthquakes, and Plagues Shaped the Story of Exodus; Princeton University Press: Princeton, NJ, USA, 2009. [Google Scholar]
- Trevisanato, S.I. Treatments for burns in the London Medical Papyrus show the first seven biblical plagues of Egypt are coherent with Santorini’s volcanic fallout. Med. Hypotheses 2006, 66, 193–196. [Google Scholar] [CrossRef] [PubMed]
- Trevisanato, S.I. Six medical papyri describe the effects of Santorini’s volcanic ash, and provide Egyptian parallels to the so-called biblical plagues. Med. Hypotheses 2006, 67, 187–190. [Google Scholar] [CrossRef] [PubMed]
- Trevisanato, S.I. Medical papyri describe the effects of the Santorini eruption on human health, and date the eruption to August 1603–March 1601 BC. Med. Hypotheses 2007, 68, 446–449. [Google Scholar] [CrossRef] [PubMed]
- Byers, G.A. New evidence from Egypt on the location of the Exodus Sea crossing, part 1. Bible Spade 2006, 19, 14–22. [Google Scholar]
- Hoffmeier, J.K. Ancient Israel in Sinai. The Evidence for the Authenticity of the Wilderness Tradition; Oxford University Press Inc.: New York, NY, USA, 2005. [Google Scholar]
- Wood, B.G. Debunking “The Exodus Decoded”. ABR, 20 September 2006. Available online: Http://www.biblearchaeology.org/post/2006/09/20/Debunking-The-Exodus-Decoded.aspx (accessed on 15 May 2015).
- Voltzinger, N.; Androsov, A. Modeling the Hydrodynamic Situation of the Exodus. Izv. Atmos. Ocean. Phys. 2003, 39, 482–496. [Google Scholar]
- Drews, C.; Han, W. Dynamics of Wind Setdown at Suez and the Eastern Nile Delta. PLoS ONE 2010, 5, e12481. [Google Scholar] [CrossRef] [PubMed]
- Abril, J.M.; Abdel-Aal, M.M. Marine Radioactivity Studies in the Suez Canal, Part I: Hydrodynamics and Transit Times. Estuar. Coast. Shelf Sci. 2000, 50, 489–502. [Google Scholar] [CrossRef]
- Abril, J.M.; Abdel-Aal, M.M. Marine Radioactivity Studies in the Suez Canal, Part II: Field Experiments and a Modelling Study of Dispersion. Estuar. Coast. Shelf Sci. 2000, 50, 503–514. [Google Scholar] [CrossRef]
- Jacobovici, S.; Cameron, J. The Exodus Decoded; Documentary Film: Toronto, ON, Canada, 19 April 2006. [Google Scholar]
- Salzman, R. Mega-Tsunami: The True Story of the Hebrew Exodus from Egypt; iUniverse: Lincoln, NE, USA, 2005. [Google Scholar]
- Novikova, T.; Papadopoulos, G.A.; McCoy, F.W. Modelling of tsunami generated by the giant Late Bronze Age eruption of Thera, South Aegean Sea, Greece. Geophys. J. Int. 2011, 186, 665–680. [Google Scholar] [CrossRef]
- Mészáros, S. Some words on theMinoan tsunami of Santorini. In Thera and the Aegean World II; Doumas, C., Ed.; The Thera Foundation: London, UK, 1978; pp. 257–262. [Google Scholar]
- Goodman-Tchernov, B.N.; Dey, H.W.; Reinhardt, E.G.; McCoy, F.; Mart, Y. Tsunami waves generated by the Santorini eruption reached Eastern Mediterranean shores. Geology 2009, 37, 943–946. [Google Scholar] [CrossRef]
- Neev, D.; Balker, N.; Emery, K.O. Mediterranean Coast of Israel and Sinai, Holocene Tectonics from Geology and Geophysics and Archaeology; Taylor and Francis: New York, NY, USA, 1987; p. 130. [Google Scholar]
- Pfannenstiel, M. Erlauterungen zu den bathymetrischen Karten des ostlichen Mittelmeeres. Bull. Inst. Oceanogr. 1960, 57, 60. [Google Scholar]
- De Martini, P.M.; Barbano, M.S.; Smedile, A.; Gerardi, F.; Pantosti, D.; del Carlo, P.; Pirrotta, C. A unique 4000 year long geological record of multiple tsunami inundations in the Augusta Bay (eastern Sicily, Italy). Mar. Geol. 2010, 276, 42–57. [Google Scholar] [CrossRef] [Green Version]
- De Martini, P.M.; Barbano, M.S.; Pantosti, D.; Smedile, A.; Pirrotta, C.; del Carlo, P.; Pinzi, S. Geological evidence for paleotsunamis along eastern Sicily (Italy): An overview. Nat. Hazards Earth Syst. Sci. 2012, 12, 2569–2580. [Google Scholar] [CrossRef]
- Ozel, N.M.; Ocal, N.; Cevdet, Y.A.; Dogan, K.; Mustafa, E. Tsunami hazard in the Eastern Mediterranean and its connected seas: Towards a tsunami warning center in Turkey. Soil Dyn. Earthq. Eng. 2011, 31, 598–610. [Google Scholar] [CrossRef]
- Periáñez, R.; Abril, J.M. Modelling tsunamis in the Eastern Mediterranean Sea. Application to the Minoan Santorini tsunami sequence as a potential scenario for the biblical Exodus. J. Mar. Syst. 2014, 139, 91–102. [Google Scholar] [CrossRef]
- Choi, B.H.; Pelinovsky, E.; Kim, K.O.; Lee, J.S. Simulation of the trans-oceanic tsunami propagation due to the 1883 Krakatau volcanic eruption. Nat. Hazards Earth Syst. Sci. 2003, 3, 321–332. [Google Scholar] [CrossRef]
- Kowalik, Z.; Knight, W.; Logan, T.; Whitmore, P. Numerical modelling of the Indian Ocean tsunami. In The Indian Ocean Tsunami; Murty, T.S., Aswathanarayana, U., Nipurama, N., Eds.; Taylor and Francis Group: London, UK, 2007; pp. 97–122. [Google Scholar]
- Periáñez, R.; Abril, J.M. Modeling tsunami propagation in the Iberia–Africa plate boundary: Historical events, regional exposure and the case-study of the former Gulf of Tartessos. J. Mar. Syst. 2013, 111–112, 223–234. [Google Scholar] [CrossRef]
- Yolsal-Cevikbilen, S.; Taymaz, T. Earthquake source parameters along the Hellenic subduction zone and numerical simulations of historical tsunamis in the Eastern Mediterranean. Tectonophysics 2012, 536–537, 61–100. [Google Scholar] [CrossRef]
- Kowalik, Z.; Murty, T.S. Numerical Modelling of Ocean Dynamics; World Scientific: Singapore, 1993. [Google Scholar]
- Periáñez, R.; Abril, J.M. A numerical modeling study on oceanographic conditions in the former Gulf of Tartessos (SW Iberia): Tides and tsunami propagation. J. Mar. Syst. 2014, 139, 68–78. [Google Scholar] [CrossRef]
- Herzfeld, M.; Schmidt, M.; Griffies, S.M.; Liang, Z. Realistic test cases for limited area ocean modelling. Ocean Model. 2011, 37, 1–34. [Google Scholar] [CrossRef]
- Kampf, J. Ocean Modelling for Beginners; Springer-Verlag: Heidelberg, Germany, 2009. [Google Scholar]
- Okada, Y. Surface deformation due to shear and tensile faults in a half-space. Bull. Seismol. Soc. Am. 1985, 75, 1135–1154. [Google Scholar]
- Abril, J.M.; Periáñez, R.; Escacena, J.L. Modeling tides and tsunami propagation in the former Gulf of Tartessos, as a tool for Archaeological Science. J. Archaeol. Sci. 2013, 40, 4499–4508. [Google Scholar] [CrossRef]
- Harbitz, C.B. Model simulations of tsunamis generated by the Storegga slides. Mar. Geol. 1992, 105, 1–21. [Google Scholar] [CrossRef]
- Cecioni, C.; Bellotti, G. Modeling tsunamis generated by submerged landslides using depth integrated equations. Appl. Ocean Res. 2010, 32, 343–350. [Google Scholar] [CrossRef]
- Abril, J.M.; Periáñez, R. A modelling approach to Late Pleistocene mega-tsunamis likely triggered by giant submarine landslides in the Mediterranean. Mar. Geol. 2015. under review. [Google Scholar]
- Lastras, G.; de Blasio, F.V.; Canals, M.; Elverhøi, A. Conceptual and numerical modeling of the BIG’95 debris flow, western Mediterranean Sea. J. Sediment. Res. 2005, 75, 784–797. [Google Scholar] [CrossRef]
- Ruff, L.J. Some aspects of energy balance and tsunami generation by earth-quakes and landslides. Pure Appl. Geophys. 2003, 160, 2155–2176. [Google Scholar] [CrossRef]
- De Blasio, F.; Elverhøi, A.; Issler, D.; Harbitz, C.B.; Bryn, P.; Lien, R. On the dynamics of subaqueous clay rich gravity mass flows -the giant Storegga slide, Norway. Mar. Pet. Geol. 2005, 22, 179–186. [Google Scholar] [CrossRef]
- Fine, I.V.; Rabinovich, A.B.; Bornhold, B.D.; Thomson, R.E.; Kulikov, E.A. The Grand Banks landslide-generated tsunami of November 18, 1929: Preliminary analysis and numerical modeling. Mar. Geol. 2005, 215, 45–57. [Google Scholar] [CrossRef]
- Tappin, D.R.; Watts, P.; Grilli, S.T. The Papua New Guinea tsunami of 17 July 1998: Anatomy of a catastrophic event. Nat. Hazards Earth Syst. Sci. 2008, 8, 243–266. [Google Scholar] [CrossRef]
- Periáñez, R.; Abril, J.M. Computational fluid dynamics simulations of the Zanclean catastrophic flood of the Mediterranean (5.33 Ma). Palaeogeogr. Palaeoclimatol. Palaeoecol. 2015, 424, 49–60. [Google Scholar] [CrossRef]
- Coutellier, V.; Stanley, D.J. Late quaternary stratigraphy and paleogeography of the eastern Nile Delta, Egypt. Mar. Geol. 1987, 77, 257–275. [Google Scholar] [CrossRef]
- El-Raey, M. Vulnerability assessment of the coastal zone of the Nile Delta of Egypt, to the impacts of sea level rise. Ocean Coast. Manag. 1997, 37, 29–40. [Google Scholar] [CrossRef]
- Barka, A.; Reilinger, R. Active tectonics on the Eastern Mediterranean region: Deduced from GPS, neotectonics and seismicity data. Ann. Geofis. 1997, 40, 587–610. [Google Scholar]
- Mascle, J.; Benkhelil, J.; Bellaiche, G.; Zitter, T.; Woodside, J.; Loncke, L.; Prismed II Scientific Party. Marine geologic evidence for a Levantine-Sinai Plate; a new piece of the Mediterranean puzzle. Geology (Boulder) 2000, 28, 779–782. [Google Scholar]
- Hamouda, A.Z. Numerical computations of 1303 tsunamigenic propagation towards Alexandria, Egyptian Coast. J. Afr. Earth Sci. 2006, 44, 37–44. [Google Scholar] [CrossRef]
- Stiros, S.C. The 8.5+ magnitude AD365 earthquake in Crete: Coastal uplift, topography changes, archaeological and historical signature. Quat. Int. 2010, 216, 54–63. [Google Scholar] [CrossRef]
- Papadopoulos, G.A.; Daskalaki, E.; Fokaefs, A.; Giraleas, N. Tsunami hazards in the Eastern Mediterranean: Strong earthquakes and tsunamis in the East Hellenic Arc and Trench system. Nat. Hazards Earth Syst. Sci. 2007, 7, 57–64. [Google Scholar] [CrossRef]
- Harbitz, C.B.; Løvholt, F.; Bungum, H. Submarine landslide tsunamis: How extreme and how likely? Nat. Hazards 2014, 72, 1341–1374. [Google Scholar] [CrossRef]
- Gaullier, V.; Mart, Y.; Bellaiche, G.; Macle, J.; Vendeville, B.; Zitter, T.; Prismed II scientific parties. Salt tectonics in and around the Nile Deep-Sea Fan: Insights from the PRISMED II cruise: From the Artic to the Mediterranean: Salt, shale and igneous diapirs in and around Europe. Geol. Soc. 2000, 174, 111–129. [Google Scholar] [CrossRef]
- Loncke, L.; Gaullier, V.; Macle, J.; Vendeville, B.; Camera, L. The Nile deep-sea fan: An example of interacting sedimentation, salt tectonics, and inherited subsalt paleotopographic features. Mar. Pet. Geol. 2006, 23, 297–315. [Google Scholar] [CrossRef]
- Ducassou, E.; Migeon, S.; Mulder, T.; Murat, A.; Capotondi, L.; Bernasconi, S.M.; Macle, J. Evolution of the Nile deep-sea turbidite system during the Late Quaternary: Influence of climate change on fan sedimentation. Sedimentology 2009, 56, 2061–2090. [Google Scholar] [CrossRef]
- Ducassou, E.; Migeon, S.; Capotondi, L.; Mascle, J. Run-out distance and erosion debris-flows in the Nile deep-sea fan system: Evidence from lithofacies and micropaleontological analyses. Mar. Pet. Geol. 2013, 39, 102–123. [Google Scholar] [CrossRef]
- Loncke, L.; Gaullier, V.; Droz, L.; Ducassou, E.; Migeon, S.; Mascle, J. Multi-scale slope instabilities along the Nile deep-sea fan, Egyptian margin: A general overview. Mar. Pet. Geol. 2009, 26, 633–646. [Google Scholar] [CrossRef]
- Loncke, L.; Vendeville, B.C.; Gaullier, V.; Mascle, J. Respective contributions of tectonic and gravity-driven processes on the structural pattern in the Eastern Nile deep-sea fan: Insights from physical experiments. Basin Res. 2010, 22, 765–782. [Google Scholar] [CrossRef]
- Gamal, M.A. Truthfulness of the Existence of the Pelusium Megashear Fault System, East of Cairo, Egypt. Int. J. Geosci. 2013, 4, 212–227. [Google Scholar] [CrossRef]
- Garziglia, S.; Migeon, S.; Ducassou, E.; Loncke, L.; Macle, J. Mass-transport deposits on the Rosetta province (NW Nile deep-sea turbidite system, Egyptianmargin): Characteristics, distribution, and potential causal processes. Mar. Geol. 2008, 250, 180–198. [Google Scholar] [CrossRef]
- Khaled, K.A.; Attia, G.M.; Metwalli, F.I.; Fagelnour, M.S. Subsurface Geology and Petroleum System in the Eastern Offshore Area, Nile Delta, Egypt. J. Appl. Sci. Res. 2014, 10, 254–270. [Google Scholar]
- Bayon, G.; Loncke, L.; Dupré, S.; Caprais, J.C.; Ducassou, E.; Duperron, S.; Etoubleau, J.; Foucher, J.P.; Fouquet, Y.; Gontharet, S.; et al. Multi-disciplinary investigation of fluid seepage on an unstable margin: The case of the Central Nile deep sea fan. Mar. Geol. 2009, 261, 92–104. [Google Scholar] [CrossRef] [Green Version]
- Prinzhofer, A.; Deville, E. Origins of hydrocarbon gas seeping out from offshore mud volcanoes in the Nile Delta. Tectonophysics 2013, 591, 52–61. [Google Scholar] [CrossRef]
- Urgeles, R.; Camerlenghi, A. Submarine landslides of the Mediterranean Sea: Trigger mechanisms, dynamics and frequency-magnitude distribution. J. Geophys. Res. Earth Surf. 2013, 118, 2600–2618. [Google Scholar] [CrossRef]
- Badawy, A.; Abdel Fattah, A.-K. Source parameters and fault plane determinations of the 28 December 1999 northeastern Cairo earthquakes. Tectonophysics 2001, 343, 63–77. [Google Scholar] [CrossRef]
© 2015 by the authors; licensee MDPI, Basel, Switzerland. This article is an open access article distributed under the terms and conditions of the Creative Commons Attribution license ( http://creativecommons.org/licenses/by/4.0/).
Share and Cite
Abril, J.M.; Periáñez, R. A Numerical Modelling Study on the Potential Role of Tsunamis in the Biblical Exodus. J. Mar. Sci. Eng. 2015, 3, 745-771. https://doi.org/10.3390/jmse3030745
Abril JM, Periáñez R. A Numerical Modelling Study on the Potential Role of Tsunamis in the Biblical Exodus. Journal of Marine Science and Engineering. 2015; 3(3):745-771. https://doi.org/10.3390/jmse3030745
Chicago/Turabian StyleAbril, José M., and Raúl Periáñez. 2015. "A Numerical Modelling Study on the Potential Role of Tsunamis in the Biblical Exodus" Journal of Marine Science and Engineering 3, no. 3: 745-771. https://doi.org/10.3390/jmse3030745