1. Introduction
Devastating tsunamis in the last two decades required a new paradigm of the earthquake occurrences and tsunami generations on a geologically extended time-span. The extraordinary tsunami in the Indian Ocean of 2004 was generated by the earthquake of more than 1000km in fault length, which includes historical fault ruptures of smaller scales along the Sumatra-Andaman subduction zone [
1]. The 2011 Tohoku tsunami in Japan resulted from a fault rupture developed from the Japan Trench to the coastline of the Tohoku prefecture of Japan along the dip-direction of the Pacific plate as well as along the strike-direction of the Japan Trench. This wide-spread source region of the 2011 megathrust earthquake of Mw9.0 includes trench-ward seismic segments, and the segments have been believed to be an interface of aseismic segments [
2,
3] without any stress accumulation.
These tsunamis were due to megathrust earthquakes much larger than anticipated sizes in their respective seismological histories, although some geological evidence demonstrated past earthquakes and tsunamis larger than those in historical documents and instrumentally observed records. It has been pointed out recently that observations of their seismic activity in recent years revealed that the megathrust earthquakes occurred in seismic segments of either Along-strike Single Segmentation (ASSS) or Along-dip Double Segmentation (ADDS) [
4,
5,
6]. The different seismic segmentations—ASSS and ADDS—have been identified, referring to their regional seismic-activity, focal mechanisms, rupture patterns, geometry of subduction zones, types of overriding plates and back-arc activity [
5].
Previous studies discuss the seismic segmentation along the subduction zones as a more complex structure, being composed of aseismic-zone, unstable zone, conditionally stable zone, and stable sliding zone, e.g. [
2]. The present ADDS/ASSS hypothesis would be one where the segmentation relates directly to observable seismic activity in the source regions of great (Mw~8) and megathrust earthquakes (Mw~9). The main purpose of this study is to discuss the tsunami excitation in relation to these segmentations so as to make a comprehensive understanding of source regions of megathrust earthquakes.
Previous studies showed that tsunami excitation in the Japan Sea is larger than that in the Pacific Sea side of Japan [
7,
8,
9]. These studies attributed the difference to the dip angle of earthquake faults or to the rigidity of earthquake source-regions. In this study, a further discussion is made about the tsunami excitation referring to the recent understanding of earthquake sources in different segmentations of ADDS and ASSS in the vicinity of Japan.
2. Diversity of Megathrust Earthquakes in the World
Seismic activity off the Pacific coast of the Tohoku district, Japan has been extensively investigated from historical and instrumental records. It is characterized into regional seismic segments; there is a double aligned seismic-segmentation along the dip-direction of the subduction zone. The segments along the island-arc side of Japan frequently generated earthquakes as large as Mw8, but the segments along the Japan Trench had been considered to be aseismic. This double aligned seismic-segmentation is called Along-dip Double Segmentation (ADDS). The 2011 megathrust earthquake of Mw9.0 ruptured many segments along not only strike- but also dip-directions of the Japan Trench, covering an area of about 200 × 500 km
2, as shown in
Figure 1.
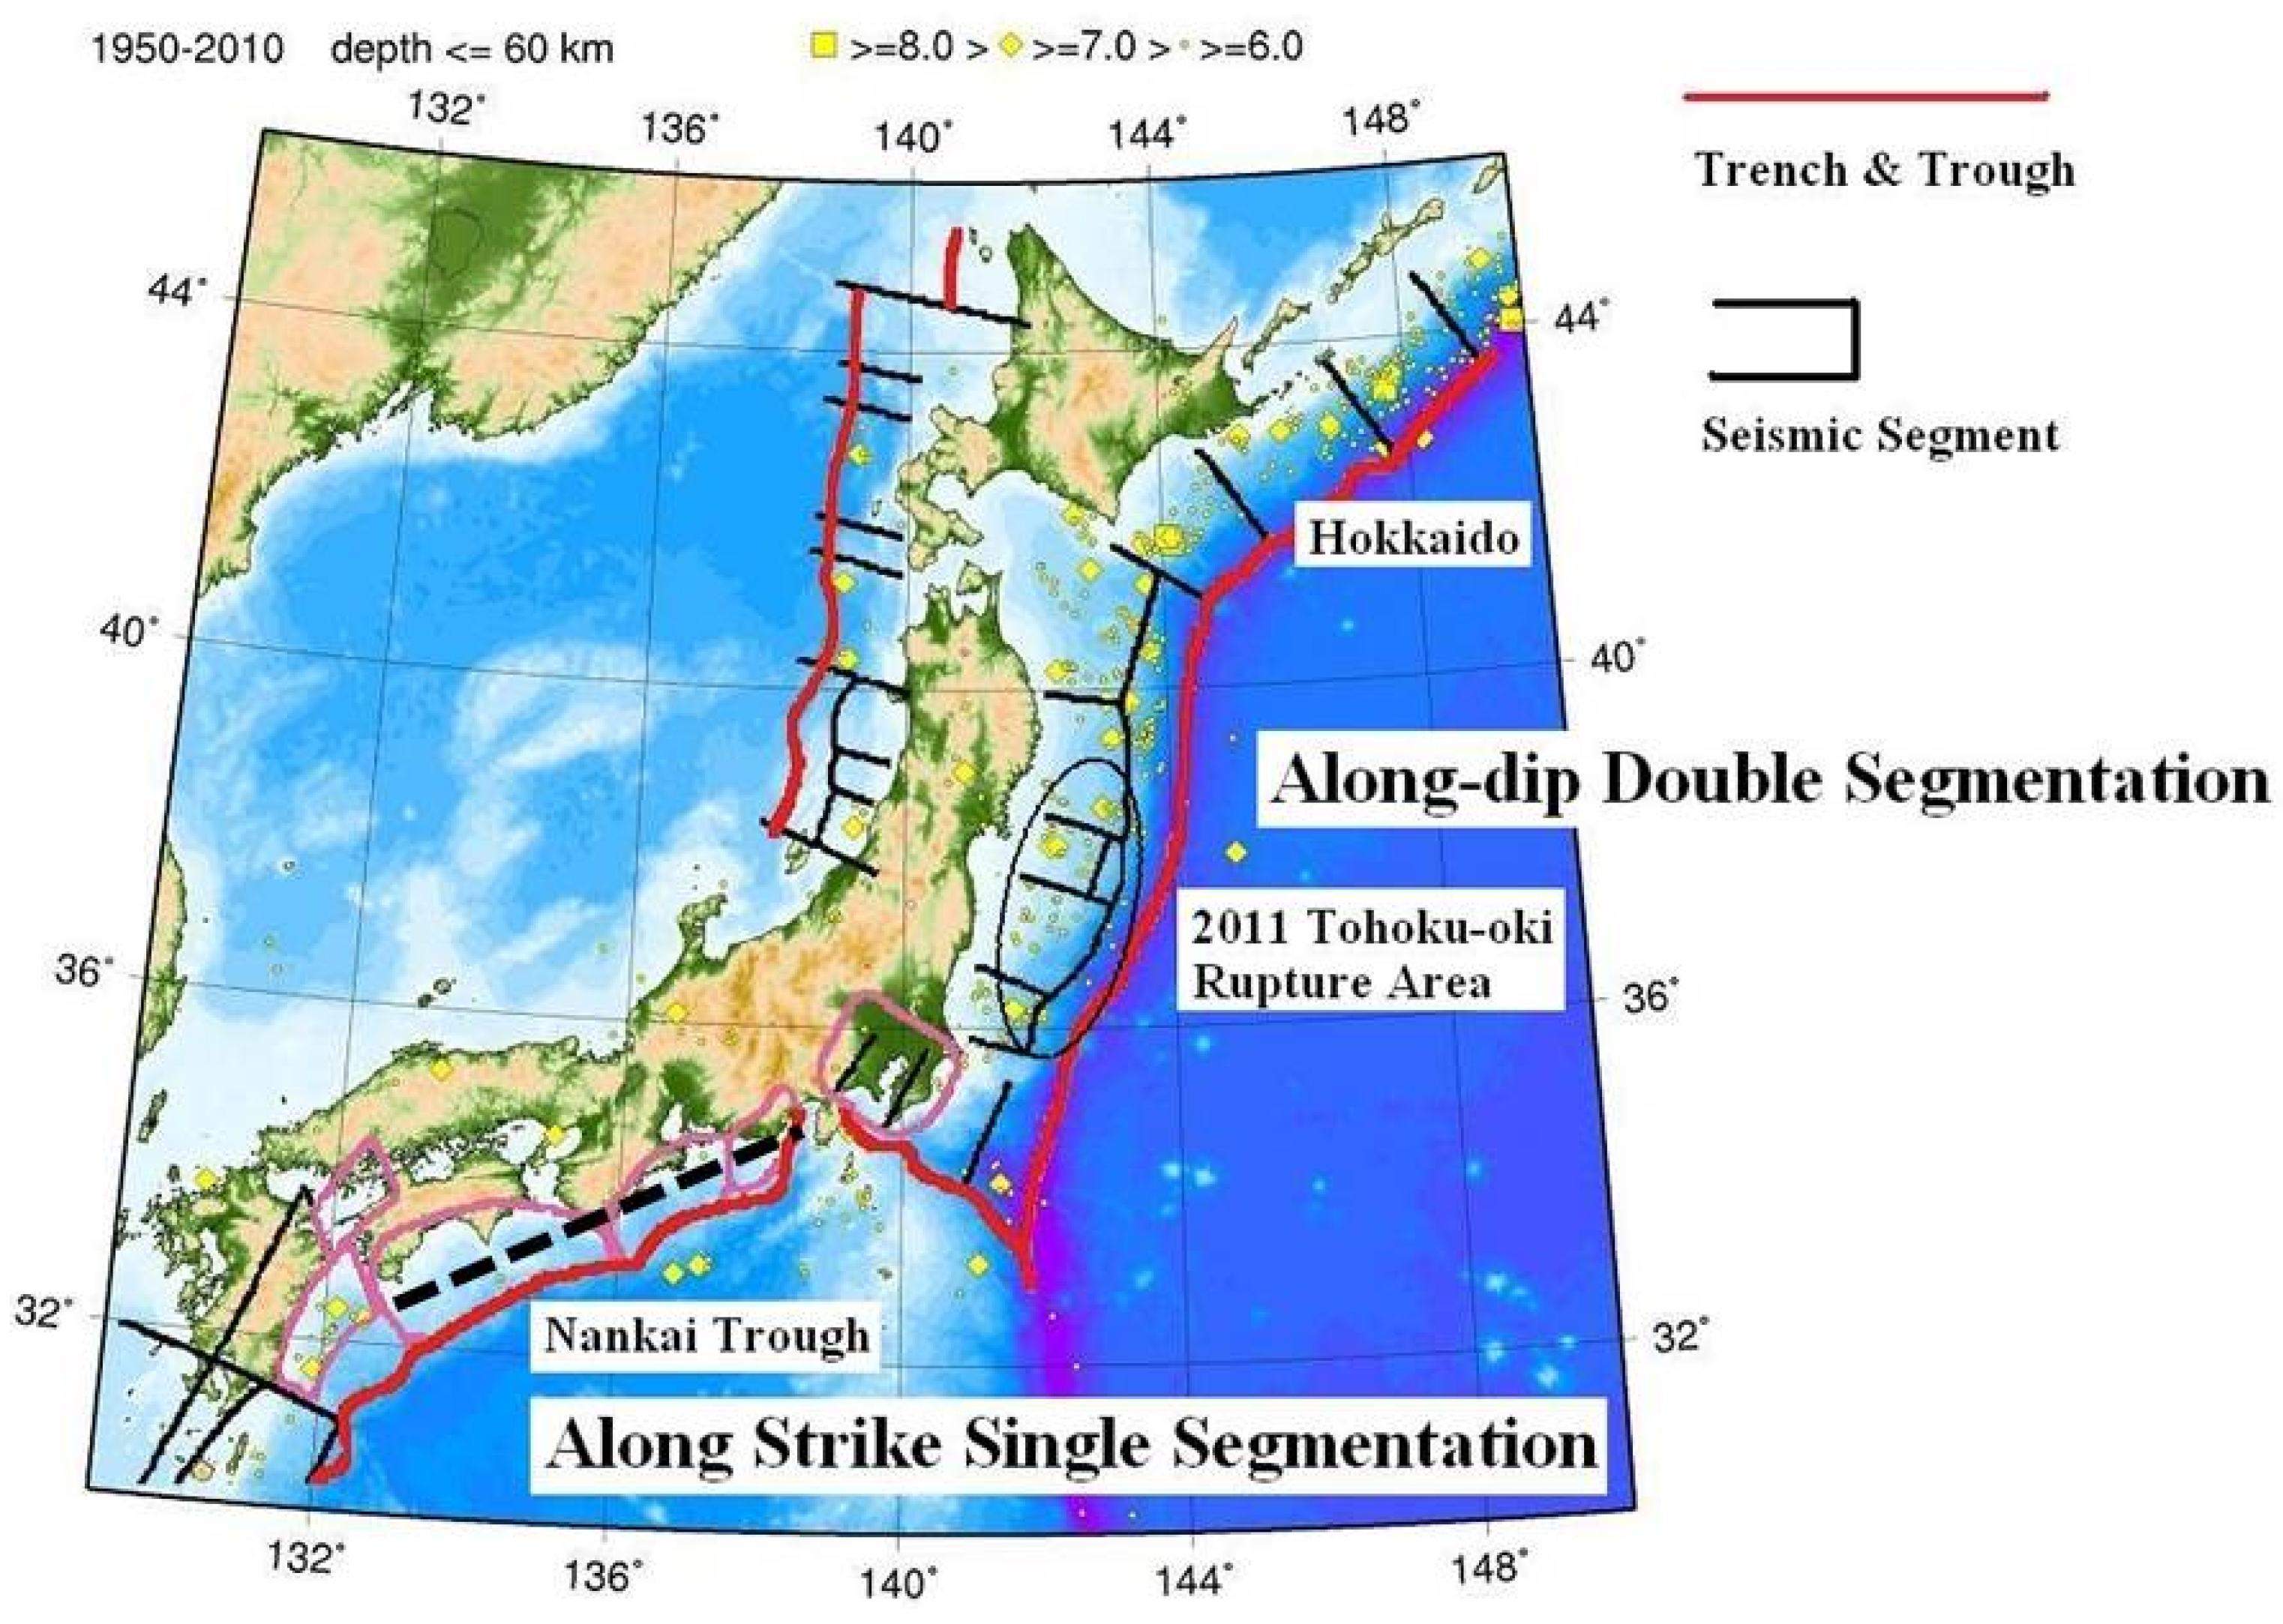
Figure 1.
Seismic activity in Japan and in its vicinity. Seismic segments have been used in the official earthquake forecasting [
10] of Evaluation of Major Subduction Zone Earthquakes by the Headquarters for Earthquake Research Promotion. Epicenters of earthquakes are plotted by yellow symbols from 1950 to 2010 with magnitudes larger than 5.9 and their focal depths shallower than 61km determined by the Japan Meteorological Agency [
11]. Trench and trough near the Japan Islands are illustrated by red curves. The 2011 Tohoku-oki megathrust earthquake ruptured the area circled by a solid ellipse, where is Along-dip Double Segmentation (ADDS). Along-strike Single Segmentation (ASSS) can be found in the Nankai Trough, where little recent seismic activity has been observed. Such regions are often called seismic gaps [
12]. The source extent of the 1707 Houei great earthquake in this segmentation is added by a broken line along the Nankai Trough to the original figure on [
13].
The best-known megathrust earthquake in Japan is the 1707 Houei great earthquake along the Nankai Trough with three major segments in
Figure 1. This historical event exhibits an interaction in the trench-axis direction among adjacent segments. The 1707 Houei great earthquake took place at a very different site from that of the 2011 megathrust event, where little seismic activity is observed in the single aligned seismic-segmentation along the axis of the Nankai Trough (
Figure 1). The inactive seismicity in this region not only applies to the period analyzed in
Figure 1 but also to the whole period from 1924 to the present, according to the Japan Meteorological Agency [
11], except for the enhanced aftershock activity following the 1944 Tonankai earthquake Mw8.2 and the 1946 Nankaido earthquake Mw8.2, which successively occurred along the Nankai Trough. The Houei earthquake of multi-segment rupture is referred to an earthquake in Along-strike Single Segmentation (ASSS), which contrasts to the 2011 Tohoku-oki megathrust earthquake in ADDS.
The reason for a gigantic megathrust earthquake in ADDS to grow up to such the scale is due to the rupture of strongly-coupled asperity in the trench-ward segment with a longer recurrence time (e.g., millennial) after large earthquakes in the land-ward segments repeated with a shorter recurrence time (e.g., centennial). The activity in ASSS is characterized by almost 100% coupled areas of shallow subduction zones, which finally gives rise to a great earthquake. In other words, the difference between these two types of segmentations appears in a seismic gap [
12] along the subduction zone in ASSS and in a doughnut pattern [
14] of seismic activity in the subduction zone prior to a gigantic megathrust earthquake in ADDS.
These two types of segmentations (
i.e., ASSS and ADDS) can be found not only in the vicinity of Japan but also elsewhere in the world. The 1952 Kamchatka earthquake of Mw 9.0 and the 1964 Alaska earthquake of Mw9.2 are pointed out to be of ADDS type, while the 1960 Chile earthquake of Mw9.5 and the 2010 Maule earthquake of Mw8.8 are of ASSS [
4,
5]. Speaking about the 2004 Sumatra-Andaman earthquake of Mw9.3, the faulting process is peculiar. Judging from the detailed analysis on the seismicity around the source region of the 2004 earthquake [
1], the 2004 event started in the ADDS region and extended into the Andaman-Nicobar ASSS region [
13]. The latter region is a typical oblique subduction zone, and is quite similar to the source areas of great earthquakes of the 1957 Andreanof Mw8.6 and the 1965 Rat Island Mw8.7 in the Aleutian arc.
General descriptions of proposed ADDS and ASSS are summarized in
Table 1, indicating the distinction from the previous seismic segmentations e.g., [
2,
3]. Seismic segments in ASSS are usually characterized by a narrow subduction zone from the oceanic trench to the island arc. The evidence has been presented, showing the asperity of the 2010 Maule earthquake in accordance with the strongly-coupled plate interface identified by GPS observation beforehand of the 2010 event [
15]. Seismic segments in ADDS are, on the other hand, rather wide. The 2011 Tohoku-oki megathrust earthquake revealed that the strongly-coupled segments exist in the trench-ward of ADDS, where the millennial seismic-asperity of the event was observed [
16,
17]. This is also true in the 1964 Alaska earthquake [
18], showing a very strong asperity in the Alaska Bay close to the Aleutian Trench. Large (not as large as gigantic) earthquakes occur repeatedly in the landward segments of ADDS with their foci in the deep part of the subduction zone. As a result, the asperity of repeated large earthquakes in ASSS is distributed in a shallow part of the subduction zone, while that of the repeated large earthquakes in ADDS stay in a rather deeper part. This would result in a different tsunami excitation between ADDS and ASSS earthquakes.
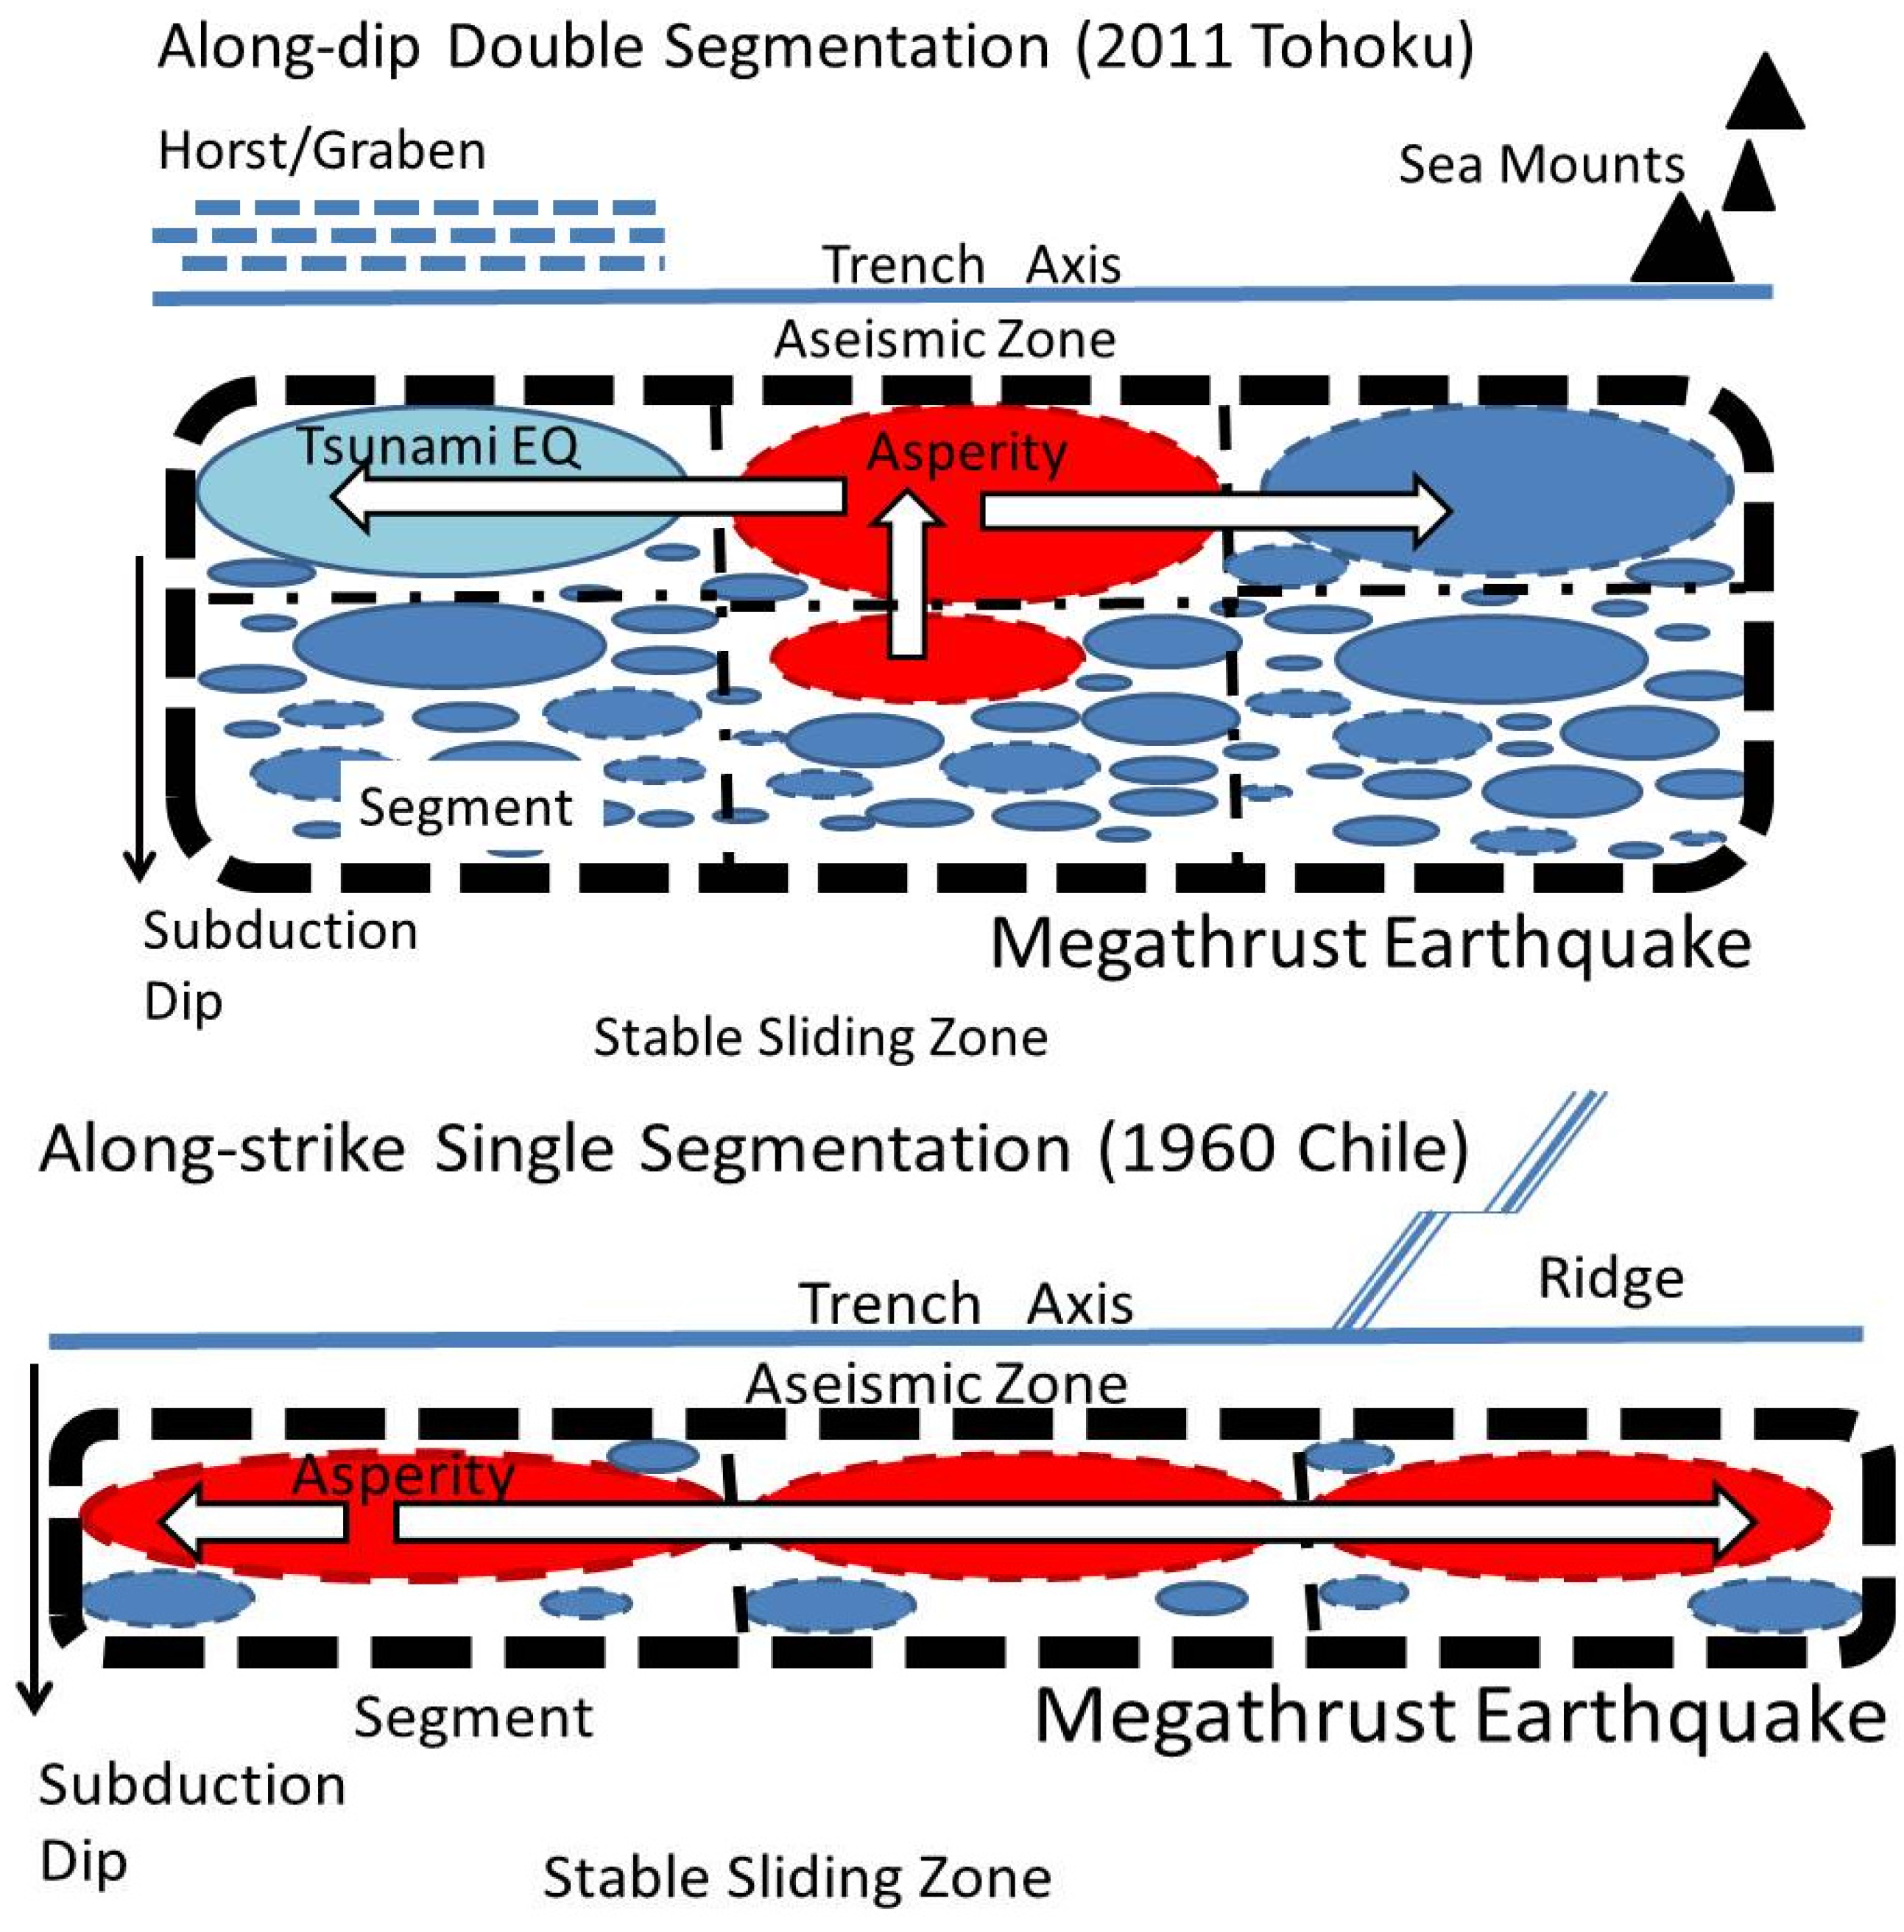
Figure 2 illustrates an image of earthquake cycles in ADDS and ASSS. An earthquake cycle in ASSS is commonly restricted in the shallow part of the subduction zone, where the contact of the plate interface is strong, forming the seismic gap all over the particular subduction zone. Successive rupture of multiple seismic segments along the trench direction results in a megathrust earthquake (metaphoric centennial event) in ASSS. On the other hand, an earthquake cycle in ADDS is characterized by repeated earthquakes as large as Mw8 and many smaller earthquakes are commonly found in the island-ward segments of the subduction zone, though the asperity in the trench-ward stays still, which eventually induces a megathrust earthquake (metaphoric millennial event) in ADDS. At the time of an ADDS megathrust event, the rupture extends in the dip-direction as well as in the strike-direction of the subduction zone.
Figure 2.
Schematic illustration of Along-dip Double Segmentation (ADDS) and Along- strike Single Segmentation (ASSS). ADDS is characterized by a double aligned seismic-segments along dip direction of subduction, one of which is a strongly-coupled asperity in the trench-ward segments, which eventually ruptures induced by an asperity in the island-ward segment(s) where repeated large earthquakes as large as Mw8 and many smaller-sized earthquakes (solid ellipses) occur. Rupturing all these segments results in a millennial megathrust earthquake (square by thick broken line) like the 2011 Tohoku event. ASSS shows a seismic gap of subduction interface along the trench axis in single aligned seismic-segments side by side. The asperity stays in a narrow part of the subduction interface in ASSS. Horst and Graben and seamounts are considered to be responsible for generating tsunami earthquakes [
19,
20,
21]. As well as Horst and Graben, surface roughness such as seamounts and oceanic ridges plays an important role in blocking seismic segments (dotted broken lines) along the subduction zone [
2].
![Jmse 03 01178 g002]()
Table 1.
Characteristics of the seismic activity in Along-strike Single Segmentation (ASSS) and Along-dip Double Segmentation (ADDS).
Table 1.
Characteristics of the seismic activity in Along-strike Single Segmentation (ASSS) and Along-dip Double Segmentation (ADDS).
| | ASSS | ADDS |
|---|
| Alignment | Single Aligned | Double Aligned |
| Seismic Zone | Narrow | Wide |
| Width/Length | 1:4 | 1:2 |
| Interface Contact | Single Whole Contact | Island-ward/Trench-ward |
| Seismic Activity | Quiet Everywhere Seismic Gap | Active/Quiet Doughnut Pattern |
| Recurrence Time | A Few Hundred | A Few Hundred/A Thousand |
| Interface Contact | Whole Zone | Contact/Strong Contact |
| Previous Events | 1960 Chile, 1707 Houei | 1964 Alaska, 2011 Tohoku |
| Possible Region | Cascade, Canada | Hokkaido, Japan [21] |
Although the segmentation of ADDS/ASSS is our proposed understanding on the seismic source region of megathrust/great earthquakes, we need to deepen our understanding of these segmentations in order to distinguish megathrust earthquakes in the future and also to reduce the disasters due to such different types of earthquakes and tsunamis. This study is an attempt to enlarge our knowledge on the tsunami excitations in relation to the different seismic segmentations.
3. Tsunami Magnitudes for Tsunamigenic Earthquakes near Japan
Tsunamis generated in the vicinity of Japan have been quantified from −1 to 4 using tsunami heights and disaster distribution near respective source regions [
22,
23]. This is called the Imamura-Iida scale of tsunamis, and it has been determined from historical documents and recorded evidence in Japan since 176 A.D. This is available at present, as listed in major tsunami catalogs, such as Historical Tsunami Data Base for the World Ocean [
24]. This scale for tsunamis is similar to earthquake intensity, such as the Mercalli intensity scale. Local tsunami magnitude
m is numerically defined [
25,
26], extending the Imamura-Iida scale. The definition of
m is, using tsunami heights
H (peak to trough in meter) recorded on tide-gauges and correction for tsunami travel distances
(km) as
Since this is the tsunami magnitude scale investigated well in Japan, at first we analyzed this local tsunami magnitude m comparing with seismic moment Mo of each earthquake that occurred near Japan.
Another magnitude scale,
Mt is the far-field tsunami magnitude [
27], of which definition is
where
is the maximum amplitude of tsunami heights in meter and
is an empirical station correction or regionally-averaged correction. The correction term and the constant 9.1 are introduced so that
Mt agrees with moment magnitude
Mw [
28] of each earthquake.
Mt scale is extended to estimate tsunami magnitude
Mt for local earthquakes near Japan [
7] as
The same analysis is made to study the relation between Mt and Mo of tsunamigenic earthquakes near Japan, taking into account the seismic segmentations.
Historical tsunami heights until recent years were measured in tide gauge stations at best located in developed harbors, most of which face in the opposite direction to their respective open seas. Others are eyewitness records and traces of inundations and up-streams. All these data and their sources are listed on the worldwide tsunami catalogs [
23,
24]. Quantification of tsunami excitation and scaling relations of tsunamis to earthquake source parameters have been made based on those observations. After the recent installation of ocean-bottom pressure gauges, the observation makes it possible to study the tsunami generation free from the contaminations of detail oceanic bathymetry and coastal topography. Unfortunately or fortunately, only few records are available now e.g., [
17]. Therefore, it is necessary to apply historical tsunami data to describe the general scaling relation of tsunami excitation to earthquakes and to study the generation mechanism of tsunamis.
In the above equations of (1) and (2), the dependence of tsunami magnitudes on tsunami heights are different. This is because local tsunami magnitude m is based on the energy of tsunami waves and far-field tsunami magnitude Mt on the amplitude of tsunami waves. It is true that these tsunami magnitudes are empirical parameters and needed to be rigorously quantified; however, the present study is interested only in their regional bias due to regional seismic segmentation. The analysis would be granted, since the discussion here is made in a relative manner based on the tsunami magnitudes, which would be free from the absolute uncertainty of tsunami magnitude determination.
4. Tsunami Magnitude and Seismic Moment of Tsunamigenic Earthquakes near Japan
Local tsunami magnitude
m and seismic moment
Mo of 59 tsunamigenic earthquakes in the vicinity of Japan since 1923 have been determined.
Table 2 summarizes those data with their references. There is a variety of earthquakes occurring near Japan, which cannot be classified into ADDS nor ASSS, although tsunamis were excited and recorded. Some of them were intra-plate and outer-rise earthquakes of normal-fault type and the others are earthquakes near the shore of the Japan Islands of the strike-slip type [
13]. Therefore, we classify them into ADDS, ASSS and NFSS (Normal Fault-Strike Slip).
Figure 3 shows the locations of all the earthquakes in
Table 2.
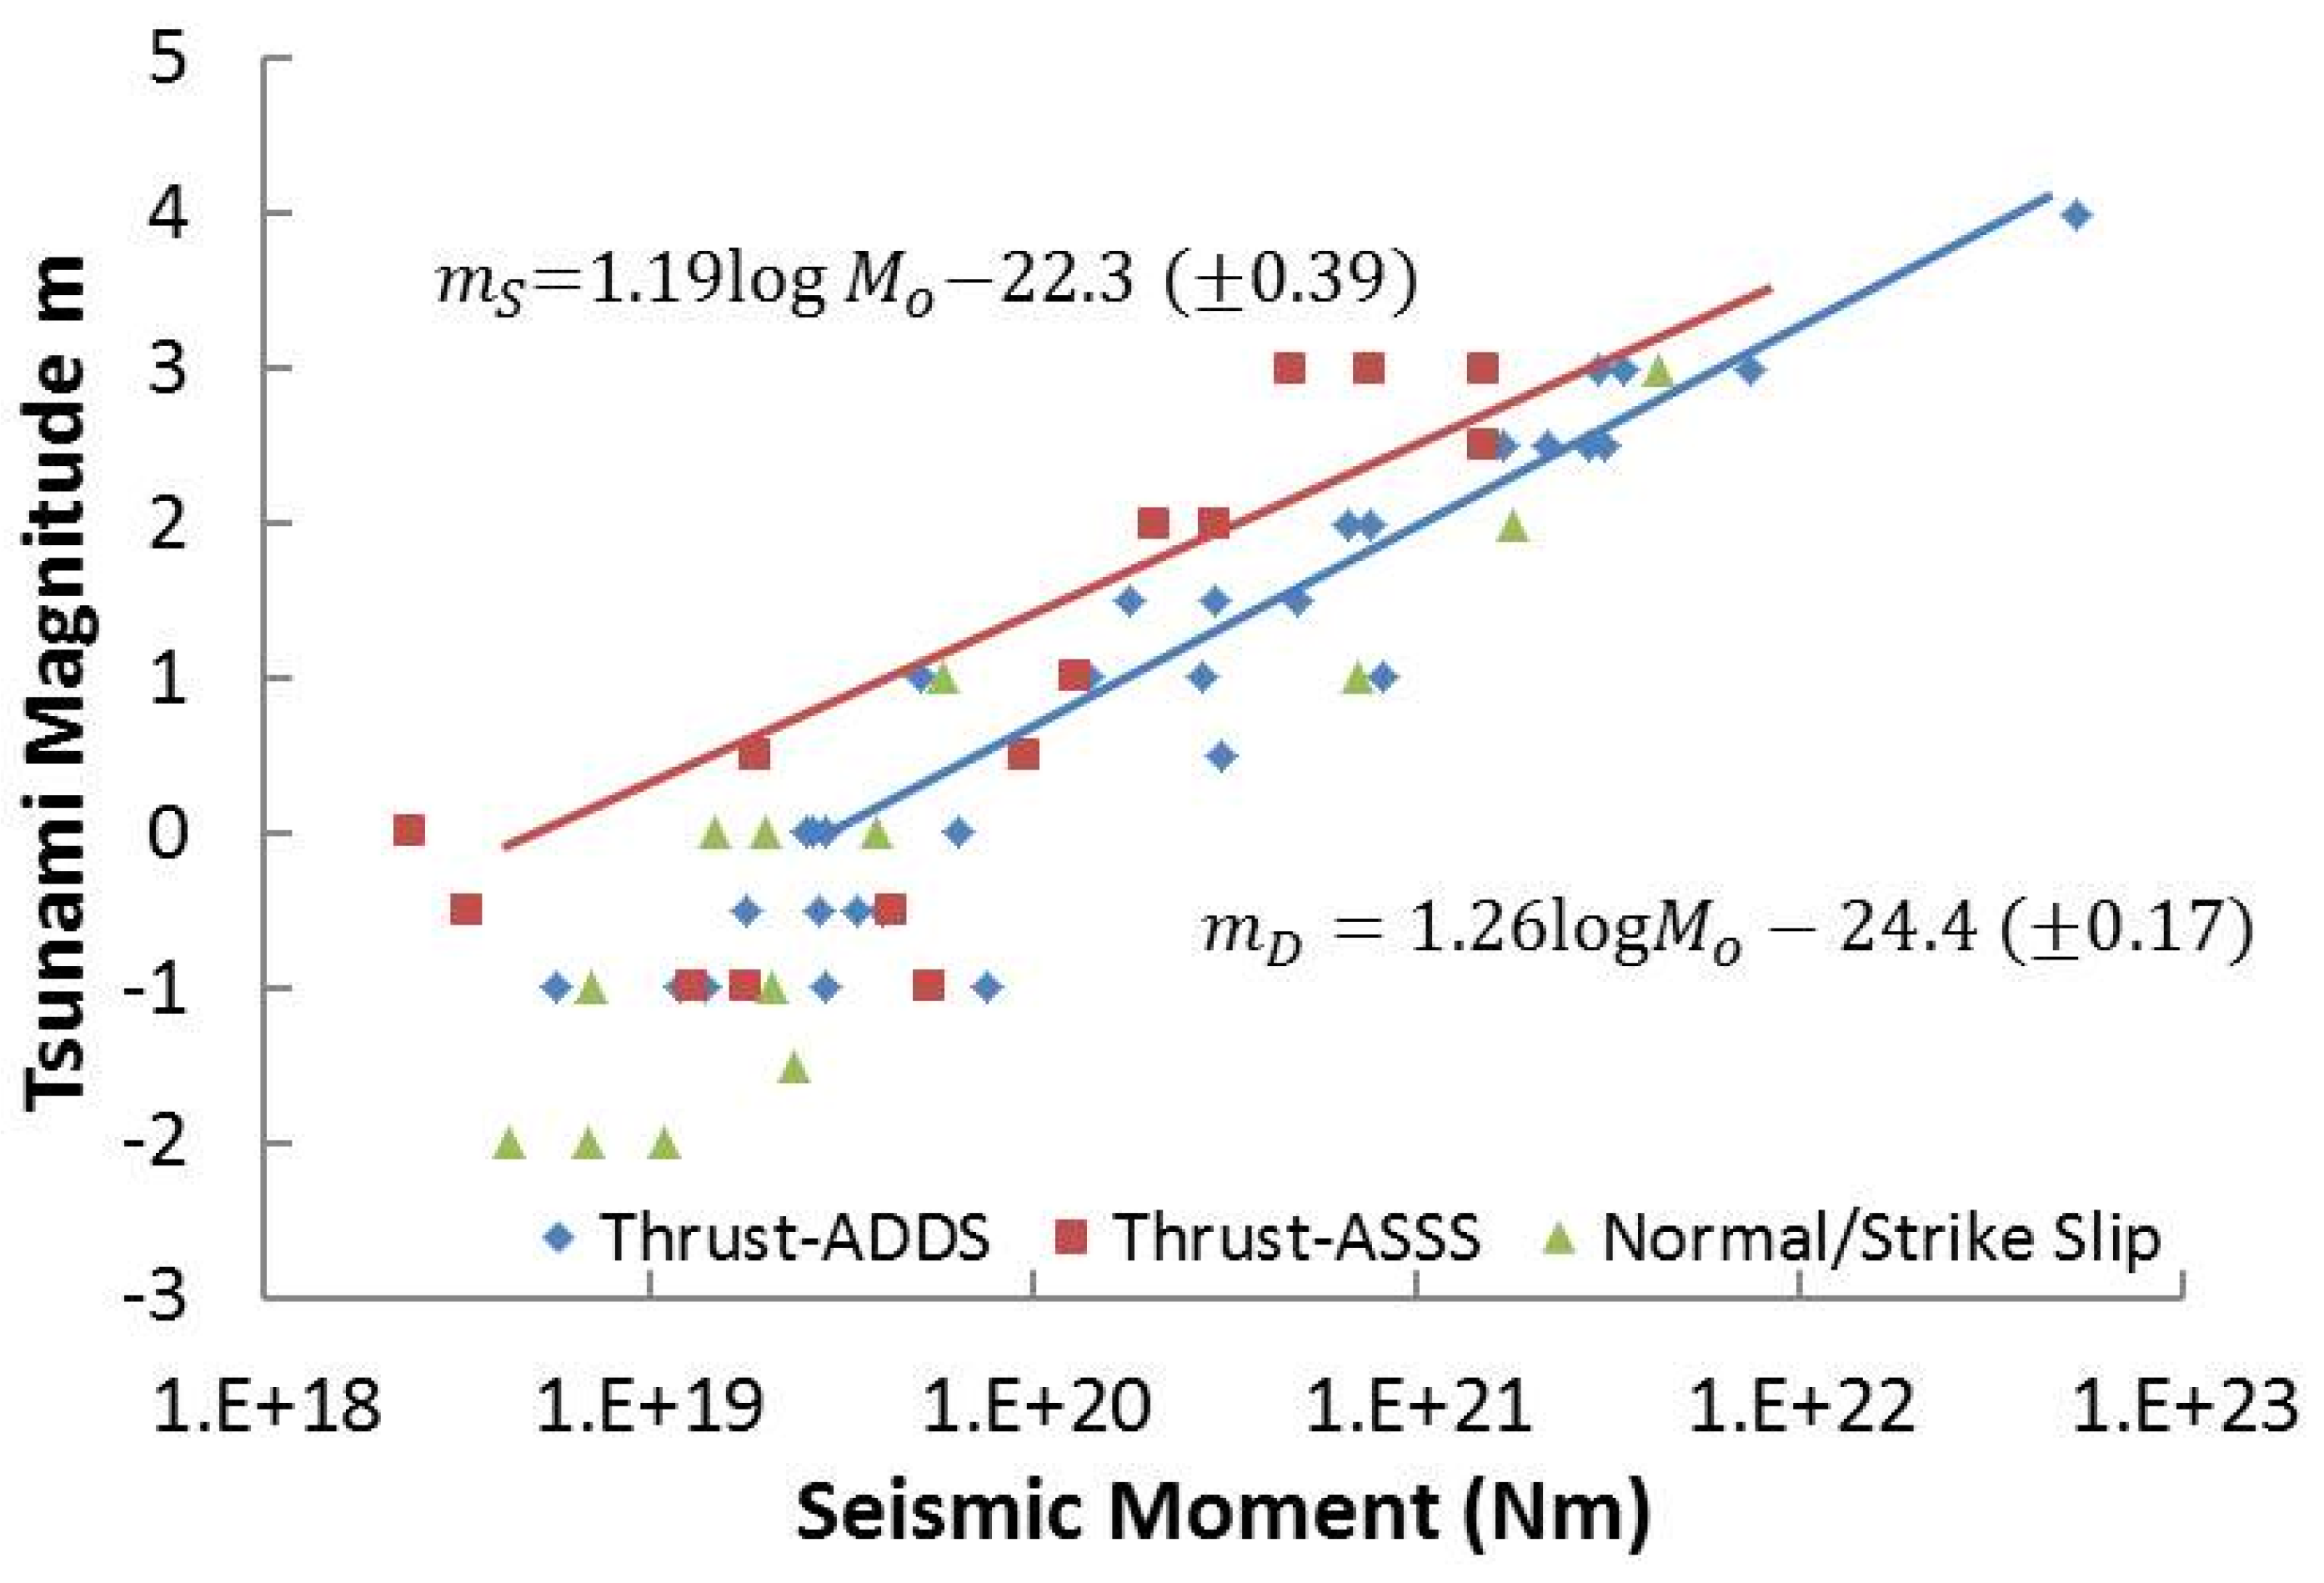
Figure 4 shows the least-squares regressions between
m and
Mo for ADDS (
; 22 events in
Table 2) and ASSS (
; 10 events in
Table 2).
The data of which
m is smaller than 0 in
Table 2 is not included in the regression analyses, because the tsunami height is smaller than 15cm at the distance of 100km for
and smaller than −0.5, which we considered large uncertainty in observations. The regression relation for the NFSS category is not calculated, because it is irrelevant in this study. However, it should be noted that the relationship looks similar to that for ADDS in general and deviates from ASSS.
The purpose of above analyses is not to introduce other empirical relationships but to quantify the difference in tsunami excitation due to the seismic segmentation. We find that
m of ASSS is about 0.7 larger than that of ADDS for the earthquakes with
of
Nm and 0.6 for
Nm, which are within the 95% confidence interval. Considering the scatter of the data in
Figure 4 and the basic data of tsunami heights to determine
m, the difference of
m would be about 1.0 at most.
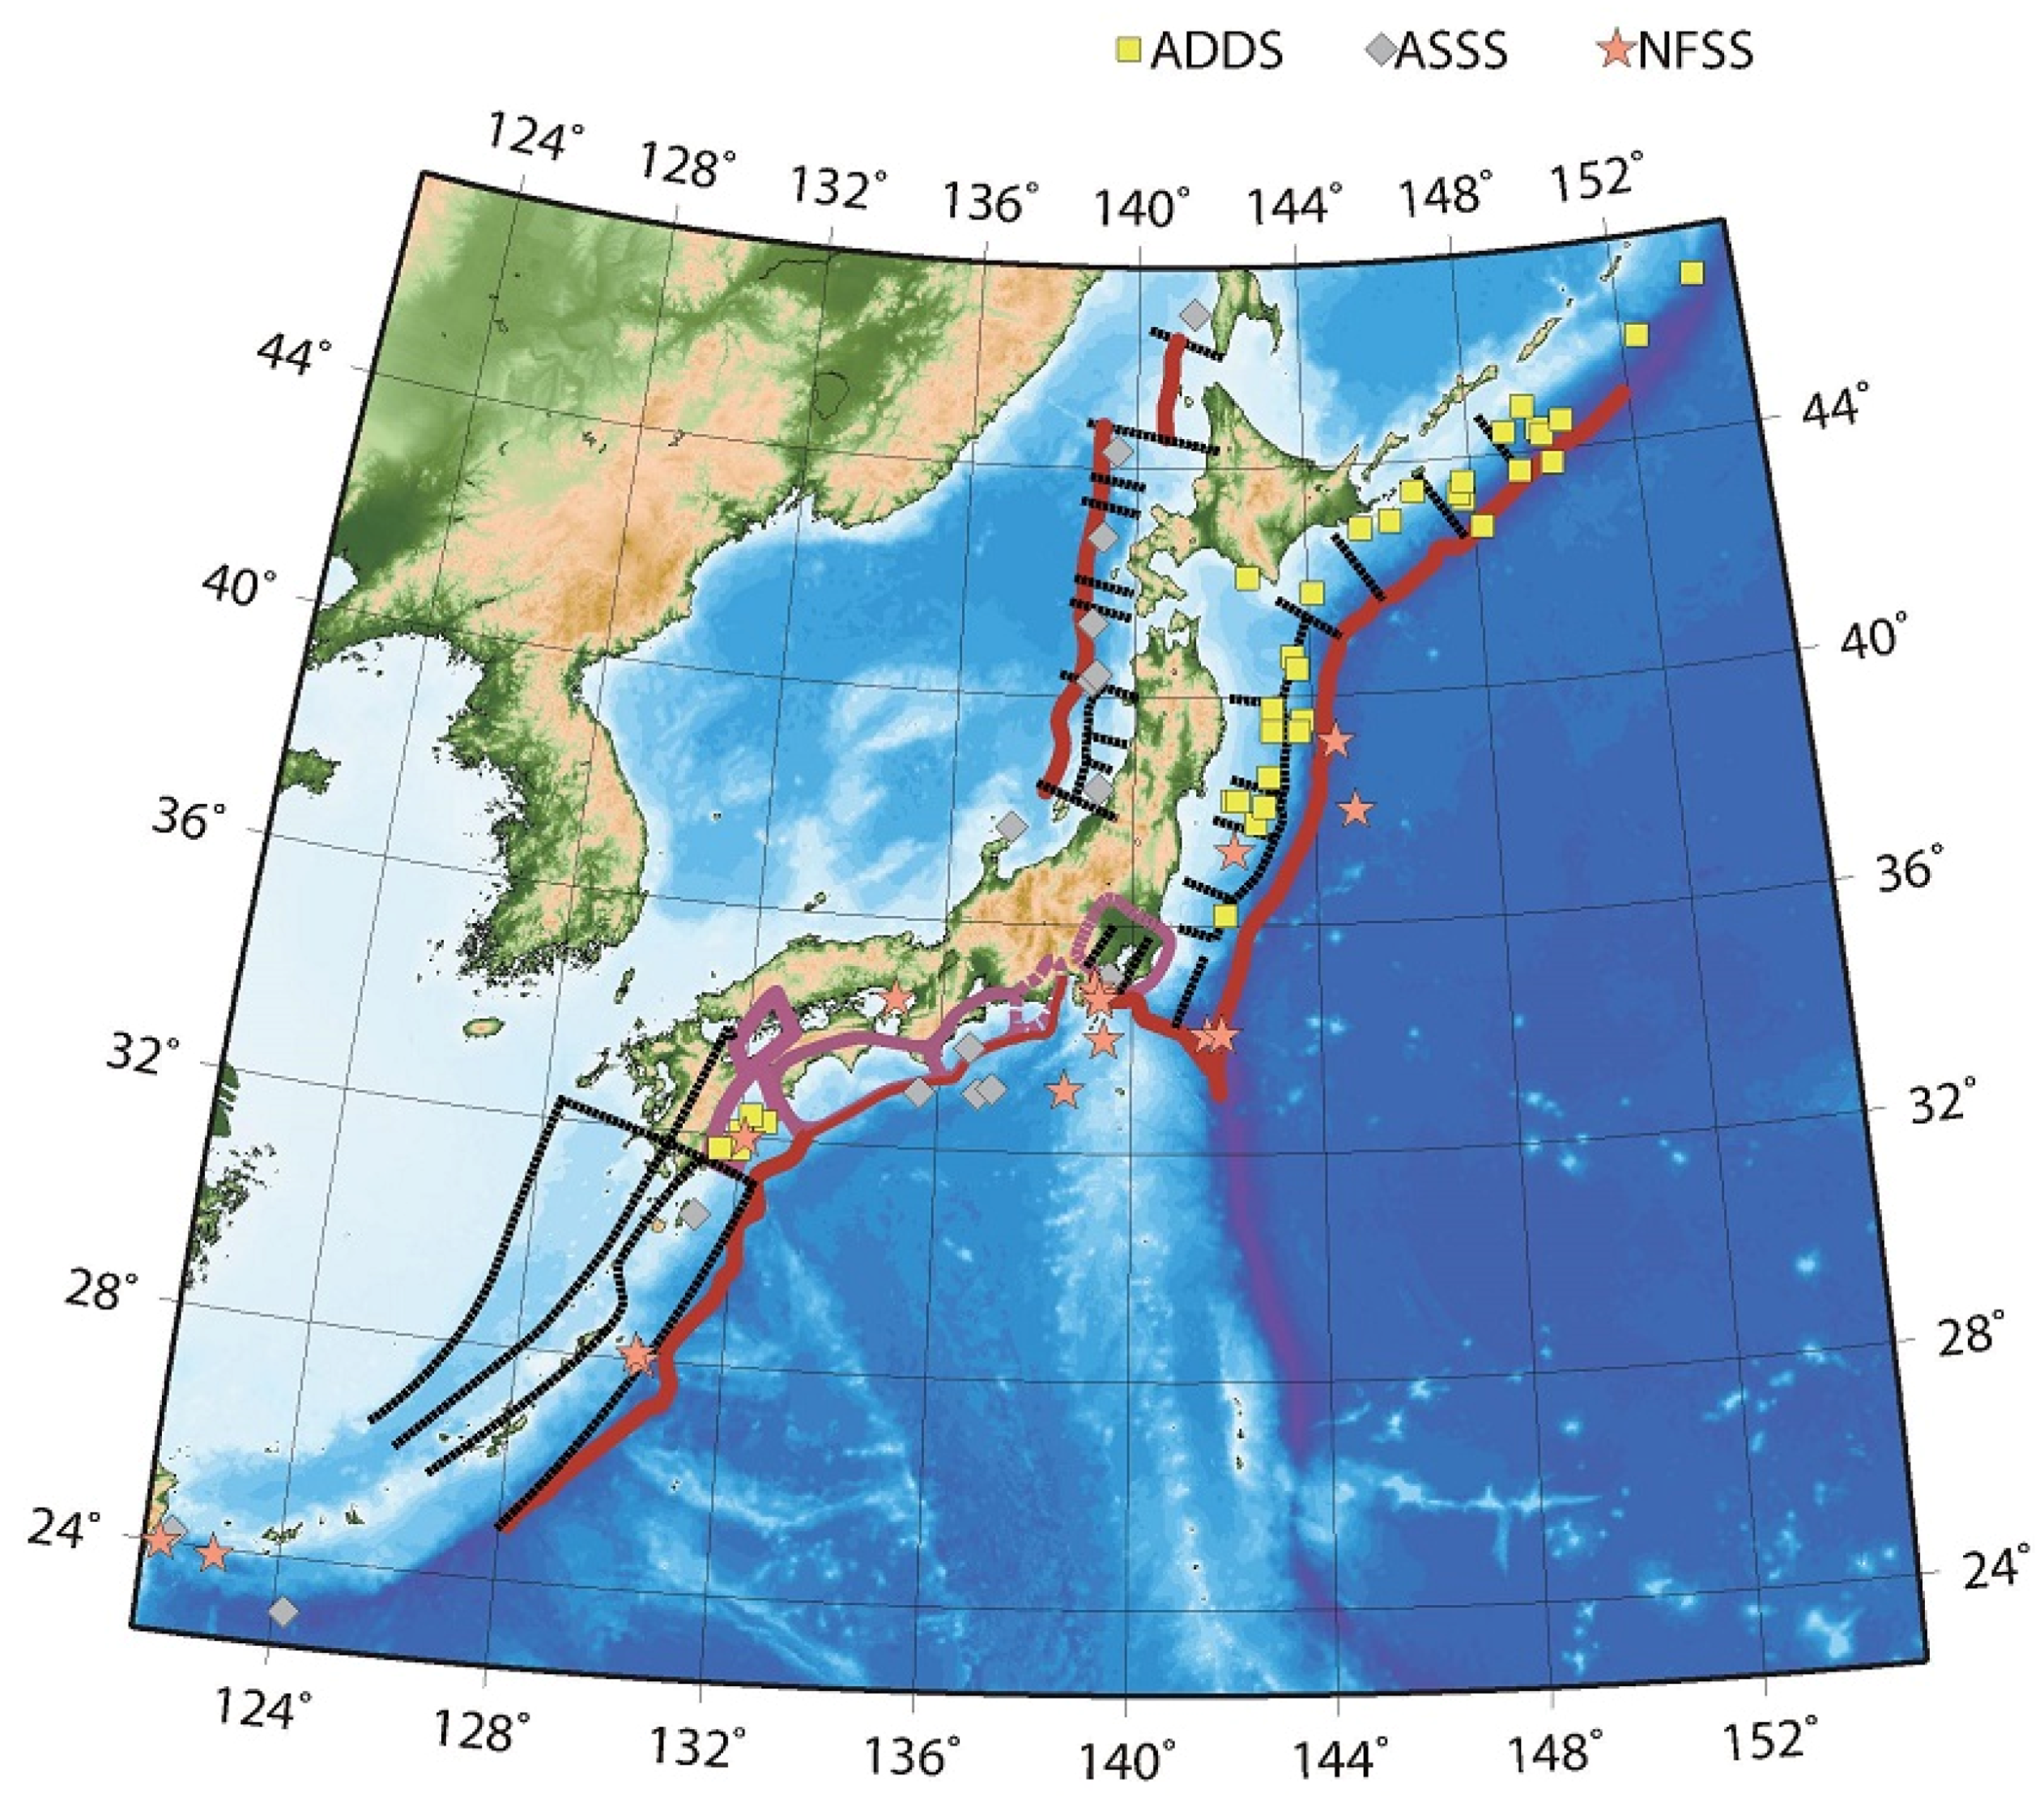
Figure 3.
Epicenter locations of tsunamigenic earthquakes near Japan from 1923. Earth-quakes are categorized into ADDS, ASSS and Normal Fault/Strike Slip (NFSS), which are plotted by different symbols. Seismic segments in
Figure 1 are also drawn.
Figure 3.
Epicenter locations of tsunamigenic earthquakes near Japan from 1923. Earth-quakes are categorized into ADDS, ASSS and Normal Fault/Strike Slip (NFSS), which are plotted by different symbols. Seismic segments in
Figure 1 are also drawn.
Figure 4.
Tsunami magnitude m in relation to seismic moment Mo of corresponding earthquakes near Japan. Different symbols represent different category of earthquakes. Least squares regressions between m ( and and Mo for ADDS and ASSS earthquakes, respectively are derived.
Figure 4.
Tsunami magnitude m in relation to seismic moment Mo of corresponding earthquakes near Japan. Different symbols represent different category of earthquakes. Least squares regressions between m ( and and Mo for ADDS and ASSS earthquakes, respectively are derived.
Table 2.
Tsunami magnitude and seismic moment of earthquakes near Japan since 1923.
Table 2.
Tsunami magnitude and seismic moment of earthquakes near Japan since 1923.
| Year | Month | Day | Location | Mw# | Mt$ | m% | Mo (N·m) | Dip+ | DipSlip* | Segment | Ref |
|---|
| 1923 | 9 | 1 | Kanto | 7.9 | 8.0 | 2.0 | 7.60 × 10²⁰ | 0.56 | 0.17 | ADDS | [29] |
| 1933 | 3 | 3 | Sanriku | 8.4 | 8.3 | 3.0 | 4.30 × 10²¹ | | | NF | [30] |
| 1938 | 11 | 5 | Fukushima | 7.8 | 7.6 | 1.0 | 7.00 × 10²⁰ | | | NF | [31] |
| 1940 | 8 | 2 | W.Hokkaido | 7.5 | 7.7 | 2.0 | 2.10 × 10²⁰ | 0.72 | 0.72 | ASSS | [32] |
| 1944 | 12 | 7 | Tonankai | 8.1 | 8.1 | 2.5 | 1.50 × 10²¹ | 0.17 | 0.17 | ASSS | [33] |
| 1946 | 12 | 21 | Nankaido | 8.1 | 8.1 | 3.0 | 1.50 × 10²¹ | 0.17 | 0.17 | ASSS | [33] |
| 1952 | 3 | 4 | Tokachi-oki | 8.1 | 8.2 | 2.5 | 1.70 × 10²¹ | 0.34 | 0.33 | ADDS | [34] |
| 1963 | 10 | 13 | Kurile | 8.5 | 8.4 | 3.0 | 7.50 × 10²¹ | 0.37 | 0.37 | ADDS | [34] |
| 1964 | 5 | 7 | Oga-oki | 7.0 | 7.1 | −0.5 | 4.30 × 10¹⁹ | | | ASSS | [32] |
| 1964 | 6 | 16 | Niigata | 7.6 | 7.9 | 2.0 | 3.00 × 10²⁰ | 0.94 | 0.94 | ASSS | [35] |
| 1968 | 4 | 1 | Hyuganada | 7.4 | 7.7 | 1.5 | 1.80 × 10²⁰ | 0.29 | 0.29 | ADDS | [36] |
| 1968 | 5 | 16 | Tokachi-oki | 8.2 | 8.2 | 2.5 | 2.80 × 10²¹ | 0.34 | 0.21 | ADDS | [37] |
| 1968 | 6 | 12 | Iwate-oki | 7.1 | 7.4 | 1.0 | 5.10 × 10¹⁹ | 0.50 | 0.24 | ADDS | [38] |
| 1969 | 8 | 12 | Kurile | 8.2 | 8.2 | 2.5 | 2.20 × 10²¹ | 0.27 | 0.27 | ADDS | [39] |
| 1970 | 7 | 26 | Hyuganada | 7.0 | 7.1 | −0.5 | 4.10 × 10¹⁹ | | | ADDS | [36] |
| 1971 | 9 | 6 | Sakhalin | 7.3 | 7.5 | 0.5 | 9.50 × 10¹⁹ | 0.63 | 0.62 | ASSS | [32] |
| 1973 | 6 | 17 | Nemuro-oki | 7.8 | 8.1 | 2.0 | 6.70 × 10²⁰ | 0.45 | 0.42 | ADDS | [40] |
| 1975 | 6 | 10 | Kurile | 7.0 | 7.9 | 1.5 | 3.00 × 10²⁰ | 0.22 | 0.22 | ADDS | [41] |
| 1978 | 1 | 14 | Oshima | 6.6 | 6.7 | −2.0 | 1.10 × 10¹⁹ | | | SS | [42] |
| 1978 | 6 | 12 | Miyagi-oki | 7.6 | 7.4 | 0.5 | 3.10 × 10²⁰ | 0.24 | 0.21 | ADDS | [43,44] |
| 1980 | 6 | 29 | E. Izu | 6.4 | 6.3 | −2.0 | 7.00 × 10¹⁸ | | | SS | [43,44] |
| 1982 | 3 | 21 | Urakawa | 6.9 | 7.1 | 0.0 | 2.60 × 10¹⁹ | 0.47 | 0.47 | ADDS | [43,44] |
| 1982 | 7 | 23 | Ibaraki-oki | 7.0 | 7.0 | −0.5 | 2.80 × 10¹⁹ | | | ADDS | [43,44] |
| 1983 | 5 | 26 | C.Nihonkai | 7.9 | 8.1 | 3.0 | 7.60 × 10²⁰ | 0.45 | 0.45 | ASSS | [43,44] |
| 1983 | 6 | 21 | W. Aomori | 7.0 | 7.3 | 0.5 | 1.90 × 10¹⁹ | 0.68 | 0.68 | ASSS | [43,44] |
| 1984 | 3 | 24 | Etorof-oki | 7.1 | 7.1 | 0.0 | 6.40 × 10¹⁹ | 0.29 | 0.28 | ADDS | [43,44] |
| 1984 | 8 | 7 | Hyuganada | 6.9 | 6.9 | −1.0 | 2.90 × 10¹⁹ | | | ADDS | [43,44] |
| 1984 | 9 | 19 | Boso-oki | 6.8 | 7.3 | 0.0 | 2.00 × 10¹⁹ | | | NF | [43,44] |
| 1986 | 11 | 15 | Taiwan-oki | 7.3 | 7.6 | 1.0 | 1.30 × 10²⁰ | 0.54 | 0.54 | ASSS | [43,44] |
| 1989 | 10 | 29 | Sanriku-oki | 6.9 | 6.8 | −1.0 | 5.80 × 10¹⁸ | | | ADDS | [43,44] |
| 1989 | 11 | 2 | Sanriku-oki | 7.2 | 7.5 | 1.0 | 1.40 × 10²⁰ | 0.23 | 0.23 | ADDS | [43,44] |
| 1990 | 2 | 20 | N. Oshima | 6.2 | 6.5 | −2.0 | 4.30 × 10¹⁸ | | | SS | [43,44] |
| 1990 | 9 | 24 | Tokai-oki | 6.5 | 6.8 | −1.0 | 7.10 × 10¹⁸ | | | SS | [43,44] |
| 1991 | 12 | 22 | Uruppu Isl | 7.5 | 7.5 | 1.0 | 2.80 × 10²⁰ | 0.28 | 0.27 | ADDS | [43,44] |
| 1992 | 7 | 18 | Sanriku-oki | 6.8 | 7.2 | 0.0 | 2.70 × 10¹⁹ | 0.19 | 0.18 | ADDS | [43,44] |
| 1993 | 2 | 7 | Noto Pen. | 6.6 | 6.7 | −0.5 | 3.40 × 10¹⁸ | | | ASSS | [43,44] |
| 1993 | 7 | 12 | SW Hokkaido | 7.7 | 8.1 | 3.0 | 4.70 × 10²⁰ | 0.57 | 0.57 | ASSS | [43,44] |
| 1994 | 10 | 4 | E Hokkaido | 8.1 | 8.2 | 3.0 | 3.00 × 10²¹ | 0.66 | 0.27 | ADDS | [43,44] |
| 1994 | 12 | 28 | Sanriku-oki | 7.7 | 7.7 | 1.5 | 4.90 × 10²⁰ | 0.21 | 0.19 | ADDS | [43,44] |
| 1995 | 1 | 17 | S Hyougo | 6.8 | 6.4 | −1.5 | 2.40 × 10¹⁹ | | | SS | [43,44] |
| 1995 | 10 | 18 | Kikaijima | 6.9 | 7.6 | 1.0 | 5.90 × 10¹⁹ | | | NF | [43,44] |
| 1995 | 10 | 19 | Kikaijima | 6.7 | 7.3 | 0.0 | 1.50 × 10¹⁹ | | | NF | [43,44] |
| 1995 | 12 | 4 | Etorof-oki | 7.6 | 7.6 | 1.0 | 8.20 × 10²⁰ | 0.21 | 0.21 | ADDS | [43,44] |
| 1996 | 10 | 19 | Hyuganada | 6.6 | 6.9 | −1.0 | 1.40 × 10¹⁹ | | | ADDS | [43,44] |
| 1996 | 12 | 3 | Hyuganada | 6.7 | 6.7 | −1.0 | 1.20 × 10¹⁹ | | | ADDS | [43,44] |
| 2001 | 12 | 18 | Yonagunijima | 6.8 | 6.8 | −1.0 | 2.10 × 10¹⁹ | | | NF | [43,44] |
| 2002 | 3 | 31 | E Taiwan | 7.1 | 7.2 | −1.0 | 5.40 × 10¹⁹ | | | ASSS | [43,44] |
| 2003 | 9 | 26 | Tokachi-oki | 8.1 | 8.1 | 2.5 | 3.10 × 10²¹ | 0.19 | 0.14 | ADDS | [43,44] |
| 2003 | 10 | 31 | Fukushima-oki | 6.8 | 7.0 | −0.5 | 3.50 × 10¹⁹ | | | ADDS | [43,44] |
| 2005 | 8 | 16 | Miyagi-oki | 7.1 | 7.0 | −1.0 | 7.60 × 10¹⁹ | | | ADDS | [43,44] |
| 2005 | 11 | 15 | Sanriku-oki | 6.9 | 7.3 | 0.0 | 3.90 × 10¹⁹ | | | NF | [43,44] |
| 2006 | 11 | 15 | Kurile | 7.9 | 8.2 | 3.0 | 3.50 × 10²¹ | 0.26 | 0.26 | ADDS | [43,44] |
| 2007 | 1 | 13 | Kurile | 8.2 | | 2.0 | 1.80 × 10²¹ | | | NF | [43,44] |
| 2007 | 3 | 25 | Noto Pen. | 6.9 | | −1.0 | 1.30 × 10¹⁹ | | | ASSS | [43,44] |
| 2007 | 8 | 2 | Sakhalin | 6.2 | | 0.0 | 2.40 × 10¹⁸ | 0.67 | 0.67 | ASSS | [43,44] |
| 2008 | 7 | 19 | Fukushima-oki | 6.9 | | 0.0 | 2.90 × 10¹⁹ | 0.28 | 0.28 | ADDS | [43,44] |
| 2008 | 9 | 11 | Tokachi-oki | 7.1 | | −0.5 | 1.80 × 10¹⁹ | | | ADDS | [43,44] |
| 2009 | 10 | 30 | Amamioshima | 6.8 | | −1.0 | 1.80 × 10¹⁹ | | | ASSS | [43,44] |
| 2011 | 3 | 11 | Tohoku-oki | 9.0 | 9.1 | 4.0 | 5.31 × 10²² | 0.17 | 0.17 | ADDS | [43,44] |
Since the increase of one unit in
m indicates the increase by the factor of 2.24 in tsunami heights [
25,
26], the above difference of 1.0 means the tsunami heights of ASSS earthquakes are about two times larger than those of ADDS earthquakes with the same seismic moment.
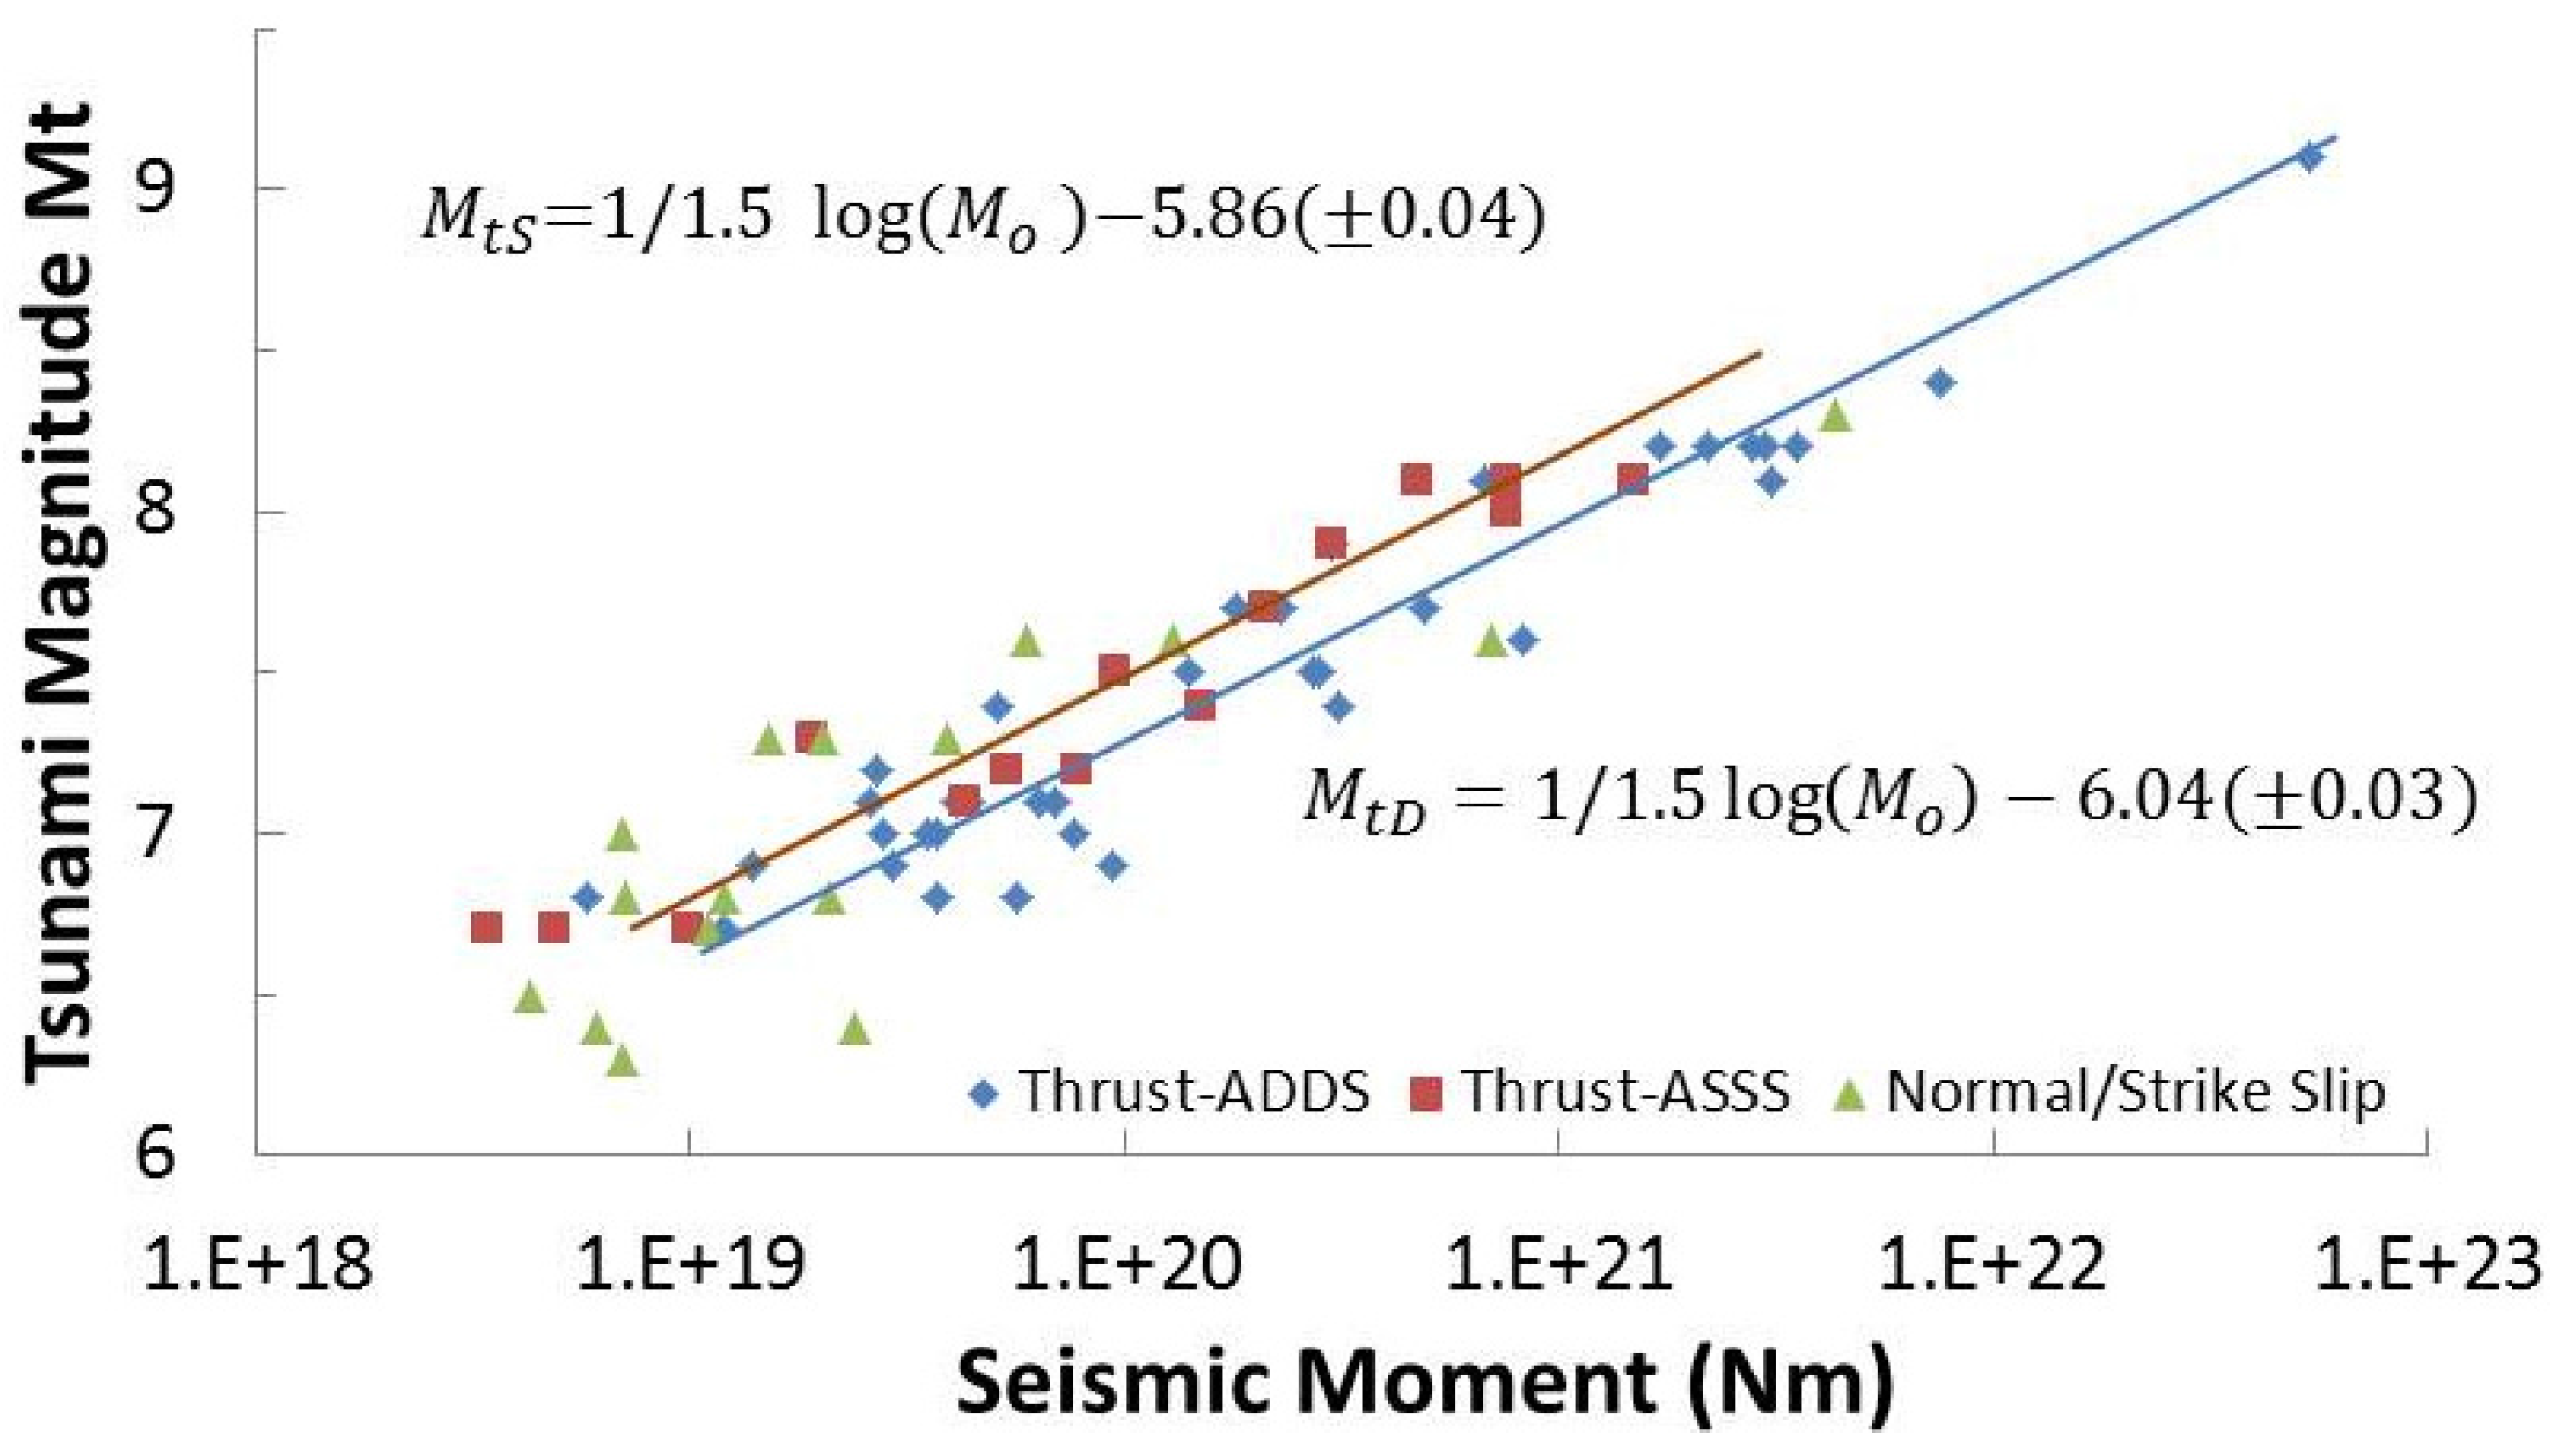
Figure 5 shows the relations between
Mt and
Mo of earthquakes in ADDS (
) and ASSS (
):
where the coefficient of 1/1.5 of the relations is from the definition of
Mw [
28] with the assumption of
Mt =
;
Although there seems to be a little difference in plots between ADDS and ASSS in
Figure 5, the difference is within the estimation uncertainty. It is about 0.2 in
Mt from Equation (5), which would suggest that tsunami heights by ASSS earthquakes are larger by a factor of about 1.8 than those by ADDS earthquakes with the same value of seismic moment. All the discussions here suggest that the tsunami excitations by ASSS earthquakes are larger, by more or less about two times, than those by ADDS earthquakes near Japan.
5. Discussion
The difference in tsunami excitation is obtained by earthquakes in ADDS and ASSS near Japan, as shown in
Figure 4 and
Figure 5. The difference is by a factor of about two. Similar emphasis has been made for tsunamigenic earthquakes in the Japan Sea through the analyses including those of tsunamis with smaller tsunami magnitude [
7,
8,
9]. Generally speaking, the larger dip angles and dip components of dislocations on the faults of earthquakes in the Japan Sea give rise to the larger tsunami excitation. This is the major reason for the difference stated in the previous studies, in addition to the effect of a soft ocean-bottom structure. However, the previous emphasis should not be restricted to tsunamis in the Japan Sea, since ASSS earthquakes outside of the Japan Sea show larger tsunami excitation similar to those in the Japan Sea (
Table 3). Therefore, the difference may not be attributed to the local ocean-bottom structures nor to faulting parameters but to the global characteristics of seismic segmentation or to the geological activity which makes such the surface structures.
Figure 5.
Tsunami magnitude
Mt [
27] in relation to seismic moment
Mo of each earth-quake near Japan. Others are the same as those in
Figure 4.
Figure 5.
Tsunami magnitude
Mt [
27] in relation to seismic moment
Mo of each earth-quake near Japan. Others are the same as those in
Figure 4.
Table 3.
Effect of dip angles and slip angles of dislocations on faults resposible for ocean-bottom vertical deformation. Average values are calculated from
Table 2.
Table 3.
Effect of dip angles and slip angles of dislocations on faults resposible for ocean-bottom vertical deformation. Average values are calculated from Table 2.
| | Dip Angle (sinδ) | Sigma % | Dip and Slip Angle (sinδsinλ) | Sigma % |
|---|
| ADDS | 0.32 | 0.13 | 0.26 | 0.08 |
| ASSS | 0.55 | 0.24 | 0.55 | 0.24 |
| ASSSexJapan * | 0.44 | 0.25 | 0.44 | 0.25 |
Tsunami height is basically responsible for the ocean-bottom vertical deformation due to earthquake faults [
47], so that the difference obtained indicates larger ocean-bottom vertical deformation for ASSS earthquakes than that for ADDS earthquakes of the same seismic moment. There would be many reasons to lead to such the difference as follows;
- (A)
Since the focal depth of ASSS earthquakes is in general shallower than those of ADDS earthquakes, the dislocation by ASSS earthquakes on particular underground faults produces larger effect on ocean-bottom deformation.
- (B)
Since the dip angle of faults by ASSS earthquakes is larger than those by ADDS earthquakes, the focal mechanism affects larger ocean-bottom deformation.
- (C)
Slip angle on the faults specifies the partition of along dip and along strike components of the dislocation on a fault. Focal mechanism of ASSS earthquakes provides more along dip components than that of ADDS earthquakes.
- (D)
Due to three dimensional structures of ocean-bottom topography, such as trench and continental shelf, tsunami excitations become large in ASSS.
- (E)
Focusing effect of tsunamis due to ocean-bottom topography near ASSS earthquake sources results in larger tsunamis.
- (F)
Soft skin layer in the ocean bottom enhances the vertical deformation, therefore, the soft sediment in the Japan Sea side would enhance the tsunami excitation there.
The reason (A) is the result of the character of ASSS asperities and/or coupled zones existing in the shallower depth of plate interfaces than that of ADDS asperities, as described in
Section 2 and
Figure 2. The reason (B) is related to (F), that is, dip angles of earthquake faults in the Japan Sea are generally larger than those of the subduction zone earthquakes in the Pacific Ocean side (
Table 3). However, ASSS earthquakes in this study include earthquakes in the Nankai Trough and the Okinawa Trough along the Philippine Sea Plate subduction as well as earthquakes in the west coast of Sakhalin. It is also apparent from the result in
Table 3 that the effect of dip and slip angles of faults classified into ASSS earthquakes excluding the events in the Japan Sea is consistent with that of ASSS earthquakes. Smaller tsunamis (
which were not included in the present analysis do show the similar tendency of the larger tsunami excitations in ASSS compared to those in ADDS (
Figure 4). Furthermore, a theoretical study on the deformation due to earthquake faults gives that the difference in the maximum deformation on the surface between dip angles with 30 and 60 degrees is within about 30% [
48,
49,
50]. That is too small to comprehend the observed difference in Equation (4) between the Japan Sea and the Pacific Sea side of Japan. For (B) and (C), dip angles and slip angles of faults in ADDS and ASSS are evaluated and listed in
Table 2. It is found that there are larger values for the earthquakes in the Japan Sea side than those in the Pacific Ocean side, but these earthquakes are not restricted in the Japan Sea as is mentioned in (B).
Regarding reason (D), ASSS earthquakes include those occurring in the Japan Sea side, in the back-arc basin without apparent trenches, as well as along the trench with developed continental shelves in the Nankai Trough. They generate larger tsunamis than those by ADDS earthquakes elsewhere. This eliminates the possibility of (D) for the different tsunami excitation. Speaking about (E), the results from both the local and far-field tsunami magnitude give consistent results in Equations (4) and (5). Therefore, the effect of local ocean-bottom structures alone is not the reason. Considering the reason (F) in the above, we should remind readers that tsunami earthquakes, earthquakes with slow-slip characteristics along the Sanriku Coast of the Tohoku, have occurred, where the source region of the 2011 megathrust earthquake located. The subduction zone shows a developed Horst and Graben structure [
19,
20,
21], which is formed by sedimentation and related to the generation of tsunami earthquakes. The source region is not similar to the sedimentary layer in the Japan Sea.
6. Conclusions
The relationship has been derived between moment magnitude
Mw of earthquake sources and local tsunami magnitude
m [
25,
26] for the tsunamigenic earthquakes near Japan, and it turns out to be similar to the relation between
Mt and
Mw [
27]. These two tsunami magnitude scales suggest that the tsunami excitations in ASSS are about two times larger than those of ADDS near Japan. Observations of tsunamis are of special importance in measuring the strength of historical large earthquakes before the dawn of instrumental seismometry in the 19th century. Previous studies pointed out that there are larger tsunami excitations in the Japan Sea compared to those in the Pacific Ocean side of Japan; however, it was found in this study that the larger excitation of tsunamis is not only restricted for earthquakes in the Japan Sea but also for those in the extended seismic region of Along-strike Single Segmentation (ASSS). The reason inducing this difference has been discussed in detail and the most probable reason is suggested that the asperity of earthquakes in ASSS spreads over the whole shallow area of the subduction interface. The rupture of the shallow asperity causes large ocean-bottom deformation. On the other hand, an asperity in the deeper seismic segments of the subduction interface of ADDS exists as well as an everlasting asperity in the shallower seismic segments, which form the double aligned seismic segments along the dip direction of the subduction. In the deeper part, repeated large earthquakes occur. A rupture of such asperity induces a smaller amount of the ocean-bottom deformation compared to that by ASSS events. The asperity in the shallower part of ADDS ruptures only in the case of a megathrust event as a millennial event. This rupture process has been observed in the 2011 Tohoku-oki megathrust and the 1964 great Alaska earthquake, and the other candidate for this type of a gigantic tsunami is the 17th century tsunami in Hokkaido, Japan [
21]. The global importance of different tsunami excitation due to the seismic segmentation of ADDS or ASSS is stressed and is now open to future studies.
It is necessary to take into account the different excitation of tsunamis due to the seismic segmentation pointed out in this study and to consider the effect of dip and slip angles to retrieve the information on the source size of historical earthquakes. This is also important in estimating the strength of tsunamis for future earthquakes judging from so-called seismic gaps and/or doughnut patterns as well as from geodetic deformations by GPS observations.


