4. Discussion
As was seen in
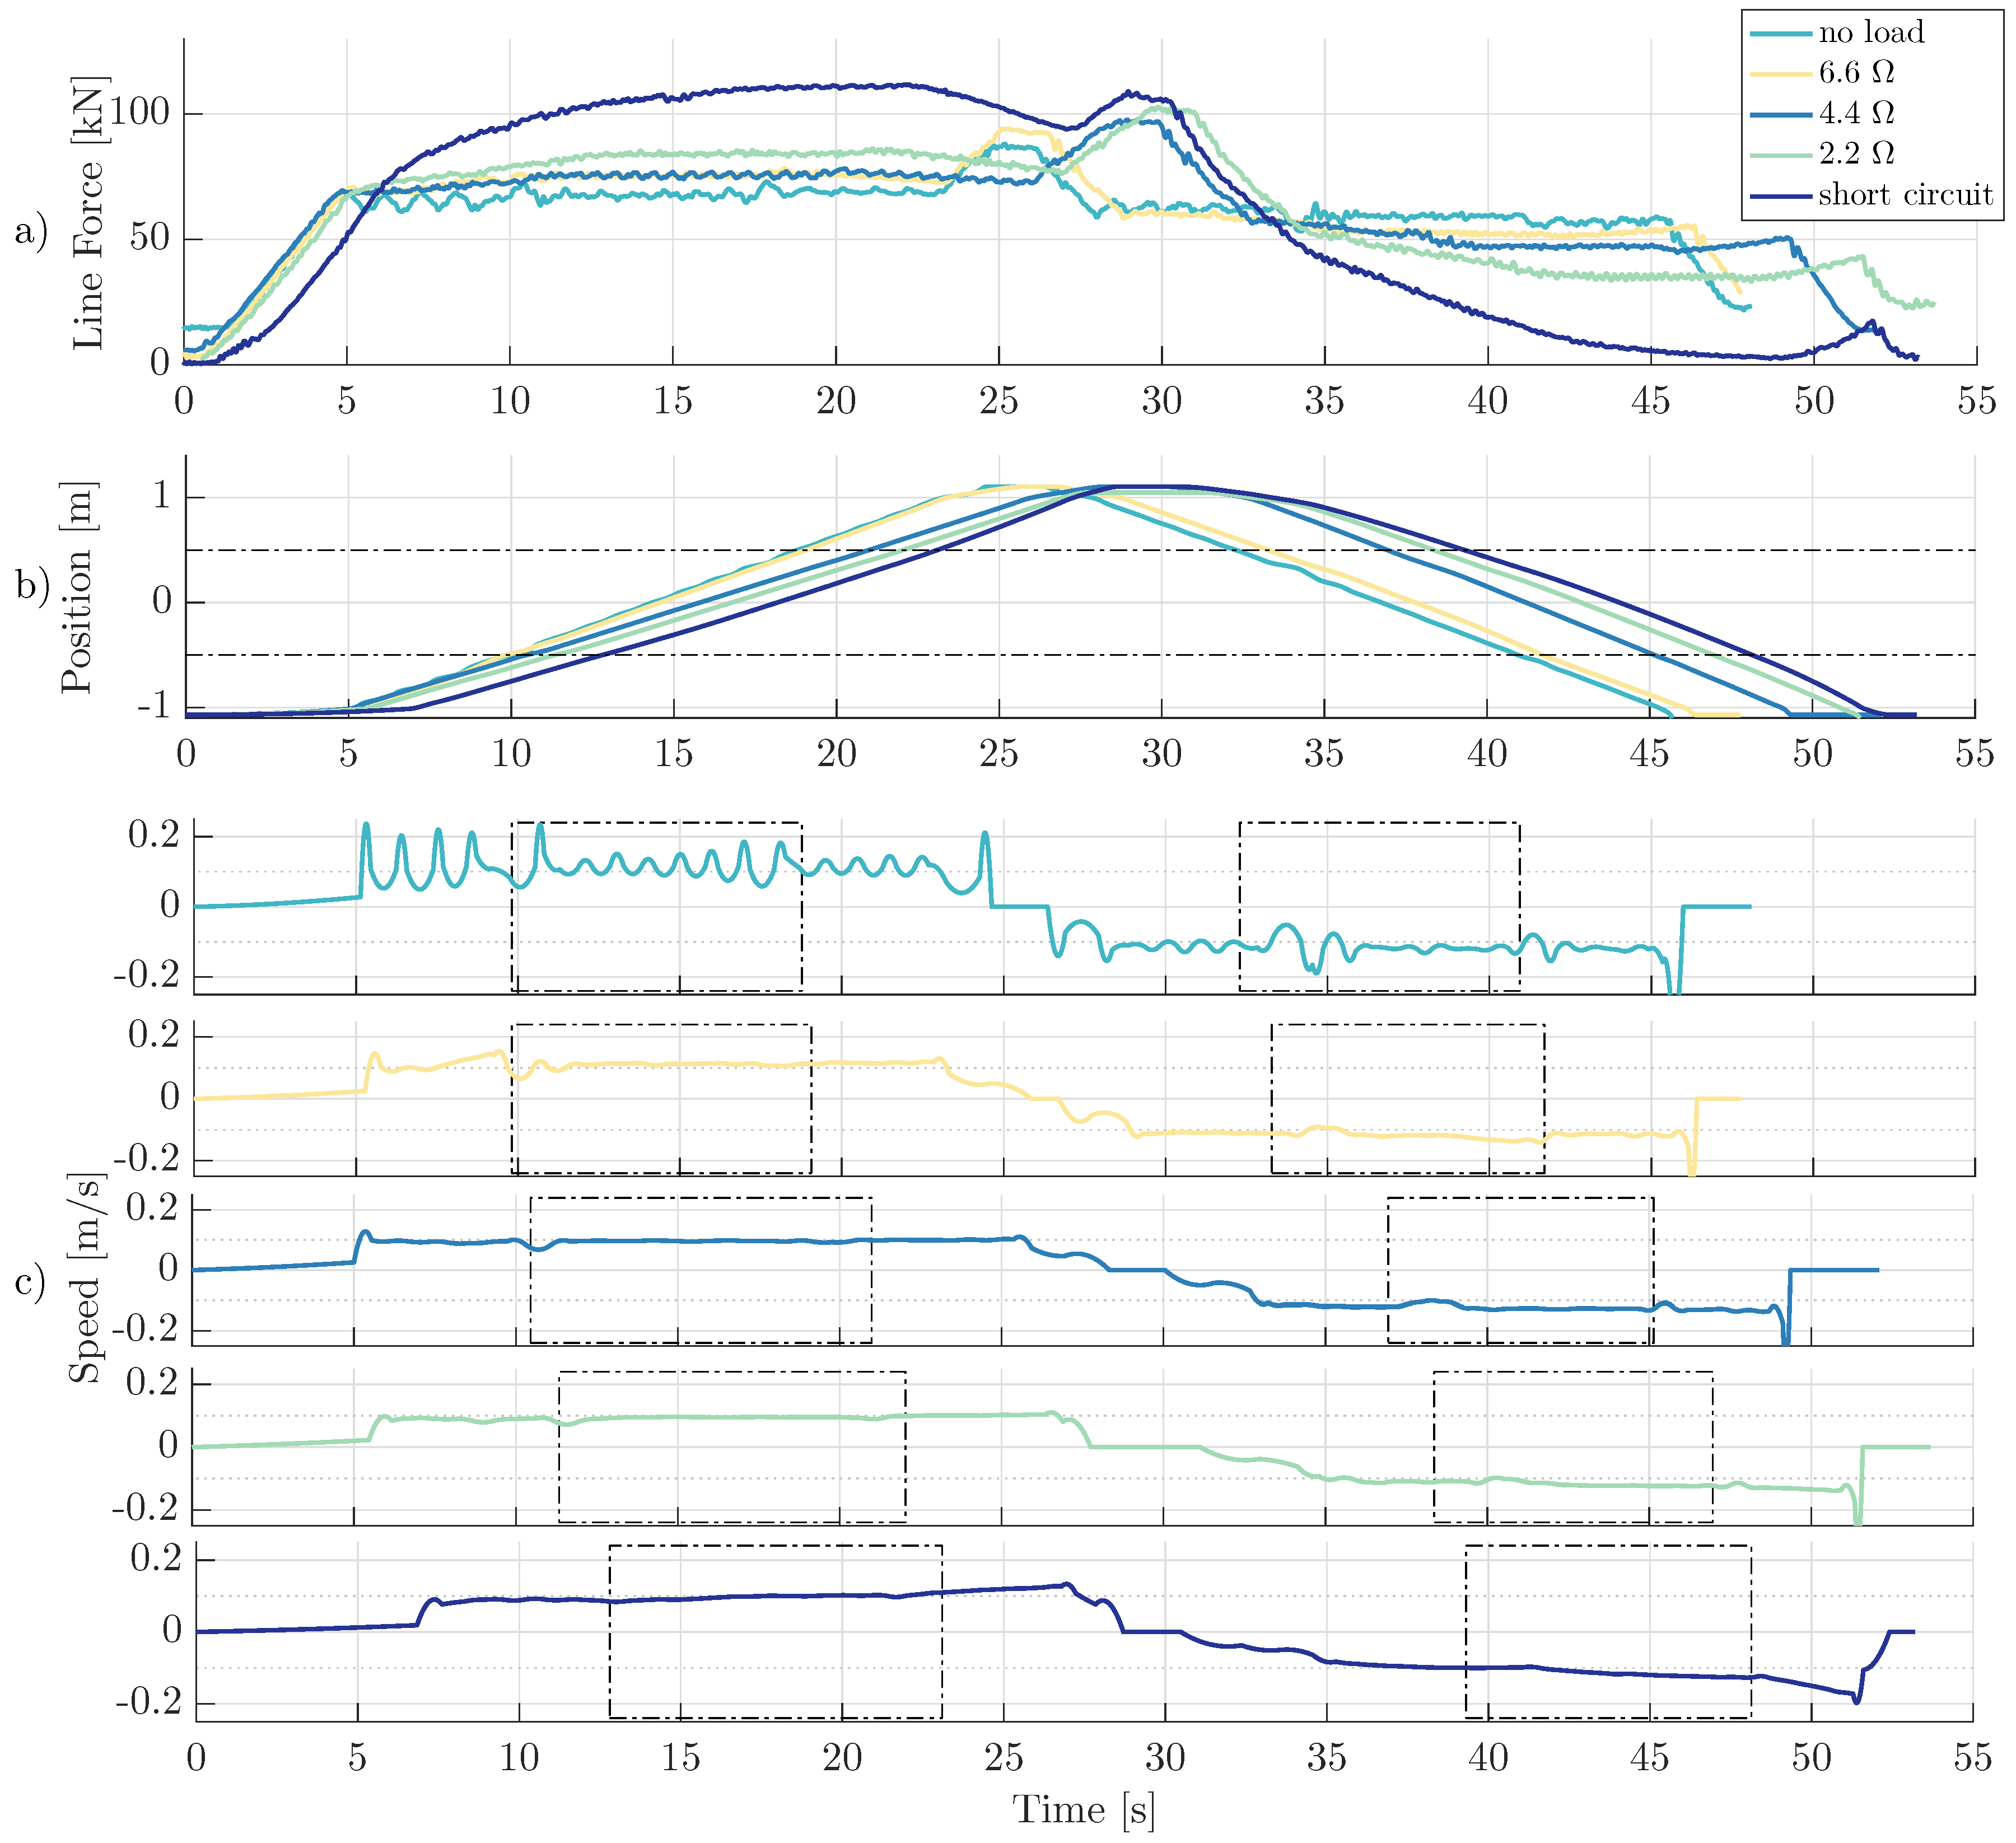
Figure 2 and
Figure 3 and in
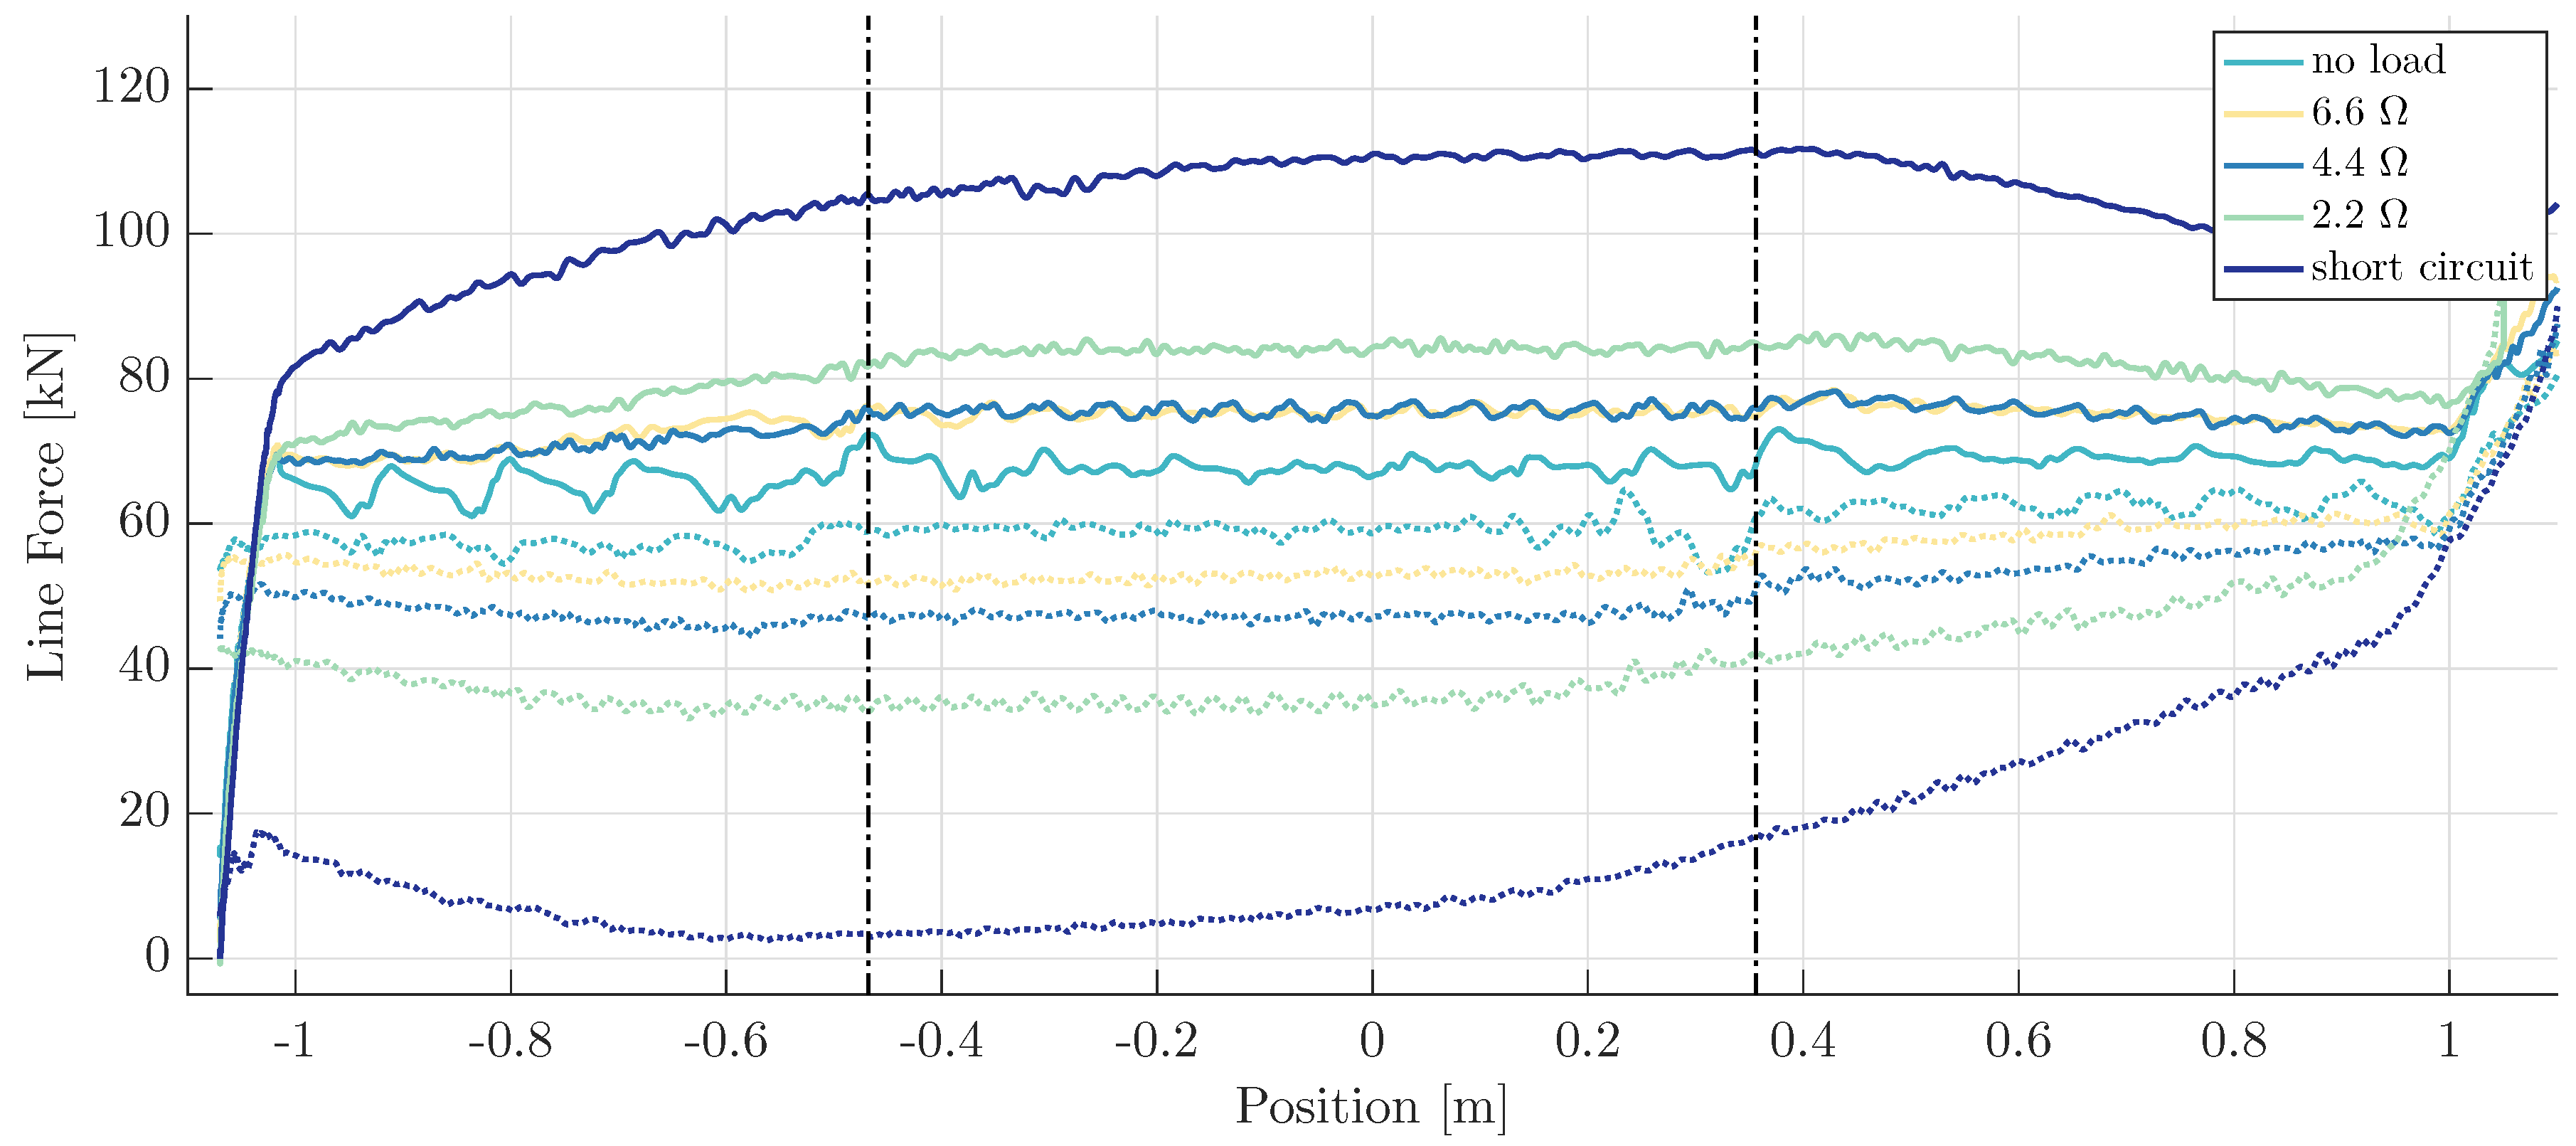
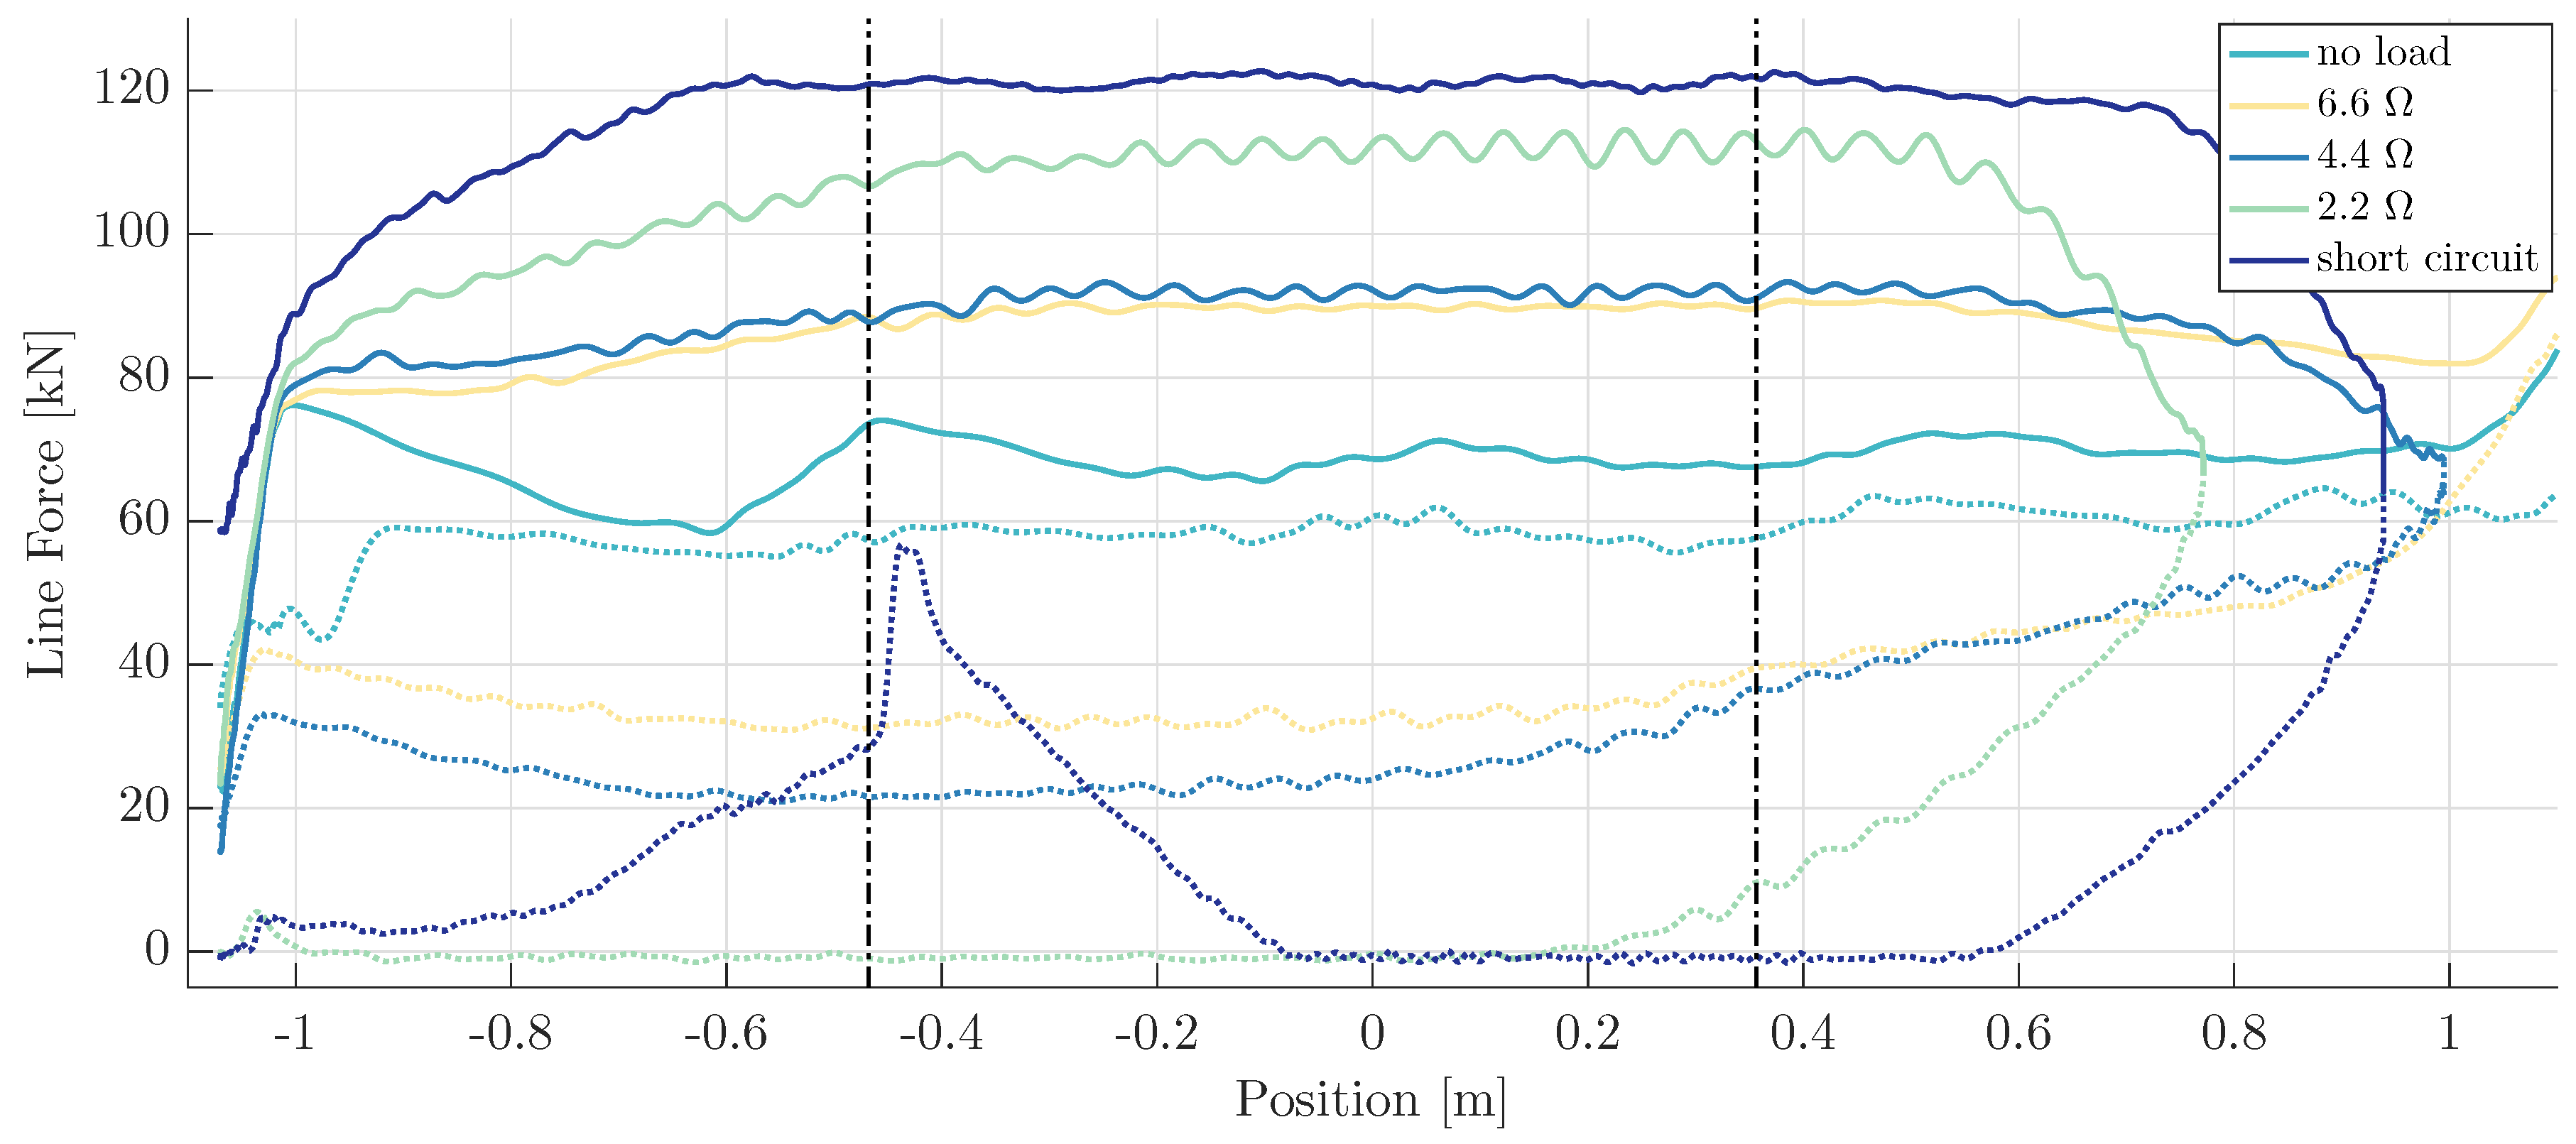
Table 5, an increased PTO damping gave an increased endstop force. This result differs from the results from tank tests presented in reference [
20], where an increased damping resulted in decreased peak forces. The difference between the results can be understood and is expected since the crane is operated to provide a constant speed, while in tank tests, the wave lifts the buoy with a time-varying instantaneous power, and the speed of the buoy depends on both the wave and the generator characteristics such as PTO damping. The results presented here provide a new insight into the tank tests presented in [
20]; there, the decreased peak forces are an implication of the decreased translator speed and retardation, which, in turn, is an effect of the increased PTO damping.
In [
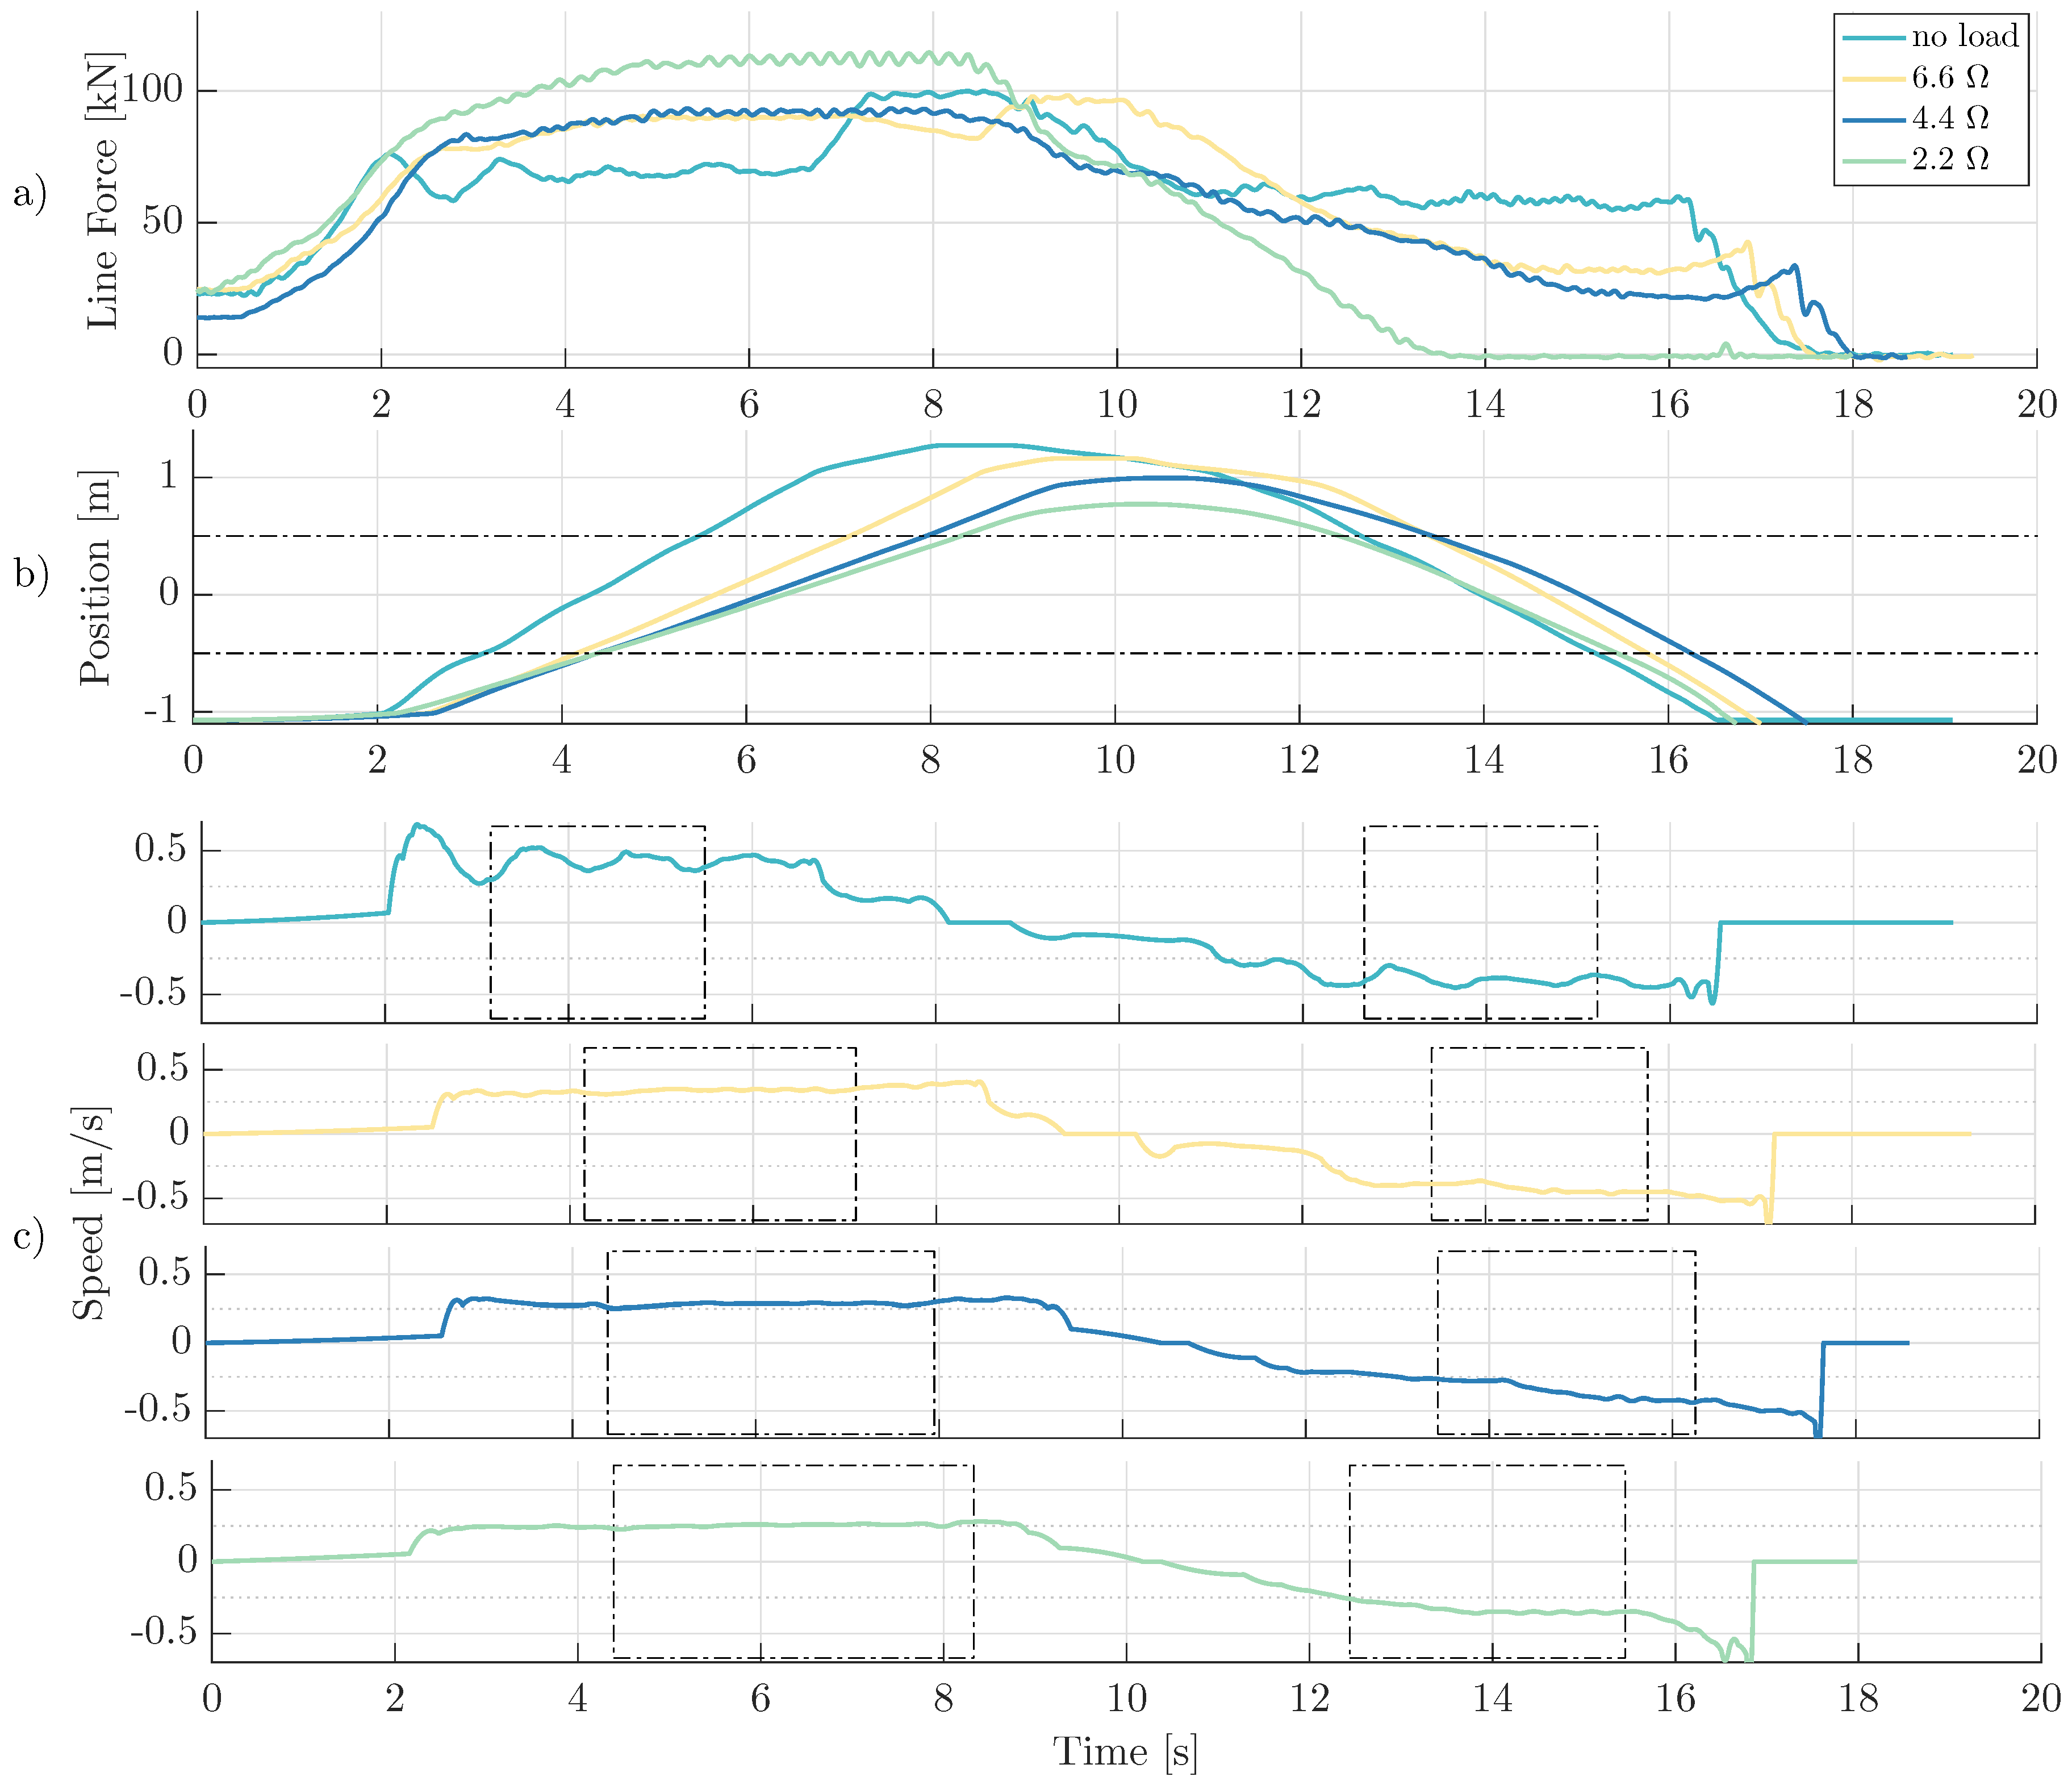
21], the power production of an earlier WEC prototype, which is similar but with a lighter translator, was studied. It was found that the output power was higher during the upward motion than during the downward motion. It was suggested that a higher translator weight would give a higher and more evenly distributed power output. The onshore experiments in this study do not provide enough data to analyze the power production within a wider speed range. Even so, comparing
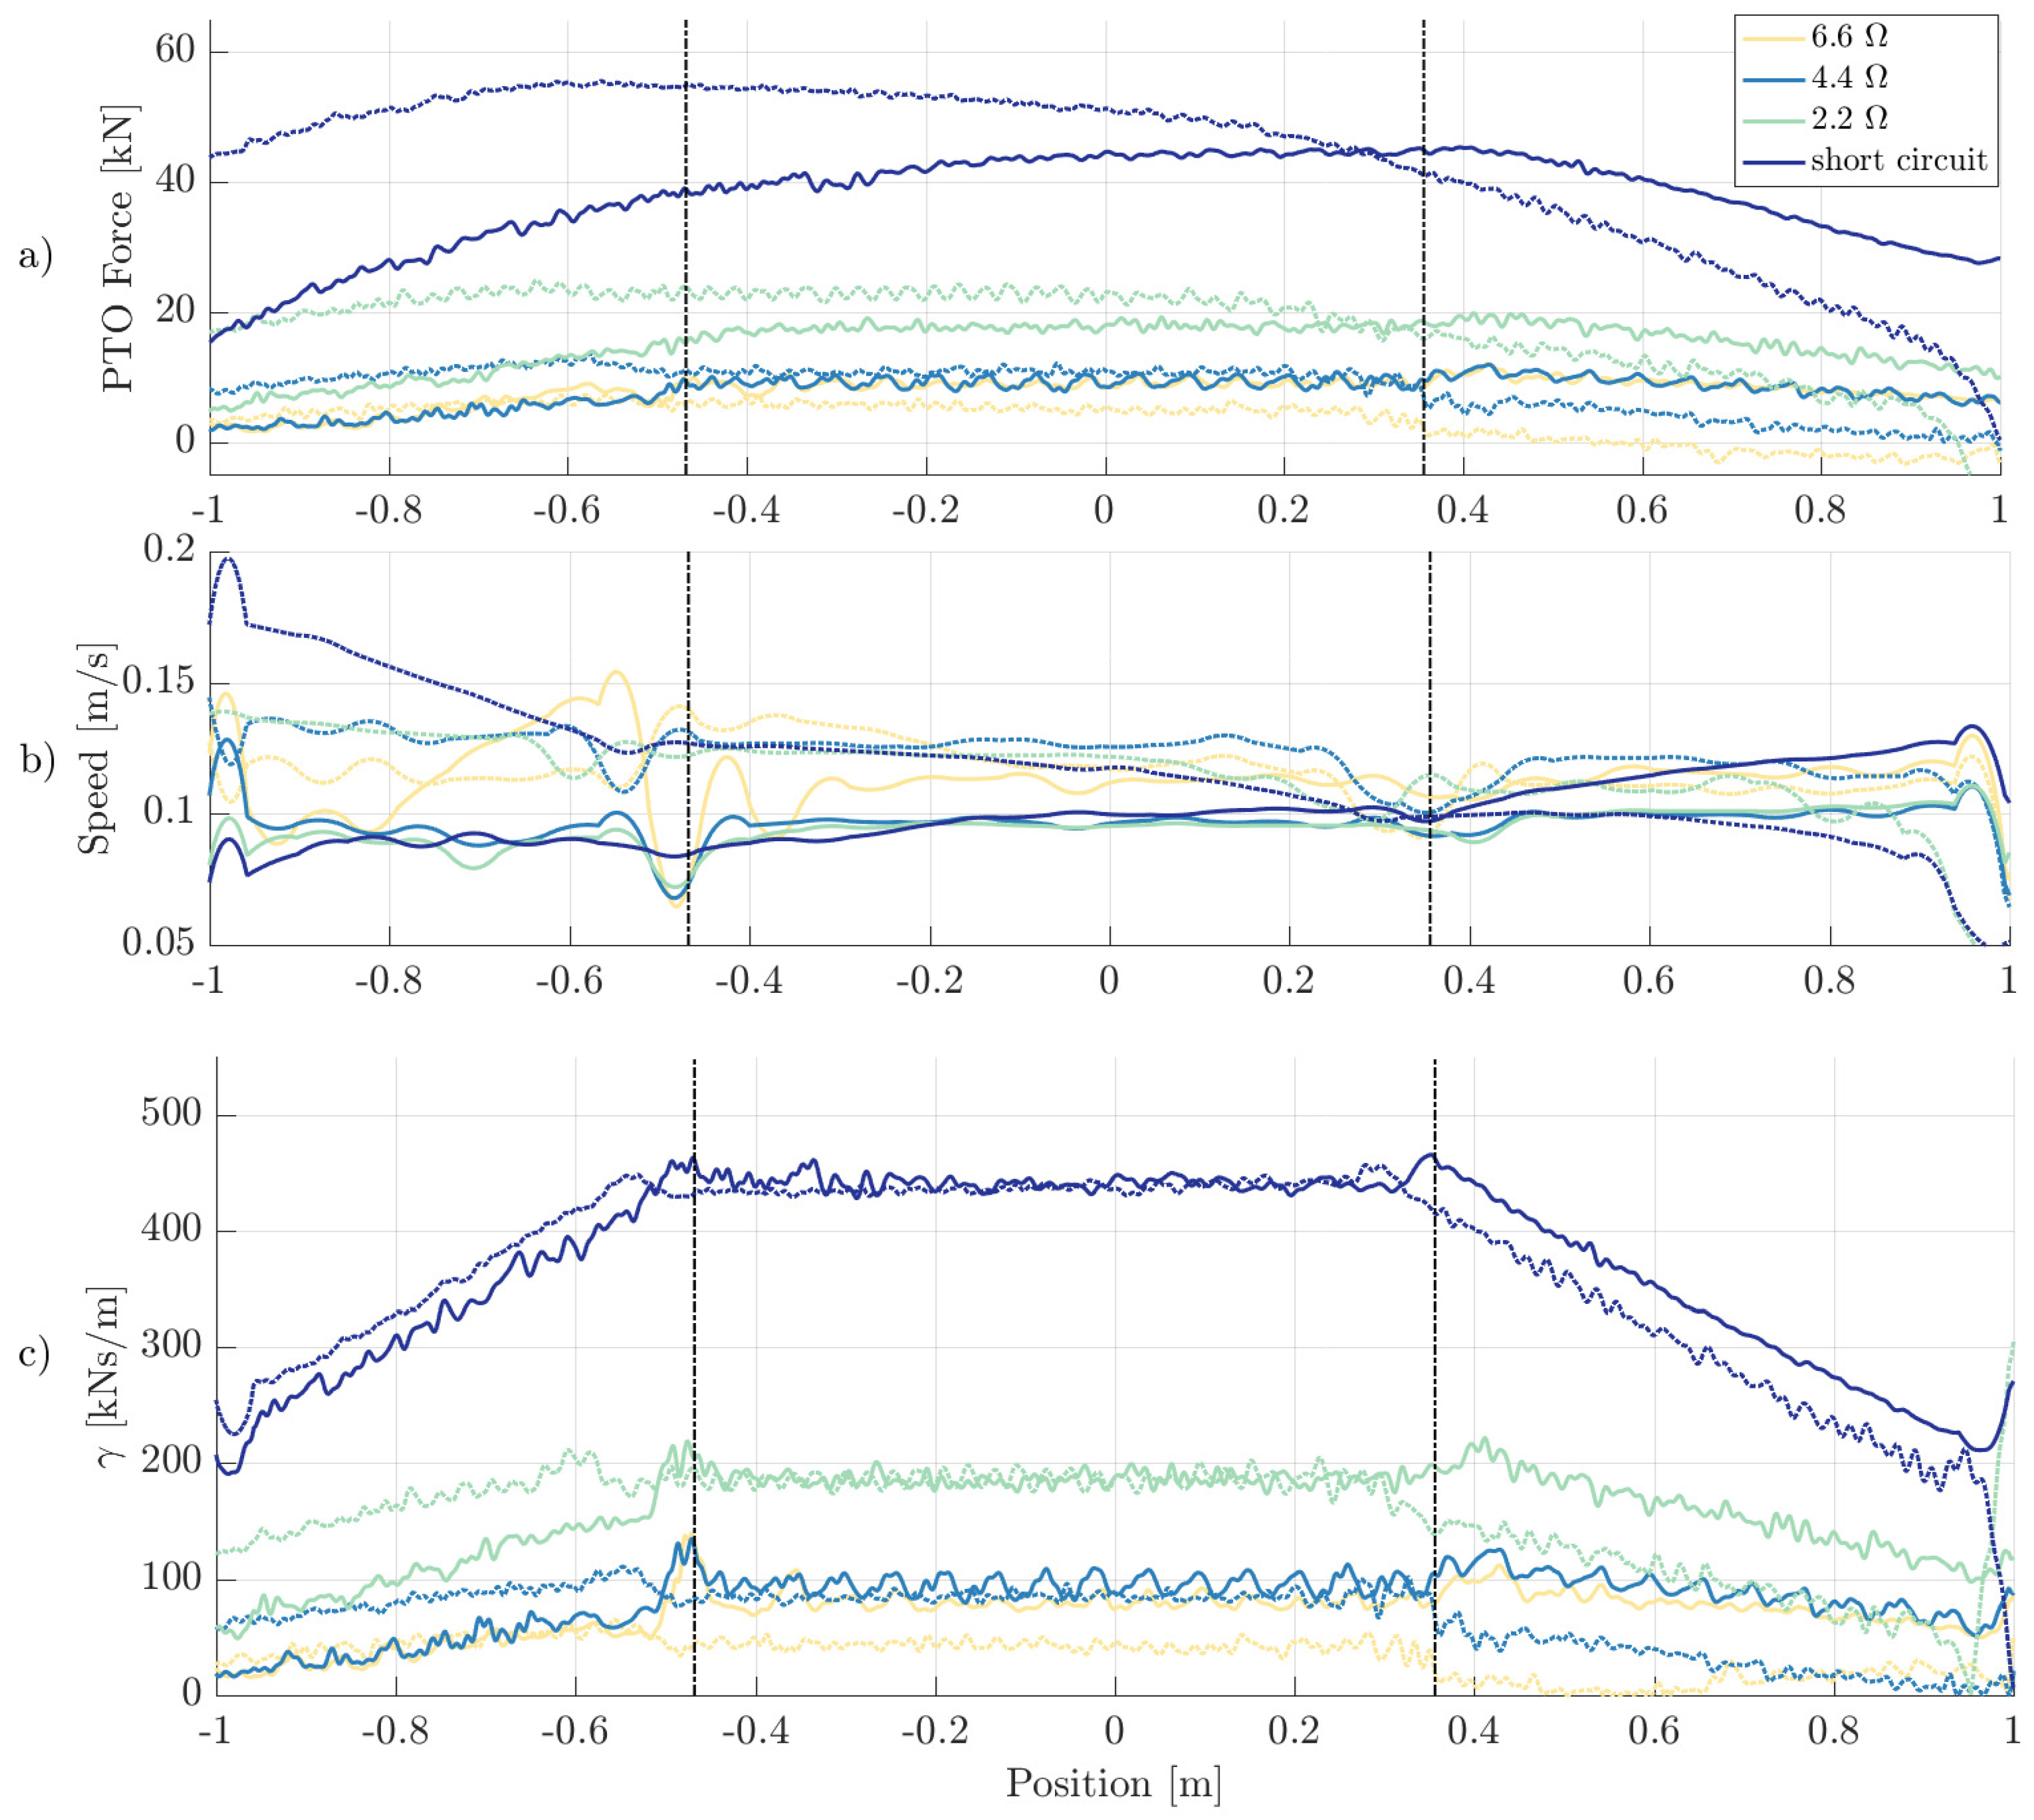
values when lifting and lowering the translator does confirm a good balance between the upward and downward stroke at the speeds tested. It should be noted, however, that the generator is expected to operate also at higher speeds during offshore operation. From the translator speed during free-fall, in the 2.2 Ω case presented in
Figure 3, it can be concluded that 2.2 Ω is not a suitable load for this generator during offshore operation at rated speed, since the translator will not move fast enough to return to the bottom position in the wave troughs. Using loads that are too high may result in a lower and less balanced power production, as was seen in [
21]. Furthermore, this may cause unwanted snatch loads, since there will be line-slack between translator and buoy.
The
values at full active area were found constant and very similar in value for both upward and downward strokes, except for the 6.6 Ω case, which shows a larger
value during upward motion. In addition, a small but non-negligible
value for the no load case was found. Possible explanations could be that the translator weight measure was incorrect or that the generator shows different friction losses during upward and downward strokes. As the translator leaves the full active area region, marked with dotted lines in
Figure 7, there are local disturbances in both
and speed. These are due to linear generator end effects, which have previously been studied in [
28]. These electromagnetic effects, due to the non-symmetric design of a linear generator, also contribute to cogging, which was seen as force and speed oscillations during the experiment.
The linear decrease in with decreased was measured, and it was seen that the slope varied with load case; a higher PTO-damping resulted in a larger drop of the PTO-damping when the active area decreased. During offshore operation, this would mean that the damping would decrease as the translator moves towards the endstop and the translator speed would increase, thus increasing the endstop force. It would be of interest for future work to investigate how this load dependence would influence the damaging forces during offshore operation.
In
Section 3.2.2, the losses at no load were calculated for two different speeds. When increasing the speed from 0.1 m/s to 0.4 m/s, the losses increased approximately 14%. The no load loss is a sum of friction and iron loss, where the iron loss should be small at no load. The friction force is partly due to roll friction from the wheel-tracks, along which the translator is moving, and the mechanical lead-through system where the buoy line force is guided into the generator. The former is expected to increase with higher speeds, while the latter should decrease with higher speeds. From the result of only two studied speeds, little can be said about the expected friction losses during offshore operation, but it can be concluded that friction forces are to be expected and that they will vary with speed.
5. Conclusions
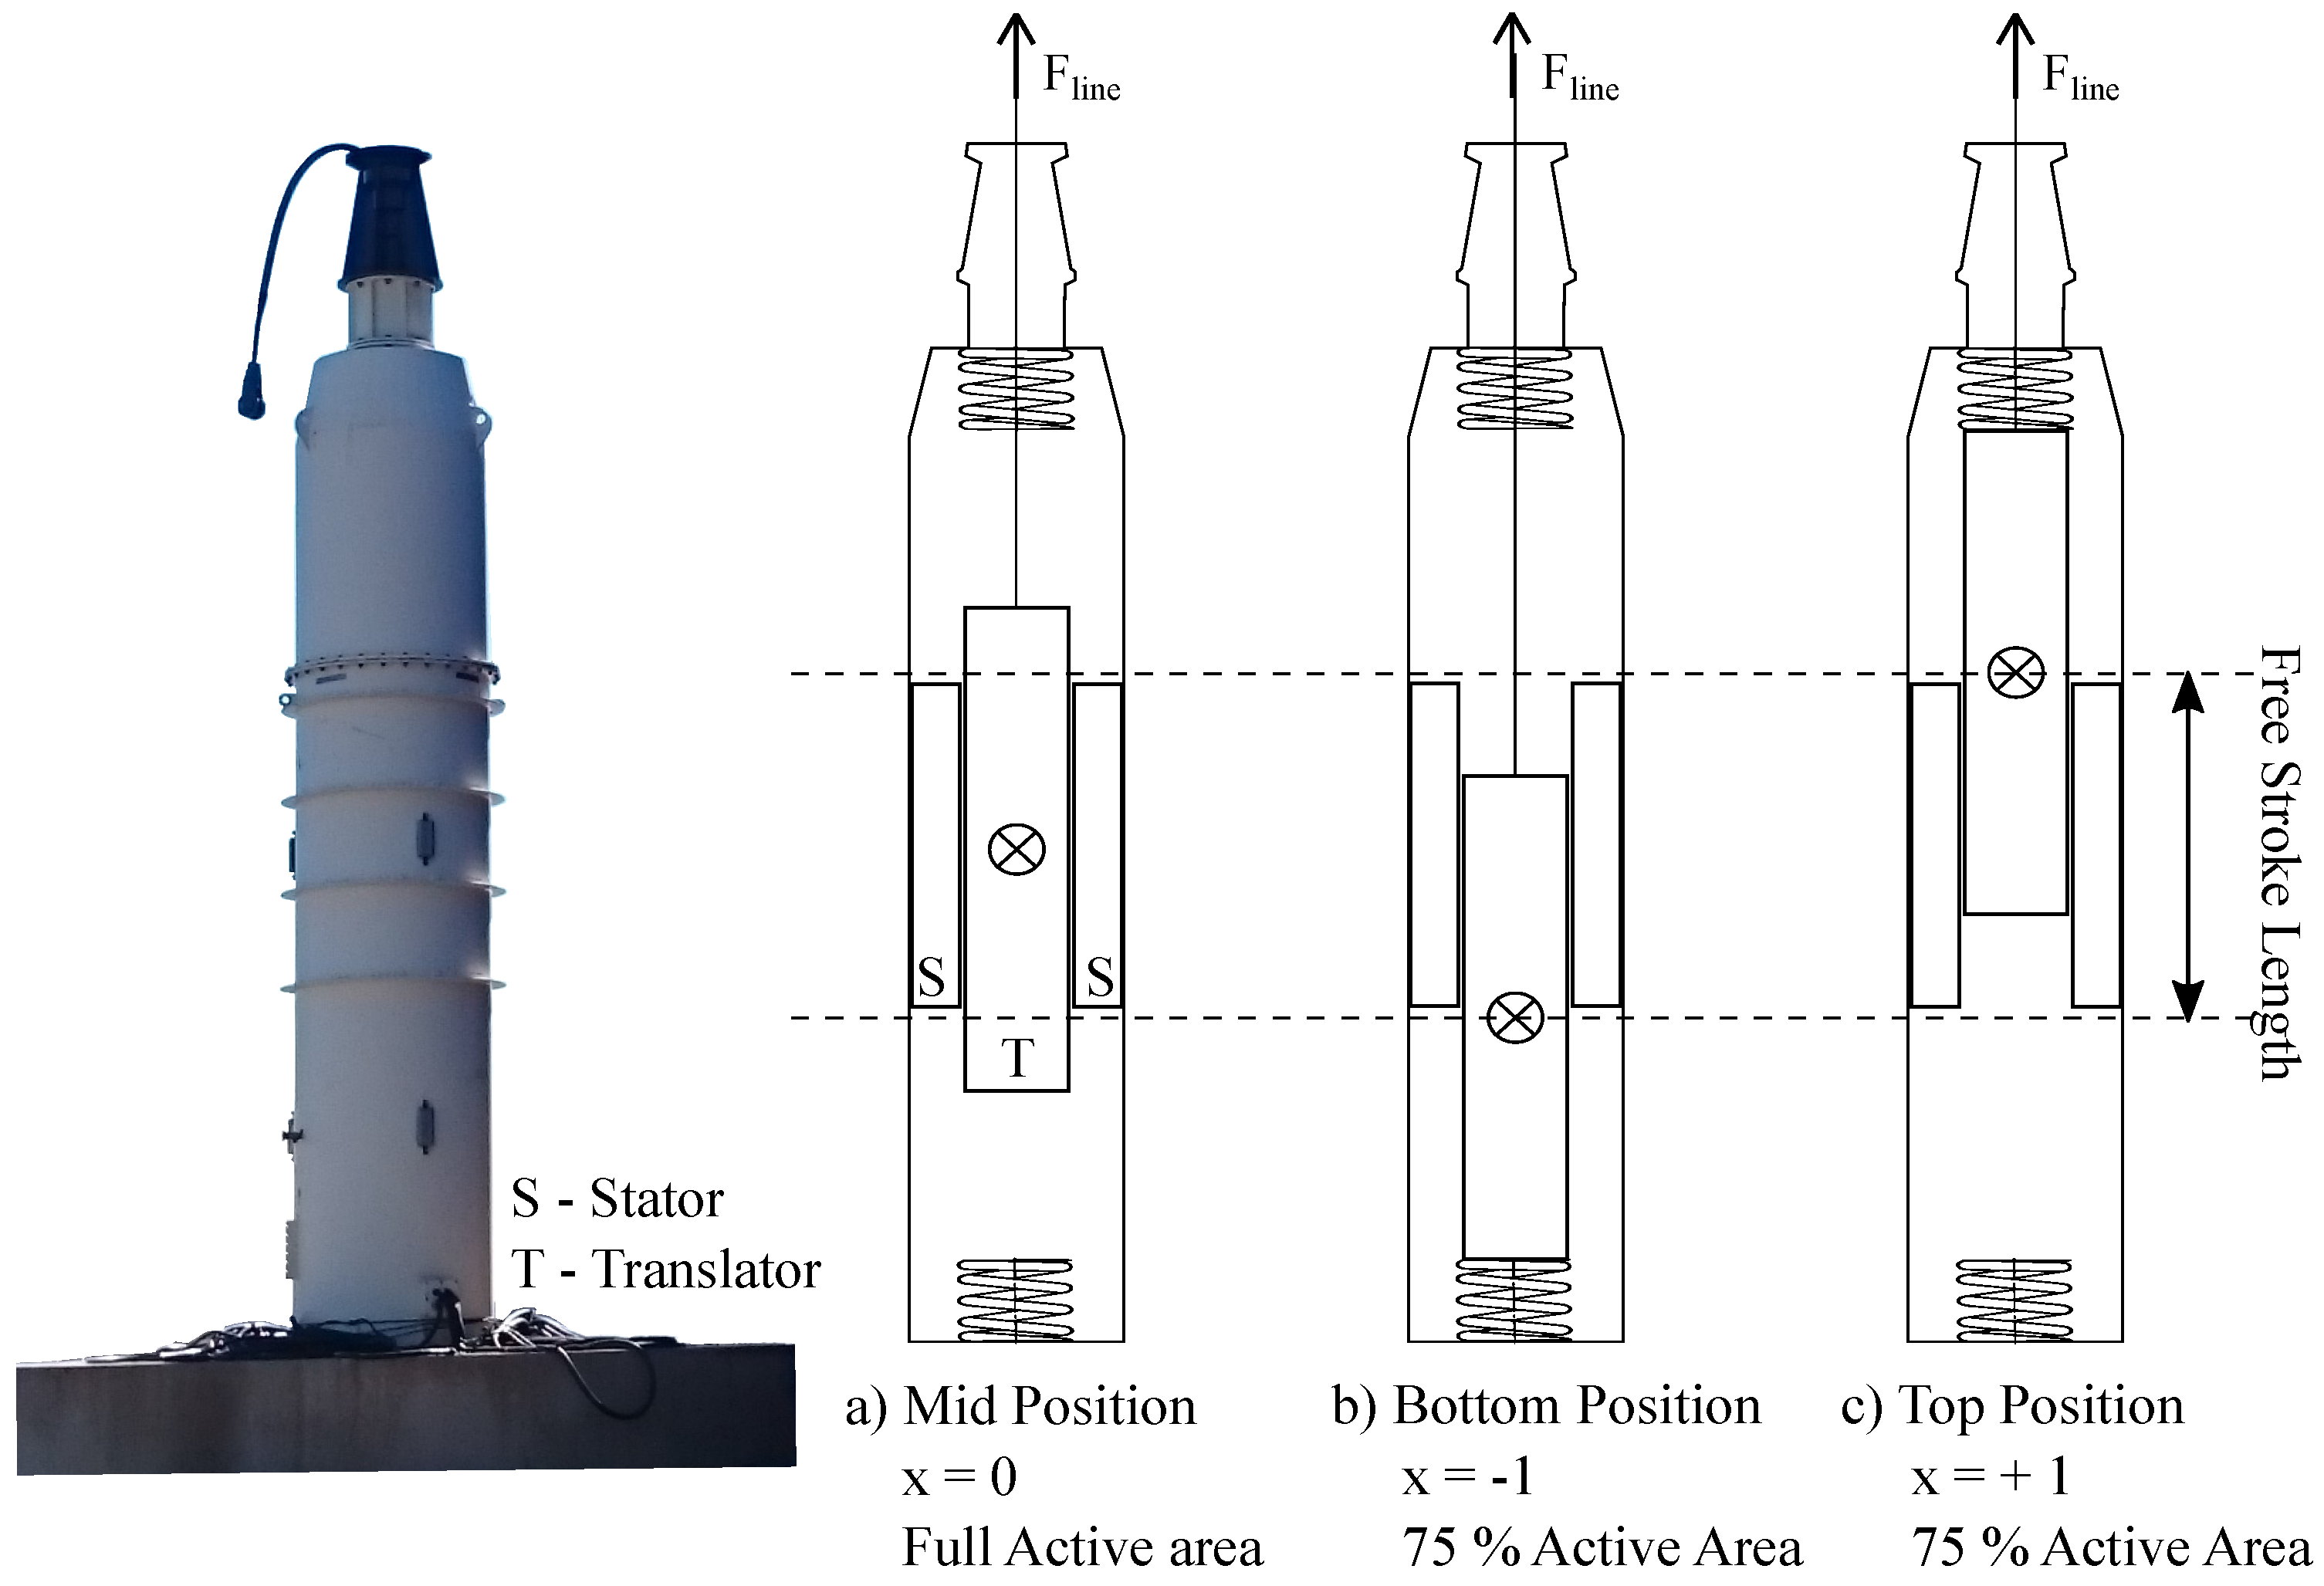
Line force and the generator damping cofficient have been studied for the full stroke of a linear generator, including full stator overlap, partial overlap and at endstop impact, when connected to five different load cases: no load, 6.6 Ω, 4.4 Ω, 2.2 Ω and short circuited. It was seen that a higher damping gives a higher line force and higher upper endstop force. The damping factor γ was calculated for each load case, showing a constant during the full active area and linearly decreasing when leaving full stator overlap. It could be seen that the drop was larger for cases with higher damping. It was also seen that the value during the partial active area is higher when leaving the stator, and lower when entering the stator. For future work, a deeper analytical study of the relationship between stator overlap and generator damping is suggested, together with extended onshore tests. It should also be studied how this behavior affects energy yield and unwanted forces during offshore operation.
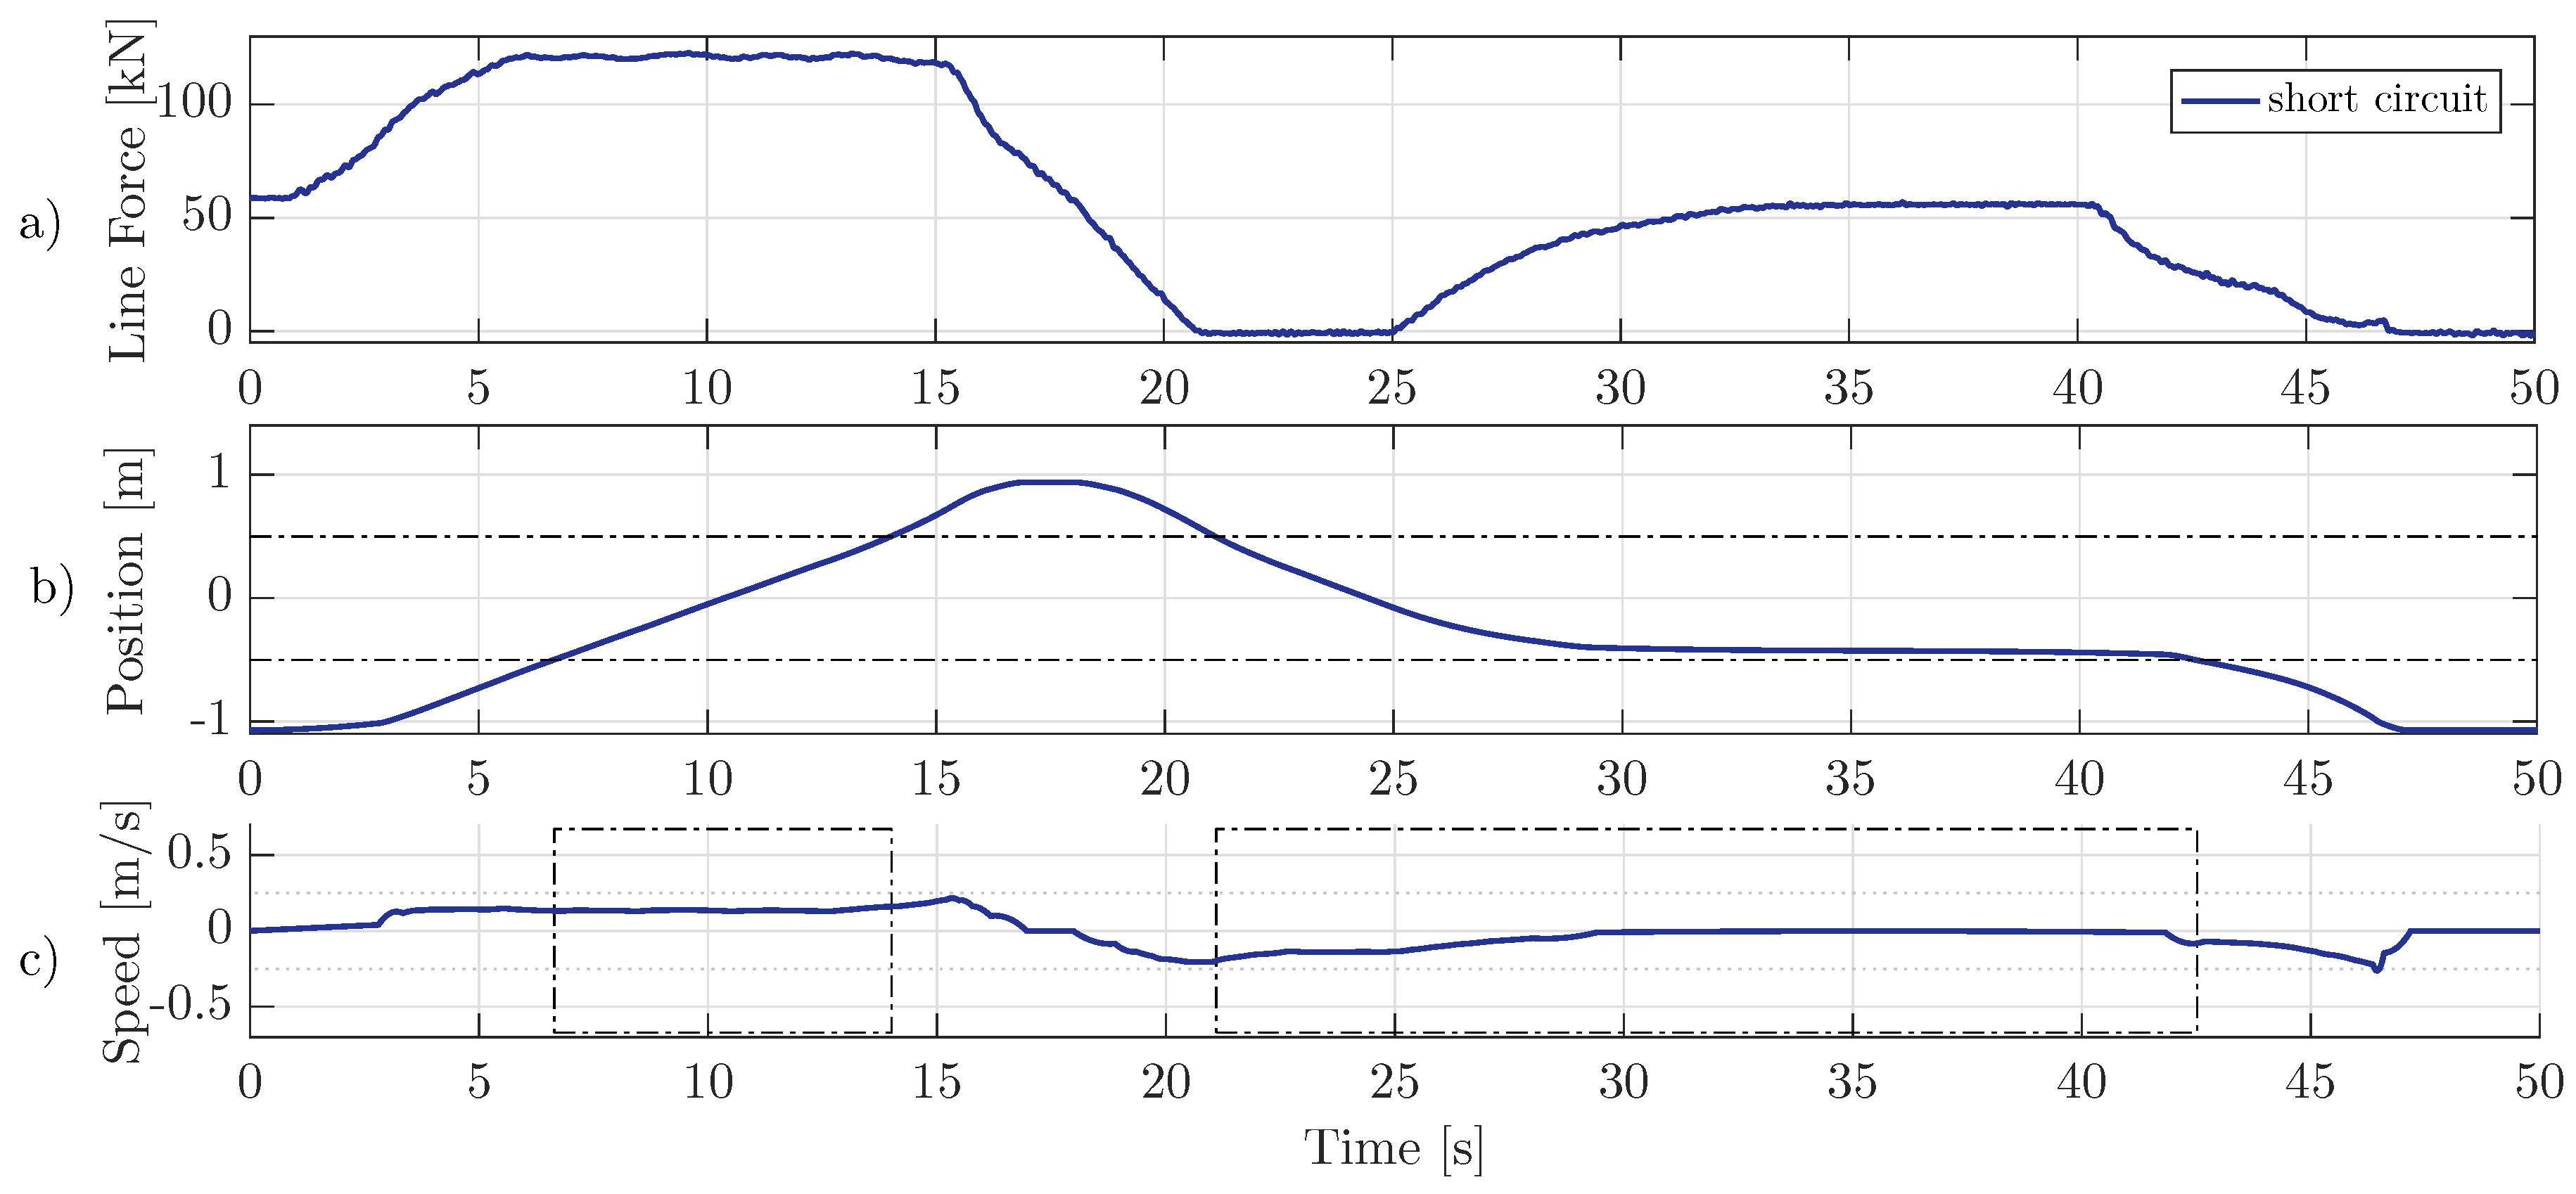
Finally, it could be confirmed that an increased translator weight, as suggested when studying earlier prototypes, improves the speed, damping and power takeoff balance between the upward and the downward strokes. It was also seen that short circuiting the generator will lead to a near translator standstill during the downward stroke, and that a 2.2 Ω load, which was used previously during offshore experiments, will limit the speed 0.35 m/s during the downward stroke.


