Article

Enhancement of Protein and Pigment Content in Two Chlorella Species Cultivated on Industrial Process Water

by
Hamed Safafar
1,
Patrick Uldall Nørregaard
1,
Anita Ljubic
1,
Per Møller
2,
Susan Løvstad Holdt
1 and
Charlotte Jacobsen
1,*
1
National Food Institute (DTU Food), Technical University of Denmark, Søltofts Plads 221, 2800 Kongens Lyngby, Denmark
2
Department of Development, Kalundborg Municipality, Torvet 3A, 4400 Kalundborg, Denmark
*
Author to whom correspondence should be addressed.
J. Mar. Sci. Eng. 2016, 4(4), 84; https://doi.org/10.3390/jmse4040084
Submission received: 8 October 2016 / Revised: 25 November 2016 / Accepted: 28 November 2016 / Published: 2 December 2016
(This article belongs to the Special Issue Emerging Biomolecular Technologies in Marine Science)

Abstract

:
Chlorella pyrenoidosa and Chlorella vulgaris were cultivated in pre-gasified industrial process water with high concentration of ammonia representing effluent from a local biogas plant. The study aimed to investigate the effects of growth media and cultivation duration on the nutritional composition of biomass. Variations in proteins, lipid, fatty acid composition, amino acids, tocopherols, and pigments were studied. Both species grew well in industrial process water. The contents of proteins were affected significantly by the growth media and cultivation duration. Microalga Chlorella pyrenoidosa produced the highest concentrations of protein (65.2% ± 1.30% DW) while Chlorella vulgaris accumulated extremely high concentrations of lutein and chlorophylls (7.14 ± 0.66 mg/g DW and 32.4 ± 1.77 mg/g DW, respectively). Cultivation of Chlorella species in industrial process water is an environmentally friendly, sustainable bioremediation method with added value biomass production and resource valorization, since the resulting biomass also presented a good source of proteins, amino acids, and carotenoids for potential use in aquaculture feed industry.

Graphical Abstract

1. Introduction

Algae are a diverse group of autotrophic organisms that have created immense interest due to their specific growth requirements such as efficient use of light energy, their ability to grow rapidly, fix atmospheric CO2, and produce more biomass per acre than land plants [1]. Microalgae are known as a potentially sustainable source of feedstock for fuel, food, chemicals, feed and even for the pharmaceutical industry [2,3].
Chemical composition of algal biomass is well studied and contains proteins, carbohydrates, lipid, pigments, vitamins, antioxidants, and trace elements. Proteins can be the most dominant nutritious compounds in some cyanobacteria such as Arthrospira sp., and microalgae such as Chlorella sp. [3,4]. Broadly microalgae present all essential amino acids such as arginine, phenylalanine, histidine, isoleucine, leucine, lysine, methionine, threonine, tryptophan, and valine [4]. In general, the amino acid composition in most microalgae is more or less the same as terrestrial plants and animal food products. High protein content, as well as proper amino acid composition, makes microalgal biomass a promising alternative ingredient in the formulation of aquaculture feed [5,6]. Moreover, there has been interest from both a research and economic point of view for microalgae such as Chlorella sp. as an alternative source of amino acids and proteins even for human nutrition [7].
Microalgae also contain other valuable bioactive compounds such as the accessory pigments carotenoids. The main carotenoids in microalgae include β-carotene, lutein, astaxanthin, fucoxanthin, violaxanthin and zeaxanthin. Astaxanthin and lutein are used for enhancement of the pigmentation in fish and as a colorant for foods, drugs, and cosmetics, respectively [5,8]. It is also known that Chlorella sp. is rich in lutein [3], with an accumulation of lutein of up to 0.45% of dry cell weight in some species, which then makes lutein the primary carotenoid in these green algae [9].
Cultivation of microalgae in wastewater provides an efficient means of nitrogen and phosphorus recycling for the production of lipids and proteins and also bioremediation of effluents before their discharge in the environment [10,11,12]. The wastewater should be free of pollutants such as heavy metals, which would be accumulated in the algal biomass, and finally in the animal tissues, if the algal biomass was targeted as a food or feed ingredient.
Anaerobic digestion represents promising, cost-effective wastewater treatment technology with widespread applications [13]. Under anaerobic conditions, methanogenic conversion of organic compounds to biogas will result in methane, CO2, and an effluent which contains inorganic compounds such as ammonia and phosphorous. The conversion process happens in an anaerobic sludge tower reactor with internal circulation (ICT), so the effluent is called IC water (ICW). The growth performance of microalgae cultivated in ICW depends on several factors including the characteristics of algal species (e.g., ammonia tolerance) and properties of the anaerobic digestion effluent [13,14]. An efficient phycoremediation of primarily treated domestic effluents by Chlorella spp. was reported previously in several studies [15,16,17]. These reports suggest phycoremediation as a feasible strategy to reduce the release of organic and inorganic compounds into natural waters, and valorize the resulting biomass by converting the waste water nutrients into bioactive compounds such as protein, lipids, and pigments.
Chlorella is one of the most promising microalgal genuses from both a scientific and a commercial point of view. Chlorella vulgaris was first described by Beijerinck in 1890 [18]. After that, a large number of Chlorella species were isolated and characterised [9]. Chlorella vulgaris and Chlorella pyrenoidosa were reported as high protein containing species among other microalgae belonging to Chlorophytes [4].
This study aims to investigate the effects of different concentrations of ICW, and cultivation duration (time) on nutritional composition (regarding protein, amino acids, and carotenoids) of final biomass. Furthermore, this study evaluated which growth condition and harvest time would be optimal for highest protein productivity, since the target was the production of algal biomass applicable as an ingredient for aquaculture feed; rich in proteins and carotenoids and with moderate lipid contents. The optimal growth condition was determined by laboratory batch experiments to provide necessary reference data to be scaled up to industrial scale.

2. Materials and Methods

2.1. Chemicals and Reagents

Standards of fatty acids, amino acids and tocopherols were purchased from Sigma (St. Louise, IL, USA) and Fluka (Deisenhofen, Germany). Standards of pigments were obtained from DHI (Hørsholm, Denmark). HPLC grade acetonitrile, heptane, isopropanol, methanol, and acetone were purchased from Sigma and Fluka. HPLC grade water was prepared at DTU Food using Milli-Q® Advantage A10 water deionizing system from Millipore Corporation (Billerica, MA, USA).

2.2. Growth Media

Industrial process water (ICW) was collected from the effluent stream of an anaerobic methanogenic conversion reactor (Novozyme’s plant, Kalundborg, Denmark). Batches of industrial process water were filtered using an out-side-in dynamic cross-flow microfiltration Bio Booster system from Grundfos A/S (Bjerringbro, Denmark) equipped with 0.2 µm ceramic disc filters and stored at −20 °C before use. The chemical composition of the industrial process water is shown in Table 1a. Table 1b shows the concentrations of nitrogen and phosphorus at each medium tested. Deionized sterile water was used for the microalgal growth in the laboratory.

2.3. Microalgal Growth Experiments

A strain of Chlorella pyrenoidosa (ATCC®75668™) was provided by American Type Culture Collection (ATCC) in partnership with LGC Standards (LGC standards-ATCC), Middlesex, UK. Chlorella vulgaris (SAG 211-81) was provided by Culture Collection of Algae at Göttingen University (SAG), Göttingen, Germany.
Both strains were cultivated in 1–5 L Schott bottles. All reactors were continuously aerated with 2% carbon dioxide/air mixture under fluorescent lamp illumination (Green-line A/S, Maribo, Denmark) with an irradiance of 200 µmol photon m−2·s−1 and 14:10 (h) photoperiod. Light intensity was measured using a Li-190 quantum sensor (LI-COR, Inc., Lincoln, NE, USA). Online monitoring and control of pH were performed by Milwaukee MC-122-pH controller (Milwaukee Electronics, Szeged, Hungary) equipped with a solenoid valve to control CO 2 addition. Temperature was controlled by an aluminum plate connected to cold water circulation system and the temperature was kept constant at 23 ± 2 °C. Preliminary experiments were performed to explore growth at different concentrations of ICW (34%, 67% and 100%) diluted with de-ionized water, at constant pH 7.3 ± 0.2. During the cultivation and at each sampling point, 0.25 L of culture was taken and samples were centrifuged at 10,000× g. Resulting biomass was freeze-dried and stored at −20 °C prior to chemical analysis.

2.4. Analytical Methods

2.4.1. Growth Curve

Microalgal growth was monitored by daily detection of optical density at 750 nm, which is outside the range of absorbance by the pigments as suggested by Griffiths et al. [19]. For the preparation of laboratory samples at each sampling point, 0.25 L of culture was taken after homogenization by shaking for 5 min and centrifuged at 10,000× g. The resulting biomass pellet was washed twice with deionized water. The resulting pellet was washed twice with deionized water and freeze dried immediately until a moisture content below 1% DW was reached. Measurement of moisture was done by an AD 4714A moisture analyser (A&D Company, Tokyo, Japan). Samples were stored at −20 °C before chemical analysis. Dry matter (DM) was calculated using the following equation obtained from a standard curve of concordance between dry matter and optical density at 750 nm ( O D 750 ):
D M   ( g · L 1 )   =   0.376   O D 750   +   0.005

2.4.2. Proteins and Amino Acids

The protein content in the microalgal samples was estimated using a modified Micro biuret method described by Safafar et al. [14].
The amino acid composition was analysed using EZ:fast™ Amino acid analysis kit (Phenomenex Inc., Torrance, CA, USA). Separation was done by liquid chromatography using Agilent 1100 series LC/MSD Trap mass spectrometry (Agilent Technologies, Hørsholm, Denmark) with a EZ:fast™ Liquid chromatography-Mass spectroscopy (LC-MS) column (250 × 3.0 mm, Phenomenex), as described previously by [14].

2.4.3. Lipids, Fatty Acid, and Tocopherols

Lipids were extracted with chloroform:methanol solvent mixture for two hours, as described in Bligh and Dyer [20], using 200 mg dry biomass.
Fatty acid profile was analyzed according to the American Oil Chemists’ Society (AOCS) official method; Ce 1i-07 [21]. Around 1g of extract was weighed in methylation glass tube and was evaporated to dryness under a gentle stream of nitrogen. Then, 100 μL of internal standard solution (2% w/v C23:0 in heptane), 200 μL of heptane including 0.01% w/v butylated hydoxy toluene (BHT) as antioxidant, 100 μL of toluene and 1 mL of boron trifluoride in methanol (BF3-MeOH) was added. Samples were mixed and methylated in the microwave oven (Microwave 3000 SOLV, Anton Paar) for 10 min at 100 °C and power of 500 W and then cooled down for 5 min. Then, 1 mL of saturated salt water (NaCl) and 0.7 mL of heptane with BHT were added. After the separation of heptane, the upper phase of the sample (around 0.7 mL) was transferred into vials. Samples were analyzed by gas chromatography system (HP-5890 A, Agilent Technologies, Santa Clara, CA, USA). Fatty acid methyl esters were separated and detected by the GC column Agilent DB-wax (10 m × 100 μm × 0.1 μm), from Agilent Technologies (CA, USA). Fatty acids are reported as % of total fatty acids.
Analysis of tocopherols and tocotrienols was done by Liquid Chromatograph equipped with Fluorescence Detector (LC-FLD). Approximately 3 g of Bligh and Dyer extract was weighted and evaporated to dryness under a gentle stream of nitrogen. Dry sample was mixed with one mL of heptane and then transferred to HPLC vials. The analysis was performed based on the AOCS official method; Ce 8-89 [21], using Agilent 1100 Liquid Chromatograph (Agilent Technologies, CA, USA), equipped with a fluorescence detector, with the excitation wavelength of 290 nm and emission wavelength of 330. The separation was carried out by a Spherisorb column 150 mm × 46 mm × 3 µm particle size (Waters Corporation, Milford, MA, USA), using a mixture of isopropanol and heptane (0.5:99.5) as the mobile phase. Quantification was done based on external calibration and by series of five different standard concentrations of α-, γ-, and δ-tocopherol.

2.4.4. Pigments

Extraction and analysis of the pigments were done by the method described by Safafar et al. [22] Samples were extracted by methanol containing BHT in a sonication bath (Branson Ultrasonics, Danbury, CA, USA) at 5 ± 1 °C for 15 min. Analyses were performed by an Agilent 1100 Liquid Chromatograph equipped with a Diode Array Detector (DAD). Separation was carried out on a Zorbax Eclipse C8 column 150 mm × 46 mm × 3.5 μm from Phenomenex. Identification was done by using DHI pigment standard mix. Quantification was done based on external calibration and by series of five different standard concentrations for each individual pigment.

2.4.5. Statistical Analysis

Cultivation experiments were repeated two times in one and five litre flasks, respectively. All analytical procedures were performed on the samples from 5 L flasks and repeated two times independently. The data are recorded as the mean. Results were evaluated using ANOVA to test the effect of time and growth media. Bonferroni multiple comparison procedure was used to discriminate among the means at the 95.0% confidence level. All statistical analyses were done by STATGRAPHICS software, version Centurion XVI (Stat point Technologies, Inc., Warrenton, VA, USA).

3. Results and Discussion

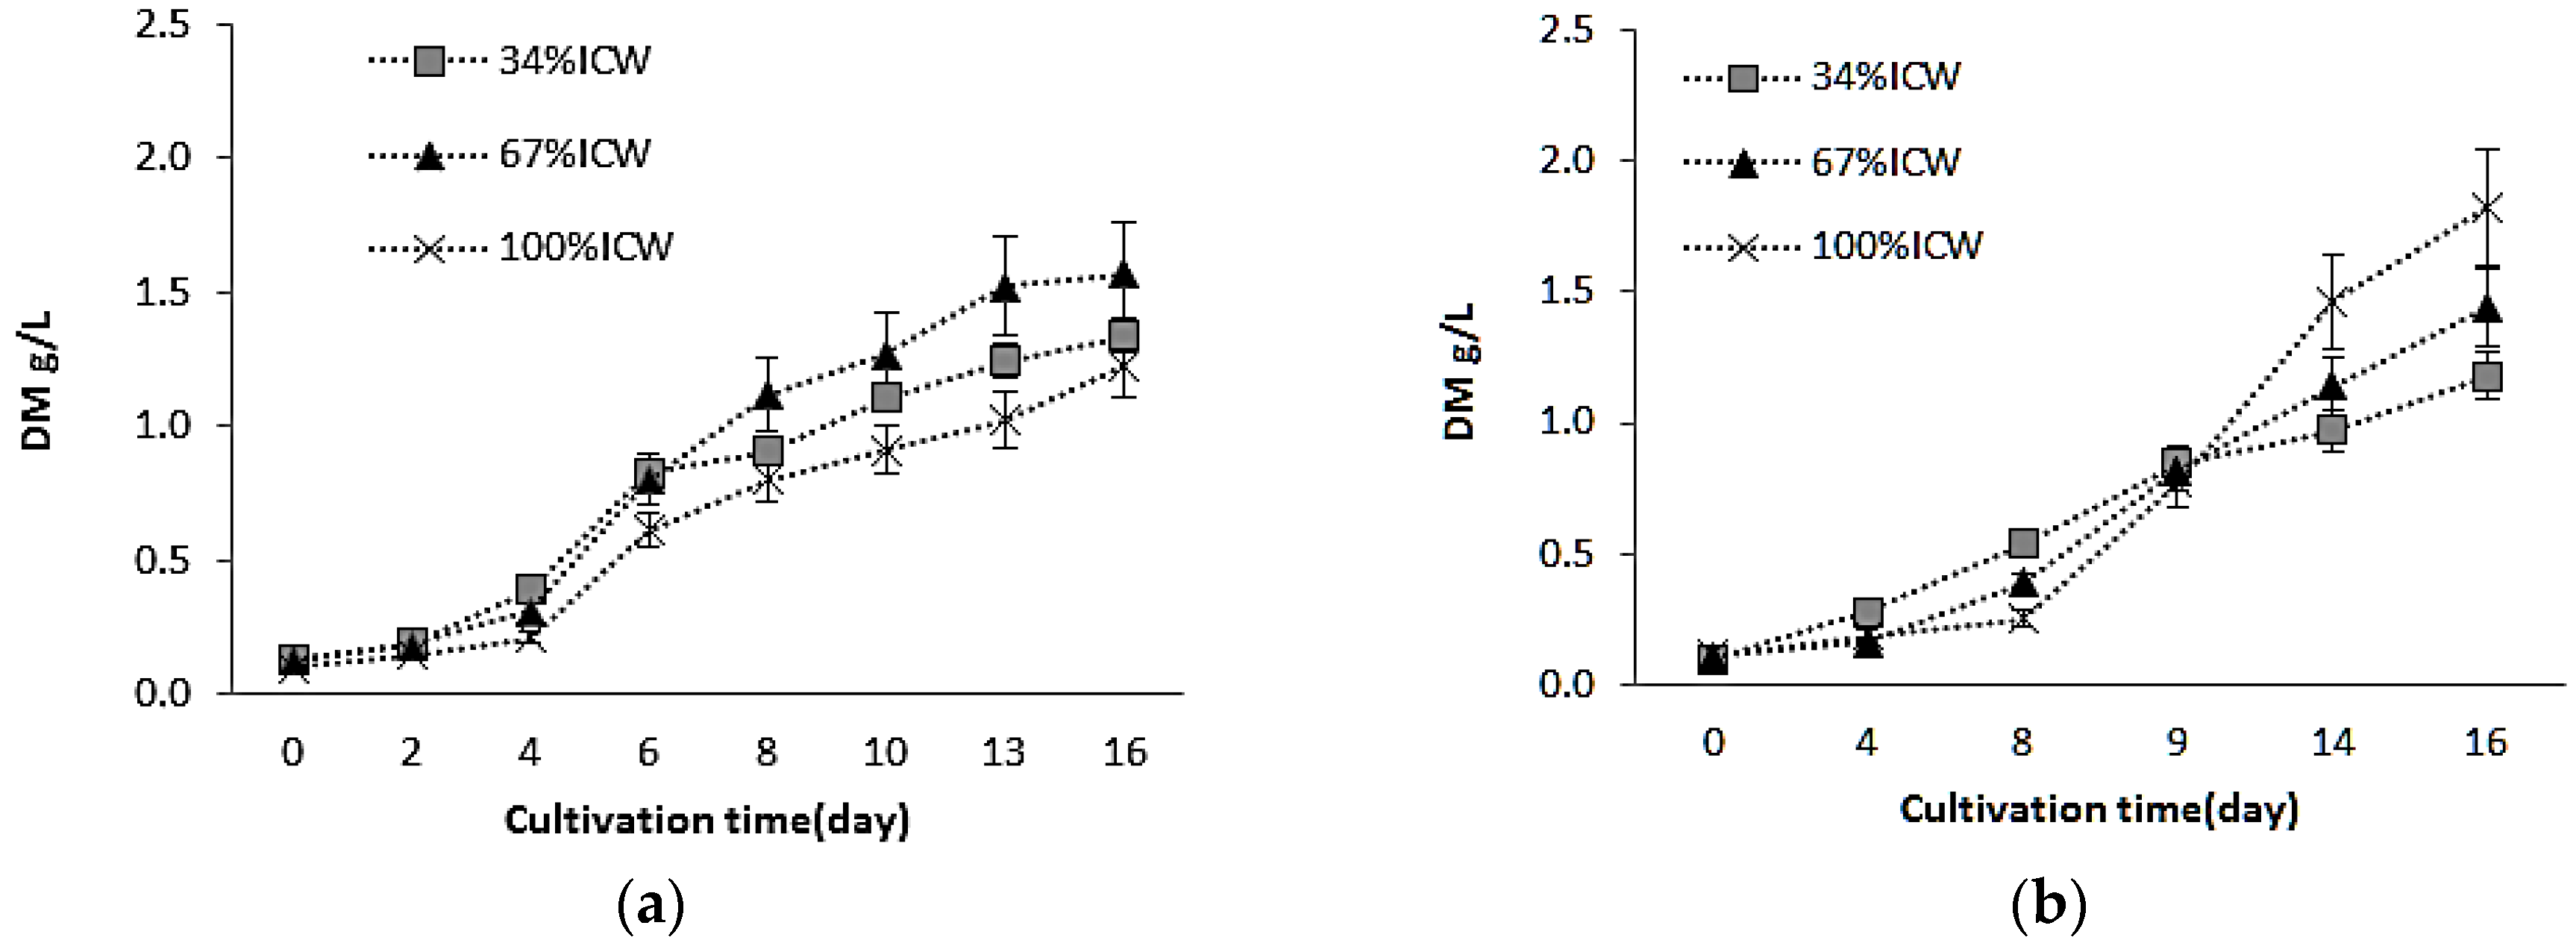
3.1. Growth and Biomass Production

Both species grew on industrial process water. Biomass increment and growth trends for C. vulgaris and C. pyrenoidosa are shown in Figure 1a,b, respectively. Biomass increased over the cultivation time in all experiments until the end, day 16. The biomass was significantly higher for C. vulgaris cultivated in 67% ICW, compared to 34% and 100% ICW experiments. (Figure 1a). For the C. pyrenoidosa experiment, on the other hand, higher biomass was measured in 100% ICW, compared to 34% and 67% experiments (Figure 1b). The differences in the optimal concentration of ICW between the two species can be attributed to the maximum tolerated level of NH 4 + -N for these two Chlorella species, so that C. vulgaris tolerates lower concentrations of ammonia in growth medium. The ammonium concentration is known to be a critical factor for growth and biomass productivity of Chlorella sp. [23]. He et al. [10] reported a positive correlation between C. vulgaris cell density and concentration of ammonia at levels of 17 to 143 mg·L−1 NH 4 + -N., while higher levels of ammonia dropped the growth rate. Cho et al. [24], reported high biomass productivity (0.4 g·L−1·d−1) and biomass production = 3 g·L−1) for Chlorella sp., cultivated on tenfold diluted wastewater from an anaerobic digestion in which the concentration of NH 4 + -N was 220 mg·L−1.
In our study, concentrations of NH 4 + -N ranged from 50 to 150 mg·L−1, which are in the optimum range reported for C. vulgaris. Moreover, other studies [2] suggested a substrate inhibition at high nitrate concentrations. It was reported [25] that low levels of nitrogen (0.2–3.0 mM) limited cell growth, while higher concentrations (5.0 mM) improved the growth of C. vulgaris. Therefore, both concentration and type of nitrogen source in the growth medium influence the growth trends.

3.2. Proteins and Lipids

3.2.1. Proteins

The content of proteins was affected significantly by the growth media and cultivation duration for Chlorella pyrenoidosa and by cultivation duration for C. vulgaris (Table 2a,b). In both species, the content of proteins increased to the highest level after the second sampling point (eight and five days of cultivation, for C. vulgaris and C. pyrenoidosa, respectively) and then decreased. This finding is in agreement with other studies showing that the protein content declines with increasing cultivation time [26]. Total N:P ratio in the culture medium in our study was around 17.2 which is higher than the range of 0.5 to 14.7 reported by previous studies [23,26,27]. Effects of N:P ratio on protein accumulation is not clear. He et al. [10] reported that protein content in biomass decreased with an increase in N:P ratio, which was in contrast to the study of Leonardos and Geider [27] who found no relationship between the protein content and the N:P ratio.
The highest levels of proteins in biomass was 65.2% ± 1.3% DW obtained in the 67% ICW experiment with C. vulgaris, however, both species showed high levels of proteins, compared to previous reports [10,25,28,29]. Protein content in 100% ICW experiment declined at a slower rate, compared to 34% and 67% ICW experiments for both species, which can be attributed to more available nitrogen in growth media. As mentioned, the biomass productivity in C. pyrenoidosa was higher in 100% ICW experiment (Figure 1a,b).
A positive correlation between the proteins content and concentration of nitrogen was already reported by previous studies [10,25,26,28]. Thus, the growth media directly influences synthesis of nitrogen-containing compounds such as proteins, nucleic acids, amino acids, and chlorophyll depending on its level of nitrogen [2]. In a growth media with sufficient available nitrogen, carbon fixated in the photosynthesis process is being used for the protein synthesis. Accumulation of carbohydrates or lipids will start when the nitrogen declines beyond a threshold, which is species-specific [26]. Hence, the protein content in the microalgae depends on the species and is influenced by growth stage, photosynthesis, and available nitrogen. When protein is the target compound in the biomass, higher levels of nitrogen in the growth medium will be required. Use of a priceless effluent like ICW decreases the production cost compared to cultivation with commercial growth media. On the other hand, nutrient removal from the effluent valorizes the resource and makes the production sustainable, as it reduces biological oxygen demand (BOD) of the effluent, which can therefore return safely to the environment without costly effluent treatment procedures. As an example, during 21 days of cultivation and for 100% ICW experiments, more than 99.5% of the ammonia and phosphorus were removed from growth medium. (data are not shown here).

3.2.2. Lipids

Variations in the contents of lipids were significantly influenced by cultivation duration (Table 2a,b) and growth medium (p > 0.05), while slightly higher levels of lipids were observed for the 34% ICW experiments followed by 67% and 100% ICW. The highest lipid contents in this study were found after 16 days of cultivation at 17.0% ± 0.1% DW and 17.6% ± 0.1% DW for Chlorella vulgaris and C. pyrenoidosa, respectively. Lipid accumulation depends on nitrogen availability as the primary factor [2,10], so in a nitrogen-rich medium, less lipids (and carbohydrates) are being produced by the microalgal cells. Phosphorus is another essential nutrient in growth media, which promotes the growth of microalgal cell and enhances the lipid synthesis. It has been claimed that N:P ratio in a growth media affects the lipid accumulation [10], while other studies [27] have not found any significant relationship between N:P ratio of growth medium and the chemical composition of the algal biomass, especially for the microalgae grown at higher light intensities. Hu [26] suggested that lower N:P ratio enhances lipid accumulation, but the response of all microalgal species is not the same. Lipid synthesis in C. vulgaris is reported as a highly complex phenomenon [25]. Chiu et al. [23] found that higher lipid contents could be achieved with more diluted ICW containing lower concentrations of ammonia and phosphorus.

3.3. Fatty Acid Composition

Chlorella sp. is a known producer of C18 and C16 fatty acids [24]. In agreement with this, C16:0 and C18:3 n-3 were the primary fatty acids found in Chlorella vulgaris (Table 3a). In the present study, the amount of C16:0 increased during cultivation of C. vulgaris in 34% ICW, but this pattern was not observed when higher levels of ICW were used (Table 3a). On the other hand, amounts of C16:0 were higher in the 100% ICW experiment compared to 34% ICW at all time points. Total unsaturated n-3 fatty acid contents decreased during the cultivation and with increasing concentration of growth media as shown in Table 3a. The same trend was suggested by He et al. [10]. The level of C18:3 n-3 followed the same pattern as the total n-3 fatty acids. Overall, the lowest amount of C18:3 n-3 was observed in C. vulgaris cultivated in 100% ICW after 16 days, whereas the highest amount was found at the first sampling point (day 3) in the 34% ICW experiment. Variations in polyunsaturated fatty acids were not the same in C. pyrenoidosa, since amounts of C18:3 n-3 slightly increased during the cultivation time, however this was only significant at 100% ICW (Table 3b).
The same pattern was observed for the total n-3 contents, and variations in C16:4 n-1 were also different in the two Chlorella species. In Chlorella vulgaris, amounts of C16:4 n-1 declined with the cultivation duration, unlike the variations of this fatty acid in C. pyrenoidosa biomass. Similarly, higher amounts of C20:5 n-3 and C22:5 n-3 were found in C. pyrenoidosa compared to C. vulgaris. Similar, the variations in C18:1 n-9 in C. pyrenoidosa was higher compared to C. vulgaris, with higher values in lower concentrations of ICW. These results confirm previous studies [10,27], showing that monounsaturated fatty acids accumulated when the nitrogen concentration in the growth medium was decreased [27].

3.4. Tocopherols

Tocopherol composition in both Chlorella species mostly include α-tocopherol as reported previously [22]. Contents of α-tocopherol increased during the cultivation, but the patterns were not the same at all concentrations of ICW in both species. The highest content of α-tocopherol was observed in 34% ICW experiment after eight days in Chlorella vulgaris (Figure 2a), whereas the 67% ICW experiment with C. pyrenoidosa resulted in the highest amount of α-tocopherol after 16 days (Figure 2b). In general, the concentration of α-tocopherol was higher compared to previous reports for Chlorella sorokiniana cultivated in wastewater [22]. To our knowledge, variations of α-tocopherol in C. vulgaris and C. pyrenoidosa during the growth was not reported in previous studies.

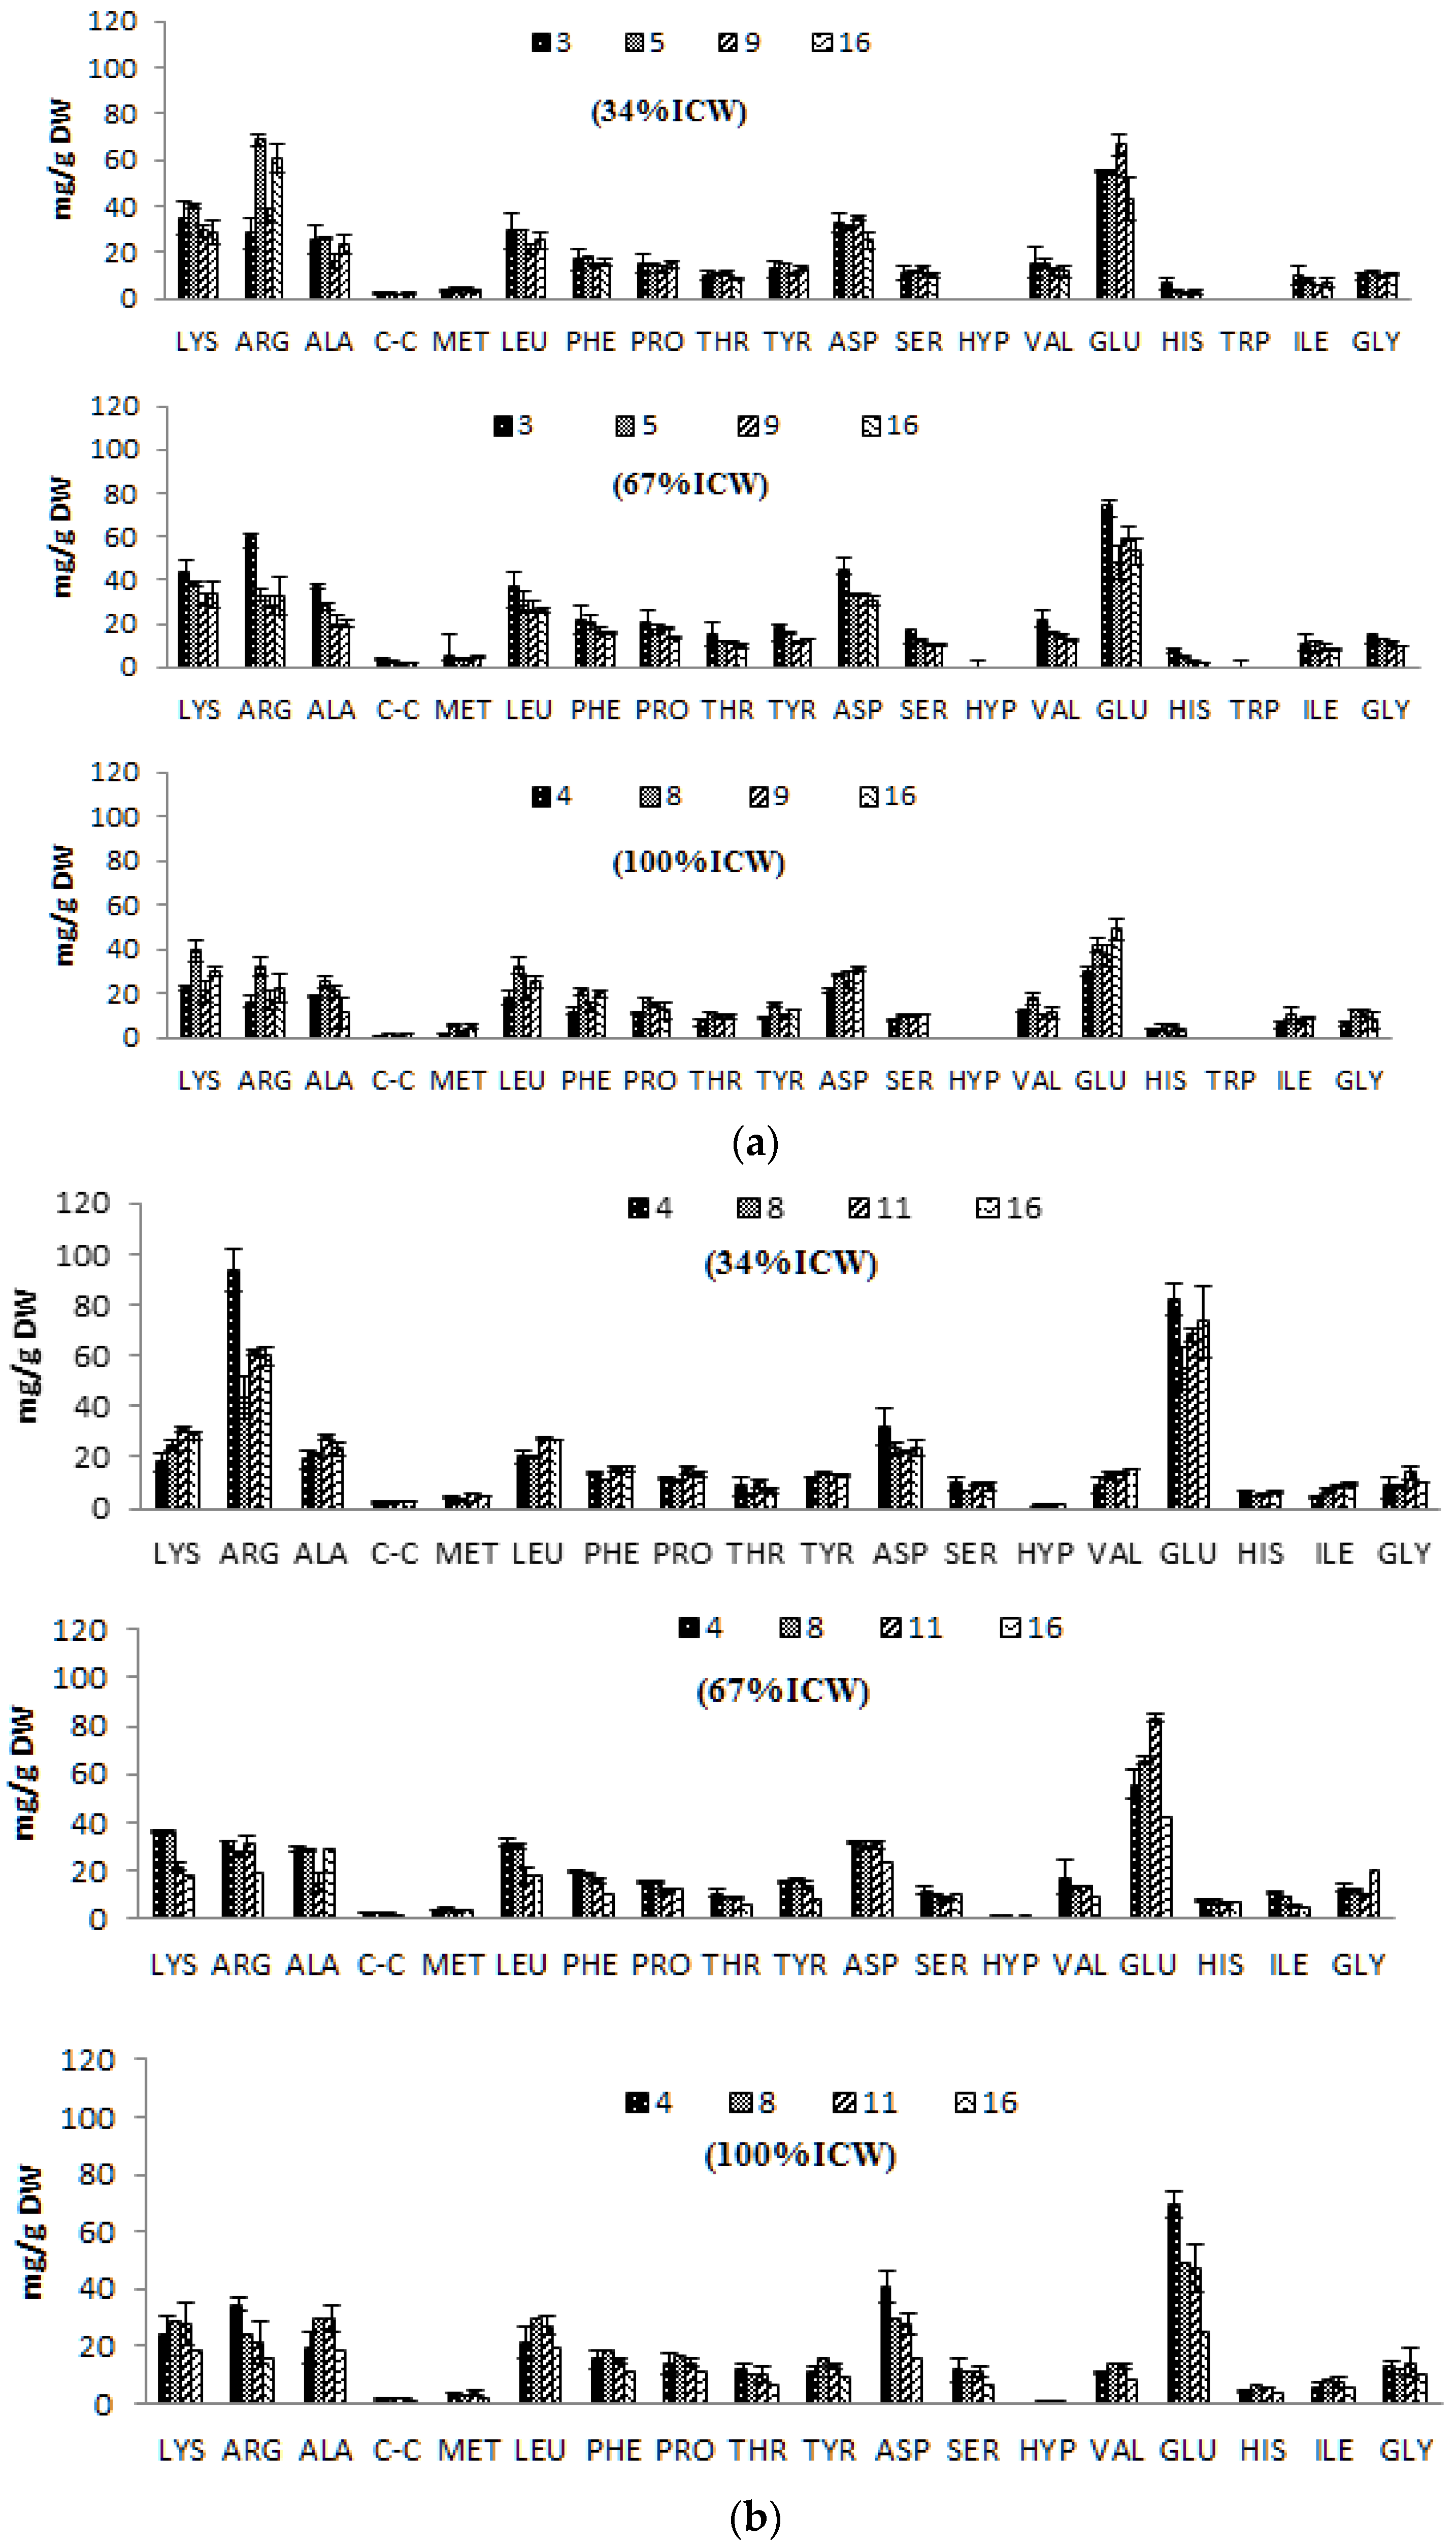
3.5. Amino Acid Composition
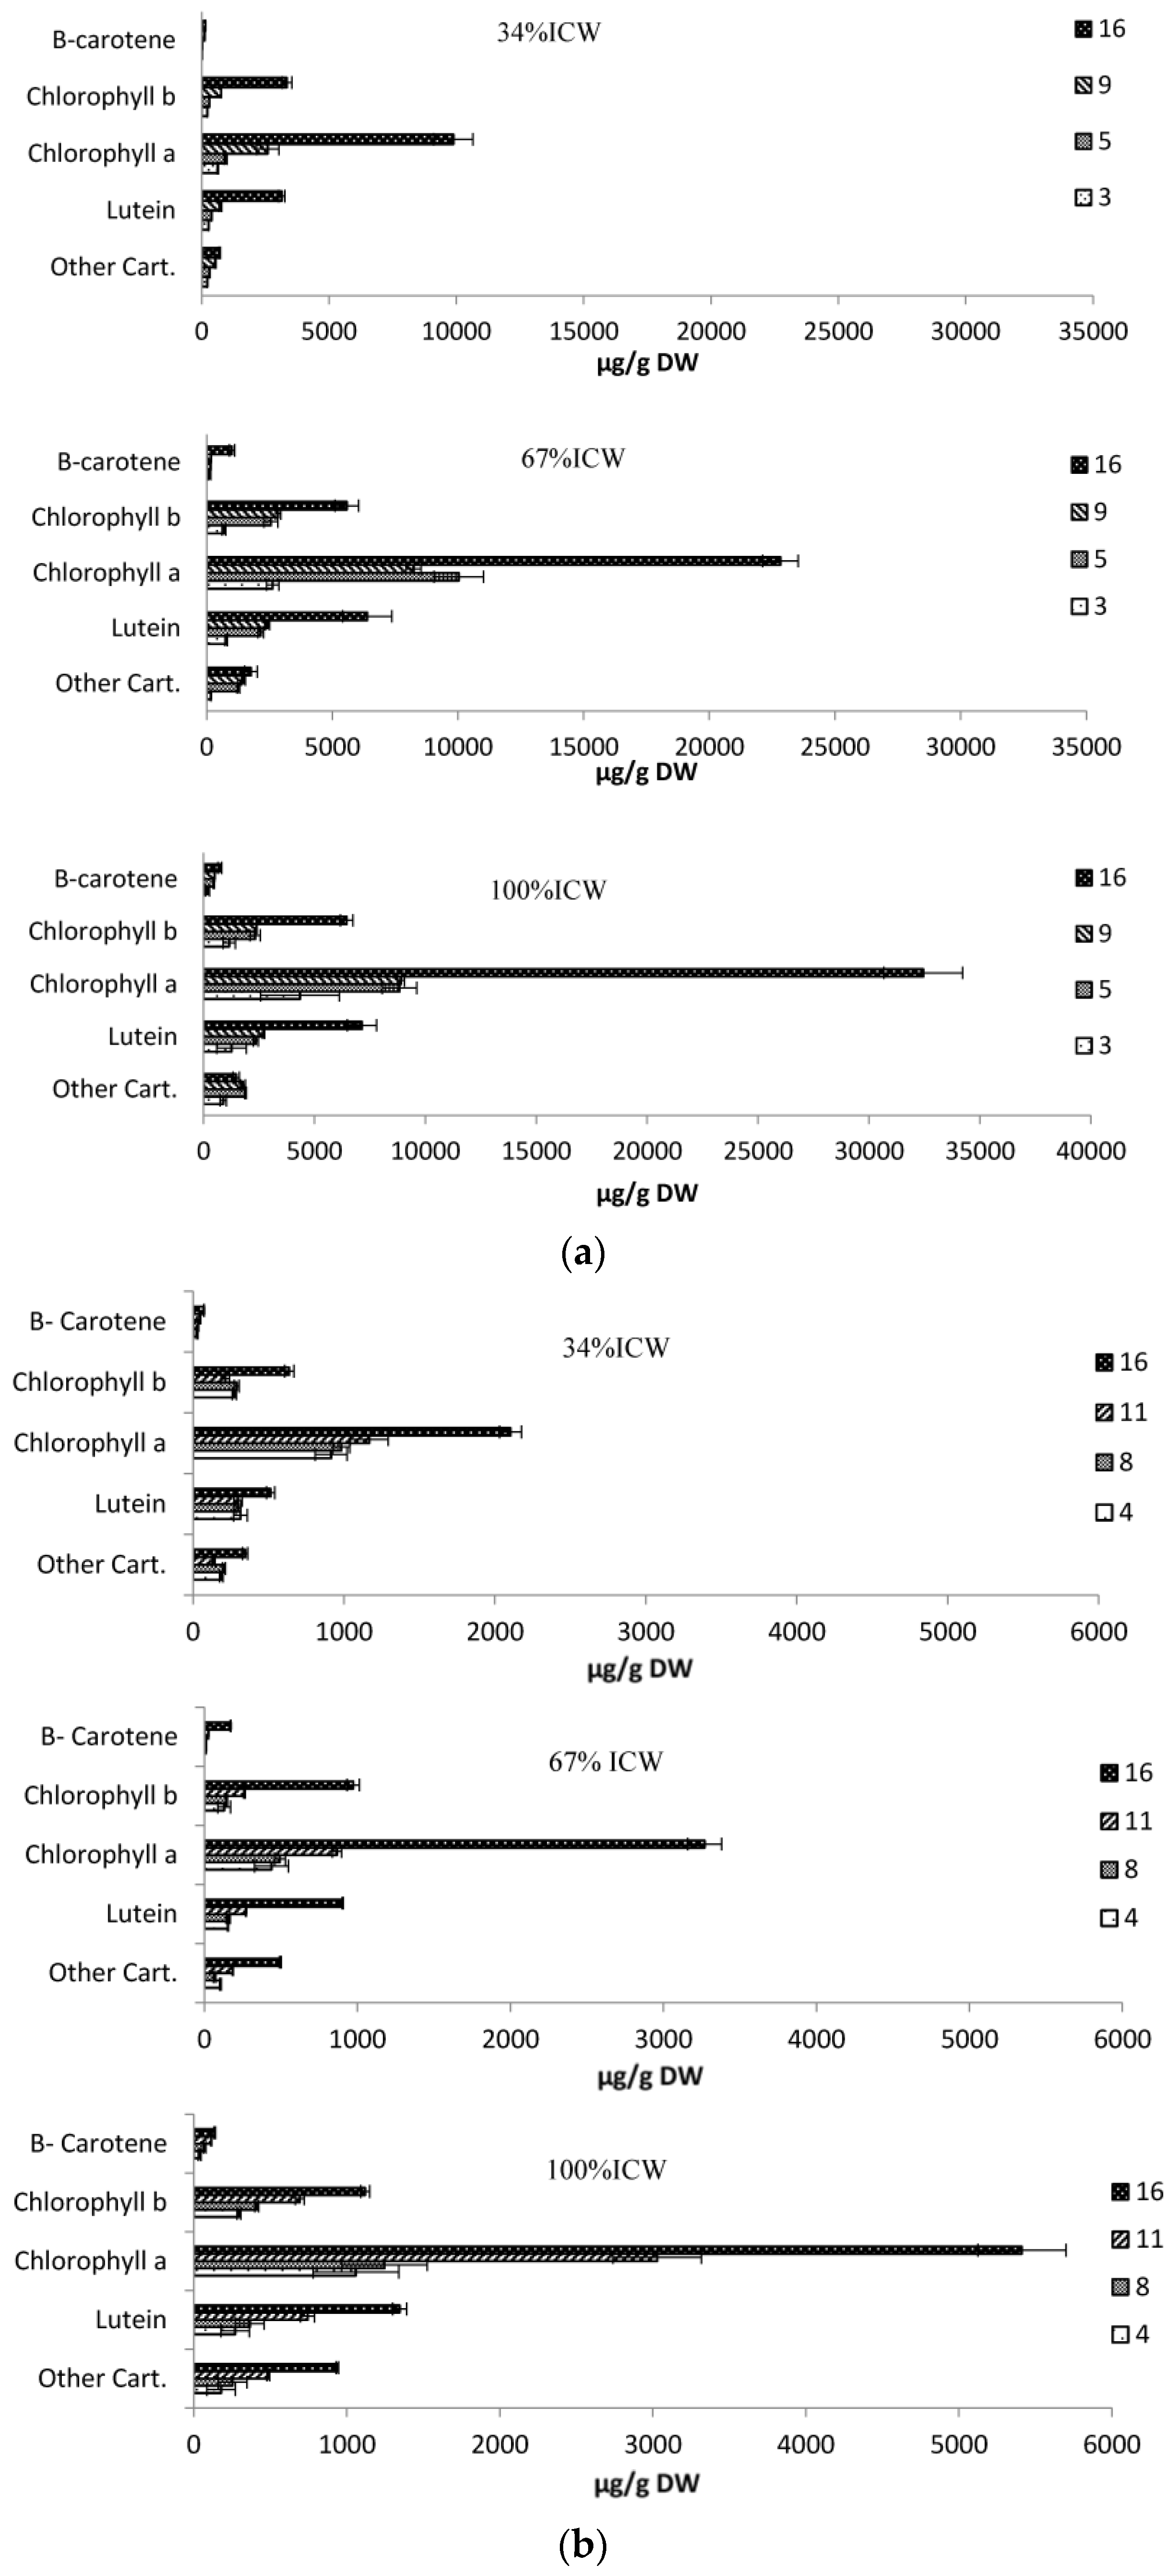
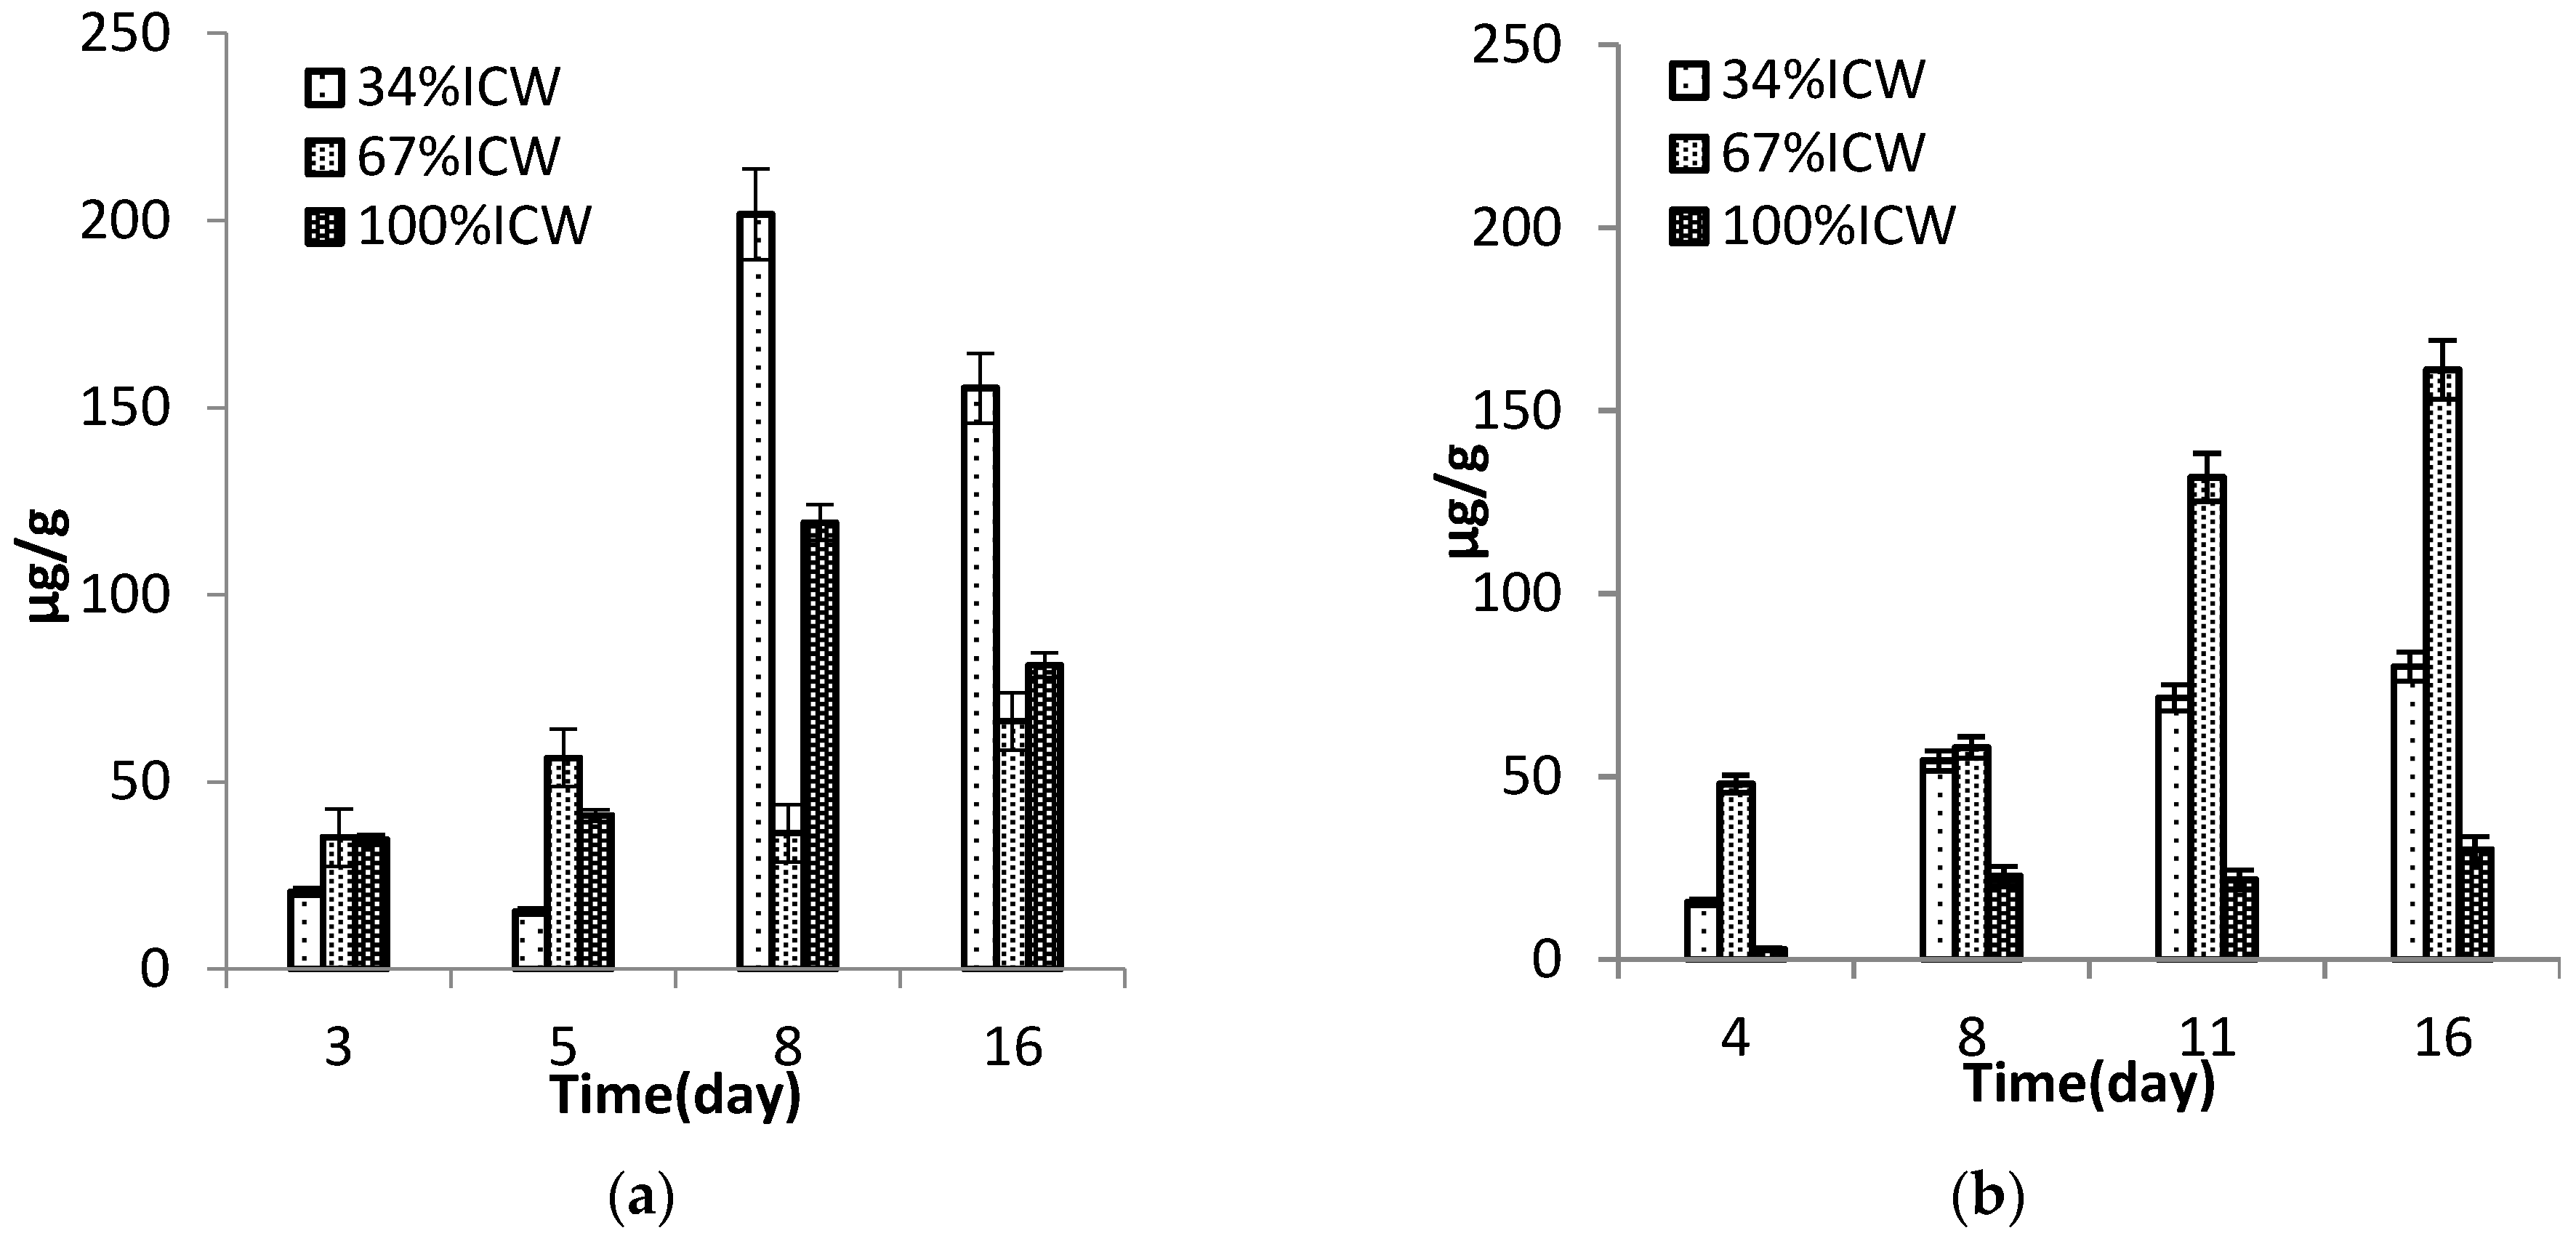
Amino acid composition in both Chlorella species includes arginine, glutamine, lysine, asparagine and leucine as principal components (Figure 3a,b). Amino acid composition in all microalgae is similar [4,30,31,32], but it can be influenced by variations in environmental conditions and growth medium composition. Amino acid profile of Chlorella pyrenoidosa in this study includes lysine, methionine, threonine, tryptophan, histidine, leucine, isoleucine, valine and phenylalanine. During cultivation, contents of glutamine, asparagine and lysine decreased in both species. Total amino acid contents also decreased, which correlates with variations in protein contents in the samples. Fish meal has always been the primary source of protein in the formulation of fish feed [33], partly due to its high protein content (ca. 70% DW) and excellent amino acid profile [34]. The continuous increase in both demand and price of fish meal emphasizes the need to find sustainable alternative resources. The biomass from the studied Chlorella species includes proper amounts of protein (ca. 58% DW for C. pyrenoidosa) and promising amino acid composition, which makes them a promising fish feed ingredient.
Animal source of amino acids such as fish meal contain a good balance of essential amino acids, but plant proteins such as soybeans are known as poor-quality as they lack some amino acids [4,35]. All fish require ten essential amino acids: arginine, histidine, isoleucine, leucine, lysine, methionine, phenylalanine, threonine, tryptophan and valine [36]. Amino acid composition of Chlorella sp. can be represented as a rich source of essential amino acids for the formulation of fish feed.

3.6. Pigments

The pigment composition in Chlorella species includes carotenoids and chlorophylls (Figure 4a,b). Lutein was the main xanthophyll in both species. Pigment production increased during the cultivation. In both species, a positive correlation between the pigment content and level of ICW was found. Chlorella vulgaris produced very high concentrations of chlorophylls and carotenoids with a plateau of 7141 ± 661 µg/g DW lutein and 32,444 ± 1772 µg/g DW chlorophyll a, at day 16 for microalgae cultivated on 100% ICW (Figure 4a). These amounts are approximately six times higher than for C. pyrenoidosa (Figure 4b) at 1345 ± 45 µg/g DW and 5411 ± 145 µg/g DW for lutein and chlorophyll a, respectively. The highest amount of β carotene (1013 ± 107 µg/g DW) was observed for C. vulgaris at day 16 in the 67% ICW experiment, whereas the highest concentration of β carotene (171.8 ± 3.9 µg/g DW) was observed at day 16 in the 34% ICW experiment for C. pyrenoidosa. The pigment production pattern was the same for both species. This showed that concentration of nitrogen in growth media influenced the accumulation of chlorophylls as previously reported [9,10,25]. High concentration of lutein (approx. 7.4 mg·L−1) was reported in Chlorococcum citriforme SAG 62.80 cultivated in optimal conditions by Del Campo et al. [36] He et al. [10] found that pigments reached their highest levels (0.2%–0.5% of the microalgal biomass) at very elevated levels of NH 4 + -N (210 mg·L−1) and also reported a positive correlation between concentration of pigments and levels of NH 4 + -N. Biosynthesis of carotenoids in microalgae is species dependent and highly affected by growth stage and growth conditions [36] Nitrogen is essential for the production of chlorophyll [2]. However, the accumulation of high levels of lutein and other carotenoids can be justified with the fact that optimal growth conditions, as well as sufficient nutrients, provide enough energy for the production of lutein and other carotenoids. The highest lutein concentration of approx. 0.7 pg·cell−1 has been reported in early stationary stage [35] for Chlorococcum citriforme SAG 62.80. Cordero et al. [37] reported a marked (from 1.4 to 3.2 mg·g−1 dry weight) increase in volumetric and cellular lutein accumulation in C. sorokiniana, when the content of nitrate in growth media rose from 10 to 40 mM. The study also reported that random mutagenesis increased the cellular lutein content up to 7.0 mg·g−1.
The high concentration of carotenoids (ca. 7 mg·g−1 DW lutein) in the produced biomass makes it suggestible as a promising ingredient in the formulation of fish feed [5], foods, health care products or cosmetics.

4. Conclusions

Cultivation of Chlorella vulgaris and C. pyrenoidosa is feasible using different percentages of industrial process water, and Chlorella pyrenoidosa was even able to grow in 100% industrial process water and produce elevated levels of biomass. Protein and pigment contents were enhanced by higher percentages of industrial process water in growth media, and protein contents were higher in C. pyrenoidosa than in C. vulgaris, while C. vulgaris produced extremely high amounts of both chlorophylls and carotenoids.
Resulting biomass with moderate lipid content and high levels of protein and carotenoids can be presented as a valuable ingredient for the aquatic feed industry. With further extraction and fractionation, biomass could also be a rich source of protein and lutein for the e.g., food and cosmetic industry. Future upscaling to industrial scale could lead to sustainable, environmentally friendly valorization of a priceless resource of waste water. Beside this, bio-utilization of nutrients such as nitrogen and phosphorous reduces the biological oxygen demand of the waste water, saving on costs of waste water treatment before release to the environment.

Acknowledgments

Authors wish to acknowledge Inge Holmberg and Michael Z. Hass for their technical assistance. This study was funded by Green Development and Demonstration program (GUDP; Project Number: 34009-13-0616) under the Danish Food Ministry and E4Water under EU’s 7th framework programme. We would like to thank Kalundborg WWTP (Kalundborg Utilities) and Novozymes A/S for providing access to industrial wastewater.

Author Contributions

All authors contributed to the design of experiments. Cultivation of Chlorella species was done by Hamed Safafar and Patrick Uldall Nørregaard. Sample preparation and chemical analysis, data treatment and statistical analyses were done by Hamed Safafar. All authors contributed to the writing and review of the manuscript and revising it critically for important intellectual content. All authors also contributed to final approval of the version to be submitted.

Conflicts of Interest

The authors declare no conflict of interest.

References

  1. Bishop, W.M.; Zubeck, H. Evaluation of Microalgae for use as Nutraceuticals and Nutritional Supplements. J. Nutr. Food Sci. 2012. [Google Scholar] [CrossRef]
  2. Griffiths, M.J.; van Hille, R.P.; Harrison, S.T. The effect of nitrogen limitation on lipid productivity and cell composition in Chlorella vulgaris. Appl. Microbiol. Biotechnol. 2014, 98, 2345–2356. [Google Scholar] [CrossRef] [PubMed]
  3. Viegas, C.V.; Hachemi, I.; Mäki-Arvela, P. Algal products beyond lipids: Comprehensive characterization of different products in direct saponification of green alga Chlorella sp. Algal Res. 2015, 11, 156–164. [Google Scholar] [CrossRef]
  4. Becker, E.W. Micro-algae as a source of protein. Biotechnol. Adv. 2007, 25, 207–210. [Google Scholar] [CrossRef] [PubMed]
  5. Gouveia, L.; Choubert, G.; Rema, P. Use of Chlorella vulgaris as a carotenoid source for rainbow trout: Effect of dietary lipid content on pigmentation, digestibility and retention in the muscle tissue. Aquac. Int. 1998, 279, 269–279. [Google Scholar] [CrossRef]
  6. Samek, D.; Mišurcová, L.; Machů, L. Whole-Cell Protein Profiles of Disintegrated Freshwater Green Algae and Cyanobacterium. J. Aquat. Food Prod. Technol. 2016, 25, 15–23. [Google Scholar] [CrossRef] [Green Version]
  7. Morris, H.J.; Almarales, A.; Carrillo, O. Utilisation of Chlorella vulgaris cell biomass for the production of enzymatic protein hydrolysates. Bioresour. Technol. 2008, 99, 7723–7729. [Google Scholar] [CrossRef] [PubMed]
  8. Shi, X.M.; Chen, F.; Yuan, J.P.; Chen, H. Heterotrophic production of lutein by selected Chlorella strains. J. Appl. Phycol. 1997, 9, 445–450. [Google Scholar] [CrossRef]
  9. Sun, Z.; Li, T.; Zhou, Z.; Jiang, Y. Microalgae as a source of lutein: Chemistry, biosynthesis, and carotenogenesis. Adv. Biochem. Eng. Biotechnol. 2016, 153, 37–58. [Google Scholar] [PubMed]
  10. He, P.J.; Mao, B.; Shen, C.M. Cultivation of Chlorella vulgaris on wastewater containing high levels of ammonia for biodiesel production. Bioresour. Technol. 2013, 129, 177–181. [Google Scholar] [CrossRef] [PubMed]
  11. Gismondi, A.; di Pippo, F.; Bruno, L.; Antonaroli, S.; Congestri, R. Phosphorus removal coupled to bioenergy production by three cyanobacterial isolates in a biofilm dynamic growth system. Int. J. Phytoremediat. 2016, 18, 869–876. [Google Scholar] [CrossRef] [PubMed]
  12. Congestri, R.; di Pippo, F.; de Philippis, R.; Buttino, I.; Paradossi, G.; Albertano, P. Seasonal succession of phototrophic biofilms in an Italian wastewater treatment plant: Biovolume, spatial structure and exopolysaccharides. Aquat. Microb. Ecol. 2006, 45, 301–312. [Google Scholar] [CrossRef]
  13. McHugh, S.; O’Reilly, C.; Mahony, T. Anaerobic granular sludge bioreactor technology. Rev. Environ. Sci. Biotechnol. 2003, 2, 225–245. [Google Scholar] [CrossRef]
  14. Safafar, H.; Hass, M.Z.; Møller, P.; Holdt, S.L.; Jacobsen, C. High-EPA Biomass from Nannochloropsis salina Cultivated in a Flat-Panel Photo-Bioreactor on a Process Water-Enriched Growth Medium. Mar. Drugs 2016, 14, 144. [Google Scholar] [CrossRef] [PubMed] [Green Version]
  15. Tam, N.F.Y.; Lau, P.S.; Wong, Y.S. Wastewater inorganic N and P removal by immobilised Chlorella vulgaris. Water Sci. Technol. 1994, 30, 369–374. [Google Scholar]
  16. Tam, N.F.Y.; Wong, Y.S. Wastewater nutrient removal by Chlorella pyrenoidosa and Scenedesmus sp. Environ. Pollut. 1989, 58, 19–34. [Google Scholar] [CrossRef]
  17. Liu, J.; Hu, Q. Chlorella: Industrial Production of Cell Mass and Chemicals. In Handbook of Microalgal Culture; John Wiley & Sons, Ltd.: Oxford, UK, 2013; pp. 327–338. [Google Scholar]
  18. Chung, K.; Ferris, D.H. Martinus Willem Beijerinck (1851–1931). J. Am. Med. Assoc. 1963, 185, 40–41. [Google Scholar]
  19. Griffiths, M.J.; Garcin, C.; van Hille, R.P.; Harrison, S.T.L. Interference by pigment in the estimation of microalgal biomass concentration by optical density. J. Microbiol. Methods 2011, 85, 119–123. [Google Scholar] [CrossRef] [PubMed]
  20. Bligh, E.G.; Dyer, W.J. A rapid method of total lipid extraction and purification. Can. J. Biochem. Physiol. 1959, 37, 911–917. [Google Scholar] [CrossRef] [PubMed]
  21. Firestone, D.A.O.A.C. Official Methods and Recommended Practices of the AOCS, 5th ed.; American Oil Chemist’s Society: Urbana, IL, USA, 2009. [Google Scholar]
  22. Safafar, H.; van Wagenen, J.; Møller, P.; Jacobsen, C. Carotenoids, Phenolic Compounds and Tocopherols Contribute to the Antioxidative Properties of Some Microalgae Species Grown on Industrial Wastewater. Mar. Drugs 2015, 13, 7339–7356. [Google Scholar] [CrossRef] [PubMed] [Green Version]
  23. Chiu, S.Y.; Kao, C.Y.; Chen, T.Y. Cultivation of microalgal Chlorella for biomass and lipid production using wastewater as nutrient resource. Bioresour. Technol. 2015, 184, 179–189. [Google Scholar] [CrossRef] [PubMed]
  24. Cho, S.; Lee, N.; Park, S. Microalgae cultivation for bioenergy production using wastewaters from a municipal waste water treatment plant, as nutritional sources. Bioresour. Technol. 2013, 131, 515–520. [Google Scholar] [CrossRef] [PubMed]
  25. Lv, J.M.; Cheng, L.H.; Xu, X.H. Enhanced lipid production of Chlorella vulgaris by adjustment of cultivation conditions. Bioresour. Technol. 2010, 101, 6797–6804. [Google Scholar] [CrossRef] [PubMed]
  26. Hu, Q. Environmental effects on cell composition. In Handbook of Microalgal Culture; John Wiley & Sons, Ltd.: Oxford, UK, 2003; pp. 83–94. [Google Scholar]
  27. Leonardos, N.; Geider, R.J. Responses of elemental and biochemical composition of Chaetoceros muelleri to growth under varying light and nitrate:phosphate supply ratios and their influence on critical N:P. Limnol. Oceanogr. 2004, 49, 2105–2114. [Google Scholar] [CrossRef]
  28. Guccione, A.; Biondi, N.; Sampietro, G. Chlorella for protein and biofuels: From strain selection to outdoor cultivation in a Green Wall Panel photo bioreactor. Biotechnol. Biofuels 2014, 7, 84. [Google Scholar] [CrossRef] [PubMed]
  29. Waghmare, A.G.; Salve, M.K.; LeBlanc, J.G.; Arya, S.S. Concentration and characterization of microalgae proteins from Chlorella pyrenoidosa. Bioresour. Bioprocess. 2016, 3, 16. [Google Scholar] [CrossRef]
  30. Alonso, D.L.; Belarbi, E.H.; Fernandez-Sevilla, J.M. Acyl lipid composition variation related to culture age and nitrogen concentration in continuous culture of the microalga Phaeodactylum tricornutum. Phytochemistry 2000, 54, 461–471. [Google Scholar] [CrossRef]
  31. Guedes, A.C.; Malcata, F.X. Nutritional Value and Uses of Microalgae in Aquaculture; Muchlisin, Z., Ed.; INTECH Open Access Publisher: Rijeka, Croatia, 2012. [Google Scholar]
  32. Zhang, W.; Zhang, Z.; Yan, S. Effects of various amino acids as organic nitrogen sources on the growth and biochemical composition of Chlorella pyrenoidosa. Bioresour. Technol. 2015, 197, 458–464. [Google Scholar] [CrossRef] [PubMed]
  33. Roy, S.S.; Pal, R. Microalgae in Aquaculture: A Review with Special References to Nutritional Value and Fish Dietetics. Proc. Zool. Soc. 2015, 68, 1–8. [Google Scholar] [CrossRef]
  34. Kim, S.S.; Rahimnejad, S.; Kim, K.W.; Lee, K.J. Feeding ecology of the topmouth gudgeon Pseudorasbora parva (Temminck and Schlegel, 1846) in the Gelingüllü Reservoir, Turkey. Turk. J. Fish. Aquat. Sci. 2013, 13, 87–94. [Google Scholar]
  35. National Research Council (NRC). Nutrient Requirements of Fish; National Academy Press: Washington, DC, USA, 1993; p. 114. [Google Scholar]
  36. Del Campo, J.A.; Moreno, J.; Rodriguez, H. Carotenoid content of Chlorophycean microalgae: Factors determining lutein accumulation in Muriellopsis sp. (Chlorophyta). J. Biotechnol. 2000, 76, 51–59. [Google Scholar] [CrossRef]
  37. Cordero, B.F.; Obraztsova, I.; Couso, I. Enhancement of lutein production in Chlorella sorokiniana (chorophyta) by improvement of culture conditions and random mutagenesis. Mar. Drugs 2011, 9, 1607–1624. [Google Scholar] [CrossRef] [PubMed] [Green Version]
Figure 1. Growth curve during 16 days of cultivation in internal circulation water (ICW): (a) Chlorella vulgaris; (b) Chlorella pyrenoidosa. The error bars represent the standard deviations.
Jmse 04 00084 g001
Figure 2. Contents of α-tocopherol in Chlorella vulgaris (a); and Chlorella pyrenoidosa (b), during the cultivation on ICW. The error bars represent the upper and lower values.
Jmse 04 00084 g002
Figure 3. Amino acid composition in Chlorella vulgaris (a); and Chlorella pyrenoidosa (b), during the cultivation in ICW. The error bars represent the standard deviation. LYSL: Lysine, ALA: alanine, ARG: arginine, LEU: leucine, C-C: cysteine, MET: methionine, PHE: phenylalanine, PRO: proline, THR: threonine, TYR: tyrosine, ASP: asparagine, SER: serine, HYP: hydrocy proline, GLU: glutamine, VAL: valine, HIS: histidine, ILE: isoleucine, GLY: glycine.
Jmse 04 00084 g003
Figure 4. Pigment composition in Chlorella vulgaris (a); and Chlorella pyrenoidosa (b), during the cultivation on ICW. Sampling day is noted as 4, 8, 11, and 16, distinguished by the different patterns. Other carotenoids: zeaxanthin, lutein derivatives, canthaxanthin and violaxanthin. The error bars represent the standard deviation.
Jmse 04 00084 g004
Table 1. (a) Chemical composition of industrial process water; and (b) type and amounts of nitrogen and phosphorus in each growth medium.
(a) Chemical Composition of Industrial Process Water
ItemUnitAmount
pH-8.1
Suspended solidsmg/L20
Total Nmg/L190
Ammonia + ammonium-Nmg/L150
Nitrite + nitratemg/L<0.1
Total Pmg/L11
Sulphatemg/L3.6
Total cyanideµg/L2.5
Total Alkalinitymmol/L62.5
EDTA (Ethylenediaminetetraacetic acid)mg/L<0.5
Sodium (Na)mg/L1500
Cadmium (Cd)µg/L<0.05
Copper (Cu)µg/L3.4
Iron (Fe)mg/l0.23
Cobolt (Co)µg/L<0.5
(b) Type and Amounts of Nitrogen and Phosphorus in Each Growth Medium
Growth Media * N H 4 + -NTotal P
34% ICW503.5
67% ICW1006.8
100% ICW15011
* All values are in mg/L.
Table 2. Lipid and protein contents of Chlorella vulgaris (a); and Chlorella pyrenoidosa (b).
(a) Chlorella vulgaris
Lipids % DW
Cultivation Time (days)ICW%
3467100
33.51 ± 0.2 a, x4.63 ± 0.0 a, x4.60 ± 0.2 a, y
55.61 ± 0.1 b, x5.80 ± 0. 3 b, x7.20 ± 0. 1 b, y
99.70 ± 0.3 c, y9.00 ± 0.1 c, x9.87 ± 0.1 c, y
1617.0 ± 0.1 d, z11.4 ± 0. 4 d, x13.0 ± 0. 4 d, y
Proteins % DW
Cultivation Time (days)ICW%
3467100
342.3 ± 2.8 a, x44.8 ± 4.1 a, y42.4 ± 1.1 a, x
555.1 ± 1.4 c, x54.4 ± 3.3 c, x55.2 ± 1.8 d, x
949.9 ± 1.0 b, xy47.7 ± 2. 3 b, x51.1 ± 0.9 c, x
1642.0 ± 0.9 a, x44.4 ± 1.3 a, y47.4 ± 2.1 d, z
(b) Chlorella pyrenoidosa
Lipids % DW
Cultivation Time (days)ICW%
3467100
42.51 ± 0.2 a, x5.91 ± 0.0 a, y5.75 ± 0.1 a, y
83.52 ± 0.1 b, x8.80 ± 0.1 b. y8.20 ± 0.2 b, y
119.30 ± 0.1 c, y10.0 ± 0.3 c, z7.87 ± 0. 3 b, x
1617.6 ± .0.1 d, z13.1 ± 0.5 d, y10.0 ± 0.3 c, x
Proteins % DW
Cultivation Time (days)ICW%
3467100
452.3 ± 2.2 c, x60.3 ± 3.7 c, y53.1 ± 1.2 a, x
855.8 ± 1.0 d, x65.2 ± 1.3 d, z58.2 ± 3.5 b, y
1147.8 ± 1.9 ab, x57.4 ± 2.0 b, y59.1 ± 3.1 bc, z
1646.3 ± 2.8 a, x54.6 ± 2.7 a, y57.8 ± 3.2 b, z
Data are presented as % of dry weight (DW) basis. For each parameter, same letters indicate similar values between cultivation duration (x–z), and ICW percentage (a–d) (p < 0.05).
Table 3. Fatty acid compositions of Chlorella vulgaris (a); and Chlorella pyrenoidosa (b). The second row at each table shows the cultivation time (day).
(a) Chlorella vulgaris
ICW %3467100
Fatty Acid359163591635916
14:001.03 ± 0.340.57 ± 0.030.61 ± 0.070.47 ± 0.010.81 ± 0.221.49 ± 0.621.51 ± 0.060.29 ± 0.040.92 ± 0.041.97 ± 0.011.60 ± 0.050.40 ± 0.01
14:010.95 ± 0.000.32 ± 0.020.53 ± 0.030.36 ± 0.010.37 ± 0.010.27 ± 0.170.36 ± 0.040.39 ± 0.010.53 ± 0.010.28 ± 0.000.25 ± 0.040.38 ± 0.00
15:000.20 ± 0.000.17 ± 0.010.17 ± 0.000.11 ± 0.010.18 ± 0.010.16 ± 0.010.14 ± 0.010.14 ± 0.000.23 ± 0.000.25 ± 0.020.18 ± 0.010.15 ± 0.01
16:0018.1 ± 2.7618.4 ± 0.1120.7 ± 0.0423.3 ± 0.0719.1 ± 0.0619. 0 ± 0.4817.1 ± 0.0117.7 ± 0.0424.0 ± 0.1723.1 ± 0.0521.2 ± 0.0123.1 ± 0.11
16:1 (n-7)1.88 ± 0.561.34 ± 0.041.87 ± 0.137.15 ± 0.012.56 ± 0.200.94 ± 0.011.62 ± 0.1017.6 ± 0.015.28 ± 0.013.58 ± 0.011.43 ± 0.0116.4 ± 0.08
16:2 (n-4)3.46 ± 0.744.56 ± 0.014.76 ± 0.082.51 ± 0.054.66 ± 0.045.24 ± 0.126.18 ± 0.011.96 ± 0.013.00 ± 0.045.90 ± 0.046.72 ± 0.042.14 ± 0.01
16:4(n-1)16.2 ± 2.3915.2 ± 0.0110.9 ± 0.2310.9 ± 0.0616.4 ± 0.0516.1 ± 0.3512.4 ± 0.0410.7 ± 0.1112.4 ± 0.1112.7 ± 0.119.15 ± 0.118.2 ± 0.19
18:001.20 ± 0.101.03 ± 0.041.01 ± 0.012.04 ± 0.011.14 ± 0.010.45 ± 0.020.46 ± 0.011.50 ± 0.051.58 ± 0.000.63 ± 0.010.85 ± 0.003.14 ± 0.02
18:1 (n-9)5.91 ± 0.888.33 ± 0.1111.4 ± 0.3013.2 ± 0.084.52 ± 0.065.53 ± 0.137.1 ± 0.0811.9 ± 0.065.82 ± 0.024.51 ± 0.0114.7 ± 0.0113.2 ± 0.04
18:1 (n-7)4.01 ± 0.763.58 ± 0.018.26 ± 0.259.37 ± 0.063.25 ± 0.011.35 ± 0.011.89 ± 0.017.39 ± 0.013.99 ± 0.033.16 ± 0.012.44 ± 0.007.23 ± 0.02
18:2 (n-6)7.59 ± 1.079.73 ± 0.0110.9 ± 0.177.37 ± 0.019.68 ± 0.0312.7 ± 0.3117.8 ± 0.064.72 ± 0.039.17 ± 0.0212.5 ± 0.0116.7 ± 0.036.42 ± 0.03
18:3 (n-3)35. 9 ± 4.8835.5 ± 0.1327.6 ± 0.5222.1 ± 0.1035.9 ± 0.2536.2 ± 0.8833.0 ± 0.0824.3 ± 0.1931.7 ± 0.1031.5 ± 0.1124.3 ± 0.1516.7 ± 0.18
20:4 (n-6)1.07 ± 0.130.28 ± 0.060.37 ± 0.020.20 ± 0.010.49 ± 0.020.11 ± 0.100.05 ± 0.000.46 ± 0.010.44 ± 0.030.13 ± 0.020.06 ± 0.000.97 ± 0.01
20:5 (n-3)0.81 ± 0.02NDNDNDNDNDNDNDNDNDNDND
22:5 (n-3)1.72 ± 0.250.79 ± 0.050.77 ± 0.020.79 ± 0.010.81 ± 0.030.21 ± 0.100.12 ± 0.010.76 ± 0.010.83 ± 0.010.34 ± 0.010.18 ± 0.021.44 ± 0.03
∑Sat20.3 ± 3.2020.2 ± 0.2022.5 ± 0.1225.3 ± 0.1021.3 ± 0.3021.1 ± 1.1219.2 ± 0.0819.6 ± 0.1326.7 ± 0.2125.2 ± 0.0723.8 ± 0.0726.8 ± 0.20
n-338.4 ± 5.1536.3 ± 0.1828.4 ± 0.5422.3 ± 0.1136.7 ± 0.2836.5 ± 0.9833.1 ± 0.0825.0 ± 0.1932.6 ± 0.1131.9 ± 0.1224.5 ± 0.1518.1 ± 0.21
n-68.60 ± 1.2010.0 ± 0.0811.2 ± 0.197.50 ± 0.0110.1 ± 0.0512.8 ± 0.4117.9 ± 0.065.20 ± 0.019.60 ± 0.0512.6 ± 0.0416.8 ± 0.037.30 ± 0.04
(b) Chlorella pyrenoidosa
ICW %3467100
Fatty Acid481116481116481116
14:000.37 ± 0.080.33 ± 0.100.49 ± 0.020.68 ± 0.100.71 ± 0.261.06 ± 0.620.30 ± 0.020.85 ± 0.031.50 ± 0.010.83 ± 0.252.21 ± 0.081.79 ± 0.15
14:010.10 ± 0.010.16 ± 0.010.36 ± 0.020.52 ± 0.010.21 ± 0.010.39 ± 0.010.79 ± 0.630.37 ± 0.050.24 ± 0.020.52 ± 0.020.53 ± 0.020.67 ± 0.01
15:000.24 ± 0.020.08 ± 0.010.13 ± 0.060.27 ± 0.010.25 ± 0.010.21 ± 0.000.45 ± 0.370.16 ± 0.000.24 ± 0.030.16 ± 0.030.30 ± 0.090.15 ± 0.02
16:0013.9 ± 0.0917.3 ± 0.2317.8 ± 1.8616.8 ± 0.2320.6 ± 0.2120.7 ± 0.0417.4 ± 1.2219.3 ± 0.0826.1 ± 0.0521.7 ± 0.2619.3 ± 2.4320.3 ± 0.35
16:1 (n-7)1.54 ± 0.020.86 ± 0.281.00 ± 0.111.22 ± 0.280.98 ± 0.291.20 ± 0.141.13 ± 0.031.71 ± 1.071.30 ± 0.010.97 ± 0.041.56 ± 0.011.13 ± 0.04
16:2 (n-4)3.24 ± 0.032.83 ± 0.042.60 ± 0.302.65 ± 0.045.23 ± 0.074.49 ± 0.145.75 ± 0.335.82 ± 0.052.85 ± 0.027.04 ± 0.084.52 ± 0.493.52 ± 0.08
16:3 (n-4)0.11 ± 0.010.13 ± 0.020.35 ± 0.240.00 ± 0.010.10 ± 0.010.27 ± 0.060.26 ± 0.080.09 ± 0.00ND0.18 ± 0.040.58 ± 0.280.30 ± 0.13
16:4(n-1)11.0 ± 0.3711.0 ± 0.1010.5 ± 1.3511.6 ± 0.1012.2 ± 0.5012.7 ± 0.3113.7 ± 0.9413.9 ± 0.2810.6 ± 0.0910.1 ± 0.1112.7 ± 1.3912.0 ± 0.24
17:00ND0.10 ± 0.010.17 ± 0.010.10 ± 0.060.10 ± 0.14NDNDNDND0.11 ± 0.01NDND
18:003.07 ± 0.010.85 ± 0.031.17 ± 0.170.80 ± 0.030.95 ± 0.051.08 ± 0.010.56 ± 0.050.44 ± 0.011.81 ± 0.010.62 ± 0.041.37 ± 0.180.98 ± 0.06
18:1 (n-9)15.0 ± 0.1828.2 ± 0.8419.3 ± 1.2218.3 ± 0.847.4 ± 0.1110.6 ± 0.0310.7 ± 0.915.26 ± 0.046.51 ± 0.027.67 ± 0.018.48 ± 0.408.03 ± 0.16
18:1 (n-7)7.98 ± 0.072.70 ± 0.033.20 ± 0.304.52 ± 0.033.36 ± 0.222.50 ± 0.022.36 ± 0.211.80 ± 0.076.89 ± 0.002.02 ± 0.013.14 ± 0.043.07 ± 0.03
18:2 (n-6)12.3 ± 0.0310.4 ± 0.1911.9 ± 1.2911.7 ± 0.1914.9 ± 0.0611.6 ± 0.3813.3 ± 1.0615.4 ± 0.189.8 ± 0.0116.8 ± 0.2011.0 ± 1.1711.8 ± 0.28
18:3 (n-3)30.5 ± 0.2724.2 ± 0.0827.7 ± 3.0829 ± 0.0832.0 ± 0.3329.1 ± 0.8432.0 ± 2.4733.3 ± 0.1031.3 ± 0.1130.1 ± 0.2830.8 ± 3.3633.9 ± 0.86
20:1 (n-9)NDNDNDNDND0.16 ± 0.01NDNDNDND0.17 ± 0.010.09 ± 0.01
20:4 (n-6)0.25 ± 0.030.14 ± 0.010.96 ± 0.140.39 ± 0.010.19 ± 0.020.87 ± 0.080.24 ± 0.010.26 ± 0.040.25 ± 0.010.24 ± 0.020.79 ± 0.090.47 ± 0.01
20:5 (n-3)ND0.23 ± 0.020.60 ± 0.300.65 ± 0.020.33 ± 0.011.32 ± 0.040.33 ± 0.030.45 ± 0.16ND0.33 ± 0.011.11 ± 0.060.71 ± 0.01
22:5 (n-3)0.43 ± 0.020.32 ± 0.051.67 ± 0.220.83 ± 0.050.33 ± 0.021.62 ± 0.070.44 ± 0.040.76 ± 0.120.53 ± 0.040.45 ± 0.031.32 ± 0.120.94 ± 0.10
∑Sat17.6 ± 0.1818.7 ± 0.4319.7 ± 2.0918.5 ± 0.4322.6 ± 0.6623.1 ± 0.6718.7 ± 1.6620.8 ± 0.0929.6 ± 0.1021.4 ± 0.5923.2 ± 2.7824.2 ± 0.57
n-331.0 ± 0.2924.7 ± 0.1629.9 ± 3.5930.4 ± 0.1632.7 ± 0.3332.0 ± 0.9532.8 ± 2.5334.5 ± 0.6931.8 ± 0.1530.92 ± 0.2933.2 ± 3.5435.5 ± 0.98
n-612.5 ± 0.0610.5 ± 0.1912.9 ± 1.4412.1 ± 0.1915.1 ± 0.0612.4 ± 0.4613.6 ± 1.0715.6 ± 0.2210.1 ± 0.0217.0 ± 0.2211.8 ± 1.2712.3 ± 0.28
Values are given as mean % of total fatty acids (n = 2) ± standard deviation (absolute value). ND: not detected.

