Article

Effect of Coastal Erosion on Storm Surge: A Case Study in the Southern Coast of Rhode Island

1
Department of Ocean Engineering, University of Rhode Island, Narragansett, RI 02882, USA
2
Environmental Earth Science Department, Eastern Connecticut State University, Willimantic, CT 06226, USA
*
Author to whom correspondence should be addressed.
J. Mar. Sci. Eng. 2016, 4(4), 85; https://doi.org/10.3390/jmse4040085
Submission received: 26 July 2016 / Revised: 31 October 2016 / Accepted: 22 November 2016 / Published: 7 December 2016

Abstract

:
The objective of this study was to assess the effect of shoreline retreat and dune erosion on coastal flooding in a case study located in the southern coast of Rhode Island, USA. Using an extensive dataset collected during 2011, an ADCIRC model was developed to simulate the propagation of storm surge in the coastal areas, including coastal inlets and ponds. A simplified methodology, based on the geological assessment of historical trends of the shoreline retreat and dune erosion in this area, was incorporated in the model to represent coastal erosion. The results showed that for extreme storms (e.g., a 100-year event), where coastal dunes are overtopped and low-lying areas are flooded, the flooding extent is not significantly sensitive to coastal erosion. However, failure of the dunes leads to a significant increase of the flooding extent for smaller storms. Substantial dampening of the storm surge elevation in coastal ponds for moderate and small storms was associated with coastal inlets connecting to coastal ponds which are often not resolved in regional surge models. The shoreline change did not significantly affect the extent of flooding. It was also shown that the accuracy of a storm surge model highly depends on its ability to resolve coastal inlets, which is critical for reliable storm surge predictions in areas with inlet-basin systems.

1. Introduction

The northeast of the US, including the coastal regions of Rhode Island, have been impacted by hurricanes in the past, most recently Hurricane Sandy in 2012. Climate change is expected to change the strength and frequency of these events, putting more coastal areas at risk [1]. Further, it is estimated that sea level will rise between 0.2 and 2 m by 2100 in the northeast of the US, which also magnifies the impacts of coastal flooding [2]. As coastal flooding is sensitive to changes in bathymetry and topography of a region, coastal erosion can potentially affect the storm surge propagation. Storm surge and coastal erosion interact in two ways: (1) storm surges (and wave forces) lead to coastal erosion; (2) coastal erosion affects the propagation of storm surge and consequently alters the extent of flooding. While it is possible to examine the two-way interaction processes using morphodynamic models (e.g., [3,4]), which incorporate sediment transport and bed level changes, validating morphodynamic models is very challenging, and developing those models is costly. Alternatively, assuming worst case scenarios (complete dune erosion, shoreline retreat at specified rate, etc.) is an alternative method which allows understanding the effect of coastal erosion on flooding for extreme scenarios (e.g., [5]).
Our case study is located in the southern coast of Rhode Island (Figure 1), which consists of several coastal ponds and barriers. The shorelines are retreating at a rapid rate, in some areas up to 1.15 m per year [6]. The coastal dunes are also eroded during major storm events (Figure 2). The failure of dunes can affect the dynamics of the inlet-basin/pond system.
The objective of this study is to investigate the effects of dune erosion and shoreline retreat (together and separately) on storm surge. The study was carried out using numerical modeling, and analysis of the field data.
Section 2 describes several sources of data (observed/hindcast) which have been used in this study; in particular, the hydrodynamic data, which have been collected during 2011, and other relevant storm surge modeling studies in the region are presented. Section 3 explains the simplified methodology which has been used to simulate shoreline retreat and dune erosion. Details of the ADCIRC (ADvanced CIRCulation) model of the study area are provided in Section 4. Several scenarios of coastal erosion and storm surge are discussed in Section 5. Discussions and summary of the results are presented at the end.

2. Data

From July 2010 to September 2011, Woods Hole Group carried out an extensive data collection program [7], for the US Army Corp of Engineers (USACE) New England District, entitled “Wave, Tide and Current Data Collection, Washington County, Rhode Island”. The primary purpose of that work was to collect site-specific data to support a RI Regional Sediment Management Study, and included a collection of water elevation, currents, wave, and meteorological data. Their study included measurement of water elevations inside coastal ponds (Figure 1), as well as waves and currents offshore. This data provided a unique source for understanding the effect of inlet-pond systems on water elevation in this area. Hurricane Irene, which impacted this area during the observation period, was also used for model validation.
For simulation of synthetic storms (i.e., 100-year event), the North Atlantic Coast Comprehensive Study (NACCS; [8,9]) was used. NACCS is based on a system of numerical models including ADCIRC [10], WAve Model (WAM), and STeady state spectral WAVE model (STWAVE) [11]. It has simulated hydrodynamic and wave fields of 1050 synthetic tropical storms as well as 100 extratropical historical storms over the Atlantic Coast. The model was based on a relatively high resolution unstructured mesh (30 m–50 m near the coast). The synthetic storms were generated based on the statistical analysis of past storms. The NACCS provides model results at the save points (Figure 1), including time series of the wind, wave and water levels for the events and return period analyses for the tropical storms. These data were used to force the model at the boundary for a synthetic storm representing a 100-year event. It should be added that some of the save points of the NACCS are located inside the coastal ponds which may be inaccurate, as will be discussed later. For the 100-year event, all synthetic storms simulated in NACCS were examined, and a storm surge event which generated the water levels of around 100-year storm surge at Newport (8452660) and Providence (8454000) National Oceanic and Atmospheric Adminstration (NOAA) water level stations was selected. This storm had a maximum surge of 3.20 m (Mean Sea Level (MSL)) at Newport (Figure 3), which is close to 3.35 m (MSL) or 2.7 m (Mean Higher High Water (MHHW)) for the 100-year event, considering the 100-year event at the upper 95% confidence level.
Since coastal erosion occurs during major storms, several hurricanes were considered in this study. For validation, Hurricane Irene (late August 2011) was selected as observed data was available during this hurricane in several locations inside the model domain. A larger storm event, Hurricane Bob, a strong tropical storm which occurred on 19 August 1991 was chosen. Hurricane Bob provides a good representation of large storms in the area, but it was not large enough to overtop the barriers. Also, two synthetic storms from NACCS including a storm representing the 100-year event (which is important for planning purposes) were simulated.
For the surge model, both bathymetry and topography of the domain (a digital elevation model: DEM) were necessary due to wetting and drying. A DEM with a resolution of 10 m was used based on the National Geography Data Center (NGDC) Bathymetry Data and the USACE 2010 coastal Light imaging, Detection, And Ranging (LiDAR) survey. The LiDAR survey focused on the south coast and extended about 1 km offshore (Figure 4).
Wind data (for forcing the ADCIRC model) were extracted from the USACE Wave Information Study (WIS) hindcasts near the domain. The WIS data covers a period from 1980 to 2012. For this study, the wind fields from large storm events were of interest. It should be mentioned, as the model domain covered just the southern coast of RI, the spatial variability of wind was considered negligible in this small area. For this 30-year period, Hurricane Bob which made land fall in RI on 19 August 1991, was chosen. Hurricane Bob gives a good representation of large storms in the area [9]. It is the fifth largest storm recorded at the NOAA tide gauge at Newport RI, and approximately corresponds to a 20-year event, according to the extremal analysis for the site (Figure 5). The Newport water elevation station is the closest station to the study area (71.33 W, 41.51 N) and has a long record including major hurricanes. The wind field for Hurricane Bob extracted from WIS is plotted in Figure 6.

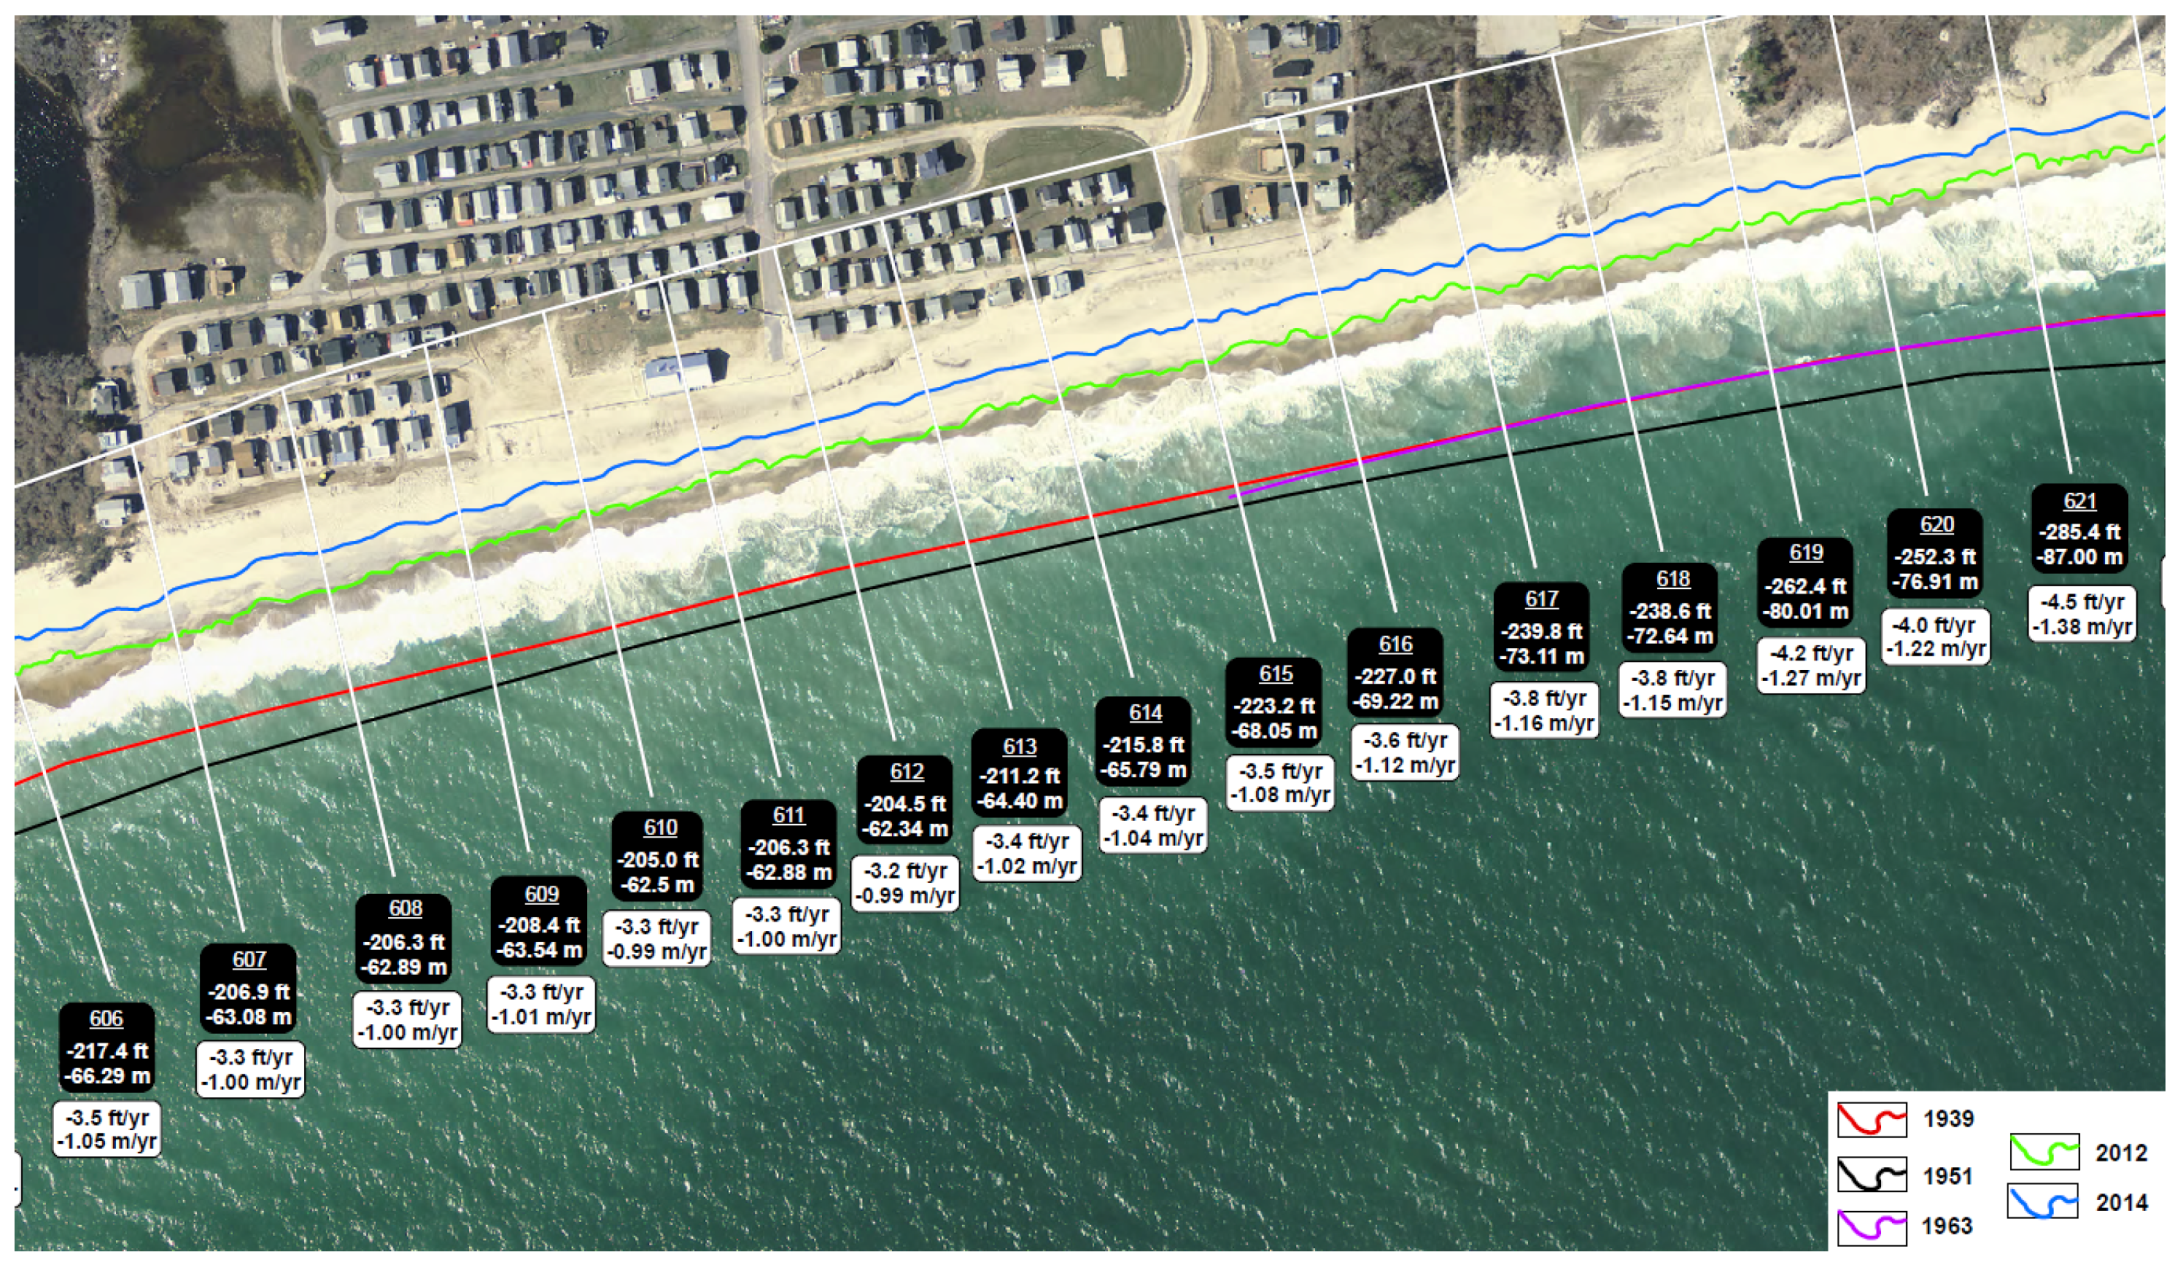
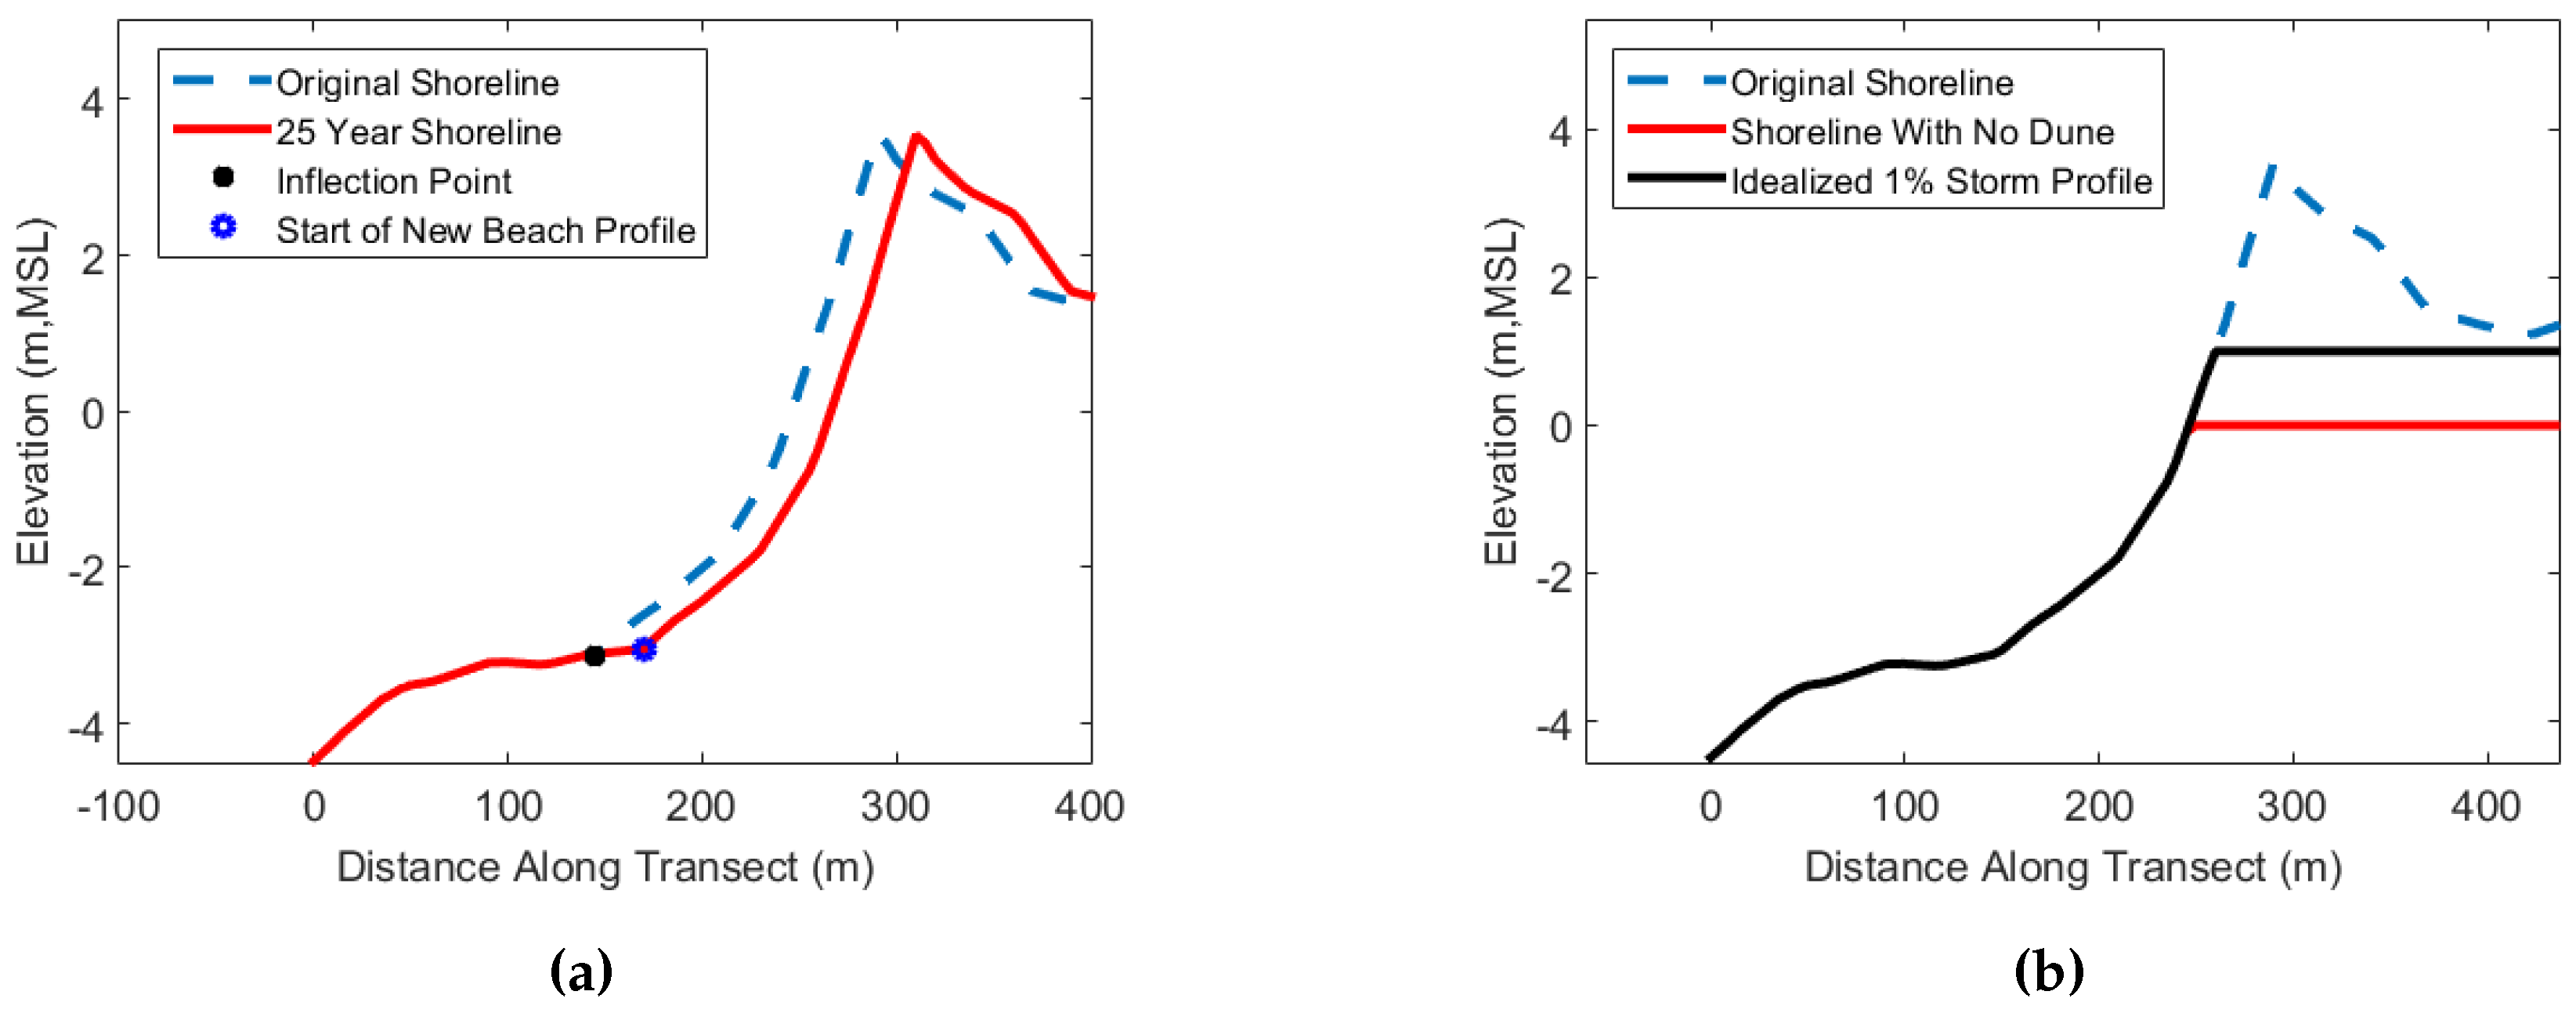
3. Coastal Erosion Scenarios

Coastal erosion scenarios were based on shoreline retreat and dune erosion during large storm events. The past shoreline retreat rates were used to estimate erosion rates for erosion scenarios, and the DEM was changed according to these rates. It should be mentioned that the rate of erosion is expected to rise due to Sea Level Rise (SLR); nevertheless, this assumption was made to simplify the analysis. Further research is necessary to include the effect of SLR on the rate of erosion. The shoreline retreat rates were calculated using aerial photographs from 1939 to 2014 (Figure 7; [6]). It should be added that shorelines retreat in severe storms and recover during fair weather; however, there is a consistent trend of shoreline retreat over past decades in this region.
The projected shoreline retreat over the next 25 years was considered. The shoreline was divided into the cross-shore profiles shown in Figure 8. In the selected area, the beach profiles consist of an offshore beach slope, a near shore beach slope, and a dune system. The offshore beach slope was extended horizontally to the corresponding 25 years erosion (Figure 9). The same near shore profile and dune system was then assumed at the end of each profile. This method retreats the shoreline while keeping the same beach profile geometry. Once the transects were modified, they were linearly interpolated to modify the DEM of the model.
Coastal erosion during large storms can lead to failure of dunes as well as retreat of the shoreline. During storm events, the combined action of storm surge and waves erode the dune and create surge channels and wash-over fans (Figure 2). To implement dune erosion in the DEM, it was assumed that the dunes were eroded or simply cut off at an elevation Mean High Water (MHW) with a horizontal line (Figure 9). The elevation of the post storm profile was determined by examining the washover fans deposited after past hurricanes in this area, including 1938 Hurricane, the Ash Wednesday storm (1962), and Hurricane Sandy. The elevations of the washover fans were estimated using LiDAR; the slope of 0.003 cm/m was measured for washover fans after Hurricane Sandy, which can be assumed horizontal for the model resolution used in this study.

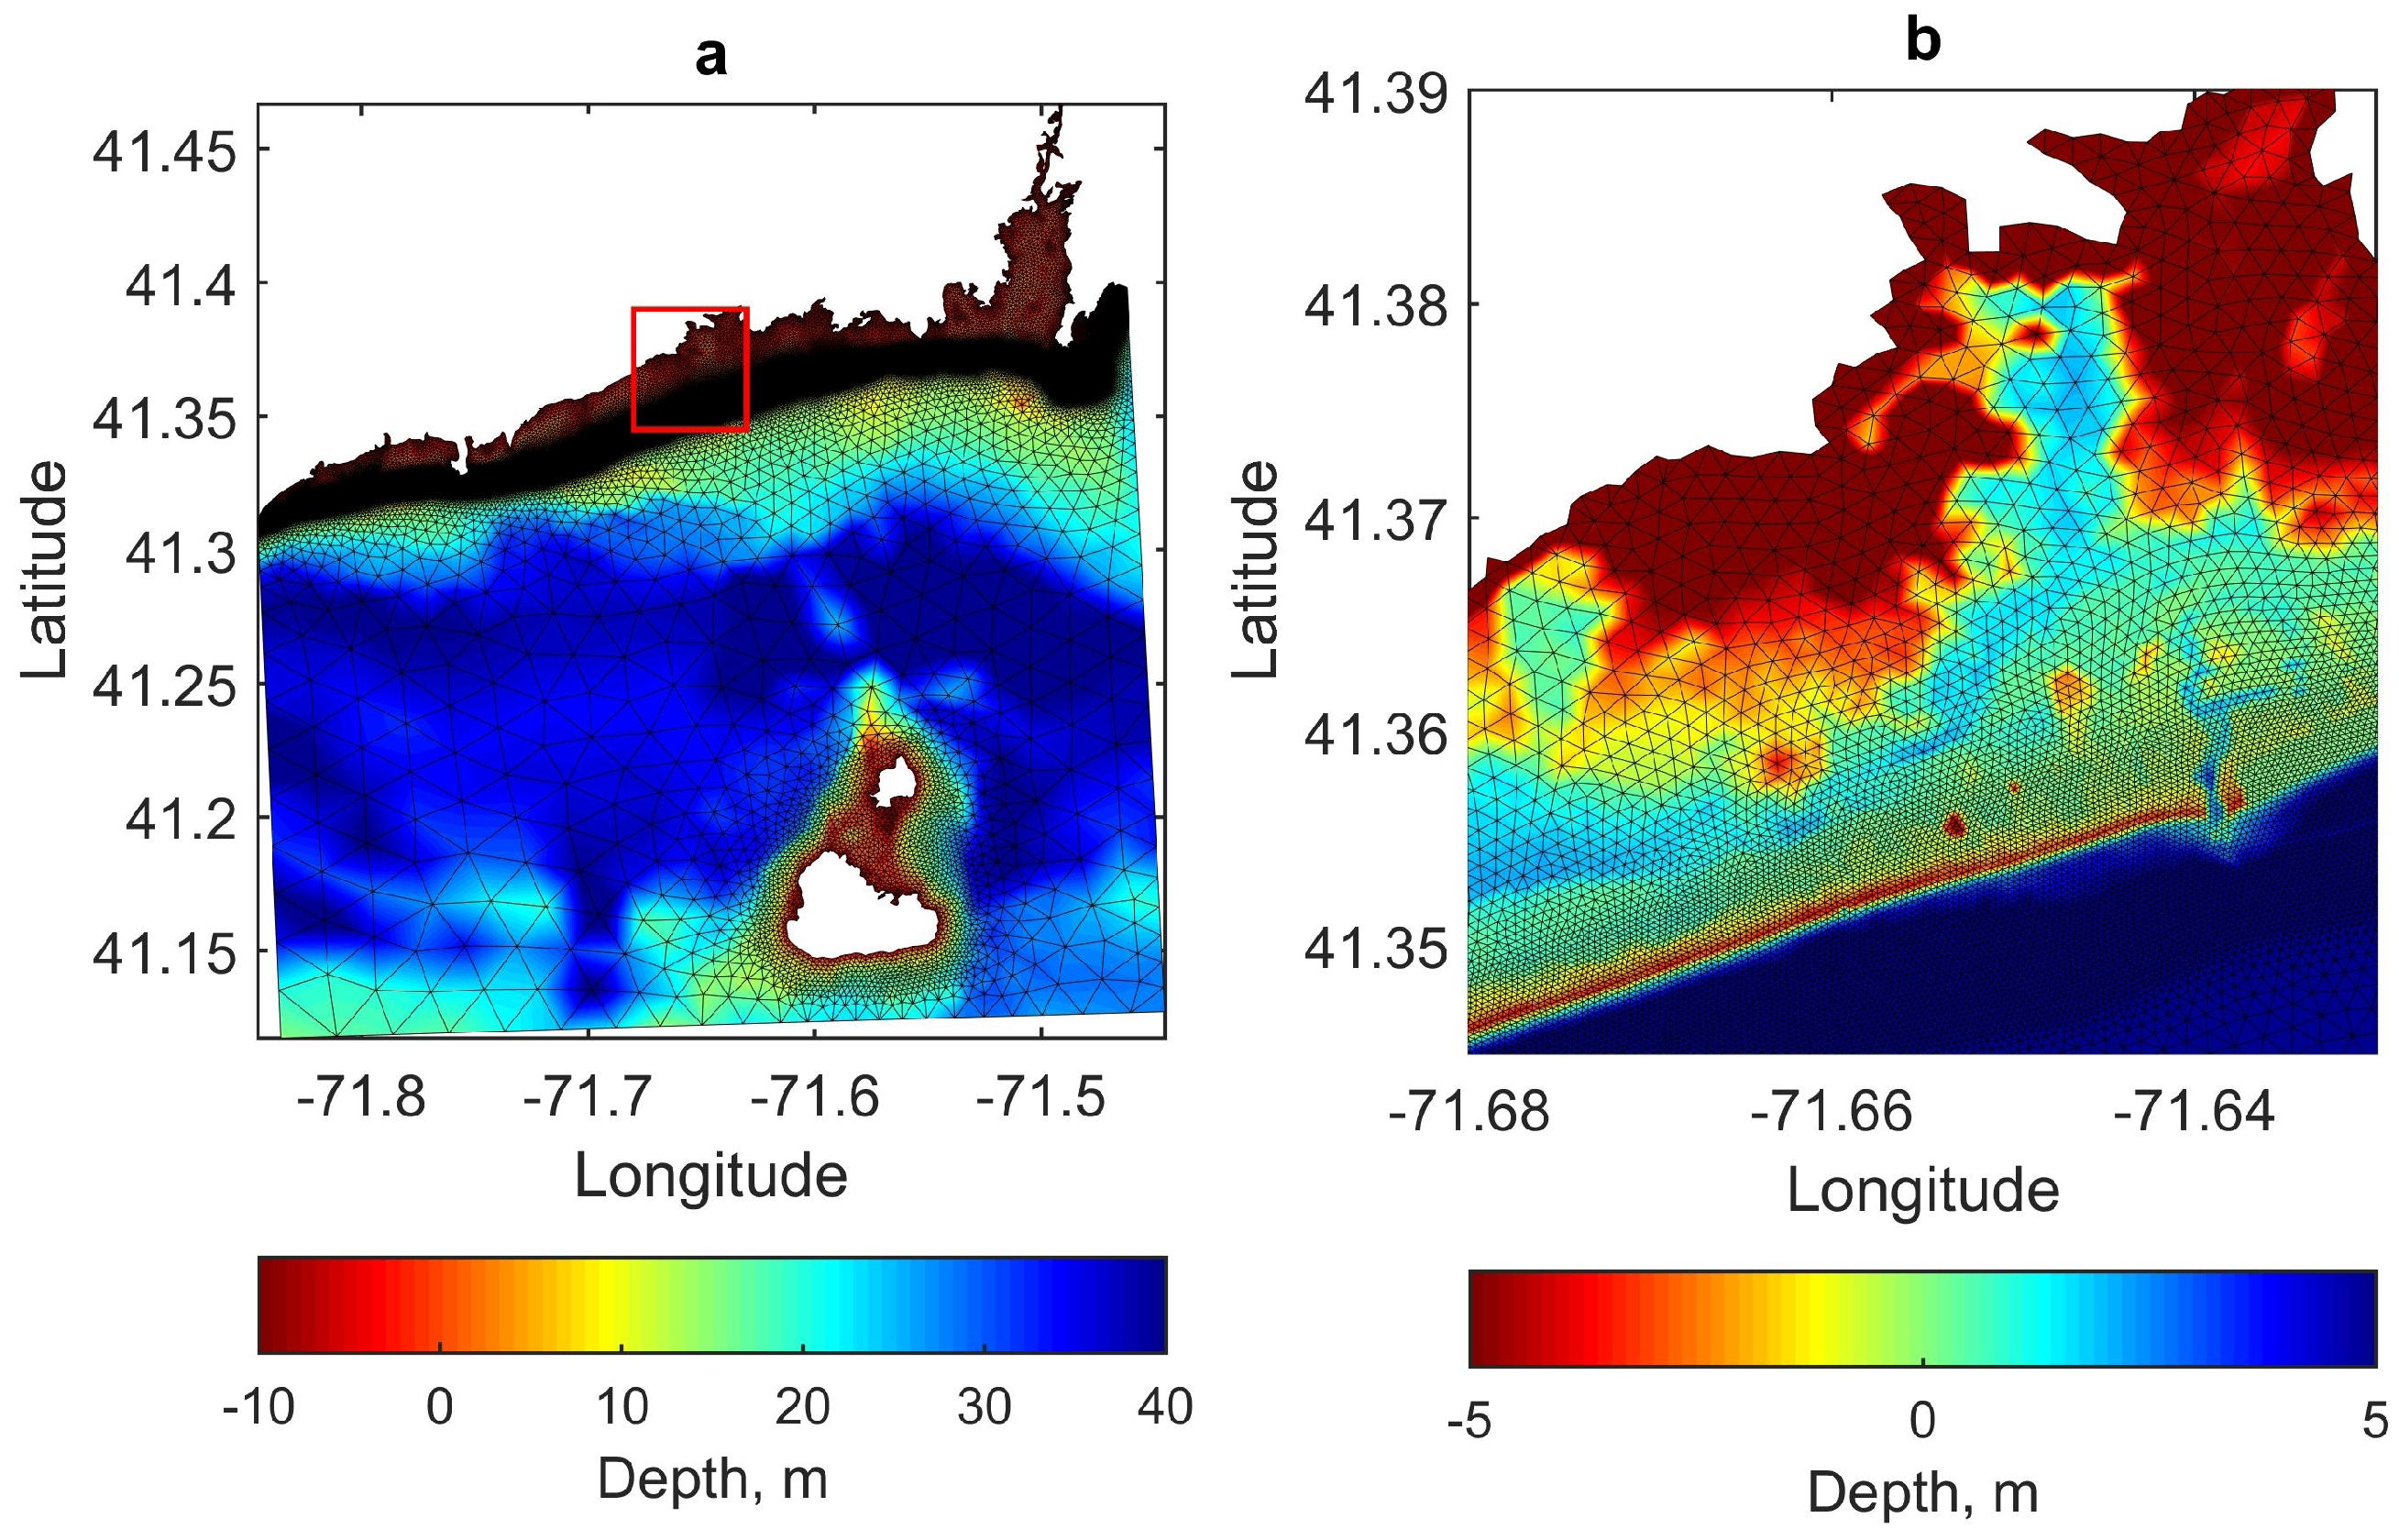
4. Numerical Modeling

For surge modeling, the ADCIRC model was used. ADCIRC is based on the finite element method and unstructured mesh discretization, allowing areas such as coastal inlets to be resolved with a reasonable computational cost. ADCIRC has been coupled with Simulating WAves Nearshore (SWAN), and can simulate the wave-surge interactions [12]. This model has been extensively used to predict storm surge flooding (e.g., [10,13]).
A mesh was created, resolving coastal inlets, using the Surface water Modeling System Software (SMS) with a resolution of 30 m near the coastline, 150 m farther offshore, and 2 km near the open boundaries. The mesh is plotted in Figure 10. The model was forced along the open boundaries by water elevation, and by wind stress/pressure over the domain. The model was run in the 2-D mode, with a Manning friction coefficient of 0.018 (below MSL), and up to 0.06 in land areas. For the tidal case, the model was forced using five harmonic constituents for tides including M2, N2, K1, S2, and O1 which can be extracted from tidal databases [14]. M4 and other overtide constituents were neglected. M4 is generated in shallower regions by friction, and causes tidal asymmetry. Neglecting the M4 component can change the water level by around 6 cm, which can be neglected during a major storm surge event. These constituents represent the main components of tide for this area (Table 1).

5. Results

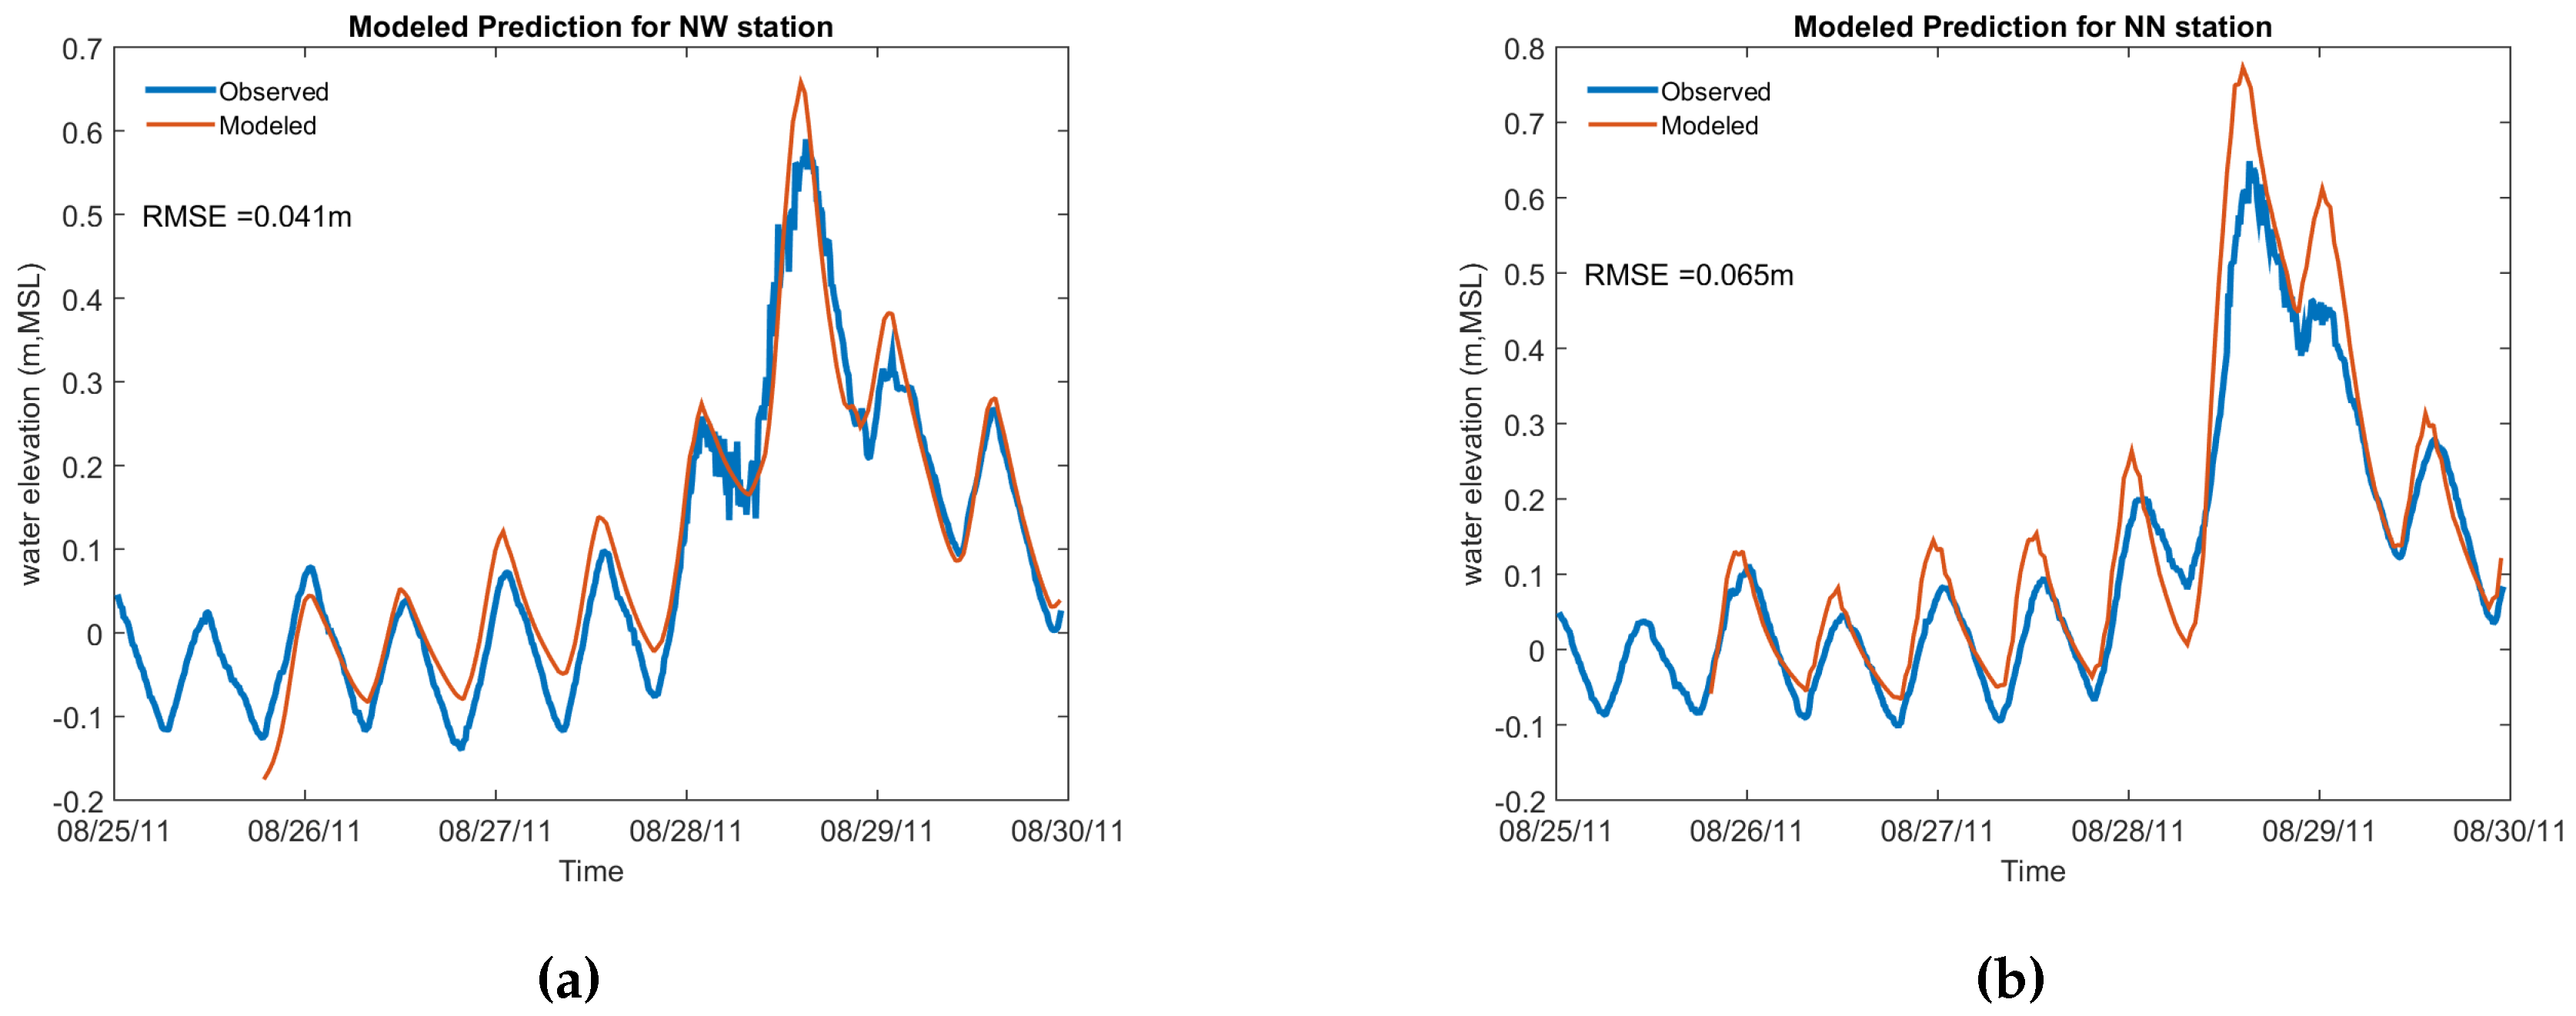
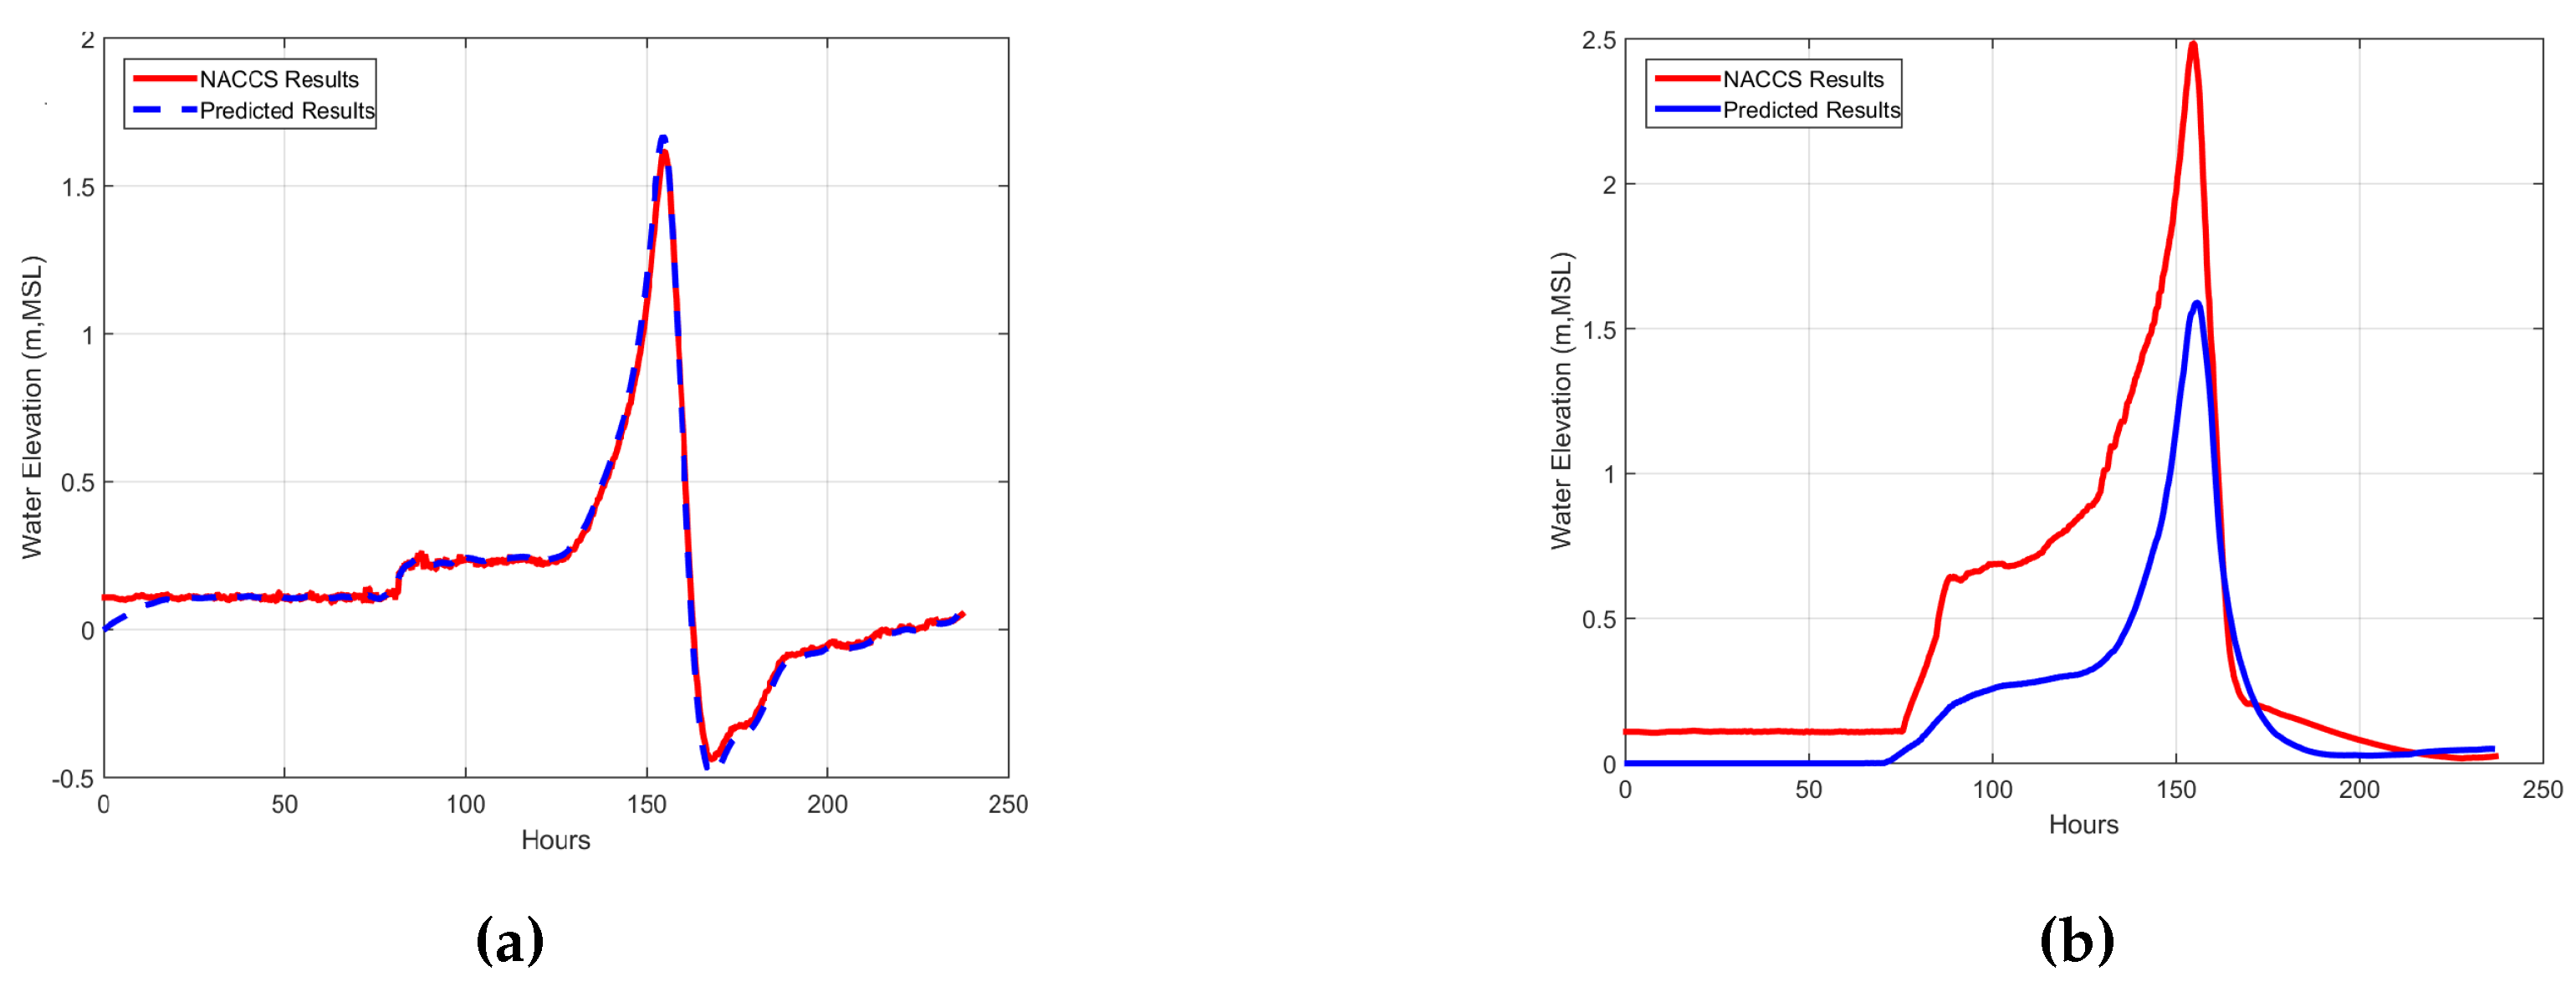
5.1. Model Skill Assessment

To test the performance of the model for tides and storm surge, the Woods Hole Group Inc. data were used [7]. The observed data were compared with the model results during a spring-neap cycle (for tides), and during Hurricane Irene (for storm surge). For tides, the model was run for 30 days from 14 May 2011 until 13 June 2011 with a one day ramping period. This time period is within the duration of the Woods Hole Group data collection campaign. The model and observed water elevation data were analysed by T_Tide code to compute tidal constituents [15]. Table 2 shows the comparison between the modeled results and the observed data at the two stations inside Ninigred Pond. As this table shows, the modeled and observed data, in general, are in good agreement. In particular, the performance of the model for the phase and amplitude of the dominant M2 component is good. The model underpredicts the amplitude of S2, but as this component is very small, its effect is not that significant inside the pond. The overall RMSEs (Root Mean Square Error) for amplitude and phase are 0.015 m and 25 , respectively, which are convincing.
For the storm surge case, Hurricane Irene was simulated, a category 3 storm that occurred in late August 2011. The comparison of the model results and observations are depicted in Figure 11. The performance of the model for both stations is very good with an RMSE of 0.065 m and 0.041 m for NN and NW respectively; however, the model slightly overestimates the surge. Overall, given the magnitude of errors, the performance of the model was considered satisfactory.

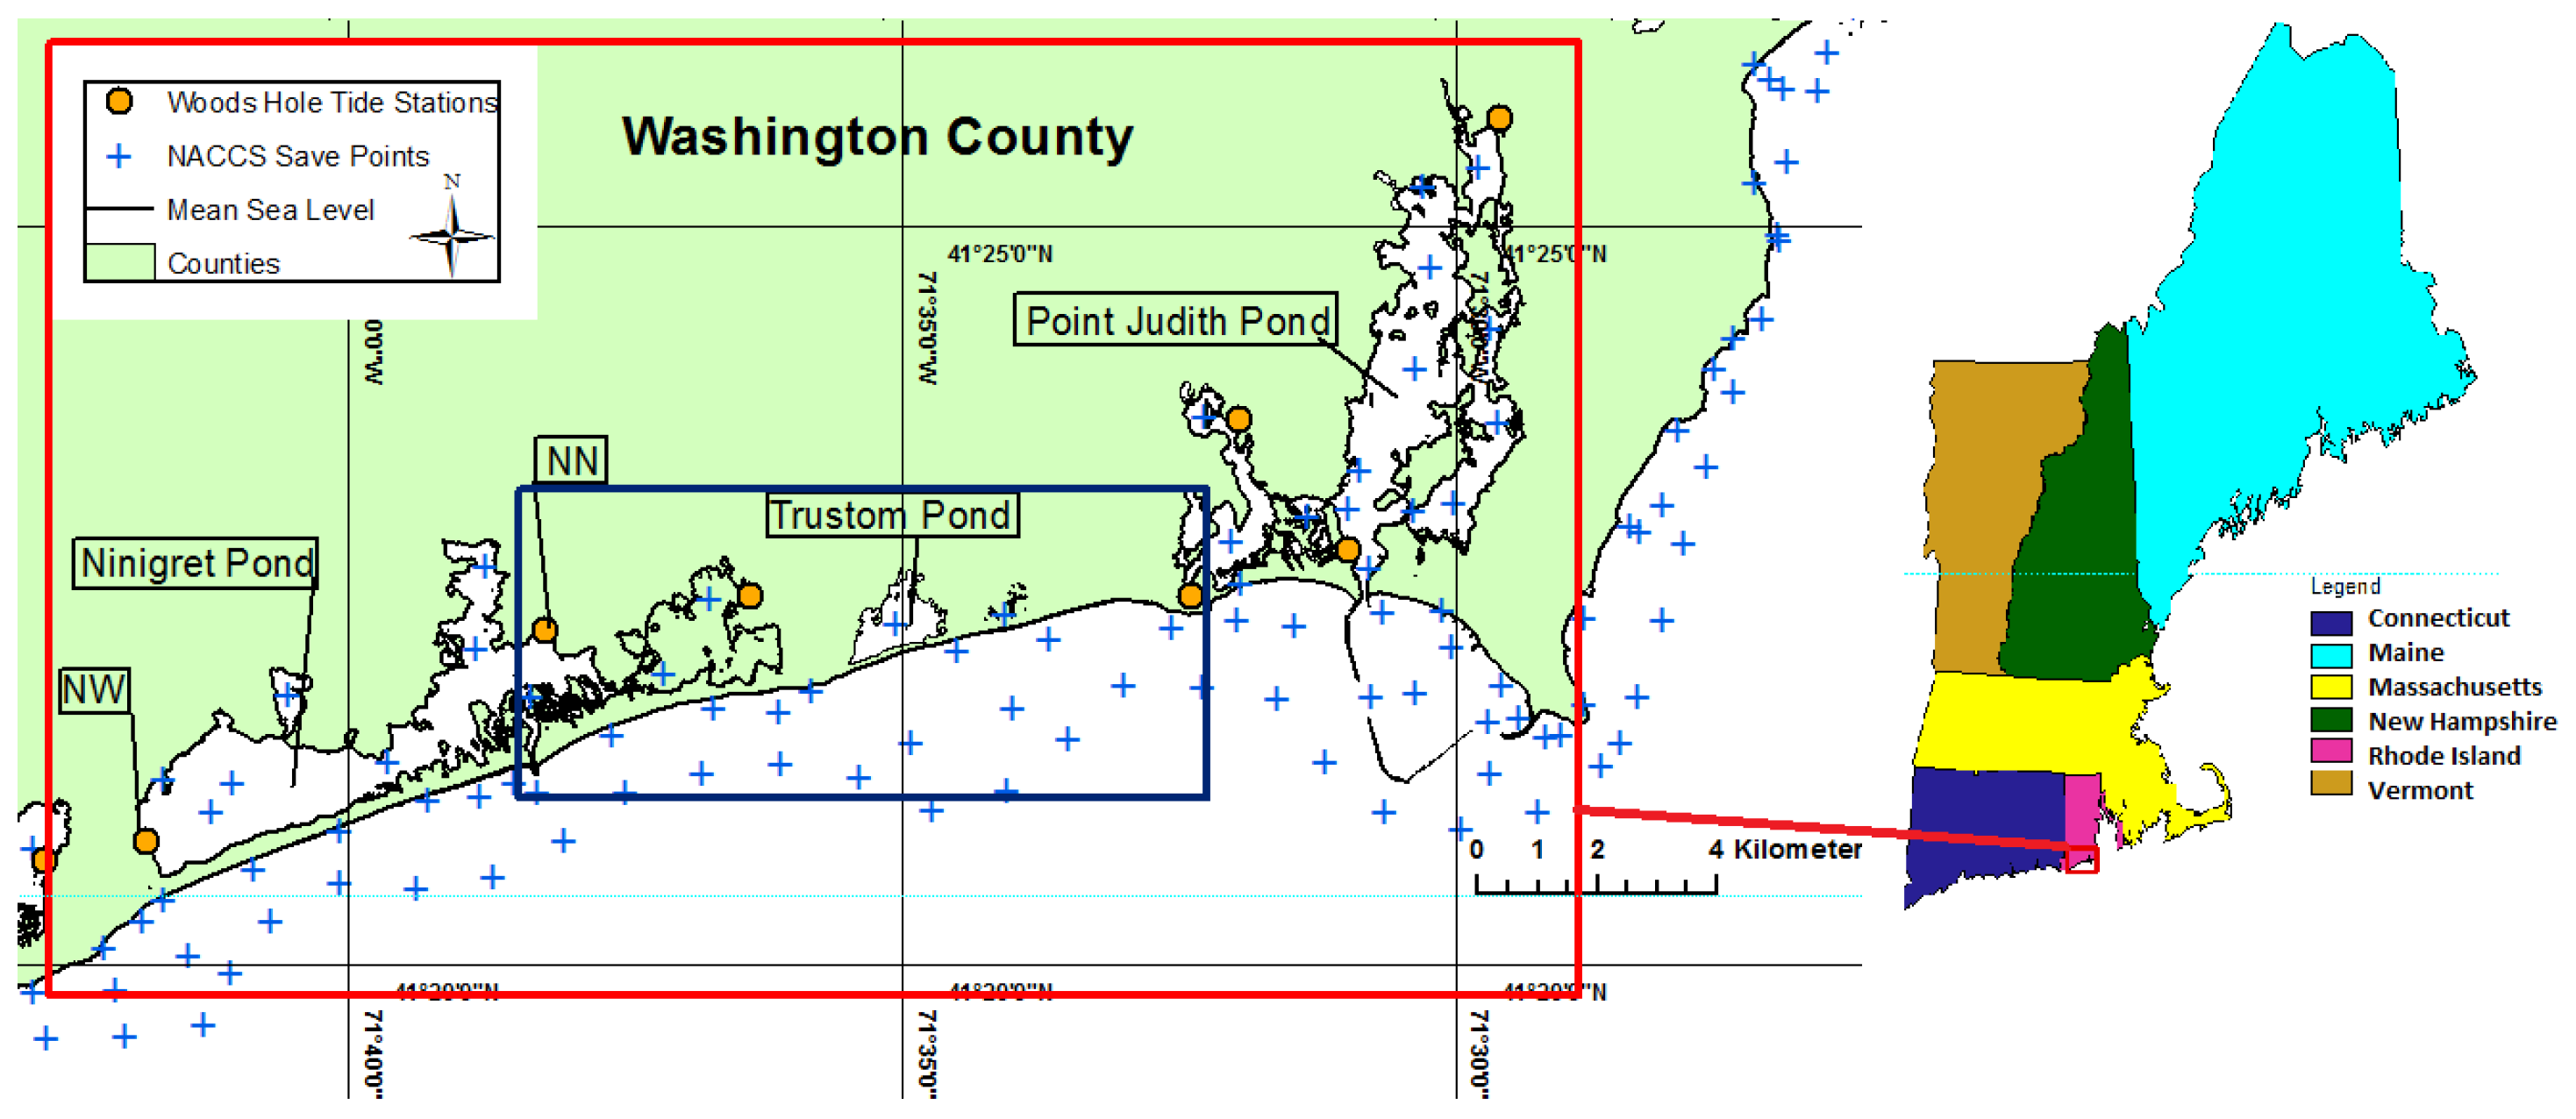
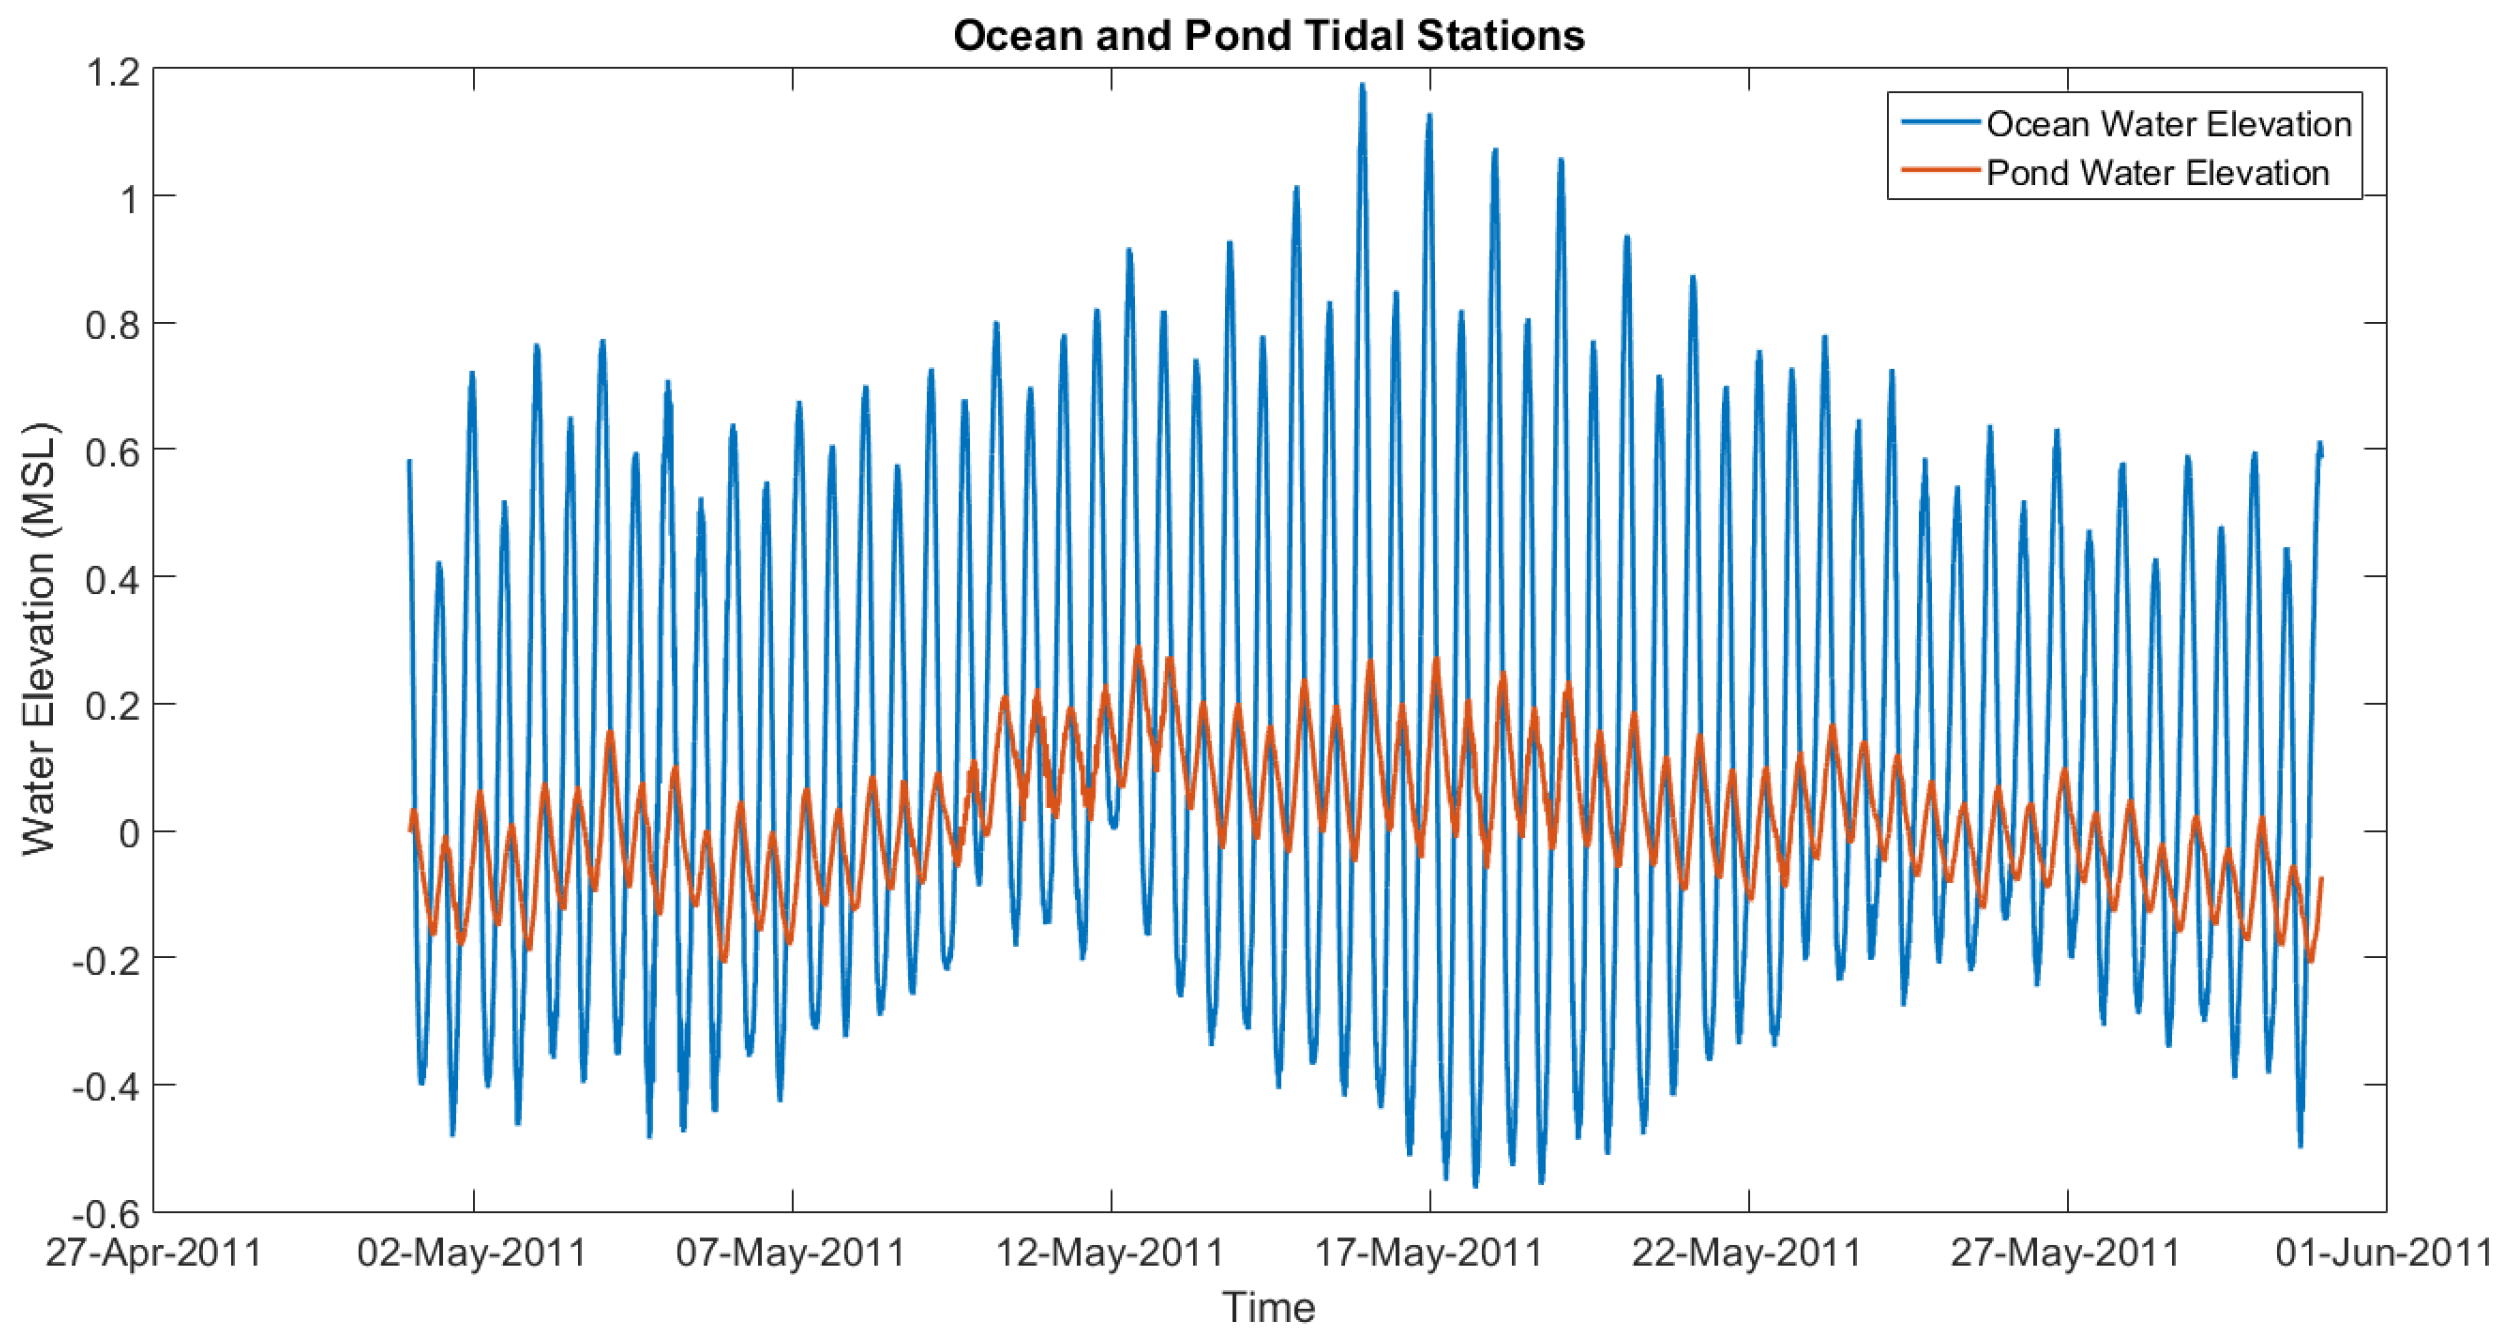
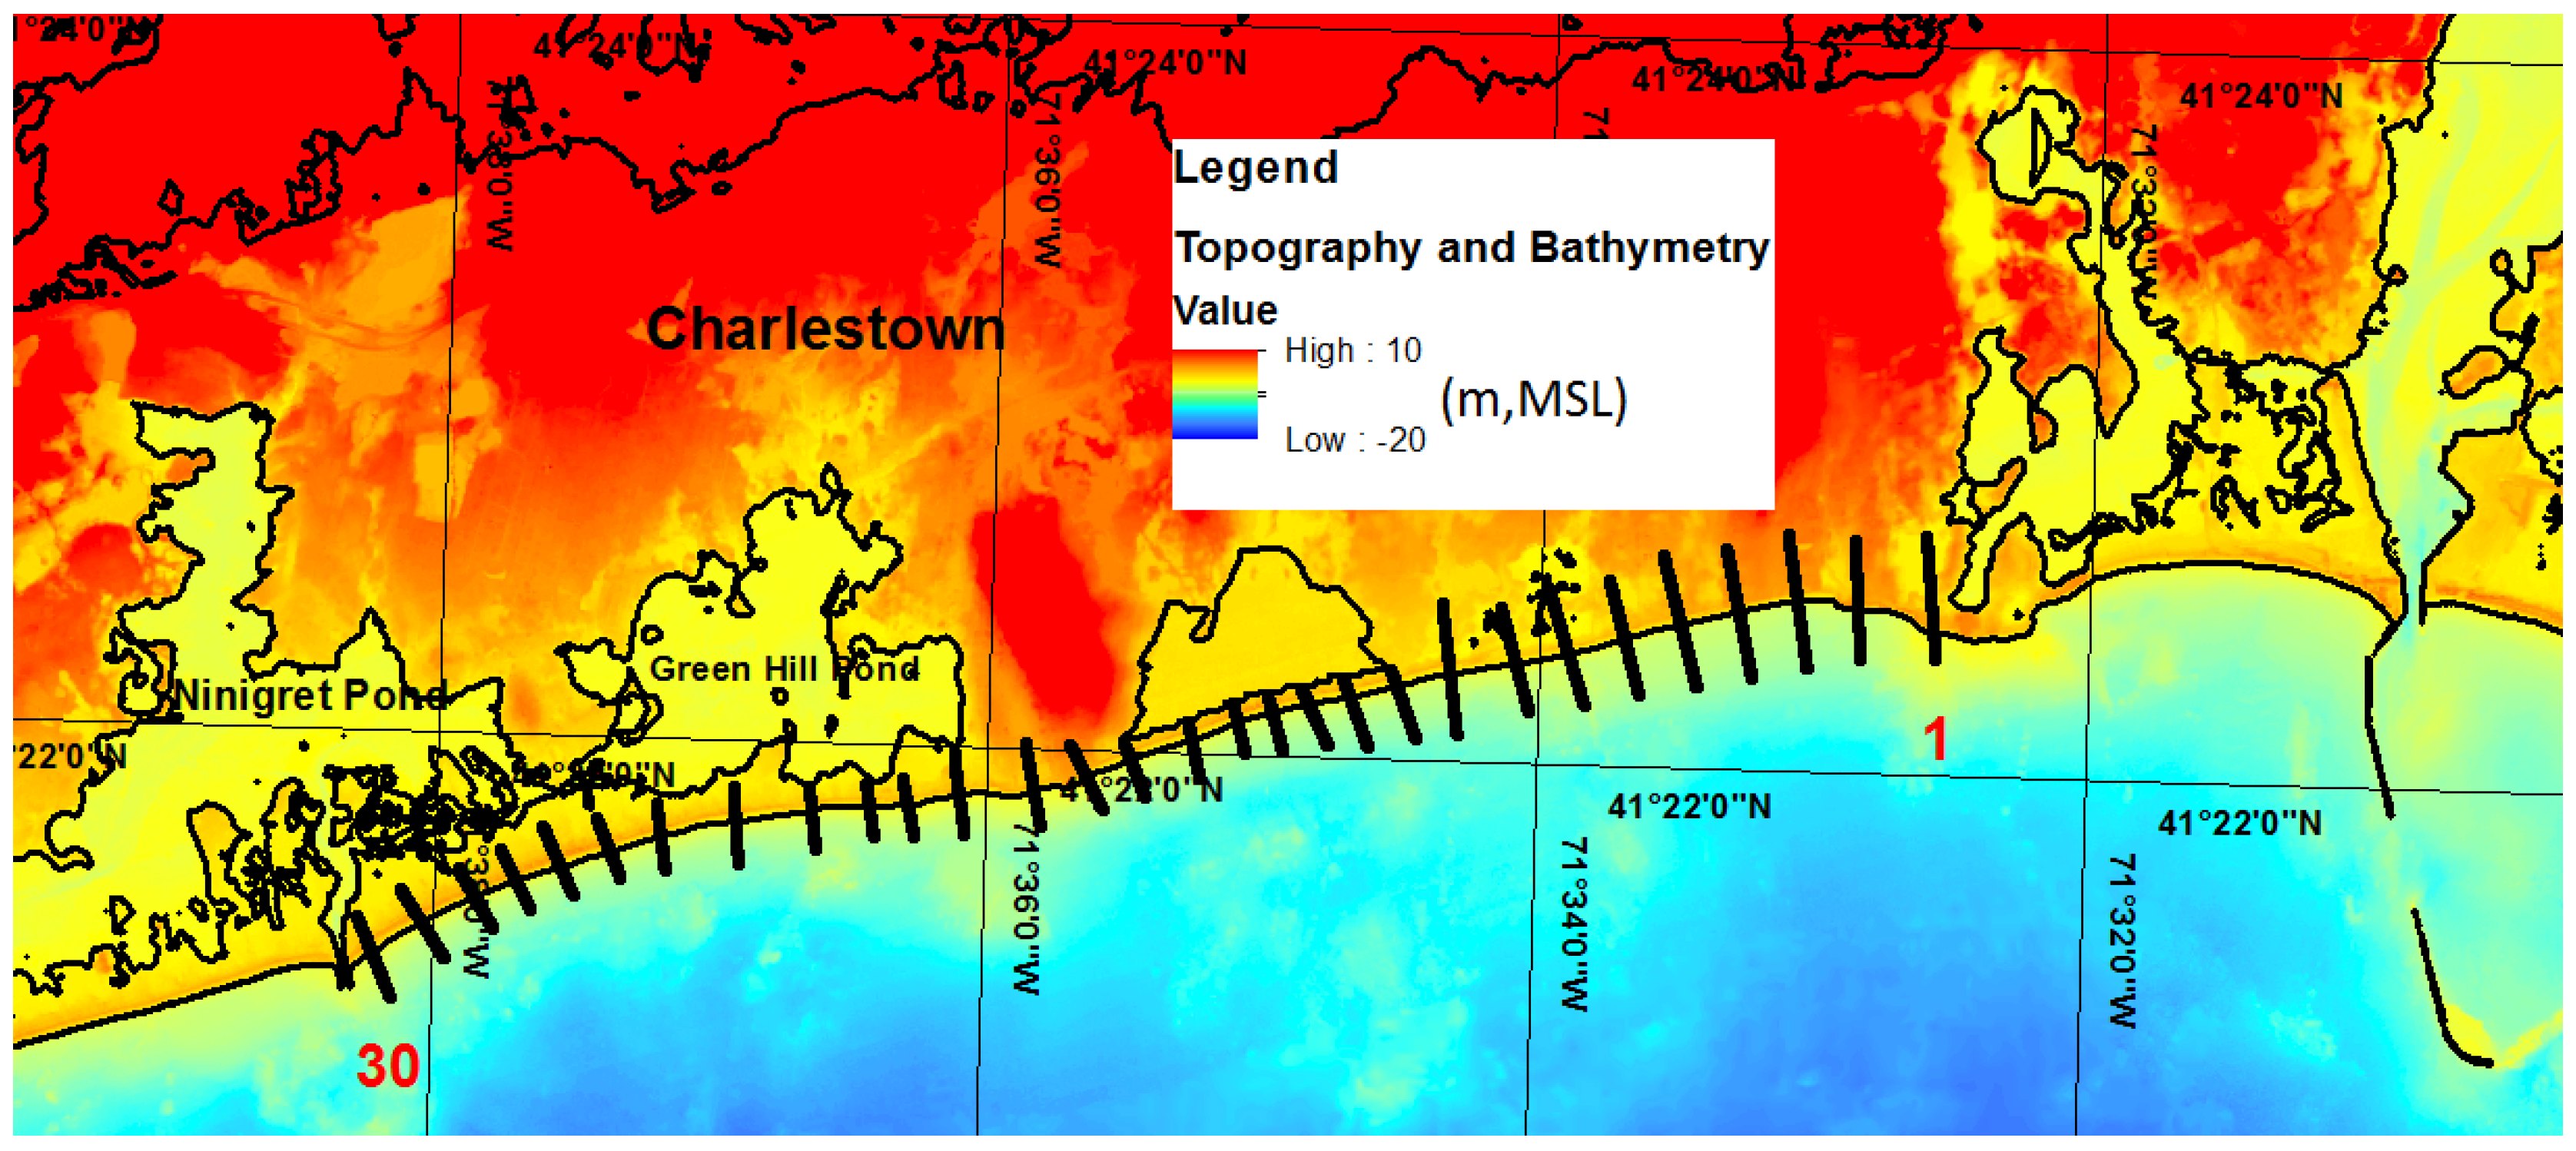
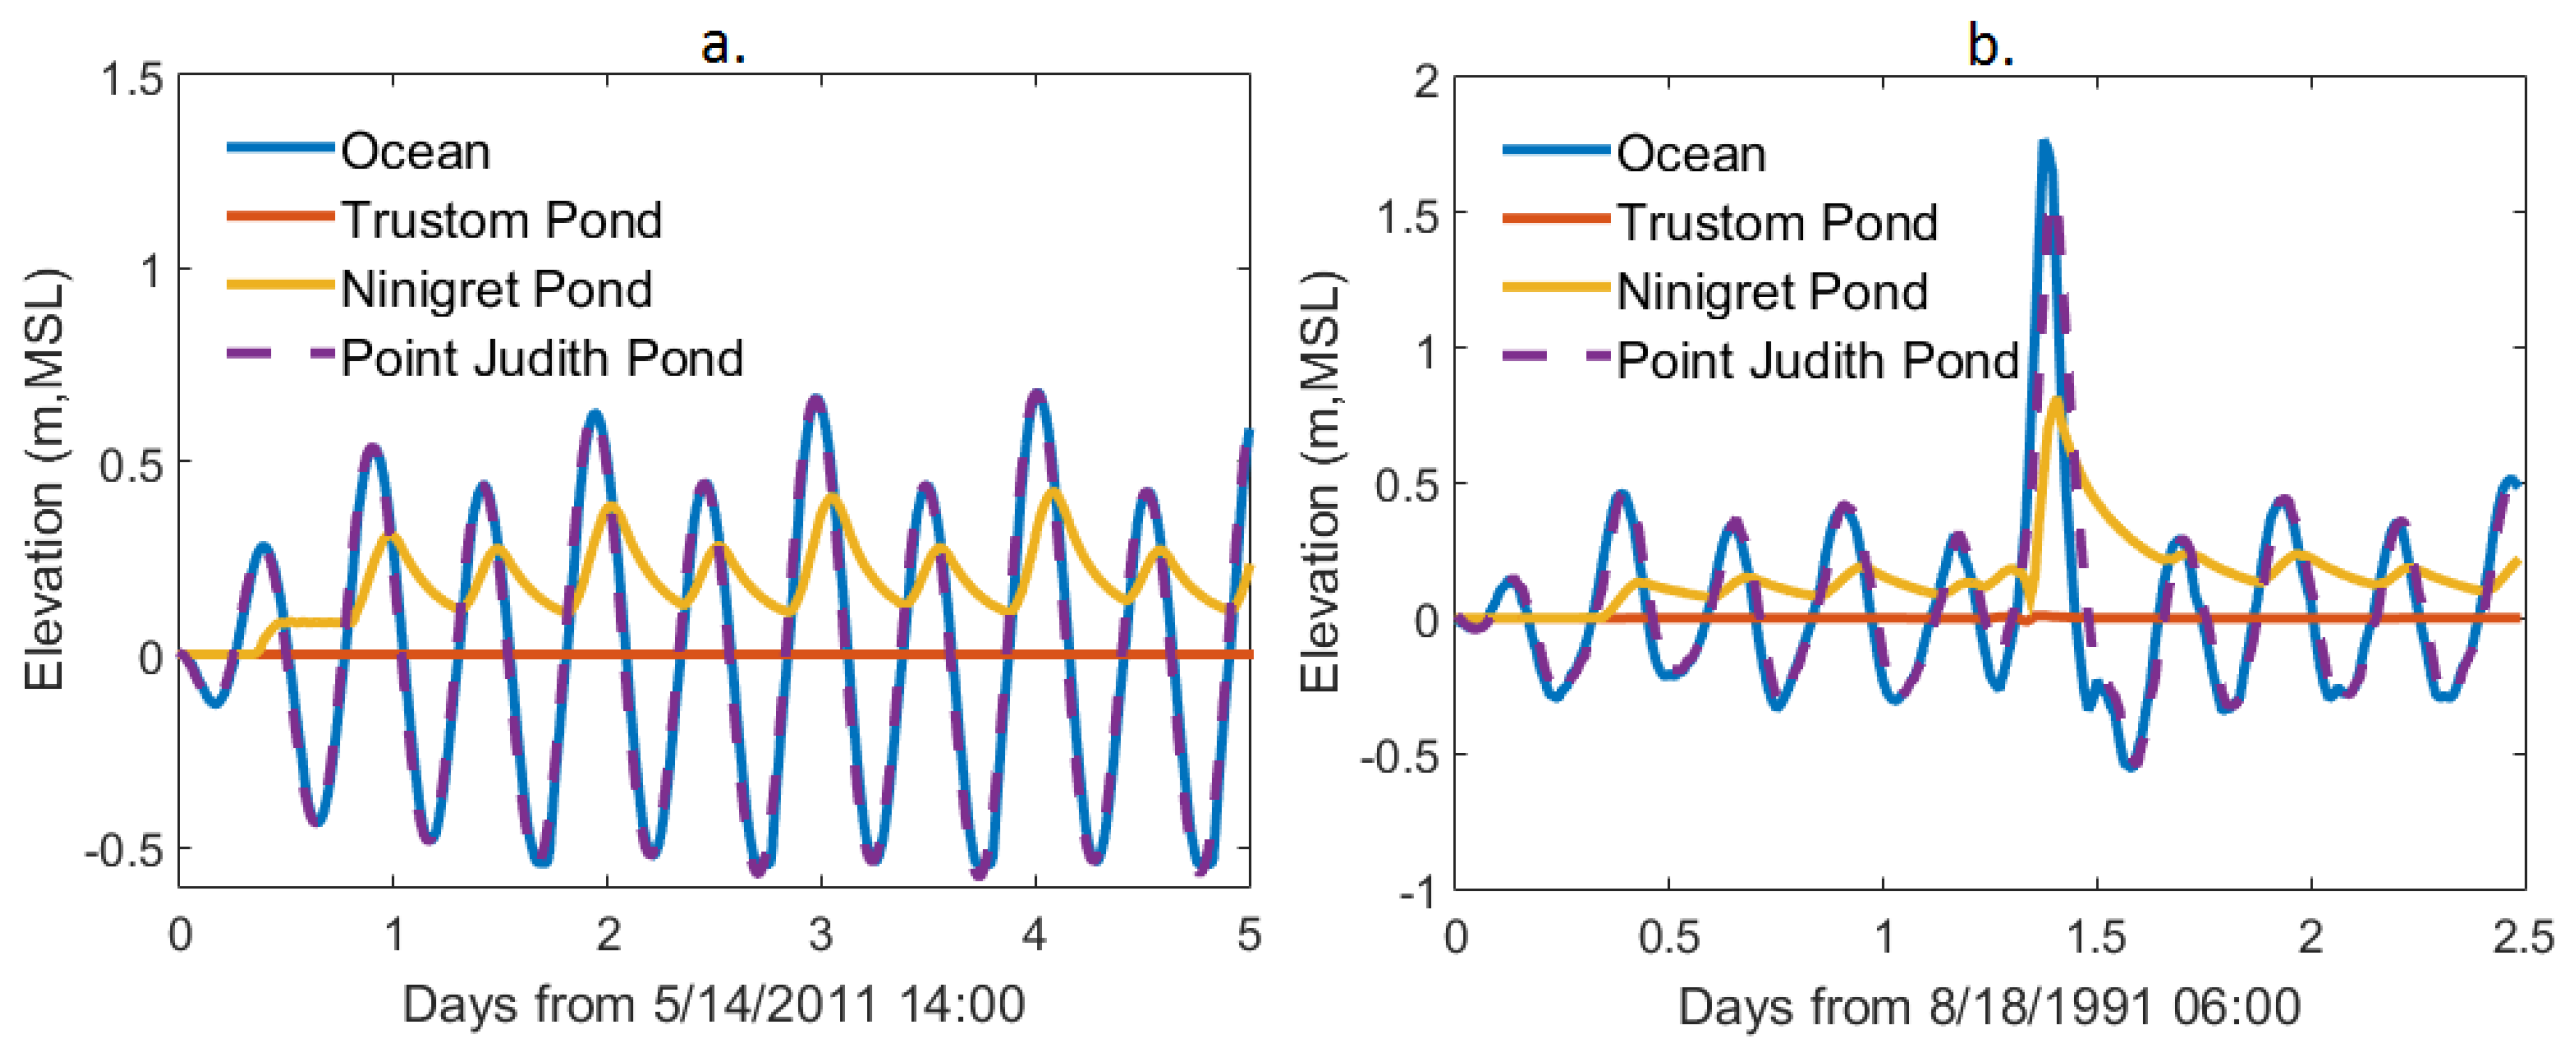
5.2. Propagation of Tides/Storm Surge in Coastal Ponds; Effect of Coastal Inlets

As mentioned previously, the southern coast of RI consists of several coastal ponds and barriers, and the failure of dunes can affect the inlet-basin/pond system. At first, a simplified analysis was carried out based on the previous research about the dynamics of inlet-basins, and the collected data in this area. This analysis helped interpret modeling results. Figure 12 shows the comparison of water elevation inside and outside Ninigret Pond using observed data for a duration of one month. A dramatic reduction of the amplitude can be observed in this figure. A coastal inlet, in general, causes a reduction of water elevation amplitude and a phase-lag or a delay inside coastal ponds relative to offshore. This is mainly associated with the energy dissipation by high velocity currents in an inlet. Simplified analytical methods have been introduced in the literature to compute the reduction of the amplitude, and the phase lag, based on the geometry and physical characteristics of the inlet-basin system. A detailed analytical analysis of inlet-basin hydrodynamics can be found in the Coastal Engineering Manual [16]. Considering a long wave (e.g., tide or surge), with an amplitude of a o , and a period of T, the effect of a coastal inlet on tide/surge signal as it propagates from the ocean to the pond can be written as,
[ R , ϕ l ] = f ( A i / A b , R h , L , T , F ) ; R = 1 a i / a o
where R is the reduction in the amplitude, a i is the amplitude inside the basin/pond, ϕ l is the phase lag, A i is the cross sectional area of the inlet, A b is the area of a basin or a pond, R h is the hydraulic radius of the inlet, L is the length of the inlet, and F represents the frictional coefficients for the entrance, exit and channel friction losses. For Ninigret Pond, A b = 7.5 km 2 , A i = 45 m 2 , L = 1.7 km, R h = 1.5 m. Using these parameters, and assuming entrance, and exit loss coefficients of 0.1 and 1.0, respectively (recommended by the Coastal Engineering Manual [16]), leads to R = 80 % and ϕ l = 90 . The impact of inlets on tidal signal was also assessed using observed data. By performing a tidal analysis using T_Tide [15] inside (Wood Holes Group Station) and outside this pond (NOAA, Weekapaug Point 71.76 W, 41.33 N), R for the M2 tidal component was found to be 76% for the NW station (Figure 1), with phase lags of 90.5 or about 3 h and 6 min. These values which are based on the observations are very close to the analytical method predictions (i.e., R = 80 % and ϕ l = 90 ). Considering that some storm surge events have similar (or longer) periods, if coastal barriers for this pond fail, this reduction of the amplitude no longer exist. Consequently, dune erosion can lead to a significant increase in the flooding area.
Further, the geometry of a coastal inlet has a controlling effect on the reduction of the amplitude of water elevation signal. Considering the three coastal ponds in this area (Figure 1; Ninigret Pond, Trustom Pond, and Point Judith Pond), the effect of coastal inlet geometry can be further examined. Point Judith Pond has a wide and deep inlet with a width of 80 m and a depth of around 7 m. Trustom Pond, on the contrary, has no permanent connection to the ocean for tides, but during large storm events, part of its barrier is overtopped or breached (for example in Hurricane Sandy) causing some flooding. Ninigret Pond has a relatively narrow inlet (35 m), protected by hard structures. The water elevations in the three ponds are plotted for a tidal cycle, and for a storm event (Hurricane Bob) in Figure 13 using the ADCIRC model. As this figure shows, the water elevation signal for tide inside and outside of the Point Judith Pond is almost the same due to its wide inlet, but the peak of storm surge slightly attenuates during the storm event. For Trustom Pond, the barrier is not overtopped for tides or the storm surge scenario. Ninigret Pond shows a significant reduction for tides ( R = 80 % ) and for Hurricane Bob ( R = 68 % ) due to its narrower inlet. Therefore, if a storm surge does not overtop or erode coastal dunes, coastal inlets can significantly decrease the magnitude of a storm surge (inside a coastal pond).
The above analysis shows a significant dampening of tide and surge signal caused by coastal inlets. However, the frequency/period of a water elevation signal and the geometry of an inlet are the two important factors which control this dampening [17,18,19]. Figure 14 shows the reduction of amplitudes of various water elevation signals assuming different periods for Ninigret Pond. The analysis was performed using the simplified analytical method mentioned earlier [16]. As this figure shows, frequencies of 1, 2, and 2.5 days lead to 0.65, 0.38, and 0.25 reductions, respectively. Therefore, a storm surge which has a long period (more than 2 days) will be less effected compared to a tidal signal with a period of 12 h. It should be added that the total water level during a storm surge is due to the combination of tide and surge signals. In addition, the geometry of an inlet, as discussed above, is another important factor, which should be always considered before generalizing these results.

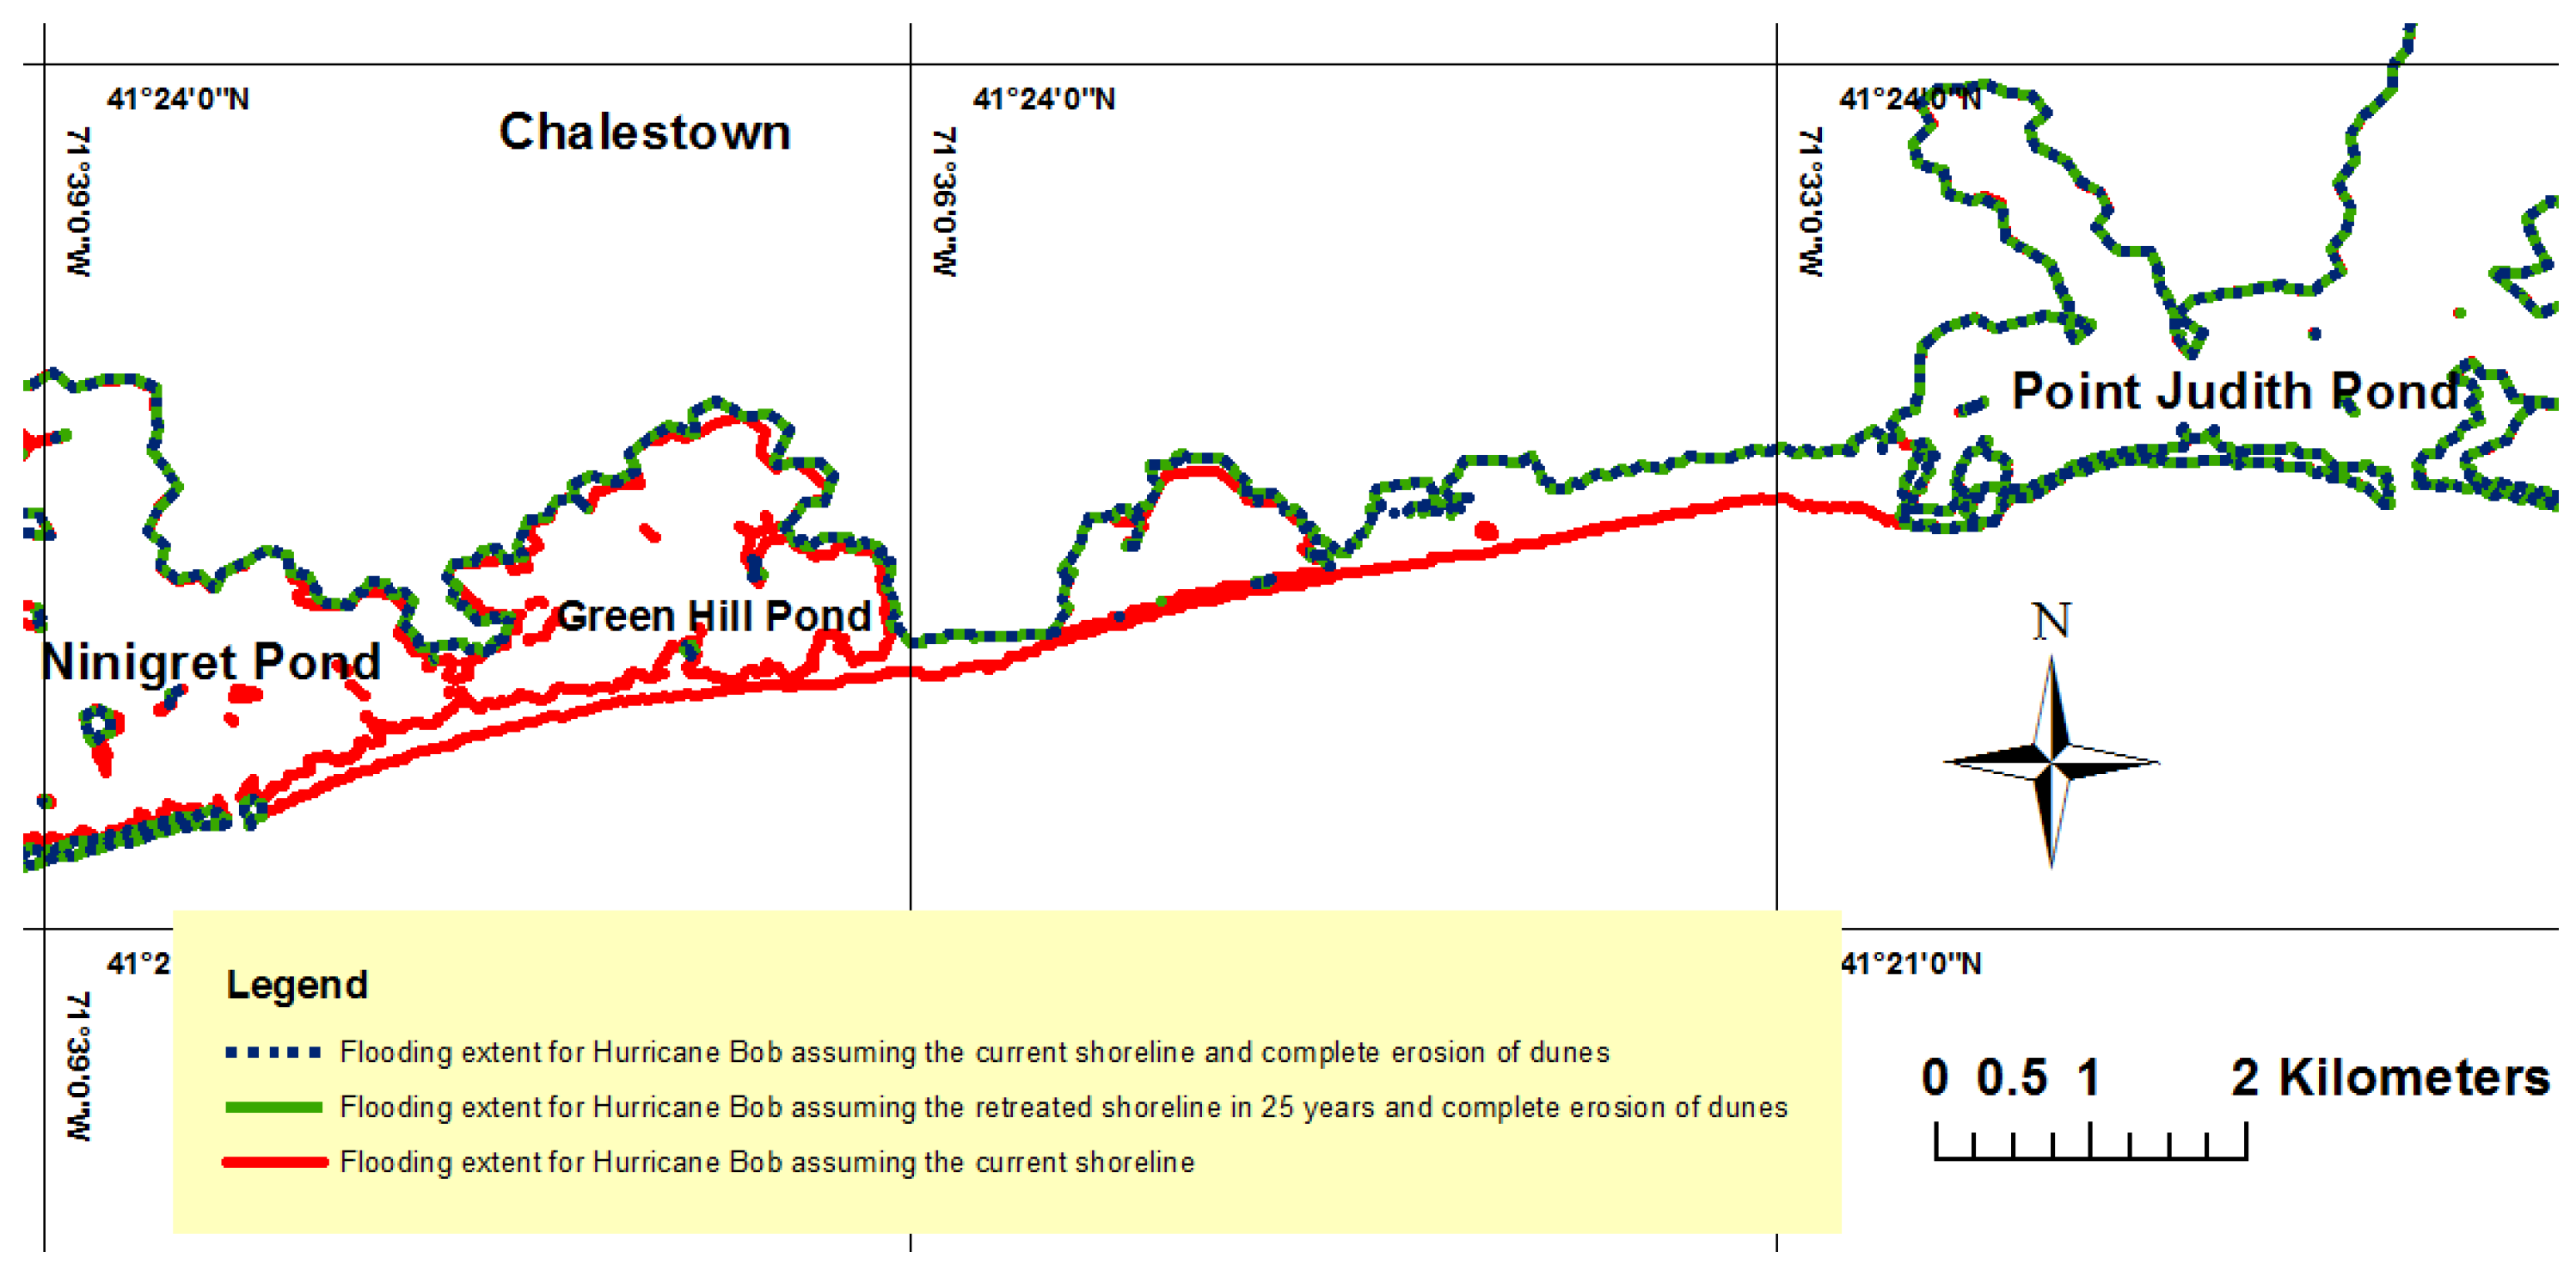
5.3. Effect of Erosion on Storm Surge

Two erosion scenarios were considered: shoreline change in 25 years, and dune erosion. As mentioned, the erosion of dunes is a common consequence of large hurricanes in the study area as can be seen in Figure 2, which shows the partial failure of the dune system of Ninigret Pond during Hurricane Carol in 1954. Several scenarios considering the two storm cases (100-year synthetic storm and Hurricane Bob) were considered.
For Hurricane Bob, the flooding areas assuming eroded (retreated) shoreline and the current shoreline were examined. Table 3 shows the summary of results. Considering a retreated shoreline in 25 years, the flooding extent slightly increases by 0.22 km 2 , which is 20% of the original flooded area (1.12 km 2 ). This increased flooding area is approximately the advance of the sea (about 30 m) due to coastal erosion; therefore, the shoreline retreat does not significantly increase the extent of flooding. However, when the dunes are eroded, the flooding extent increased by 2.33 km 2 , which is a 207% increase. When dunes erode, the coastal inlets of the ponds can no longer dampen the surge signal, and therefore a much larger area within coastal ponds are flooded. For this scenario, the flooding extent advanced up to 500 m in some areas. Figure 15 shows the flooding extent for existing dunes, and eroded dune profile scenarios.
For the 100-year event, the erosion scenarios (shoreline retreat and dune erosion) did not lead to a significant change in flooded areas as shown in Figure 16. This is because for this event, the storm surge is large enough to overtop the dunes (the dune top elevation is about 3 m, MSL in this area); therefore, even if the dunes were solid structures and could resist the erosion during storm surge, they could not protect the coastal ponds. It should be noted that the failure of dunes may significantly affect wave propagation for the 100-year event (waves can break over dunes, due to decreased water depth).
SLR, in general, leads to an increase of the flooding extent [20]. A very simple way of investigating the impact of SLR on flooding is the bathtub approach or adding the magnitude of SLR to elevations predicted by a storm surge model; this methods neglects the nonlinearity of the storm surge propagation. A more accurate method includes changing the DEM, and simulating the storm surge assuming a SLR scenario. Consistent to our analysis which assumed a 25 years shoreline retreat, 30 cm or 1 foot SLR was assumed, corresponding to projected values by NOAA (High) for 25 years [21]. Figure 17 shows that the extent of flooding, as expected, increases in some areas. The flooding area increased from 4.72 km 2 to 6.80 km 2 , leading to a 44% increase.

6. Discussion

The geometry of coastal inlets controls the storm propagation for moderate storms in areas with inlet-basin systems. Some regional modeling studies such as NACCS have not resolved these inlets, and their predictions inside coastal ponds may not be reliable beyond barriers and inside ponds. Figure 18 is an example showing the poor resolution of the NACCS mesh around Ninigret Pond inlet. In Figure 19, the prediction of storm surge for a moderate synthetic storm (220, which has a peak elevation of 1.67 m, MSL in Newport [8]), near two save points (see Figure 18b) located inside and outside Ninigret Pond, has been compared with that from our model. The surge event was channeled through the inlet, but given the poor resolution of the NACCS model, water levels are overestimated. It should be noted that NACCS results, unlike the ADCIRC model developed in this study, have not been validated inside coastal ponds and very near shore in RI. Also, waves for this storm are not that significant inside the pond; therefore, wave-surge interaction cannot be associated with higher storm prediction in the NACCS model. The results are identical at the boundary (Point A), as the ADCIRC model was forced by NACCS at the open boundary.
The dunes along the entire southern coast of RI have an average height of 3.39 m above MSL, but in some areas they are as low as 1.1 m. This means that a storm with a magnitude of 100-year (3.35 m, (MSL) considering the 100-year event at the upper confidence level curve) can potentially overtop all of the dunes. A hurricane such as Carol, which had a surge height of 2.7 m, MSL at Newport RI can breach the dunes (Figure 2), and have a similar but lesser effect on flooding (increasing the flooding extent). Various factors are associated with the erosion of dunes [22], including the geotechnical properties of dunes, the elevation of dunes compared to surge, wave-induced forces, and wave runup/overtopping. Therefore, it is a challenging task to specify a threshold for a storm which leads to dune failure. Morphological modeling (e.g., [4]) along with data collection during and after large storms around coastal dunes can improve our understanding of this process for this area, for future studies.
The analysis carried out in this study was based on two extreme scenarios: complete dune erosion, and no dune erosion. In reality, dunes are partially eroded during major storms (Figure 2), and gradually recover during calmer months. Therefore, a storm cluster can lead to more damage compared with isolated events. The effect of erosion on storm surge is overestimated by assuming complete erosion of dunes. However, the results show the significant impact of dune erosion on flooding, and quantify this impact for this extreme scenario.

7. Conclusions

We explored the effect of dune erosion and shoreline retreat on coastal flooding in an area which consists of coastal ponds protected by dunes and connected to the ocean by narrow inlets. A storm surge model was developed/validated with a unique dataset, which included water elevation data inside coastal ponds during 2011 and measurements during Hurricane Irene. The conclusions are summarized as follows:
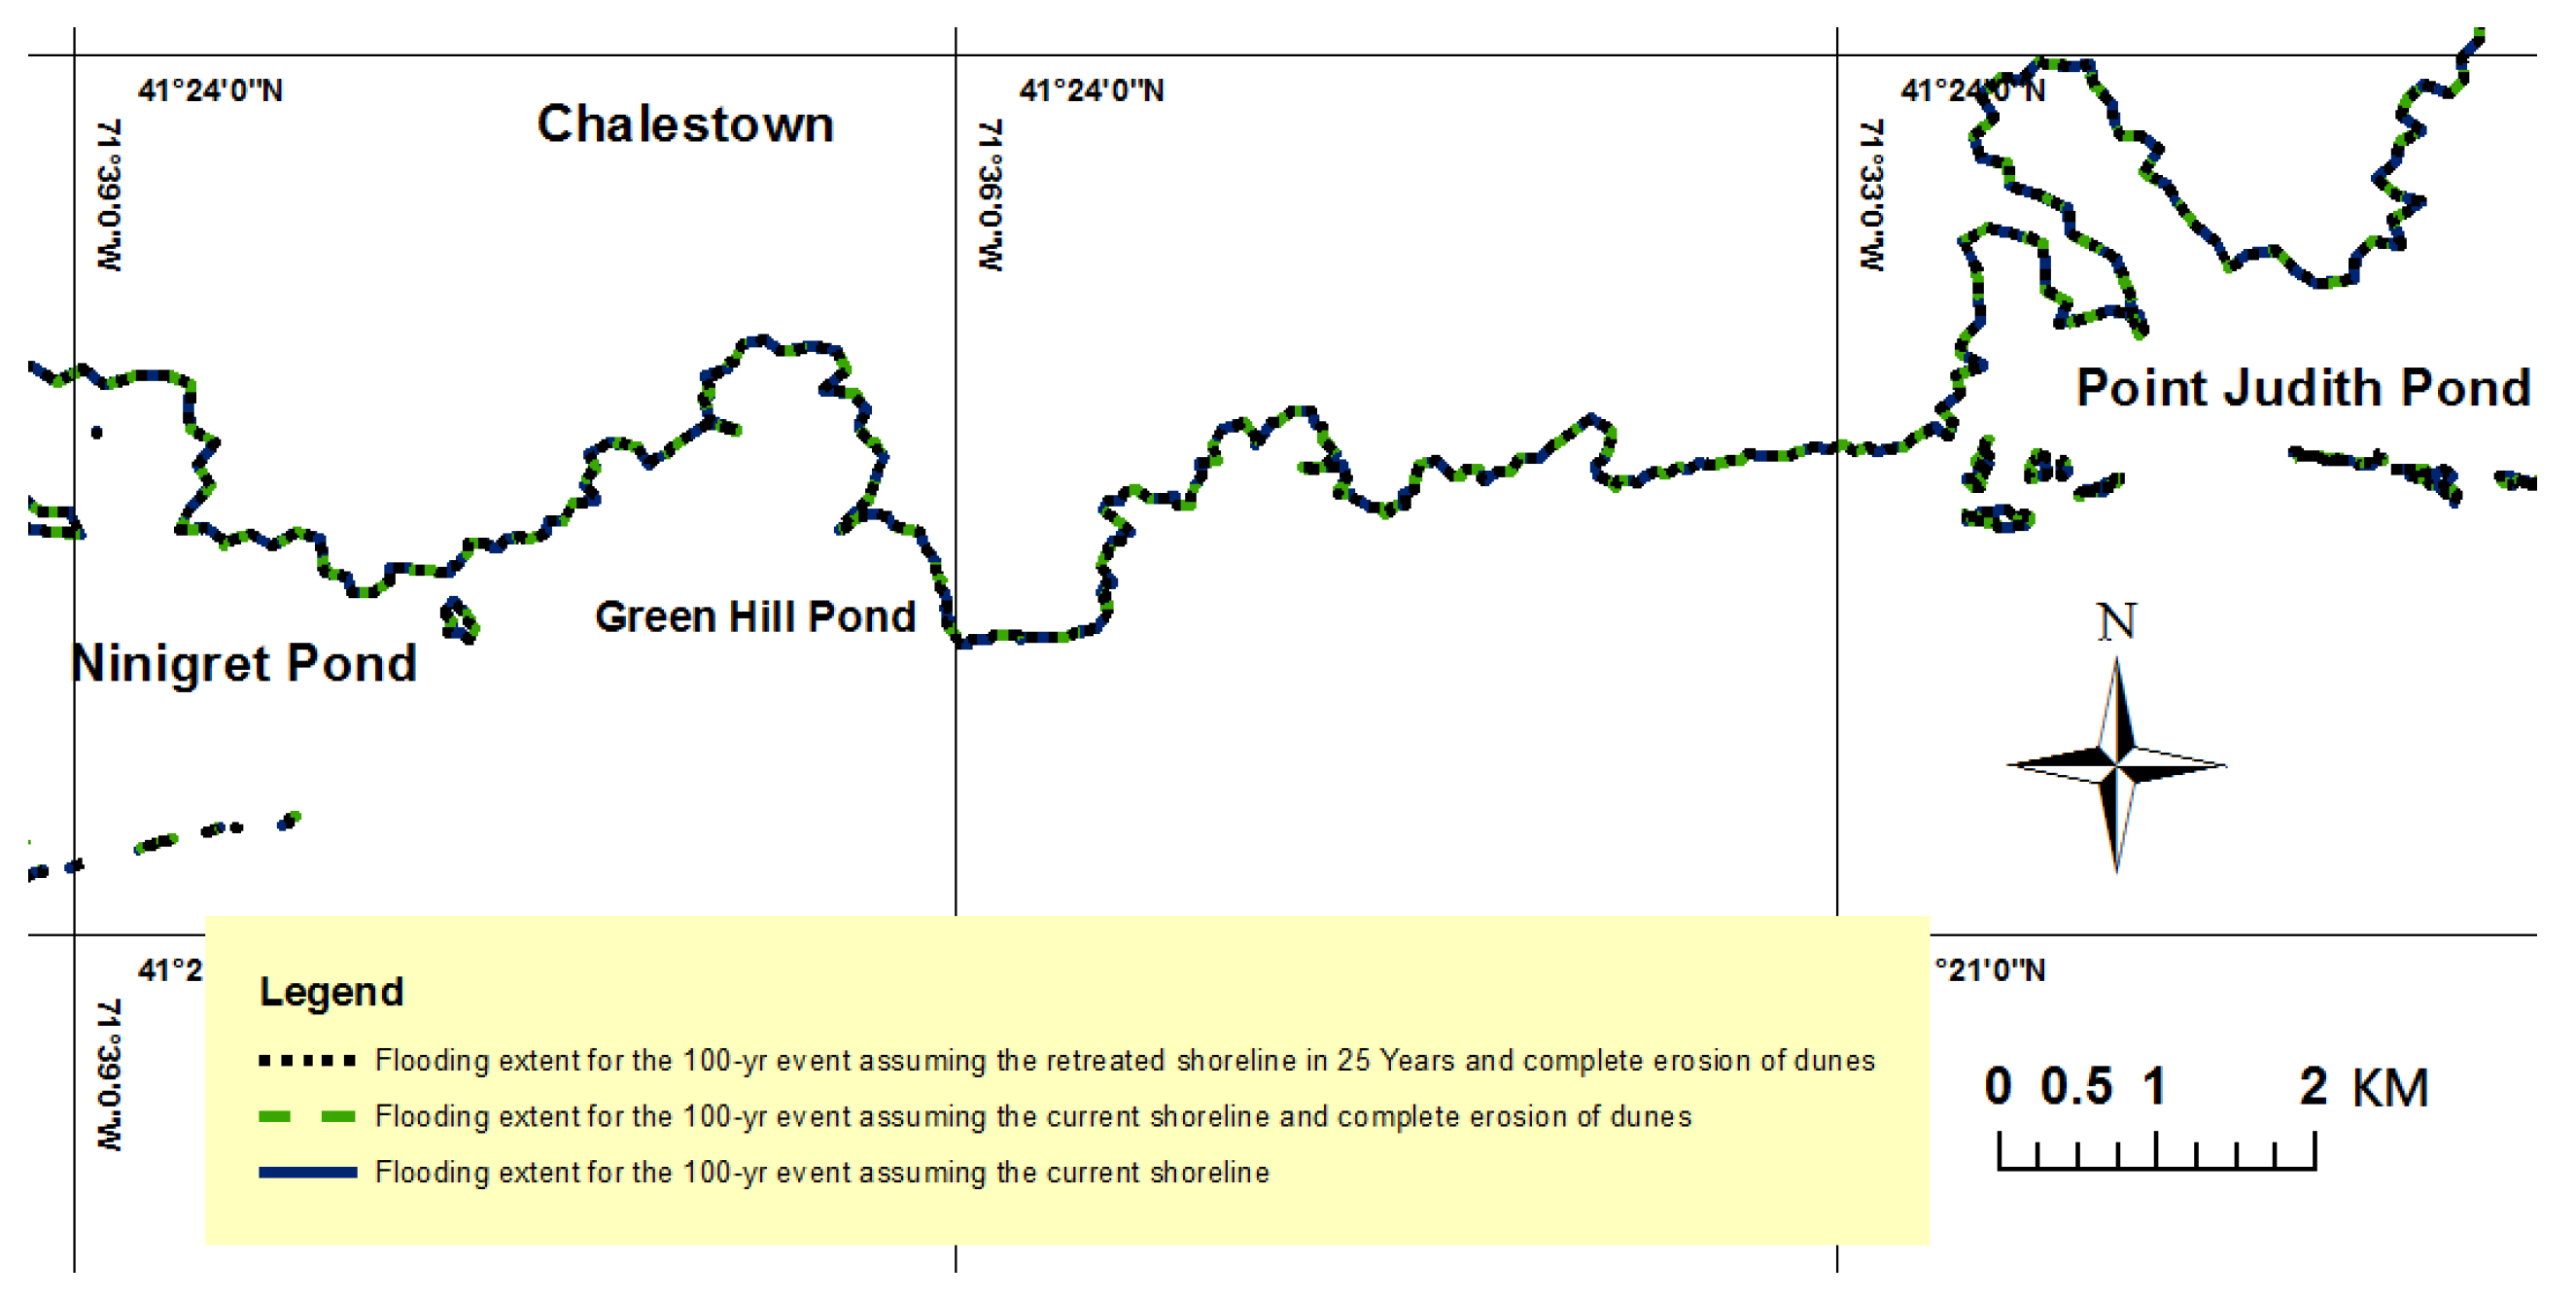
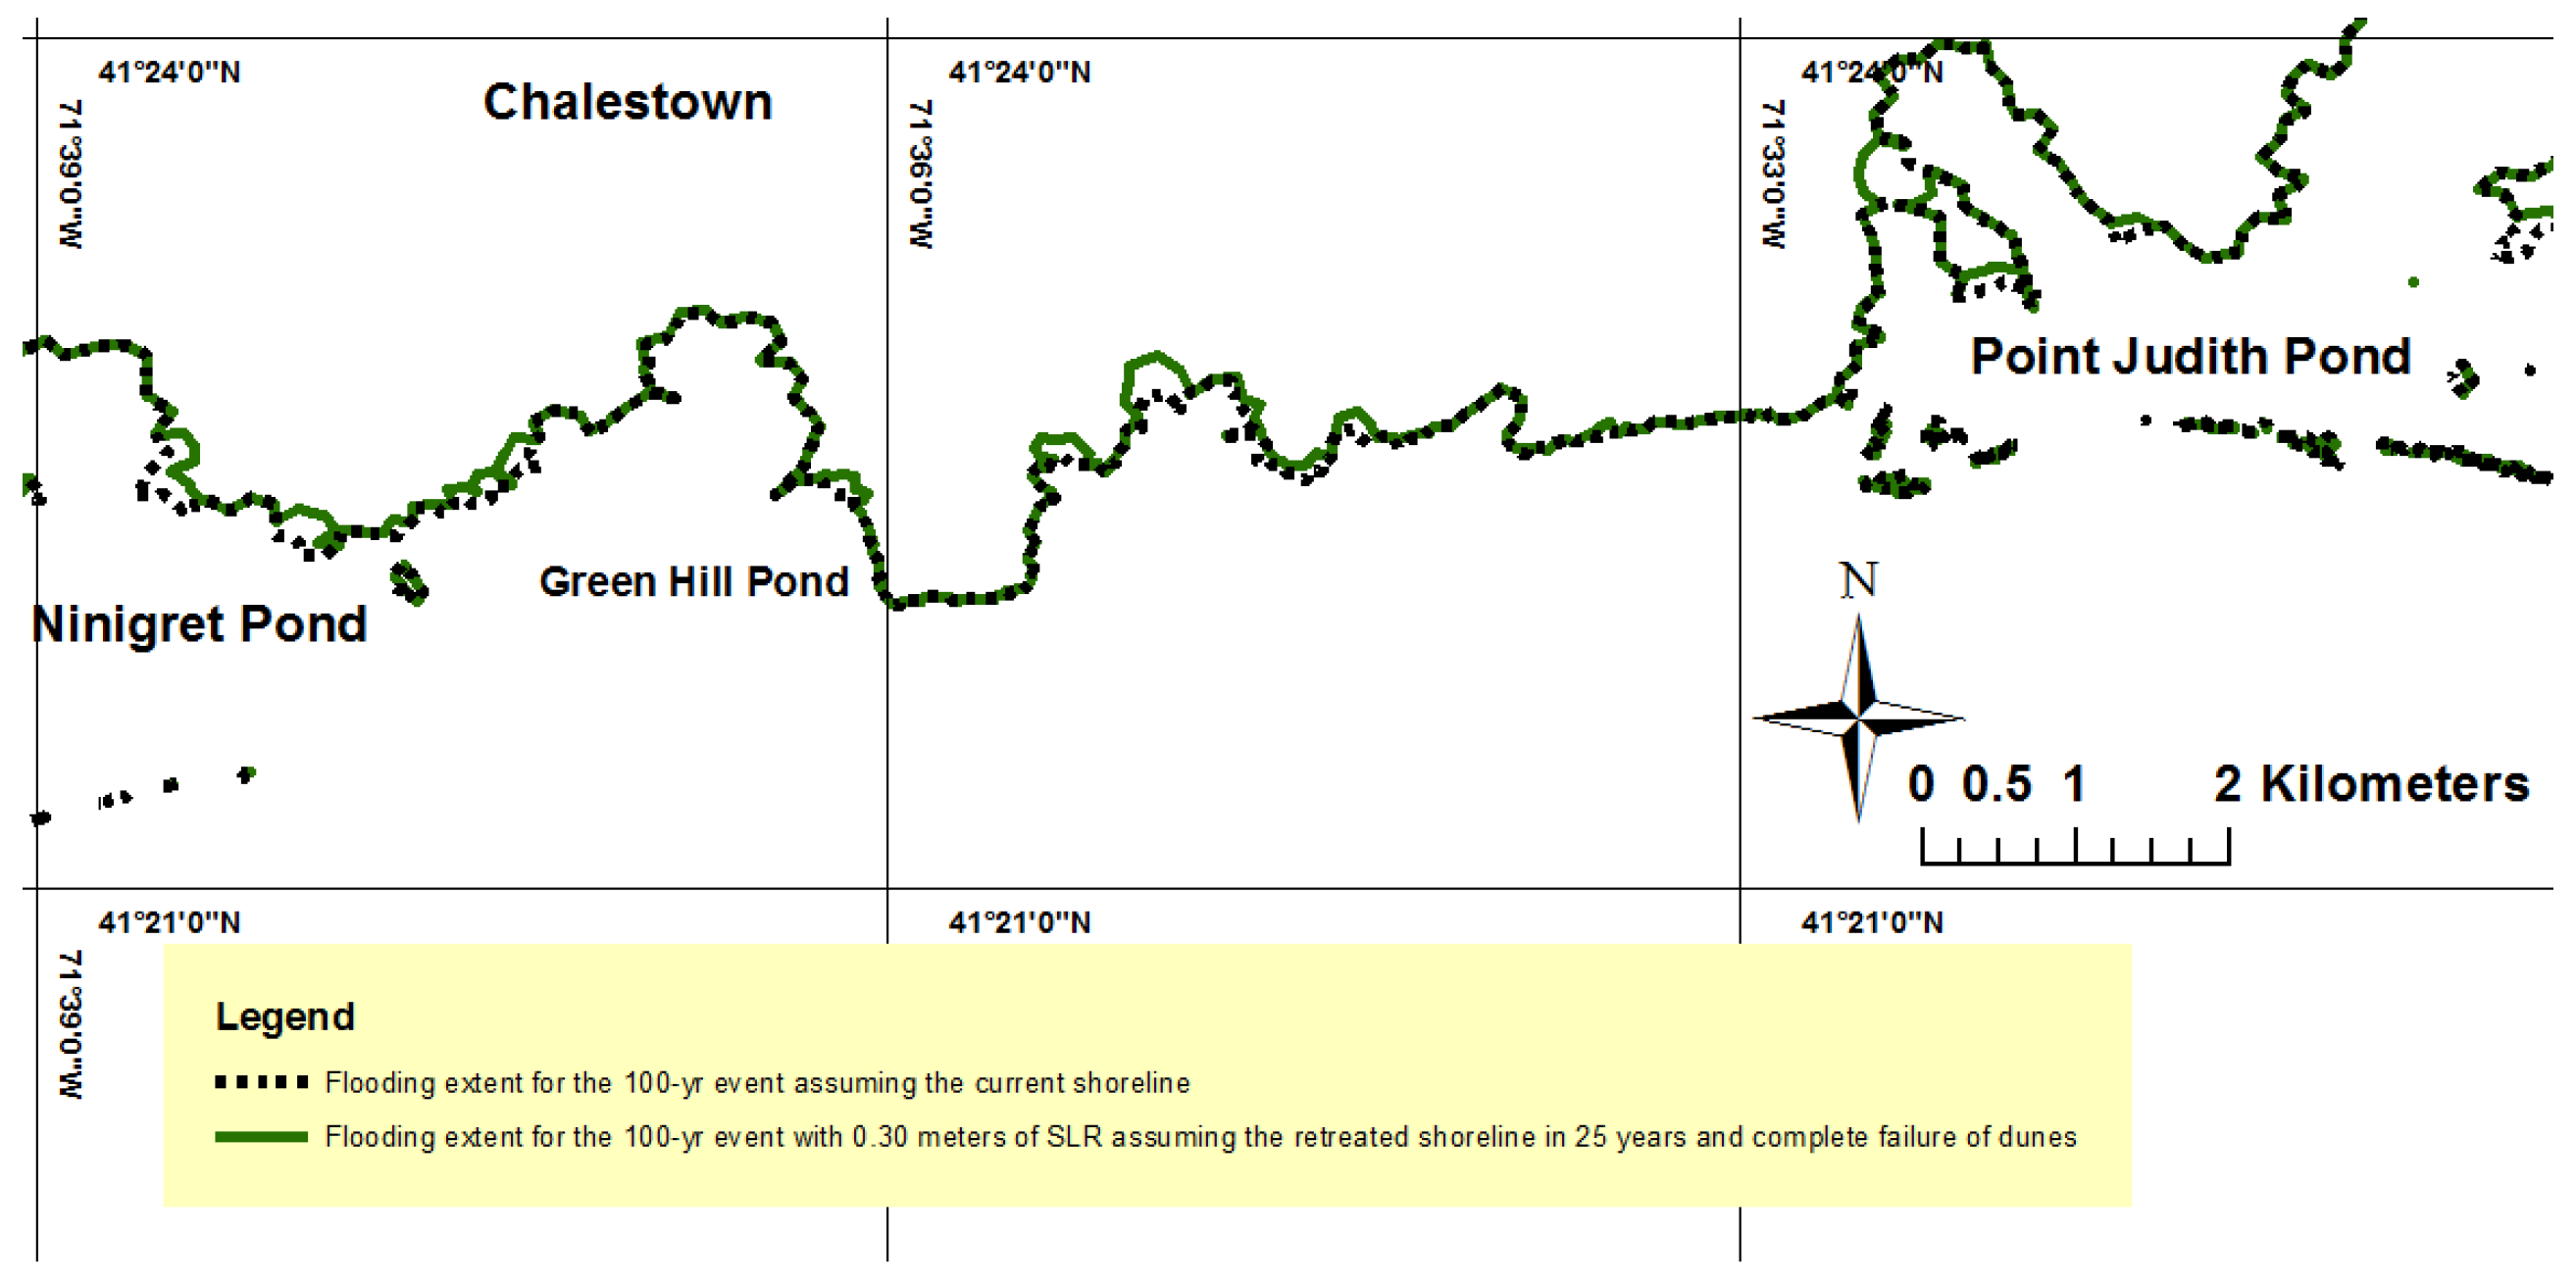
  • The results showed that erosion of dunes has more effect on flooding extent compared with retreat of shorelines.
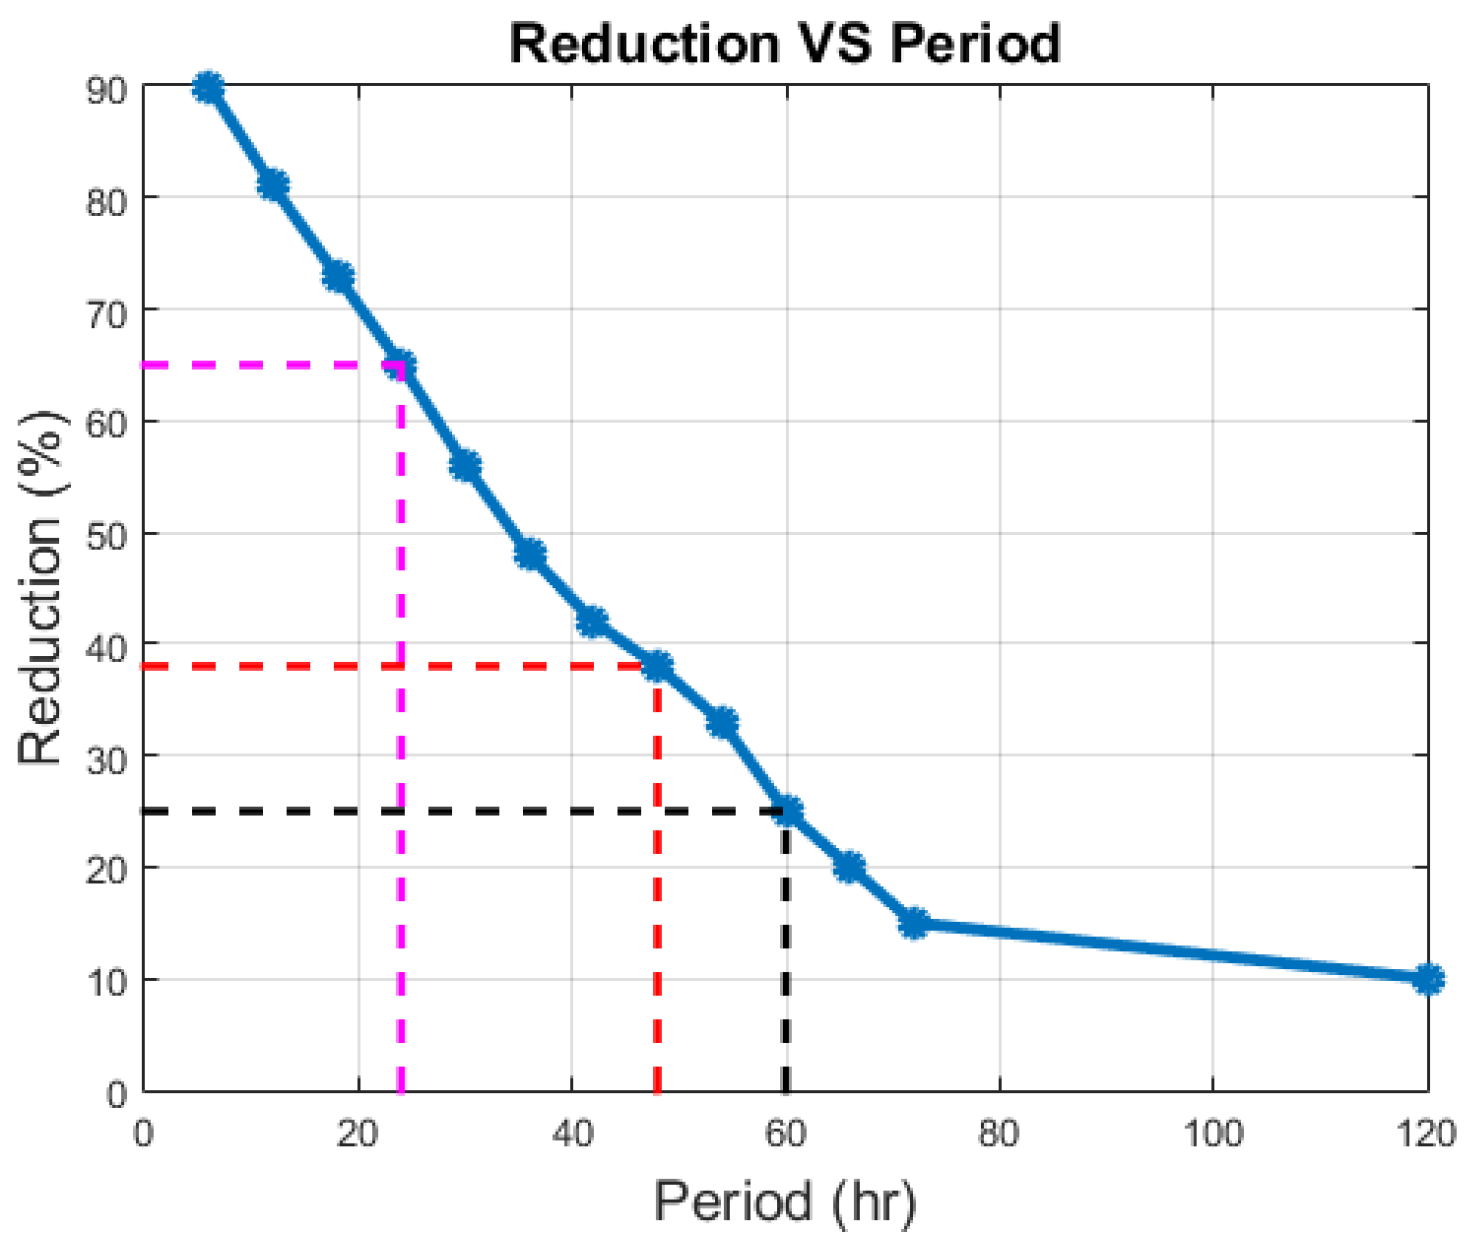
  • For storms which do not overtop or erode the coastal dunes, the inlets of coastal ponds can significantly decrease the storm surge elevation. This can be explained using the concepts of inlet-basin hydrodynamics. However, for very extreme storms such as a 100-year event where coastal dunes are overtopped, and low-lying areas are flooded, the flooding extent did not significantly change.
  • Assuming complete erosion of the dunes and for the scenario of Hurricane Bob, simulations showed a more than 200% increase in the flooding extent. Several sources of uncertainty can affect these estimations. For instance, in many cases, dunes are partially eroded. Coupled hydrodynamic and morphodynamic models which can simulate dunes erosion more accurately, can lead to more realistic estimations.
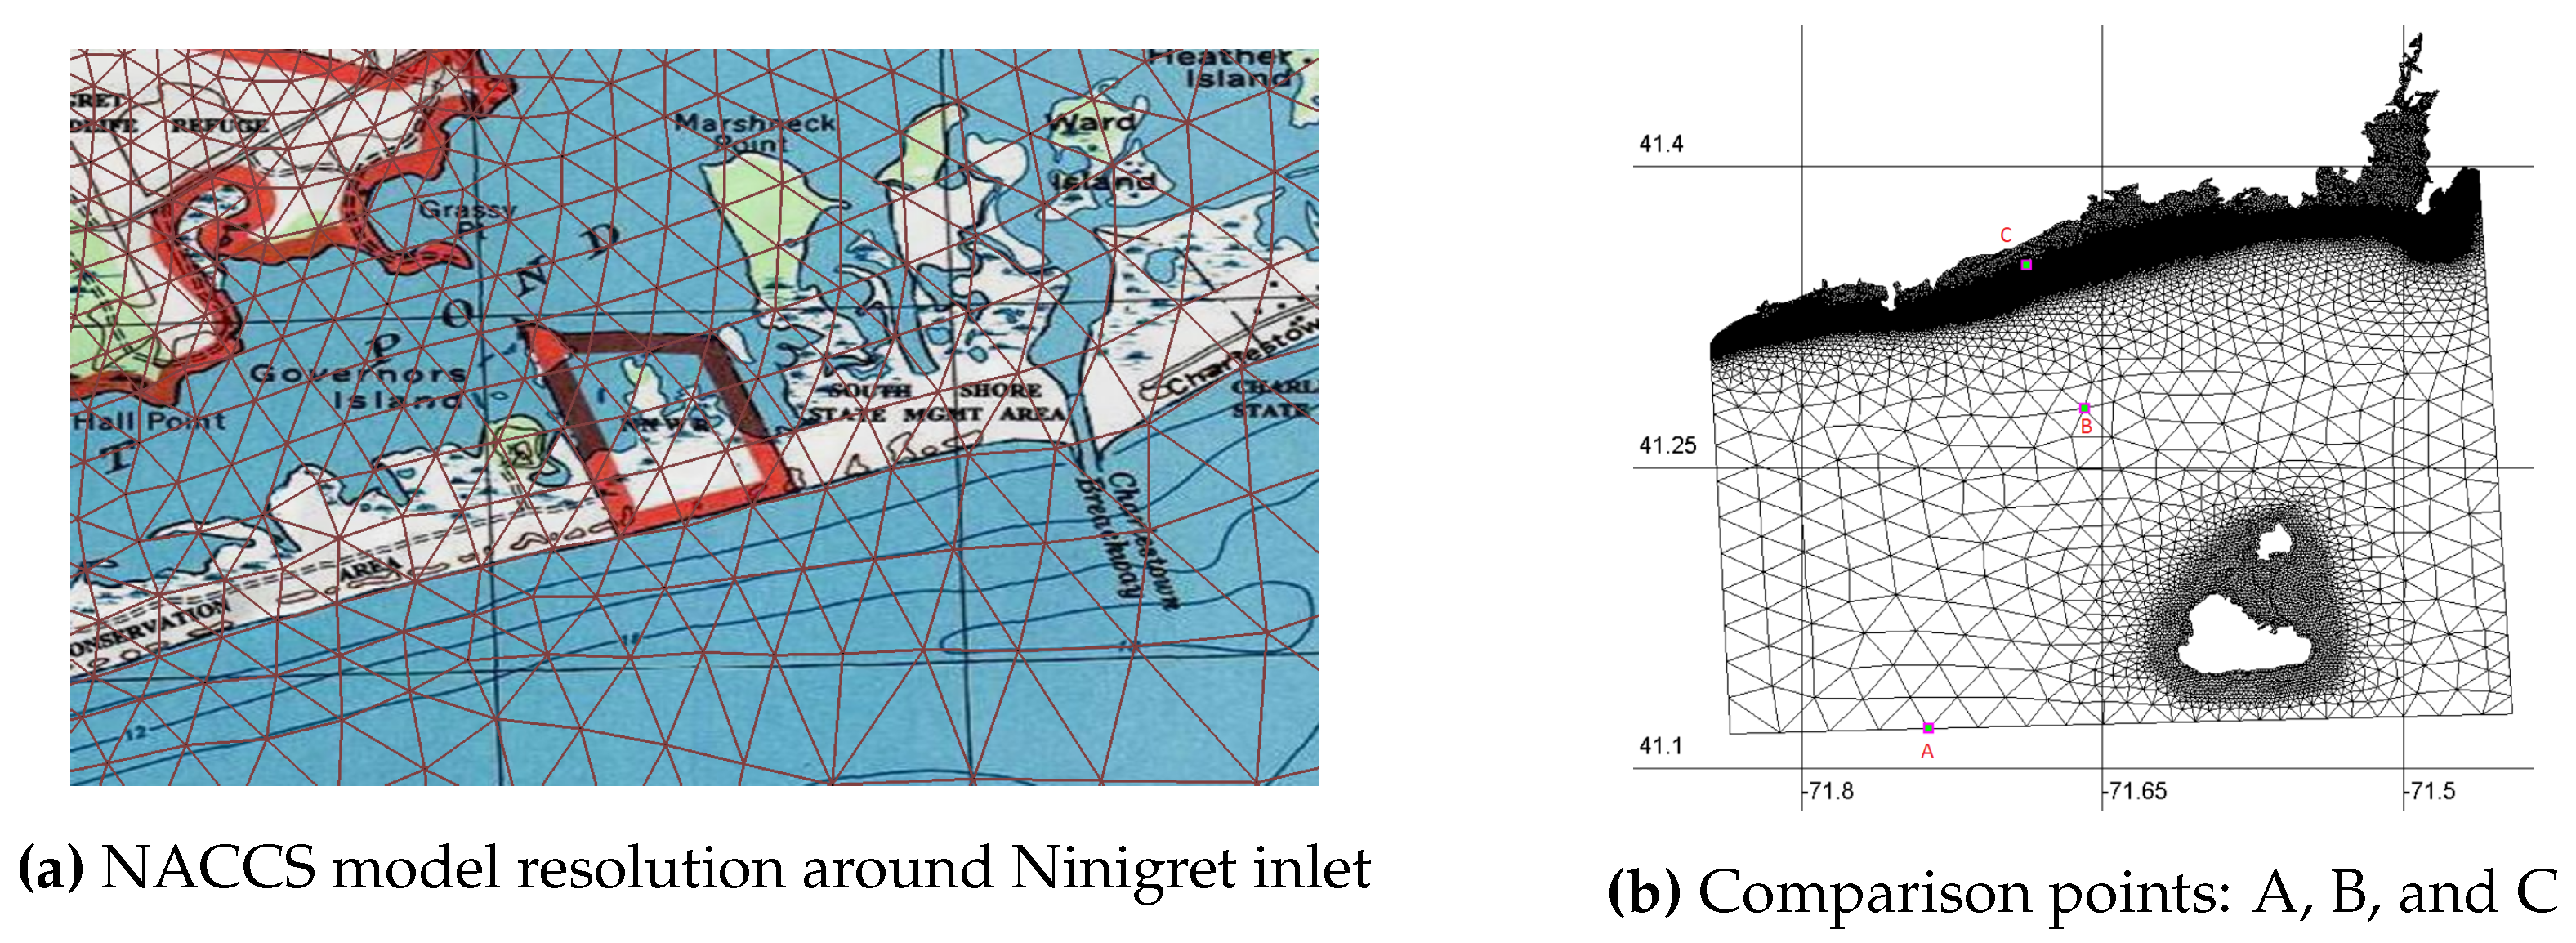
  • Numerical surge models which do not fully resolve coastal inlets (e.g., NACCS model in RI) lead to significant errors in the prediction of surge in coastal ponds. Accurate bathymetric and topographic measurement of coastal inlets is essential for storm surge modeling in areas with inlet-basin systems.

Acknowledgments

This work was under taken with funding support from a Rhode Island Community Development Block Grant (4712) from the U.S. Department of Housing and Urban Development and the State of Rhode Island Division of Planning Office of Housing and Community Development. Thanks to US Army Corps of Engineers (USACE) for sharing the North Atlantic Coastal Comprehensive Studies’ dataset. Thanks to National Hurricane Center (NHC) and Center for Operational Oceanographic Products and Services from NOAA for supplying hurricane and water level data. Thanks to Woods Hole Group Inc. for providing the water elevation data. Thanks to Marissa Torres for her comments on the paper.

Author Contributions

Alex Shaw developed the numerical models, and analysed the results. Mohammad Reza Hashemi initiated and led the research, and helped in discussion of the results. Malcolm Spaulding advised the research in many aspects, including analysis of the results and development of the models. Bryan Oakley contributed in coastal erosion and general discussions. Chris Baxter helped in the discussion of the results.

Conflicts of Interest

The authors declare no conflict of interest.

References

  1. Wahl, T.; Jain, S.; Bender, J.; Meyers, S.D.; Luther, M.E. Increasing risk of compound flooding from storm surge and rainfall for major US cities. Nat. Clim. Chang. 2015, 5, 1093–1097. [Google Scholar] [CrossRef]
  2. Parris, A.; Bromirski, P.; Burkett, V.; Cayan, D.R.; Culver, M.; Hall, J.; Horton, R.; Knuuti, K.; Moss, R.; Obeysekera, J.; et al. Global Sea Level Rise Scenarios for the United States National Climate Assessment; NOAA Technical Report OAR CPO-1; NOAA: Silver Spring, MD, USA, 2012. [Google Scholar]
  3. Roelvink, D.; Reniers, A.; van Dongeren, A.; de Vries, J.V.T.; McCall, R.; Lescinski, J. Modelling storm impacts on beaches, dunes and barrier islands. Coast. Eng. 2009, 56, 1133–1152. [Google Scholar] [CrossRef]
  4. McCall, R.T.; de Vries, J.V.T.; Plant, N.; van Dongeren, A.; Roelvink, J.; Thompson, D.; Reniers, A. Two-dimensional time dependent hurricane overwash and erosion modeling at Santa Rosa Island. Coast. Eng. 2010, 57, 668–683. [Google Scholar] [CrossRef]
  5. Kurum, M.O.; Edge, B.; Mitasova, H.; Overton, M. Effects of coastal landform changes on storm surge along the Hatteras Island breach area. Coast. Eng. Proc. 2011, 1, 25. [Google Scholar] [CrossRef]
  6. Boothroyd, J.; Hollis, R.; Oakley, B.; Henderson, R. Shoreline Change from 1939–2014, Washington County, Rhode Island. 1:2,000 scale, 45 maps; Technical Report; Rhode Island Geological Survey: Kingston, RI, USA, 2016. [Google Scholar]
  7. Woods Hole Group. Wave Tide and Current Data Collection Contract No. W912WJ-09-D-0001-0026; US Army Corps of Engineers: New England District, MA, USA, 2012. [Google Scholar]
  8. Cialone, M.A.; Massey, T.C.; Anderson, M.E.; Grzegorzewski, A.S.; Jensen, R.E.; Cialone, A.; Mark, D.J.; Pevey, K.C.; Gunkel, B.L.; McAlpin, T.O. North Atlantic Coast Comprehensive Study (NACCS) Coastal Storm Model Simulations: Waves and Water Levels; Technical Report, DTIC Document; The U.S. Army Engineer Research and Development Center: Vicksburg, MS, USA, 2015. [Google Scholar]
  9. Hashemi, M.R.; Spaulding, M.L.; Shaw, A.; Farhadi, H.; Lewis, M. An efficient artificial intelligence model for prediction of tropical storm surge. Nat. Hazards 2016, 82, 471–491. [Google Scholar] [CrossRef]
  10. Luettich, R., Jr.; Westerink, J.; Scheffner, N.W. ADCIRC: An Advanced Three-Dimensional Circulation Model for Shelves, Coasts, and Estuaries; Report 1. Theory and Methodology of ADCIRC-2DDI and ADCIRC-3DL. Technical Report, DTIC Document; US Army Corps of Engineers: Washington DC, USA, 1992. [Google Scholar]
  11. Smith, J.M.; Sherlock, A.R.; Resio, D.T. STWAVE: Steady-State Spectral Wave Model User’s Manual for STWAVE, version 3.0; Technical Report, DTIC Document; US Army Corps of Engineers: Washington DC, USA, 2001. [Google Scholar]
  12. Dietrich, J.C.; Tanaka, S.; Westerink, J.J.; Dawson, C.; Luettich, R., Jr.; Zijlema, M.; Holthuijsen, L.H.; Smith, J.; Westerink, L.; Westerink, H. Performance of the unstructured-mesh, SWAN + ADCIRC model in computing hurricane waves and surge. J. Sci. Comput. 2012, 52, 468–497. [Google Scholar] [CrossRef]
  13. Westerink, J.J.; Luettich, R.A.; Feyen, J.C.; Atkinson, J.H.; Dawson, C.; Roberts, H.J.; Powell, M.D.; Dunion, J.P.; Kubatko, E.J.; Pourtaheri, H. A basin-to channel-scale unstructured grid hurricane storm surge model applied to southern Louisiana. Mon. Weather Rev. 2008, 136, 833–864. [Google Scholar] [CrossRef]
  14. Mukai, A.Y.; Westerink, J.J.; Luettich, R.A., Jr.; Mark, D. Eastcoast 2001, a Tidal Constituent Database for Western North Atlantic, Gulf of Mexico, and Caribbean Sea; Technical Report, DTIC Document; US Army Corps of Engineers: Washington DC, USA, 2002. [Google Scholar]
  15. Pawlowicz, R.; Beardsley, B.; Lentz, S. Classical tidal harmonic analysis including error estimates in MATLAB using T_TIDE. Comput. Geosci. 2002, 28, 929–937. [Google Scholar] [CrossRef]
  16. US Army Corps of Engineers. Hydrodynamics of Tidal Inlets, EM 1110-2-1100 ed.; US Army Corps of Engineers: Washington DC, USA, 2008. [Google Scholar]
  17. Wong, K.C.; DiLorenzo, J. The response of Delaware’s inland bays to ocean forcing. J. Geophys. Res. Oceans 1988, 93, 12525–12535. [Google Scholar] [CrossRef]
  18. Chuang, W.S.; Swenson, E.M. Subtidal water level variations in Lake Pontchartrain, Louisiana. J. Geophys. Res. Oceans 1981, 86, 4198–4204. [Google Scholar] [CrossRef]
  19. Aretxabaleta, A.L.; Butman, B.; Ganju, N.K. Water level response in back-barrier bays unchanged following Hurricane Sandy. Geophys. Res. Lett. 2014, 41, 3163–3171. [Google Scholar] [CrossRef]
  20. Woodruff, J.D.; Irish, J.L.; Camargo, S.J. Coastal flooding by tropical cyclones and sea-level rise. Nature 2013, 504, 44–52. [Google Scholar] [CrossRef] [PubMed]
  21. Sweet, W.V. Sea Level Rise and Nuisance Flood Frequency Changes around the United States; NOAA Technical Report NOS CO-OPS 073; National National Oceanic and Atmospheric Administration: Silver Spring, MD, USA, 2014. [Google Scholar]
  22. Judge, E.K.; Overton, M.F.; Fisher, J.S. Vulnerability indicators for coastal dunes. J. Waterw. Port Coast. Ocean Eng. 2003, 129, 270–278. [Google Scholar] [CrossRef]
Figure 1. Overview of the the study area in the southern coast of Rhode Island. Other details include save points (blue crosses) from the North Atlantic Coast Comprehensive Study (NACCS) (see Section 2), Woods Hole Group Inc. water level gauge locations (orange dots), and a red box around the study area. Transects in the dark blue area were used to apply erosion scenarios (Figure 8).
Jmse 04 00085 g001
Figure 2. Failure of dunes protecting Ninigret Pond after Hurricane Carol (1954); source: Rhode Island (RI) Coastal Resources Management Council.
Jmse 04 00085 g002
Figure 3. The time series of storm surge for synthetic storm 457—from NACCS—which approximately produces 100-year storm surge (at the upper 95% confidence level) near the Newport NOAA water level station.
Jmse 04 00085 g003
Figure 4. The Digital Elevation Model (DEM) around the study area.
Jmse 04 00085 g004
Figure 5. Extremal analysis of water elevation (MHHW = MSL + 0.65) for Newport NOAA station (8452660); the red box shows Hurricane Bob.
Jmse 04 00085 g005
Figure 6. Plots of the wind speed and direction for Hurricane Bob at WIS station number 63079, which is located near the region (71.22 W, 41.25 N).
Jmse 04 00085 g006
Figure 7. A sample shoreline change map for a beach in the study area [6].
Jmse 04 00085 g007
Figure 8. Crossshore transects made to implement coastal erosion between Charlestown Beach and Matunuck Beach (Numbered 1–30).
Jmse 04 00085 g008
Figure 9. The simplified method which was used to estimate the shoreline geometry after erosion in future. Transect 30 (as an example; Figure 8), with the original shoreline (blue), 25-year shoreline (red), and intersection point (star) are shown. The vertical axis is exaggerated for better clarity. (a) shoreline geometry after erosion; (b) erosion of the dunes.
Jmse 04 00085 g009
Figure 10. An overview of the mesh used for surge modeling in the southern coast of RI. The model domain is larger than the study area and includes Block Island near the southern boundary. Subfigure (b) shows a magnified view of the rectangular area in Subfigure (a) around Ninigret Pond.
Jmse 04 00085 g010
Figure 11. Comparison between the model predictions and the observed data for Hurricane Irene (see Figure 1 for location of the stations). (a) NW station; (b) NN station.
Jmse 04 00085 g011
Figure 12. Comparison of observed water elevation data inside and outside Ninigret Pond (NW Gauge, Figure 1).
Jmse 04 00085 g012
Figure 13. Effect of coastal inlet geometry on surge inside three coastal ponds in the study area; comparison of water elevation in Ninigret Pond, Trustom Pond, and Point Judith Pond for (a) Tides; (b) Hurricane Bob.
Jmse 04 00085 g013
Figure 14. Effect of water elevation signal period on reduction of the amplitude for Ninigret Pond.
Jmse 04 00085 g014
Figure 15. Comparison of Hurricane Bob flooding extent assuming current condition (red) and current shoreline with no dune system (blue), and the 25-year retreated shoreline as well as complete dune failure (black).
Jmse 04 00085 g015
Figure 16. Comparison of 100-year flooding extent assuming the current shoreline (blue), current shoreline with eroded dune system (green), and the 25-year retreated shoreline plus complete dune failure (black). Lines overlap for this scenario.
Jmse 04 00085 g016
Figure 17. Comparison of flooding extend of the 100-year storm event, assuming 30 cm SLR, and coastal erosion.
Jmse 04 00085 g017
Figure 18. Effect of model resolution on the results; Subfigure (a) shows an example of low resolution NACCS mesh in a coastal inlet; Subfigure (b) shows the locations of comparison for NACCS results and those obtained in this study.
Jmse 04 00085 g018
Figure 19. Comparison of NACCS results and ADCIRC model of this study for synthetic Storm 220. See Figure 18b for locations of comparison. (a) Comparison at B: outside Ninigret Pond; (b) Comparison at C: inside Ninigret pond.
Jmse 04 00085 g019
Table 1. Harmonic constituents at the Newport and Providence NOAA water elevation stations.
HarmonicsNewport Amplitude (m)Newport Phase (degrees)Providence Amplitude (m)Providence Phase (degrees)
M20.5052.30.6439.5
S20.10825.00.13833.6
N20.124345.80.152354.6
K10.062166.10.073169.4
M40.05735.80.103202.2
O10.047202.00.027312.7
M60.0005220.10.027312.7
MK30.000819.50.01639.3
S40.00075.10.01423.8
MN40.026347.90.01412.7
Table 2. Skill assessment of the numerical model for tidal predictions inside Ninigret Pond; see Figure 1 for location of the stations. RMSE for amplitude and phase are 0.015 m and 25 , respectively.
ConstituentsNWNN
ModelObservationModelObservation
amp (m)Phase (deg)amp (m)Phase (deg)amp (m)Phase (deg)amp (m)Phase (deg)
O10.0222770.0182830.0222710.017277
K10.0242170.0192230.0242100.019216
N20.021480.017710.020340.01756
M20.083820.081890.075690.07775
S20.0081140.0211060.007980.021101
Table 3. Differences in flooded areas near the eroded shoreline for Hurricane Bob assuming erosion scenarios.
Erosion ScenarioCurrent Flooded Area, km 2 Changed Flooded Area, km 2 Difference, km 2 Percentage Increase
Shoreline retreat in 25 years1.131.350.2219.7%
Eroded dunes1.133.52.33207%

