
Role of Beach Morphology in Wave Overtopping Hazard Assessment


Abstract
:1. Introduction
1.1. Controls on Breaching
- Hydraulic failure: overtopping damage causing significant erosion or scouring to the landward side.
- Geo-hydraulic failure: porewater-related effects, such as erosion of the internal structure through seeping.
- Global static failure: pressure forces (ice, wind, waves) exceeding the structure’s resistance.
1.2. Flood Risk Modelling
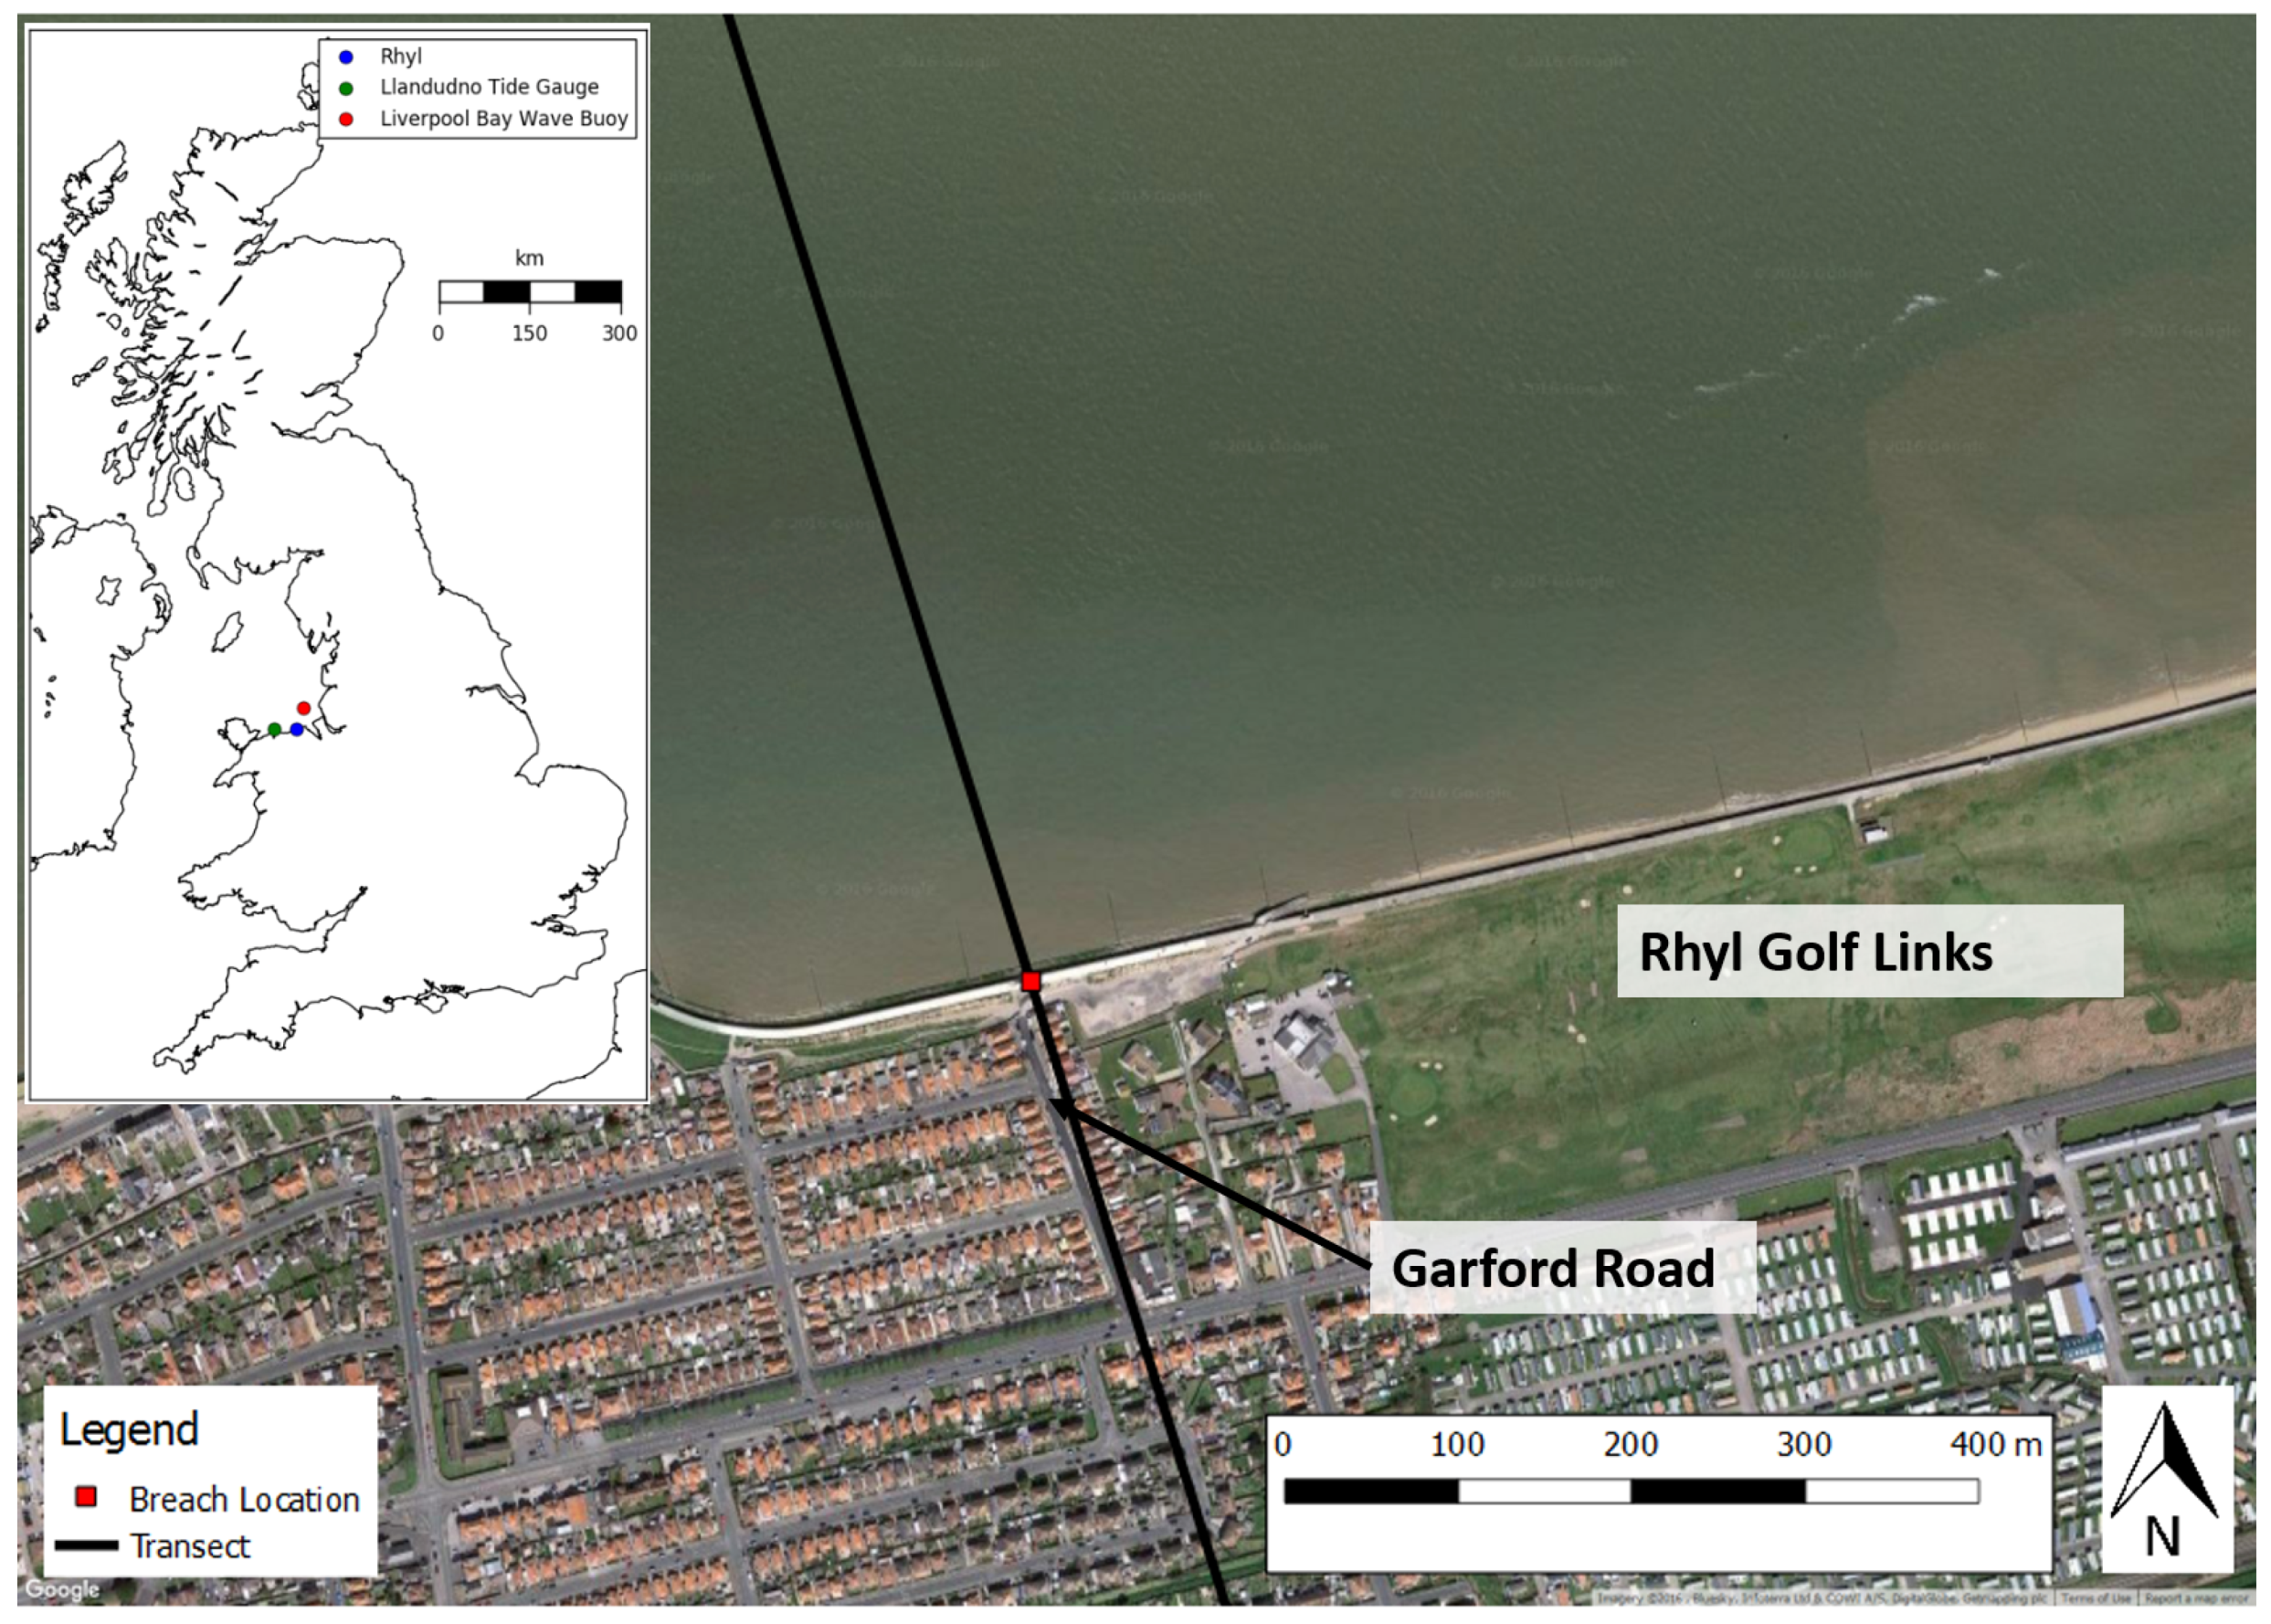
1.3. Site Selection
2. Modelling Approach
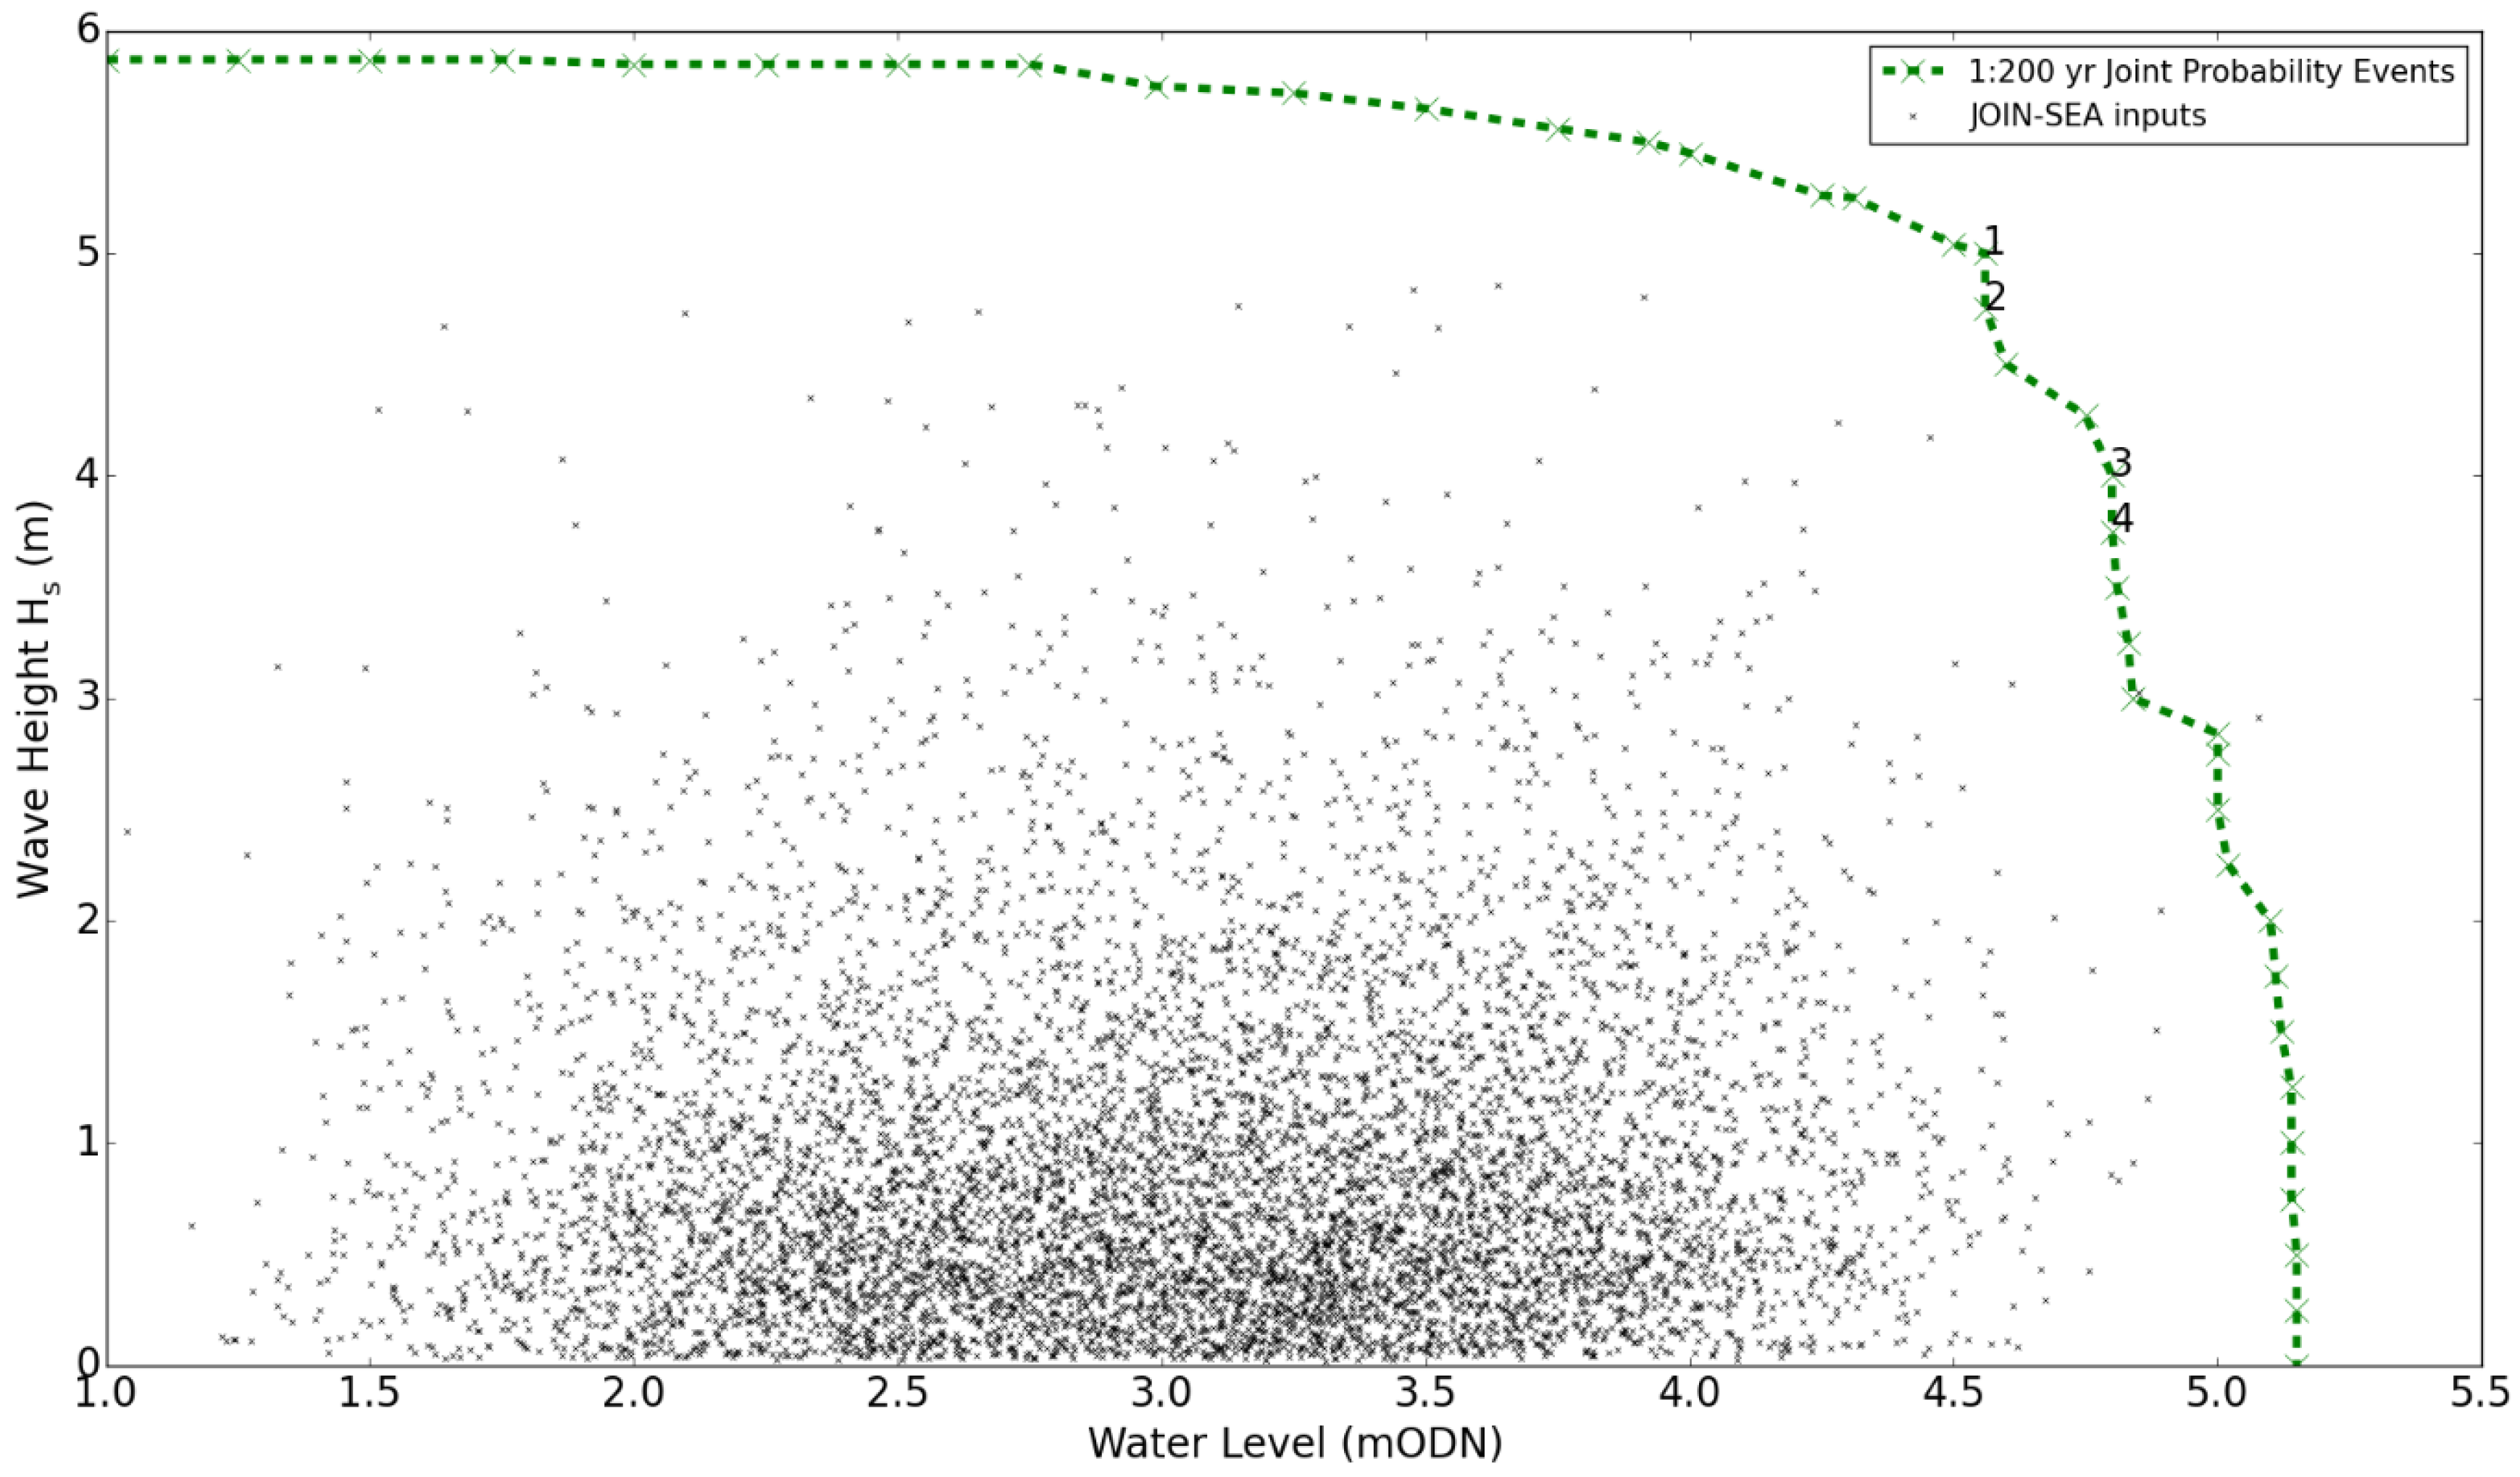
2.1. Joint Probability Extreme Water Level Dataset
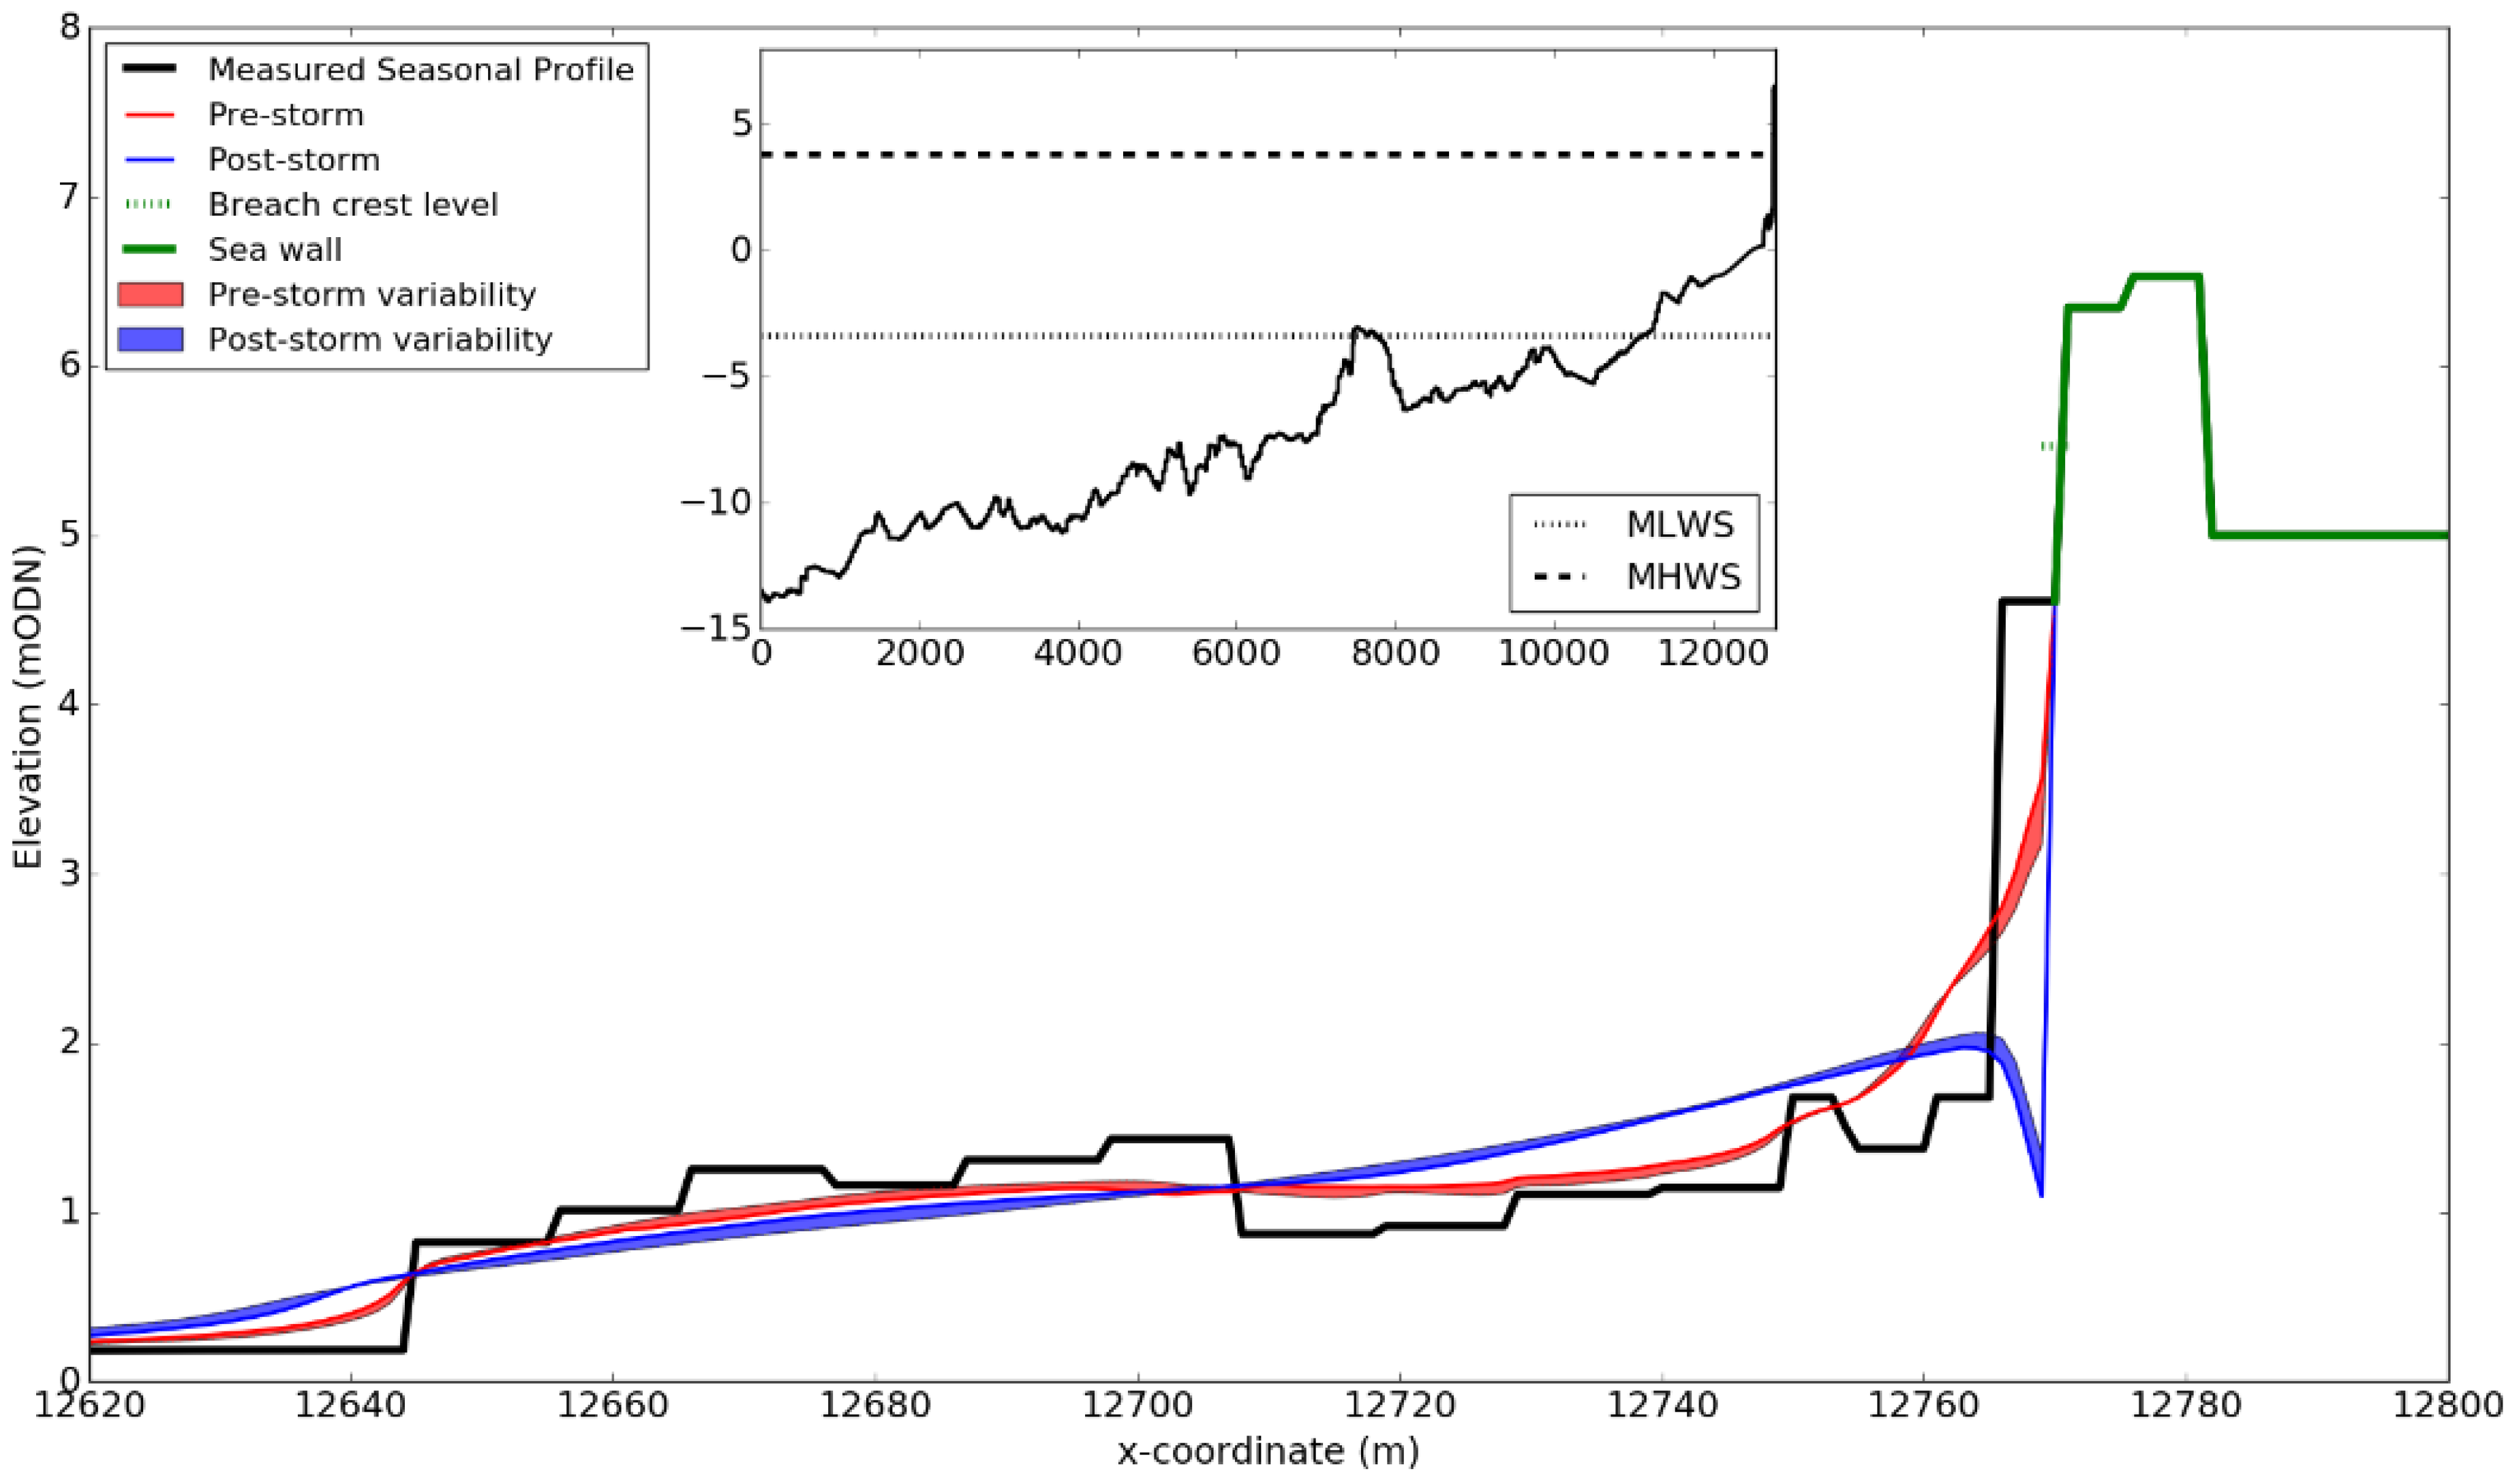
2.2. Model Setup
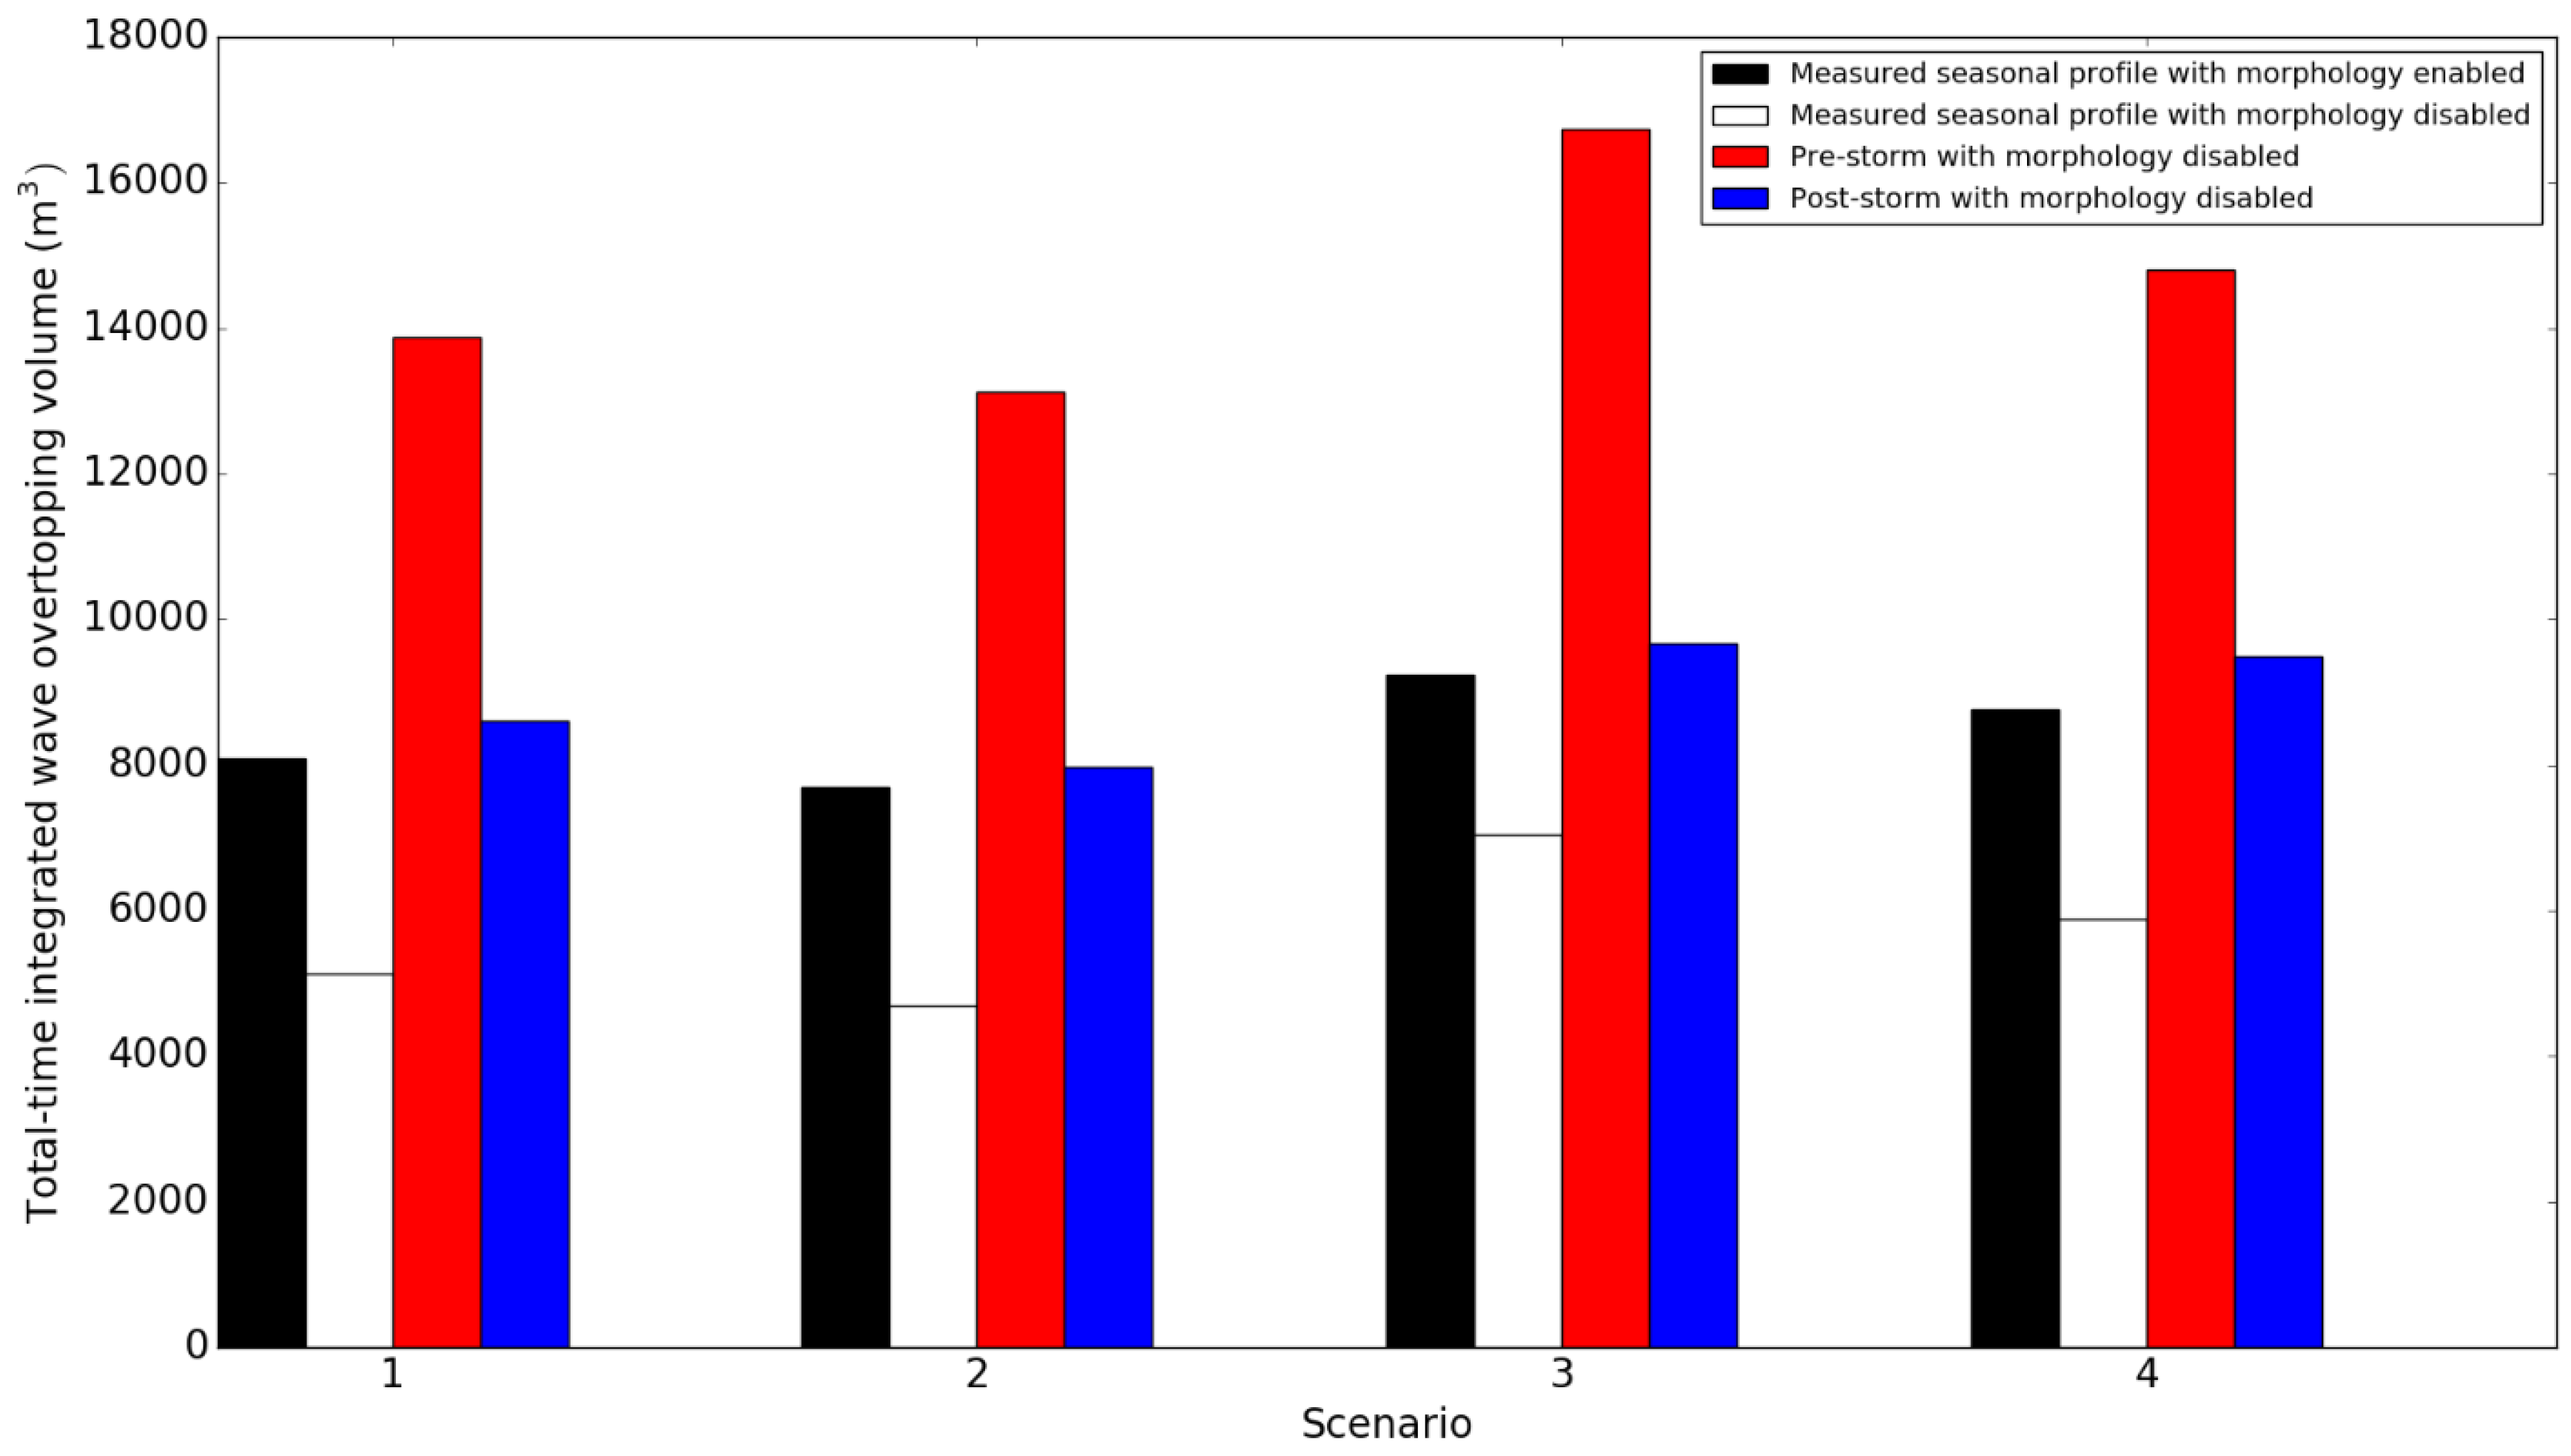
- A realistic (measured seasonal profile, Figure 3) nearshore swash bar system, extracted from the original 1D transect, with morphology disabled.
- A realistic (measured seasonal profile, Figure 3) nearshore swash bar system, extracted from the original 1D transect, with morphology enabled.
- Pre high water (transect extracted 33% of the way through the XBeach simulation of Scenario 1, pre-storm, Figure 3), where the water level had begun to smooth the nearshore swash bar system to represent the pre-storm profile, with morphology disabled.
- Post high water (transect extracted at the end of the XBeach simulation of Scenario 4, post-storm, Figure 3), to be representative of a post-storm beach profile, with morphology disabled.
2.3. Modelling Sea Defence Breaching
3. Results
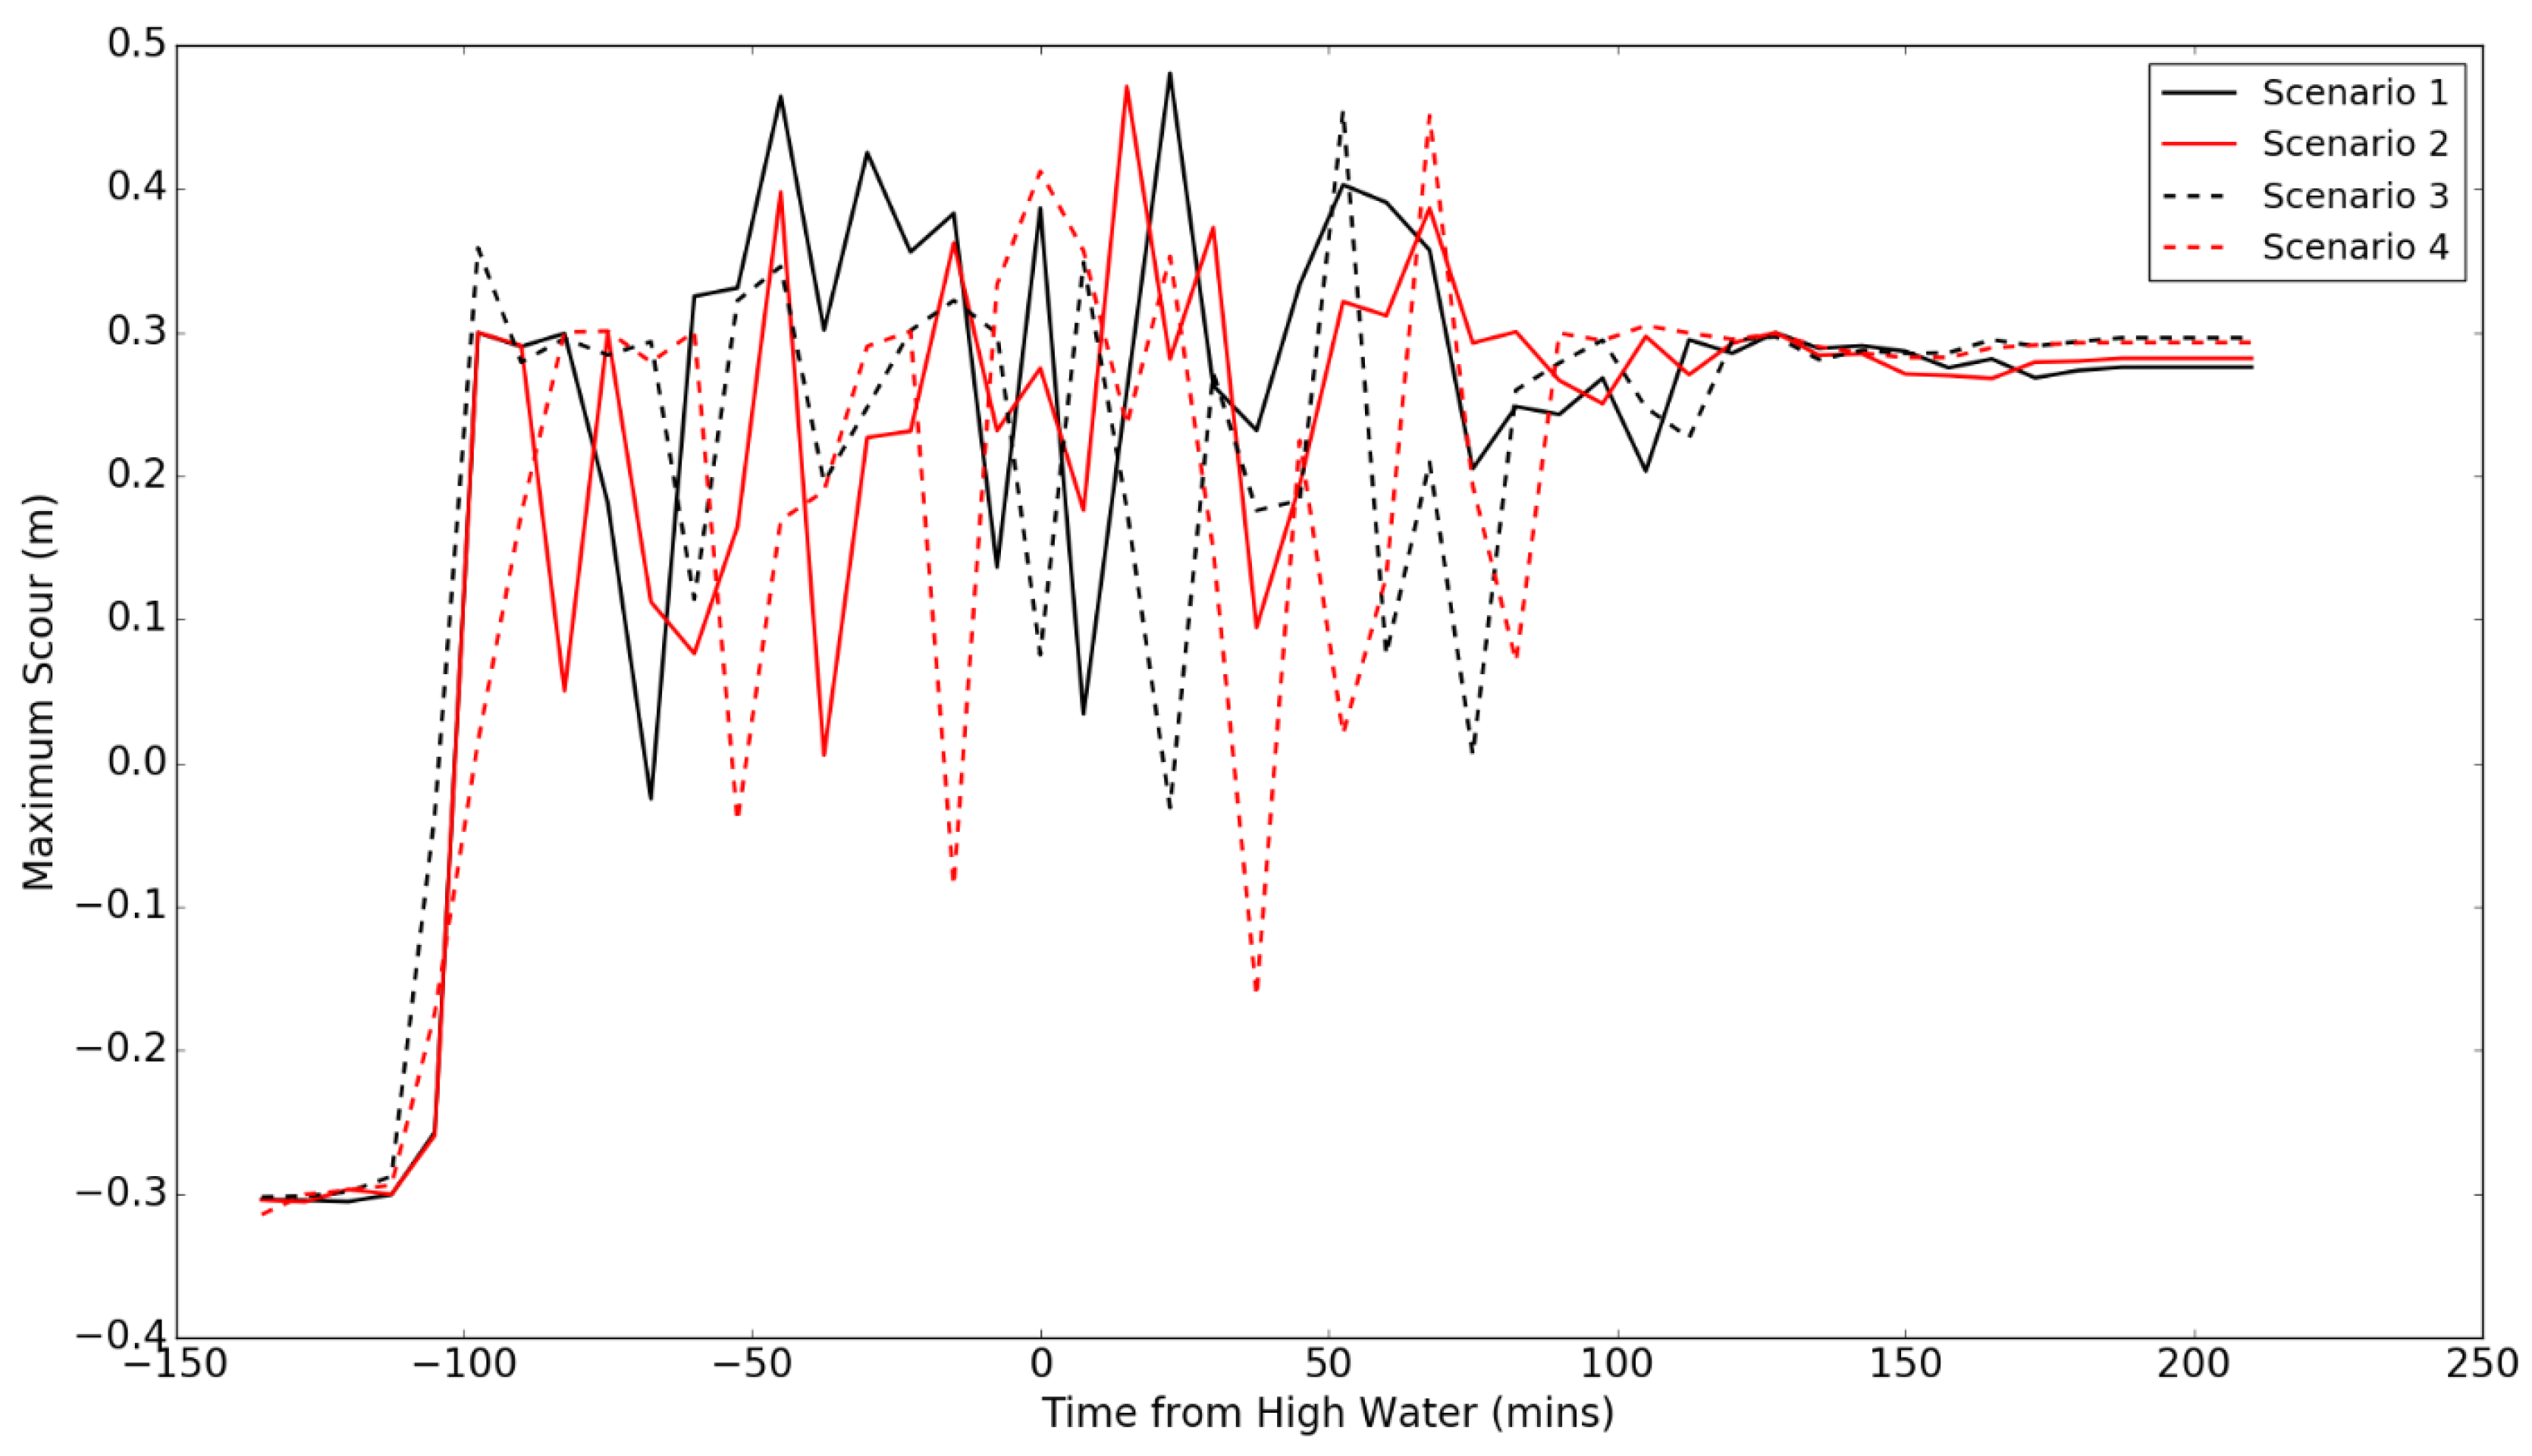
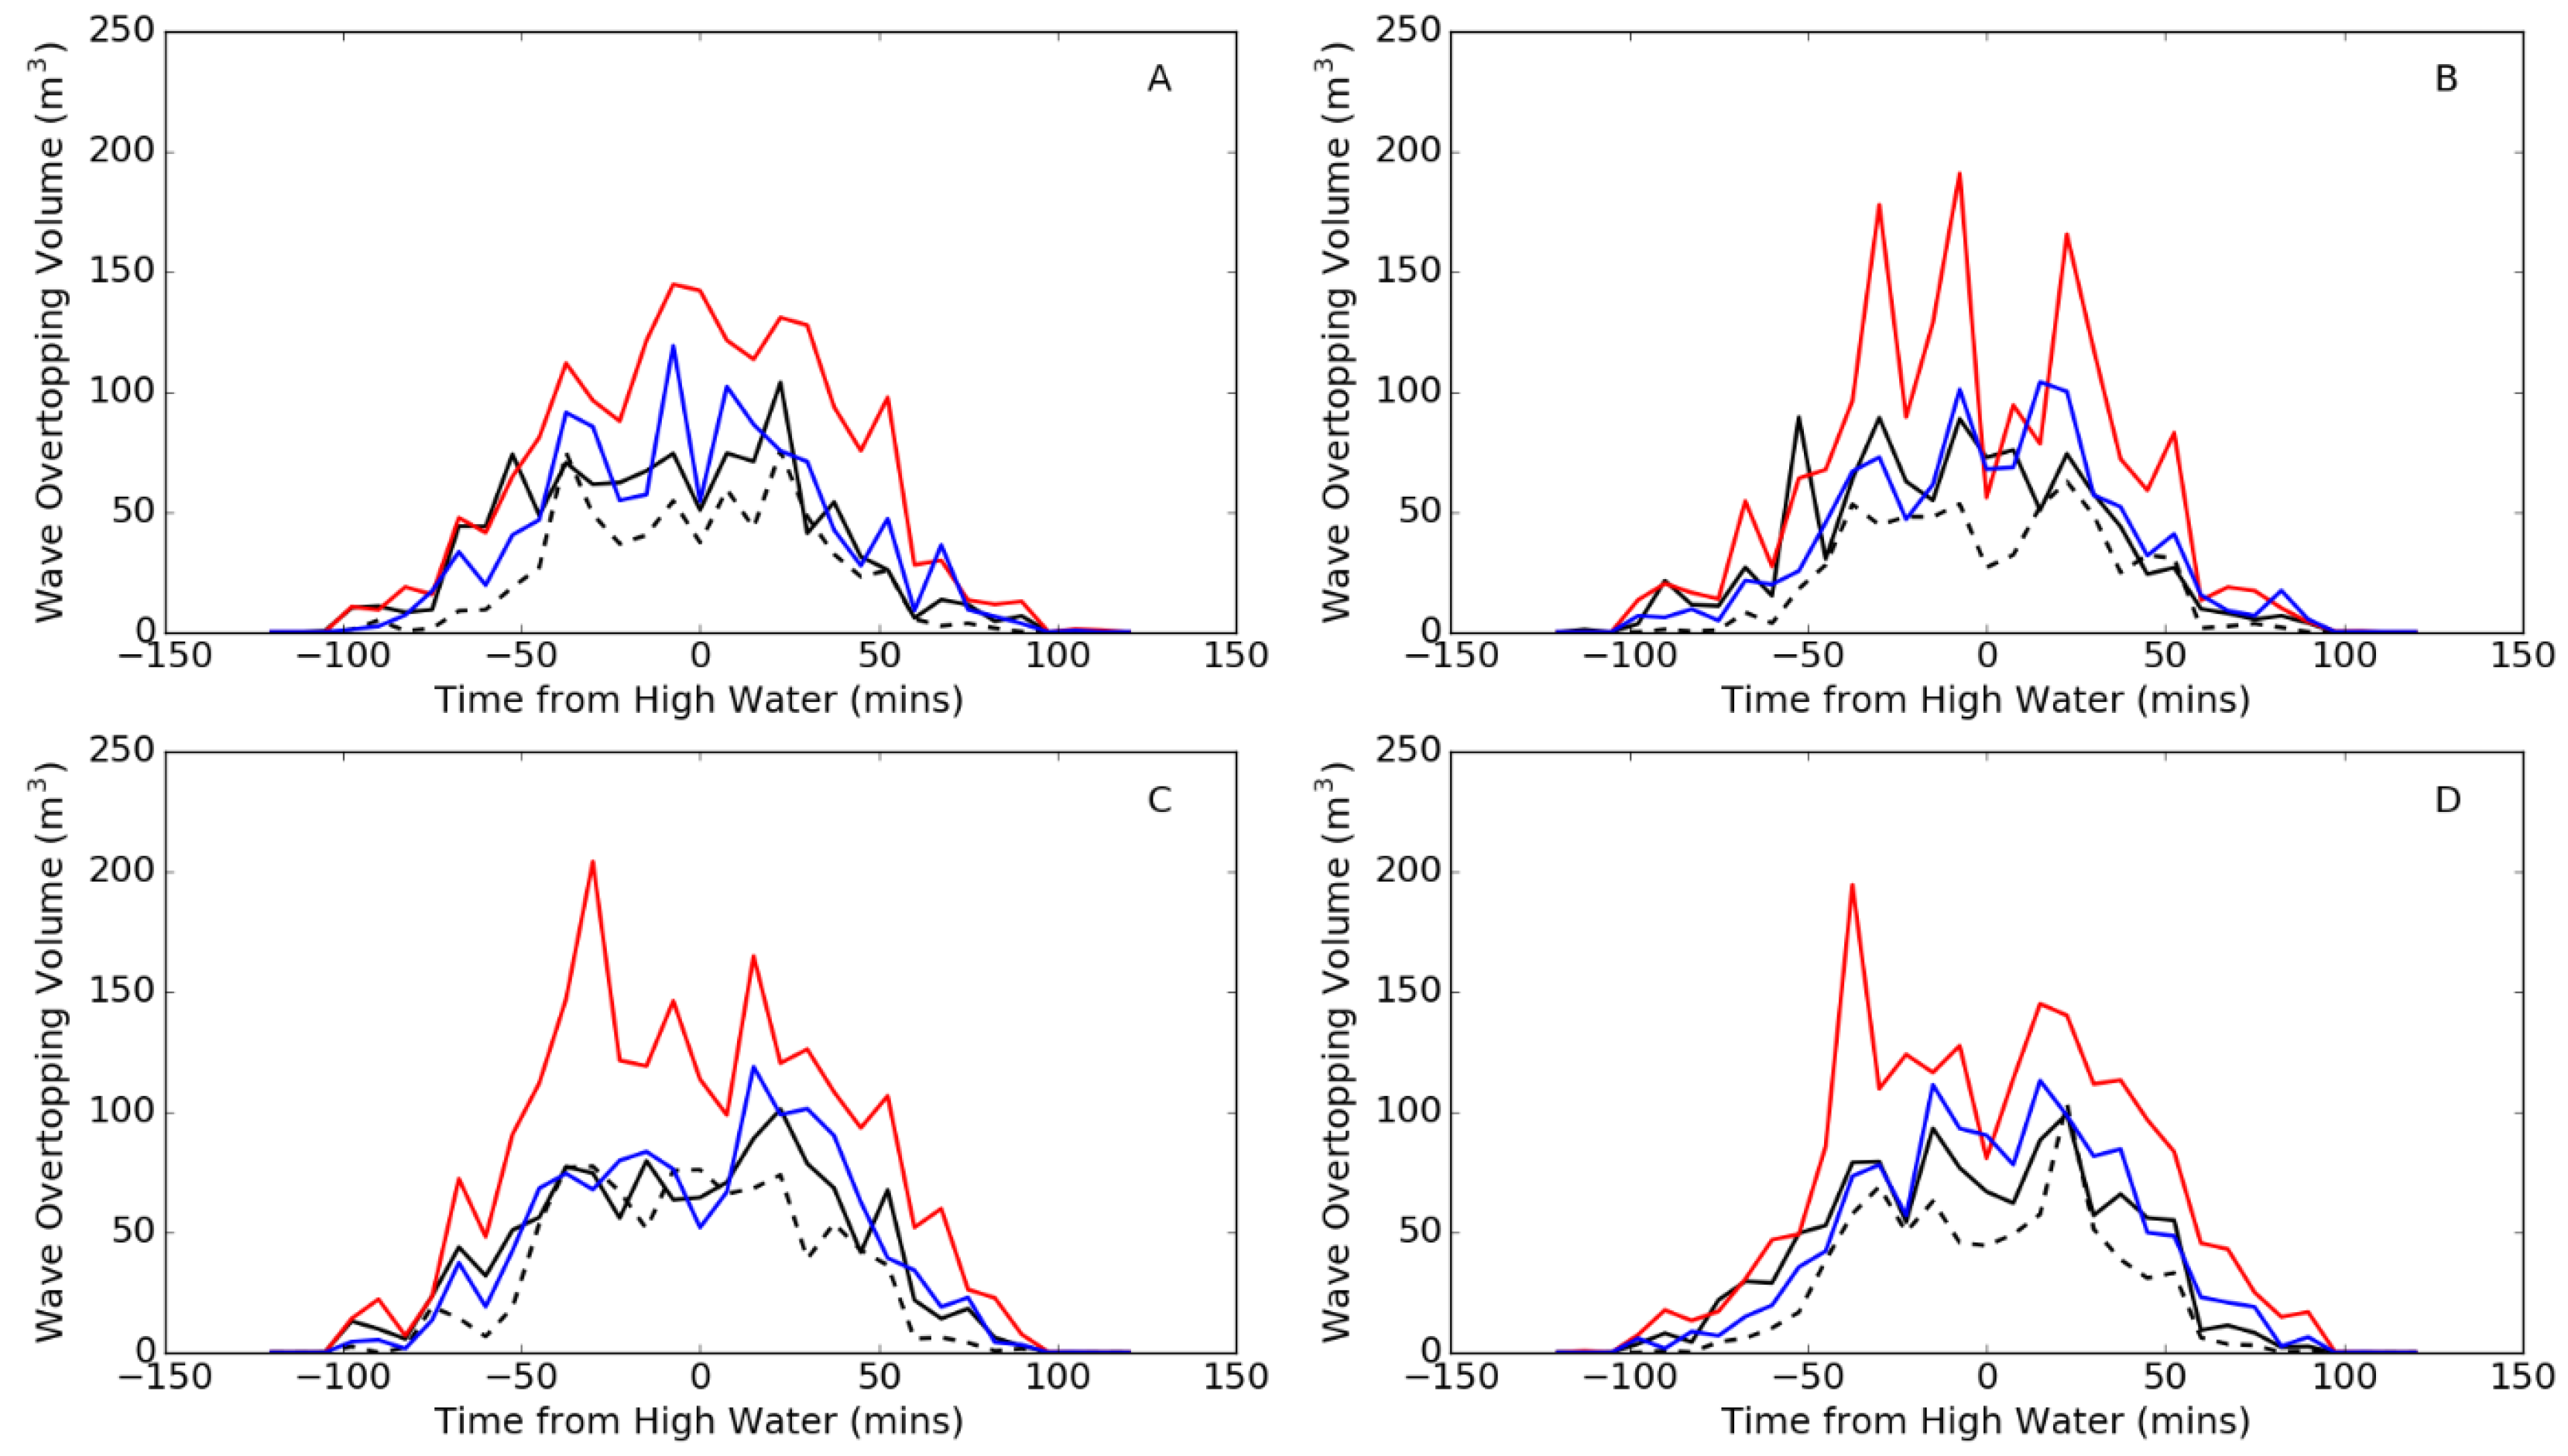
3.1. Beach Morphology under Wave Overtopping Scenarios
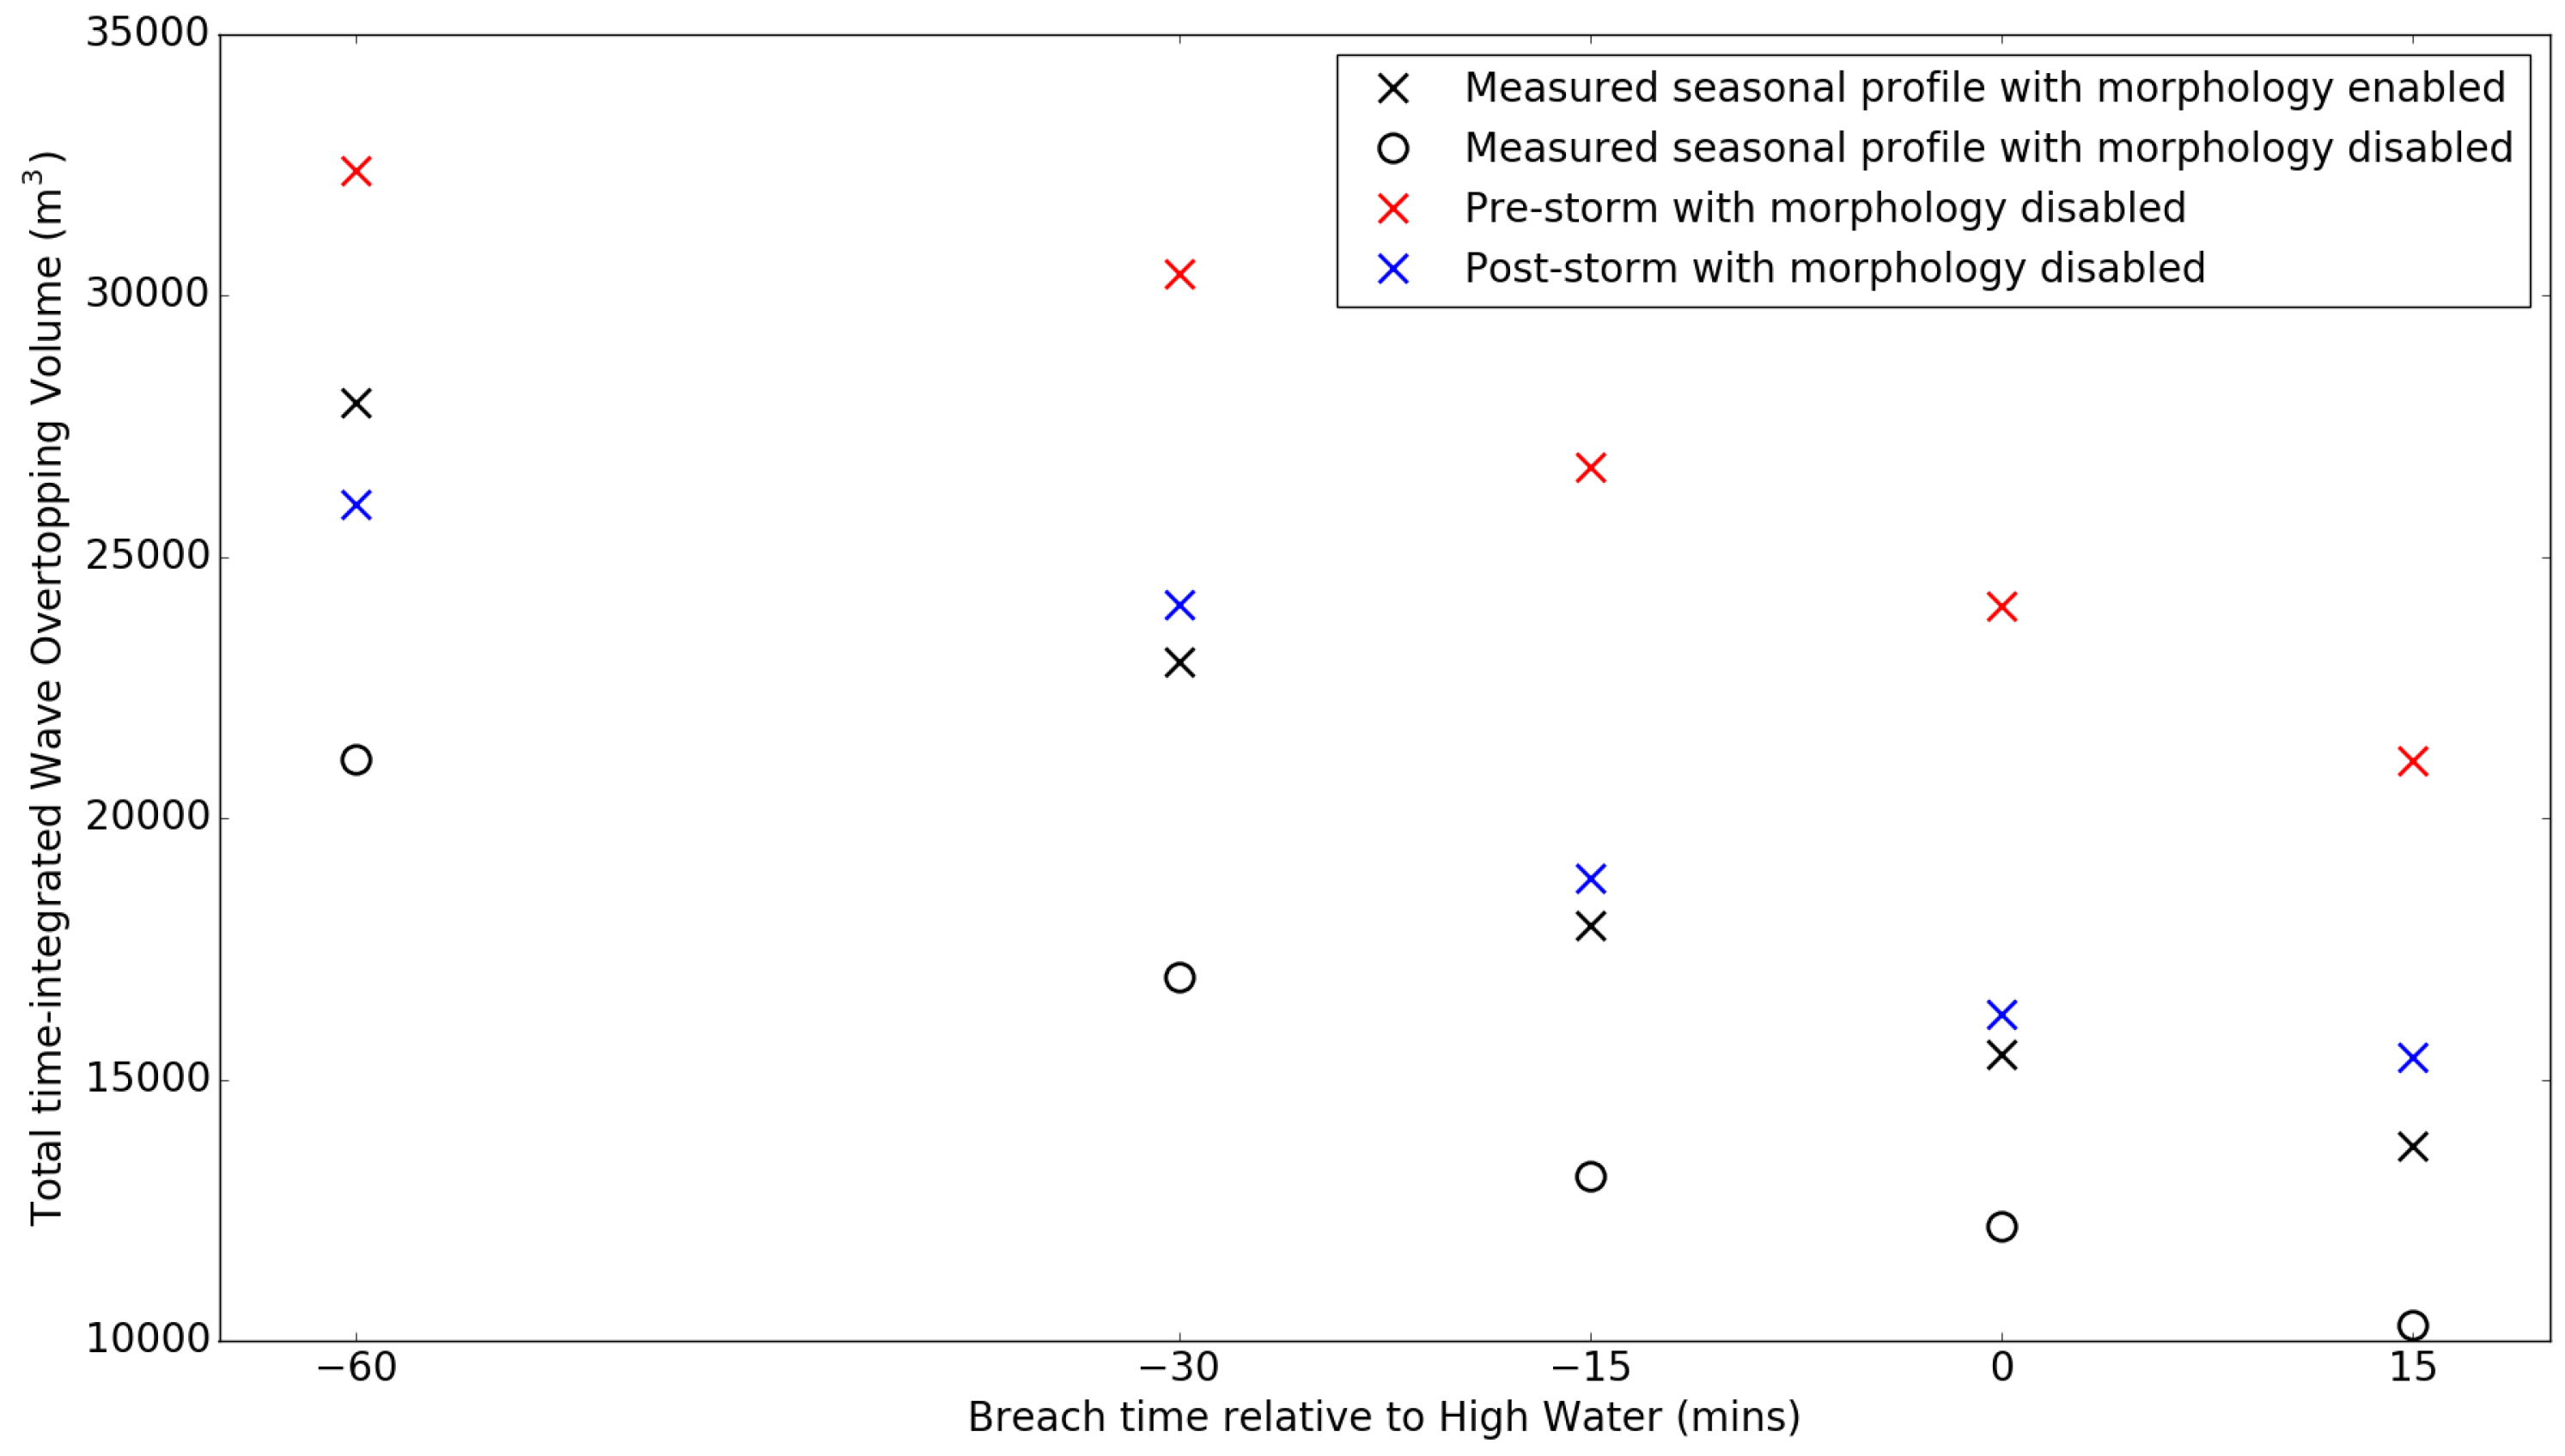
3.2. Beach Morphology under Sea Defence Breaching Scenarios
4. Discussion
4.1. Impact of Morphology on Controlling Wave Overtopping
4.2. Implications for Flood Modelling
4.3. Limitations of This Research
5. Conclusions
Acknowledgments
Author Contributions
Conflicts of Interest
References
- Wood, R.M.; Bateman, W. Uncertainties and constraints on breaching and their implications for flood loss estimation. Philos. Trans. R. Soc. Ser. A Math. Phys. Eng. Sci. 2005, 363, 1423–1430. [Google Scholar] [CrossRef] [PubMed]
- Van Heerden, I.L. The Failure of the New Orleans Levee System Following Hurricane Katrina and the Pathway Forward. Public Adm. Rev. 2007, 67, 24–35. [Google Scholar] [CrossRef]
- Bernitt, L.; Lynett, P. Breaching of sea dikes. In Proceedings of the 32nd Conference on Coastal Engineering (ICCE No 32), Shanghai, China, 30 June–5 July 2010.
- Jonkman, S.; Masskant, B.; Boyd, E.; Levitan, M. Loss of life caused by the flooding of New Orleans after Hurricane Katrina: Analysis of the relationship between flood characteristics and mortality. Risk Anal. Off. Publ. Soc. Risk Anal. 2009, 29, 676–698. [Google Scholar] [CrossRef] [PubMed]
- Risk Management Solutions (RMS). 1953 U.K. Floods: A 50-Year Retrospective; Technical Report; Risk Management Solutions, Inc.: Newark, CA, USA, 2003. [Google Scholar]
- Department for Environment Food and Rural Affairs (DEFRA). Flood Risks to People Phase 1, R & D Technical Report FD2317; Technical Report; Department for Environment Food and Rural Affairs: London, UK, 2003.
- Baxter, P.J. The east coast Big Flood, 31 January–1 February 1953: A summary of the human disaster. Philos. Trans. Ser. A Math. Phys. Eng. Sci. 2005, 363, 1293–1312. [Google Scholar] [CrossRef] [PubMed]
- Wright, L.D.; Short, A.D. Morphodynamic variability of surf zones and beaches: A synthesis. Mar. Geol. 1984, 56, 93–118. [Google Scholar] [CrossRef]
- He, Z.; Hu, P.; Zhao, L.; Wu, G.; Pähtz, T. Modeling of breaching due to overtopping flow and waves based on coupled flow and sediment transport. Water 2015, 7, 4283–4304. [Google Scholar] [CrossRef]
- Wright, L.D.; Short, A.D.; Green, M.O. Short-term changes in the morphodynamic states of beaches and surf zones: An empirical predictive model. Mar. Geol. 1985, 62, 339–364. [Google Scholar] [CrossRef]
- Loureiro, C.; Ferreira, Ó.; Cooper, J. Contrasting morphologic behaviour at embayed beaches in Southern Portugal. J. Coast. Res. 2009, 1, 83–87. [Google Scholar]
- Kanning, W.; van Baars, S.; van Gelder, P.H.A.J.M.; Vrijling, J.K. Lessons from New Orleans for the design and maintenance of flood defence systems. In Risk, Reliability and Societal Safety; Aven, T., Vinnem, J.E., Eds.; Taylor and Francis Group: London, UK, 2007. [Google Scholar]
- Vorogushyn, S.; Merz, B.; Apel, H. Development of dike fragility curves for piping and micro-instability breach mechanisms. Nat. Hazards Earth Syst. Sci. 2009, 9, 1383–1401. [Google Scholar] [CrossRef]
- Morris, M.W.; Hassan, M. Breach Formation through Embankment Dams & Flood Defence Embankments: A State of the Art Review, Impact Project Workshop (16–17 May 2002); Technical Report; HR Wallingford: Wallingford, UK, 2002. [Google Scholar]
- Smallegan, S.M.; Irish, J.L.; van Dongeren, A.R.; den Bieman, J.P. Morphological response of a sandy barrier island with a buried seawall during Hurricane Sandy. Coast. Eng. 2016, 110, 102–110. [Google Scholar] [CrossRef]
- Hawkes, P.; Gouldby, B. The Joint Probability of Waves and Water Levels: JOIN-SEA Version 1.0; HR Wallingford: Wallingford, UK, 1998. [Google Scholar]
- Prime, T.; Brown, J.M.; Plater, A.J. Flood inundation uncertainty: The case of a 0.5% annual probability flood event. Environ. Sci. Policy 2016, 59, 1–9. [Google Scholar] [CrossRef]
- Dawson, R.; Hall, J.; Sayers, P.; Bates, P.; Rosu, C. Sampling-based flood risk analysis for fluvial dike systems. Stoch. Environ. Res. Risk Assess. 2005, 19, 388–402. [Google Scholar] [CrossRef]
- Nicholls, R.; Mokrech, M.; Bates, P.; Dawson, R.; Hall, J. Assessing Coastal Flood Risk at Specific Sites and Regional Scales: Regional Assessment of Coastal Flood Risk; Technical Report 45; Tyndall Centre for Climate Change Research: Norwich, UK, 2005. [Google Scholar]
- Stanczak, G.; Oumeraci, H. Model for prediction of sea dike breaching initiated by breaking wave impact. Nat. Hazards 2011, 61, 673–687. [Google Scholar] [CrossRef]
- D′Eliso, C.; Oumeraci, H.; Kortenhaus, A. Breaching of Coastal Dikes: Reliability Analysis and Validation of the Model System; University of Florence: Florence, Italy, 2007; p. 44. [Google Scholar]
- Naulin, M.; Kortenhaus, A.; Oumeraci, H. Failure Probability of Flood Defence Structures/Systems in Risk Analysis for Extreme Storm Surges. Coast. Eng. 2010, 32, 1–15. [Google Scholar] [CrossRef]
- Wadey, M.P.; Nicholls, R.J.; Hutton, C. Coastal Flooding in the Solent: An Integrated Analysis of Defences and Inundation. Water 2012, 4, 430–459. [Google Scholar] [CrossRef]
- Gervais, M.; Balouin, Y.; Belon, R. Morphological response and coastal dynamics associated with major storm events along the Gulf of Lions Coastline, France. Geomorphology 2012, 143–144, 69–80. [Google Scholar] [CrossRef]
- Kobayashi, N.; Tega, Y.; Hancock, M.W. Wave reflection and overwash of dunes. J. Waterw. Port Coast. Ocean Eng. 1996, 122, 150–153. [Google Scholar] [CrossRef]
- Baldock, T.E.; Weir, F.; Hughes, M.G. Morphodynamic evolution of a coastal lagoon entrance during swash overwash. Geomorphology 2008, 95, 398–411. [Google Scholar] [CrossRef]
- McCall, R.T.; van Thiel de Vries, J.S.M.; Plant, N.G.; van Dongeren, A.R.; Roelvink, J.A.; Thompson, D.M.; Reniers, A.J.H.M. Two-dimensional time dependent hurricane overwash and erosion modeling at Santa Rosa Island. Coast. Eng. 2010, 57, 668–683. [Google Scholar] [CrossRef]
- McCall, R.T.; Masselink, G.; Poate, T.G.; Roelvink, J.A.; Almeida, L.P.; Davidson, M.; Russell, P.E. Modelling storm hydrodynamics on gravel beaches with XBeach-G. Coast. Eng. 2014, 91, 231–250. [Google Scholar] [CrossRef]
- Williams, J.J.; de Alegría-Arzaburu, A.R.; McCall, R.T.; van Dongeren, A. Modelling gravel barrier profile response to combined waves and tides using XBeach: Laboratory and field results. Coast. Eng. 2012, 63, 62–80. [Google Scholar] [CrossRef]
- Dissanayake, P.; Brown, J.; Karunarathna, H. Modelling storm-induced beach/dune evolution: Sefton coast, Liverpool Bay, UK. Mar. Geol. 2014, 357, 225–242. [Google Scholar] [CrossRef]
- Roelvink, D.; Reniers, A.; van Dongeren, A.; van Thiel de Vries, J.; McCall, R.; Lescinski, J. Modelling storm impacts on beaches, dunes and barrier islands. Coast. Eng. 2009, 56, 1133–1152. [Google Scholar] [CrossRef]
- Laudier, N.A.; Thornton, E.B.; MacMahan, J. Measured and modeled wave overtopping on a natural beach. Coast. Eng. 2011, 58, 815–825. [Google Scholar] [CrossRef]
- McCabe, M.; Stansby, P.; Apsley, D. Random wave runup and overtopping a steep sea wall: Shallow-water and Boussinesq modelling with generalised breaking and wall impact algorithms validated against laboratory and field measurements. Coast. Eng. 2013, 74, 33–49. [Google Scholar] [CrossRef]
- Prime, T.; Brown, J.M.; Plater, A.J. Physical and economic impacts of sea-level rise and low probability flooding events on coastal communities. PLoS ONE 2015, 10, e0117030. [Google Scholar] [CrossRef] [PubMed]
- Lichter, M.; Vafeidis, A.; Nicholls, R.; Kaiser, G. Exploring Data-Related Uncertainties in Analyses of Land Area and Population in the “Low-Elevation Coastal Zone” (LECZ). J. Coast. Res. 2011, 274, 757–768. [Google Scholar] [CrossRef]
- Coastal Engineering UK Ltd. Denbighshire County Council Coastal Defence Monitoring Inspection December 2013; Technical Report December; Coastal Engineering UK Ltd.: Thurstaston, UK, 2013. [Google Scholar]
- National Tidal and Sea Level Facility. Highest and Lowest Predicted Tides at Llandudno; The National Oceanography Centre: Southampton, UK, 2008. [Google Scholar]
- Wolf, J.; Brown, J.M.; Howarth, M.J. The wave climate of Liverpool Bay-observations and modelling. Ocean Dyn. 2011, 61, 639–655. [Google Scholar] [CrossRef]
- HR Wallingford. Conwy Tidal Flood Risk Assessment, Stage 1- Interim Report, Report EX 4667; Technical Report; HR Wallingford: Wallingford, UK, 2003. [Google Scholar]
- Buijs, F.; Simm, J.; Wallis, M.; Sayers, P. Performance and Reliability of Flood and Coastal Defences. R&D Technical Report FD2318/TR1; Technical Report; Department for Environment Food and Rural Affairs: London, UK, 2007.
- Parker, S. Flooding to Properties in Rhyl ( A548 Coast Road, Garford Road and Surrounding Areas) 5th December 2013; Technical Report; Denbighshire County Council: Denbigh, UK, 2014.
- Dissanayake, P.; Brown, J.; Karunarathna, H. Impacts of storm chronology on the morphological changes of the Formby beach and dune system, UK. Nat. Hazards Earth Syst. Sci. 2015, 15, 1533–1543. [Google Scholar] [CrossRef]
- DigitalGlobe. Google Earth Satellite Imagery—QGIS OpenLayers Plugin; DigitalGlobe: Longmont, CO, USA, 2016. [Google Scholar]
- Souza, A.J.; Brown, J.M.; Williams, J.J.; Lymbery, G. Application of an operational storm coastal impact forecasting system. J. Oper. Oceanogr. 2013, 6, 23–26. [Google Scholar] [CrossRef]
- Harley, M.D.; Valentini, A.; Armaroli, C.; Perini, L.; Calabrese, L.; Ciavola, P. Can an early-warning system help minimize the impacts of coastal storms? A case study of the 2012 Halloween storm, northern Italy. Nat. Hazards Earth Syst. Sci. 2016, 16, 209–222. [Google Scholar] [CrossRef]
- McMillan, A.; Batstone, C.; Worth, D.; Tawn, J.; Horsburgh, K.; Lawless, M. Coastal Flood Boundary Conditions for UK Mainland and Islands. Project SC060064/TR2: Design Sea Levels; Environment Agency: Bristol, UK, 2011.
- European Centre for Medium Range Weather Forecasts. IFS Documentation|ECMWF; European Centre for Medium Range Weather Forecasts: Reading, UK, 2016. [Google Scholar]
- Natural Resources Wales. Natural Resources Wales/Flood Risk Map; Natural Resources Wales: Cardiff, UK, 2015. [Google Scholar]
- Wadey, M.P.; Brown, J.M.; Haigh, I.D.; Dolphin, T.; Wisse, P. Assessment and comparison of extreme sea levels and waves during the 2013/14 storm season in two UK coastal regions. Nat. Hazards Earth Syst. Sci. 2015, 15, 2209–2225. [Google Scholar] [CrossRef]
- National Tidal and Sea Level Facility. Storm Surge Climatology: Wales; National Tidal and Sea Level Facility: Liverpool, UK, 2012. [Google Scholar]
- Scott, T.; Masselink, G.; Russell, P. Morphodynamic characteristics and classification of beaches in England and Wales. Mar. Geol. 2011, 286, 1–20. [Google Scholar] [CrossRef]
- Stansby, P.; Chini, N.; Apsley, D.; Borthwick, A.; Bricheno, L.; Horrillo-Caraballo, J.; Mccabe, M.; Reeve, D.; Rogers, B.D.; Saulter, A.; et al. An integrated model system for coastal flood prediction with a case history for Walcott, UK, on 9 November 2007. J. Flood Risk Manag. 2013, 6, 229–252. [Google Scholar] [CrossRef] [Green Version]
- Silveira, T.M.; Taborda, R.; Carapuço, M.M.; Andrade, C.; Freitas, M.C.; Duarte, J.F.; Psuty, N.P. Assessing the overwash regime along an embayed urban beach. Geomorphology 2016. Accepted. [Google Scholar] [CrossRef]
- Gallien, T.W. Validated coastal flood modeling at Imperial Beach, California: Comparing total water level, empirical and numerical overtopping methodologies. Coast. Eng. 2016, 111, 95–104. [Google Scholar] [CrossRef]
- Prime, T.; Brown, J.M.; Knight, P.J.; Plater, A.J. Sandscaping for Mitigating Coastal Flood and Erosion Risk to Energy Infrastructure on Gravel Shorelines: Dungeness Flood Risk Assessment; Technical Report Research & Consultancy Report No. 49; National Oceanography Centre: Southampton, UK, 2015. [Google Scholar]
- EDF Energy Nuclear Generation Ltd. (EDF). EU Stress Test—Dungeness B; EDF Energy Nuclear Generation Ltd.: Barnwood, UK, 2012. [Google Scholar]
- Wadey, M.P.; Haigh, I.D.; Nicholls, R.J.; Brown, J.M.; Horsburgh, K.; Carroll, B.; Gallop, S.L.; Mason, T.; Bradshaw, E. A comparison of the 31 January–1 February 1953 and 5–6 December 2013 coastal flood events around the UK. Front. Mar. Sci. 2015, 2. [Google Scholar] [CrossRef]


| Scenario | WL (m ODN) | (m) | Overtopping Volume (m3 per m) | Skew Surge above MHWST (m) |
|---|---|---|---|---|
| 1 | 4.56 | 5.00 | 8089 | 0.73 |
| 2 | 4.56 | 4.75 | 7701 | 0.73 |
| 3 | 4.80 | 4.00 | 9244 | 0.97 |
| 4 | 4.80 | 3.75 | 8755 | 0.97 |
© 2017 by the authors; licensee MDPI, Basel, Switzerland. This article is an open access article distributed under the terms and conditions of the Creative Commons Attribution (CC BY) license ( http://creativecommons.org/licenses/by/4.0/).
Share and Cite
Phillips, B.T.; Brown, J.M.; Bidlot, J.-R.; Plater, A.J. Role of Beach Morphology in Wave Overtopping Hazard Assessment. J. Mar. Sci. Eng. 2017, 5, 1. https://doi.org/10.3390/jmse5010001
Phillips BT, Brown JM, Bidlot J-R, Plater AJ. Role of Beach Morphology in Wave Overtopping Hazard Assessment. Journal of Marine Science and Engineering. 2017; 5(1):1. https://doi.org/10.3390/jmse5010001
Chicago/Turabian StylePhillips, Benjamin T., Jennifer M. Brown, Jean-Raymond Bidlot, and Andrew J. Plater. 2017. "Role of Beach Morphology in Wave Overtopping Hazard Assessment" Journal of Marine Science and Engineering 5, no. 1: 1. https://doi.org/10.3390/jmse5010001