Brief Report

Short-Term Nitrogen and Phosphorus Release during the Disturbance of Surface Sediments: A Case Study in an Urbanised Estuarine System (Gold Coast Broadwater, Australia)

1
Griffith School of Engineering, Gold Coast campus, Griffith University, QLD 4222, Australia
2
Catchment Management Unit, Gold Coast City Council, PMB 5042 Gold Coast Mail Centre, QLD 9729, Australia
3
Environmental Futures Centre, Gold Coast campus, Griffith University, QLD 4222, Australia
*
Author to whom correspondence should be addressed.
Present address: RPS APASA Pty Ltd, P.O. Box 5692 Gold Coast Mail Centre, QLD 9726, Australia
Present address: Centre for Tropical Water and Aquatic Ecosystem Research (TropWATER), James Cook University, QLD 4811, Australia
§
Present address: Monash Sustainability Institute, Monash University, VIC 3168, Australia
J. Mar. Sci. Eng. 2017, 5(2), 16; https://doi.org/10.3390/jmse5020016
Submission received: 16 January 2017 / Revised: 14 March 2017 / Accepted: 4 April 2017 / Published: 7 April 2017

Abstract

:
Understanding the effects of sediment disturbances on nutrient loadings is important for the management of estuarine settings. This study investigated the initial influence of sediment disturbance on water column nutrient concentrations in a shallow estuarine setting within the Gold Coast Broadwater, using a laboratory-based approach. Undisturbed sediment cores (200 mm Ø × 330 mm length, plexiglass) were incubated before and after being subjected to a disturbance event, to investigate the effect on the immediate and subsequent short-term water column nutrient concentrations. Sediment NH4+bio and PO43−bio concentrations ranged from 150 to 478 and 1.50 to 8.56 nmol g−1 dry wt, respectively. Water column NH4+ concentrations underwent the greatest increase (>1000% or approx. 14 times greater) immediately following disturbance, with mean effluxes increasing by >300%. Thereafter, water column NH4+ concentrations and efflux rates declined to near initial pre-disturbance concentrations. Water column NH4+ concentrations accounted for 0.58%–5.50% of the depth-integrated sediment NH4+bio concentration, indicating mobilization of the sediment bound exchangeable NH4+. The observed changes in PO43− concentrations and fluxes were much lower in comparison to those observed for N-species. Following disturbance, increases in the water column PO43− concentration accounted for 7.16%–8.22% depth-integrated sediment bioavailable PO43− at +1 and +2 hours, and 5.65% at +7 hours, respectively. These results provide important insight into the potential implications of disturbance events, such as vessel activities and dredging operations, within the case study region, providing information for potential management options and relevant water quality concerns.

1. Introduction

Estuarine surface sediments typically accumulate high loads of organic matter and are therefore regions of intense microbial activity and nutrient cycling. They are often characterised by high concentrations of soluble nitrogen and phosphorus from the remineralisation of deposited organic matter and anthropogenic sources [1,2], becoming additional nutrient sources to overlying waters [3]. This exchange of nutrients across the sediment water interface (SWI) modifies both sediment nutrient pools (pore water, exchangeable/adsorbed, and strongly bound) and water column conditions [4,5]. Three key processes for the exchange of nutrients across the SWI are: the passive diffusion of solutes, biota-mediated transport (bioirrigation, bioturbation, and bioresuspension [6]), and the physical disturbance and resuspension of sediment [7,8]. Disturbance and resuspension events may occur under natural circumstances (e.g., tidal currents and wave induced; [9]), but also as a result of anthropogenic activities such as vessel movement (e.g., vessel wake and propeller wash) and mooring, and dredging practices [10,11]. These anthropogenic activities can induce negative impacts on the water quality, altering suspended sediment and nutrient loadings [10,12,13,14], in addition to modifying the biology of fauna present in bottom sediments [15], as well as water column communities [11,16].
Sediment resuspension often leads to increases in water column nutrient concentrations through the mixing of formerly interstitial waters with the overlying water column and the desorption of nutrients from the resuspended particles or release from dissolving minerals [17,18]. Furthermore, resuspension potentially increases the rates of remineralisation by the bacteria attached to the benthic particles that are released into the water column upon exposure to higher oxygen concentrations [19]. Although it is difficult to estimate the proportion of nutrients that will be transferred between the sediment, sourced from a system of interest, and overlying water during sediment disturbance and resuspension events, estimates of the exchangeable concentrations in sediment slurries in laboratory holding tanks can be estimated. Given the potential for adverse effects of disturbed and resuspended sediments on nutrient loadings within estuarine settings, an understanding of nutrient release processes, influencing factors, and resultant nutrient loads, is important for the sustainable management of an ecologically and economically important estuarine seascape. To date, studies relating to the effects of vessel- and dredge-induced resuspension on suspended sediment and nutrient dynamics include both laboratory-based (closed system; e.g., [11,14] and field-based approaches (open system; e.g., [10,12]). In both cases, these experiments report increases in suspended sediment concentrations and/or water column nutrient concentrations, which vary in magnitude and duration according to influencing factors such as disturbance depth, frequency, intensity, and pre- and post-disturbance sediment and hydrodynamic conditions, e.g., [10,11,12,13,14,20,21,22].
The objective of this study was to investigate the initial influence of the disturbance and resuspension of estuarine sediment on water column nutrient concentrations using laboratory-based sediment incubations. This case study focuses on sediments and waters directly collected from a shallow urbanised estuarine waterbody within the Gold Coast Broadwater (Australia), Saltwater Creek, a system that experiences, and is likely to be subjected to increasing future, anthropogenic sediment disturbance events [23]. This data contributes to the body of works used to evaluate future sediment disturbances in shallow estuarine settings.

2. Materials and Methods
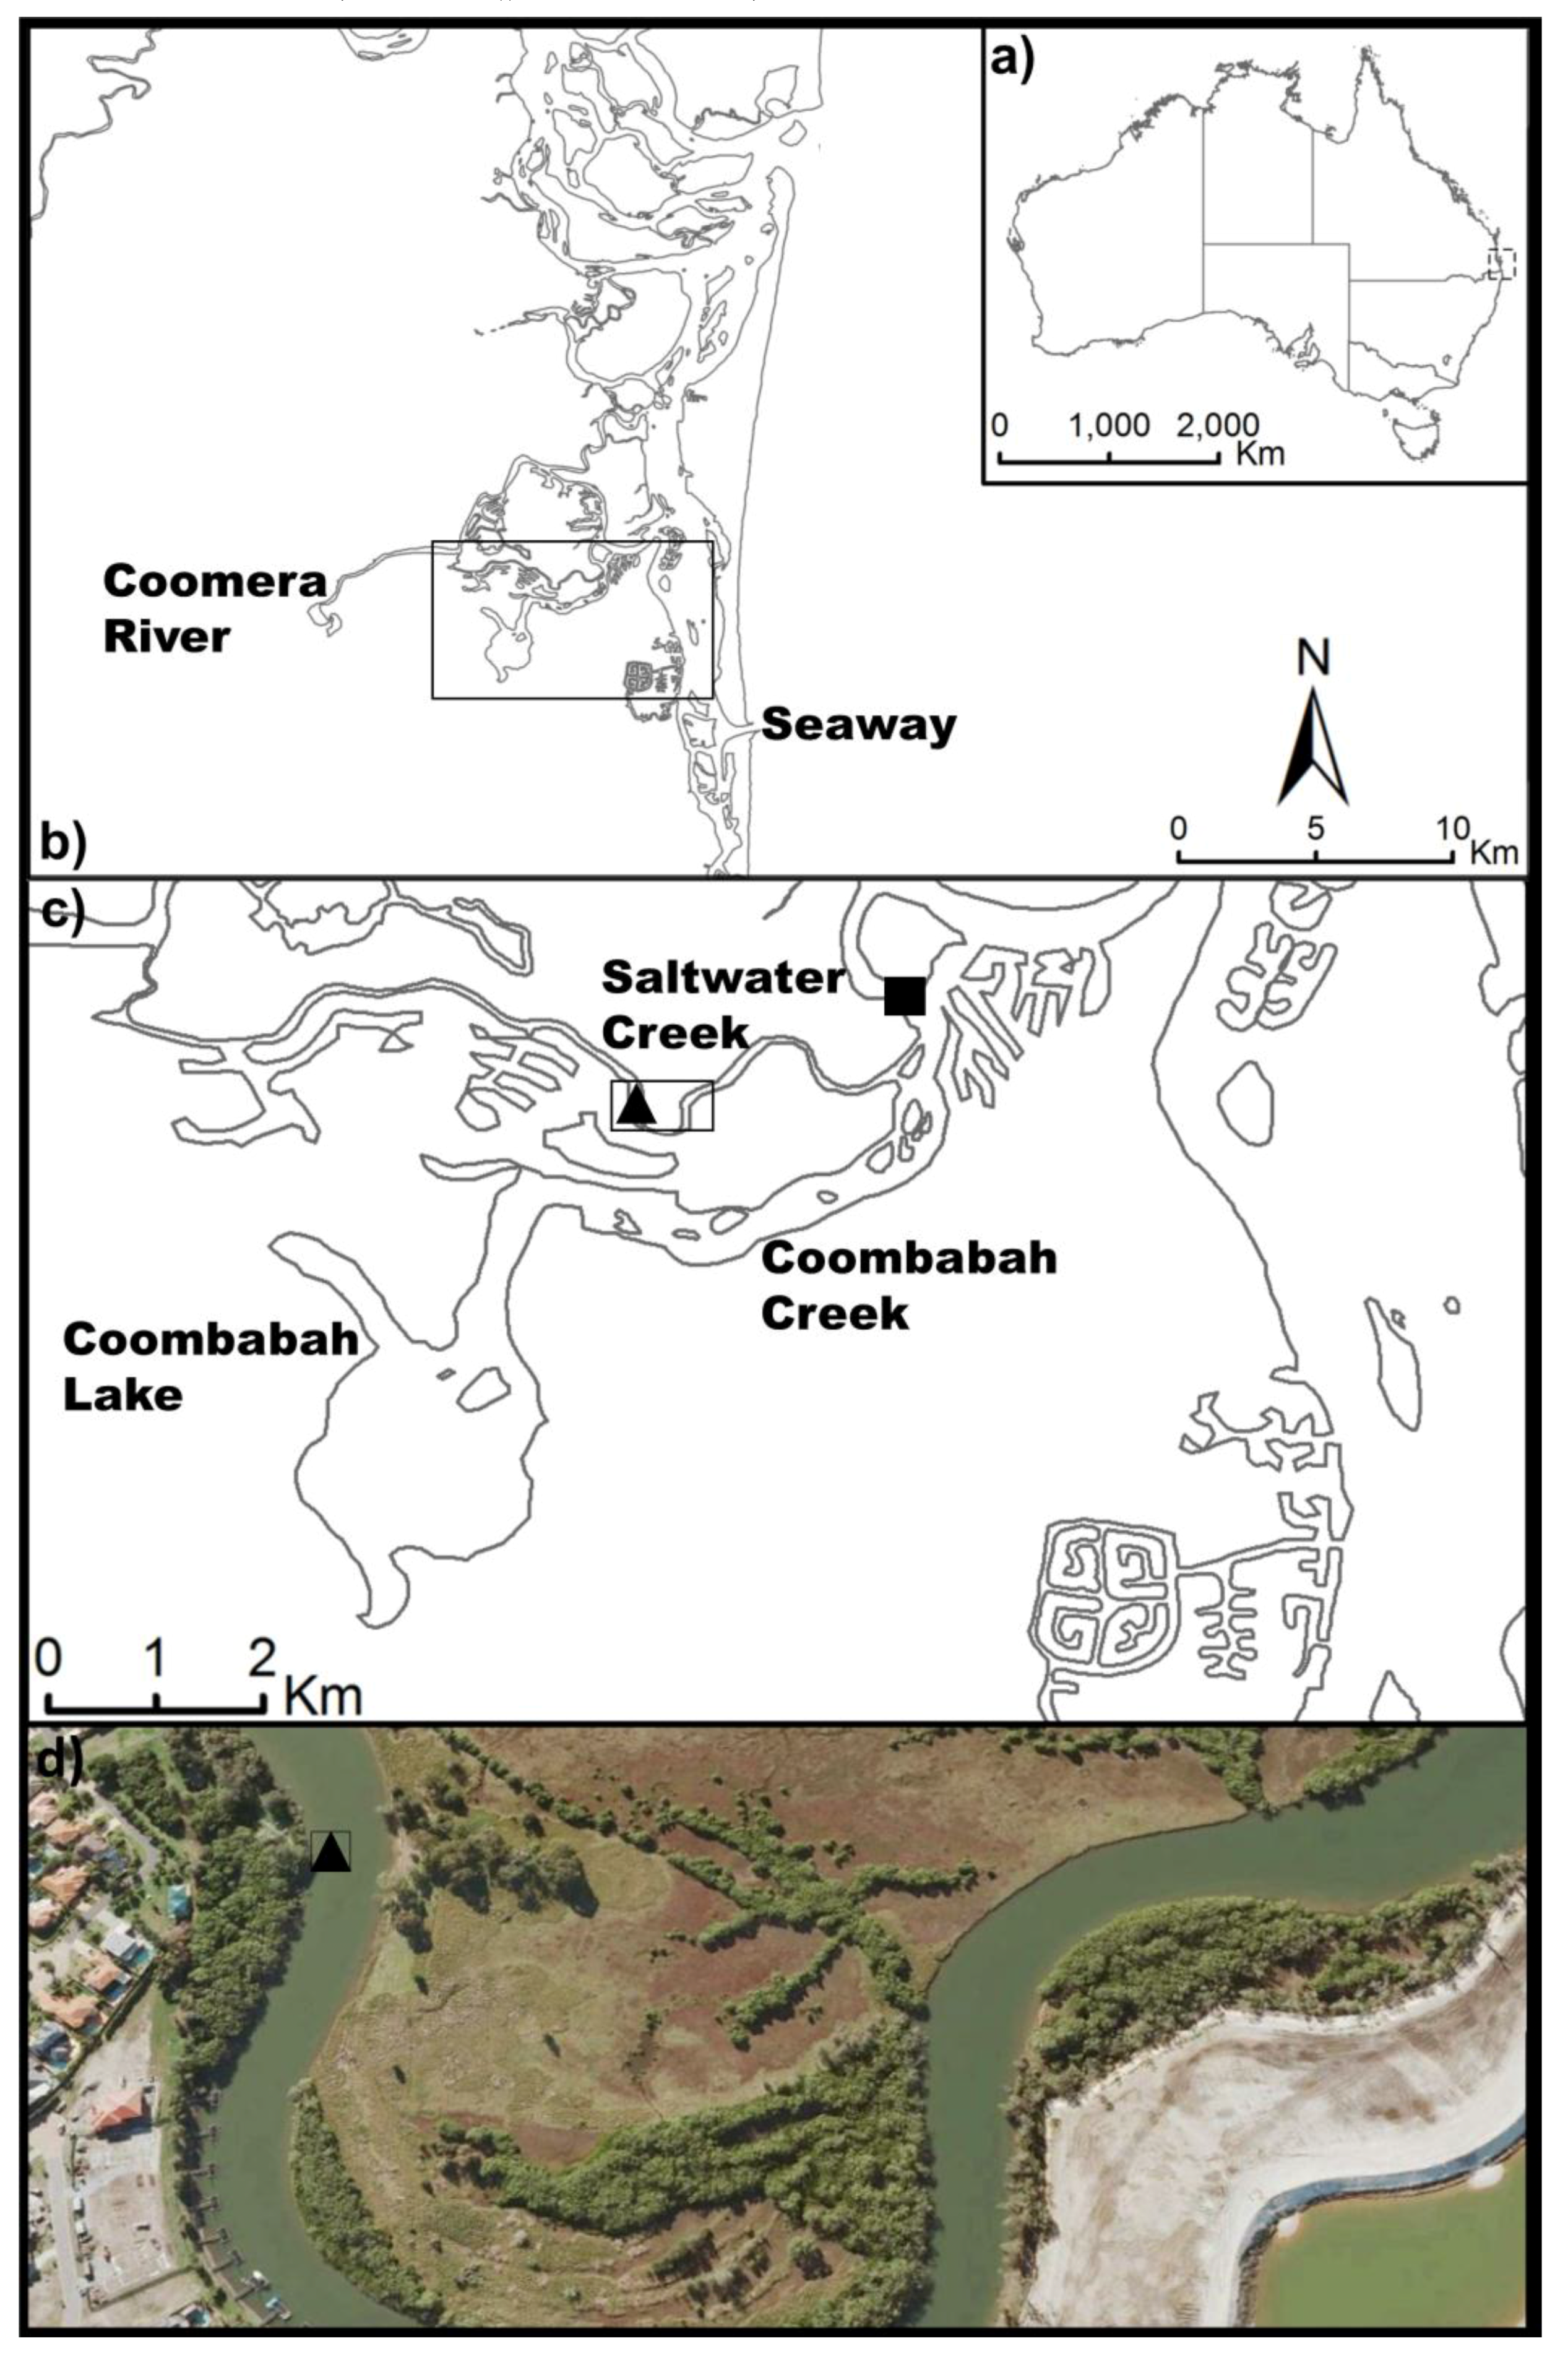
2.1. Study Location

Saltwater Creek is an urbanised stream and estuary located on the Gold Coast (Australia). The creek is approximately 17 km long, flowing from its headwaters in the Nerang State Forest to the Gold Coast Broadwater [24] (Figure 1). The average width of the creek is 30 m, with the depth of the first 3 km typically 3 m (below mean sea level), with the remaining upstream region of the creek typically 1 m in depth [25]. Freshwater flow from the catchment is only significant after periods of rainfall. Thunderstorms, common during the summer period (November–January), often result in intense short periods of catchment freshwater flow. The creek experiences a wide range of hydrodynamic conditions, and sediment and nutrient loadings, according to inflow conditions [23,25,26,27], which are complicated by interactions with the Coomera River system, via a small anabranch [26]. The creek is characterised by a tidal amplitude of <1 m [26] and tidal asymmetry, where flood tides have a greater velocity but shorter duration than that of the ebb tide [28]. Salinity profiles indicate that the system is predominantly well mixed [28].
The estuarine zone of the creek is turbid [23,28], although it varies from a relatively clean mouth to having intermittently highly turbid upper reaches [26]. Catchment runoff and biological activity are known sources of increased sediment loadings, whilst natural sediment resuspension has been identified as playing a lesser role [26]. The suspended sediment concentrations along the estuarine zone range from approx. 20–30 mg L−1 and 80–300 mg L−1 during periods without and with rainfall (high tide period), respectively [27]. Furthermore, seasonal NOx and NH4+ water column concentrations range between 0.5–34 µmol L−1 and 0.4–7.4 µmol L−1, respectively, with rainfall events increasing the nutrient concentrations [27].
Bottom surface sediments along the estuarine zone of the creek are characterised by <63 µm and 63–180 µm size fractions, accounting for a combined contribution of up to 90% of the total particle size distribution [27]. The mineralogy of the surrounding intertidal and subtidal surface sediments of the area is dominated by halite, quartz, anorthite, and kaolinite [29]. Additionally, Dunn et al. [27] report sediment NH4+bio concentrations ranging from approx. 200–240 nmol g dry wt−1 and surface sediments to typically be net sources of dissolved inorganic nitrogen to the overlying water [27].
Bioturbating fauna (e.g., worm (Simplisetia aequisetis), amphipod (Victoriopisa australiensis), and crab (Heloecius cordiformis)) occur within the surface sediments, with V. australiensis accounting for up to 45% of the bioturbating macrofaunal density at the sediment collection site [27].
Saltwater Creek and its adjoining waterways have high recreation and amenity values, serving as a major access route for residents of adjoining residential canal estates and providing an entry point for vessels into the Coomera River (Figure 1). A dredging program has been previously conducted in Saltwater Creek to restore navigation passage depths; however, concerns have been raised regarding ongoing access and use of the creek without routine maintenance dredging to maintain channel depths.
Due to considerable urban development/expansion in the catchment, combined with the utility of Saltwater Creek and adjoining waterways as an important fish habitat, the system has been the focus of recent scientific investigation and management intervention (e.g., [23,25,26,27,28,30]).

2.2. Sample Collection

Sediment and water was collected in May 2008, 2 km from the mouth of Saltwater Creek (Figure 1), corresponding to site 1 in Dunn et al. [27]. The site sampled represents a section of Saltwater Creek that receives recreational vessel traffic and has been dredged in the past. Three intact cores (70 mm Ø × 800 mm length, PVC) were collected within a 10 × 10 m area from an intertidal-subtidal location, to determine the wet-bulk density, porosity, organic matter determined as loss-on-ignition (LOI550), grain size distribution, bioavailable ammonium concentrations (NH4+bio; porewater + exchangeable NH4+), and sediment bioavailable phosphate concentrations (PO34−bio; porewater + exchangeable PO43−). Upon collection, cores were immediately sliced into eight depth horizons (0–1, 1–2, 2–4, 4–6, 6–10, 10–20, 20–40, >40 cm) and stored in the dark (<4 °C) before freezing within two hours of collection.
To investigate the effects of sediment disturbance and resuspension on nutrient mobilization and water column NOx, NH4+, and PO43− concentrations, six undisturbed sediment cores (200 mm Ø × 330 mm length, plexiglass) were collected from the above mentioned intertidal-subtidal location at low tide, to facilitate ease of core collection, and were relocated to the laboratory. The depth of sediment contained within each core was 160 ± 10 mm. The sediment surface within each core was generally smooth, uniformly horizontal, and void of visible debris. The sediment collection area was considered typical of sediments which would undergo disturbance and resuspension events, such as those created by vessel propeller wash, or dredging operations, due to the close proximity to vessel mooring structures adjacent to private residencies and the downstream positioning from the canal estates.
Additionally, water samples were collected using acid washed (10% v/v HCl) low density polyethylene (LDPE) bottles (Nalgene), to determine dissolved inorganic and total dissolved nitrogen and phosphorus concentrations, and total suspended sediment (TSS) concentrations. Nutrient samples were immediately filtered through pre-washed, pre-ashed 25 mm Ø GF/F (pore size ≡ 0.7 µm) filters and were frozen until analysed. Suspended solids were collected by filtration onto pre-washed, pre-ashed, and pre-weighed 47 mm Ø GF/F filters. Nutrient samples were frozen (−20 °C) whilst awaiting analysis. In situ physicochemical water column parameters were measured using a calibrated multi-probe unit (TPS 90-FLMV, TPS, Brisbane, Australia).
In addition, a large volume (>500 L) of site water from Saltwater Creek was collected during the flood tide phase on the day of sediment collection to facilitate maintenance and incubation of sediment cores before and during the sediment disturbance and resuspension event, and all subsequent incubation sampling events.

2.3. Sediment Resuspension Flux Measurements

Following collection, cores were returned to the laboratory within two hours of collection, carefully filled with creek water, and submerged in holding tubs for equilibration, according to the methods described in Dunn et al. [27]. Following the equilibration period, water in the holding tanks was replaced with fresh site water and the cores were re-equilibrated for two hours before incubations commenced. To initiate incubations, water levels were lowered in the holding tubs, giving an overlying water depth of ~120 mm (equivalent to ~3.7 L) within each replicate core, resulting in a large volume ratio of sediment to water of approximately 1.4:1. Sediments were initially incubated in dark conditions without disturbance to the SWI, before being subjected to a simulated sediment disturbance and resuspension event, to investigate the change in short-term water column nutrient concentrations and fluxes. Nutrient fluxes were determined following water sample collection -2 and -0.5 hours prior to sediment disturbance (incubation 1), immediately following sediment disturbance (0 hours), +1 hour following disturbance (incubation 2), +2 and +3 hours following disturbance (incubation 3), and +6 and +7 hours following disturbance (incubation 4), respectively. All flux incubations were conducted in dark conditions. Cores were closed during incubations using a floating plastic lid and the water was maintained at a temperature of 22 ± 1 °C following the protocols described in [27]. In between each time series incubation event, additional creek water was carefully added to the pre-existing incubation core waters in order to fully submerge the cores within the holding tank.
Following the initial flux incubation (representing typical conditions prior to sediment disturbance), the entire sediment within each core was mechanically mixed (i.e., sediments overturned with the overlying water) using a manual stirring rod over a 2–3-minute period, simulating a sediment disturbance and resuspension event. Water samples were collected from each core immediately following the sediment disturbance and resuspension to initiate the initial flux determination, and thereafter at the beginning and end of the subsequent flux incubations.
Flux rates were estimated from the difference in individual solute concentrations in the initial and final water samples:
Fx = (((CfCi) × V)/A × t) × 10000
where Fx is the flux of the dissolved species x (µmol m−2 h−1); Cf and Ci are the final and initial concentrations of x (µmol L−1), respectively; V is the volume of water in the core (L); A is the sediment surface area within the core (cm2); and t is the incubation time (h).
Additionally, the percentage change (Δ) in water column nutrient and TSS concentrations was calculated as:
% change = (([X]t − [X]ti)/[X]ti) × 100
where [X]t is the water column nutrient or TSS concentration at time t and [X]ti is the water column nutrient or TSS concentration at time i.

2.4. Sample Handling and Analytical Techniques

The sediment wet-bulk density, porosity, and LOI550 were determined following the techniques described in Dunn et al. [31]. The proportion of clay and silt (<63 µm), sand (180 < x > 63 µm), and gravel (>180 µm) fractions were determined by dry sieving and are expressed as the percent of dry weight. Sediment NH4+bio and PO43−bio concentrations were determined following the extraction of 1 cm3 of homogenised sediment for 24 hours in 9 mL 2 M KCl and 1 M MgCl2, respectively, as outlined in [32] and [33], respectively.
During sediment incubations, water samples were collected using acid washed and Milli-Q element water rinsed 60 mL plastic syringes and tubing. Nutrient samples were filtered through 25 mm Ø GF/F (pore size ≡ 0.7 µm) filters and were frozen (−20 °C) until analysis.
Concentrations of water column NO2 NO3, NH4+, PO43−, and extracted bioavailable NH4+ and PO43− concentrations were determined using an automated nutrient analyser (Easychem Plus Random Access Analyzer; Systea Analytical Technologies, Anagni, Italy), incorporating standard colorimetric analyses. Deionised (Milli-Q Element) water and filtered low nutrient seawater were used for all sample preparation and analyses. Natural filtered seawater certified reference materials produced by the National Low Level Nutrient Collaborative Trials, in addition to laboratory standards, were used for quality assurance purposes. The total suspended sediment (mg L−1) concentrations were determined gravimetrically.

2.5. Data Presentation and Statistical Analysis

Physicochemical sediment data, water column parameters, and nutrient flux rates are reported as mean ± standard deviation. Estimates of sediment-water column nutrient fluxes (µmol m−2 h−1) and sediment depth profiles of bioavailable nutrients are utilised to investigate the potential release of nutrients following sediment disturbance within the estuarine sediments of Saltwater Creek. Comparisons of physicochemical parameters of the various depth horizons were performed by ANOVA and the means were compared using Tukey’s HSD analysis. Pearson correlations were used to identify relationships between physicochemical sediment parameters of the various depth horizons. The significance of observed differences between TSS and dissolved inorganic nutrient concentrations, and nutrient flux rates before and following the sediment disturbance and resuspension event (n = 6), was calculated with a paired t-test. Normality was tested using the Kolmogorov-Smirnov test, and adjusted as necessary to satisfy the ANOVA assumptions. The total suspended sediments, dissolved inorganic nutrient concentrations, and flux rates following the resuspension event, were compared by ANOVA using SPSS for Windows (version 19, SPSS Inc., Chicago, IL, USA).

3. Results and Discussion

3.1. Background Sediment and Water Column Conditions

Depth profiles of the surface sediment properties are presented in Table 1. Grain sizes between 63–180 µm were predominant, accounting for 51.3% to 63.2% of the total sediment mass at each depth. The contribution of fine grained sediments (<63 µm) ranged from 24.1% to 36.7%, being greatest in the upper 1–2 cm depth horizon. No other discernible trends in grain size distributions with depth were evident. The sediment density and porosity values ranged from 1.37 to 1.78 g cm−3 and 64.2% to 76.1%, respectively. Wet-bulk densities and porosity values demonstrated typical vertical profiles, where the density increases and the porosity decreases with depth [34].
Sediment NH4+bio and PO43−bio concentrations ranged from 150 to 478 and 1.50 to 8.56 nmol g−1 dry wt, respectively. NH4+bio concentrations were greater in the upper-most surface sediments (0–1 cm), exhibiting concentrations two-fold greater than those measured at any other depth, with a further decrease in concentrations below a 10 cm depth. Similarly, PO43−bio concentrations were significantly greater (F = 17.069, p = 0.006) in the upper sediments (0–10 cm) compared to the deeper sediments below a 10 cm depth. Concentrations corresponded to those previously observed within the sediments of Saltwater Creek and neighbouring estuarine systems [5,27,28,31]. Sediment organic matter (LOI550) was greatest in the surface 0–2 cm depth horizon and decreased with depth thereafter (Table 1). Sediment bioavailable nutrient concentrations were significantly correlated with sediment density (PO43−bio; r = 0.922, p = 0.001), porosity (NH4+bio; r = 0.919, p = 0.001, PO43−; r = 0.868, p = 0.005), and LOI550 (PO43−; r = 0.726, p = 0.041) (Table 2).
In situ water column dissolved nutrient concentrations measured from water samples obtained during flood tide conditions were: 0.59 ± 0.15 µmol L−1 for NO3, 0.81 ± 1.18 µmol L−1 for NOx, 0.54 ± 0.22 µmol L−1 for NH4+, and 0.34 ± 0.14 µmol L−1 for PO43−, which correspond to the ranges previously reported for Saltwater Creek and adjoining waters [5,27,28,29,30]. The mean in situ TSS concentrations during the flood tide conditions were 24 ± 5.3 mg L−1. The snapshot survey of the in situ physicochemical parameters revealed that the values were: 7.8 ± 0.2 pH, 28.1‰ ± 0.1‰ salinity, 24.3 ± 0.2 °C temperature, and 85.0% ± 2.3% saturation for dissolved oxygen. These parameters have been demonstrated to vary considerably within Saltwater Creek according to location and rainfall runoff [25,26,27,28].

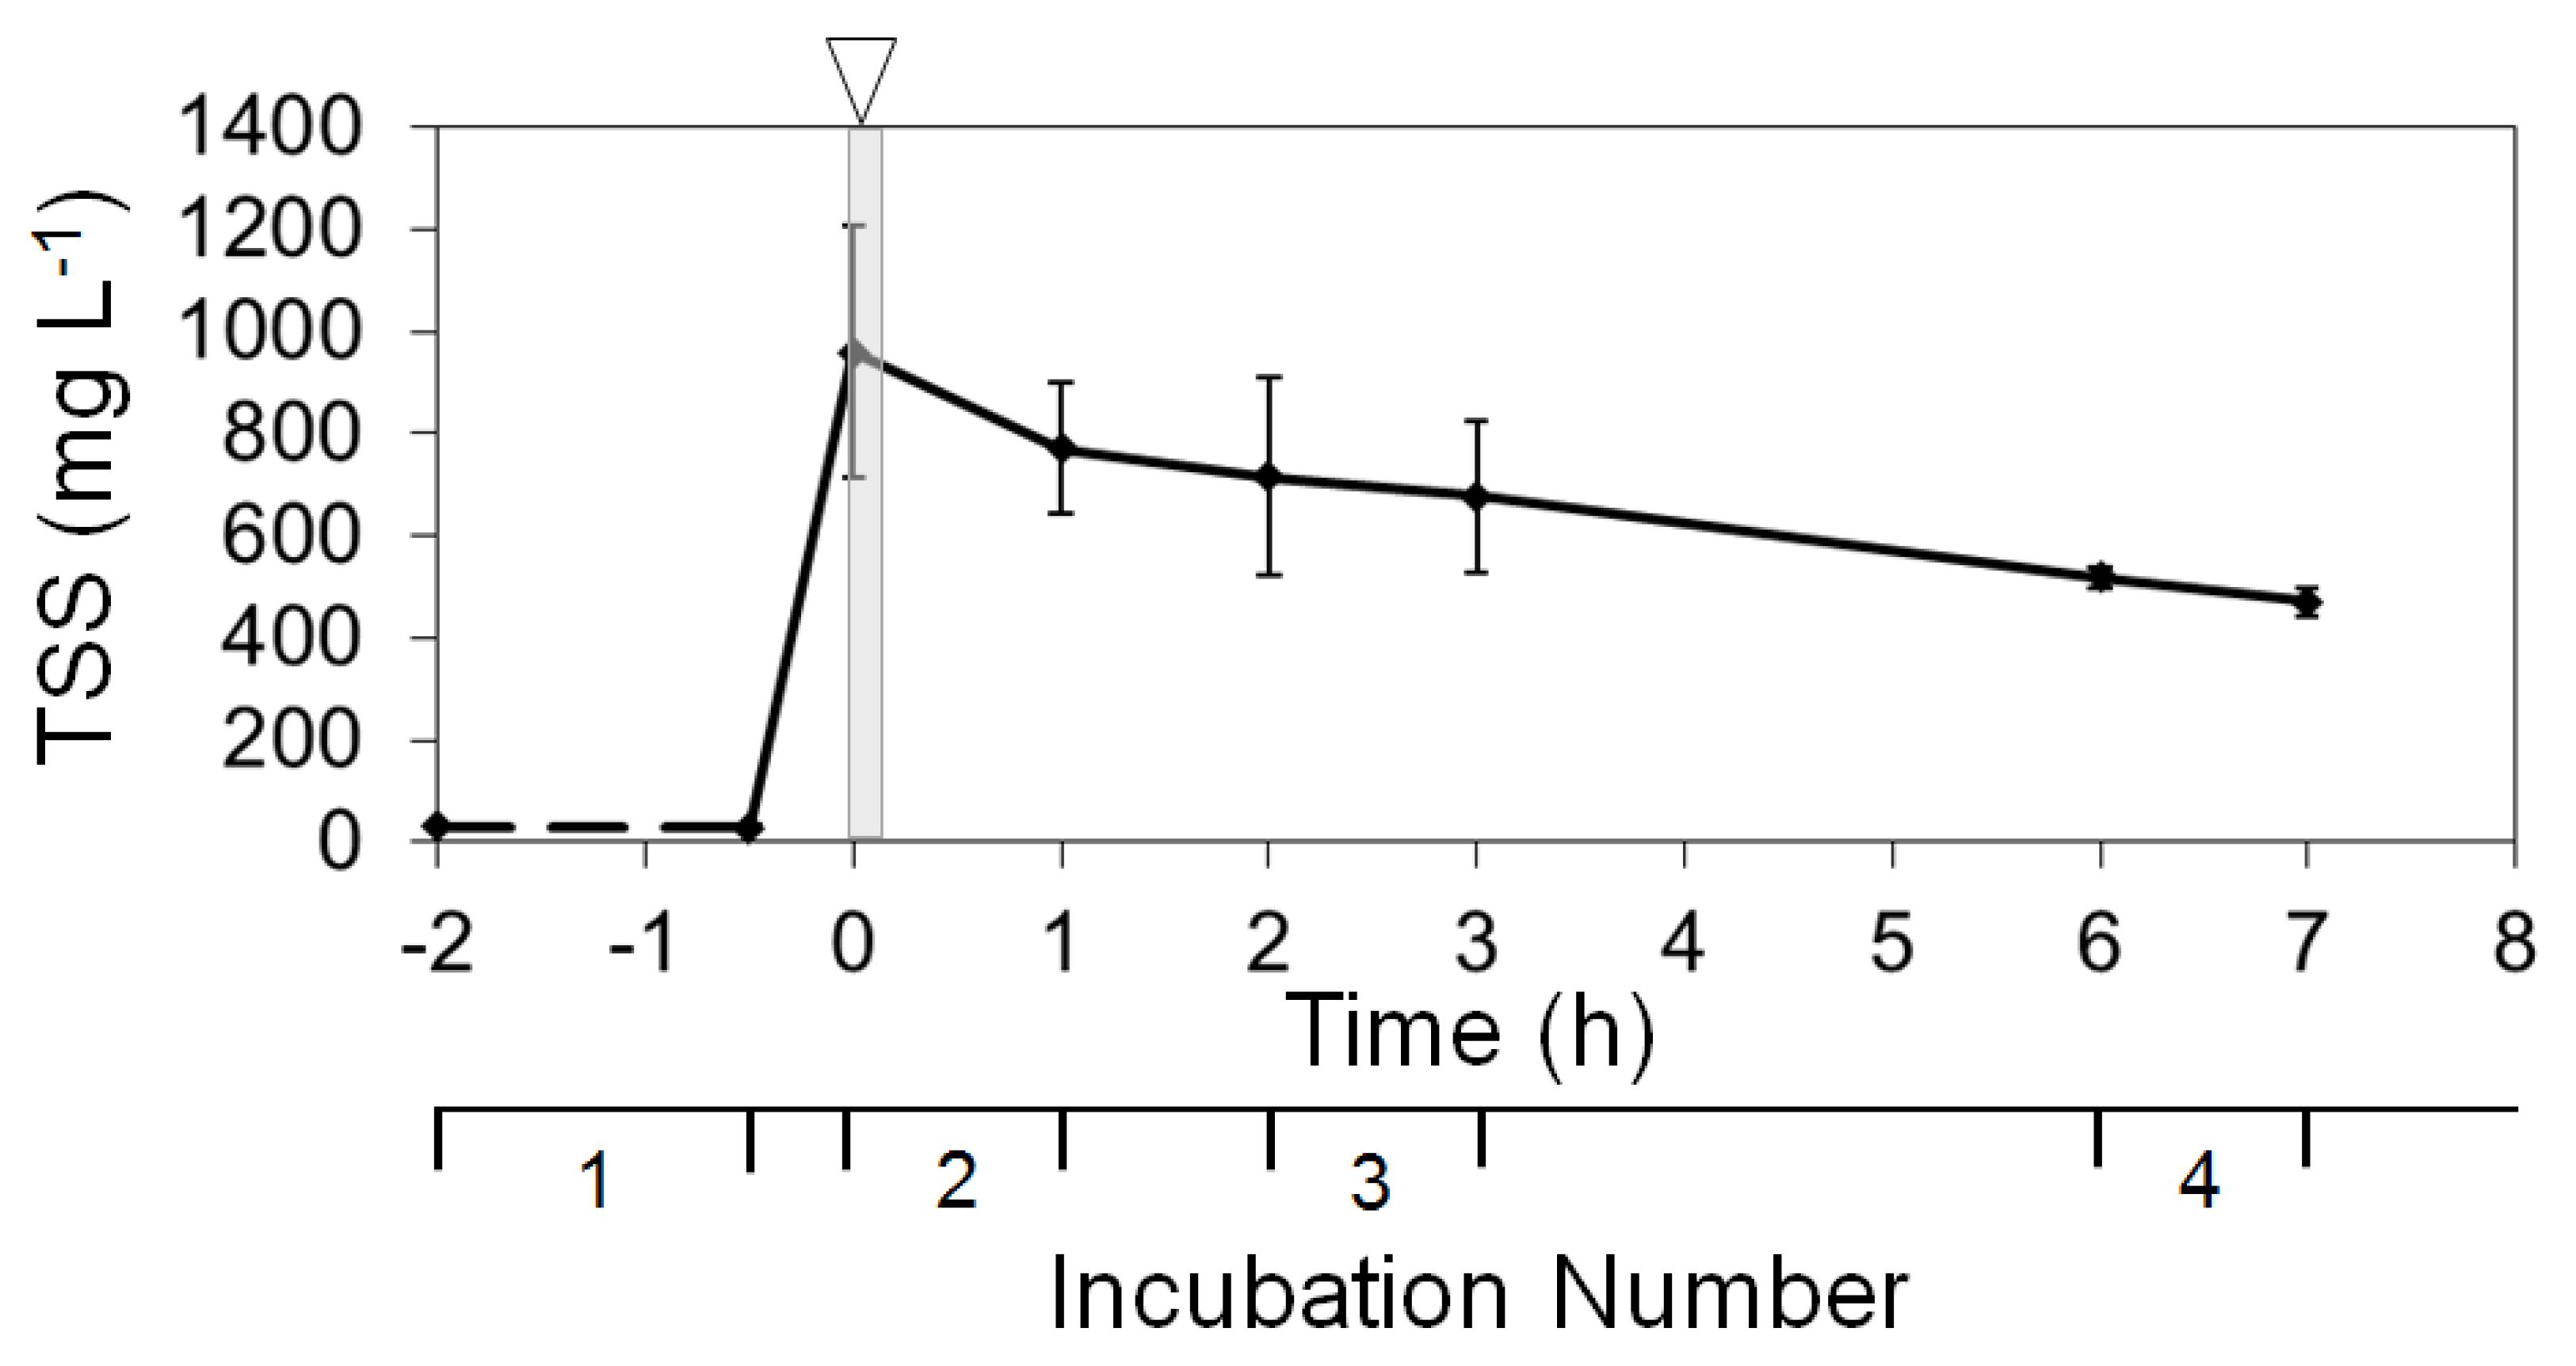
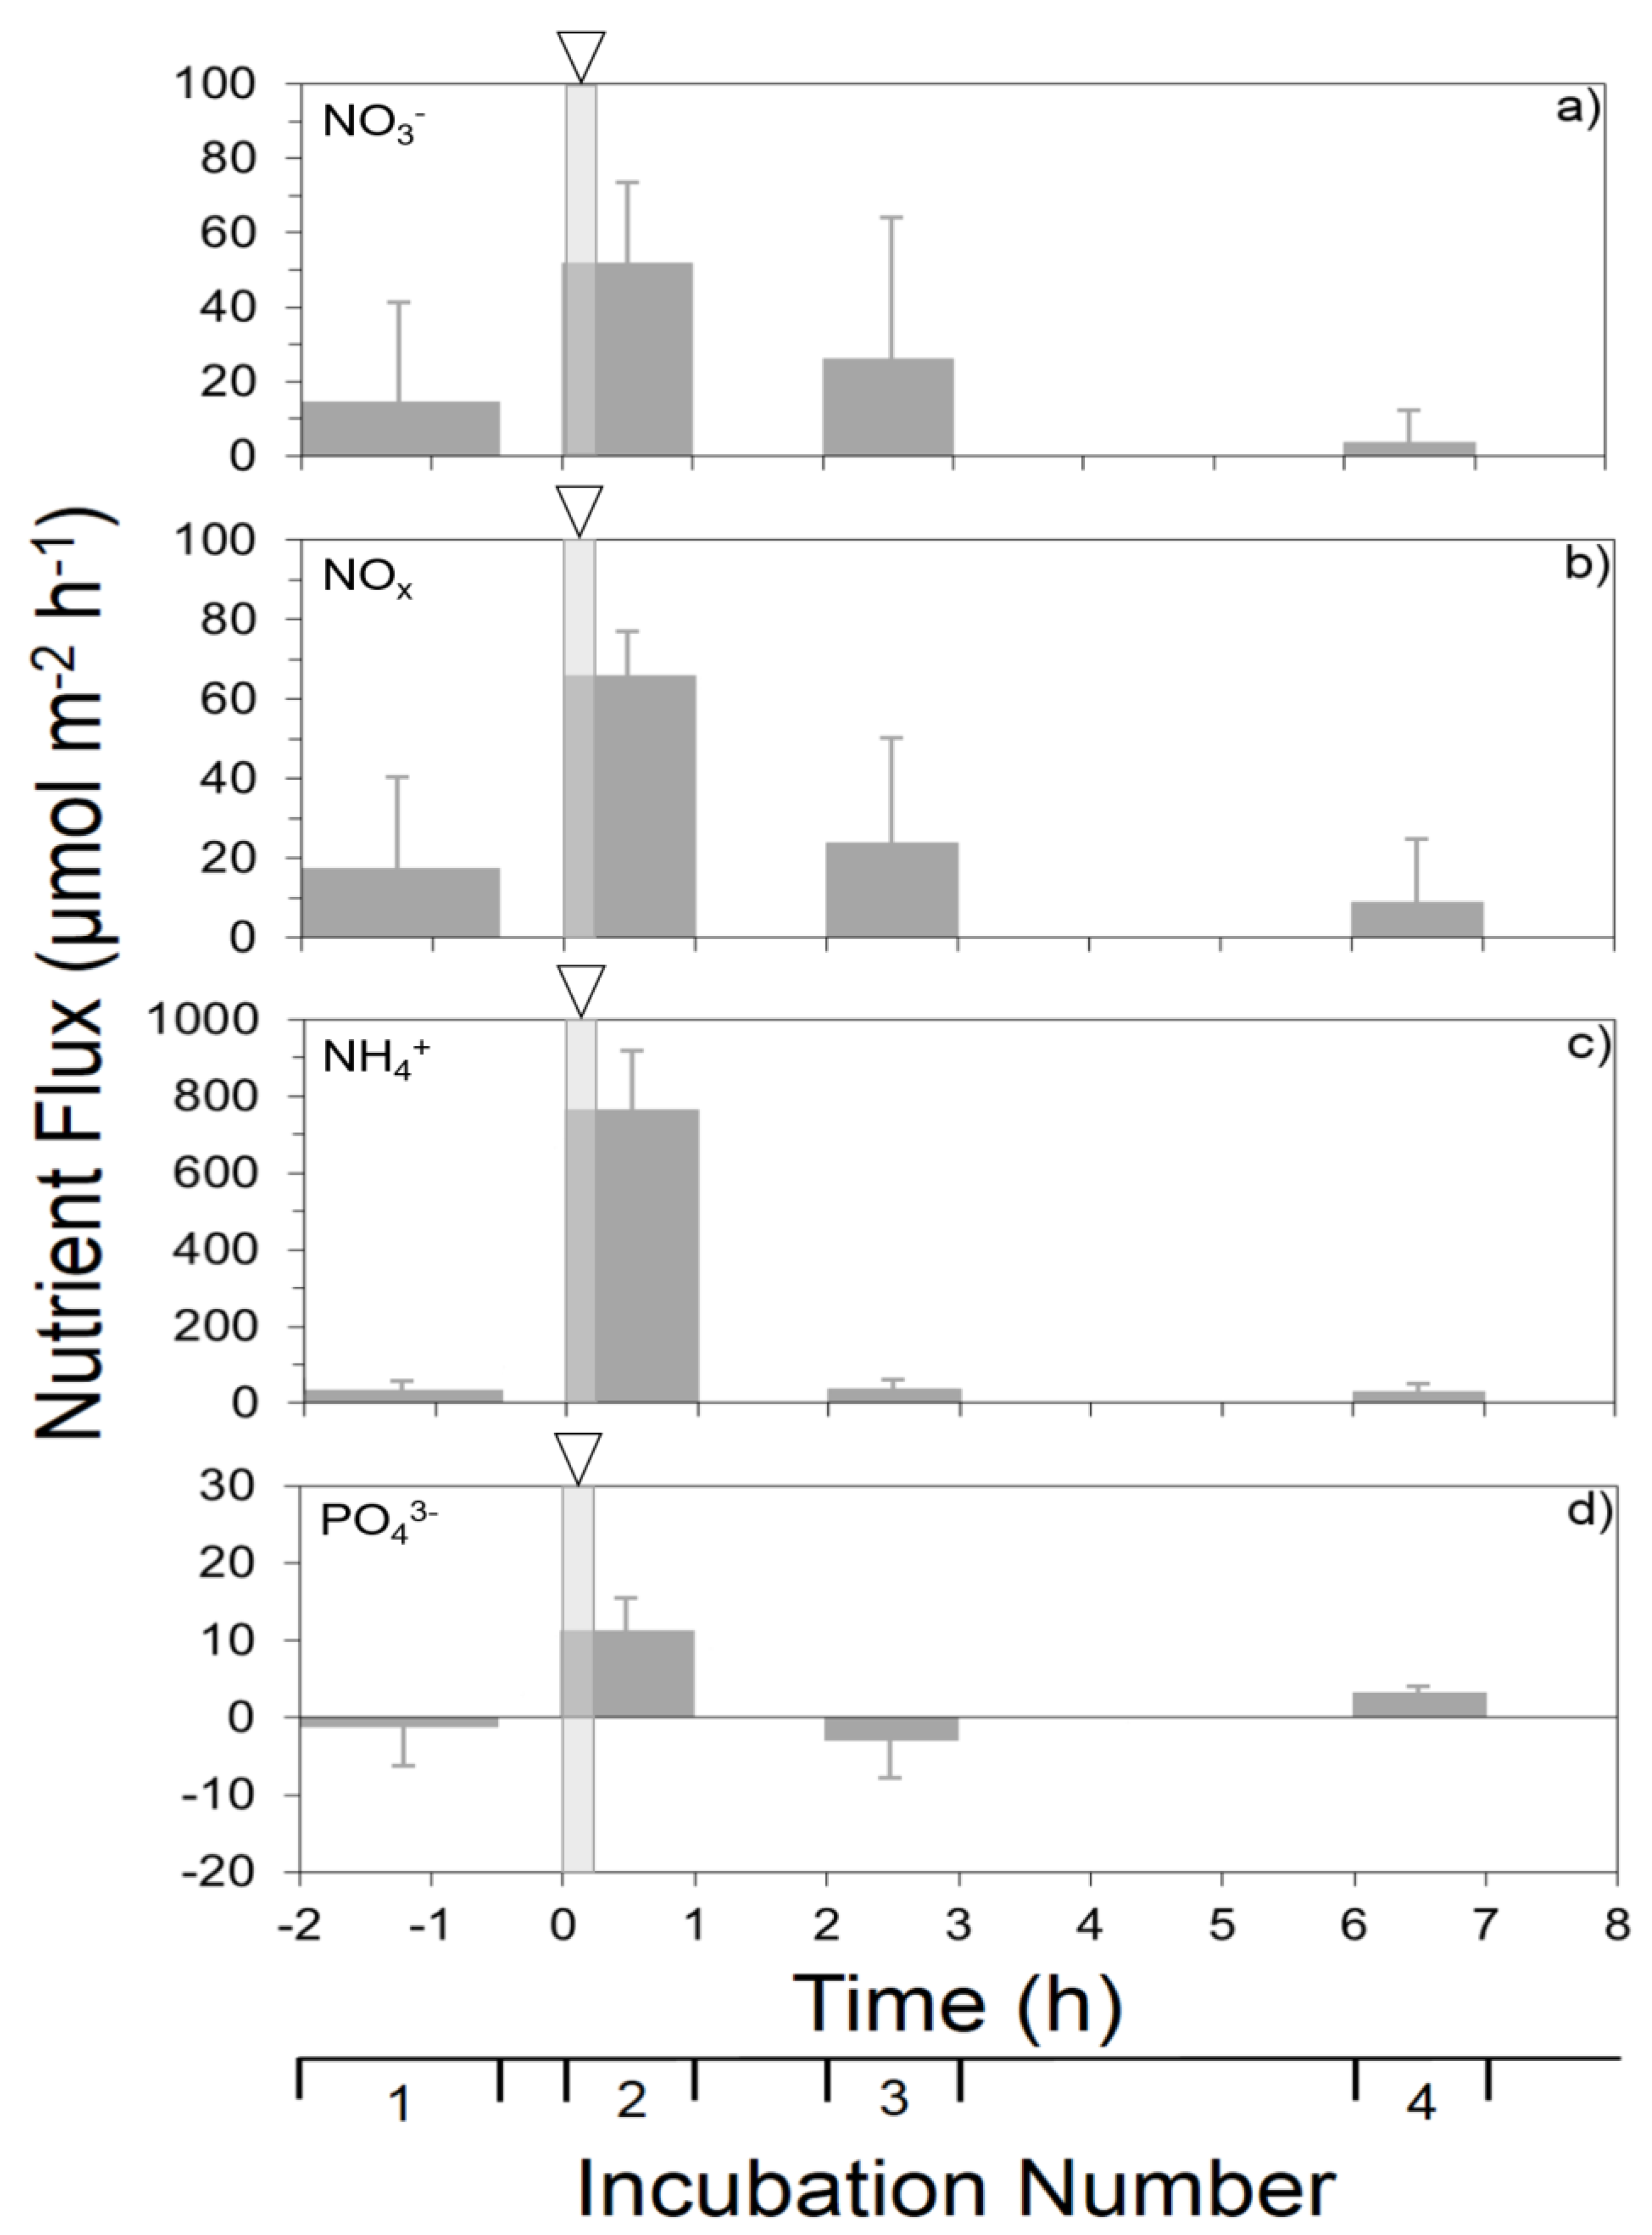
3.2. Sediment Disturbance Simulation and Sediment Incubations

Following the sediment disturbance and resuspension event, TSS concentrations immediately increased by >1000% or greater than 30 times higher, compared to concentrations measured prior to the simulated event (Table 3). Thereafter, TSS concentrations decreased over the duration of the incubations through both particle settlement on the sediment surface and TSS removal (and dilution) from the mesocosm during the part-replenishment of incubation waters. The reduction of TSS concentrations in the incubation cores demonstrated a significant correlation (r = 0.986, p = 0.002) with time (Figure 2). Concentrations of TSS during incubations following the disturbance and resuspension event represent gross overestimates of the in situ water column concentrations that would exist throughout a small estuary like Saltwater Creek, other than those waters within the immediate vicinity of a disturbance event. The settlement of heavier particles and tidal exchange with “cleaner” waters would likely result in rapidly decreasing TSS concentrations away from the disturbance source.
Nitrogen fluxes determined prior to the sediment disturbance and resuspension event were typical of the effluxes previously observed for sediments under quiescent conditions, not accounting for sediment disturbance events, within Saltwater Creek [27], a nearby adjoining system [5], and regional southern Moreton Bay waters [4]. Time-series dissolved inorganic nutrient concentrations and estimated flux rates are presented in Table 3 and Figure 3, respectively. Concentrations of NO3 and NOx demonstrated effluxes from the bulk sediment prior to disturbance and an increase in water column concentrations after the simulated disturbance and resuspension event (Table 3, Figure 3a,b). Following resuspension, water column NO3 and NOx concentrations and NO3 and NOx effluxes decreased below those measured prior to the resuspension event. Water column NH4+ concentrations underwent the greatest increase (>1000% or approx. 14 times greater) immediately following the disturbance and resuspension event (Table 3), with mean effluxes increasing by >300% following sediment disturbance and resuspension (Figure 3c). Nutrient fluxes associated with recently resuspended sediments have been shown to significantly increase due to both natural circumstances, e.g., [35,36,37,38,39], and anthropogenic disturbance and resuspension events, e.g., [14,40,41]. Increases in NH4+ effluxes due to the simulated anthropogenic sediment disturbance and resuspension event exceeded those reported under the natural resuspension circumstances of two-six times reported by Corbett [35].
Following disturbance and resuspension, NH4+ concentrations during this study declined to near initial concentrations, as did efflux rates. Estuarine sediments typically contain significant pools of NH4+ and when resuspended, NH4+ enriched porewater is immediately mixed into the overlying receiving water. It was therefore expected that, following the disturbance of the sediments within the mesocosms, increases in the NH4+ concentration would be observed in the overlying water column, which was observed during this study. These increased concentrations represent the mobilisation of pore water NH4+, and potentially the adsorption of NH4+ onto solid phase surfaces, when sediment particles are resuspended in the overlying water. Following the disturbance and resuspension event, the increase in water column NH4+ concentrations accounted for 0.58%–5.50% of the depth-integrated sediment NH4+bio concentration (Table 4).
Upon sediment disturbance and resuspension events, porewater NH4+ and exchangeable NH4+ within surface sediments are usually released into the receiving waters, as a new equilibrium establishes between the dissolved and exchangeable pools [42].
Due to the typical dominant contribution of NO3 to NOx within Saltwater Creek waters, NO3 and NOx water column concentrations demonstrated similar responses to the disturbance and resuspension of the sediment column within the mesocosms (Table 3). Increased water column concentrations are presumably attributable to the release of NO3 already present in the sediment porewater, as a result of nitrification within oxic sediment zones. In Saltwater Creek, nitrification within the sediment has been shown to be the primary source of nitrate fuelling nitrate reduction, with NO3 reduction rates coupled to nitrification accounting for ~75% of total nitrate reduction in dark conditions [27]. The removal of dissolved NOx from the water column is likely due to denitrification and dissimilatory nitrate reduction to ammonium in the surface sediment and anoxic zones within suspended solids or even in the water column. However, the burial of nitrifiers in anoxic zones as suspended solids resettle would presumably limit nitrification rates and consequently nitrate reduction rates coupled to this process after disturbance events.
Prior to resuspension, PO43− fluxes were directed into the sediments (i.e., mean negative flux), whilst immediately following sediment resuspension, increased water column PO43− concentrations resulted from effluxes (Figure 3d). The observed changes in PO43− concentrations and fluxes were much lower in comparison to those observed for inorganic N-species. Subsequent to the resuspension event, PO43− fluxes decreased and were variable in direction (Table 3 and Figure 3d). Water column PO43− concentrations measured during the last sample events (+6 hours and +7 hours) were consistent with the initial water column concentrations.
Phosphorus-liberation from sediments to the overlying water depends on the process of diffusion, based on the difference in phosphate concentration between overlying water and interstitial water [43,44]. Whilst the source of phosphate in sediments is the microbial remineralisation of deposited organic matter, an important factor in the cycling of PO43− in aquatic systems is its interaction with iron (III) oxyhydroxides (FeOOH), where PO43− binds to precipitated FeOOH within surface sediments, decreasing its bioavailability [45].
During the disturbance and resuspension event, porewater PO43− in the deeper anoxic sediment zones of the cores would have been released into the water column, initially increasing PO43− concentrations. However, as co-released porewater dissolved Fe(II) auto-oxidised and precipitated as FeOOH in the oxic water column, much of the mobilised PO43− was presumably adsorbed onto the surfaces of the newly formed FeOOH minerals in the water column, resulting in the decrease in the PO43− concentrations in the water column. This would ultimately lead to PO43− once again being sequestered in the sediment when these iron minerals settled out of suspension. Following the disturbance and resuspension event, the increase in the water column PO43− concentration accounted for 7.16%–8.22% of depth-integrated sediment bioavailable PO43− at +1 hours and +2 hours following sediment disturbance and resuspension, and 5.65% +7 hours following disturbance and resuspension (Table 4).

4. Conclusions

The results from this study provide an approximation of resultant water column nutrient conditions within Saltwater Creek (grain size dominated by <63 mm and 63–180 mm size fractions), providing insight for potential management options and relevant water quality concerns. The exchangeable NH4+ measured for a particular volume of sediment can be used as a theoretical maximum for NH4+ that could potentially be released during sediment disturbance and resuspension events. In practice, however, this maximum is unlikely to be realised, during which an intermediate amount of the nutrient is liberated, as observed in this study, where only 0.58%–5.50% of the bioavailable NH4+ present in the sediment contributed to the water column concentration. Conversely, disturbance and resuspension events are unlikely to have a significant effect on water column PO43− concentrations, other than locally, where in the short term, there may be a temporary “spike” in concentrations until phosphates mobilised from sediment porewaters reassociate with suspended sediment particles and newly formed FeOOH minerals, before settling out.
This manipulative study presents a case that during disturbance and resuspension events, there is a net release of nutrients to the water column, which is then followed by a decrease in the sediment NH4+ pool. Increases of NO3 and NH4+ within the water column will occur in conjunction with a reduction in deeper sediment NH4+ pools along the disturbed creek sections. Due to the strong binding of phosphate to FeOOH and other sediment particles, disturbance events are unlikely to liberate substantial amounts of PO43− contained in the sediment, other than in the short-term, with a short spike in local concentrations followed by a decrease as PO43− adsorbs or binds to the suspended sediment (demonstrated by the low fluxes across the SWI), with a depletion of the PO43− water column upon re-settling. Overall, the results here provide an important insight into the implications of sediment disturbances, resulting from vessel activities and dredging operations, of urbanised coastal sediments of the region. It is apparent that even the short term disturbance of estuarine sediments (dominated by <63 mm and 63–180 mm size fractions) would contribute to degraded water quality conditions through an initial increase in TSS and nutrient loadings, which requires full consideration when assessing the risks to local aquatic values.

Acknowledgments

This research was financially supported by the Gold Coast City Council Catchment Management Unit, in association with the Griffith Centre for Coastal Management (Griffith University, Gold Coast Campus), Australia.

Author Contributions

All authors have conceived, formulated, conducted, and contributed to the work described in this paper. R.J.K.D., N.J.W. and D.T.W. wrote the first version of the manuscript and D.R. and P.R.T. provided comments and edited the paper. All authors read and approved the final manuscript.

Conflicts of Interest

The authors declare no conflict of interest.

References

  1. Nixon, S.W. Remineralization and nutrient cycling in coastal marine ecosystems. In Estuaries and Nutrients; Neilson, B.J., Cronin, L.E., Eds.; Humana Press Inc.: Clifton, NJ, USA, 1981; pp. 111–138. [Google Scholar]
  2. Dunn, R.J.K.; Welsh, D.T.; Teasdale, P.R.; Lee, J.; Lemckert, C.J.; Meziane, T. Investigating the distribution and sources of organic matter in surface sediment of Coombabah Lake (Australia) using elemental, isotopic and fatty acid biomarkers. Cont. Shelf. Res. 2008, 28, 2525–2549. [Google Scholar] [CrossRef]
  3. Lijklema, L.; Koelmans, A.A.; Portielje, R. Water quality impacts of sediment pollution and the role of early diagenesis. Water Sci. Technol. 1993, 28, 1–12. [Google Scholar]
  4. Eyre, B.D.; Ferguson, A.J.P.; Webb, A.; Maher, D.; Oakes, J.M. Denitrification, N-fixation and nitrogen and phosphorus fluxes in different benthic habitats and their contribution to the nitrogen and phosphorus budgets of a shallow oligotrophic sub-tropical coastal system (southern Moreton Bay, Australia). Biogeochemistry 2010, 102, 111–133. [Google Scholar] [CrossRef]
  5. Dunn, R.J.K.; Welsh, D.T.; Jordan, M.A.; Waltham, N.J.; Lemckert, C.J.; Teasdale, P.R. Benthic metabolism and nitrogen dynamics in a sub-tropical coastal lagoon: Microphytobenthos stimulate nitrification and nitrate reduction through photosynthetic oxygen evolution. Estuar. Coast. Shelf Sci. 2012, 113, 272–282. [Google Scholar] [CrossRef]
  6. Graf, G.; Rosenberg, R. Biodeposition and bioresuspension: A review. J. Mar. Syst. 1997, 11, 269–278. [Google Scholar] [CrossRef]
  7. Couceiro, F.; Fones, G.R.; Thompson, C.E.L.; Statham, P.J.; Sivyer, D.B.; Parker, R.; Kelly-Gerreyn, B.A.; Amos, C.L. Impact of resuspension of cohesive sediments at the Oyster Grounds (North Sea) on nutrient exchange across the sediment–water interface. Biogeochemistry 2013, 1331, 37–52. [Google Scholar] [CrossRef]
  8. Eggleton, J.; Thomas, K.V. A review of factors affecting the release and bioavailability of contaminants during sediment disturbance events. Environ. Int. 2004, 30, 973–980. [Google Scholar] [CrossRef] [PubMed]
  9. Bachmann, R.W.; Hoyer, M.V.; Canfield, D.E., Jr. The potential for wave disturbance in shallow Florida Lakes. Lake Reserv. Manag. 2000, 16, 281–291. [Google Scholar] [CrossRef]
  10. Beachler, M.M.; Hill, D.F. Stirring up trouble? Resuspension of bottom sediments by recreational watercraft. Lake Reserv. Manag. 2003, 19, 15–25. [Google Scholar] [CrossRef]
  11. Zhang, S.; Zhou, Q.; Xu, D.; Lin, J.; Cheng, S.; Wu, Z. Effects of sediment dredging on water quality and zooplankton community structure in a shallow of eutrophic lake. J. Environ. Sci. 2010, 22, 218–224. [Google Scholar] [CrossRef]
  12. Lohrer, A.M.; Wetz, J.J. Dredging-induced nutrient release from sediments to the water column in a southeastern saltmarsh tidal creek. Mar. Pollut. Bull. 2003, 46, 1156–1163. [Google Scholar] [CrossRef]
  13. Nayar, S.; Miller, D.J.; Hunt, A.; Goh, B.P.L.; Chou, L.M. Environmental effects of dredging on sediment nutrients, carbon and granulometry in a tropical estuary. Environ. Monit. Assess. 2007, 127, 1–13. [Google Scholar] [CrossRef] [PubMed]
  14. Jing, L.D.; Wu, C.X.; Liu, J.T.; Wang, H.G.; Ao, H.Y. The effects of dredging on nitrogen balance in sediment-water microcosms and implications to dredging projects. Ecol. Eng. 2013, 52, 167–174. [Google Scholar] [CrossRef]
  15. Wulff, A.; Sundbaeck, K.; Nilsson, C.; Carlson, L.; Jönsson, B. Effect of sediment load on the microbenthic community of a shallow-water sandy sediment. Estuaries 1997, 20, 547–558. [Google Scholar] [CrossRef]
  16. Cabrita, M.T. Phytoplankton community indicators of changes associated with dredging in the Tagus estuary (Portugal). Environ. Pollut. 2014, 191, 17–24. [Google Scholar] [CrossRef] [PubMed]
  17. Tengberg, A.; Almroth, E.; Hall, P. Resuspension and its effects on organic carbon recycling and nutrient exchange in coastal sediments: In situ measurements using new experimental technology. J. Exp. Mar. Biol. Ecol. 2003, 285–286, 119–142. [Google Scholar] [CrossRef]
  18. Dyer, K.R. Sediment transport processes in estuaries. In Geomorphology and Sedimentology of Estuaries; Perillo, G.M.E., Ed.; Elsevier Science B.V.: Amsterdam, The Netherlands, 1995; pp. 423–450. [Google Scholar]
  19. Sloth, N.P.; Riemann, B.; Nielsen, L.P.; Blackburn, T. Resilience of pelagic and benthic microbial communities to sediment resuspension in a coastal ecosystem, Knebel Vig, Denmark. Estuar. Coast. Shelf Sci. 1996, 42, 405–415. [Google Scholar] [CrossRef]
  20. Reddy, K.; Fisher, M.; Wang, Y.; White, J.R.; James, R.T. Potential effects of sediment dredging on internal phosphorus loading in a shallow, subtropical lake. Lakes Reserv. Manag. 2007, 23, 27–38. [Google Scholar] [CrossRef]
  21. Wu, M.; Sun, X.-M.; Huang, S.-L.; Tang, X.-Q.; Scholz, M. Laboratory analyses of nutrient release processes from Haihe River sediment. Int. J. Sediment Res. 2012, 27, 61–72. [Google Scholar] [CrossRef]
  22. Ailstock, M.S.; Hornor, S.G.; Norman, C.M.; Davids, E.M. Resuspension of sediments by watercraft operated in shallow water habitats of Anne Arundel County, Maryland. J. Coast. Res. 2002, 37, 18–32. [Google Scholar]
  23. Waltham, N.J.; Barry, M.; McAlister, T.; Weber, T.; Groth, D. Protecting the green behind the gold: Catchment-wide restoration efforts necessary to achieve nutrient and sediment load reduction targets in Gold Coast City, Australia. Environ. Manag. 2014, 54, 840–851. [Google Scholar] [CrossRef] [PubMed]
  24. Dunn, R.J.K.; Waltham, N.J.; Benfer, N.P.; King, B.A.; Lemckert, C.J.; Zigic, S. Gold Coast Broadwater: Southern Moreton Bay, Southeast Queensland (Australia). In Estuaries of Australia in 2050 and beyond; Wolanski, E., Ed.; Springer: Dordrecht, The Netherlands, 2014; pp. 93–109. [Google Scholar]
  25. Benfer, N.P.; King, B.A.; Lemckert, C.J. Salinity observations in a subtropical estuarine system on the Gold Coast, Australia. J. Coast. Res. 2007, 50, 646–651. [Google Scholar]
  26. Webster, T.; Lemckert, C. Sediment resuspension within a microtidal estuary/embayment and the implication to channel management. J. Coast. Res. 2002, 36, 753–759. [Google Scholar]
  27. Dunn, R.J.K.; Robertson, D.; Teasdale, P.R.; Waltham, N.J.; Welsh, D.T. Benthic metabolism and nitrogen dynamics in an urbanised tidal creek: Domination of DNRA over denitrification as a nitrate reduction pathway. Estuar. Coast. Shelf Sci. 2013, 131, 271–281. [Google Scholar] [CrossRef]
  28. Tomlinson, R.; Teasdale, P.; Connolly, R.; Lemckert, C.; Robertson, A.; Preston, K.; O′Halloran, K.; Webster, T.; Burns, P.; Cheung, L.; et al. Saltwater Creek Environmental Inventory: Scoping Study Report and Recommendations; Research Report No. 6; Griffith University Centre for Coastal Management: Gold Coast, Australia, 2006. [Google Scholar]
  29. Lee, S.Y.; Connolly, R.M.; Dale, P.E.R.; Dunn, R.J.K.; Knight, J.M.; Lemckert, C.J.; McKinnon, S.; Powell, B.; Teasdale, P.R.; Welsh, D.T.; Young, R. The Impact of Urbanisation on Coastal Wetlands: A Case Study of Coombabah Lake, Southeast Queensland; Technical Report No. 54; Cooperative Research Centre for Coastal Zone, Estuary and Waterway Management: Gold Coast, Australia, 2006. [Google Scholar]
  30. Dunn, R.J.K.; Ali, A.; Lemckert, C.J.; Teasdale, P.R.; Welsh, D.T. Short-term variability of physico-chemical parameters and the estimated transport of filterable nutrients and chlorophyll-a in the urbanised Coombabah Lake and Coombabah Creek system, southern Moreton Bay, Australia. J. Coast. Res. 2007, 50, 1062–1068. [Google Scholar]
  31. Dunn, R.J.K.; Lemckert, C.J.; Teasdale, P.R.; Welsh, D.T. Distribution of nutrients in surface and sub-surface sediments of Coombabah Lake, southern Moreton Bay (Australia). Mar. Pollut. Bull. 2007, 54, 606–614. [Google Scholar] [CrossRef] [PubMed]
  32. Nizzoli, D.; Welsh, D.T.; Viaroli, P. Seasonal nitrogen and phosphorus dynamics during benthic clam and suspended mussel cultivation. Mar. Pollut. Bull. 2011, 62, 1276–1287. [Google Scholar] [CrossRef] [PubMed]
  33. Azzoni, R.; Giordani, G.; Bartoli, M.; Welsh, D.T.; Viaroli, P. Iron, sulphur and phosphorus cycling in the rhizosphere sediments of a eutrophic Ruppia cirrhosa meadow (Valle Smarlacca, Italy). J. Sea Res. 2001, 45, 15–26. [Google Scholar] [CrossRef]
  34. Burdige, D.J. Geochemistry of Marine Sediments; Princeton University Press: Princeton, NJ, USA, 2006. [Google Scholar]
  35. Corbett, D.R. Resuspension and estuarine nutrient cycling: Insights from the Neuse River Estuary. Biogeosciences 2010, 7, 3289–3300. [Google Scholar] [CrossRef]
  36. Fanning, K.A.; Carder, K.L.; Betzer, P.R. Sediment resuspension by coastal waters: A potential mechanism for nutrient re-cycling on the ocean’s margins. Deep Sea Res. 1982, 29, 953–965. [Google Scholar] [CrossRef]
  37. Kristensen, P.; Sondergaard, M.; Jeppesen, E. Resuspension in a shallow eutrophic lake. Hydrobiologia 1992, 228, 101–109. [Google Scholar] [CrossRef]
  38. Sondergaard, M.; Kristensen, P.; Jeppesen, E. Phosphorus release from resuspended sediment in the shallow and wind-exposed Lake Arreso, Denmark. Hydrobiologia 1992, 228, 91–99. [Google Scholar] [CrossRef]
  39. De Jong, V.N.; van Beusekom, J.E.E. Wind- and tide-induced resuspension of sediment and microphytobenthos from tidal flats in the Ems estuary. Limnol. Oceanog. 1995, 40, 766–778. [Google Scholar]
  40. Zhong, J.; Liu, G.; Fan, C.; Li, B.; Ding, S. Environmental effect of sediment dredging in lake. II. The role of sediment dredging in reducing internal nitrogen release. J. Lake Sci. 2009, 21, 335–344. [Google Scholar]
  41. Cornwell, J.C.; Owens, M.S. Quantifying sediment nitrogen release associated with estuarine dredging. Aquat. Geochem. 2011, 17, 499–517. [Google Scholar] [CrossRef]
  42. Berner, R.A. Early Diagenesis: A Theoretical Approach; Princeton University Press: Princeton, NJ, USA, 1980. [Google Scholar]
  43. Aller, R.C. Diagenetic processes near the sediment-water interface of Long Island Sound. Adv. Geophys. 1980, 22, 237–350. [Google Scholar]
  44. Krom, M.D.; Berner, R.A. The diagenesis of phosphorus in a nearshore marine sediment. Geochim. Cosmochim. Acta 1981, 45, 207–216. [Google Scholar] [CrossRef]
  45. Gomez, E.; Durillon, C.; Rofes, G.; Picot, B. Phosphate adsorption and release from sediments of brackish lagoons: pH, O2 and loading influence. Water Res. 1999, 33, 2437–2447. [Google Scholar] [CrossRef]
Figure 1. Map of: (a) Australia, showing (b) the Gold Coast Broadwater, and (c,d) the sediment sample collection site within Saltwater Creek (▲) and water collection site nearby the creek entrance (■) (satellite imagery source: Google Earth).
Jmse 05 00016 g001
Figure 2. Total suspended solid concentrations during core incubations. The occurrence of the sediment disturbance and resuspension event is represented by ▽ and shading.
Jmse 05 00016 g002
Figure 3. Calculated fluxes for (a) NO3, (b) NOx, (c) NH4+, and (d) PO43− during core incubations. The occurrence of the sediment disturbance and resuspension event is represented by ▽ and shading.
Jmse 05 00016 g003
Table 1. Depth profiles of physicochemical parameters in surface sediments of Saltwater Creek (mean ± standard deviation; n = 3).
Depth (cm)Wet-Bulk Density (g cm−3)Porosity (%)LOI550 (%)<63 µm (%)63–180 µm (%)>180 µm (%)NH4+bioPO43−bio
(nmol g−1 dry wt)
0–11.37 ± 0.0576.1 ± 6.919.23 ± 3.5624.1 ± 4.0860.8 ± 2.3915.1 ± 5.43478 ± 1898.56 ± 1.03
1–21.38 ± 0.0770.1 ± 5.229.16 ± 2.8836.7 ± 22.1763.2 ± 8.0413.1 ± 7.64208 ± 85.17.72 ± 1.95
2–41.51 ± 0.1668.4 ± 1.477.68 ± 2.0126.5 ± 3.3361.3 ± 6.4012.2 ± 3.24181 ± 1035.57 ± 1.01
4–61.53 ± 0.1566.3 ± 2.767.77 ± 2.5027.9 ± 2.7060.6 ± 4.7711.4 ± 6.48212 ± 90.74.27 ± 1.67
6–101.66 ± 0.0766.1 ± 3.786.72 ± 1.1229.7 ± 5.1359.7 ± 3.7110.5 ± 7.97186 ± 93.11.50 ± 0.56
10–201.68 ± 0.5166.9 ± 5.937.66 ± 0.8134.9 ± 4.6055.4 ± 4.639.32 ± 2.88161 ± 51.92.53 ± 0.32
20–401.73 ± 0.1665.1 ± 4.956.51 ± 1.2530.7 ± 3.8651.3 ± 5.1516.5 ± 5.72150 ± 87.62.11 ± 0.71
>401.78 ± 0.3264.2 ± 5.874.12 ± 2.1134.8 ± 4.4757.7 ± 4.866.94 ± 6.80155 ± 60.42.96 ± 1.13
Table 2. Pearson correlation coefficients for physicochemical sediment parameters of the various depth horizons (n = 8; * correlation significant at the 0.05 level (2-tailed); ** correlation significant at the 0.01 level (2-tailed)).
Parameter Porosity (%)LOI550 (%)<63 µm (%)63–180 µm (%)>180 µm (%)NH4+bioPO43−bio
(nmol g−1 dry wt)
Wet-bulk density (g cm−3)r−0.850 **−0.891 **0.3650.755 *−0.470−0.6840.922 **
p0.0080.0030.3740.0300.2400.610.001
Porosity (%)r 0.784 *0.4730.4980.4950.919 **0.868 **
p0.0210.2360.2090.2130.0010.005
LOI550 (%)r −0.3010.4880.5760.5810.726 *
p0.4680.2200.1350.1310.041
<63 µm (%)r −0.182−0.455−0.611−0.278
p0.6660.2580.1080.505
63-180 µm (%)r −0.1260.3810.672
p0.7660.3520.068
>180 µm (%)r 0.4320.407
p 0.2850.316
NH4+bio (nmol g−1 dry wt)r 0.725 *
p 0.042
Table 3. Time-series of mean changes (n = 6) in total suspended sediment and dissolved inorganic nutrient concentrations according to mesocosms sampling timeline. Negative times represent before, time 0 represents immediately prior to, and positive times represent hours after the sediment disturbance and resuspension event, respectively.
Time (h)Initial Concentration
TSS (mg L−1)NO3 (µmol L−1)NOx (µmol L−1)NH4+ (µmol L−1)PO43− (µmol L−1)
-229 ± 10.50 ± 0.080.90 ± 0.160.21 ± 0.050.22 ± 0.05
Time (h)Δ TSSΔ NO3Δ NOxΔ NH4+Δ PO43−
(mg L−1)%(µmol L−1)%(µmol L−1)%(µmol L−1)%(µmol L−1)%
-0.5−1−30.1224.70.1415.80.27125.2−0.01−3.5
0932>10000.2844.80.3028.66.26>10000.0313.5
+1−189−200.3842.50.4936.55.6784.10.0833.8
+2−56−7−0.29−22.4−0.39−21.6−11.10−89.50.0514.8
+3−39−50.2121.30.1913.50.2922.2−0.01−3.7
+6−159−23−0.85−70.1−0.84−51.5−0.27−17.3−0.13−34.9
+7−46−90.037.10.078.40.2015.00.029.6
Table 4. Mean water column nutrient concentration as a percentage of depth-integrated (0–15 cm) sediment NH4+bio and PO43−bio concentrations during incubations. Negative times represent before, time 0 represents immediately prior to, and positive times represent hours after the sediment disturbance and resuspension event, respectively.
NutrientTime (hours)
-2-0.50+1+2+3+6+7
NH4+0.090.212.995.500.580.710.580.67
PO43−4.894.725.367.168.227.925.155.65

