Anti-Collision Assessment and Prediction Considering Material Corrosion on an Offshore Protective Device


1
Department of Marine Structure, Guangdong Shipping Science Research Institute, Guangzhou 510110, China
2
College of Science and Engineering, Flinders University, Adelaide, SA 5042, Australia
3
College of Mechanical and Marine Engineering, Qinzhou University, Qinzhou 535000, China
4
Department of Naval Architecture and Ocean Engineering, School of Civil Engineering and Transportation, South China University of Technology, Guangzhou 510648, China
*
Authors to whom correspondence should be addressed.
J. Mar. Sci. Eng. 2017, 5(3), 37; https://doi.org/10.3390/jmse5030037
Submission received: 13 July 2017
/
Revised: 8 August 2017
/
Accepted: 9 August 2017
/
Published: 15 August 2017
(This article belongs to the Special Issue Marine Structures)
Abstract
:Corrosion deterioration of steel can heavily degrade the performance of marine and offshore structures. A typical steel protective device, which has worked for a dozen years in a river estuary, is selected as the research object. Its current corrosion response is measured on site and its further corrosive response is predicted based on measurement data and the structure’s current state. Nonlinear finite element method is utilized to analyze the degradation of the protective device’s anti-collision performance. Meanwhile the rubber buffer effect has been investigated for its anti-collision on the protective device. A prediction method is proposed that can accurately forecast degradation of the anti-collision performance of a protective device as time progresses.
1. Introduction
Steel is one of the most popular materials used in offshore and marine structures such as ships, ocean platforms, and submarine pipelines. The corrosion deterioration of steel can lead to heavy losses [1]: in 2001 the annual worldwide cost of corrosion was around 3% of the world’s GDP [2], and Khan [3] summarized that 1034 incidents (44.7% of the total incidents) were caused by steel corrosion and the corresponding ‘mechanical failure’, including a series of serious incidents in 1988 and 1992 in the U.S. [1,4]. Many researchers have studied the mechanism of steel corrosion in marine and offshore environments. Jyoti et al. [5] summarized previous research work and reported that temperature [6], pH value [7], salinity [8], dissolved oxygen [9], and water velocity [10] were the main physical factors that affected the corrosion responses of steel. Besides the investigation of corrosion factors, other studies have focused on mechanism optimization. For example, Li et al. [11] adjusted element contents within steel, and found that tin-containing steel had better corrosion resistance than steel itself.
The assessment of steel under a state of corrosion is another area of current research interest. Calabrese et al. [12] studied the corrosion degradation effects of aluminum/steel clinched joints and pointed out that thicker aluminum foil could endow superior durability properties in large-scale applications. Chen et al. [13] used finite element analysis (FEA) to investigate the failure processes of high-strength pipelines with single and multiple corrosions and produced an assessment procedure to predict the failure pressure of a pipeline with multiple corrosions. Jin et al. [14] used FEA in considering the shear buckling behavior of a web panel with pits and through-thickness corrosion damage, and found that through-thickness corrosion damage significantly decreased the critical buckling load.
Bridge protective devices are among the many large-scale steel structures used in marine environments. They are energy-absorptive structures designed to withstand ship impact and depend on internal steel plastic damage [15]. Many studies of ship–bridge collision responses [16,17] and device usage [18,19] have been reported. For example, Qiu et al. [20] analyzed an original protective device scheme and proposed structural and material optimization for the protective device [21,22,23].
Because of the many influencing factors, it is difficult to predict realistic corrosion responses of engineering structures based only on existing research conclusions and results, especially given the coupling effect of an antirust coat. Degradation of the anti-collision performance of protective devices influenced by corrosion has been insufficiently analyzed. In this study, a protective device that had worked for 12 years in a river estuary was selected as a research object, and its current corrosion response was detected on-site based on the corresponding standards [24,25]. Further corrosive response was predicted based on measurement data and the current state of the structure. The current degradation of the protective device’s anti-collision performance and the device’s further corrosion states were analyzed and predicted separately. An anti-collision performance prediction method for the protective device is proposed.
2. Model Description
Yamen Bridge is located in the Pearl River estuary, China. The estuary experiences severe engineering environments such as a high tidal range, high swell velocity, and large-tonnage ships shuttling back and forth over it. Thus, a protective device had been designed to protect the bridge piers from ship collisions. The main geometrical parameters of the studied device are listed in Table 1. This protective device was a large-scale shell structure containing 14 watertight cabins and 4 non-watertight cabins assembled by deck plates, bottom plates, longitudinal bulkheads, transverse bulkheads, and trunk bulkheads. Each plate was enhanced by stiffeners with rib distance of 650 mm to ensure structural stability. Non-watertight cabins were used to adjust the protective device’s floating state when it was assembled around bridge piers. After assembly of the device, seawater could flow into the non-watertight cabins. This maintained the same water level within and outside the protective device and ensured that the protective device was unaffected by tidal levels. Seventy drum-type buffer rubbers were assembled on the inside bulkhead of the protective device, designed to absorb impact forces that the bridge pier received during ship collision.
Front collision is selected as the study case here, with the design value of the ultimate impact force being 28 MN. Cabins in the front direction would perform the main anti-collision functions. Figure 1 shows a sketch of the protective device.
3. Corrosion Measurement and Prediction
The protective device had been manufactured and placed in the river estuary 12 years earlier and corrosion had certainly occurred within it. External views of the protective device were obtained first through a diver’s visual inspection; subsequently, each steel component’s residual thickness was measured by an ultrasonic thickness gauge. The whole structure of the protective device was examined to check whether pitting corrosion, bulking, weld crack, steel damage, or corrosion punching had occurred. Visual inspection and hammer testing were utilized in the tidal and spray zones, and diver inspection was utilized to detect the corrosion state of the immersed zone. Typical corrosion states of the protective device are shown in Figure 2 and the detection results are listed in Table 2. As shown in Table 2, no apparent pitting corrosion, weld crack, or steel plate punching was observed, implying that no severe local damage had occurred.
Originally, undercoat and finishing had been painted on the protective device for anticorrosion purposes and a special undercoating containing Zn [26] was used in the tidal zone, as steel in this zone oxidized more severe than in other zones [5]. After years of immersion, however, rusting had occurred almost everywhere (see Figure 2), the coating retained little anticorrosion effect, meanwhile, corrosion and structural loss had occurred in almost every part of the protective device. Components in the different zones (spray, tidal, and full immersion) were measured separately as they were situated in different environmental conditions (differences in temperature, dissolved oxygen, salinity, pH value, redox potential, etc.). As the protective device was a non-watertight structure, seawater perfused into the undersea cabins and thus seawater corrosion occurred on both sides of the steel components. In total, 500 points were selected to measure the residual thickness of the steel components and data were classified according to the design thickness of the steel component, as summarized in Table 3. Comparisons of the different corrosion zones showed that the protective device experienced the most severe corrosion in the full immersion zone rather than in the tidal zone and its anticorrosion performance was best in the spray zone.
Pitting corrosion is regarded as one of the most hazardous forms of corrosion for traditional marine and offshore structures as it is a localized accelerated dissolution of metal that can weaken structural stiffness and lead to early catastrophic failure (oil leakage, product loss, environmental pollution, loss of life, for example) [4]. Pitting corrosion does not greatly affect the function of a protective device, as pitting corrosion (even consequent piercing) merely causes local damage relative to the large-scale structure of the whole device and its influence on anti-collision performance is negligible [27]. The design principle of the protective device is to absorb a large amount of the kinetic energy from the hull’s impact through plastic damage to the metal within itself. The amount of energy absorbed through plastic damage to the metal correlates with the mass loss and consequent thickness reduction of the metal. The average residual metal thicknesses of typical steel components of the protective device are listed in Table 4. In the subsequent FEA, each steel plate or enhanced component is modeled with the average thickness detected by a thickness gauge as reported above.
According to the simulation results presented in the next section, the protective device at the current time could meet anti-collision requirements. As long as the protective device remained in active service around the bridge pier, everyday corrosion progressed. Further analysis to predict whether the protective device could retain its anti-collision performance after a long period of service is an important issue. The protective device was located in a marine environment and, when manufactured in a shipyard, it was designed with only 10 years’ service life. Most of its components were painted by hand-brushing using common marine coatings whose normal durability was 10 years. Thus, further corrosive responses need to be predicted if we want to study the subsequent corrosion response of the device and judge its ultimate service life. Steel components within the protective device were classified according to design thickness and the corrosion zone in which they were located, and then the further corrosive response of each classified group was predicted. The average residual thicknesses of typical components in their corrosion environment (5-year prediction) are listed in Table 5.
4. FE Simulation
4.1. FE Model of the Protective Device
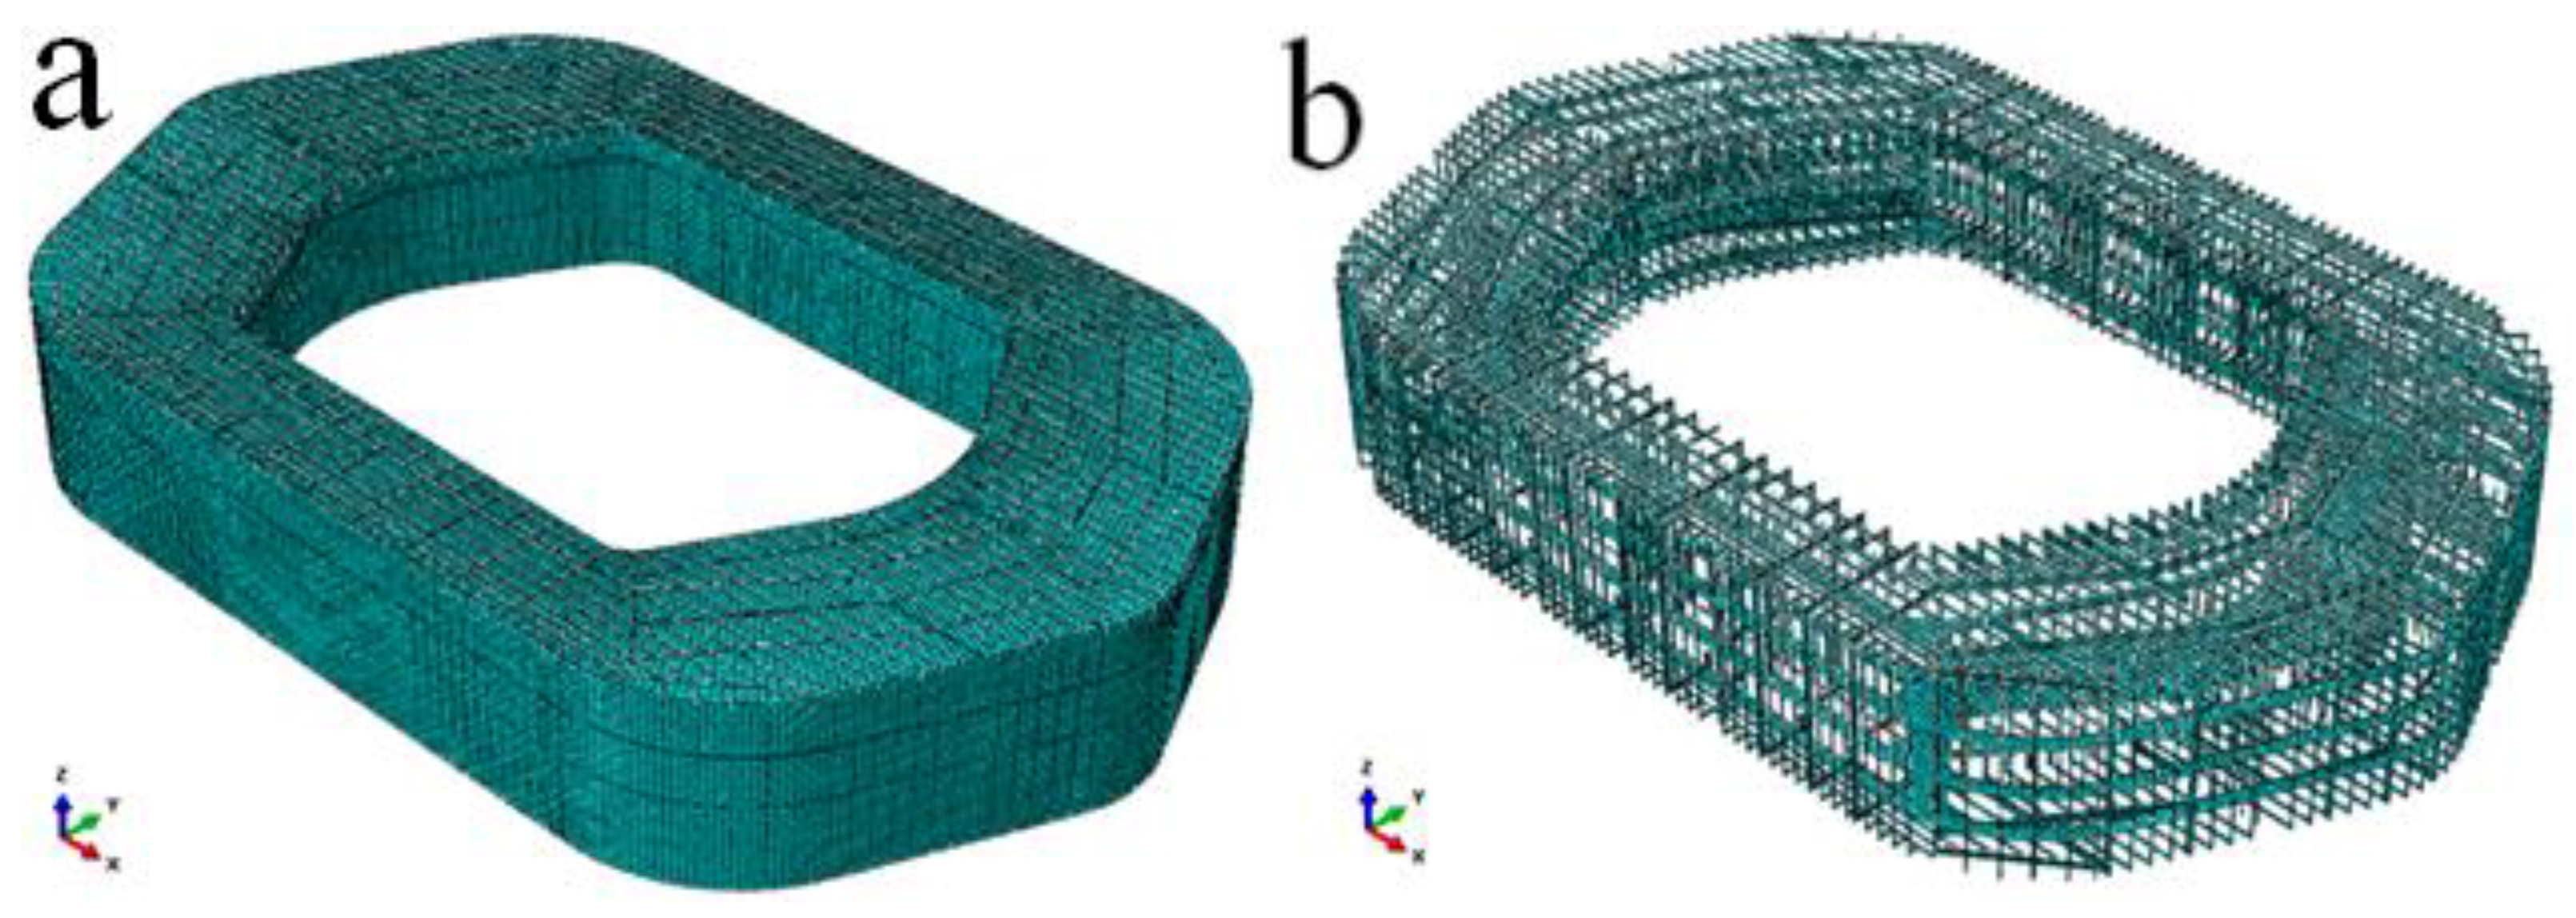
A detailed FE model of the protective device was built, with each plate and stiffener (Table 4 and Table 5) modeled with shell elements. The majority of shell elements were S4R (4-node double-curved thick shell with reduced integration); some small components were modeled with S3R (3-node triangular thick shell) elements. Although the macroscopic structure size of the protective device was very large, the mesh size was only between 130 and 260 mm, and in total 186,126 elements (connected by 244,102 nodes) were used. The main parameters of the protective device are listed in Table 1 and its FE model is shown in Figure 3.
4.2. FE Model of a Striking Ship
Both ocean-going and inland vessels with deadweight tonnage (DWT) normally around 5000 tons commonly pass through a river estuary, so a 5000 DWT striking ship model was proposed, built with shell elements. As the ship’s response was not the research object here, the ship’s FE model was simplified to minimize calculation time. Only the ship’s bow was modeled as an elastic body; other parts were modeled as rigid bodies as they were relatively distant from the protective device and direct collision with them should not occur. Enhanced stiffeners and bulkheads within the ship’s bow were deleted and their mass was compensated through increasing the bulkhead thickness. Furthermore, a centerline bulkhead was added in the ship’s bow to compensate for the loss of section modulus. The main parameters of the striking ship are listed in Table 6.
4.3. Boundary Conditions
Front collision was selected as the case involving the maximum impact force received by a bridge pier [20]. The ship’s stroking velocity was defined as 5 m/s and the high tide level was selected, considering that navigation is relatively busy at this tide level. The full immersion zone was below the low tide level, the tidal zone was between the low and high tide levels, and the spray zone was above the high tide level. Detailed parameters of the boundary conditions are listed in Table 7.
The attached water mass proposed was based on relevant theory [28] and was uniformly distributed onto the under-water part of the protective device in order to solve the fluid-solid coupling problem without increasing calculation time. Different corrosion states of the protective device were defined and the anti-collision effect of the buffer rubber was also considered. In total, 5 work cases were studied. The buffer rubber’s anti-collision effect was analyzed in cases 1 and 2 (without and with buffer rubber equipment), and the influence of the protective device’s corrosion was analyzed based on cases 3–5 (case 3 corresponds to the original design state, case 4 to the current corrosion state, and case 5 to the predicted future corrosion state).
4.4. Material Properties
This protective device was made of common marine steel Q235 with the chemical composition was well documented in the literature and the steel’s mechanical parameters concerning metal plasticity are listed in Table 8. Ductile and shear failure criteria were utilized to determine the damage response of the marine steel. The mechanical properties of the rubber (simulated by a viscous elastic spring) are listed in Table 9. The friction coefficient between steel components was assigned as 0.10 [29].
5. Results and Discussion
5.1. Anti-Collision Effect of Buffer Rubber
As the protective device had been used and immersed in a corrosive environment for 12 years, the mechanical performance of the buffer rubber had significantly decreased. The current mechanical performance of the buffer rubber was not measured as it could not simply be represented by thickness reduction. Two models (cases 1 and 2) were built: one was equipped with buffer rubber and the other not, to represent typical/extreme cases, and the protective device’s anti-collision response is analyzed here.
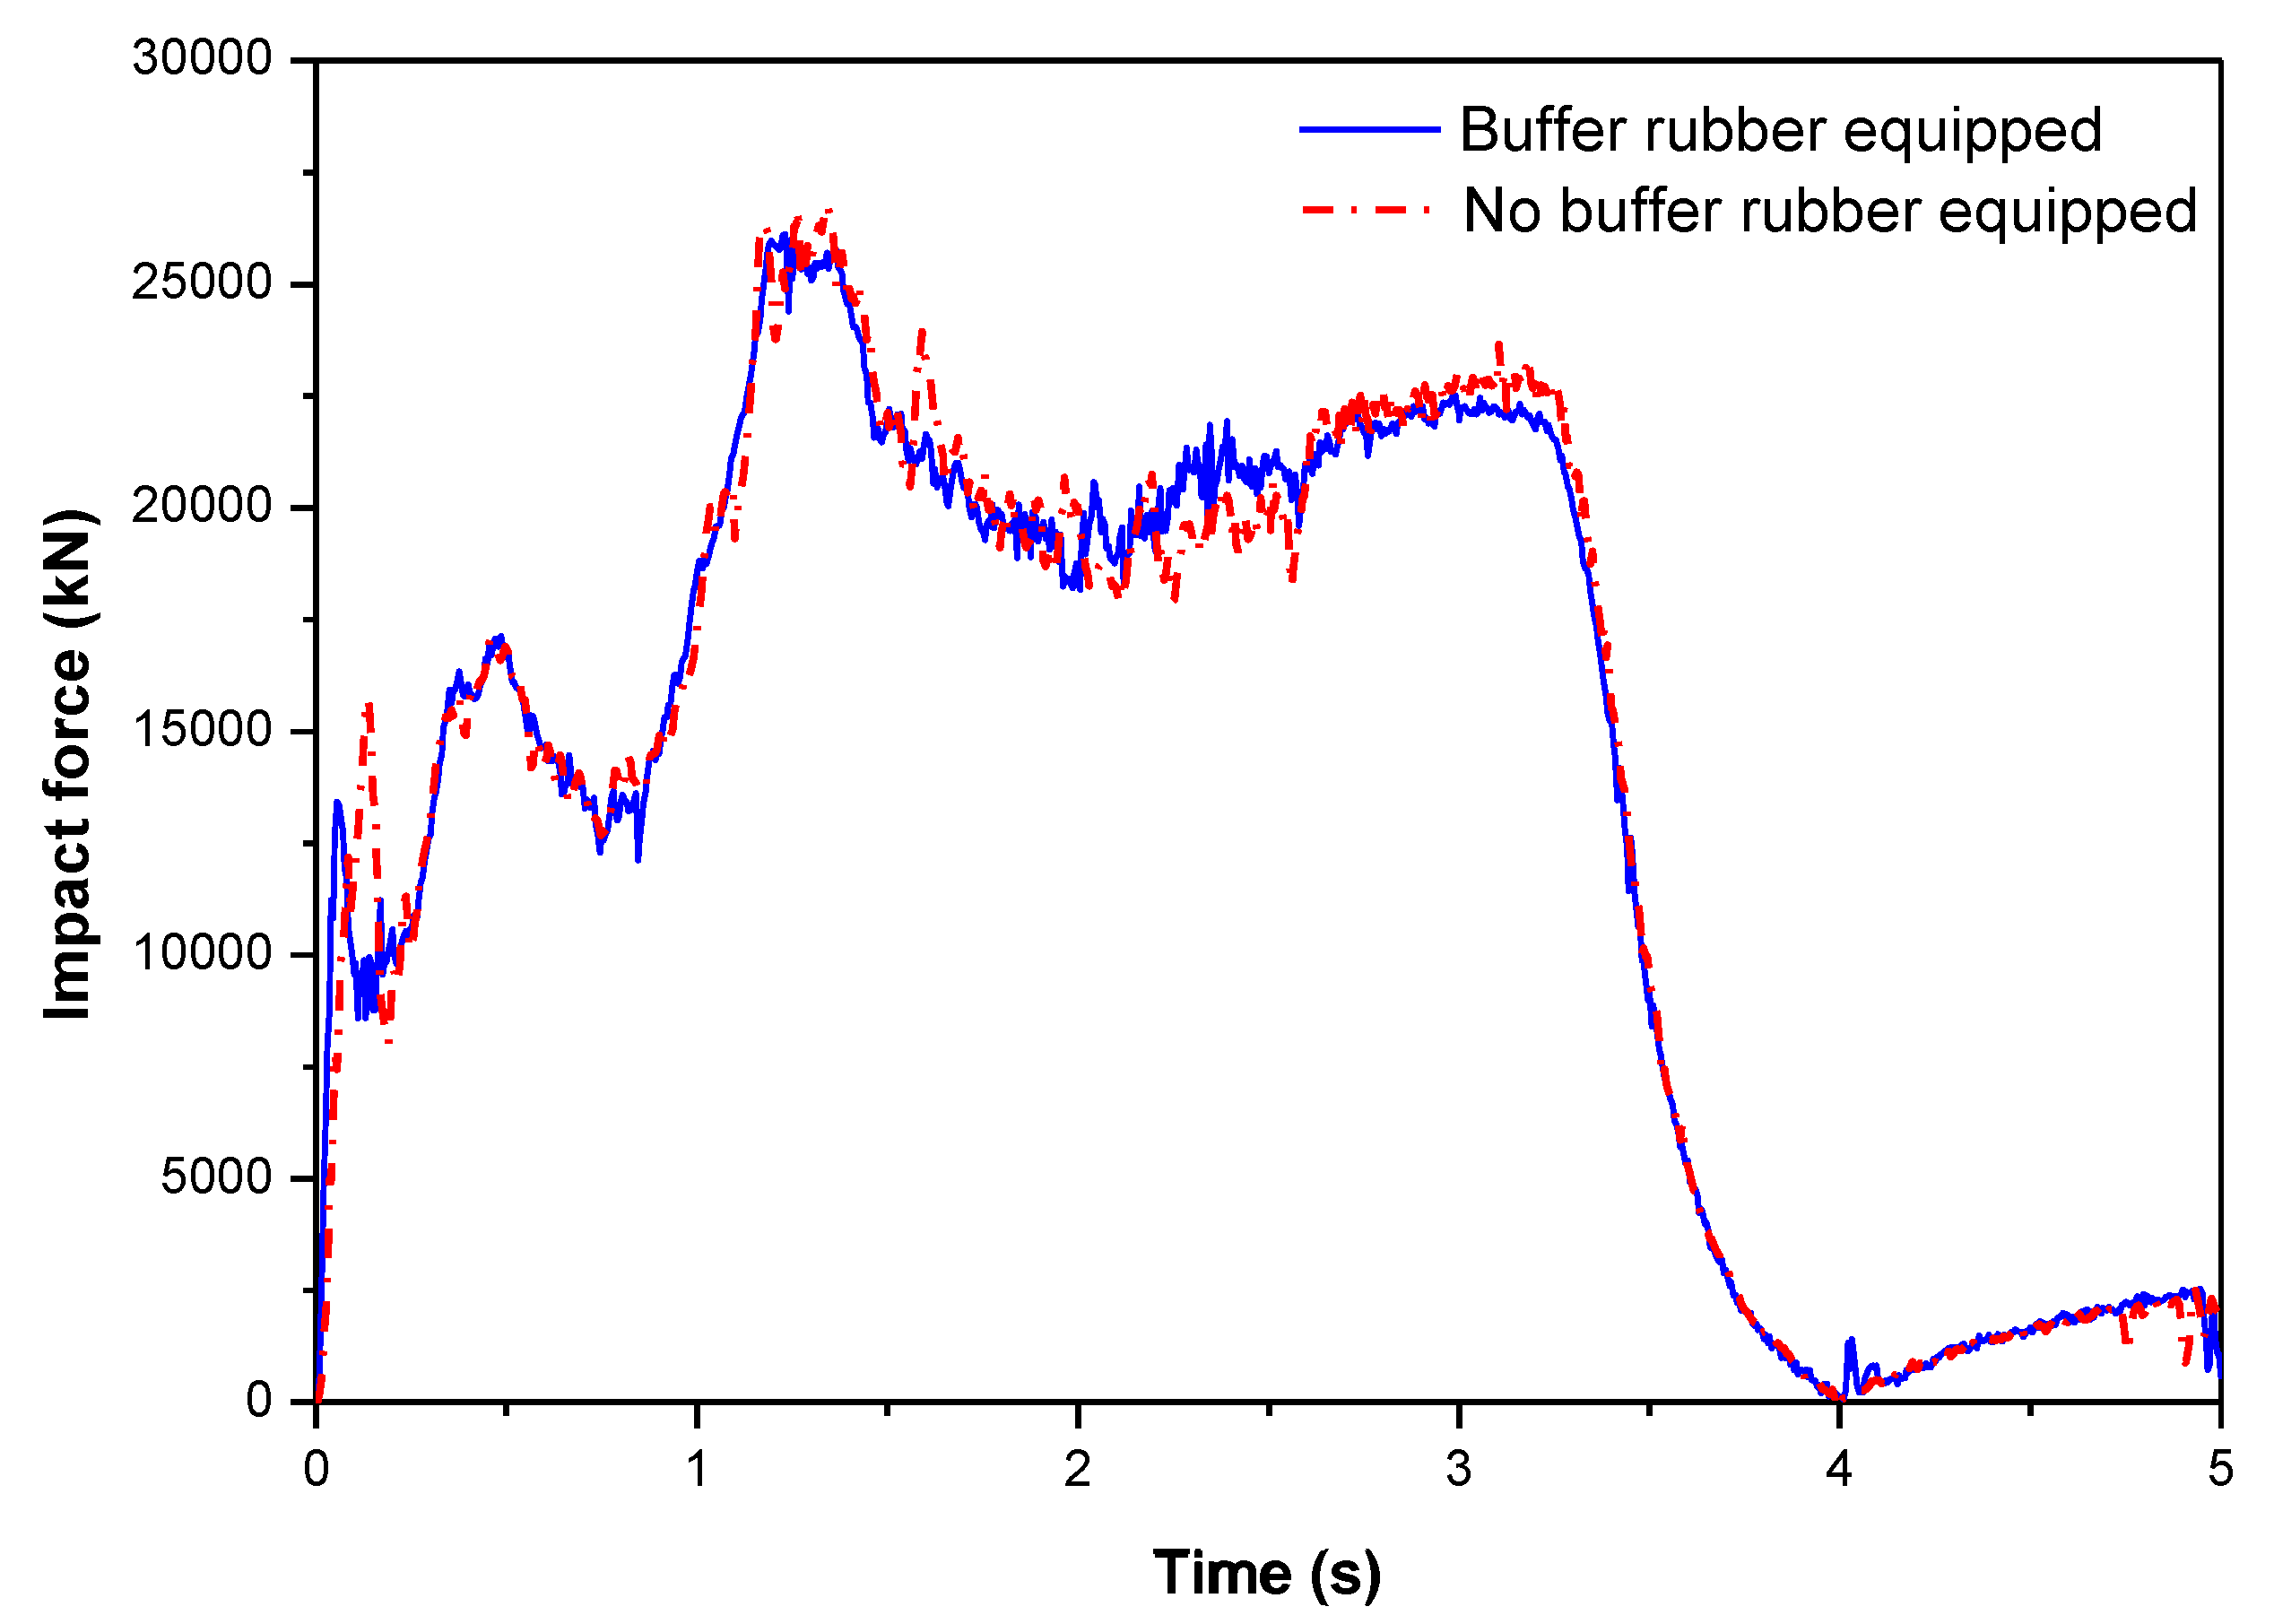
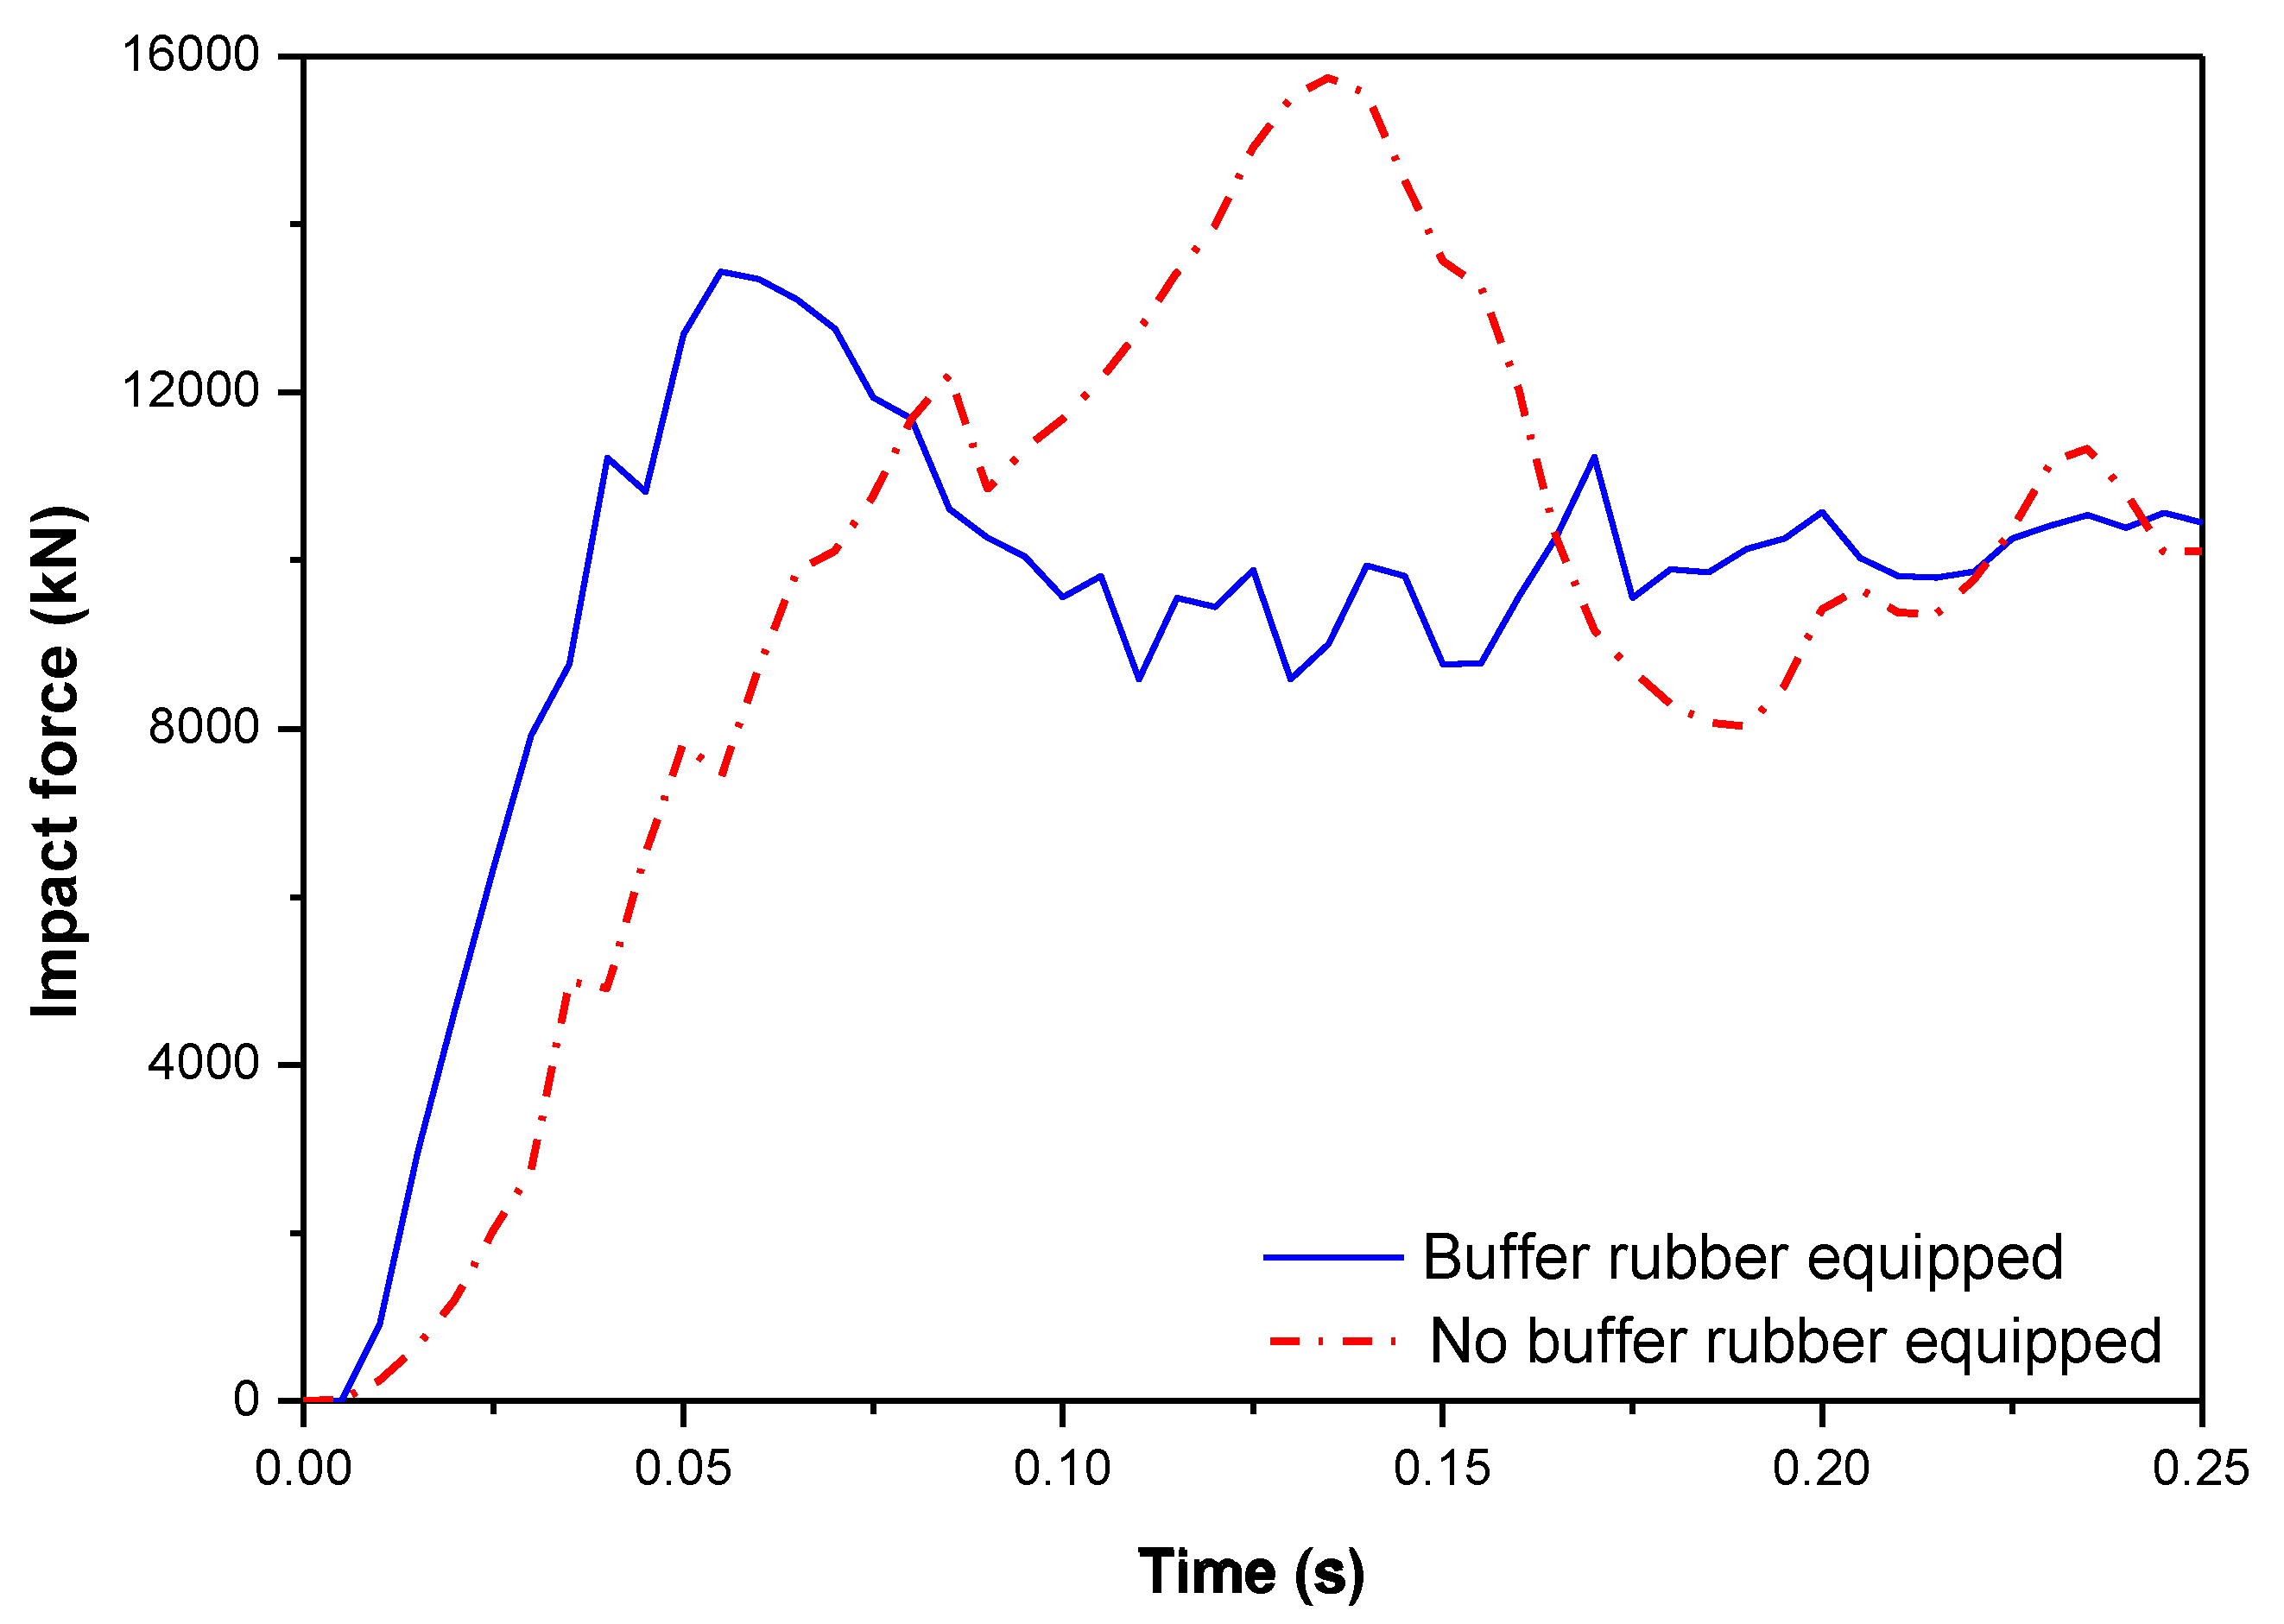
The simulation results are listed in Table 10 and the corresponding reaction force histories are shown in Figure 4. The maximum value of the impact force received by the protective device is 26.79 MN in case 1, compared with 26.12 MN in case 2, an increase of 2.56%. The maximum ship stroke in case 1 is 8.69 m, compared with 8.71 m in case 2, a decrease of 0.23%. According to the discussion above, the protective device equipped with buffer rubber could decrease the maximum impact force and prolong the ship stroke, but the difference is not significant, as shown in Figure 4. However, it is worth mentioning that buffer rubber can obviously decrease the impact force at the beginning of impact and allow the protective device to activate its function more quickly, as shown in Figure 5. At the beginning stage of impact (within 0.15 s), the maximum impact force in case 1 is 15.75 MN (0.14 s), whereas in case 2 it is 13.43 MN (0.06 s), a decrease of 14.73%. Therefore, if the ship impact is too weak to damage the protective device’s steel components, the anti-collision effect of the buffer rubber is efficient and sufficient, but if the collision is too violent and must be resisted through structural damage within the protective device, the buffer rubber plays almost no role.
As the performance of the protective device was demonstrated by the ultimate collision state and the ship collision cases discussed here were all violent, the buffer rubber was insignificant with regard to the impact response in the ultimate collision state. In the following cases, the protective device models are all equipped with buffer rubber and the corrosive state of the steel components is the only parameter investigated.
5.2. Corrosion Effects on the Protective Device
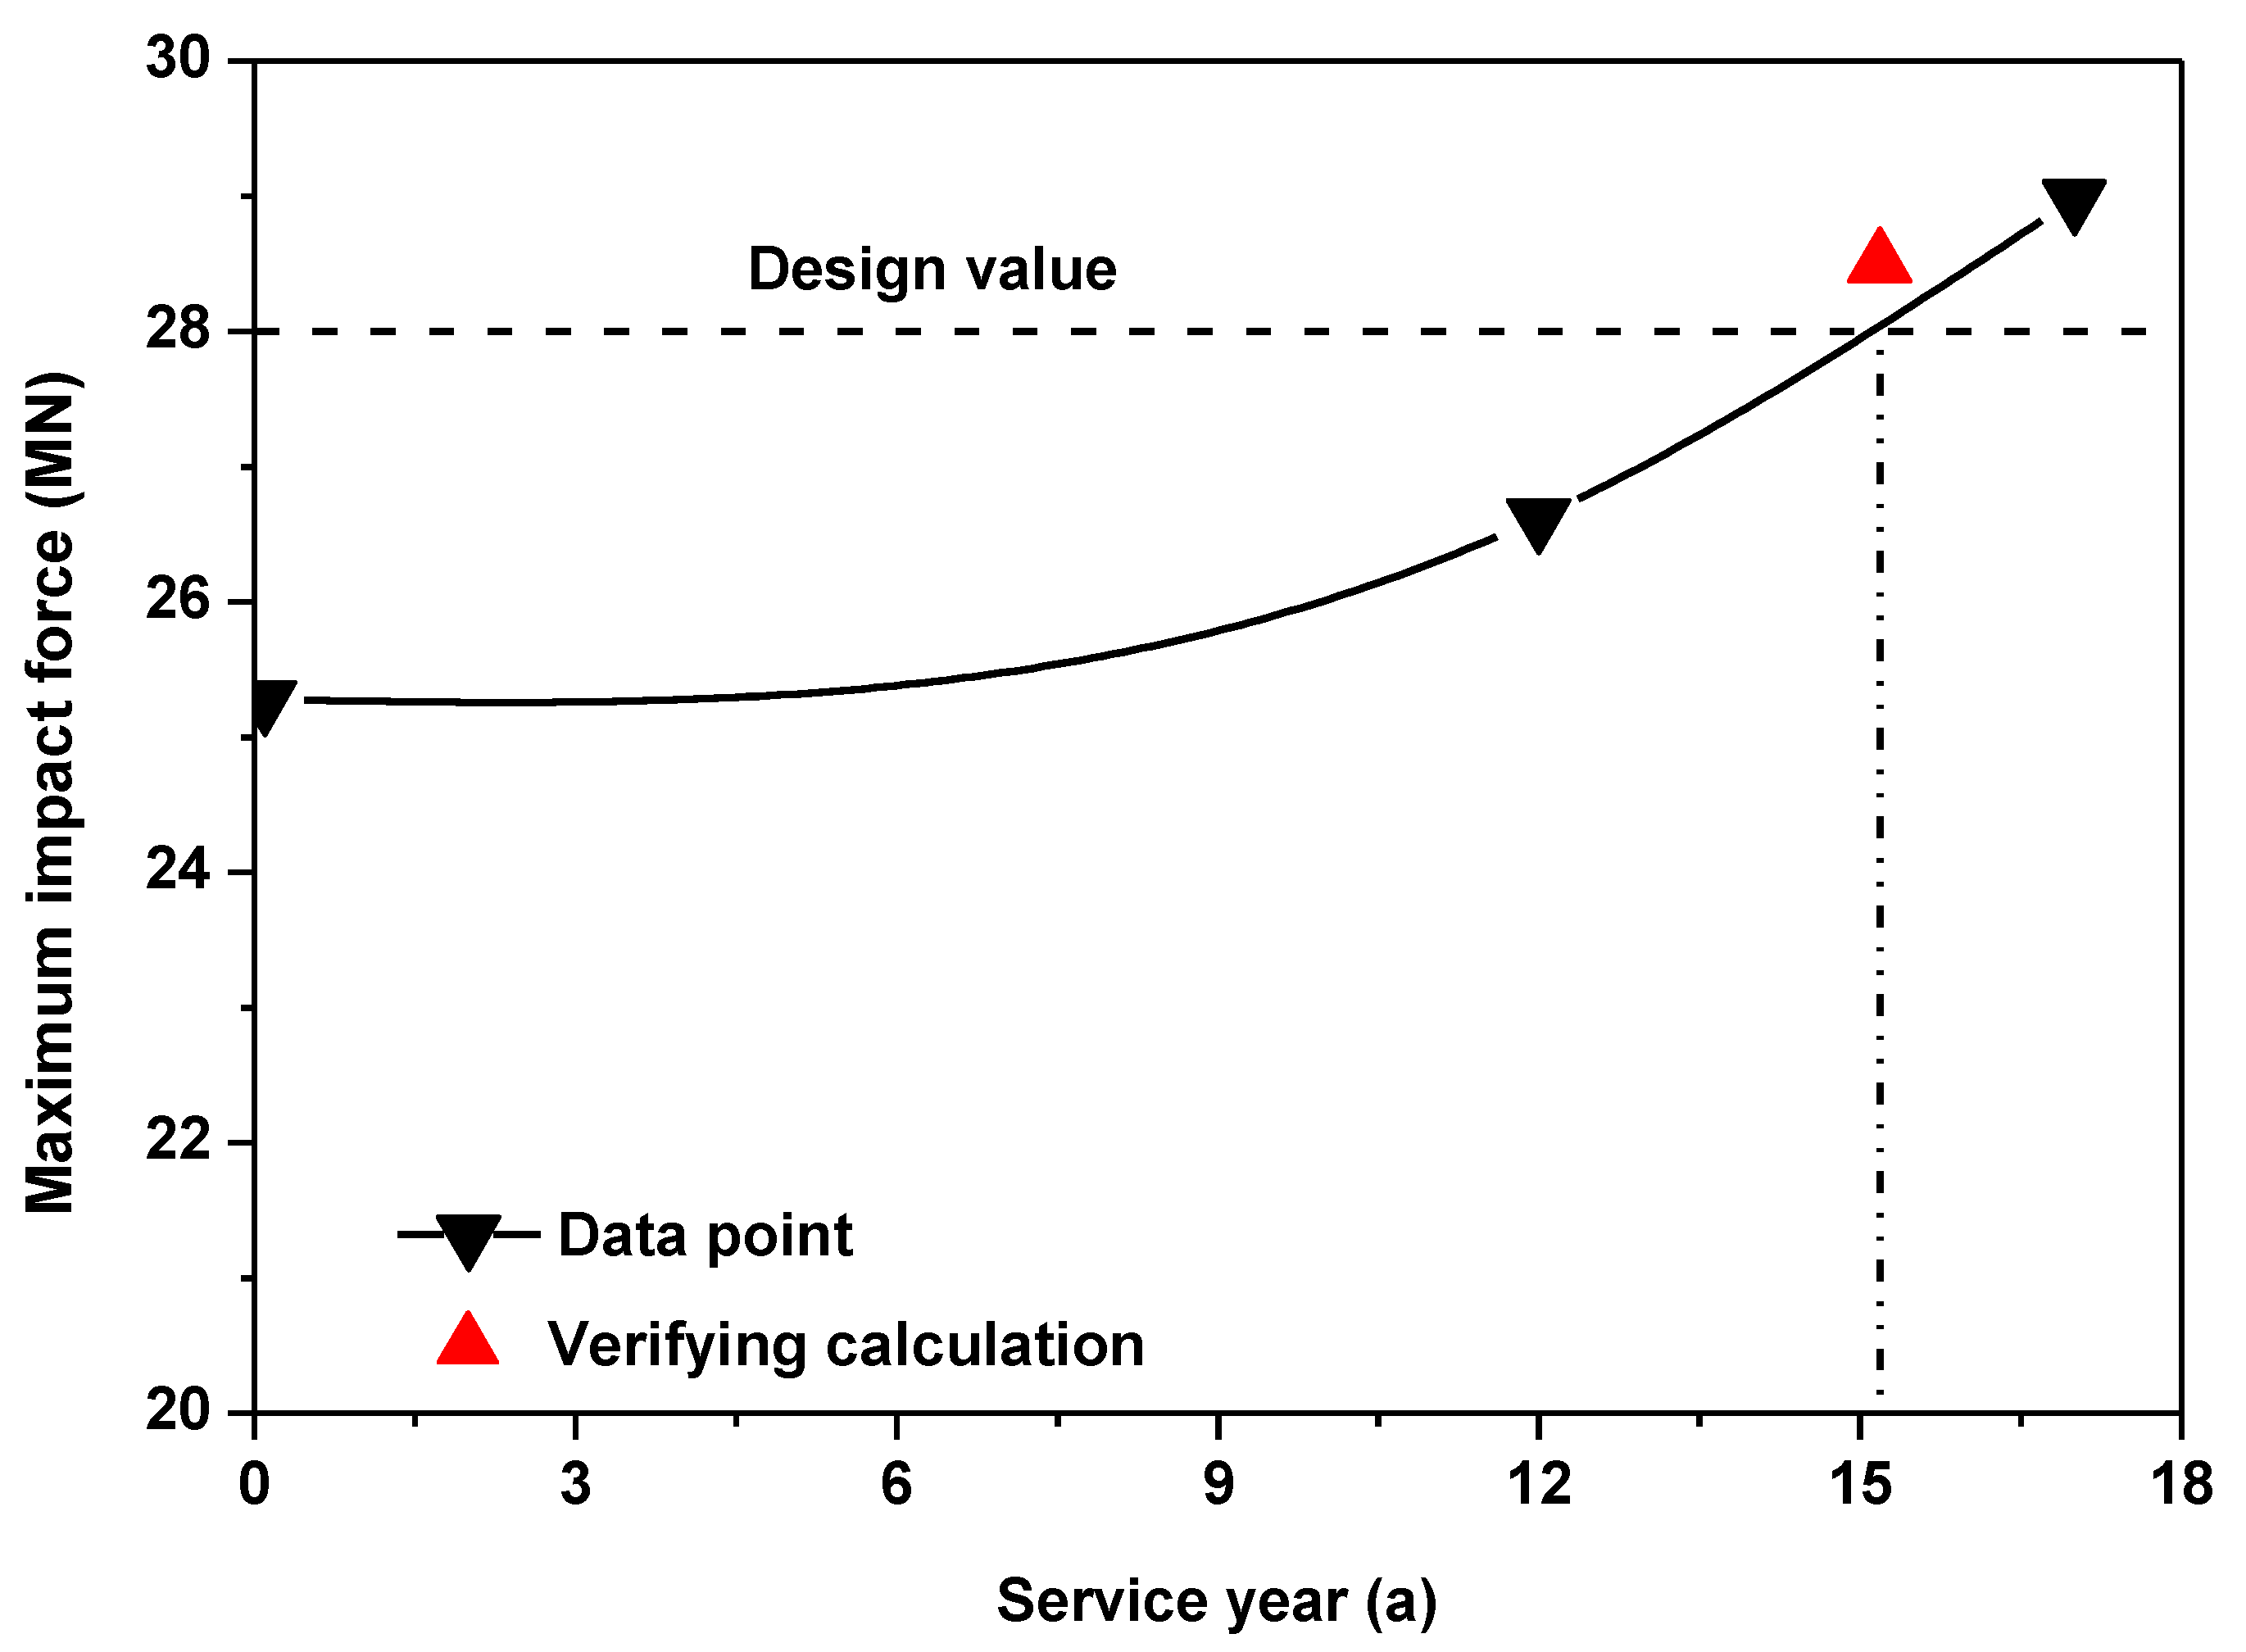
Models of the protective device in the original design, with current corrosion, and with predicted further corrosion were built separately. Simulation results are listed in Table 11. The lowest maximum impact force experienced by the bridge piers occurs in case 3 (25.28 MN) and the highest maximum impact force increases as corrosion continues, with values in cases 4 and 5 of 26.62 MN and 28.98 MN respectively, increases of 5.3% and 14.6% respectively from the original design state. It is worth noting that the maximum impact force in case 5 exceeds the ultimate design value (28 MN), which means that the protective device cannot meet design requirements in this predicted further corrosion state. Reaction force histories are shown in Figure 6, in which the shape of the reaction force history with the original design is somewhat rectangular, revealing that the range of variation of the impact force is greater with the original design than in the corrosion states. The ship collision is the most severe in the predicted further corrosion state: not only is the peak value of the reaction force (28.98 MN) higher, but also the variation of the reaction force and the corresponding acceleration velocity is more turbulent, with higher acceleration velocity than in the other two cases.
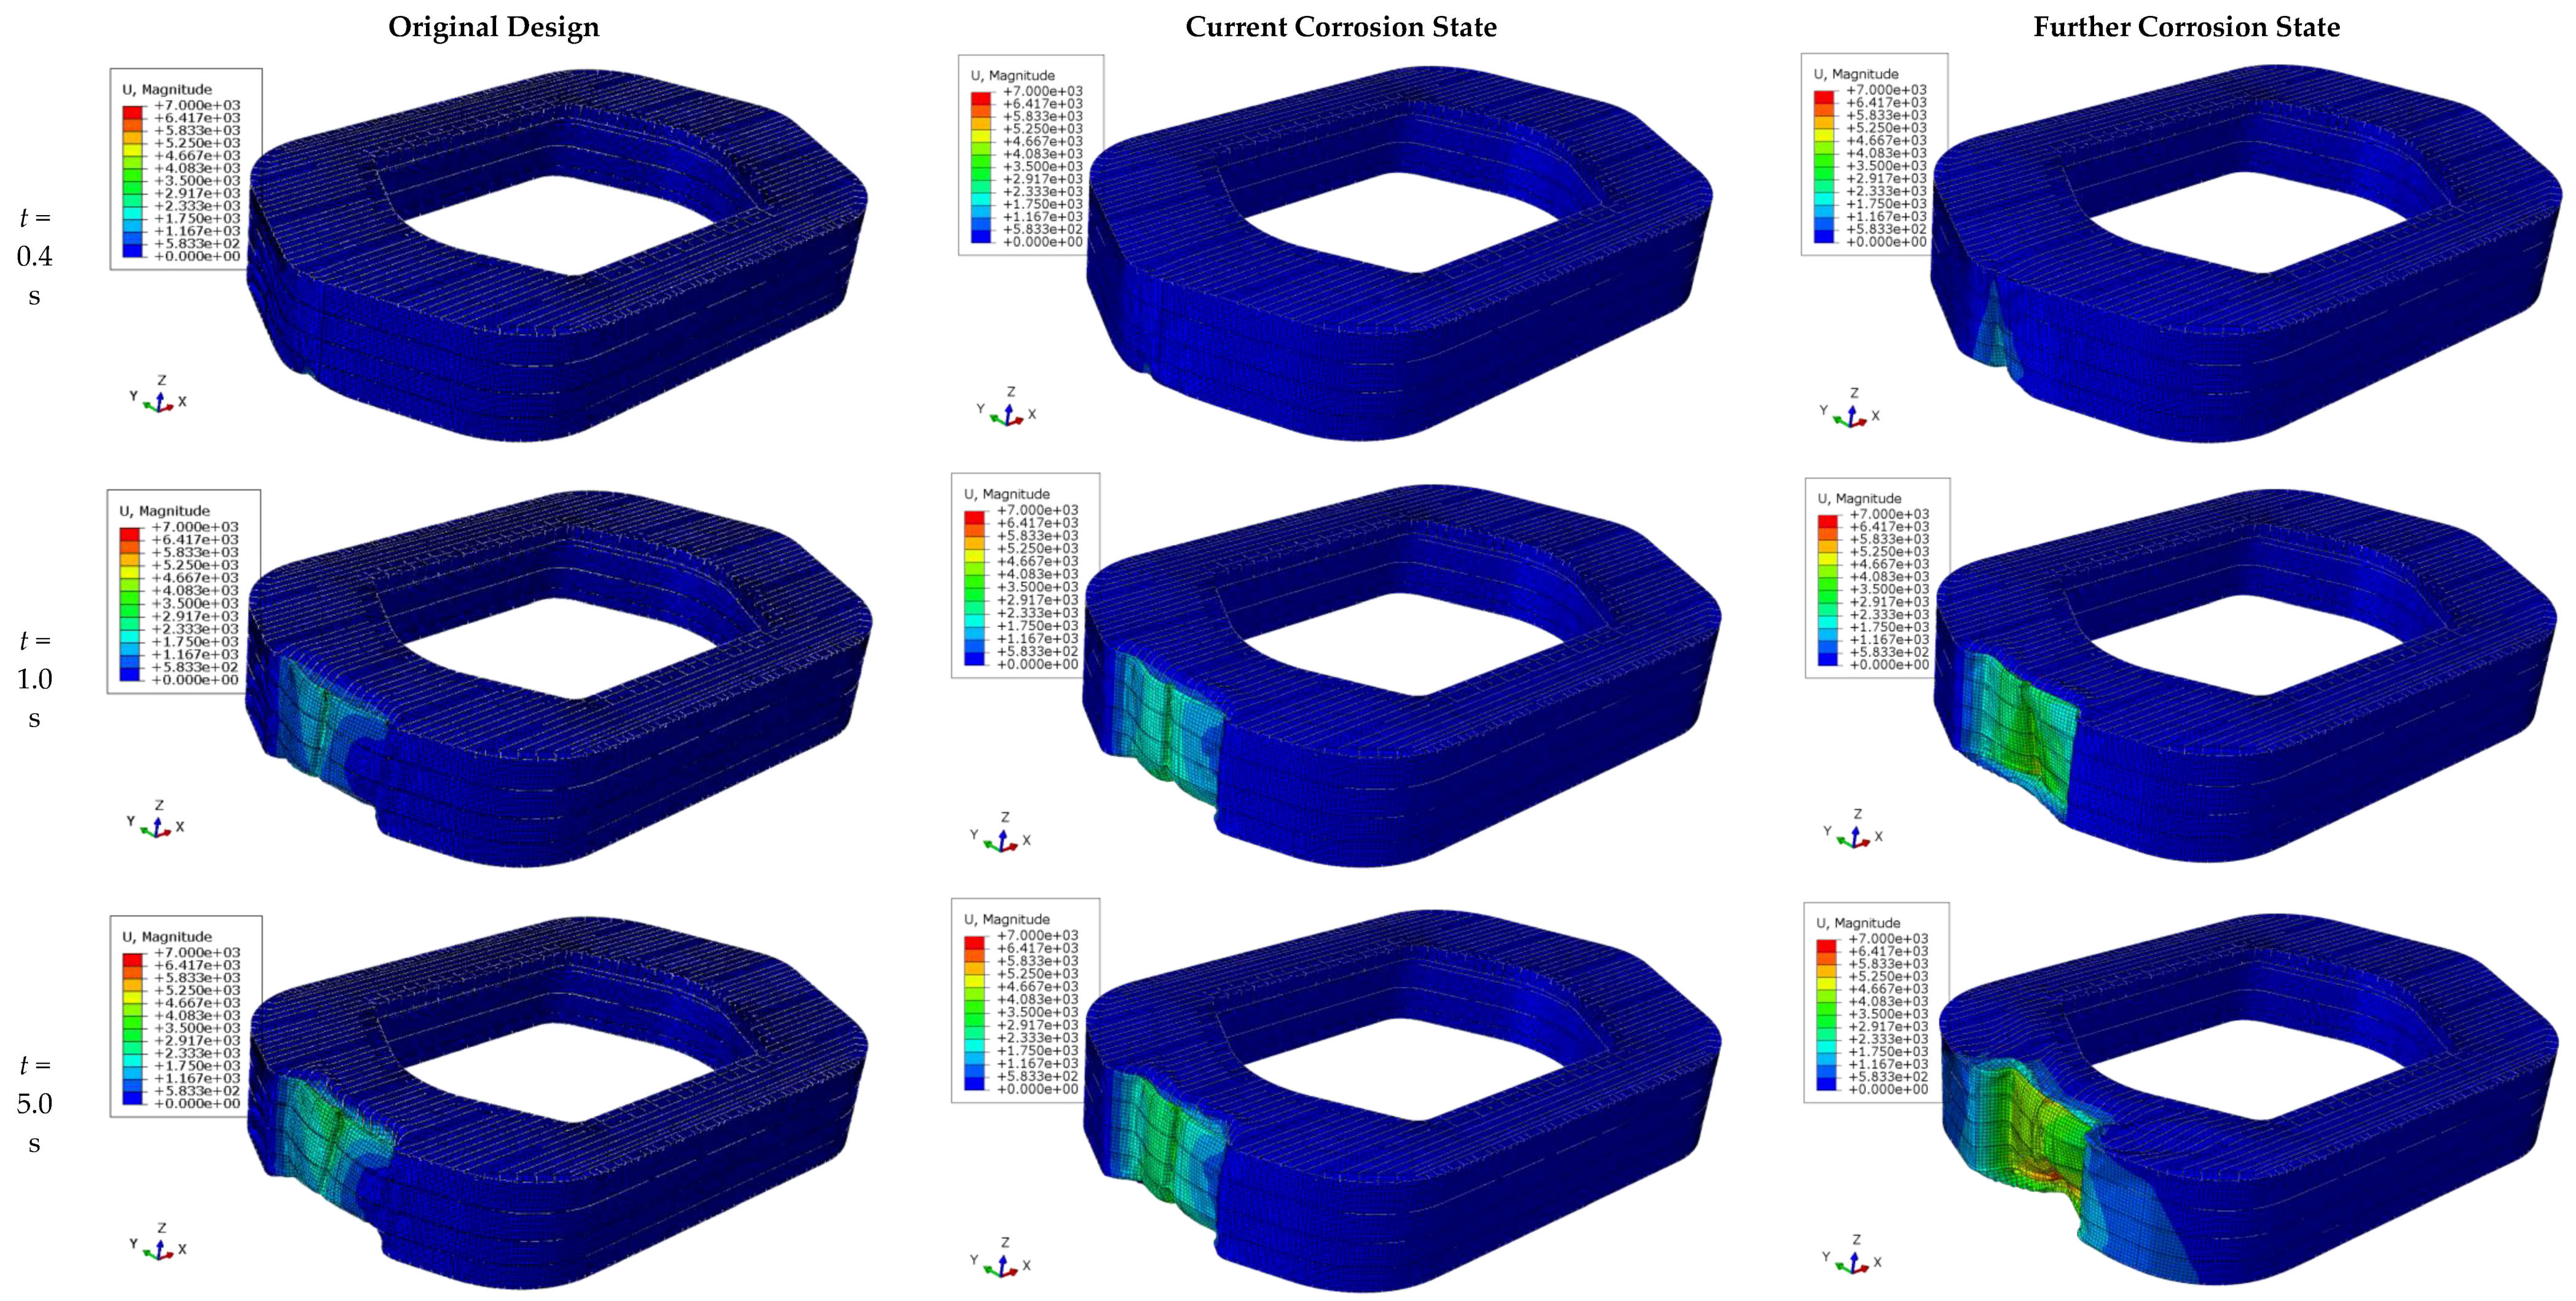
The buffering effect of the protective device tended to be less when the plate thickness decreased under the action of corrosion, and the extent of corresponding structural deformation was more severe once the ship collision occurred. Deformation responses of the protective device during impact are shown in Figure 7. In the beginning stage of impact, the protective device in the further corrosion state deforms most easily. During the entire impact process, the extent of deformation and damage of the protective device is the greatest in the further corrosion state.
5.3. Prediction of Performance Degradation
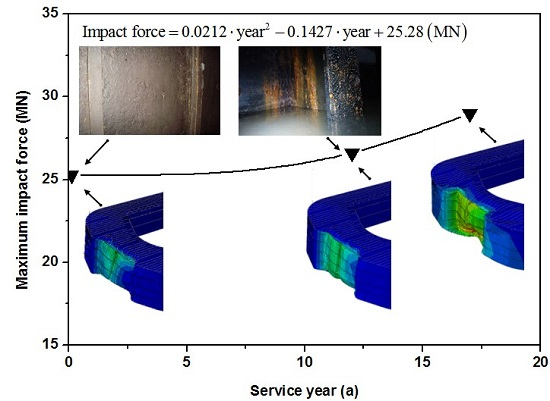
The protective device was a large-scale shell structure assembled with different steel components located in different corrosion zones. As the corrosion characteristics in the spray zone, the tidal zone, and the full immersion zone differed, and the size of steel components could also influence the corrosion process, it was difficult to accurately quantify the overall corrosion response of the protective device. Moreover, ship collision is a complex impact process that involves problems of material nonlinearity (metal plasticity and rubber hyperelasticity), geometric nonlinearity (large deformation), and boundary nonlinearity (boundary variation). All these factors increase the difficulty in predicting the anti-collision performance of the protective device after further corrosion. Based on the simulation results discussed here, a polynomial equation is proposed to judge the variation trend of the maximum impact force. Then a new case is calculated to judge the validity of the equation through comparison with the design value. The anti-collision performance of the protective devices is further discussed from the perspectives of ship stroke and residual mass of the device.
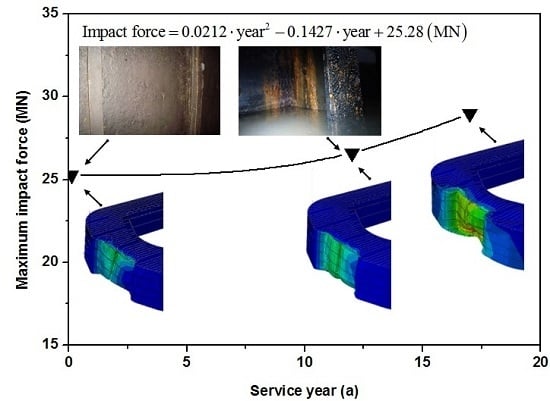
The maximum impact forces under different corrosion states were calculated and are listed in Table 11. According to these data plotted in Figure 8, a prediction equation (Equation (1)) was derived by a polynomial fitting method to show the evolution trend:
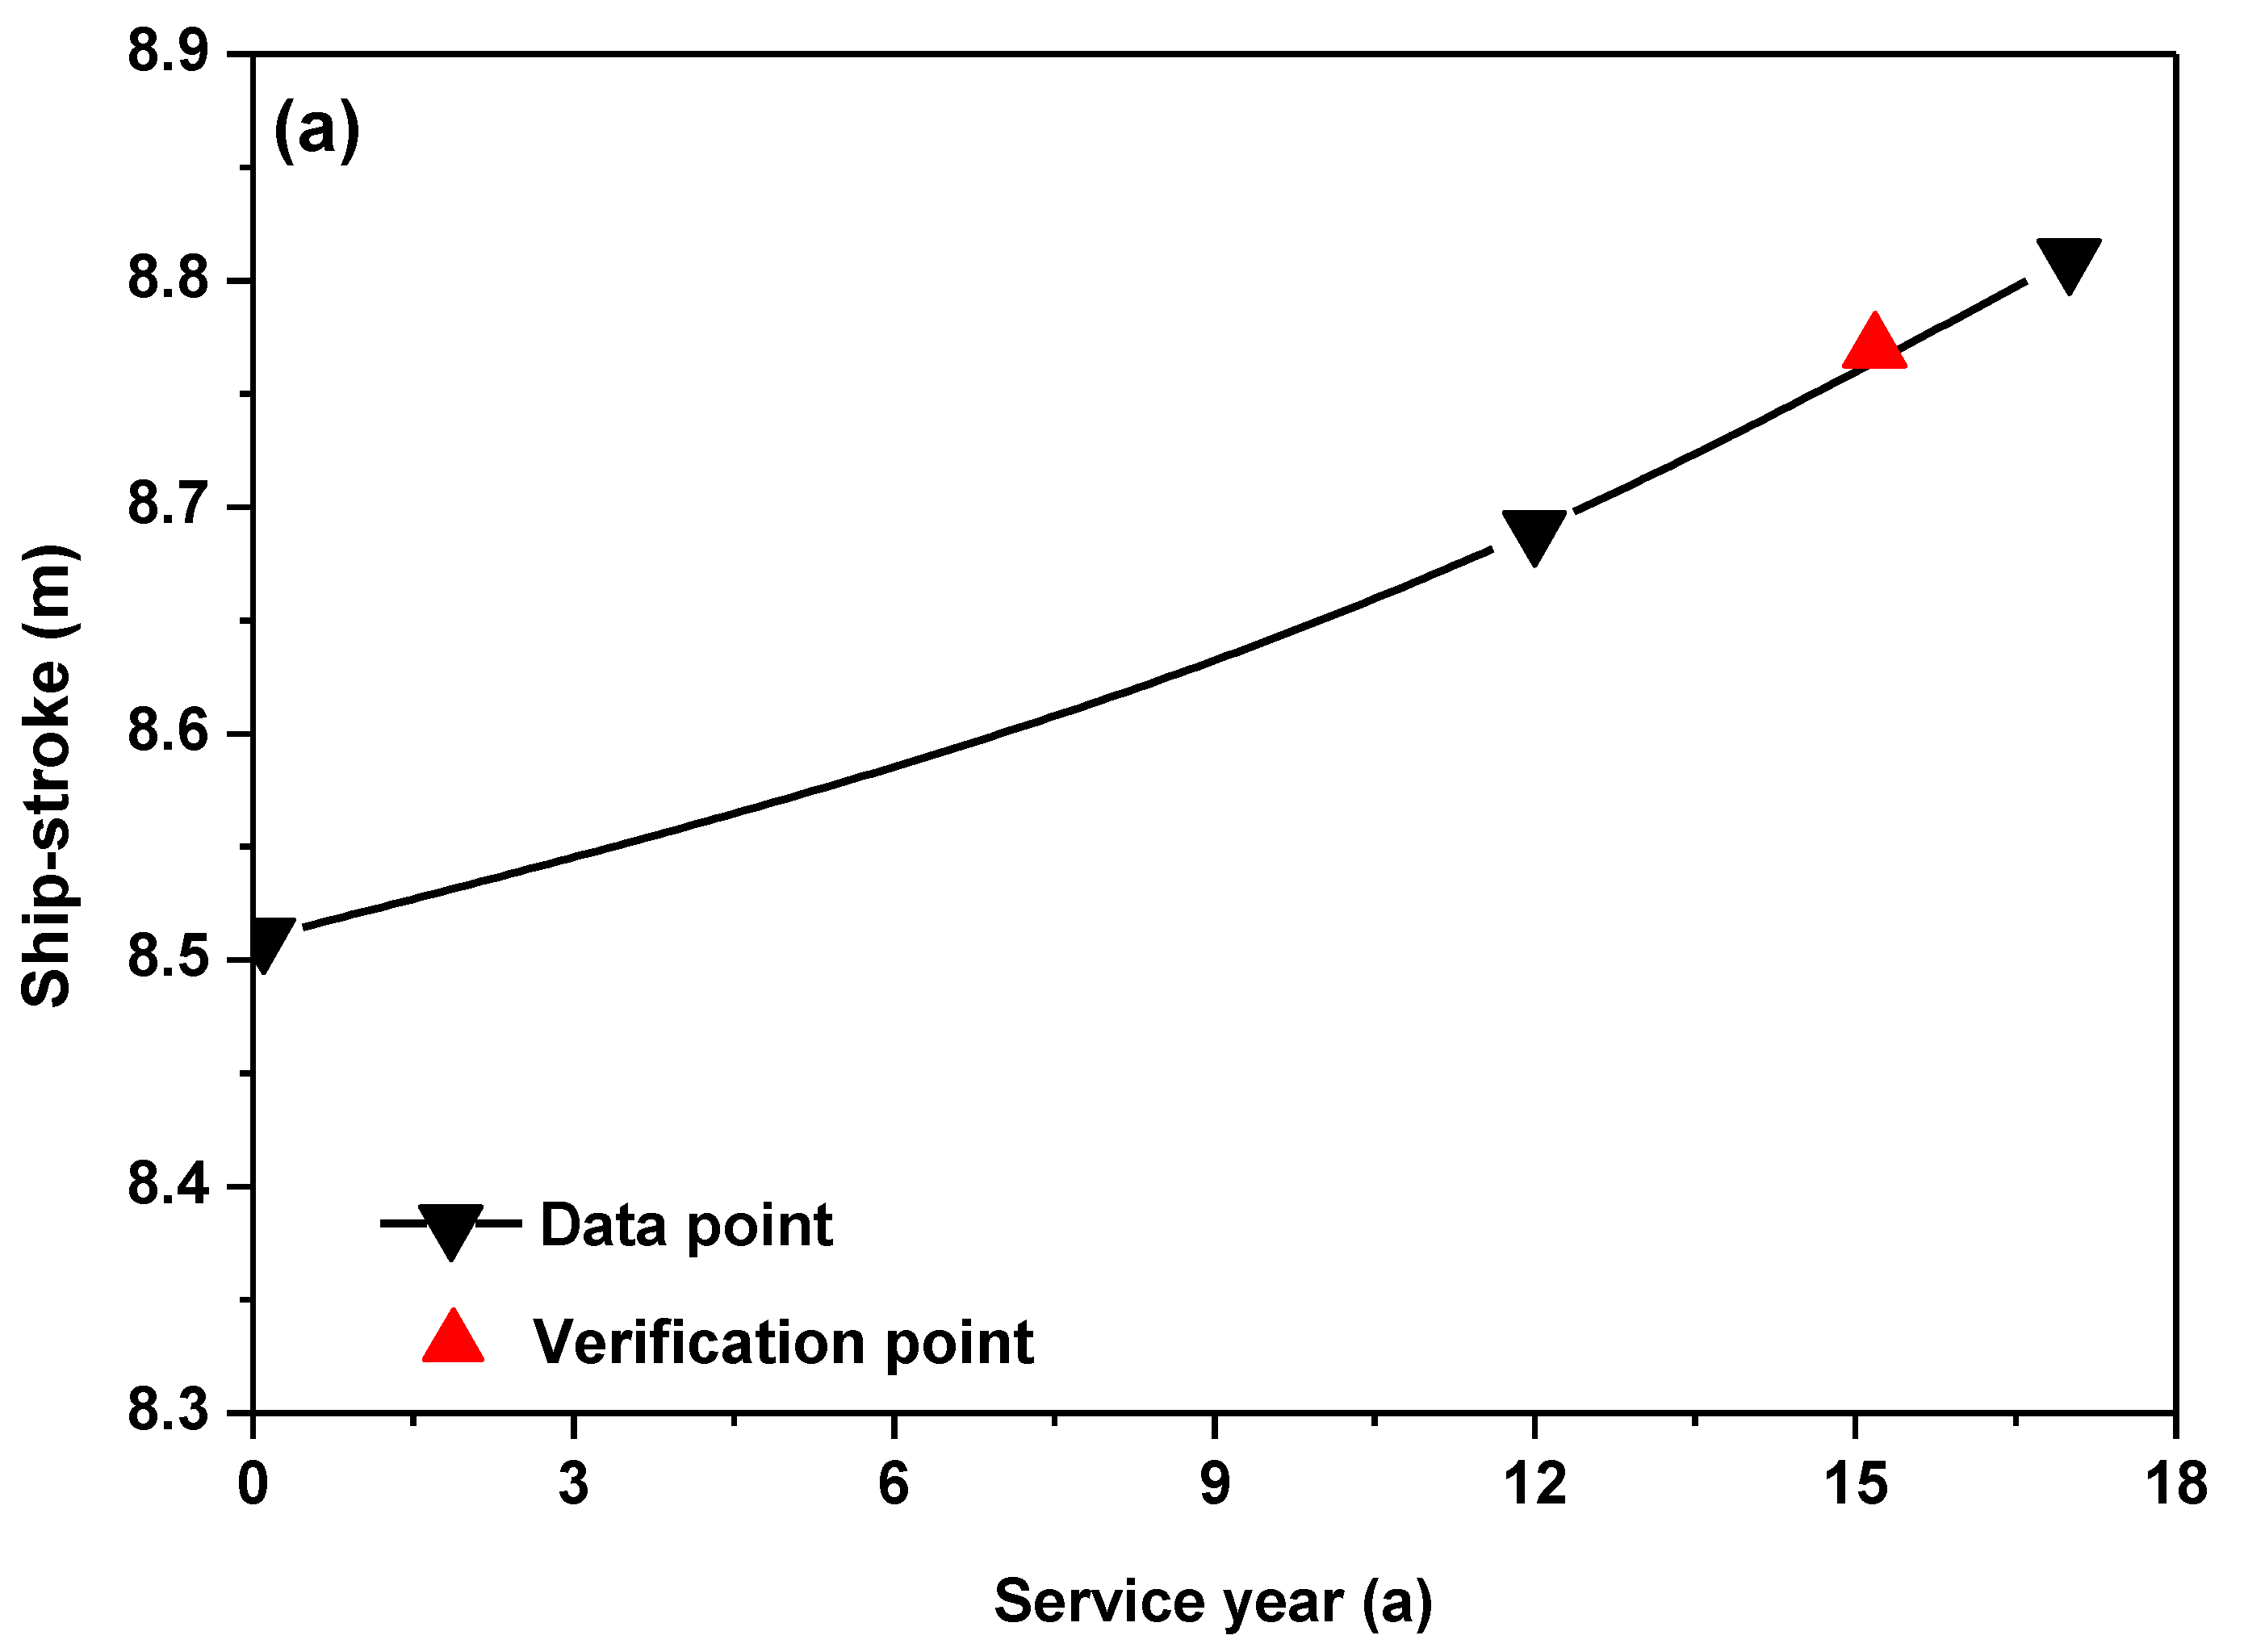
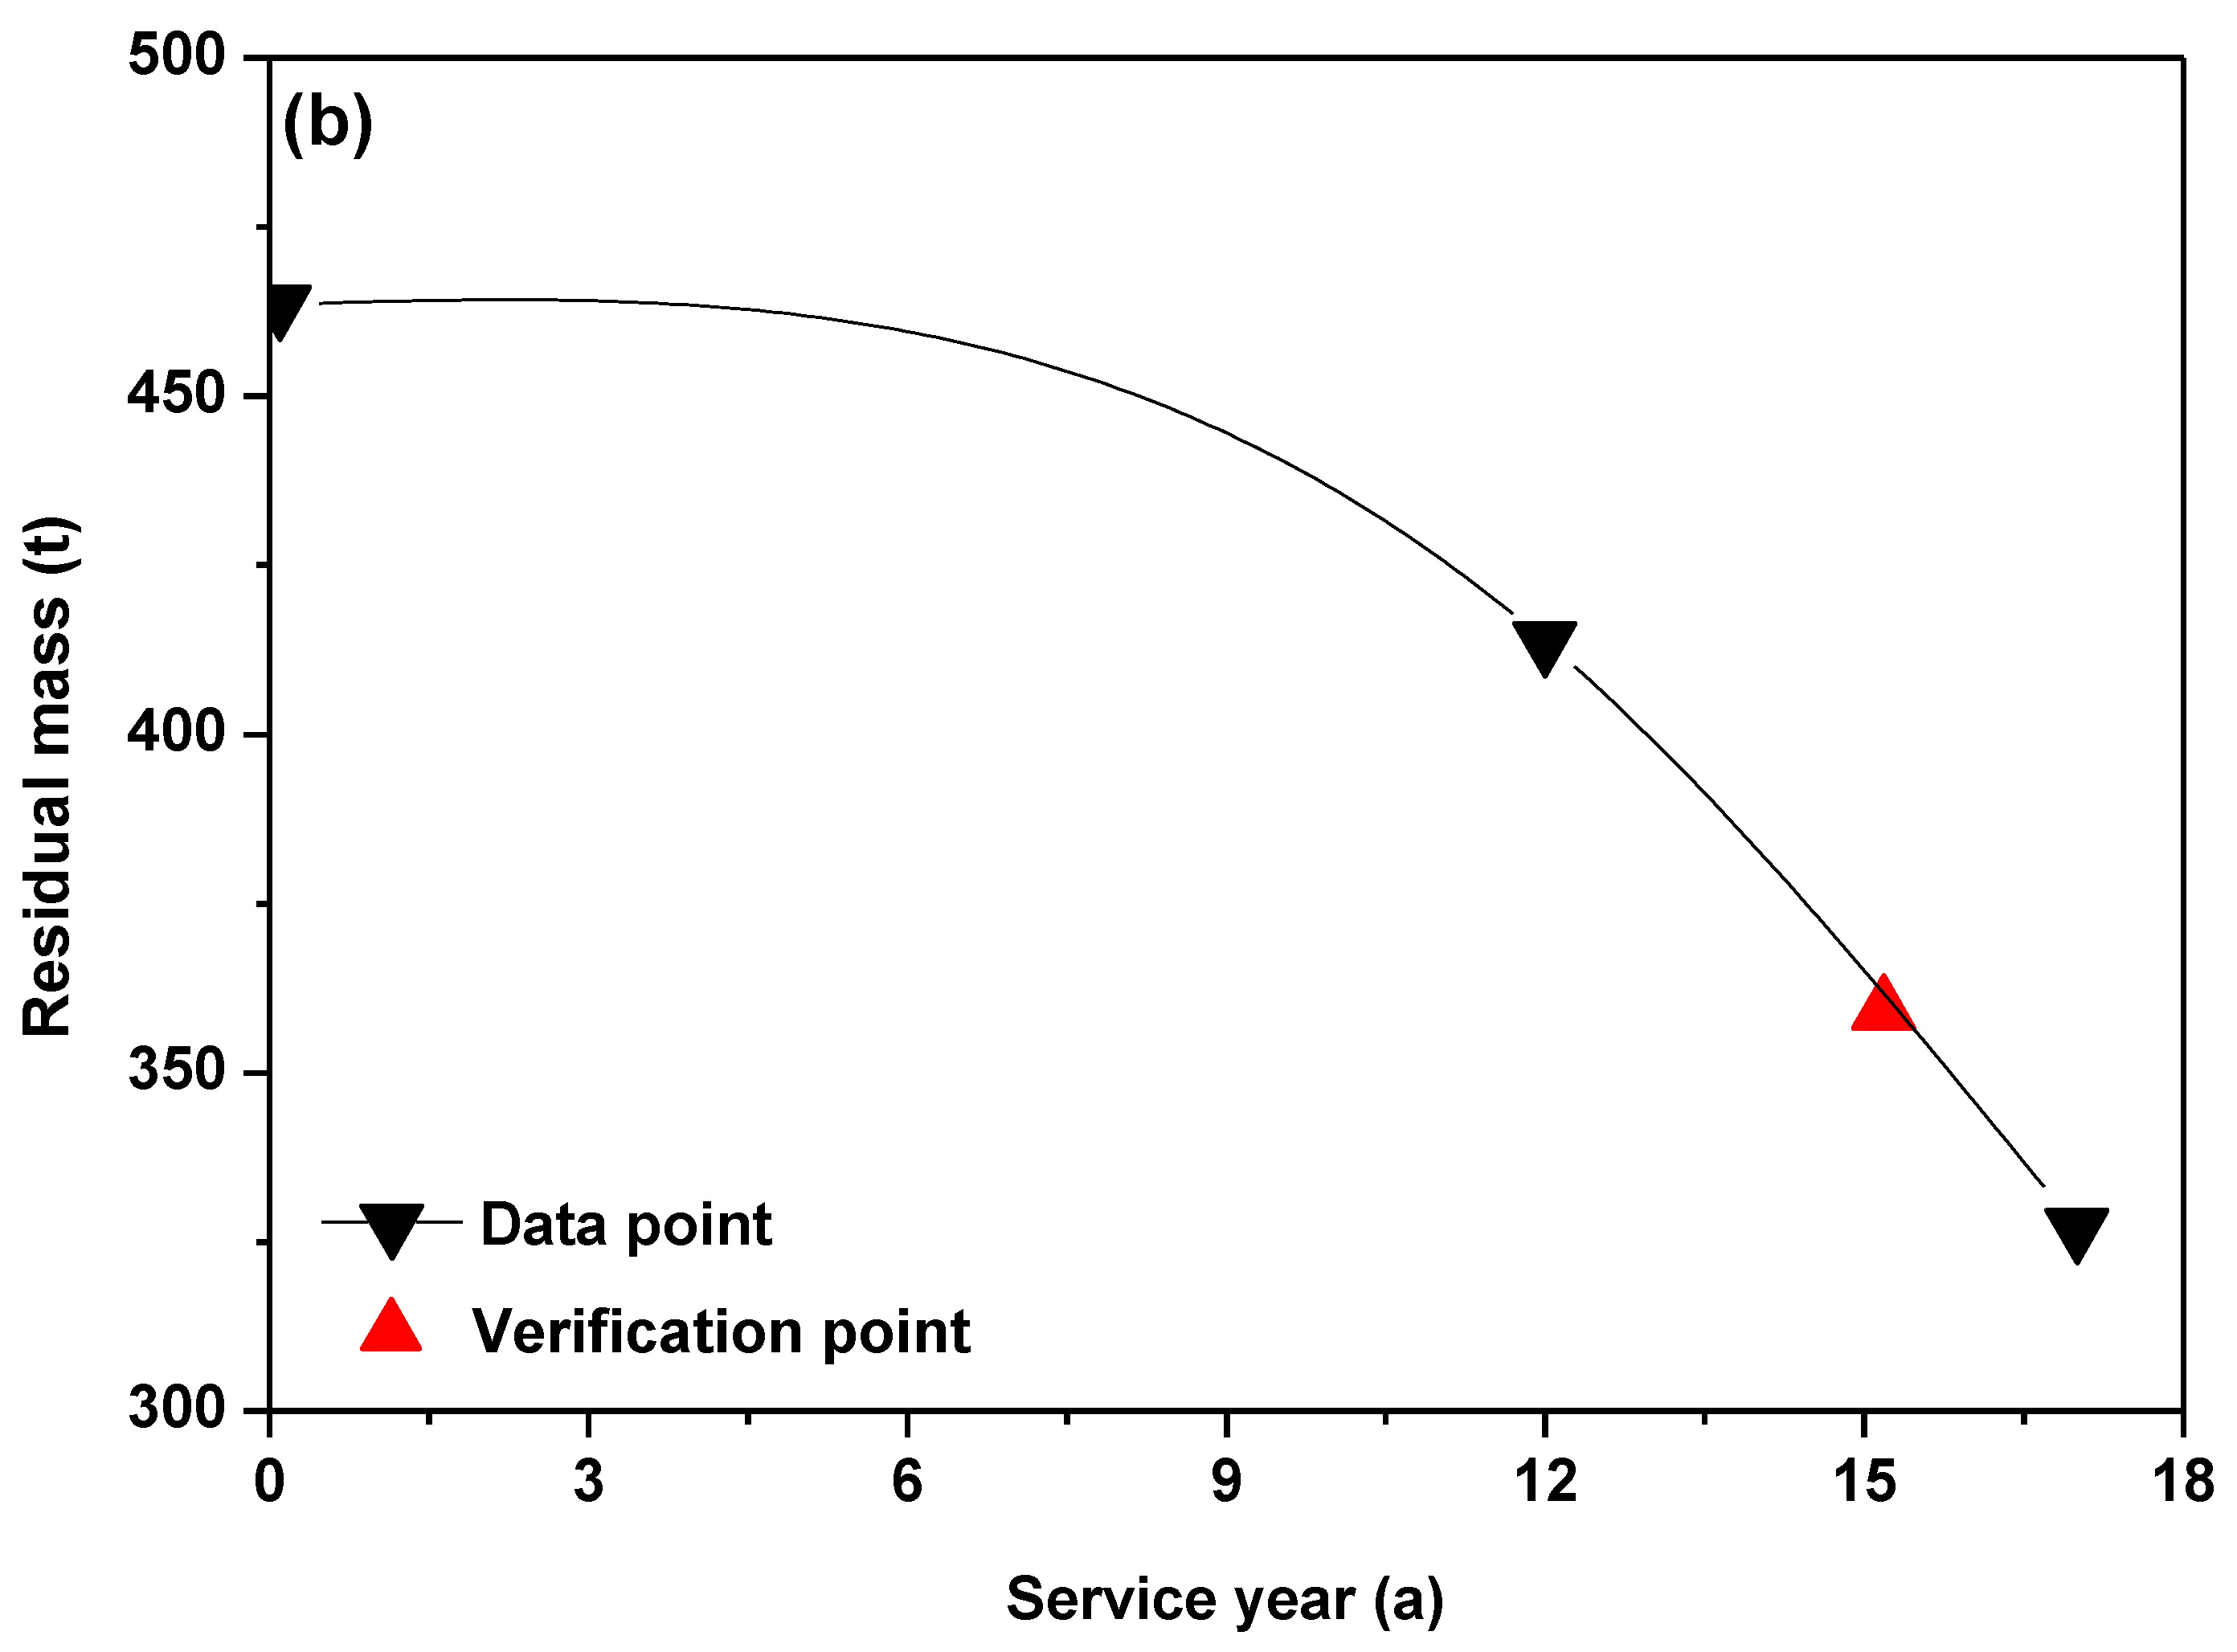
With substitution of the design value (28 MN) into Equation (1), the calculated service life was 15.18 years. A new FE model was built up considering the corrosion effect after 15.18 years. The upper triangle (with red color) in Figure 8 represents the maximum reaction force calculated with the new FE model, and it is evident that it matches the evolution trend well. The evolution trend of anti-collision performance follows a quadratic nonlinear relationship and is unlike the corrosion effect of the steel component, which is determined by a unique spot in the marine environment and is an approximately linear relationship [5]. To further investigate the corrosion response in the protective device, other impact factors were analyzed and verified by this simulation case, from which the corresponding data points and fitted curves are shown in Figure 9. Each verification point falls exactly on the respective fitting curve, which means that, under the corrosion effect, both the quadratic curves plotted are valid and they fit the variation trend of each factor well. Therefore, the variation trend of device’s anti-collision response follows a quadratic nonlinear relationship under the corrosion effect, which is unlike the linearly changing corrosion effect, because too many influencing factors are involved. However, prediction of this variation trend depends merely on three calculation values referring to different corrosion durations, respectively.
6. Conclusions
When the Yamen Bridge protective device located in the Pearl River estuary had been in active service for 12 years, on-site measurement was utilized to detect its current corrosion response. Further, the evolution of its corrosion was predicted based on measurement data and corresponding theories. The anti-collision performance of the protective device was analyzed taking into account the corrosion effect, and a performance prediction method was proposed. If a ship’s impact is too weak to damage the protective device’s steel components, the anti-collision effect of the buffer rubber is considerable, but if the ship’s impact is so great that it must be resisted through structural damage within the protective device, the buffer rubber plays almost no role. The anti-collision response of the protective device under the corrosion effect followed a quadratic nonlinear variation trend that was accurately predicted by a quadratic curve determined by three calculation values with reference to different corrosion durations.
Acknowledgments
This study was partially supported by “Haiou Talent Plan” of Qinzhou City, China. We would like to thank Chengbi Zhao from South China University of Technology for his valuable comments in this study.
Author Contributions
Y.T., W.L. and A.Q. conceived and designed the analysis; A.Q. performed the experiments; A.Q. and X.H. analyzed the data; H.Q. contributed analysis tools; A.Q. and W.L. wrote the paper.
Conflicts of Interest
The authors declare no conflict of interest.
References
- Maureen, W.; Lisa, V.A.A.; Lorenzo, V.W. Corrosion-Related Accidents in Petroleum Refineries: Lessons Learned from Accidents in EU and OECD Countries; Publications Office of the European Union: Luxembourg, 2013. [Google Scholar]
- Velazquez, J.; Van Der Weide, J.; Hernandez, E.; Hernandez, H.H. Statistical modeling of pitting corrosion: Extrapolation of the maximum pit depth growth. Int. J. Electrochem. Sci. 2014, 9, 4129–4143. [Google Scholar]
- Khan, F.; Howard, R. Statistical approach to inspection planning and integrity assessment. Insight-Non-Destr. Test. Cond. Monit. 2007, 49, 26–36. [Google Scholar] [CrossRef]
- Roberge, P.R. Corrosion Engineering: Principles and Practice; McGraw-Hill Professional: New York, NY, USA, 2008. [Google Scholar]
- Bhandari, J.; Khan, F.; Abbassi, R.; Garaniya, V.; Ojeda, R. Modelling of pitting corrosion in marine and offshore steel structures—A technical review. J. Loss Prevent. Proc. 2015, 37, 39–62. [Google Scholar] [CrossRef]
- Ramana, K.V.S.; Anita, T.; Mandal, S.; Kaliappan, S.; Shaikh, H.; Sivaprasad, P.V.; Dayal, R.K.; Khatak, H.S. Effect of different environmental parameters on pitting behavior of AISI type 316L stainless steel: Experimental studies and neural network modeling. Mater. Des. 2009, 30, 3770–3775. [Google Scholar] [CrossRef]
- Younis, A.A.; EI-Sabbah, M.M.B.; Holze, R. The effect of chloride concentration and pH on pitting corrosion of AA7075 aluminum alloy coated with phenyltrimethoxysilane. J. Solid State Electrochem. 2012, 16, 1033–1040. [Google Scholar] [CrossRef]
- Zakowski, K.; Narozny, M.; Szocinski, M.; Darowicki, K. Influence of water salinity on corrosion risk-the case of the southern Baltic Sea coast. Environ. Monit. Assess. 2014, 186, 4871–4879. [Google Scholar] [CrossRef] [PubMed]
- Zamaletdinov, I.I. Pitting on passive metals. Prot. Met. 2007, 43, 470–475. [Google Scholar] [CrossRef]
- Melchers, R.E. Pitting corrosion of mild steel in marine immersion environment-Part 2: Variability of maximum pit depth. Corrosion 2004, 60, 937–944. [Google Scholar] [CrossRef]
- Li, H.; Yu, H.; Zhou, T.; Yin, B.; Yin, S.; Zhang, Y. Effect of tin on the corrosion behavior of sea-water corrosion-resisting steel. Mater. Des. 2015, 84, 1–9. [Google Scholar] [CrossRef]
- Calabrese, L.; Proverbio, E.; Galtieri, G.; Borsellino, C. Effect of corrosion degradation on failure mechanisms of aluminium/steel clinched joints. Mater. Des. 2015, 87, 473–481. [Google Scholar] [CrossRef]
- Chen, Y.; Zhang, H.; Zhang, J.; Li, X.; Zhou, J. Failure analysis of high strength pipeline with single and multiple corrosions. Mater. Des. 2015, 67, 552–557. [Google Scholar] [CrossRef]
- Ahn, J.H.; Cheung, J.H.; Lee, W.H.; Oh, H.; Kim, I.T. Shear buckling experiments of web panel with pitting and through-thickness corrosion damage. J. Constr. Steel Res. 2015, 115, 290–302. [Google Scholar] [CrossRef]
- Lu, G.; Yu, T. Energy Absorption of Structures and Materials; Woodhead Publishing: Cambridge, UK, 2003. [Google Scholar]
- Macduff, T. The Probability of Vessel Collisions. Ocean Ind. 1974, 9, 144–148. [Google Scholar]
- Sha, Y.; Hao, H. Nonlinear finite element analysis of barge collision with a single bridge pier. Eng. Struct. 2012, 41, 63–76. [Google Scholar] [CrossRef]
- Laura, P.A.A.; Nava, L.C. An economic device for protecting bridge piers against ship collisions. Ocean Eng. 1981, 8, 331–333. [Google Scholar] [CrossRef]
- Wang, L.; Yang, L.; Huang, D.; Zhang, Z.; Chen, G. An impact dynamics analysis on a new crashworthy device against ship-bridge collision. Int. J. Impact Eng. 2008, 35, 895–904. [Google Scholar] [CrossRef]
- Qiu, A.; Lin, W.; Ma, Y.; Zhao, C.; Tang, Y. Novel material and structural design for large-scale marine protective devices. Mater. Des. 2015, 68, 29–41. [Google Scholar] [CrossRef]
- Qiu, A.; Fu, K.; Lin, W.; Zhao, C.; Tang, Y. Modelling low-speed drop-weight impact on composite laminates. Mater. Des. 2014, 60, 520–531. [Google Scholar] [CrossRef]
- Qiu, A.; Tang, Y.; Zhao, C.; Lin, W. Numerical investigation of transverse tensile behaviors of marine composites under different strain rates. Adv. Mater. Res. 2013, 774–776, 944–948. [Google Scholar] [CrossRef]
- Qiu, A.; Zhao, C.; Tang, Y.; Lin, W. Rapid predicting the impact behaviors of marine composite laminates. Mater. Sci. Forum 2015, 813, 19–27. [Google Scholar] [CrossRef]
- ASTM International. Standard Practice for Exposing and Evaluating Metals and Alloys in Surface Seawater; ASTM G52-00; ASTM International: West Conshohocken, PA, USA, 2011. [Google Scholar]
- Standards China. Technical Specification for Corrosion Protection of Steel Structures for Sea Port Construction. Chinese Standard JTS-153-3-2007. 2007. Available online: http://www.chinasybook.com (accessed on 14 August 2017).
- Li, J.; Bao, G. Main girder protective shell construction of Yamen Bridge. J. Chongqing Jiaotong Univ. 2003, 22, 11–13. [Google Scholar]
- Lu, G.; Wang, X. On the quasi-static piercing of square metal tubes. Int. J. Mech. Sci. 2002, 44, 1101–1115. [Google Scholar] [CrossRef]
- Zhan, D.; Zhang, L.; Zhao, C.; Wu, J.; Zhang, S. Numerical simulation and visualization of immersed tube tunnel maneuvering and immersing. J. Wuhan Univ. Technol. 2001, 25, 16–20. [Google Scholar]
- Johannes, V.I.; Green, M.A.; Brockley, C.A. The role of the rate of application of the tangential force in determining the static friction coefficient. Wear 1973, 24, 381–385. [Google Scholar] [CrossRef]
Figure 1.
Sketch of protective device (a) isometric view, (b) top view and (c) perspective view with a code of each cabin.
Figure 1.
Sketch of protective device (a) isometric view, (b) top view and (c) perspective view with a code of each cabin.
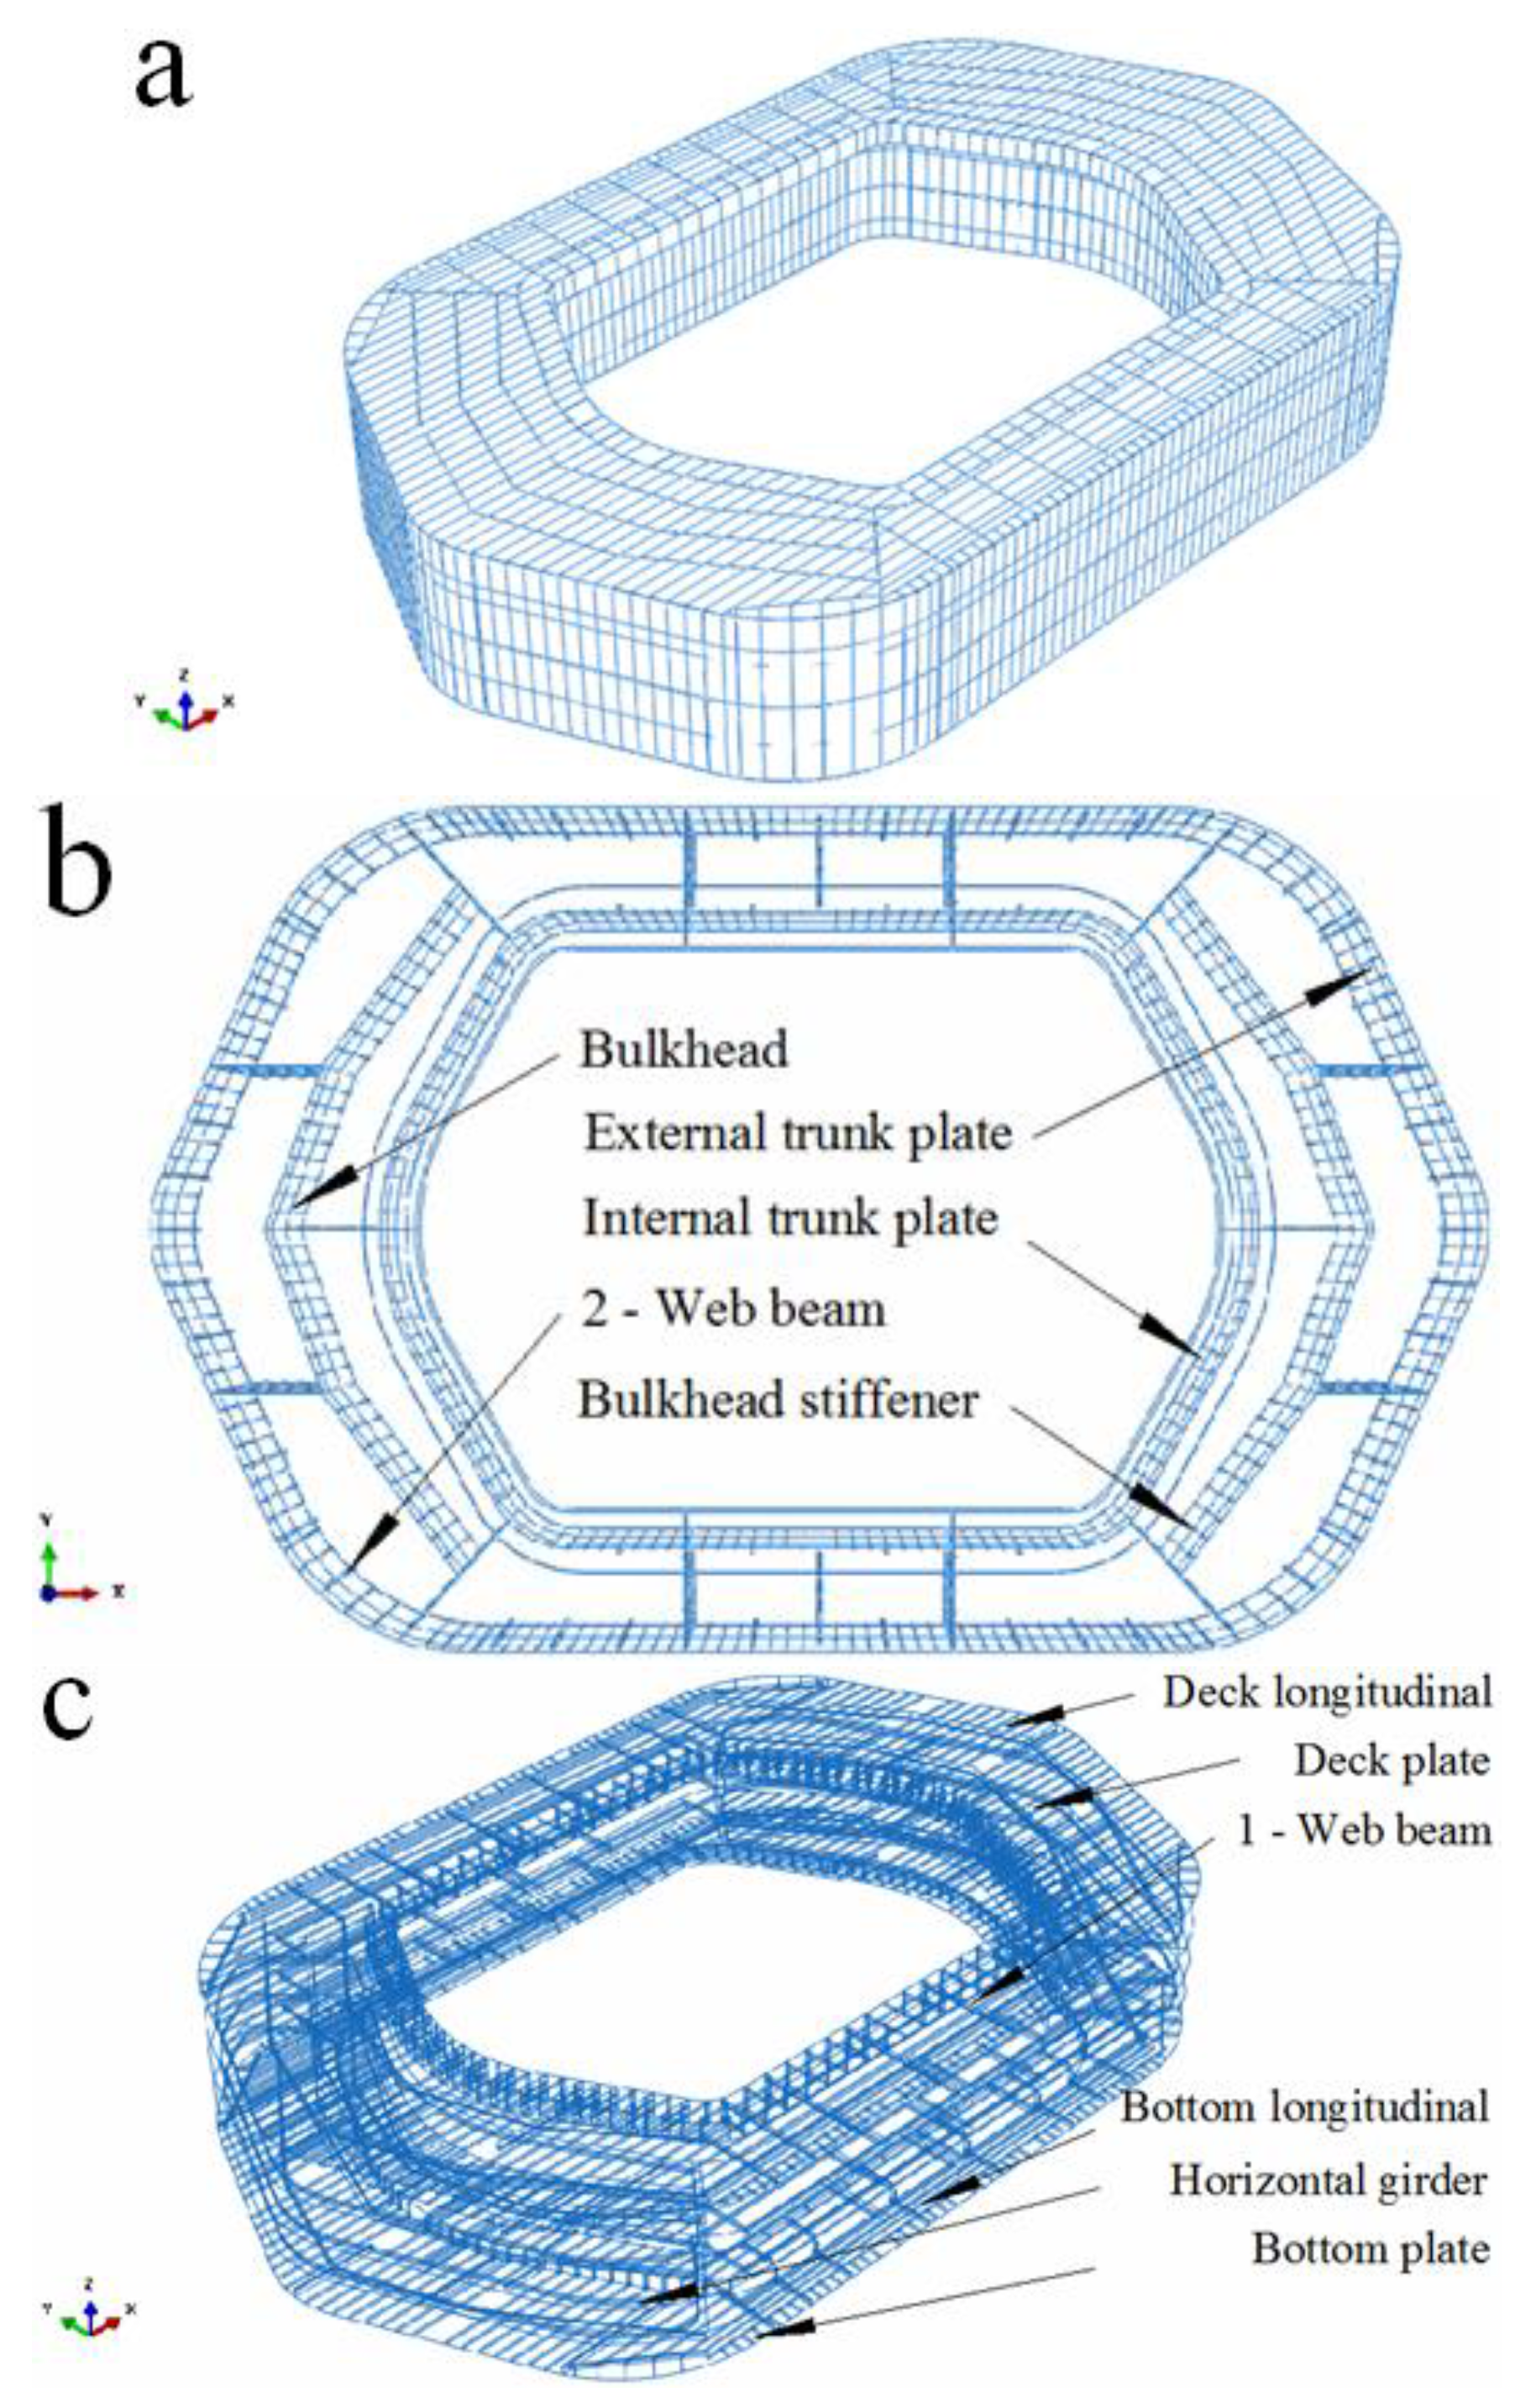
Figure 2.
Typical images of corrosion states within the protective device of (a) the spray zone, (b) the tidal zone and (c) the full immersion zone.
Figure 2.
Typical images of corrosion states within the protective device of (a) the spray zone, (b) the tidal zone and (c) the full immersion zone.
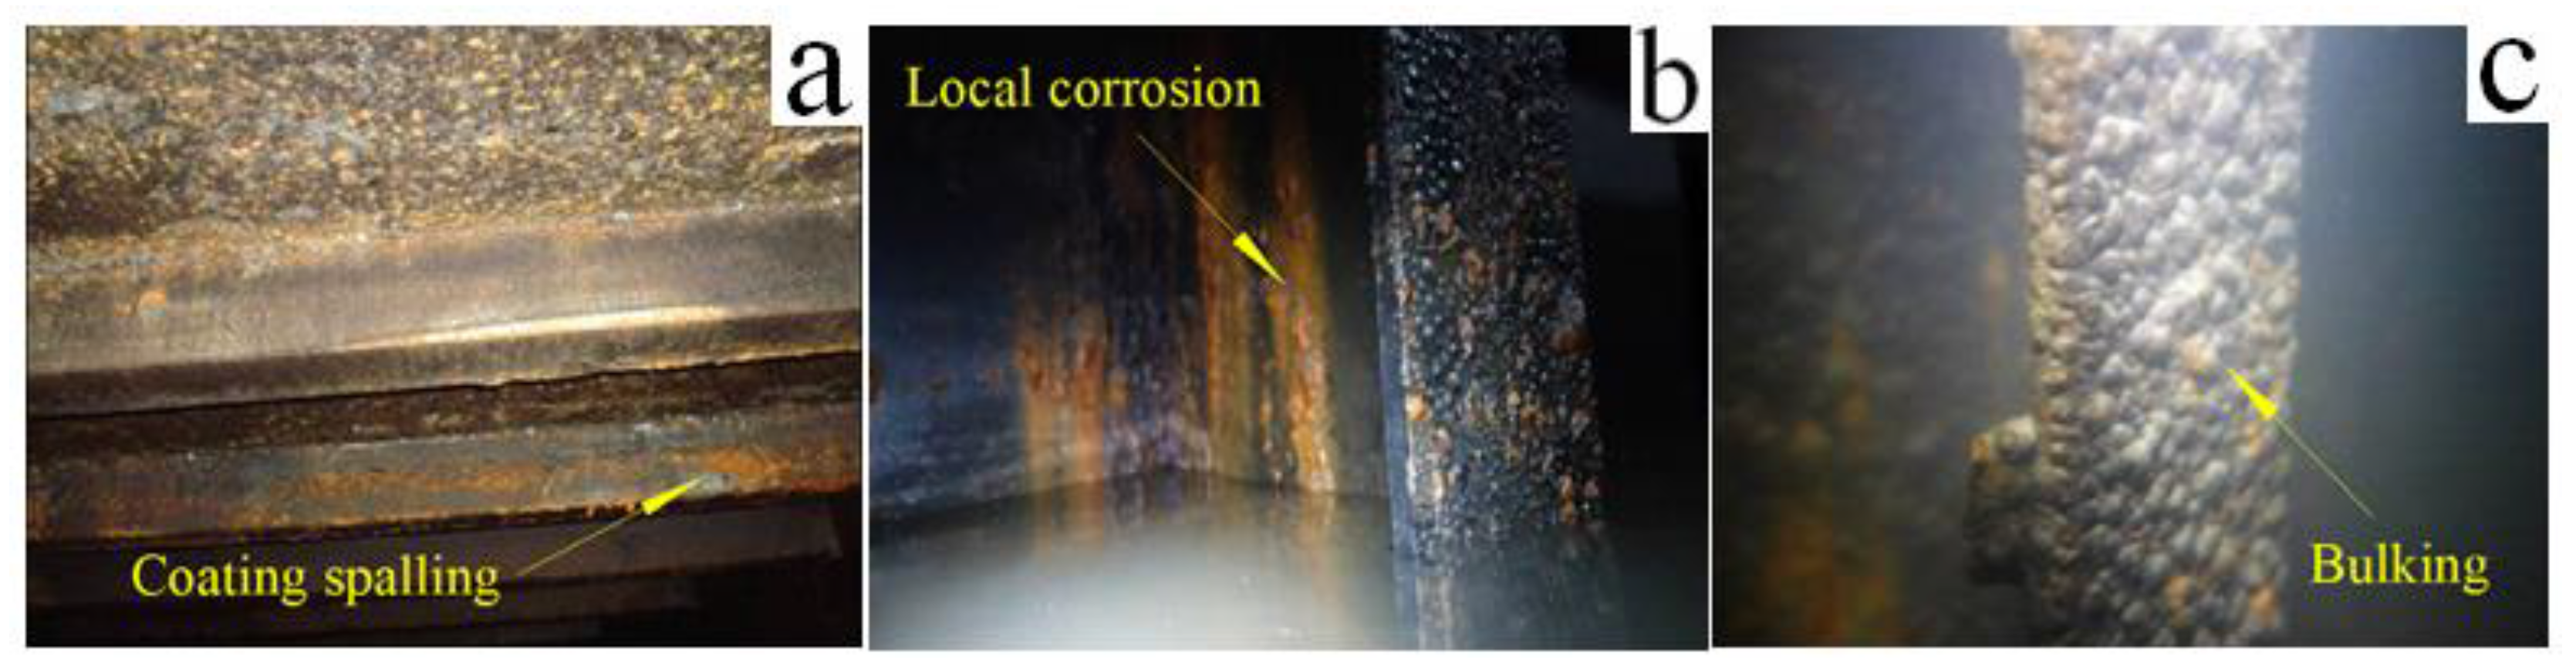
Figure 3.
FE model of the protective device (a) Integration sketch and (b) Inner frame sketch.

Figure 4.
Reaction force histories of bridge pier with and without buffer rubber equipment.

Figure 5.
Initial stage of reaction force histories of the bridge pier with and without buffer rubber.
Figure 5.
Initial stage of reaction force histories of the bridge pier with and without buffer rubber.

Figure 6.
Reaction force histories of the bridge pier under different corrosion states.
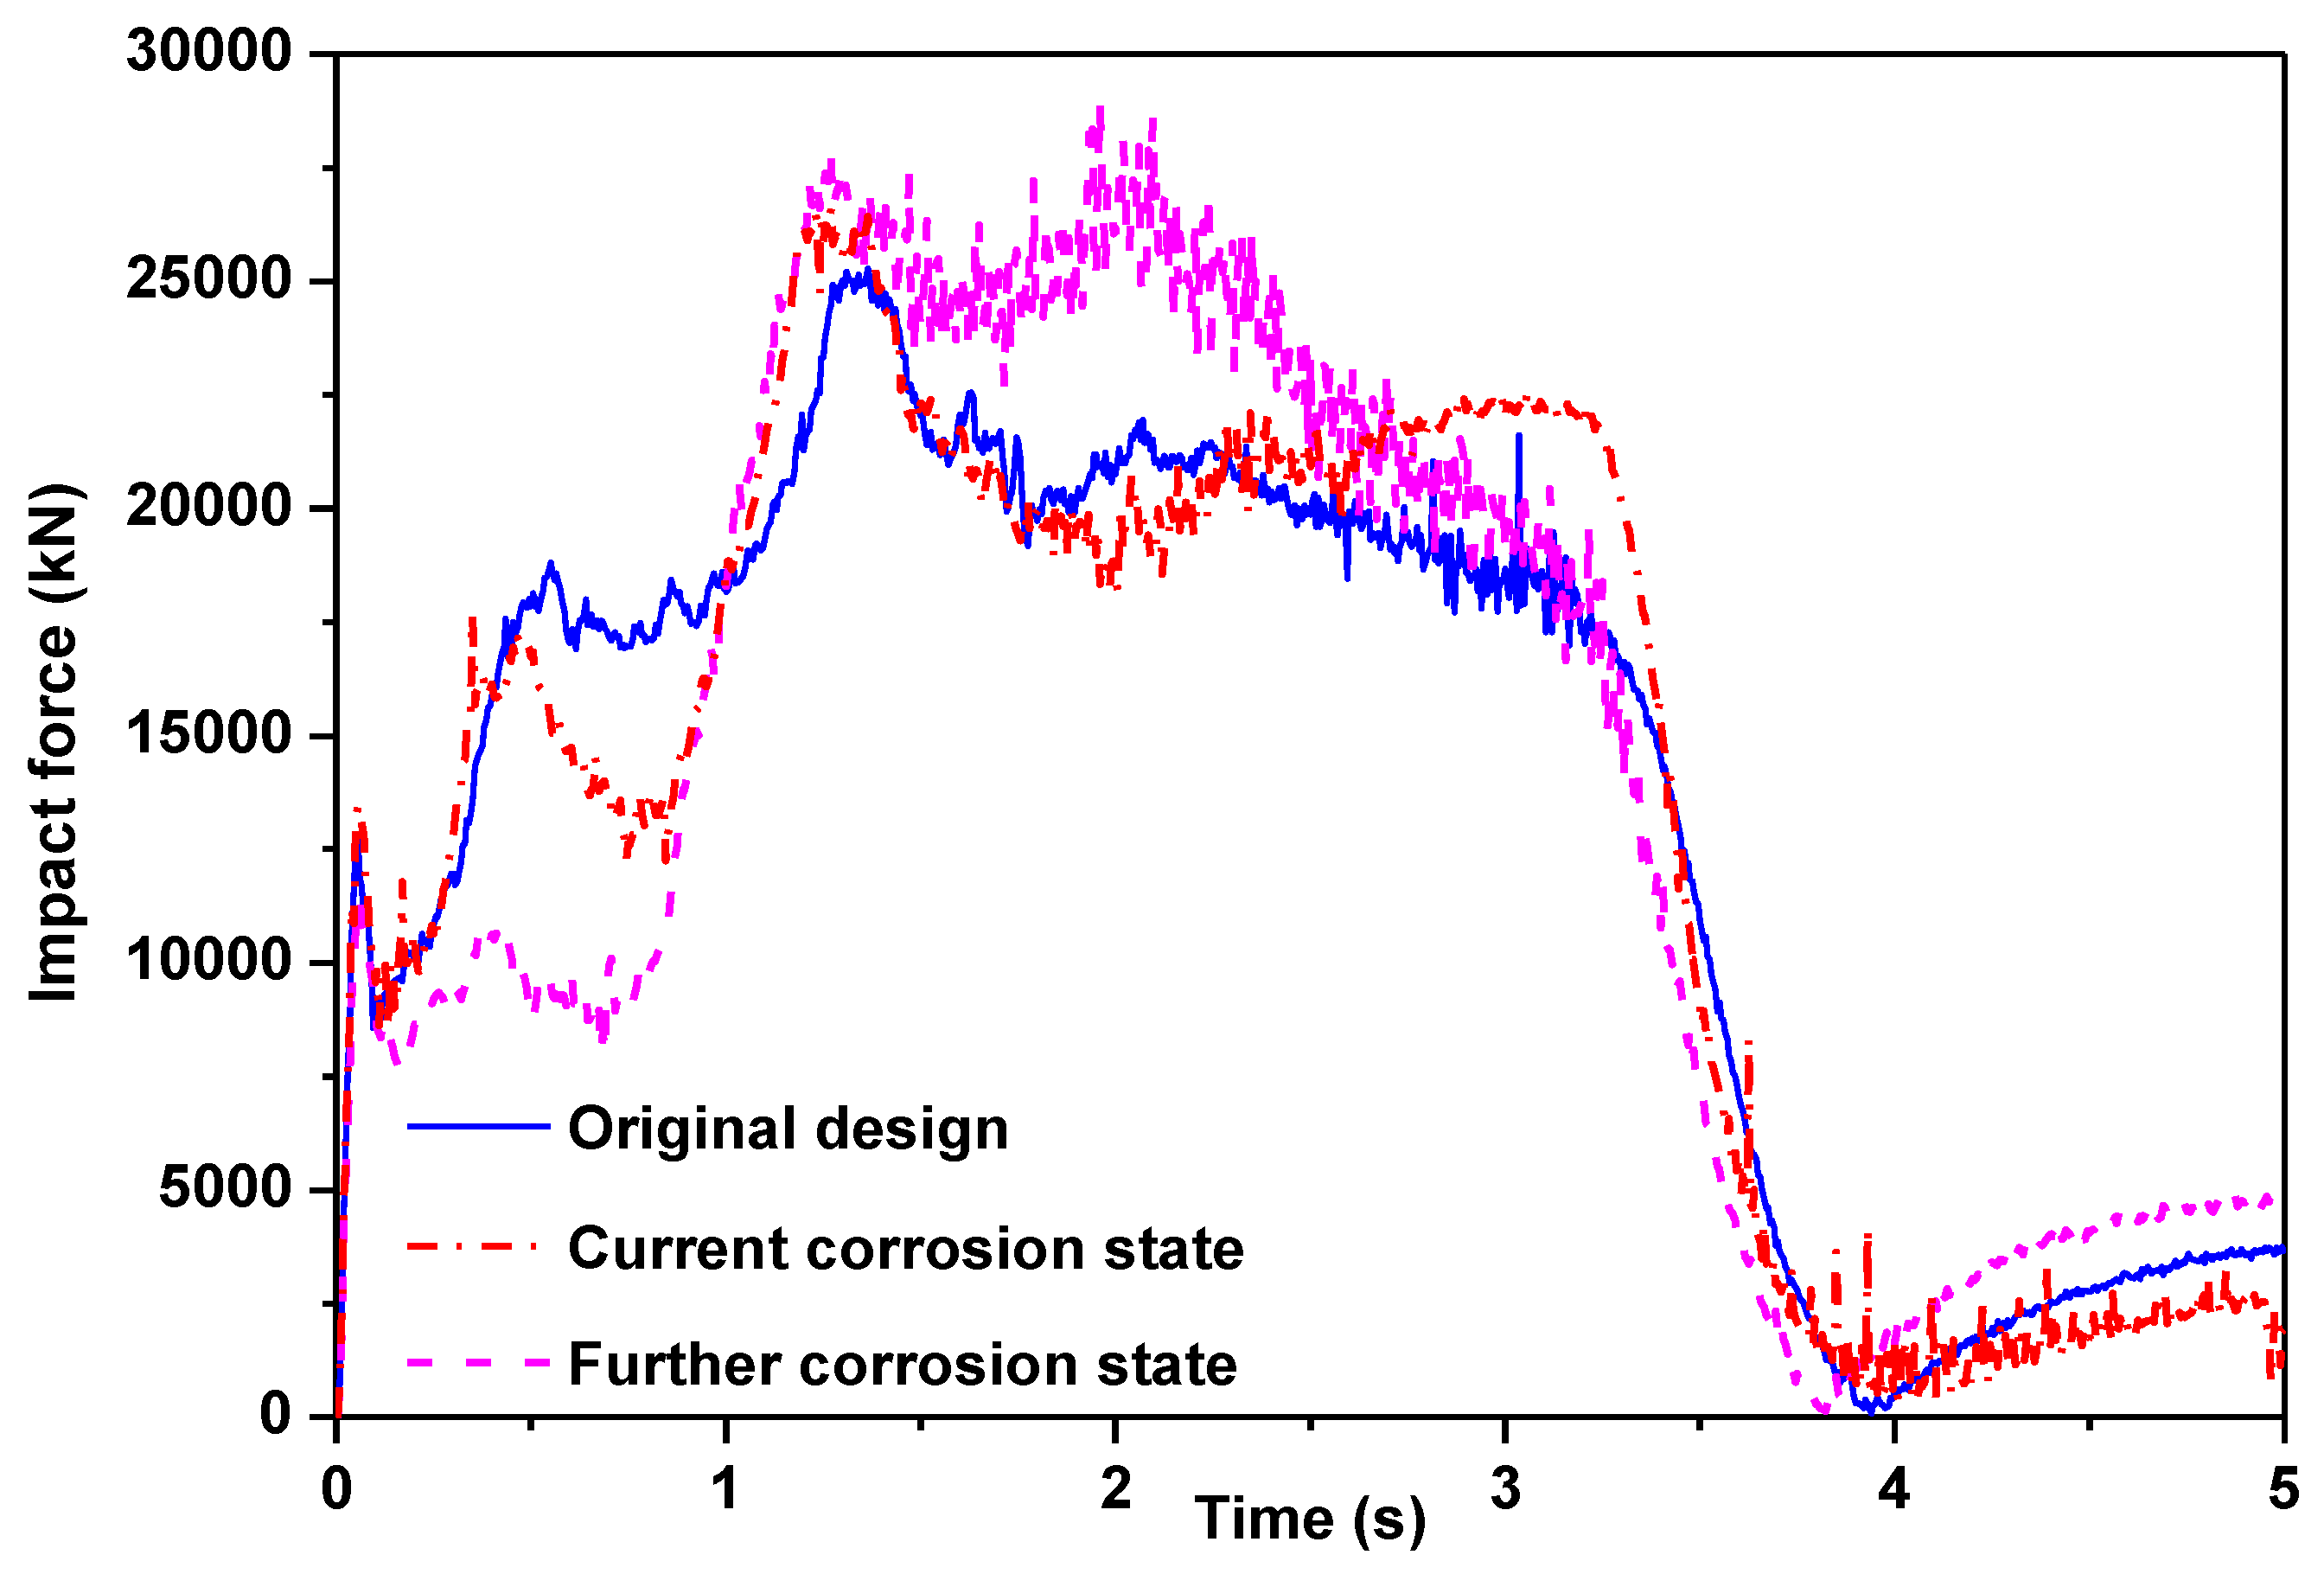
Figure 7.
Deformation distribution in protective device during impact for original design, current corrosion state, and further corrosion state.
Figure 7.
Deformation distribution in protective device during impact for original design, current corrosion state, and further corrosion state.

Figure 8.
Prediction of maximum impact force and verification considering corrosion effect.

Figure 9.
Prediction and verification of key impact factors (a) ship stroke prediction and (b) residual mass prediction considering corrosion effects.
Figure 9.
Prediction and verification of key impact factors (a) ship stroke prediction and (b) residual mass prediction considering corrosion effects.


Table 1.
Key geometrical parameters of the protective device.
| Length (L) | Breadth (B) | Depth (H) | Draught (d) |
|---|---|---|---|
| 47.95 m | 30.20 m | 7.50 m | various |
Table 2.
Visual detection results of corrosion states within the protective device.
| Corrosion Extent | Spray Zone | Tidal Zone | Full Immersion Zone |
|---|---|---|---|
| Coating spalling | ● | ● | ● |
| Local corrosion | ● | ● | ● |
| Bulking | ● | ● | ● |
| Aquatic adhesion | ● | ● |
Table 3.
Corrosion state classified by design thickness of steel component.
| Design Thickness (mm) | Zone | Measuring Points | Average Value (mm) | Average Corrosion Rate 1 (mm/a) 2 | Minimal Value (mm) | Maximum Corrosion Rate 1 (mm/a) 2 |
|---|---|---|---|---|---|---|
| 6.00 | Spray zone | 12 | 5.60 | 0.03 | 5.30 | 0.06 |
| Tidal zone | 12 | 5.50 | 0.04 | 5.30 | 0.06 | |
| Full immersion zone | 12 | 5.36 | 0.05 | 4.30 | 0.14 | |
| 8.00 | Spray zone | 113 | 7.50 | 0.04 | 6.90 | 0.09 |
| Tidal zone | 69 | 7.32 | 0.06 | 5.10 | 0.24 | |
| Full immersion zone | 101 | 7.30 | 0.06 | 5.10 | 0.24 | |
| 10.00 | Spray zone | 39 | 9.00 | 0.08 | 7.30 | 0.23 |
| Tidal zone | 47 | 8.70 | 0.11 | 6.70 | 0.28 | |
| Full immersion zone | 95 | 8.60 | 0.12 | 6.50 | 0.29 |
Note: 1 Corrosion rate [25] was calculated based on measurement data and service years, not considering the influence of the coating’s guarantee period; 2 mm/a is mm per annual.
Table 4.
Average measured residual thickness of typical plates and stiffeners in the protective device.
Table 4.
Average measured residual thickness of typical plates and stiffeners in the protective device.
| Component Name | Design Thickness (mm) | Measured Thickness (mm) | ||
|---|---|---|---|---|
| Spray Zone | Tidal Zone | Full Immersion Zone | ||
| Plates | ||||
| Deck plate | 8.00 | 7.50 | --- | --- |
| Tween deck plate | 8.00 | --- | 7.32 | --- |
| Bottom plate | 8.00 | --- | --- | 7.30 |
| External trunk plate | 8.00 | 7.50 | 7.32 | 7.30 |
| Internal trunk plate | 8.00 | 7.50 | 7.32 | 7.30 |
| Bulkhead | 10.00 | 9.00 | 8.70 | 8.60 |
| Stiffeners | ||||
| Deck longitudinal | --- | --- | ||
| Tween deck longitudinal | --- | --- | ||
| Bottom longitudinal | --- | --- | ||
| Bulkhead stiffener | ||||
| 1-Web beam | ||||
| 2-Web beam | ||||
| Horizontal girder | ||||
Note: means L-section stiffener with length 100 mm, width 75 mm and thickness 8 mm; means T-section stiffener with web length 350 mm, web thickness 8 mm, panel length 150 mm and panel thickness 12 mm.
Table 5.
Average 5-year predicted residual thickness of typical plates and stiffeners in the protective device.
Table 5.
Average 5-year predicted residual thickness of typical plates and stiffeners in the protective device.
| Component Name | Design Thickness (mm) | Measured Thickness (mm) | ||
|---|---|---|---|---|
| Spray Zone | Tidal Zone | Full Immersion Zone | ||
| Plates | ||||
| Deck plate | 8.00 | 6.50 | --- | --- |
| Tween deck plate | 8.00 | --- | 5.96 | --- |
| Bottom plate | 8.00 | --- | --- | 5.90 |
| External trunk plate | 8.00 | 6.50 | 5.96 | 5.90 |
| Internal trunk plate | 8.00 | 6.50 | 5.96 | 5.90 |
| Bulkhead | 10.00 | 7.00 | 6.10 | 5.80 |
| Stiffeners | ||||
| Deck longitudinal | --- | --- | ||
| Tween deck longitudinal | --- | --- | ||
| Bottom longitudinal | --- | --- | ||
| Bulkhead stiffener | ||||
| 1-Web beam | ||||
| 2-Web beam | ||||
| Horizontal girder | ||||
Table 6.
Key parameters of the ship.
| Principal Dimensions | Mass Matrix (Considering Attach Water) | ||||||
|---|---|---|---|---|---|---|---|
| Overall length (L) | 112 m | Load draught (d) | 7 m | M11 | 12,276 t | I11 | 447,841 t·m2 |
| Modeled breadth (B) | 17 m | Block coefficient (Cb) | 0.8 | M22 | 23,100 t | I22 | 17,248,000 t·m2 |
| Molded depth (H) | 9.2 m | Displacement | 11,000 t | M33 | 23,100 t | I33 | 17,248,000 t·m2 |
Table 7.
Boundary conditions of the ship’s collision.
| Ship Draught (m) | Protective Device Draught (m) | Stroking Velocity (m/s) | Impact Direction | Impact Location |
|---|---|---|---|---|
| 7.00 | 6.66 | 5 | Transverse bridge direction | Transverse vertex |
Table 8.
Mechanical properties of marine steel Q235.
| Basic Parameters | Yield Stress (MPa) | Plastic Strain | ||
|---|---|---|---|---|
| Elasticity Modulus E (GPa) | Poisson Ratio | Density (kg·m−3) | ||
| 210 | 0.3 | 7800 | 235 | 0 |
| 245 | 0.01 | |||
| 251 | 0.02 | |||
| 255 | 0.03 | |||
| 262 | 0.06 | |||
| 267 | 0.10 | |||
| 271 | 0.15 | |||
| 276 | 0.25 | |||
| 279 | 0.40 | |||
| 289 | 2.00 | |||
Table 9.
Stiffness and damping factors of the buffer rubber.
| Standard Code | Stiffness Factor | Damping |
|---|---|---|
| SC500 | 250,000 | 250,000 |
Table 10.
Simulation results of bridge pier with and without buffer rubber equipment.
| Case No. | Feature | Maximum Impact Force Received by Bridge Pier (MN) | Maximum Internal Energy of Protective Device (kJ) | Maximum Ship Stroke (m) | Impact Duration (s) |
|---|---|---|---|---|---|
| 1 | No buffer rubber | 26.79 | 148,371 | 8.69 | 3.23 |
| 2 | Buffer rubber present | 26.12 | 147,883 | 8.71 | 3.23 |
Note: Impact duration is defined as the period during which a ship obtains its minimum kinetic energy.
Table 11.
Simulation results of bridge pier under different corrosion states.
| Feature | Maximum Impact Force Received by Bridge Pier (MN) | Maximum Internal Energy of Device (kJ) | Maximum Ship Stroke (m) | Impact Duration (s) | Mass of Protective Device (t) |
|---|---|---|---|---|---|
| Original design | 25.28 | 147,563 | 8.51 | 3.29 | 463.64 |
| Current corrosion state | 26.62 | 147,883 | 8.69 | 3.23 | 413.85 |
| Predicted further corrosion state | 28.98 | 146,698 | 8.81 | 3.17 | 327.06 |
Note: Impact duration is defined as the period in which ship obtains its minimum kinetic energy.
© 2017 by the authors. Licensee MDPI, Basel, Switzerland. This article is an open access article distributed under the terms and conditions of the Creative Commons Attribution (CC BY) license (http://creativecommons.org/licenses/by/4.0/).
Share and Cite
MDPI and ACS Style
Qiu, A.; Han, X.; Qin, H.; Lin, W.; Tang, Y. Anti-Collision Assessment and Prediction Considering Material Corrosion on an Offshore Protective Device. J. Mar. Sci. Eng. 2017, 5, 37. https://doi.org/10.3390/jmse5030037
AMA Style
Qiu A, Han X, Qin H, Lin W, Tang Y. Anti-Collision Assessment and Prediction Considering Material Corrosion on an Offshore Protective Device. Journal of Marine Science and Engineering. 2017; 5(3):37. https://doi.org/10.3390/jmse5030037
Chicago/Turabian StyleQiu, Ang, Xiangxi Han, Hongyu Qin, Wei Lin, and Youhong Tang. 2017. "Anti-Collision Assessment and Prediction Considering Material Corrosion on an Offshore Protective Device" Journal of Marine Science and Engineering 5, no. 3: 37. https://doi.org/10.3390/jmse5030037
Note that from the first issue of 2016, this journal uses article numbers instead of page numbers. See further details here.