Article

A Spatio-Temporal Assessment of Landcover and Coastal Changes at Wandandian Delta System, Southeastern Australia

by
Ali K. M. Al-Nasrawi
1,
Carl A. Hopley
1,2,
Sarah M. Hamylton
1 and
Brian G. Jones
1,*
1
School of Earth and Environmental Sciences, University of Wollongong, Wollongong NSW 2522, Australia
2
Buildings & Facilities Sustainability, Wollongong City Council, Wollongong NSW 2522, Australia
*
Author to whom correspondence should be addressed.
J. Mar. Sci. Eng. 2017, 5(4), 55; https://doi.org/10.3390/jmse5040055
Submission received: 21 September 2017 / Revised: 16 November 2017 / Accepted: 17 November 2017 / Published: 27 November 2017

Abstract

:
Large numbers of people live along and depend upon the world’s coastal resources. Human modifications of the coastal zone, in combination with climate induced environmental changes, have had a major effect on the natural ecological systems. GIS analysis of remote sensed data, combined with fieldwork and laboratory tests, can be used to determine the resultant eco-geomorphic changes that need to be managed sustainably on a worldwide scale. Modelling the eco-geomorphic dynamics between 1949 and 2016 on the Wandandian Creek delta (southeastern NSW, Australia) provides a case study of management options for such coastal resources. Results from the Wandandian Creek delta show that sand/silt sediment derived from the partially (22%) modified terrestrial catchment has prograded into the wave-dominated St. Georges Basin where it is impacted by nearshore processes. Clear spatio-temporal growth of the areal extent and elevation of the deltaic levees and sandspits, with their associated mangroves and saltmarshes, has occurred over the past 65 years. Although the growth rate has fluctuated during the study period, due to flood events in 1974, 1990s and 2010, the overall subaerial and subaqueous delta area has had an average growth of 4168 m2 annually with the shoreline extending 1.451 m/year on average. This geomorphic growth has stabilised the estuarine deltaic habitats with high proportions of nutrients and organic matter, particularly within saltmarsh, mangrove, Casuarina/Juncus and other mixed native plant areas. This research shows the importance of analysing morphological changes observed on the delta that can be related to both anthropogenic modifications and natural processes to the catchment and thus should be used in the development of catchment and coastal management plans.

1. Introduction

Many coastal ecosystem management strategies have become more focused on the conservation and sustainability of coastal wetlands [1,2] locally [3], regionally [4] and globally [5] according to their unique ecosystem function roles [6]. However, they are located in sensitive zones where anthropogenic and climate change stressors are concentrated, such as estuaries and deltaic platforms [7,8,9]. For effective management of such areas it is imperative that comprehensive knowledge of their environmental responses to current anthropogenic and climatic stressors is known, along with the factors that have driven such responses within the last few decades, to enable prediction of their future behaviour.
One of the most cost effective methods of studying changes in coastal ecosystems is through global information system (GIS) analysis of aerial photograph and satellite images [3,4,10,11]. Ozesmi and Bauer [10] provided an overview of the most appropriate satellite data and classification methods to use for studying wetlands. They also discussed how complimentary information could be obtained from aerial photographs, thus providing the opportunity to extend equivalent analyses back before satellite data became available to study longer term changes to wetland composition and shoreline positions. Some studies have relied entirely on satellite data, such as the study by Cho et al. [11] who successfully mapped wetland and shoreline changes on a broad scale in southeastern India. The same techniques have been applied when mapping vegetation and shoreline changes in inland wetland situations, such as Haack’s [12] study of the distribution and dynamic nature of small isolated wetlands in the plains and highlands of Kenya and Tanzania, and Roshier and Rumbachs’ [13] mapping of temporary wetlands in the arid areas of the Darling River basin in eastern Australia. The success of these studies led us to instigate a case study modelling the current and historic coastal ecosystem dynamics on the Wandandian Delta (St. Georges Basin, Southeastern Australia) as a method for providing data to assist in developing local catchment and coastal management plans.
The aim of this study is to use the Wandandian Delta as a case study to monitor and measure sensitive shoreline, land cover and vegetation changes in a deltaic system and its associated coastal wetland in order to assess potential options for conserving and managing the wetlands. This study (i) employs spatial technologies to determine the ecological and geomorphological (eco-geomorphic) growth of the estuarine system within the last few decades, (ii) considers the direct and indirect influences of anthropogenic and environmental trends on the catchment runoff and sedimentation factors, (iii) assesses the historical eco-geomorphic trends to determine the main factors likely to affect the future ecosystem health, and then (iv) indicates how these findings could be extended to other estuarine deltaic regimes and important coastal wetlands worldwide. This work is relevant to management because it indicates how susceptible the estuary is to shoreline expansion or contraction, which causes changes in ecosystem accommodation space as a function of sediment transport and deposition from the catchment.

2. Background

2.1. The Study Site Specifications

The Wandandian deltaic eco-geomorphic system is located on the southeastern coast of New South Wales (35°06′23.4″ S 150°33′20.5″ E), about 194 km south of Sydney (Figure 1). The coastal eco-geomorphic system of the Wandandian Delta is located at the end of Wandandian Creek where the channel is actively prograding into St. Georges Basin (Figure 1) that is separated from the South Pacific Ocean by a sandy barrier [14]. The shallow St. Georges Basin has rock outcrops that control where the Wandandian fluvial sediment can accumulate and build the deltaic system over time [15,16].
The Wandandian eco-geomorphic system has been considered as a sensitive area that includes (i) fluvial platforms, and (ii) intensive vegetation cover, such as mangroves and Casuarina [17,18].
Wandandian Creek is 25 km long starting from the eastern cliffs of the Tianjara Range (part of east Australian Great Dividing Range) to indirectly discharge to the southern Pacific Ocean via St. George Basin, a typical wave dominated estuarine platform [15,19]. The 1.6 m deep Wandandian Creek drains about 46% of St. Georges Basin catchment [20]. The deltaic system built by the Wandandian Creek sedimentary processes contains small areas of coastal wetlands (including mangrove, saltmarsh and back swamp) and intertidal flats on a fluvial bayhead delta [16].

2.2. Catchment and Land Use Classes

Wandandian Creek has a small catchment draining about 202.3 km2 ranging from high to irregularly sloped terrain with elevations from 0 to 709 m along the ~25 km long Wandandian Creek. This represents an average 3.5% slope along the main creek channel, but the slope is much higher in the upper parts of the valleys (Figure 2a, [14]). The Wandandian Creek catchment contains the Wandandian, Bewong, Tullarwalla and Jerrawangala villages that are neighboured by quite intensive rural activities [15]. This region has a population of about 15,000 [14,21] but this will increase as urban development expands [14]. St. Georges Basin is a popular holiday destination known for its recreational activities such as sightseeing, bushwalking, fishing, water skiing and sailing.
Human settlement in the catchment began in 1830 and by 1900 had established grazing, urban areas and other modifications over 22% of the catchment (see Figure 2b). These transitions in land use were associated with clearing native vegetation, resulting in changes to the drainage network hydrology and eco-geomorphologic characteristics of the catchment and its runoff and sedimentary processes [3,22]. Large areas of the catchment are still covered with native vegetation (74.2%) including a state forest and a national park along the eastern cliffs of the Tianjara Range (Figure 2). Early land clearing affected the eco-geomorphic systems in the lower catchment and its dependent downstream areas but during the study period has only included minor additional urban development (Figure 2). Sand mining operations for construction materials in the late 1960s through to the early 1970s in the lower deltaic reach of Wandandian Creek increased water depths and affect sedimentation rates for over a decade. The dredging also opened the creek to recreational users and wake waves enhanced bank erosion.

2.3. Local Climate Conditions

The main climate factors that could have major effects on the eco-geomorphic processes are precipitation (and the resultant river discharge in the Wandandian watershed area), temperature and mean sea level at/around the deltaic system (Figure 3 and Figure 4).
Wandandian catchment has a temperate oceanic climate (Cfb) with no dry season [23], which promotes weathering and sediment production [24]. The average temperatures range from 11.5 °C in winter (July and August) to 21 °C during summer (January and February; data from Sussex Inlet Bowling Club gauging station; Figure 3; [15]). Rainfall in the Wandandian Creek catchment is highest in late summer and autumn, whereas the lowest rainfall occurs in late winter and spring [25].
Average rainfall in the Wandandian catchment is 1300 mm/year leading to an estimated annual runoff of 400 mm [16,26]. Five major flood events between 1985 and 2015 have been identified within the Wandandian catchment (Figure 4a,b). They occurred in March 1959, October 1959, February 1971, June 1991 and August 2015. Nine additional minor flood events occurred in May 1953, February 1958, March 1961, March 1975, March 1976, October 1976, February 1992, September 1993, April 1994, March 2011, March 2012 and June 2013 (Figure 4a,b); [23,27,28]).
In terms of climate change at the study site, temperature and sea level are slowly rising (Figure 4c,d), which reflects the global warming trend [2,29]. Air temperature shows a clear overall increase during the last five decades, with numerous fluctuations. The increasing temperature would affect sedimentological processes and plant productivity, which logically would have an effect on the eco-geomorphic system.
The reported local mean sea level rise (MSLR; Figure 4d) is caused by global warming and climate change [2,29]. It is based on mean water level relative to the nearest local tide gauging station at Port Kembla, which is located ~45 km away but has an observation record extending from 1957 to recent [31].
Analysis of monthly data from this gauging station is based on 60 years’ time-series of sea-level measurements from 1957 to 2016. Figure 4d clearly shows that sea level at Port Kembla has fluctuated and risen. The monthly average mean sea level at Port Kembla is 0.907 m, and the maximum recorded was 2.233 m on 19 August 2001, whereas, the minimum recorded was on 4 December 1994 at −0.217 m. The overall average trend of SLR at Port Kembla is 0.035 m from 0.895 to 0.930 m during last six decades.
The channel linking St. Georges Basin to the open ocean is restricted and the basin has a much reduced tidal range and an elevated water level of about 1.23 m AHD (data from Island Point Station 216415 in northern St. Georges Basin). This means water level fluctuations within St. Georges Basin have less influence than in other coastal examples since there is very little tidal influence coming into this large basin with restricted connection to the Pacific Ocean. Thus, water flows from Wandandian Creek will always be attenuated as they enter the basin giving rise to more sediment deposition opportunities on the delta that can develop habitat accommodation and ecosystem diversity. Sea level rise is still likely to influence the basin and can be used to assess the eco-geomorphic changes, such as shoreline dynamics and coastal wetland responses.

3. Materials and Methods

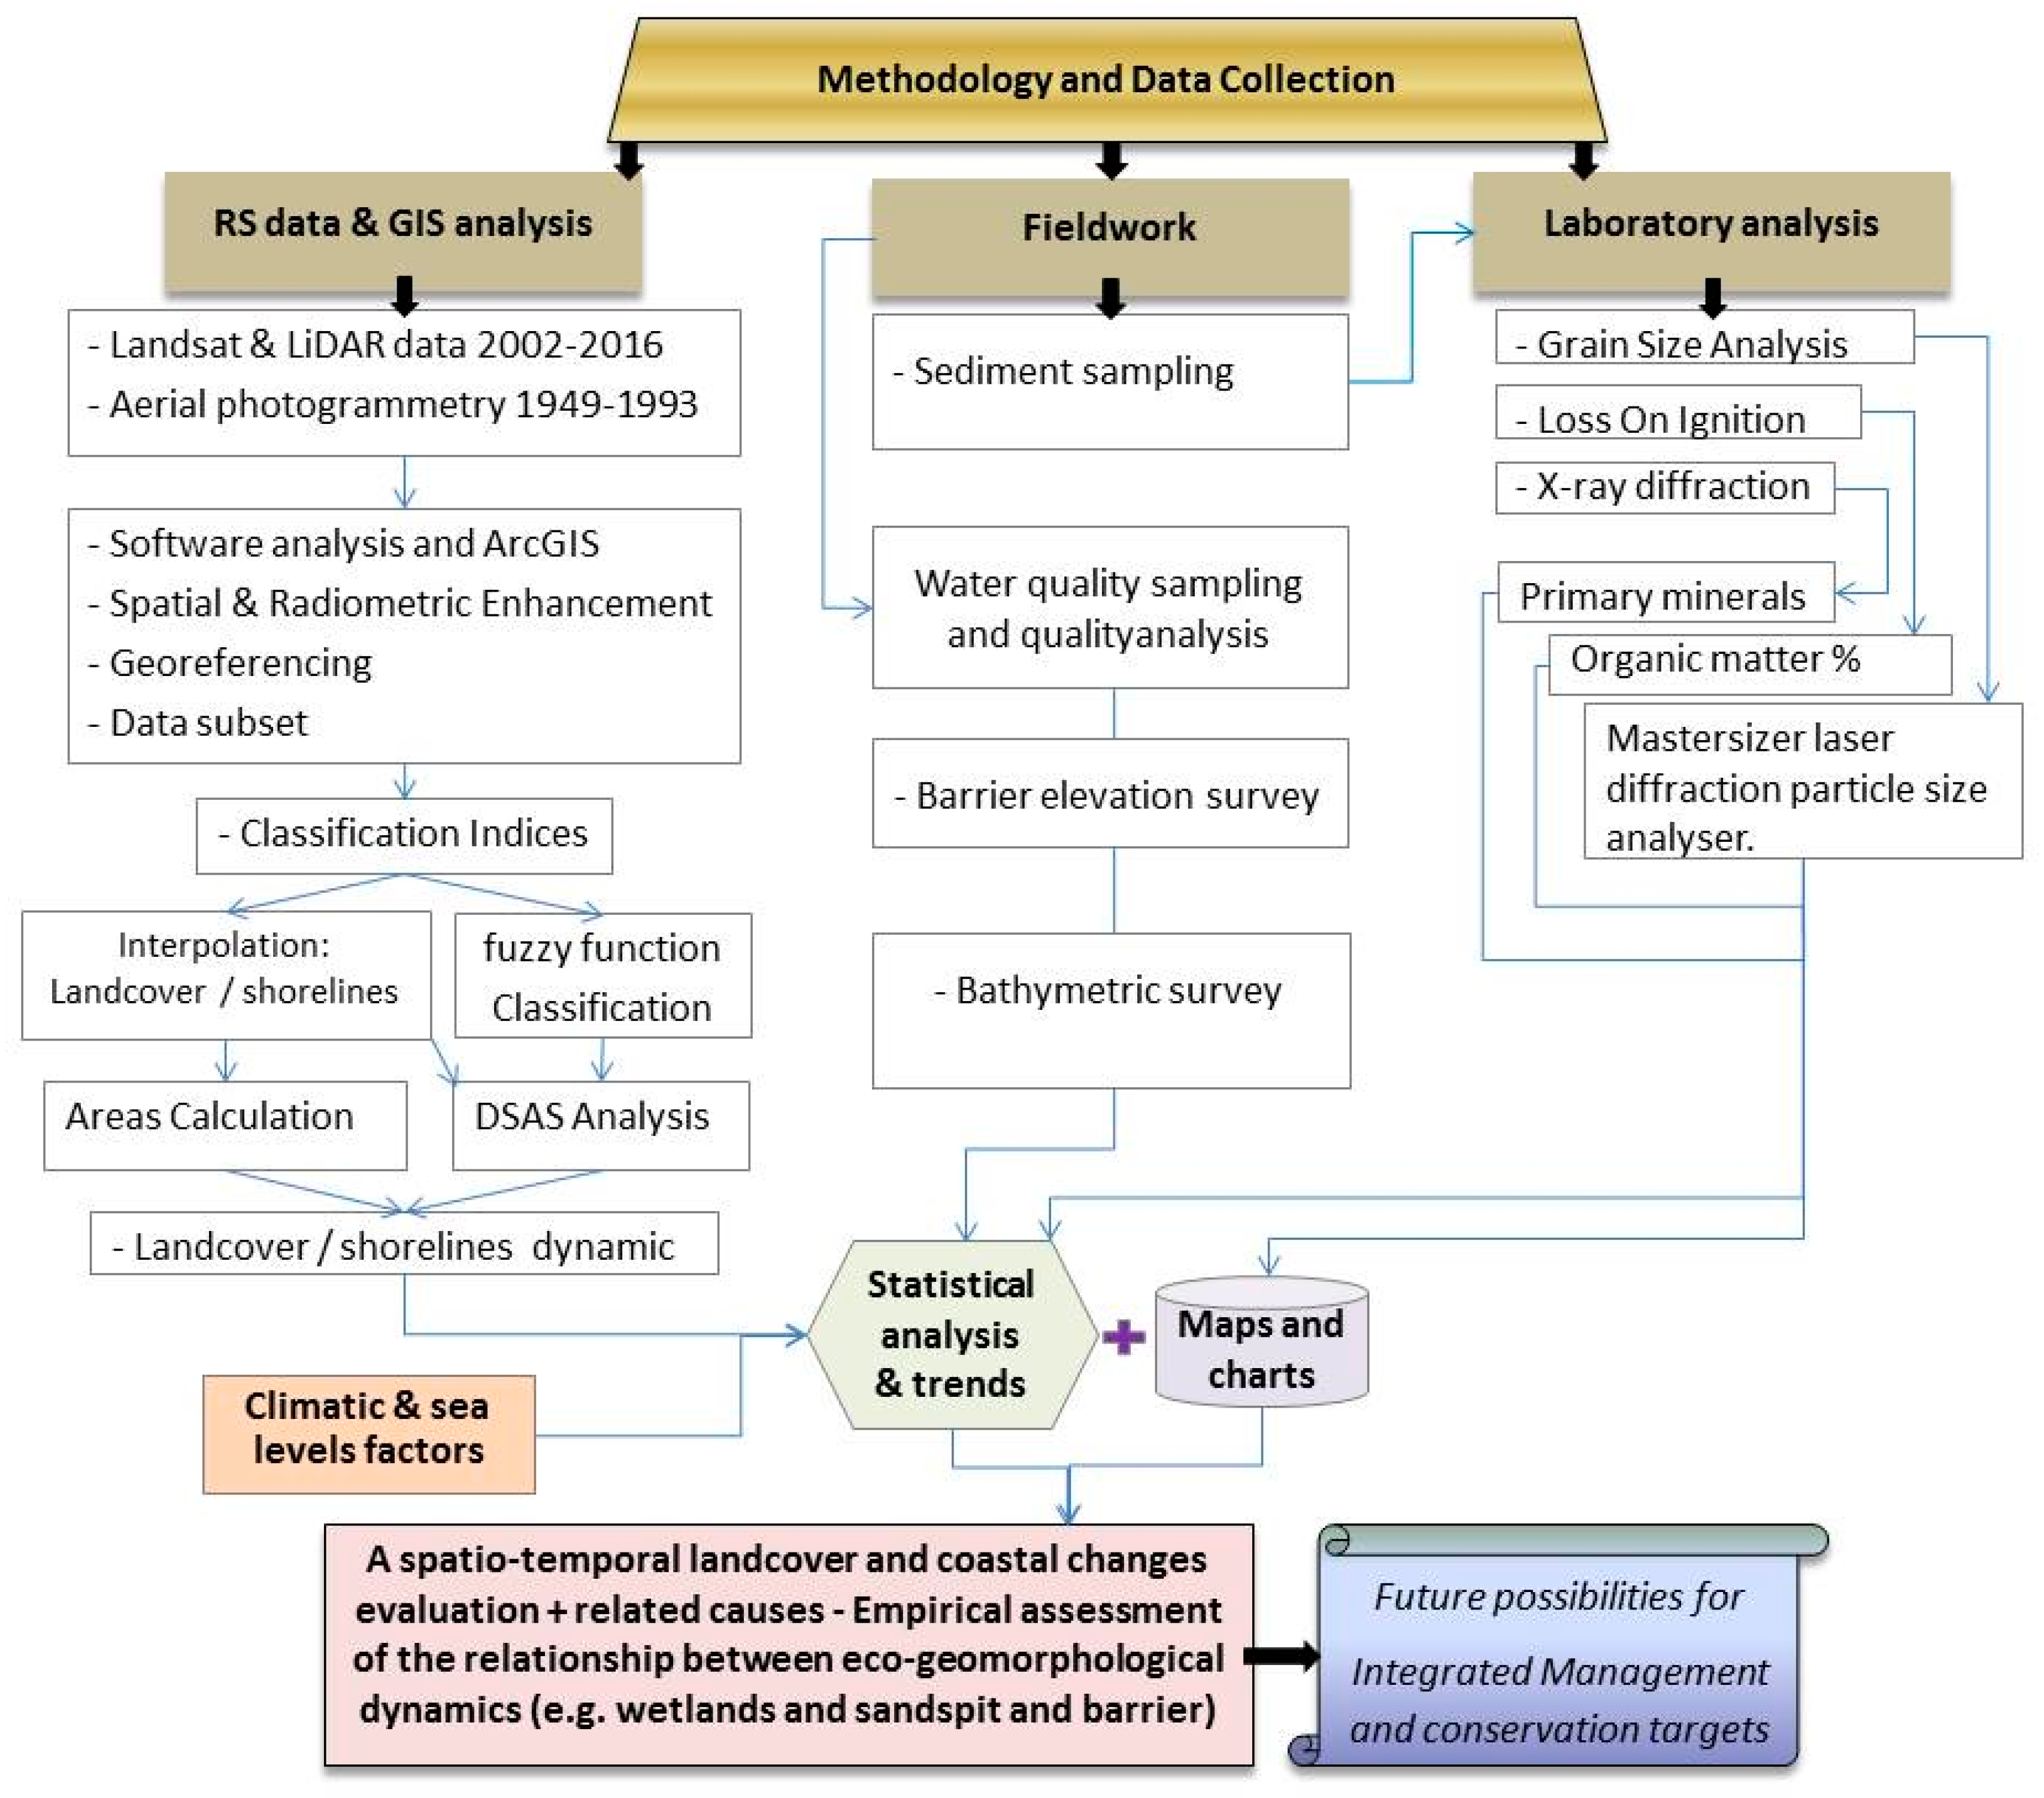
GIS mapping, monitoring and modelling has been used to investigate the landcover classes dynamics, shoreline movement, sedimentation rates and the general deltaic progradation based on local literature, aerial photography, and satellite imagery. The GIS analysis was supported by previous investigations of vegetation, sediment sampling, particle size, X-ray diffraction (XRD), loss on ignition (LOI) and water quality analyses [16]. This study divided the methodology into three parts, as seen in Figure 5.

3.1. Data Collection

Various data have been collected to achieve the study aims. RS and GIS datasets were used to analysis land covers. Light Detection and Ranging (LiDAR; 2004 and 2010) and SRTM (2011) data have been used in ArcGIS to create DEMs. These survey data for the Wandandian area were provided by the Department of Land and Property Information (LPI) in NSW. These data record the surface elevation as heights (Z values) relative to a local zero level datum. The data also incorporated the actual local mean sea level at the time of the survey based on the tidal/time dynamics from the local ground base-stations at the Sussex Inlet Bowling Club and the Island Point Station in St. Georges Basin. The DEM was generated using a TIN and the contour spatial analyst tools in ArcGIS. Meanwhile, aerial photography was obtained from the LPI and the landsat satellite imagery from the USGS (https://earthexplorer.usgs.gov/).
Sediment and soil samples were collected as vibracores from the Wandandian Delta (Figure 1) to represent all the recognized sedimentary facies [16]. Surface material was subsampled and analysed for grain size, mineralogy (using X-ray diffraction; XRD, Panalytical, Almelo, Holland) and organic matter (by loss on ignition; LOI, Ceramic Engineering, Sydney, Australia) to categorise each facies. The pH, conductivity, dissolved oxygen, salinity and turbidity were measured in the field using a Yeo-Kal 615 multi-parameter water quality analyser. These data were combined with previous detailed stratigraphic data from the vibracores [16].

3.2. Data Analysis

All images were rectified by using 20 training points within an average of 15 to 25 pixels as a finger print; this has been done for each class in every single satellite tail. We used the pixel to pixel validation method using an existing vector based classification of this study site provided by LPI in 2014. The vector layer was then converted to a raster and the ERDAS IMAGINE (Hexagon Geospatial, Madison, AL, USA) validation tool was run to test our results, which showed high accuracy.
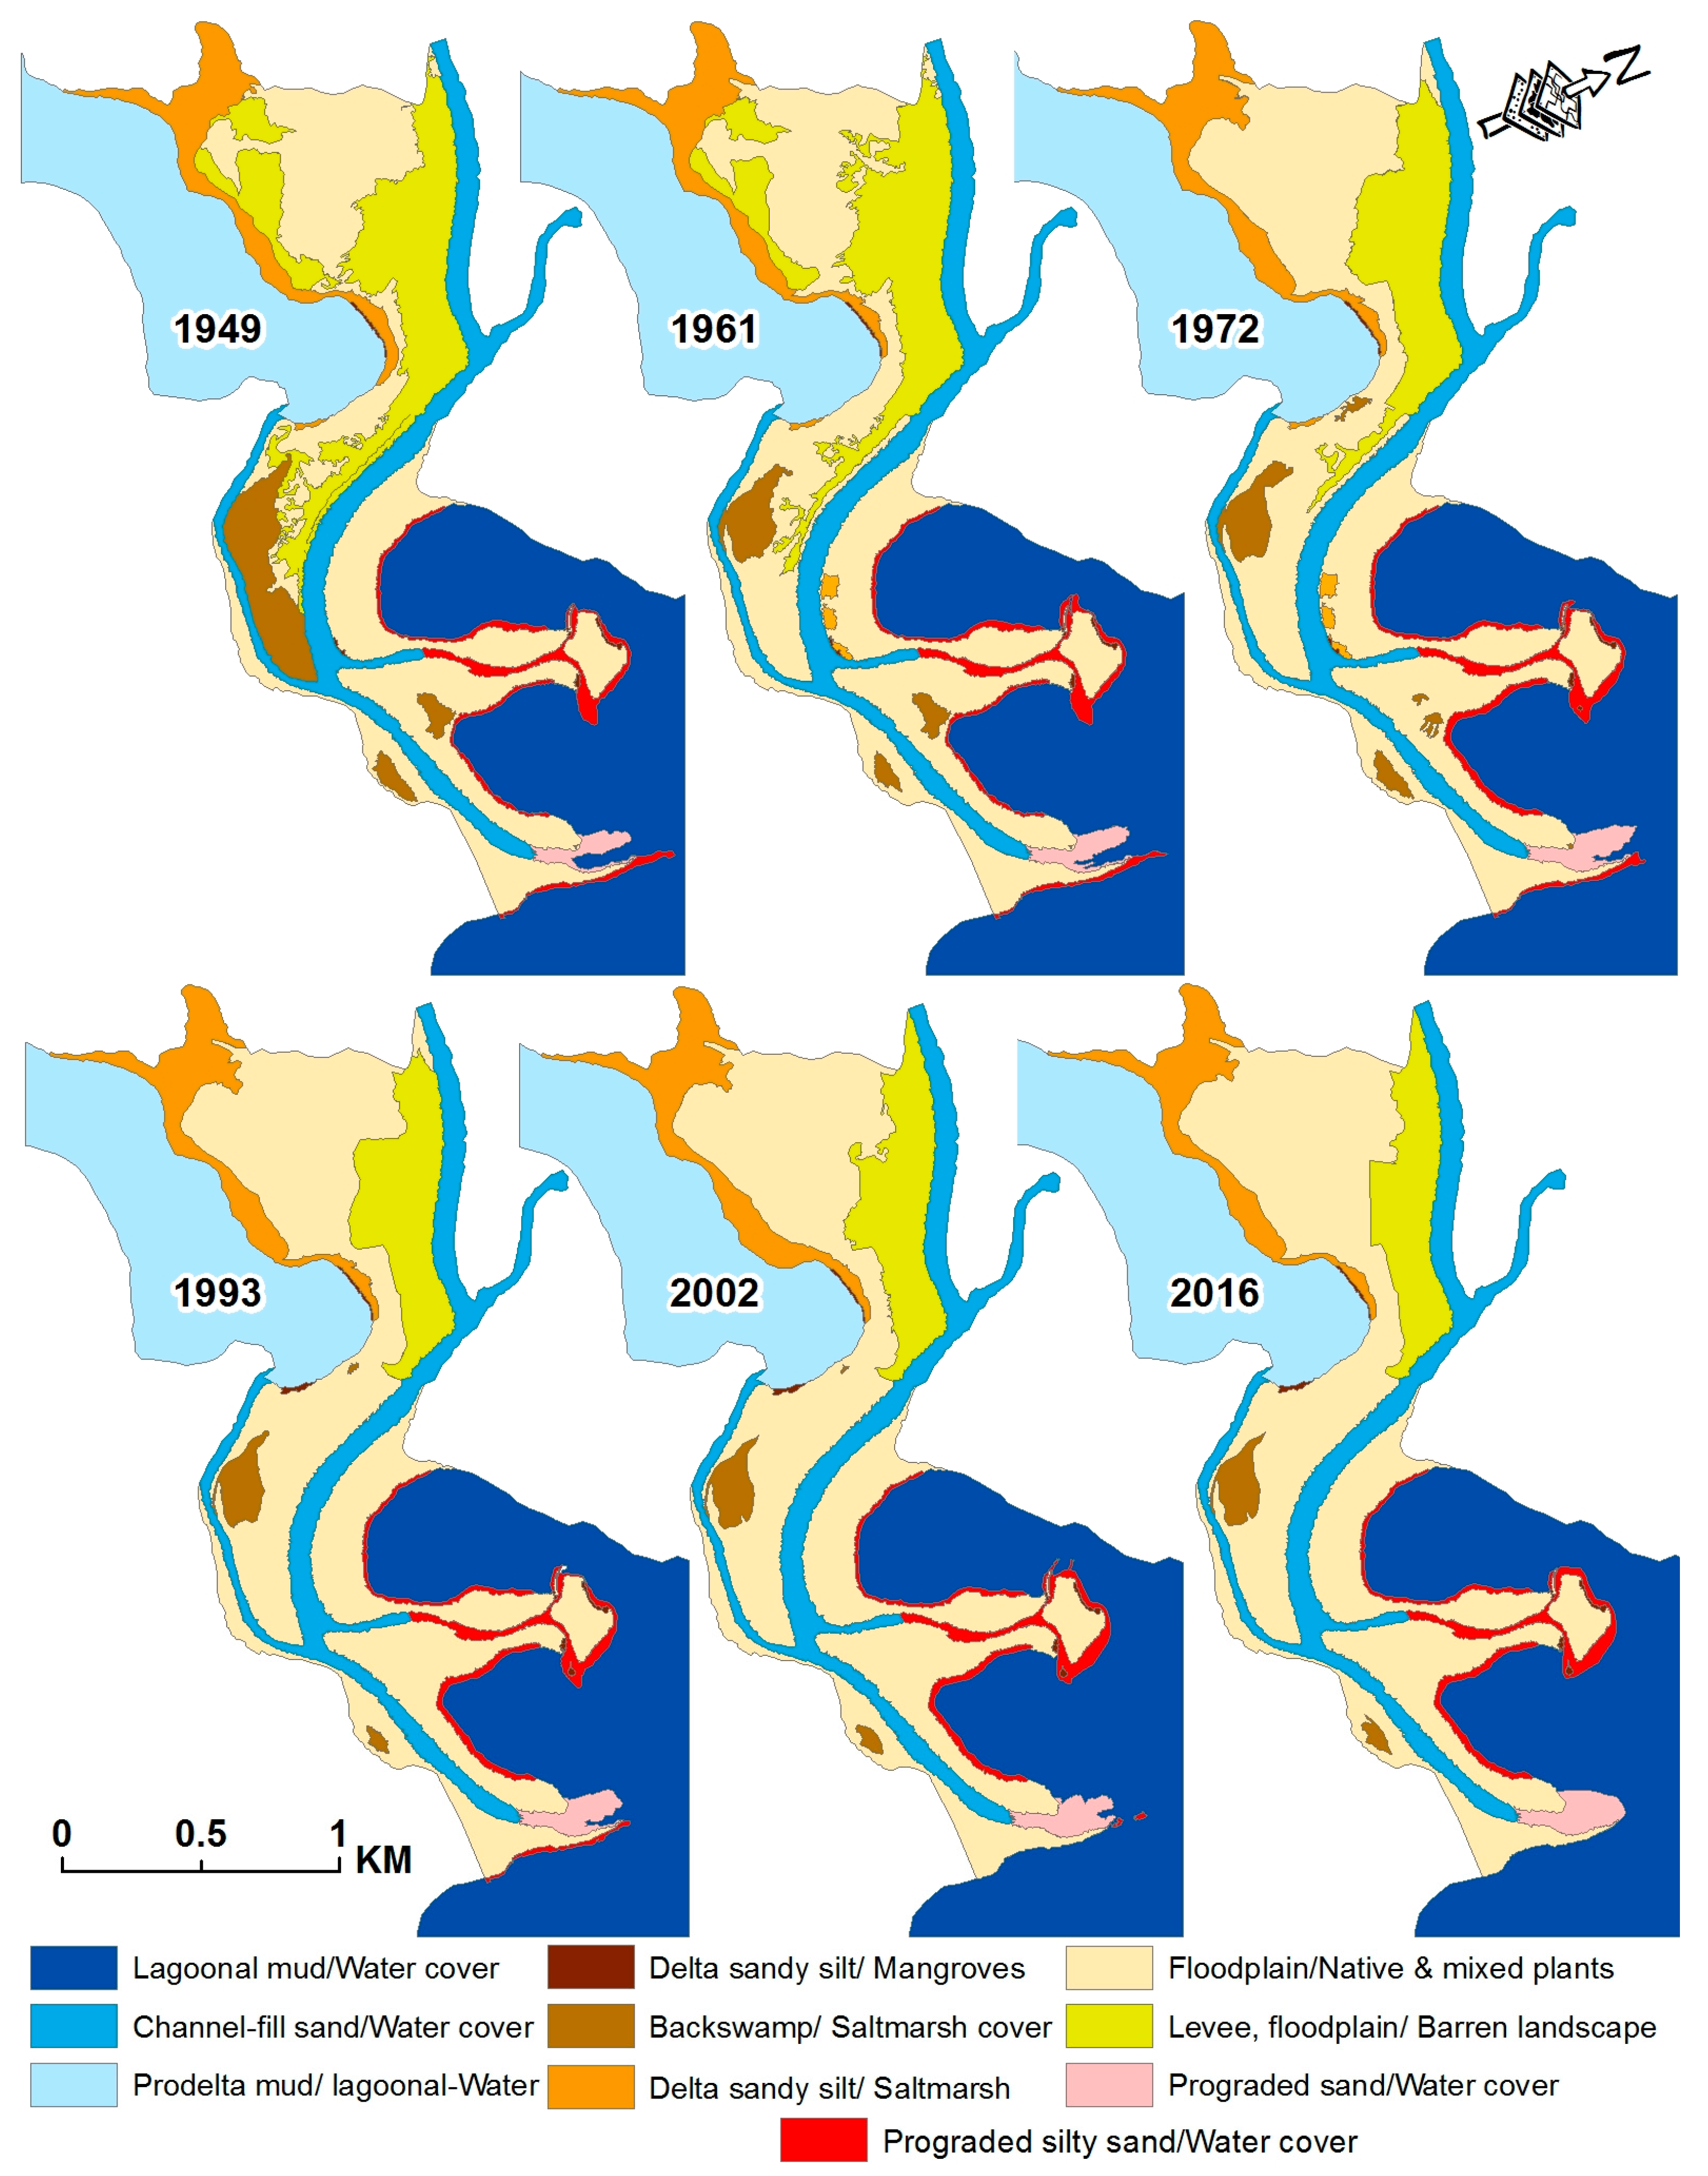
Assessment and measurement are based on the land cover derived from aerial photographs (1949, 1961, 1972, and 1993) and satellite images (2002 and 2016) over time using the standard self-adaptive/minimum distance-adjustment combined with the fuzzy membership function. The fuzzy classification method distinguishes the spatial features on the imagery according to fuzzy rules about the pixels membership functions to give more reliable and realistic outputs. Simultaneously, it will not allow pixels to be incomplete-members of multiple classes, which could lead to ambiguous/uncertain assignation of the resultant classes [31,32,33]. Analysis of the shoreline has determined the progradation of Wandandian deltaic system. Changes to the levees and shorelines and their associated wetlands, including mangrove and saltmarsh areas (as a land cover function), illustrate the shoreline position and elevation stability in the area. This project entails assessing potential threats, such as shoreline erosion and sediment delivery problems. In addition, the effects of artificial modification in the catchment are the principle element addressed.
The project targets are achieved at several levels, starting with GIS and RS-based analysis to identify and classify the land cover and shoreline changes at specific study sites depending on recent and historical records of aerial photography, satellite and LiDAR data. This was combined with sampling the water, soil and sediment.
Pre-processing of the employed imagery and aerial photographs was done to produce radiometrically and geometrically rectified framework parameters, including the local coordinate system and datum (GDA-MGA-1994/zone 56), atmospheric issues, and pixel size. To analyse datasets with various resolutions and to make the multi-temporal data comparable for valid use in research, this paper has scaled the pixel sizes to a uniform spacing and converted the imagery pixels to the same scale as the resolution of the aerial photographs to assure common pixel extents, which resulted in errors of ±0.0125 to ±0.0375 m. As part of the standard procedure, statistical weighting was used to cope with rescaling to a common pixel spacing and to accommodate images across multiple dates. During this rescaling some neighbourhood weighting is needed to make sure that the output values are radiometrically equivalent, rather than visually smooth.
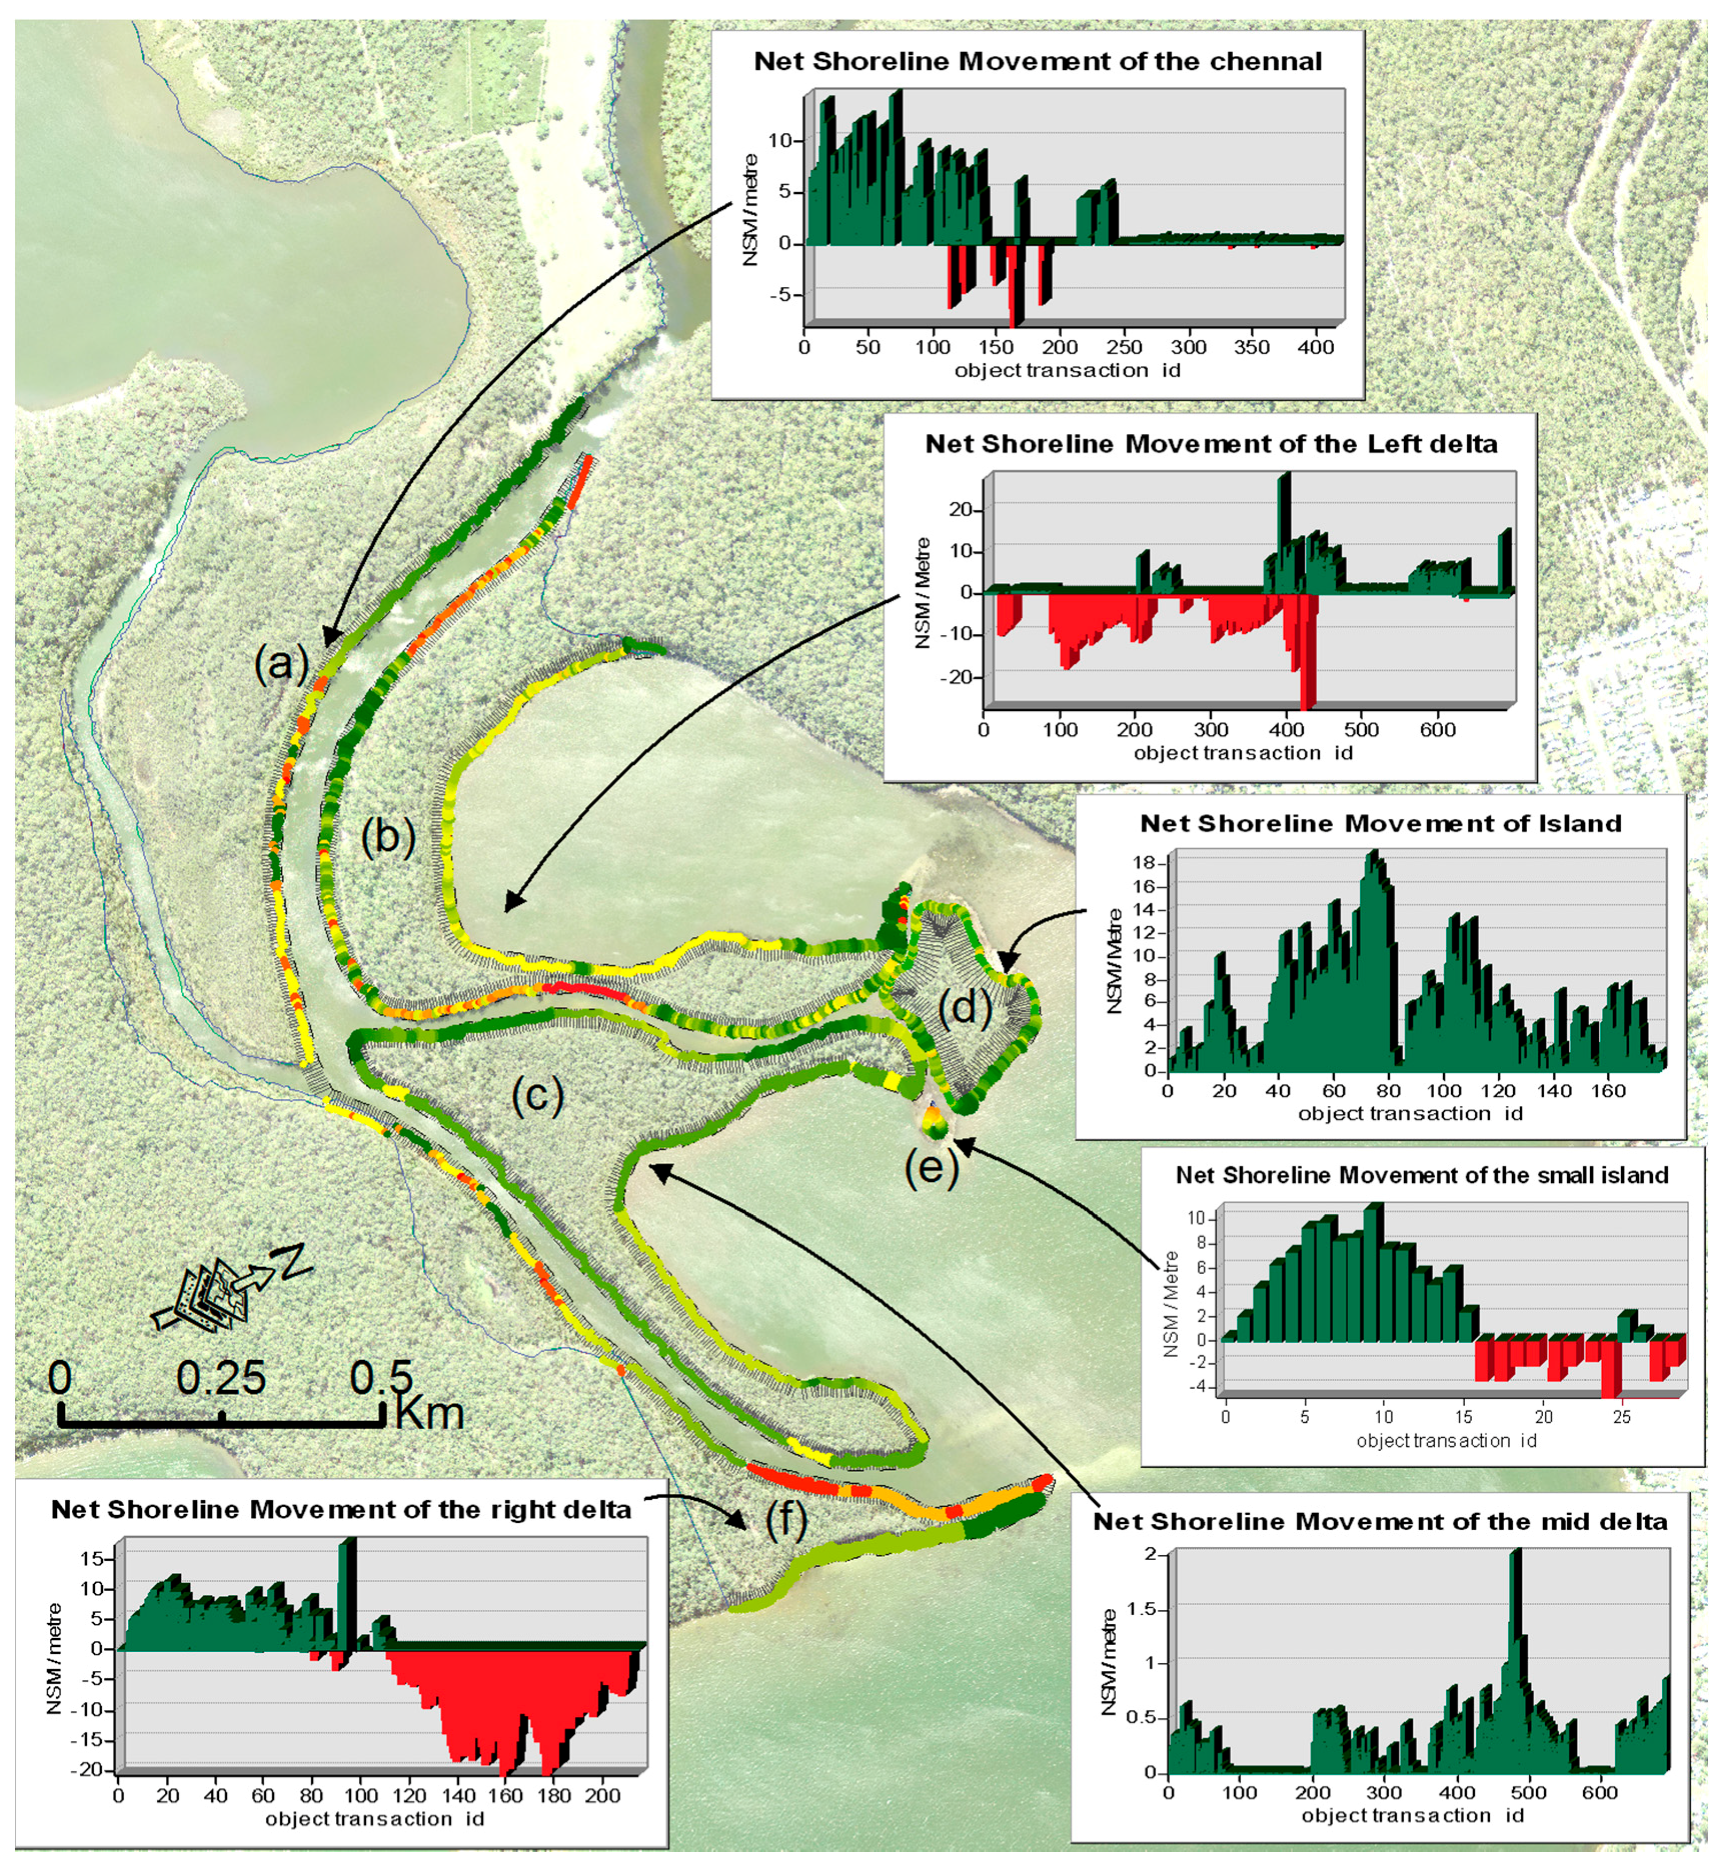
To analyse shoreline changes, the Digital Shoreline Analysis System (DSAS) was used on the dynamic shoreline positions of the delta (after dividing them into sections a–f; see Figure 10) derived from the employed datasets between 1949 and 2016. The DSAS also quantified the rate of deltaic progradation over a 66-year period (Figure 10). The DSAS analysis used many transects sampled along shorelines at 50 m intervals from an offshore baseline around the deltaic facies and levees (Figure 10a–f). To calculate the rates of shoreline changes over the study period, two statistical methods were used: the net shoreline movement (NSM)/envelope to track the changes, and the linear regression rate (LRR) to evaluate the results [34,35].

4. Results

A spatiotemporal deltaic dynamic evaluation has been established, using a stratigraphic description derived from remote sensing datasets, GIS analyses and fieldwork sampling, to highlight the deltaic changes including shoreline erosion/accretion rates and landcover change (e.g., vegetation canopy). Eco-geomorphic changes to the Wandandian Delta were detected using ArcGIS, digital shoreline analyses system (DSAS) and geomorphic change detection (GCD) based on aerial photography and satellite imagery. These changes were related to most effective controlling factors through sedimentology analyses and catchment assessment. Thus, a three level simulation approach for evaluation of the Wandandian deltaic system was based on geochronological data at the landscape scale.
The coastal eco-geomorphic changes, caused by deltaic progradation and land use development have resulted in expansion of the Wandandian deltaic eco-geomorphic systems, including growth and establishment of saltmarsh, mangrove and mudflat shorelines (Figure 6 and Figure 7).

4.1. Multitemporal Imagery Classification

The multitemporal analysis of remote sensing (RS) and GIS data (Figure 6) indicates that the river channel has actively prograded moving sediment brought down from the catchment to the mouth of the delta. This has built an interesting deltaic system at the Wandandian Creek mouth, which has grown geomorphologically since at least 1949 to offer suitable ecosystem habitats for wetland colonisation. In addition, there is clear evidence of landcover development on the main deltaic platform since the 1940s (Figure 6).
The Wandandian Delta is under constant eco-geomorphic growth due to both natural (e.g., weathering/erosion, deposition) and indirect anthropogenic forces (including human activities, climate change and sea level rise). During the Holocene, the Wandandian Delta started to infill and prograde into the western part of St. Georges Basin [15,16] with more accommodation space being generated during the current sea level rise (Figure 6 shown in red and pink).
Geomorphic development has led to ecosystem expansion onto sensitive deltaic areas as shown by the landuse classes (Figure 6). Growth of the Wandandian deltaic eco-geomorphic system of vegetation canopy and deltaic facies is due to the protected ecosystem allowing sediment accumulation. This has resulted in the active channel levees prograding into St. Georges Basin (Figure 7) with elevations up to 1.5 m above water level [15]. Vegetation canopy growth has played an important role in stabilising and expediting the shoreline/levee expansion and vertical accretion (Figure 7).
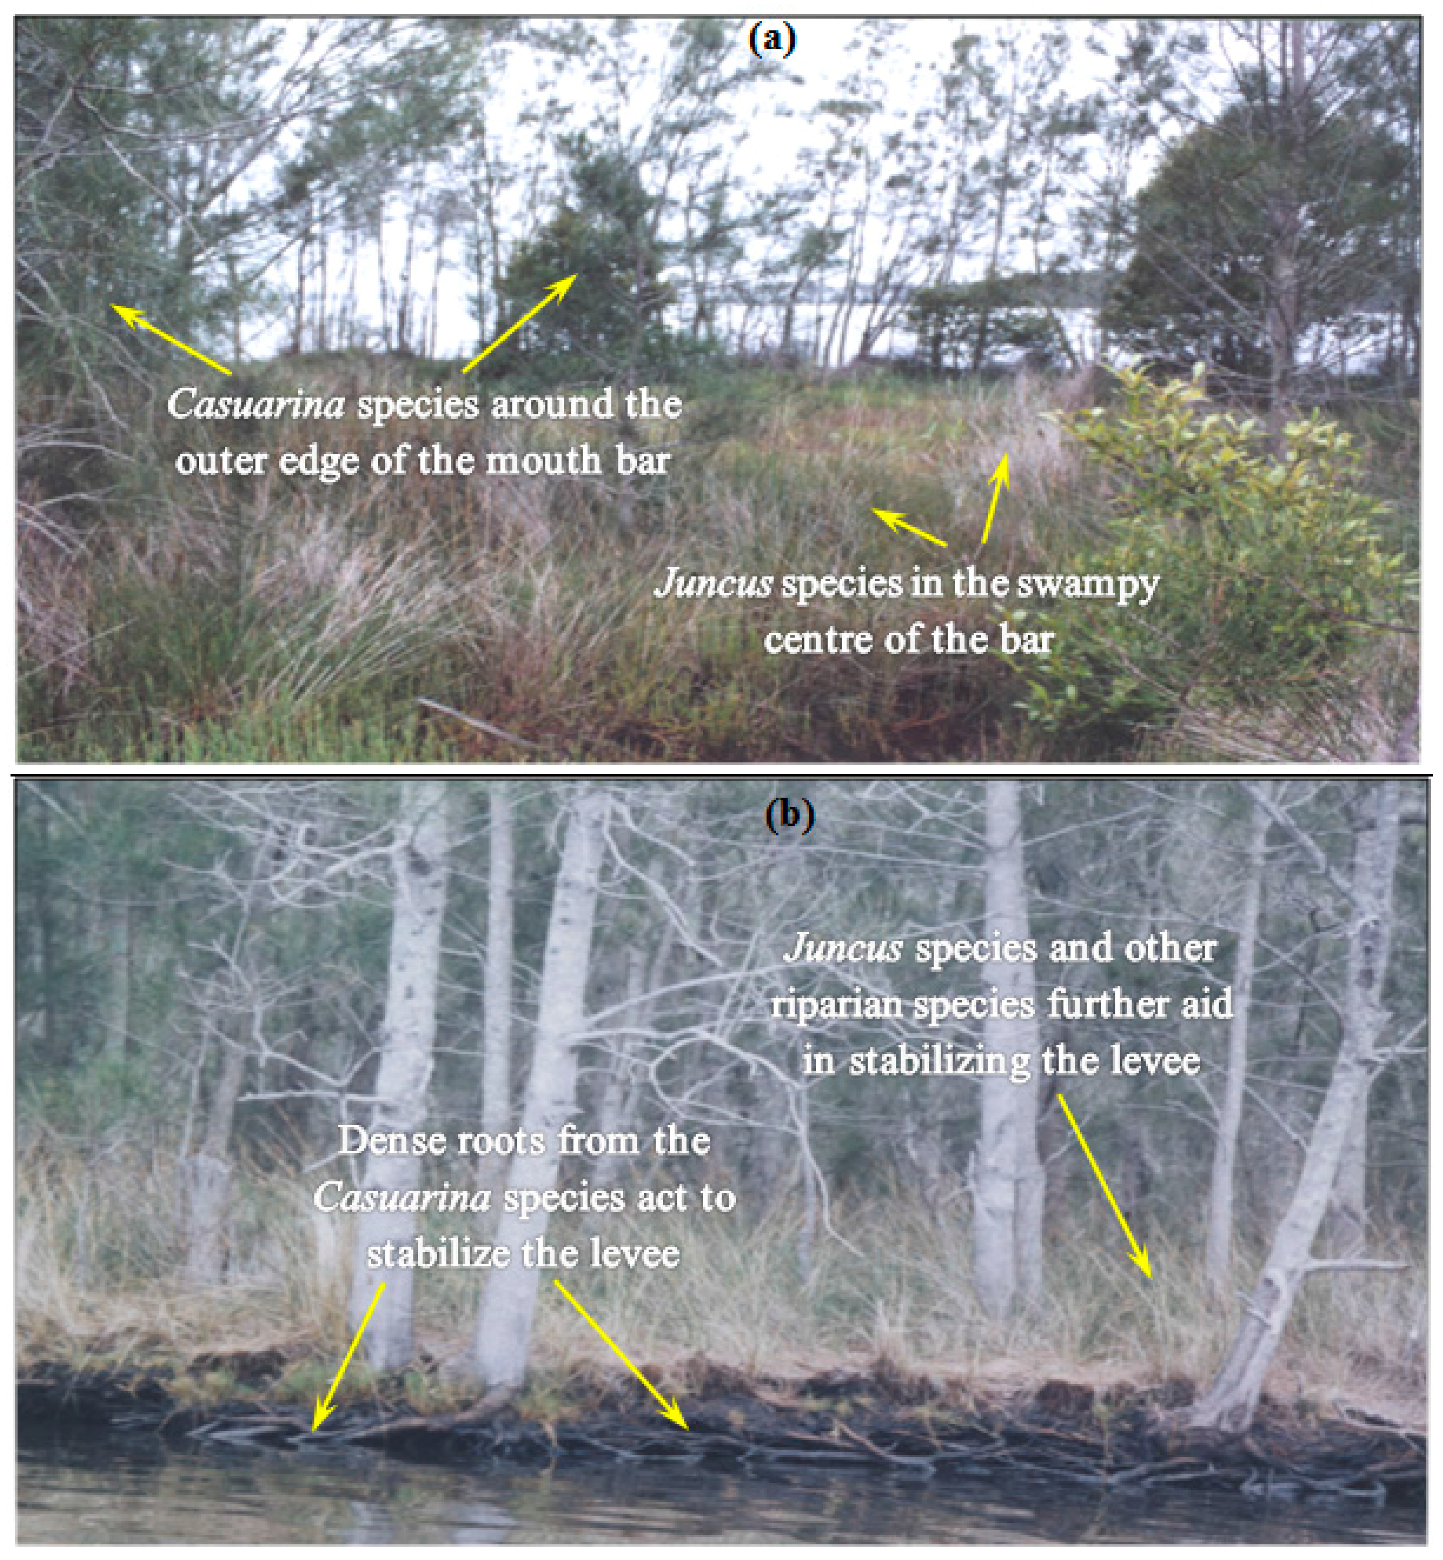
Charcoal in the basal fraction of the palaeoswamp facies suggests that at the time of deposition relatively frequent fire events occurred in the area [15,16]. Growth of levees and delta front facies have become suitable habitats for new ecosystems, including; mangrove and saltmarsh, as well as the native plants such as Casuarina, eucalypts and Juncus, which have continued to stabilise the estuarine deltaic ecosystem (Figure 7a,b). The biotic detritus has accumulated as organic matter within the sedimentary sequences.
The high-resolution aerial photography analysis (Figure 6) shows Wandandian deltaic facies progradation and growth into St. Georges Basin in red and graded red. Clear spatial patterns of accelerated accumulation of sediment in the Wandandian system are shown in Figure 6 and Figure 7. Measurements of deltaic progradation including rates, total and net growth are summarised in Table 1 and Figure 8.

4.2. Wandandian Deltaic Growth (1949–2016)

Figure 6 and 
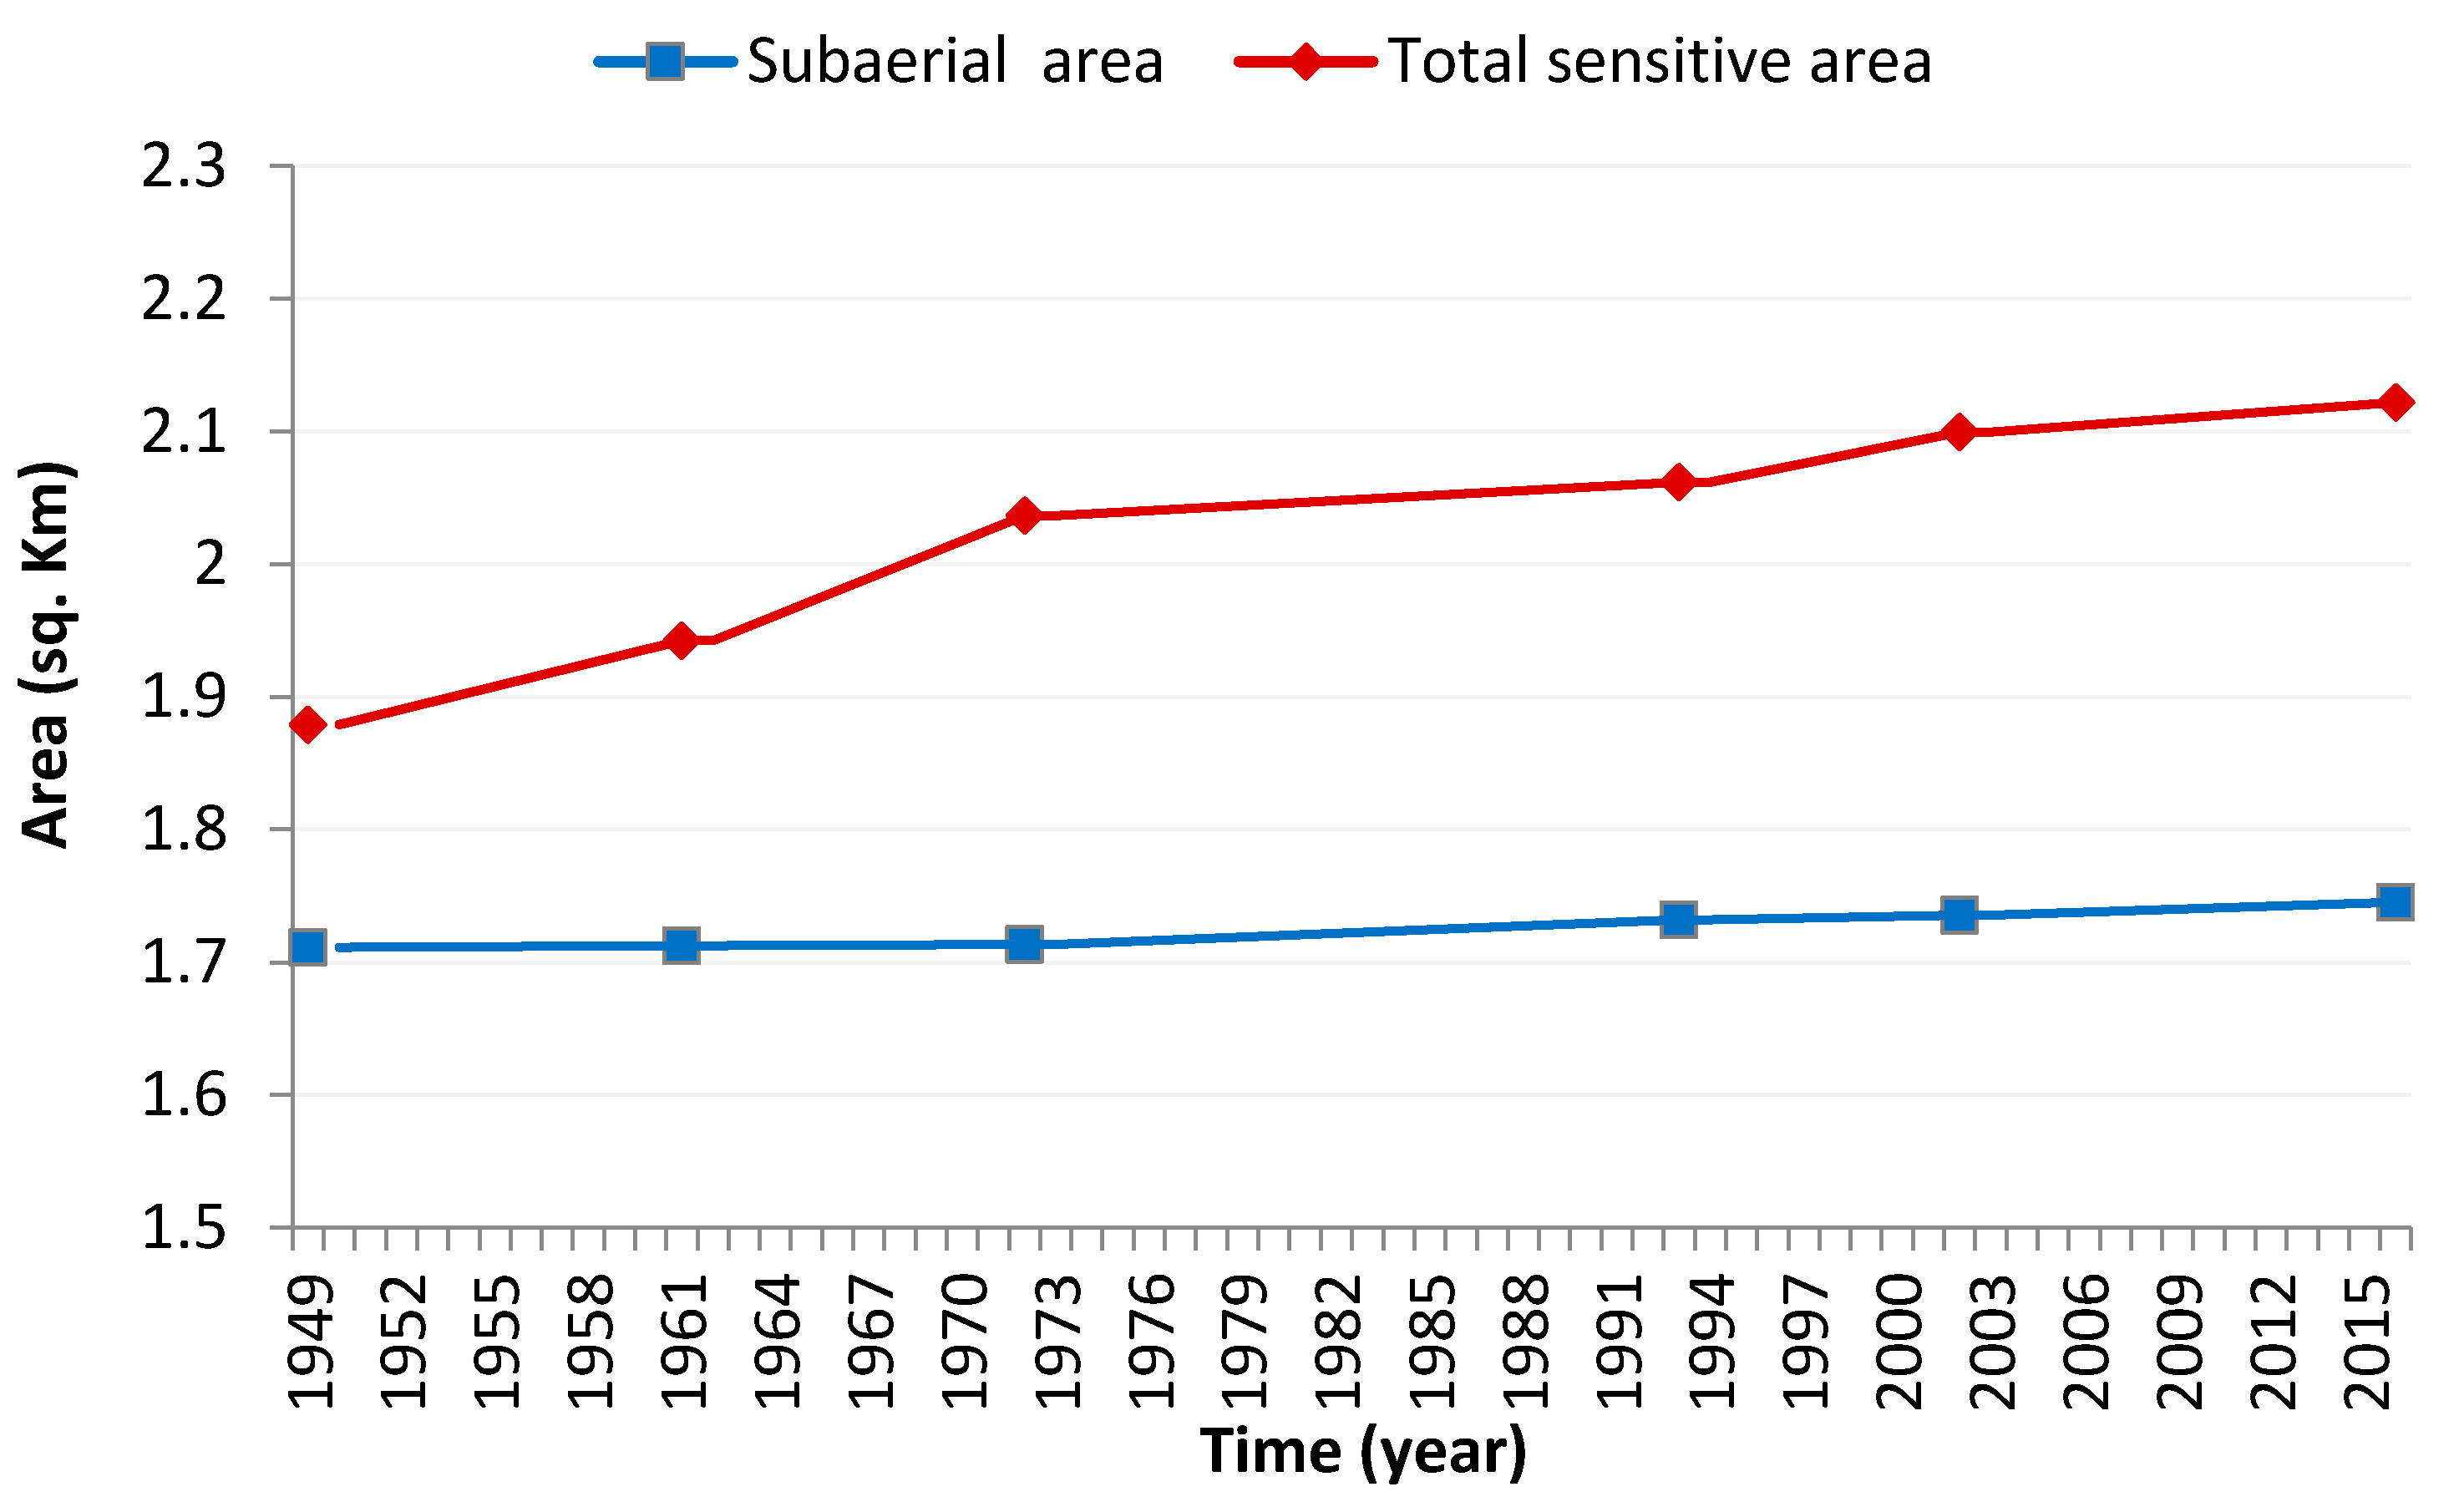
Figure 8 have derived growth evidence from the Wandandian deltaic eco-geomorphic system, particularly on the delta front facies and the adjacent shorelines. The area of the delta has been calculated for: (i) the subaerial, (ii) subaqueous delta borders and (iii) the total area (Table 1) thus providing annual rates of sedimentation during the study period (1949–2016), as illustrated in Figure 9.
Table 1 shows that the delta grew by 14% (242,860 m2) over the study period (1949–2016) at an average rate of 4168 m2/year, with highest rates being 5283 and 8554 m2 for 1949–1961 and 1961–1972, respectively. The reduced delta growth between 1972 and 1993 probably reflects sediment trapping in the sand mining area on Wandandian Creek. The subaerial area has grown by 29,130 m2, allowing suitable ecological accommodation to be inhabited. The intertidal and subaqueous area grew by 213,730 m2 into a protected part of St Georges Basin preparing a great opportunity for the subaerial area to expand more positively in the future (Figure 8).

4.3. Tracing the Shoreline Temporal Movement

Evidence of shoreline movements in Figure 6, Figure 7 and Figure 8, and the more detailed example in 
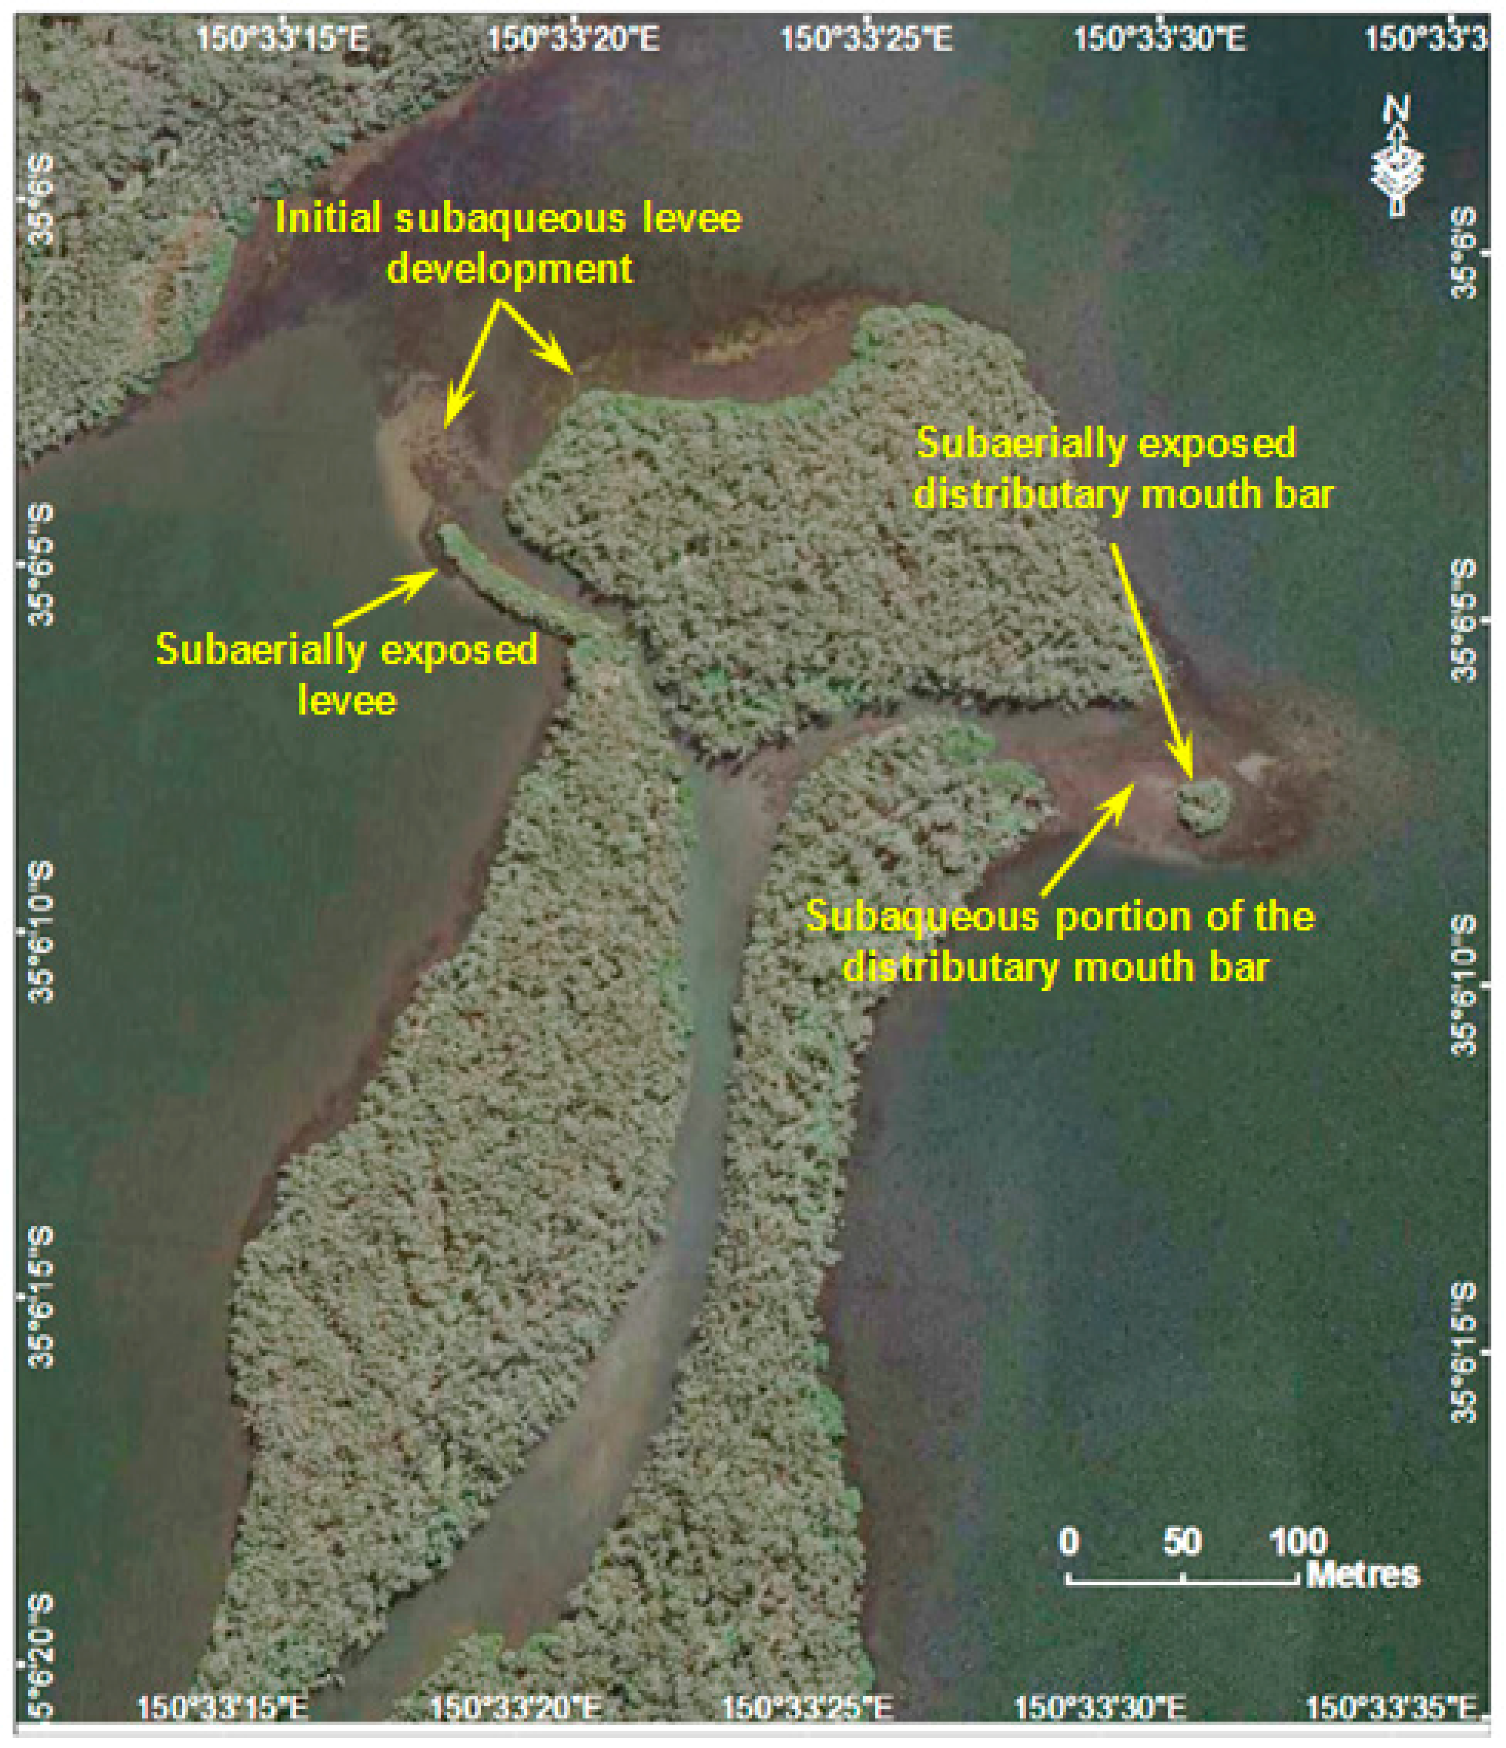
Figure 9, is a call for more shoreline dynamic analysis. The frictional interaction between the outflowing river water and the sediment surface [36] in the shallow western distributary channel resulted in the deposition of a triangular midchannel bar that caused the channel to bifurcate forming a typical fluvial-dominated birdsfoot delta morphology [37,38,39]. The subaqueous portion of the delta coarsens upwards whereas the subaerial portion of the interdistributary bar fines upwards from relatively clean mouthbar sand to muddy finer sand interbedded with dark carbonaceous silt lenses [15,16].
Most of the fluvial sediments passed into delta mouth via the active tidal channel are eroded and redeposited on the margins of St. Georges Basin (Figure 9). A more detailed dynamic analysis of the deltaic shoreline is shown in Figure 10.
Shoreline movements of Wandandian Creek delta have been captured using the digital shoreline analysis system (DSAS). Figure 10 shows clear growth (green) in the active delta areas. On the other hand, some erosion occurred along the landward side of the upper active channel (Figure 10a,b,f) part of its southern bank, as well as small portion of the delta-front island (Figure 10e).
The overall average shoreline extension was 1.451 m/year (Figure 10) but some zones show shoreline erosion rates of up to 0.348 m/year. These changes occurred along some parts of the deltaic landform facies and are more concentrated on the southern part of the delta at the creek mouth. Accretion was concentrated on the left side of the delta (on and around the large island, Figure 10d and levees of sections b and c), with a net shoreline movement of 2.87 m over the past 65 years. Most of the sediment movement occurs during flood conditions but movement around the delta margins is also affected by minor tidal flows and wind-wave action.

4.4. Fieldwork and Sampling

4.4.1. Soil and Sediment Samples

The soil and sediment sample locations (Figure 1 and 
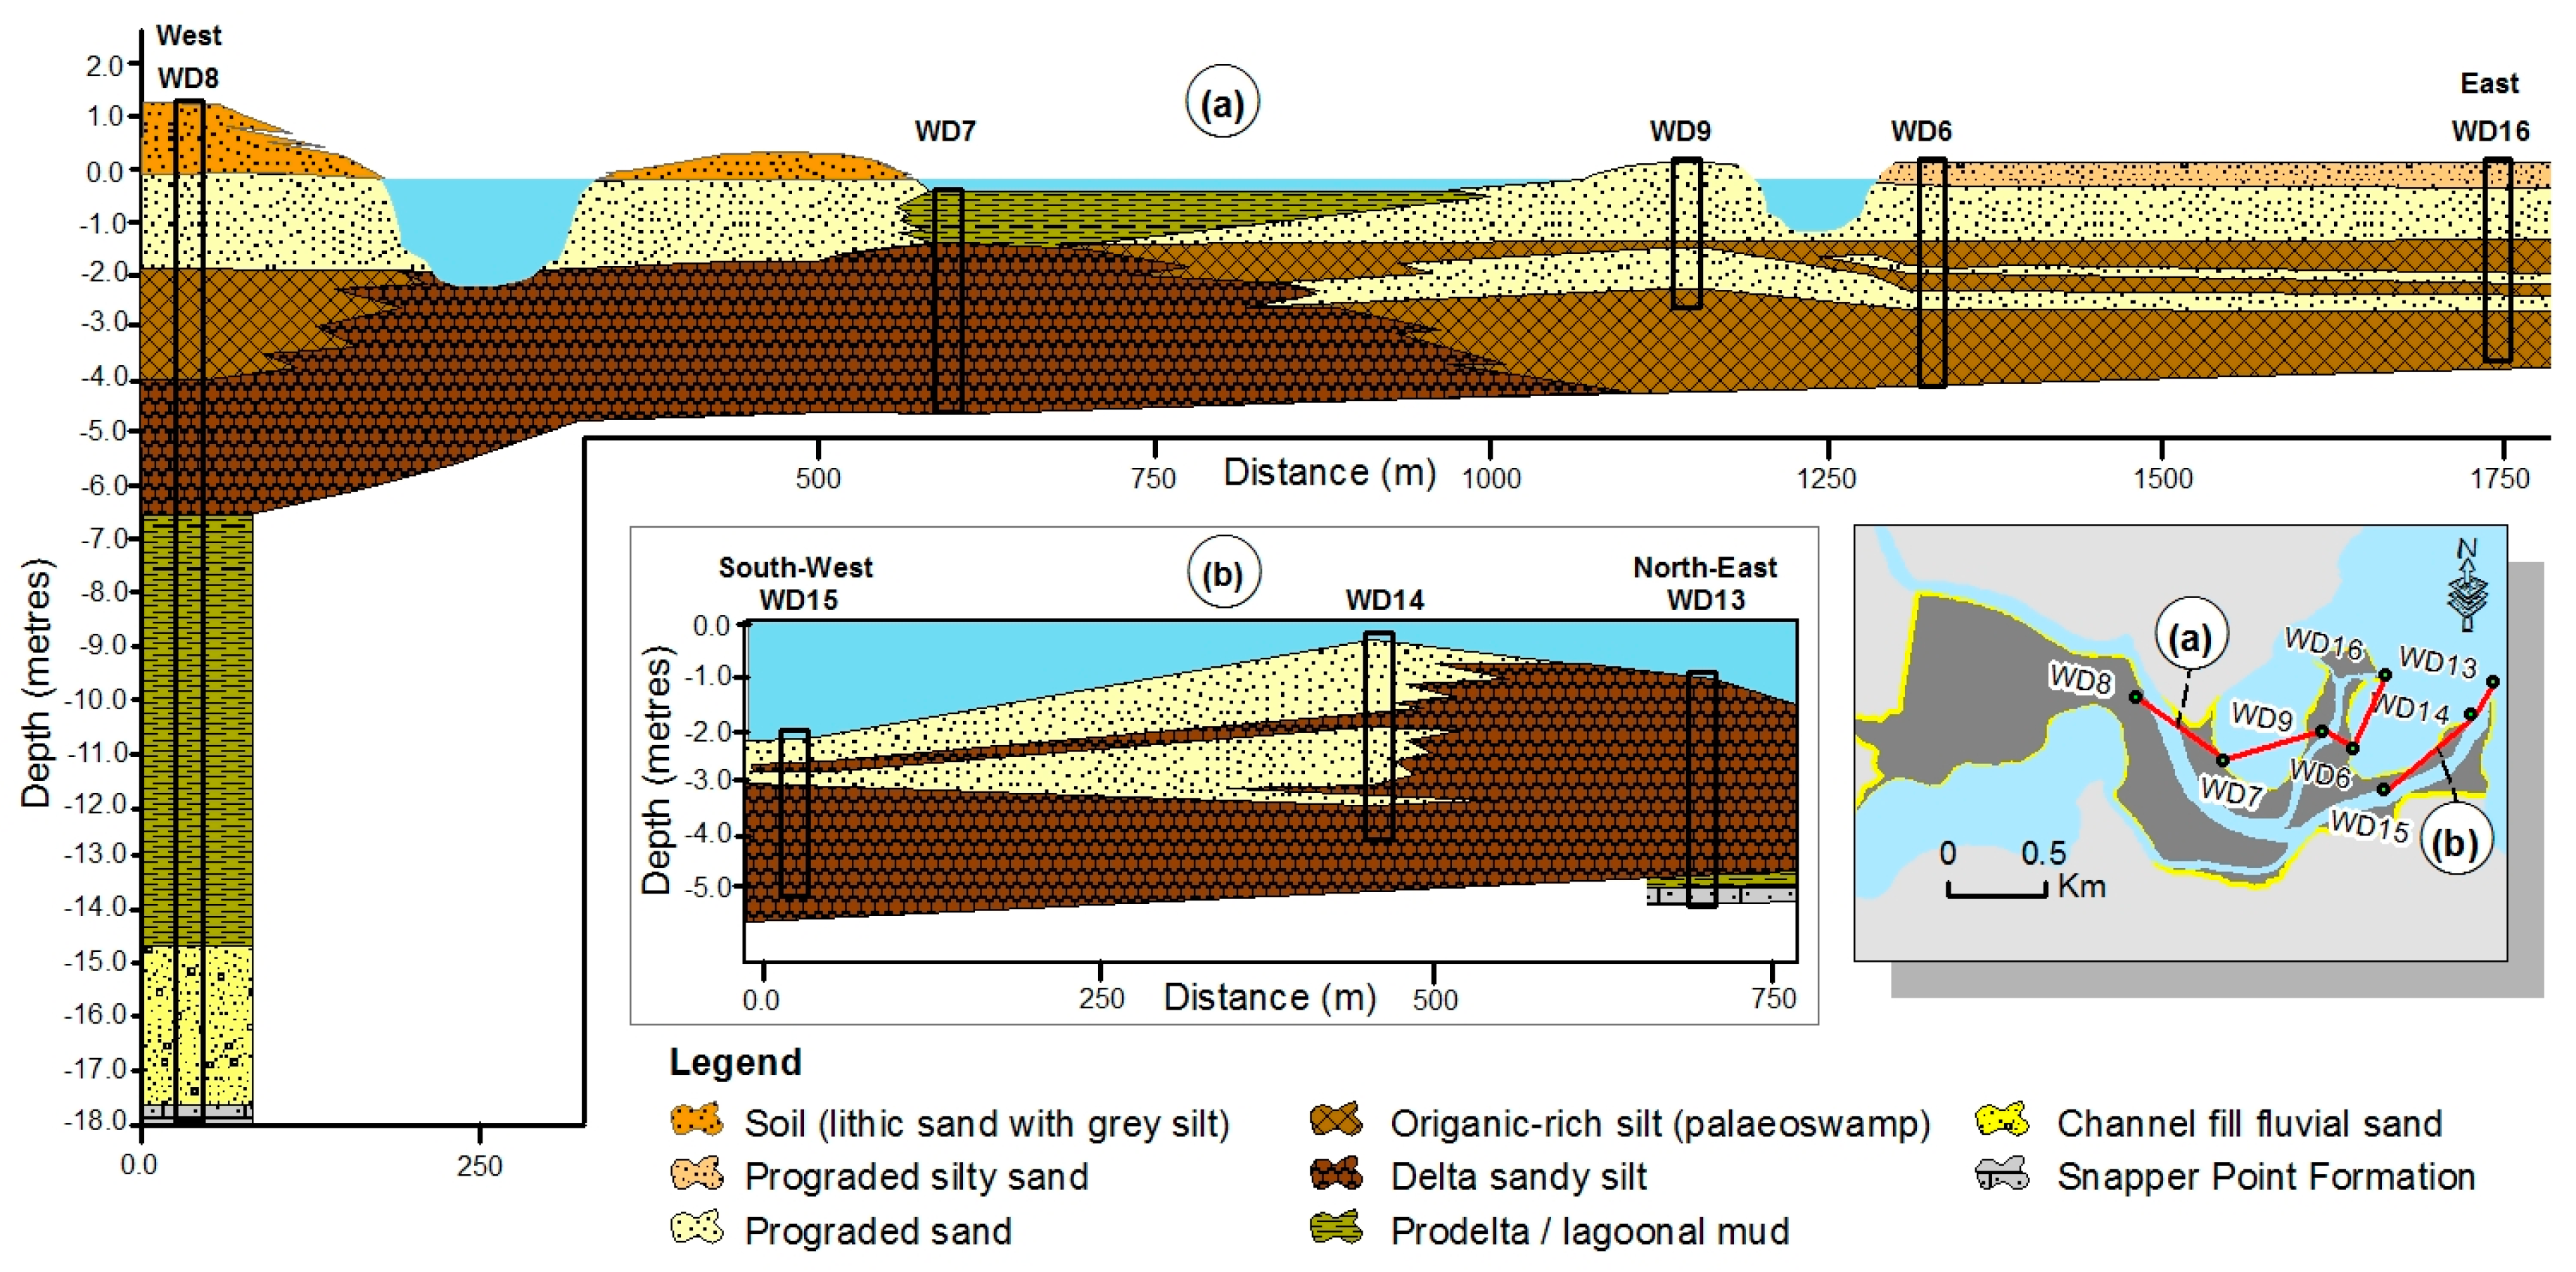
Figure 12) and analyses have linked the detected shoreline changes to a better understanding of the Holocene facies distribution and sedimentation patterns. A detailed description of the stratigraphy of the Wandandian Delta and its substrate has been presented in [15,16]. Initial deposition of fluvial sands and overbank deposits progressively filled the Pleistocene low stand palaeochannel before reaching St Georges Basin. Progradation of the Wandandian Delta into the broader embayment on the western margin of St. Georges Basin began approximately 3.5–4 ka [16] with the prodelta/lagoonal mud facies being overlain successively by the delta-front sandy silt facies and the prograded sand facies (Figure 11b). However, in the inner part of this embayment the latter two facies are mainly separated by 1–2 m thick organic-rich accumulations representing a palaeoswamp environment (Figure 11a). The prograded sand facies includes mouth bar, subaqueous channel and levee, and wave-reworked delta-front deposits. In the innermost protected part of the embayment the prodelta sand facies is overlain by a younger prodelta/lagoonal mud facies recorded in WD7 (Figure 11a).
The rate of progradation of sandy facies in the Wandandian Creek delta is difficult to establish in the dynamic fluvial and delta mouth areas. Very few macrofossils live within these facies and most of the recorded shells are reworked or broken making them unsuitable for accurate dating since they are not in situ [15,40].
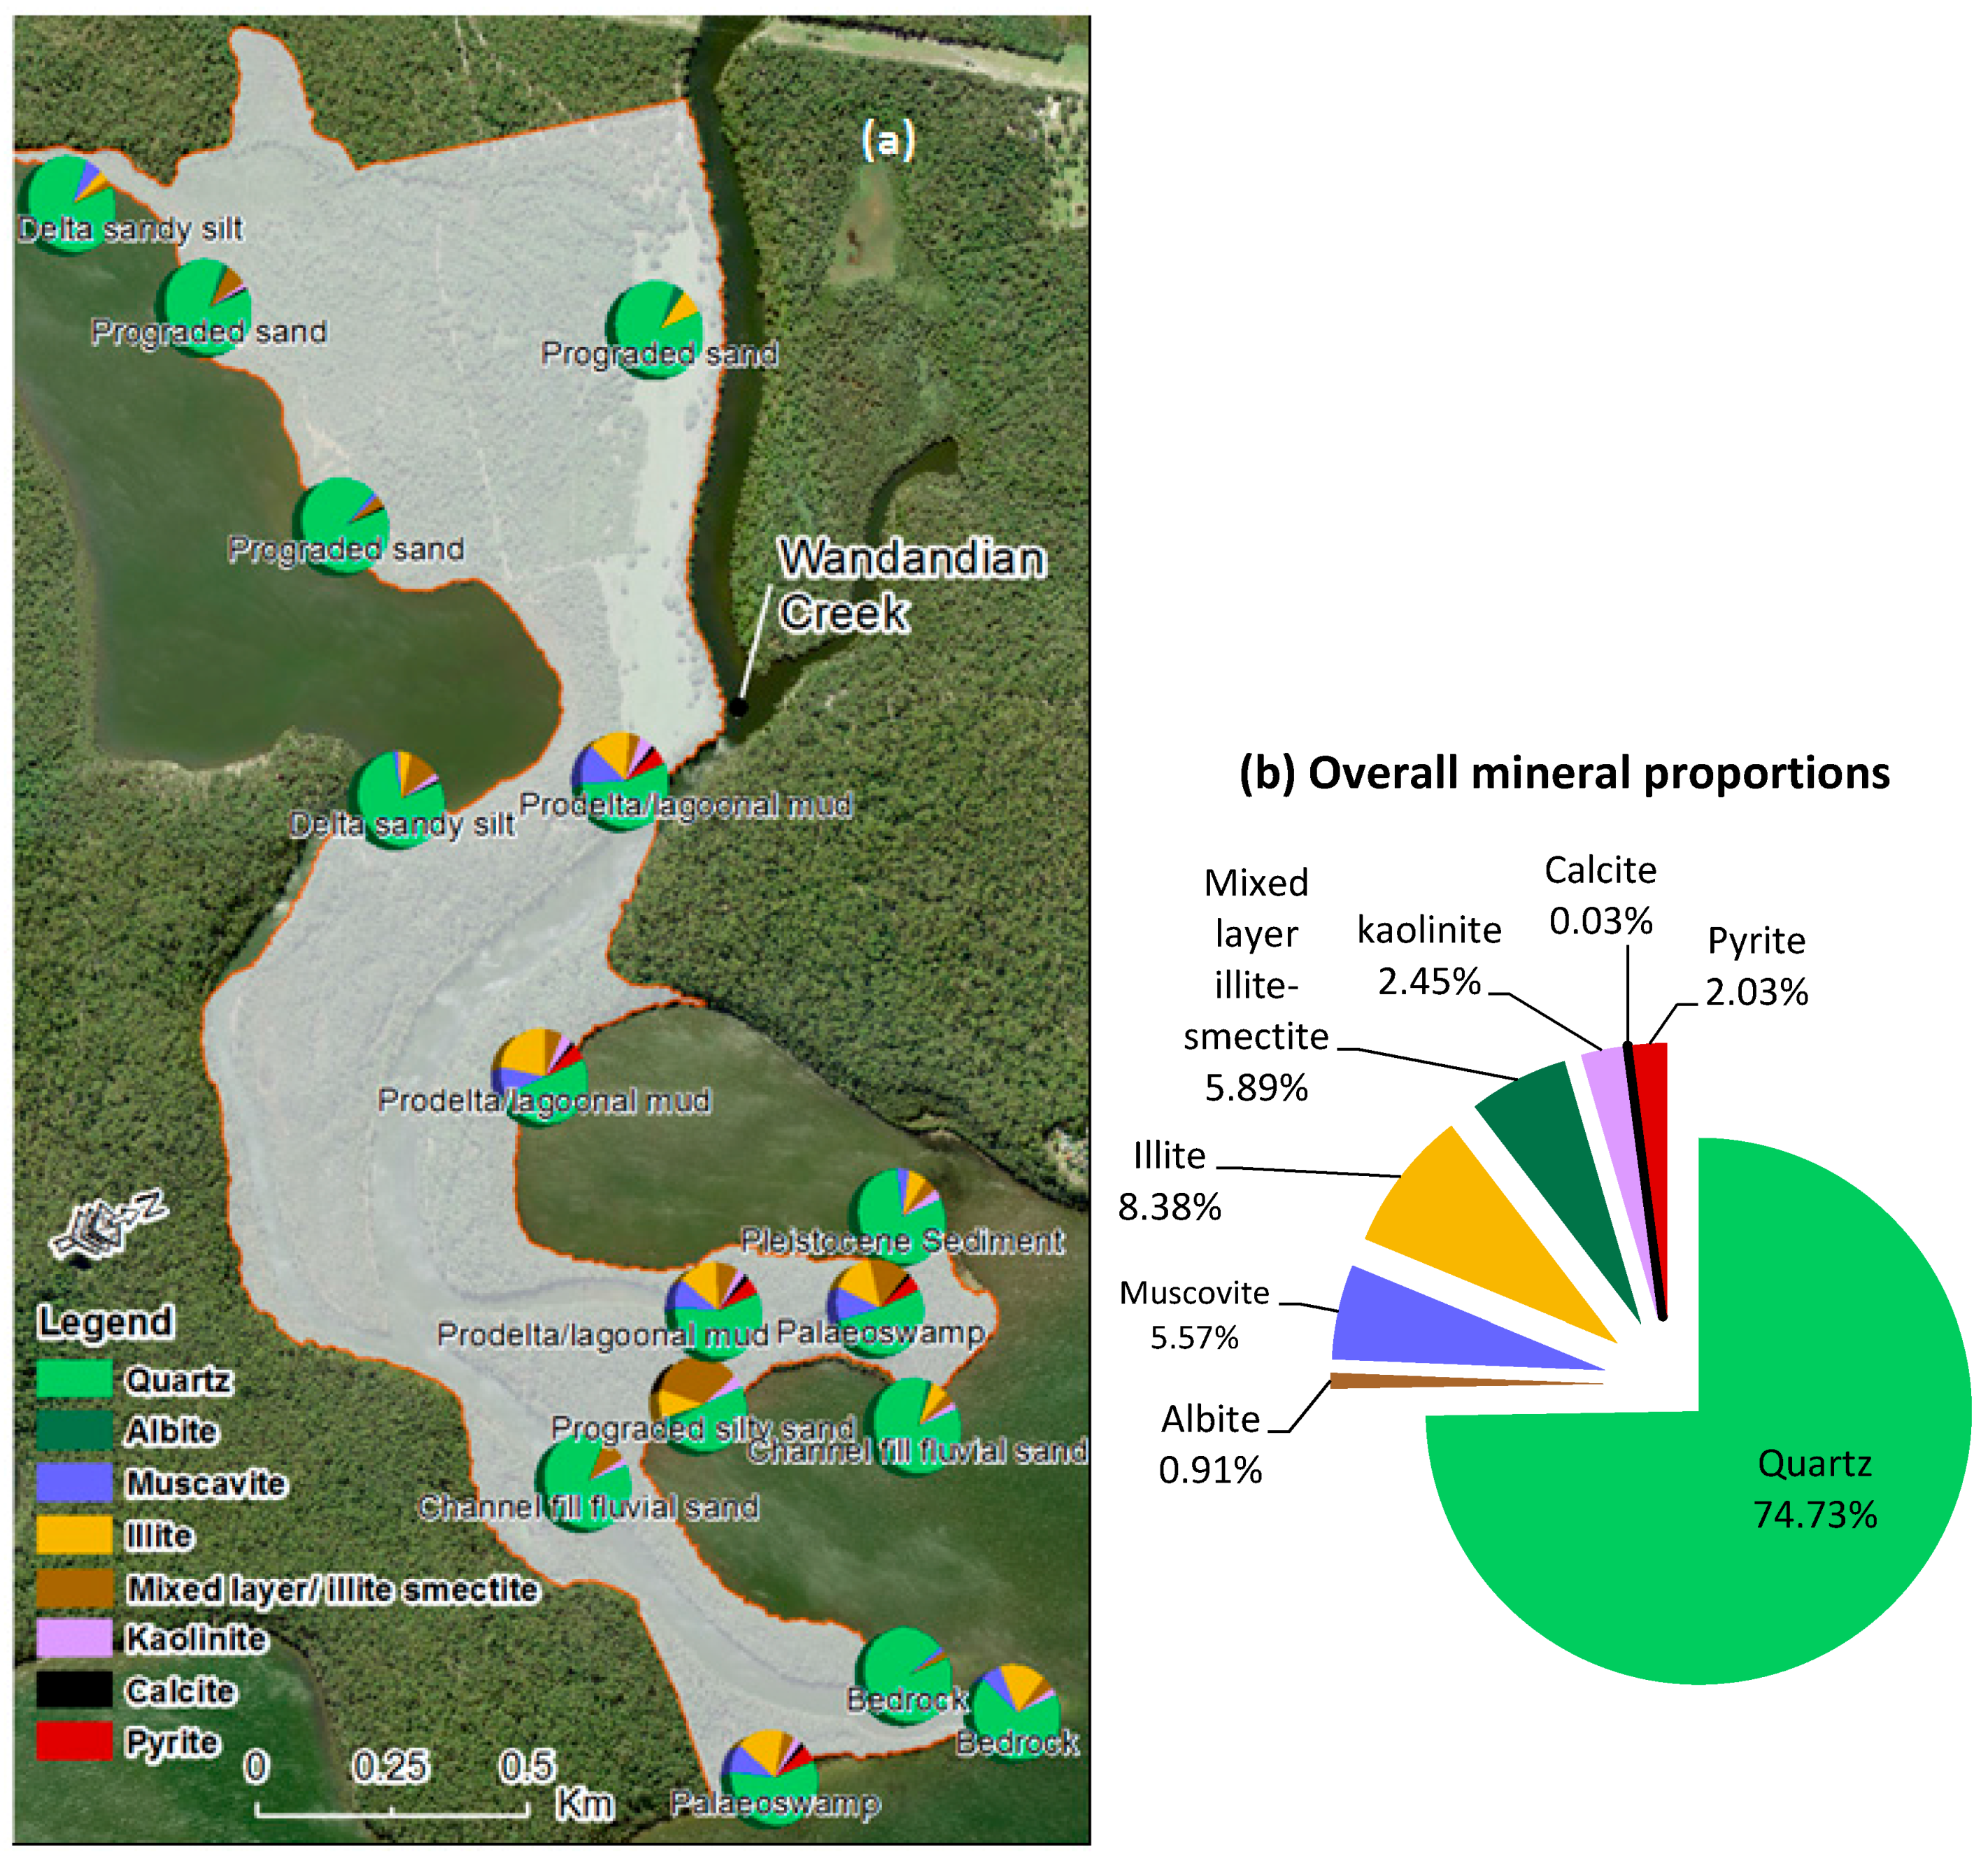
The mineralogy and grain size of the deltaic facies shows a clear relationship to the depositional energy reflected in the relative proportions of quartz in the sand facies and clay in the fine facies (Table 2). Clay content in the samples is highest in the low energy environments in sheltered reaches, but also occurs in the fluvial lithic sands through the diagenetic alteration of feldspar and rock fragments (Figure 12). Pyrite indicates reducing conditions in the organic-rich palaeoswamp and prodelta/lagoonal mud facies.
Organic matter plays an important role in the ecosystem development and growth on intertidal sedimentary deltaic landforms. The amount of organic matter in the sediment is controlled by the rate of organic decomposition in the sediment [14]. In general, high rates of total carbon dioxide (TCO2), ammonium (NH4+), and silicate (SiO44−) production, and oxygen (O2) consumption indicate high respiration rates and correspond to high organic contents in the sediment [14]. As the organic matter degrades nutrients are released into the water column and become available for plant growth and ecosystem development. Organic matter components (%OM) are concentrated (Figure 13) in the downstream part of the delta, where the wetlands are distributed.
While the Wandandian Delta had low TCO2, O2, NH4+, and SiO44− fluxes, the SiO44− and TCO2 fluxes exceeded the NH4+ flux indicating that denitrification, carbonate dissolution or decoupled decomposition of organic matter were more important than respiration [14]. Aerobic respiration in coastal and estuarine sediments generally shows a flux ratio of 1TCO2:1.3O2 but the TCO2 flux in the Wandandian Delta exceeded this ratio indicating the importance of anaerobic degradation in these deposits. This was confirmed by the large amount of gas, including H2S, released during vibracoring [15,16].

4.4.2. Water Quality

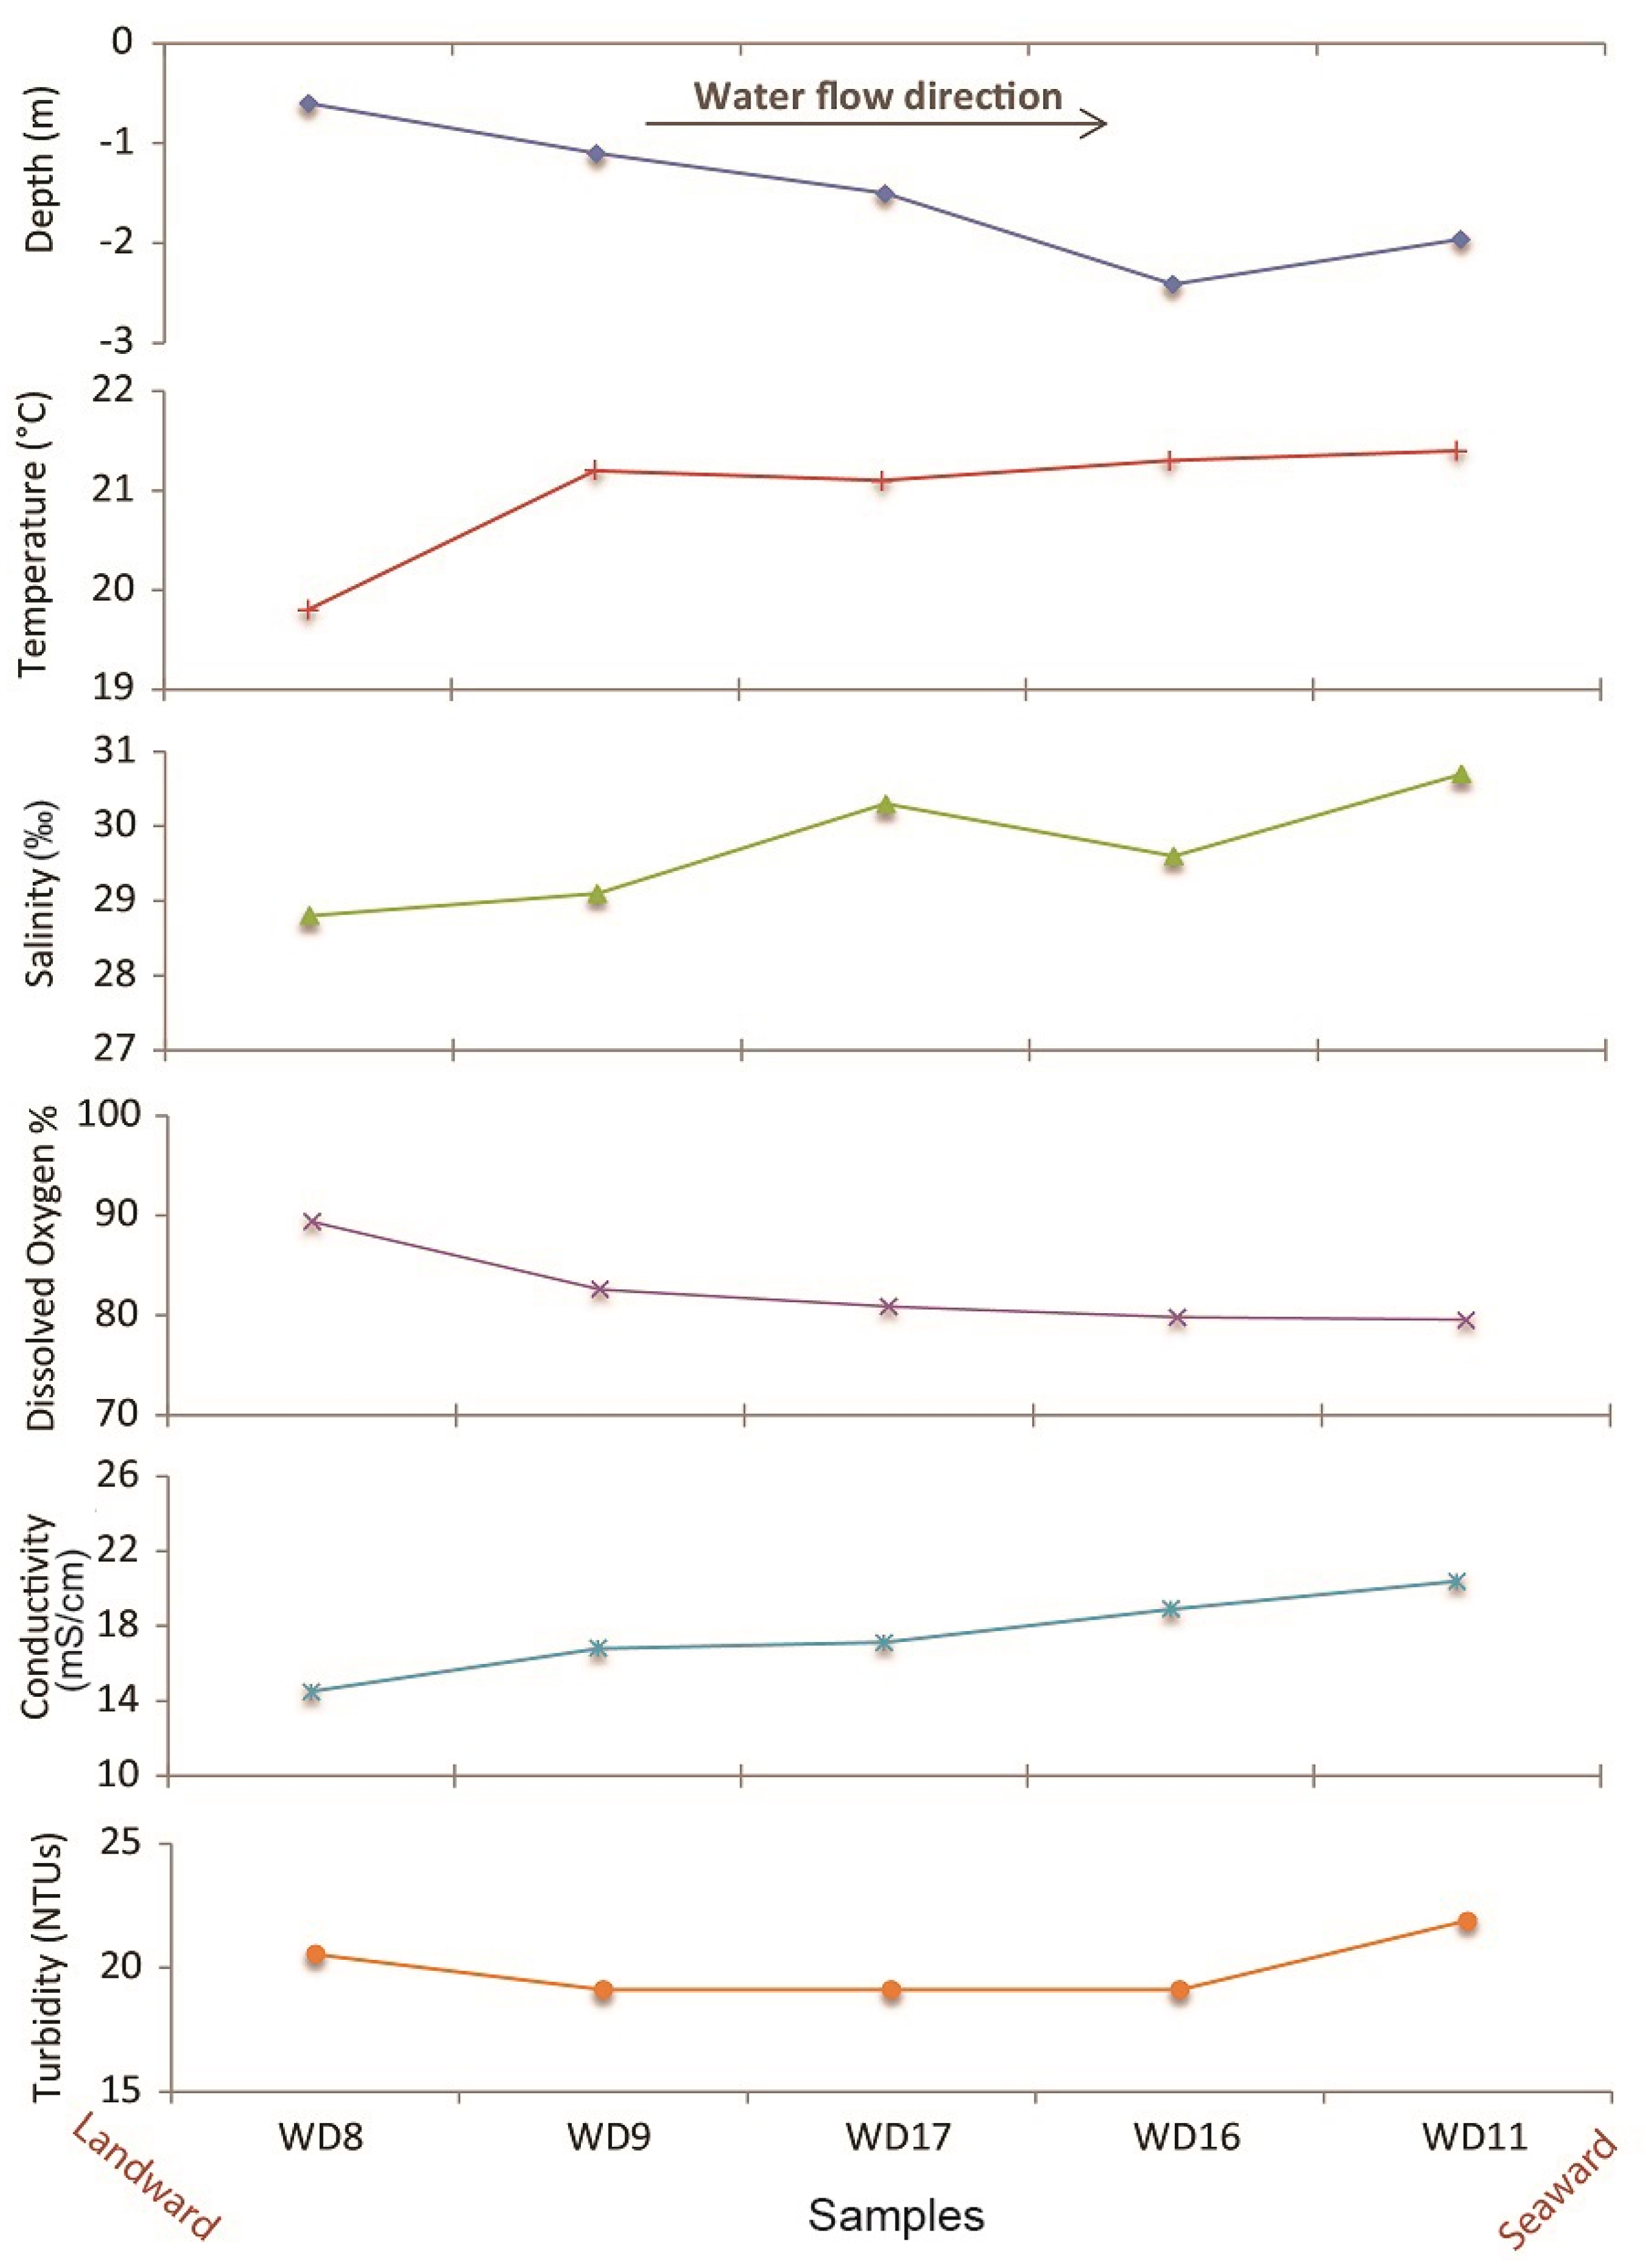
Water quality was assessed under average flow conditions to indicate downstream changes in the main water quality parameters. Figure 14 shows increases in conductivity, dissolved oxygen and salinity towards the mouth of the delta while the temperature and pH show a very slight increase, due to shallower water that was easier to heat (Table 3). In contrast, turbidity has shown a decline in the downstream direction because suspended sediment has flocculated and accumulated along the delta channels as salinity increases. At the same time, the active channel flows more slowly towards the coastal end of the delta especially during rising basin water levels (due to floods, tides or seiches), which makes the river less able to transport both bedload and suspended sediments. These results clearly indicate that abundant sediment is transported to the delta leading to high rates of deposition and bank accretion in these downstream areas. Thus, the sediment is basically spread across the entire estuary and the suspended sediment becomes less and finer during its movement along the Wandandian Delta due to flocculation.

5. Morphological Evolution of the Wandandian Delta

The knowledge gained by assessing accumulation rates through remote sensing datasets and the GIS analytic system creates a better framework for assessing deltaic systems here and worldwide. The multi-temporal changes analysis approach was able to quantify the eco-geomorphic changes on the Wandandian Delta case study, and shows a qualitative picture of changes in the pattern of land cover, banks and broad changes in the delta area since the start of suitable historical photographic data in 1949 (Figure 7, Figure 8, Figure 9 and Table 1). The main features shown by the multitemporal deltaic changes between 1949, 1961 and 1972 are in the delta front facies, which involved growth of the levees, deltaic shoreline facies, a reduction in the width of the active channel, and changes to the areas of mangrove, saltmarsh and some native plant canopy (Figure 6, Figure 7 and Figure 8). The subaqueous zone and the active delta channel, as well as some of the internal shorelines, experienced net accretion in all five analysed time intervals between 1949 and 2016 but especially from the 1940s to 1970s. Consequently, most of the extended areas have increased land covers by expansion of mangroves and saltmarshes.
The active channel of Wandandian Creek has bifurcated with the eastern distributary prograding onto the shallow rocky bed on the western side of the St. Georges Basin producing an elongate delta. In contrast, the western distributary extends into the middle of the bay forming a small birdsfoot delta. These delta extensions have resulted in expanded geomorphic units including levees, floodplain, sandspits and their associated land covers (Figure 6 and Figure 10; [15]). Both distributaries are characterised by well-defined subaqueous and subaerial levees up to 1.5 m above water level. These levees consist of coarse fluvial sand that fine upwards to silty sands with interbedded dark organic-rich silt lenses. The subaerial levees are rapidly stabilized mainly by Casuarina and Juncus (Figure 7b). Additionally, most of the native plants and the new saltmarsh areas (seen in 1949) were growing on the stable sensitive areas and started mixing with mangroves in the tidal zones as an effect of sea level and the consequent water table rise (Figure 4d and Figure 6). The mangrove cover has gained ground as a result of the shoreline expansion (Figure 6 and Figure 8).
The minimal wind-wave reworking in the western embayment of St. Georges Basin means that it represents an ideal environment for silt and organic matter accumulation as Wandandian Creek discharges load through the delta. A reduced sediment carrying capacity through the delta may reflect a lower river discharge (lower rainfall) or more probably represents gradual filling and abandonment of previously active channels [37]. The large woody detritus and abundant organic material present in the palaeoswamp and prodelta/lagoonal mud facies were mainly transported as rafted plant debris into these quiet water environments. Two distinct sand sheets in the upper part of the palaeoswamp facies (Figure 11a) probably represent large flood events. The palaeoswamp deposits typically have a distinctive hydrogen sulphide smell caused by anaerobic decomposition of organic matter in the presence of sulphate ions.
Suspended sediment fluxes from the catchment and the progradation of geomorphic units are the major influences controlling this delta growth in an inner estuary, like St. Georges Basin [15,16]. The results of this study reveal some important aspects of human and natural effects influencing the sedimentary facies, shoreline growth and water quality of Wandandian Creek and its deltaic zone (Figure 6, Figure 7, Figure 8, Figure 9 and Figure 10).
Water quality analysis (Table 3 and Figure 14) has shown that sedimentation increases towards the delta head providing continued accumulation processes. The salinity shows a gradual increase downstream towards the marine influenced St. Georges Basin. The water temperature also increases due to the stagnated water and limited ocean water exchange in the inner parts of St. Georges Basin [14,15]. Meanwhile, the conductivity and turbidity have fluctuated but show a slight increase towards the delta mouth reflecting the influence of salinity and suspended sediment transport and accumulation along the creek. In contrast, dissolved oxygen shows a declining trend seaward, indicating that O2 consumption in the water column exceeded any replenishment from photosynthesis or the atmosphere.
The deltaic progradation evidence comes from the geomorphic growth of 242,860 m2 over the study period (4168 m2 annually, Table 1). Growth has resulted from the sediment delivered to the coastal zone through the Wandandian Creek drainage system from intermediate moderately modified catchment. This growth has provided good ecosystem accommodation for plant colonisation, with common organic matter accumulating within the sediment along the shorelines and in the interdistributary bays.
This study has illustrated how careful analysis of remote sensing data using a GIS platform can lead to a detailed understanding of the growth and evolution of deltaic and estuarine systems and is similar to the results presented for other Australian coastal systems [3,4,19,41,42,43]. This implies that the methodology can be broadly applied to study morphological changes over relatively short timeframes in other coastal lagoon systems both in eastern Australia and more generally to any similar systems around the world.

6. Conclusions

This investigation has effectively used remote sensing and GIS analysis to quantify historical and existing eco-geomorphic situations in deltas and use these to predict their future responses to related environmental stressors. Proven deltaic progradation has shown how estuaries can keep up with sea level rise through continuous sand/silt sediment accumulation derived from a partially modified catchment.
The morphology of the Wandandian Creek delta has been influenced by both the shape of the shallow bedrock and Pleistocene outcrops and by recent anthropogenic modifications within the catchment. Delta growth into the western arm of St. Georges Basin began at 3.5–4 ka with the delta-front sandy silt facies overlying a very thin prodelta mud facies. Seaward extension of the overlying prograded sand facies formed a coarsening-upward sequence that was probably facilitated by the lowering of regional sea-level by about 1.5 m after 4 ka [41]. The fall in sea-level reduced the available accommodation space farther up Wandandian Creek releasing more sediment for delta growth. As the delta prograded into a broader and deeper part of St. Georges Basin its form became less restricted, and the western distributary has formed a typical classic birds-foot delta [37,38,39,42,44]. The large amount of organic matter in the fine-grained delta facies indicates subaqueous deposition in a low energy environment at water depths similar to or slightly higher than at present [16]. The upper delta floodplains, levees and backswamps partly overlie the lower delta plain subaqueous units described above but elsewhere they directly overlie fluvial sands. These fluvial-dominated areas show a typical fining-upwards sequence, and hosted an extensive vegetation canopy, such as mangrove vegetated shorelines and backswamps with saltmarsh habitats.
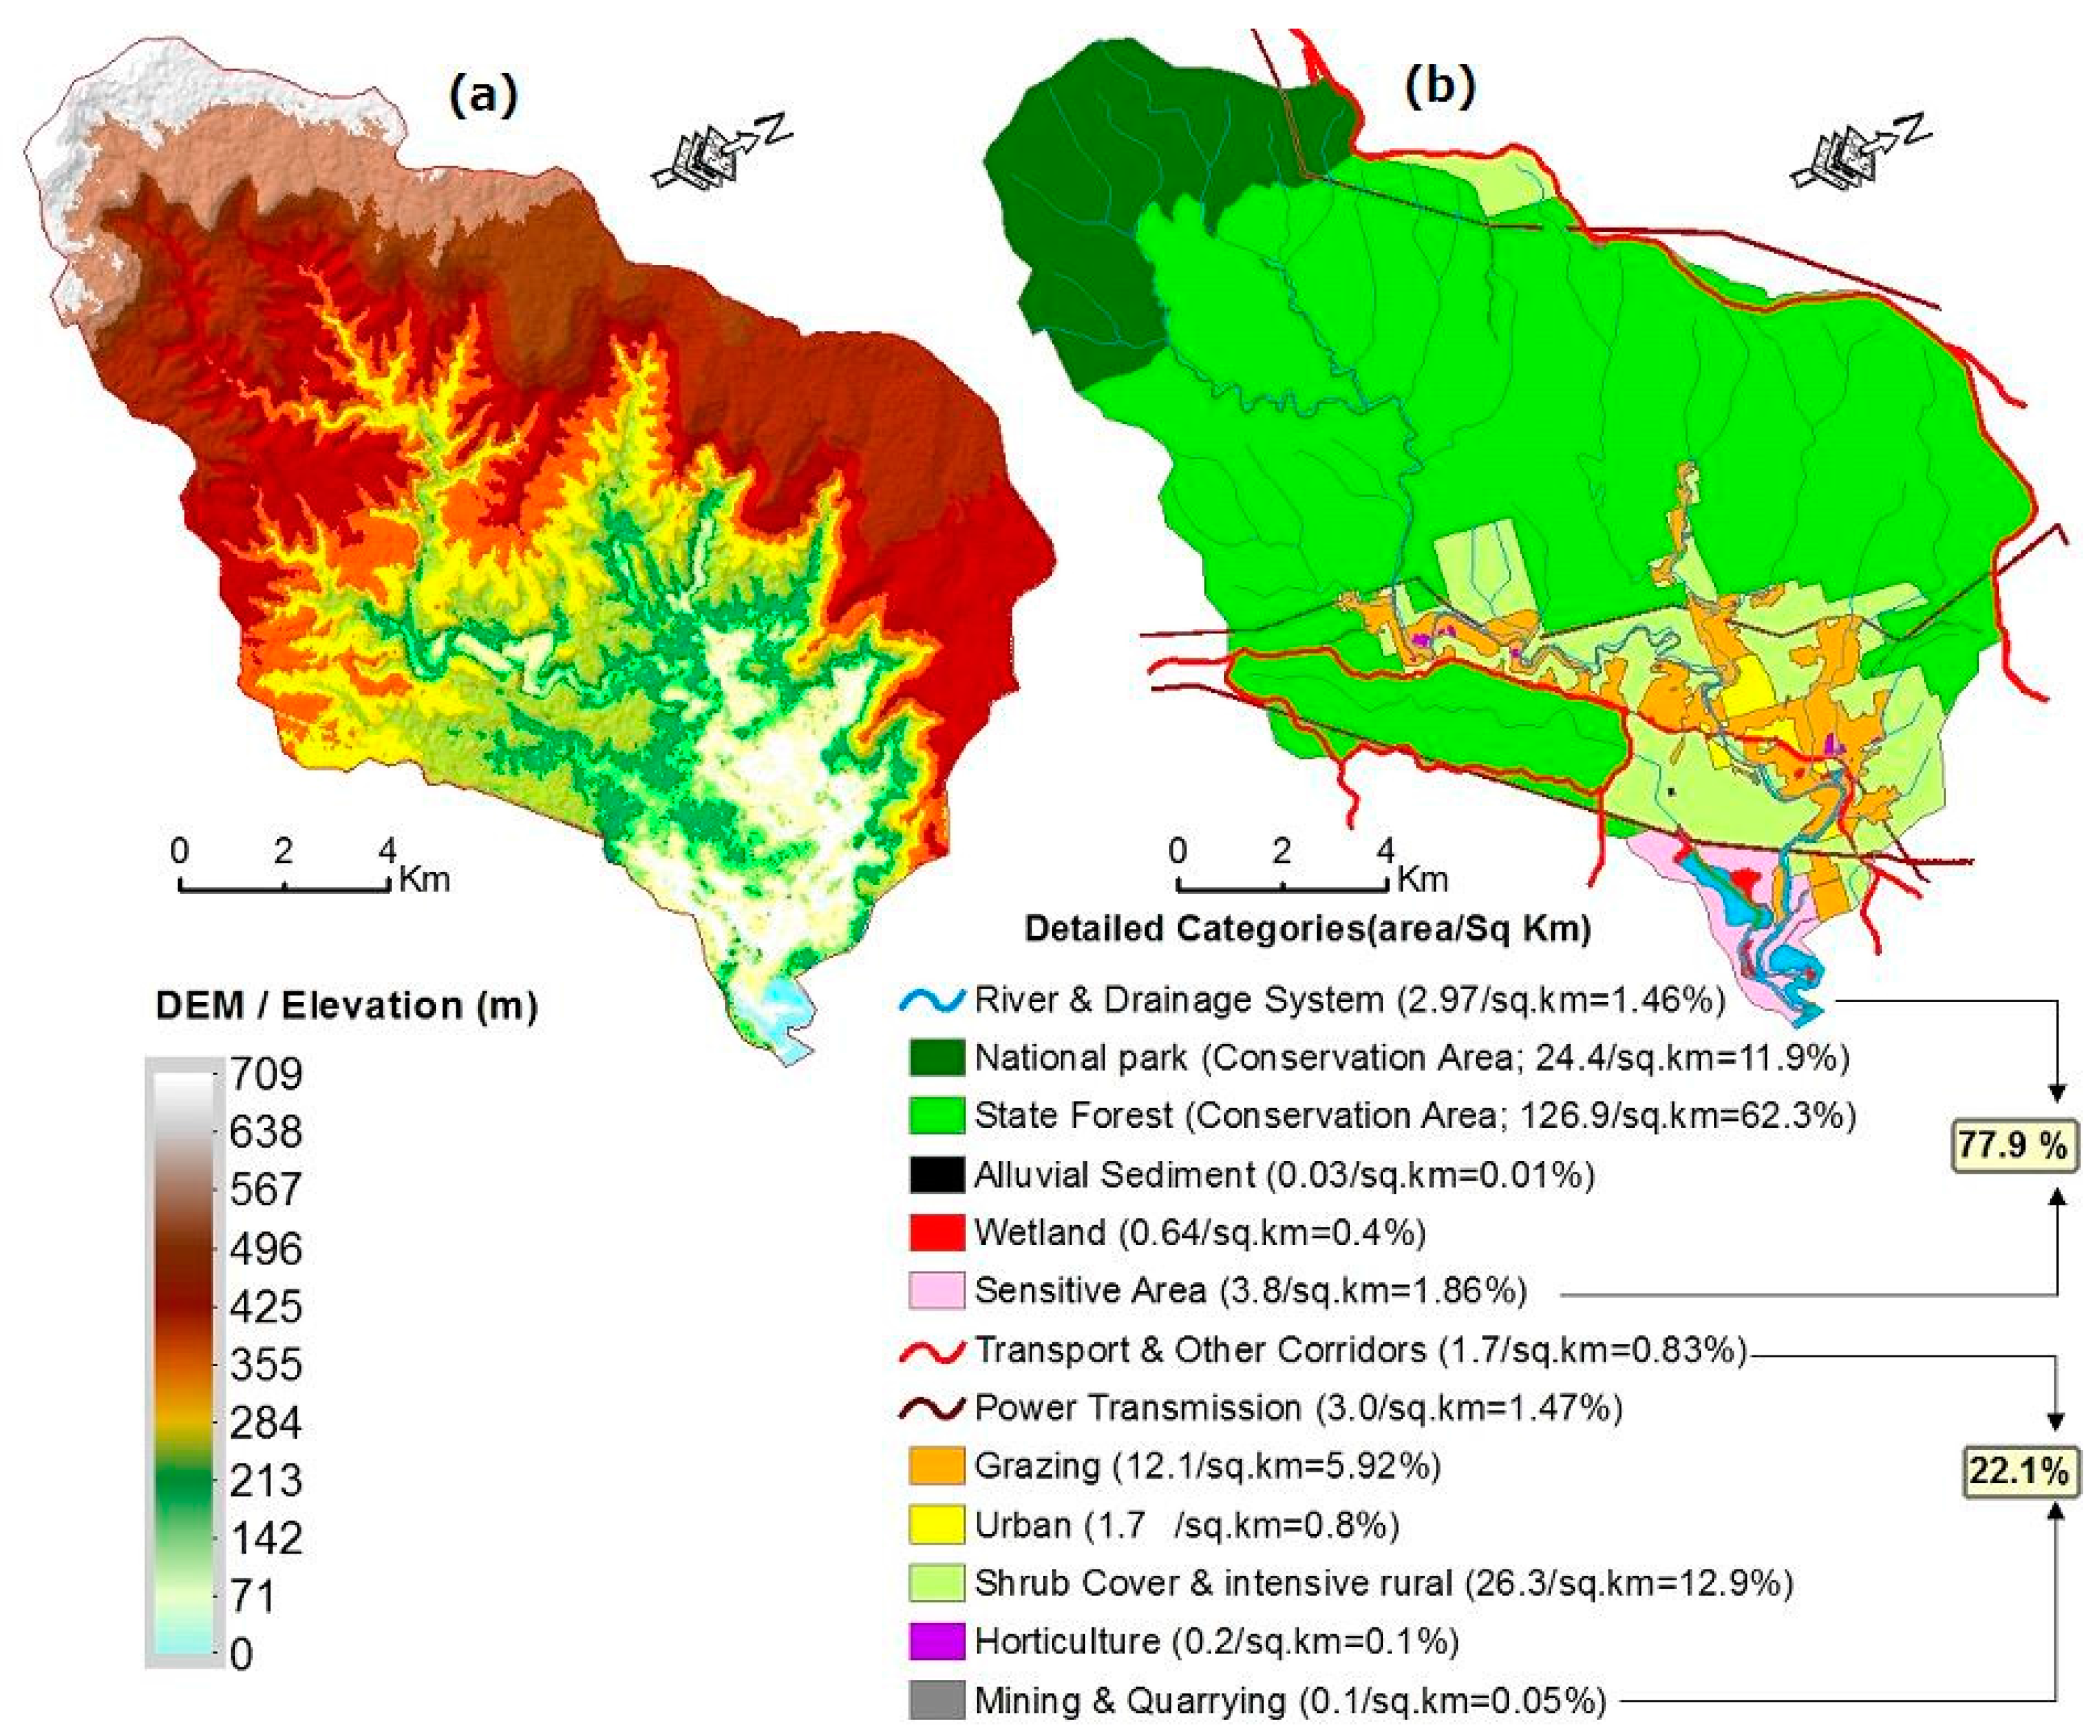
European modification of the Wandandian Creek catchment (22.1%) has had a limited impact on sedimentation and progradation rates of the delta [15,16]. However, dredging in the Wandandian river channel in the 1970s reduced the amount of bedload transport into St. Georges Basin restricting delta progradation. The effects of modifications such as this means that short term intensive investigations based on remote sensing and GIS analysis are highly recommended in all such areas worldwide.
The eco-geomorphic interpretation from this study could assist the Shoalhaven City Council and local landowners on the lower Wandandian Creek floodplains to make informed decisions about the future environmental management of the delta. The findings from this study can be extended locally and globally when considering the Holocene development of coastal lagoons. For example, the widespread occurrence of pyrite- and organic-rich delta-front deposits at relatively shallow depths could lead to the formation of acid sulphate soils if they were drained and oxidized. This would have a large impact on the surrounding environment.
This paper has established that remote sensing datasets and GIS analysis, in combination with sedimentological and morphological data, can clearly document the evolution of the Wandandian deltaic eco-geomorphic system as it progrades into St. Georges Basin, southeastern NSW, Australia. The understanding of how the deltaic landforms have evolved in the past can then be used to help establish their probable vulnerability/adaptability into the future. Equivalent analytical methods can be extended to and replicated in similar lagoonal estuaries worldwide.

Acknowledgments

This study is a part of a Ph.D. project of the first author undertaken at the School of Earth and Environmental Sciences at the University of Wollongong. This project has been financially supported by the GeoQuEST Research Centre, University of Wollongong, Australia.

Author Contributions

This research forms part of Ali K. M. Al-Nasrawi’s PhD and as such he designed the project, carried out the new research and wrote the draft of the manuscript. Carl A. Hopley provided the results and samples from previous research on the Wandandian Creek delta from which the current study has been developed. Sarah M. Hamylton assisted with advice on the spatial analytical methods used in this research. Brian G. Jones helped design the project, provided assistance with some of the analyses and discussed and edited the manuscript.

Conflicts of Interest

The authors declare no conflict of interest. The funding sponsor had no role in the design of the study; in the collection, analyses, or interpretation of data; in the writing of the manuscript, and in the decision to publish the results.

References

  1. Aarts, B.G.W.; Nienhuis, P.H. Ecological sustainability and biodiversity. Int. J. Sustain. Dev. World Ecol. 1999, 6, 89–102. [Google Scholar] [CrossRef]
  2. Day, J.W.; Christian, R.R.; Boesch, D.M.; Yáñez-Arancibia, A.; Morris, J.; Twilley, R.R.; Naylor, L.; Schaffner, L.; Stevenson, C. Consequences of climate change on the ecogeomorphology of coastal wetlands. Estuar. Coasts 2008, 31, 477–491. [Google Scholar] [CrossRef]
  3. Al-Nasrawi, A.K.; Jones, B.G.; Hamylton, S.M. GIS-based modelling of vulnerability of coastal wetland ecosystems to environmental changes: Comerong Island, southeastern Australia. J. Coast. Res. 2016, 75, 33–37. [Google Scholar] [CrossRef]
  4. Akumu, C.E.; Pathirana, S.; Baban, S.M.J.; Bucher, D.J. Monitoring coastal wetland communities in north-eastern NSW using ASTER and Landsat satellite data. Wetl. Ecol. Manag. 2010, 18, 357–365. [Google Scholar] [CrossRef]
  5. Kirkpatrick, S. The Economic Value of Natural and Built Coastal Assets: Part 2: Built Coastal Assets; National Climate Change Adaptation Research Facility: Southport, Australia, 2012. [Google Scholar]
  6. Costanza, R.; Costanza, R.; Pérez-Maqueo, O.; Martinez, M.L.; Sutton, P.; Anderson, S.J.; Mulder, K. The value of coastal wetlands for hurricane protection. AMBIO A J. Hum. Environ. 2008, 37, 241–248. [Google Scholar] [CrossRef]
  7. Ehrenfeld, J.G. Evaluating wetlands within an urban context. Ecol. Eng. 2000, 15, 253–265. [Google Scholar] [CrossRef]
  8. Morris, J.T.; Sundareshwar, V.; Nietch, C.T.; Kjerfve, B.; Cahoon, D.R. Responses of coastal wetlands to rising sea level. Ecology 2002, 83, 2869–2877. [Google Scholar] [CrossRef]
  9. Lee, S.Y.; Dunn, R.J.K.; Young, R.A.; Connolly, R.M.; Dale, P.E.R.; Dehayr, R.; Lemckert, C.J.; McKinnon, S.; Powell, B.; Teasdale, P.R.; et al. Impact of urbanization on coastal wetland structure and function. Austral Ecol. 2006, 31, 149–163. [Google Scholar] [CrossRef]
  10. Ozesmi, S.L.; Bauer, M.E. Satellite remote sensing of wetlands. Wetl. Ecol. Manag. 2002, 10, 381–402. [Google Scholar] [CrossRef]
  11. Cho, H.Y.; Lakshumanan, C.; Usha, N. Coastal wetland and shoreline change mapping of Pichavaram, south east coast of India using satellite data. In Proceedings of the Geospatial Application Papers, Map Asia Conference, Beijing, China, 26–29 August 2004. [Google Scholar]
  12. Haack, B. Monitoring wetland changes with remote sensing: An East African example. Environ. Manag. 1996, 20, 411–419. [Google Scholar] [CrossRef]
  13. Roshier, D.A.; Rumbachs, R.M. Broad-scale mapping of temporary wetlands in arid Australia. J. Arid Environ. 2004, 56, 249–263. [Google Scholar] [CrossRef]
  14. Murray, E.J.; Haese, R.R.; Smith, C.S.; Heggie, D.T. Nutrient Cycling in St Georges Basin, South Coast NSW: Report on Field Survey; Geoscience Australia, Department of Industry, Tourism & Resources: Canberra, Australia, 2005; Volume 22.
  15. Hopley, C.A. The Holocene and Beyond: Evolution of Wandandian Creek Delta, St Georges Basin, New South Wales. BSc Honours Thesis, University of Wollongong, Wollongong, Australia, November 2004. [Google Scholar]
  16. Hopley, C.; Jones, B.G. Holocene stratigraphic and morphological evolution of the Wandandian Creek delta, St Georges Basin, New South Wales. Aust. J. Earth Sci. 2006, 53, 991–1000. [Google Scholar] [CrossRef]
  17. St Georges Basin Estuary Management Plan; Shoalhaven City Council: Nowra, Australia, 1998.
  18. ALUM. Australian Land Use and Management, Classification Version 7 (Geo-Datasets); Geoscience Australia: Canberra, Australia, 2010.
  19. Roy, P.; Williams, R.J.; Jones, A.R.; Yassini, I.; Gibbs, P.J.; Coates, B.; West, R.J.; Scanes, P.R.; Hudson, J.P.; Nichol, S. Structure and function of south-east Australian estuaries. Estuar. Coast. Shelf Sci. 2001, 53, 351–384. [Google Scholar] [CrossRef]
  20. Windley, B. Comparative tectonics of the western Grenville and the western Himalaya. Geol. Assoc. Can. Spec. Pap. 1986, 31, 341–348. [Google Scholar]
  21. Australian Bureau of Statistics. Available online: http://www.abs.gov.au/ (accessed on 17 November 2017).
  22. Al-Nasrawi, A.K.; Jones, B.G.; Alyazichi, Y.M.; Hamylton, S.M.; Jameel, M.T.; Hammadi, A.F.; Cahoon, D.R. Civil-GIS incorporated approach for water resource management in a developed catchment for urban-geomorphic sustainability: Tallowa Dam, southeastern Australia. Int. Soil Water Conserv. Res. 2016, 4, 304–313. [Google Scholar] [CrossRef]
  23. Bureau of Meteorology. Climate Classification of Australia 2017. Available online: http://www.bom.gov.au/climate/ (accessed on 17 November 2017).
  24. Mkpenie, V.N.; Ebong, G.; Abasiekong, B. Studies on the effect of temperature on the sedimentation of insoluble metal carbonates. J. Appl. Sci. Environ. Manag. 2007, 11, 67–69. [Google Scholar]
  25. Bradshaw, B.E. St Georges Basin: Morphology and Late Quaternary Deposits. BSc Honours Thesis, University of Sydney, Sydney, Australia, November 1987. [Google Scholar]
  26. Stage 1—Estuarine Processes St Georges Basin Management Study; Webb McKeown & Associates: Sydney, Austrialia, 1993.
  27. St Georges Basin Flood Study; Webb McKeown & Associates: Nowra, Australia, 2001.
  28. Bureau of Meterology. NSW Weather 2017. Available online: http://www.bom.gov.au (accessed on 17 November 2017).
  29. Hughes, L. Climate change and Australia: Trends, projections and impacts. Austral Ecol. 2003, 28, 423–443. [Google Scholar] [CrossRef]
  30. Chakravarty, S.; Banerjee, M.; Chandel, S. Spectral-spatial classification of hyperspectral imagery using support vector and fuzzy-MRF. In Proceedings of the International Conference on Intelligent, Secure, and Dependable Systems in Distributed and Cloud Environments, Vancouver, BC, Canada, 25–27 October 2017; pp. 151–161. [Google Scholar]
  31. Bureau of Meterology-NSW. Tide Gauge Metadata and Observed Monthly Sea Levels and Statistics. Available online: http://www.bom.gov.au/oceanography/projects/ntc/monthly/ (accessed on 17 November 2017).
  32. Hofmann, P. Defuzzification strategies for fuzzy classifications of remote sensing data. Remote Sens. 2016, 8, 467. [Google Scholar] [CrossRef]
  33. Foody, G.M.; Cox, D.P. Sub-pixel land cover composition estimation using a linear mixture model and fuzzy membership functions. Int. J. Remote Sen. 1994, 15, 619–631. [Google Scholar] [CrossRef]
  34. Thieler, E.R.; Himmelstoss, E.A.; Zichichi, J.L.; Ergul, A. The Digital Shoreline Analysis System (DSAS) Version 4.0-an ArcGIS Extension for Calculating Shoreline Change; US Geological Survey: Reston, VA, USA, August 2009.
  35. Thi, V.T.; Nguyen, H.P.; Xuan, A.T.T.; Dahdouh-Guebas, F.; Koedam, N. Application of remote sensing and GIS for detection of long-term mangrove shoreline changes in Mui Ca Mau, Vietnam. Biogeosciences 2014, 11, 3781–3795. [Google Scholar] [CrossRef]
  36. Carter, R.W.G.; Woodroffe, C.D. Coastal Evolution: Late Quaternary Shoreline Morphodynamics; Cambridge University Press: Cambridge, UK, 1997. [Google Scholar]
  37. Coleman, J.M.; Wright, L. Modern river deltas: Variability of processes and sand bodies. In Deltas, Models for Exploration; Broussard, M.L., Ed.; Houston Geological Society: Houston, TX, USA, 1975; pp. 99–149. [Google Scholar]
  38. Bhattacharya, J.P.; Walker, R.G.; Deltas, R.G. Facies Models: Response to Sea Level Change; Geological Association of Canada: Toronto, Japan, 1992. [Google Scholar]
  39. Haslett, S. Coastal Systems, 2nd ed.; Routledge: London, UK, 2008. [Google Scholar]
  40. LPI. Mapping and Imagery-Access from LPI Web Services, Land and Property Information 2017. Available online: http://www.lpi.nsw.gov.au (accessed on 17 November 2017).
  41. Sloss, C.R.; Murray-Wallace, C.V.; Jones, B.G. Holocene sea-level change on the southeast coast of Australia: A review. Holocene 2007, 17, 999–1014. [Google Scholar] [CrossRef]
  42. Kench, P.S. Geomorphology of Australian estuaries: Review and prospect. Aust. J. Ecol. 1999, 24, 367–380. [Google Scholar] [CrossRef]
  43. Hopley, C.A.; Jones, B.G.; Puotinen, M.L. Assessing the recent (1834–2002) morphological evolution of a rapidly prograding delta within a GIS framework: Macquarie Rivulet delta, Lake Illawarra, New South Wales. Aust. J. Earth Sci. 2007, 54, 1047–1056. [Google Scholar] [CrossRef]
  44. Haslett, S.K.; Davies, P.; Curr, R.H. Geomorphologic and palaeoenvironmental development of Holocene perched coastal dune systems in Brittany, France. Geogr. Ann. Ser. A Phys. Geogr. 2000, 82, 79–88. [Google Scholar] [CrossRef]
Figure 1. The study site, of the coastal deltaic section of Wandandian Creek, southeast NSW, Australia, illustrating; (a) location of New South Wales (NSW) in eastern Australia, (b) the study site located on the mid-southern NSW coast, (c) the regional setting showing the St. Georges Basin and the catchment area of Wandandian Creek, and (d) illustrates the deltaic border, elevation and the sampling locations (WD1 to WD18).
Jmse 05 00055 g001
Figure 2. Landcover elevation and patterns within Wandandian Creek catchment area, showing; (a) the elevation of the catchment illustrating the terrain and high sloped watershed (using Australian height vertical datum at 1.024 m MSL), the 1-metre digital elevation model (DEM) is derived from C3 LiDAR (Light Detection and Ranging) obtained by LPI on 19 September 2016 [23]. (b) Land use classes and areas (km2). Source after [15,17,18,23].
Jmse 05 00055 g002
Figure 3. Monthly data for temperature and precipitation for Wandandian area during this study period show that the highest seasonal temperature occurs during the south hemisphere summer, particularly in January and February. At the same time, February and March are the wettest months in the records [15,24,30].
Jmse 05 00055 g003
Figure 4. Climate trends for Wandandian Creek estuary; (a) the total monthly precipitation, (b) annual flow discharge in Wandandian Creek, (c) mean annual air temperature, and (d) monthly mean sea level at Port Kembla (1957 to 2016; red is the maximum, green is the mean, and blue is the minimum). Sources [24,30].
Jmse 05 00055 g004
Figure 5. Methodology, data collection and analysis sequences.
Jmse 05 00055 g005
Figure 6. Multi-temporal high resolution aerial photograph classifications for 1949, 1961, 1972, 1993, 2002 and 2016 show progressive changes of Wandandian deltaic landform classes and shorelines. The clearest changes have occurred on the levee and backswamp facies where increasing native and mixed vegetation canopy indicates progressive eco-geomorphic stability. Prograded sand and silt bars have grown since 1949 and added more geomorphic accommodation habitat, thus allowing ecological development to continue.
Jmse 05 00055 g006
Figure 7. Vegetation canopy acting positively to assist the geomorphic growth and to develop the deltaic ecosystem; (a) Casuarina has vegetated the outer edge of the subaerial portion of the mouth bar whereas the depressed swampy portion in the centre of the bar is dominated by Juncus. (b) Casuarina and Juncus stabilising and expediting vertical accretion of the subaerial portions of the Wandandian Creek delta (levees and mouth bars; after [15]).
Jmse 05 00055 g007
Figure 8. Wandandian deltaic growth, illustrating the overall growth of the delta itself and its levees/shorelines (blue), as well as the total growth of sensitive subaqueous areas (red).
Jmse 05 00055 g008
Figure 9. Subaqueous and subaerially exposed levees associated with the western distributary channel of the Wandandian Creek delta. Source: LPI, 50 cm Jervis Bay and Ulladulla surveys of January 2014.
Jmse 05 00055 g009
Figure 10. Digital shoreline analysis system (DSAS) applied to the sensitive Wandandian Delta shows shoreline erosion in red, accretion in green while yellow represents the stable zones. Attached charts show the net shoreline movement envelope between 1949 and 2016: (a) the upper channel; (b) western portion of the delta; (c) the mid delta; (d) large interdistributary island; (e) small mouthbar island; and (f) eastern portion of the delta.
Jmse 05 00055 g010
Figure 11. Cross-sections showing the distribution of prograded sand and organic-rich silty sequences in the Wandandian deltaic facies, which provide suitable bases for eco-geomorphic growth. (a) Progradation of the western distributary into the embayment in St Georges Basin along vibracores: WD8 (west), WD7, WD9, WD6 and WD16 (east). (b) Eastern distributary through drill-holes WD15 (southwest), WD14 and WD13 (northeast). Its eastern extent is controlled by an outcropping to shallow subsurface basement high (after [15,16]).
Jmse 05 00055 g011
Figure 12. Soil and sediment samples from the Wandandian deltaic landform, illustrating: (a) mineral contents in each sediment sample and represented facies, with a clear dominance of quartz, (b) the overall mineral proportions in the sediment samples. (The background is from a Jervis Bay 50 cm Orthorectified Image obtained from LPI for January 2014 [30]).
Jmse 05 00055 g012
Figure 13. Average (n = 3) organic matter (benthic nutrient), TCO2, O2, NH4+, and SiO44− in Wandandian delta. Note that NH4+, SiO44−, and TCO2 were fluxing out of the sediment, whereas O2 was fluxing into the sediment. TCO2 was determined by alkalinity and conductivity titrations for this study site (after [14]).
Jmse 05 00055 g013
Figure 14. Water sample analyses show spatial changes in; conductivity, salinity, dissolved oxygen and turbidity, (sample locations have presented on Figure 1).
Jmse 05 00055 g014
Table 1. Area analyses of the Wandandian Delta for the overall delta growth, subaqueous area, total sensitive area, and average deltaic progradation *.
Aerial PhotographSubaerial Area (km2)Subaqueous Area (km2)Total Sensitive Area (km2)Total Growth (m2)Growth/Year (m2/year)
19491.71120.16791.8791--
19611.71250.231.942563,4005283
19721.71340.32322.036694,1008554
19931.72980.33192.061725,1001195
20021.73560.3642.099637,9004211
20161.740330.381632.1219622,3601597
Changes (m2)29,130213,730242,860242,8604168
* Sources: Figure 6 and the calculate geometry tool of the data management package in ArcGIS, (after [15,33]).
Table 2. X-ray diffraction analyses of sediment samples from the Wandandian Delta showing mineral proportions (after [15]).
FaciesQuartz %Albite %Illite-Muscovite %Mixed Layer Illite-Smectite %Kaolinite %Calcite %Pyrite %
Prograded Sand85.74.38.80.30.80.10
86.62.50.57.92.400.1
92.10.23.24.20.300
Palaeoswamp51.10.227.014.41.605.7
59.11.426.54.22.706.1
Delta sandy Silt86.10.79.72.80.600.1
78.50.47.310.82.900.1
Prodelta/Lagoonal Mud51.50.131.66.23.90.26.5
56.30.128.83.85.20.15.7
58.31.323.37.83.106.2
Channel Fill Fluvial Sand87.200.69.32.900
84.72.46.43.62.900
Table 3. Profile depth and analysis of water temperature, salinity, dissolved oxygen (DO), conductivity and turbidity.
Sample No.Depth (m)Temperature (°C)Salinity (±0.05 ‰)DO (%)Conductivity (±0.05 mS/cm)Turbidity (NTUs)
WD8−0.619.828.889.414.520.54
WD9−1.121.229.182.616.819.1
WD17−1.521.130.380.917.1219.1
WD16−2.421.329.679.818.919.1
WD11−1.9621.430.779.5520.421.9
Average1.521.029.782.517.519.9

