A Marine Information System for Environmental Monitoring: ARGO-MIS


1
Institute of Information Science and Technologies—National Research Council, Via Moruzzi, 1-56124 Pisa, Italy
2
EdgeLab s.r.l., Via degli Altiforni, 3-57037 Portoferraio, Isle of Elba (LI), Italy
*
Author to whom correspondence should be addressed.
J. Mar. Sci. Eng. 2018, 6(1), 15; https://doi.org/10.3390/jmse6010015
Submission received: 4 December 2017
/
Revised: 12 January 2018
/
Accepted: 29 January 2018
/
Published: 5 February 2018
(This article belongs to the Special Issue Maritime Environment Monitoring)
Abstract
:Sea shipping routes have become very crowded and this, coupled with an always increasing demand of oil based products, contributes to the increase in maritime traffic density, as a consequence pollution risks have increased. Therefore, it is important to have information systems capable of detecting and monitoring environmental endangering situations like oil spills at sea. In this paper, a Marine Information System, acting as an integrated and inter-operable monitoring tool is proposed and discussed. The discussion focuses on a system that is able to integrate different data acquired from various electronic sensors, and that is inter-operable among marine operators and ship traffic authorities. The available data on the system are all geo-referenced, and flows seamlessly through the system, where they are integrated in a consistent and usable manner. An important result of this integration is the capability to produce a collection of proactive services such as Decision Support ones, which can be used to improve the functionalities and facilities concerned in an intervention operation. Through the implementation of these services, we aim to demonstrate how an efficient environmental management system could benefit from being supported by a Marine Information System that can provide the dynamic links between different data, models and actors.
1. Introduction
Decision-making plays a vital and challenging role in environmental management, due to the degree of uncertainty that characterizes this task and the need to perform a trade-off between several, often conflicting, objectives (e.g., higher social costs vs. long-term environmental benefits). Environmental processes are, indeed, not easy to model due to their multi-variable and dynamic nature and the knowledge about them is still incomplete and uncertain (e.g., policy choices, social processes, economic and technical issues) [1]. Due to these factors, it is very important that every bit of knowledge about the processes, possibilities of improvement, and innovation is effectively made available and distributed among all actors involved in the process of environmental management. In this respect, the integration of knowledge derived from different and heterogeneous fields is the main and most critical point.
With respect to sea environment pollution, oil spills seriously affect marine ecosystems and cause political and scientific concerns since they have serious effects on fragile marine and coastal ecosystem [2]. Moreover, the amount of pollutant discharges and associated effects on the marine environment are important parameters in evaluating sea water quality. Consequently, there is an increased interest on both maritime safety and environmental protection. In this context, the focus on integration frameworks, intended as models for integrating different system processes into a unified framework, have grown considerably [3,4]. In the development of a conceptual framework for environmental monitoring, the types of available data are usually either quantitative (such as all measurable data acquired) or qualitative (such as prediction based on surveys or less specific reports), these two typologies should be considered and integrated in the system. Most of the studies and methods were developed following major accidents, like the Exxon Valdez [5], the Prestige [6], and the DeepWater Horizon [7]; however, the most part of the studies are related to major damages and large oil spills. In general, most parts of the studies are not really proposing an integration of heterogeneous and multi-source data acquired singularly, and we found this to be particularly true for smaller oil spills that can be caused by minor accidents or operational discharges. These kinds of polluting events did not receive the attention they deserve, especially taking into account their importance in the routine work of local authorities, and especially when they occur in proximity of protected areas of great environmental value [8]. For these areas, which are more precious and receive greater attention, the classical remote sensing approach [9] could be put side by side, and thus enriched, with information retrieved from static and mobile sensors placed in situ, and consequently making use of Information and Communications Technology methods for data correlation and fusion [10,11].
Our proposal is an inter-operable framework based on the integration of various electronic sensors with advanced sensing capabilities, which could be used in medium-scale scenarios by local authorities and stakeholders in the context of the intervention chain of oil spill remediation operations. The proposed Marine Information System (MIS) is intended as a scalable, and modular framework integrating several heterogeneous data and enhanced with a set of environmental management services. The collection of heterogeneous data is among the intriguing capabilities of an MIS: data from different sensor families (SAR, hyperspectral sensor, thermal sensors, electronic noses, acoustic hydrophones, chemical sensors, etc.) acquired from satellites, aircraft, vessels, in situ anchored buoys, manned and unmanned vehicles can be collected from test areas, and sent by different communication links to the MIS, which can use these data through its components in order to bring a decision support and to be proactive in determining when there can be some autonomous activities that could be performed for the purpose increasing the knowledge about a possible oil spillage.
Furthermore, by means of an integrated Decision Support System (DSS), the MIS provide an enhancement to the end users in the following aspects: (a) an automatic and real-time screening of the overall environmental situation, (b) a quantitative representation of the risk factors and (c) a proactive notification of events needing supervision [12]. The fundamental model, used also as a graphic interface for the MIS, is based on dynamic risk maps that aggregate the available heterogeneous data acquired from electronic sensors and other sources [13]. These risk maps, beyond giving an effective and quick outlook of the situation in the monitored area, allow through an automatic analysis, based on the developed proactive services, the delivery of notifications and alerts to local authorities in charge of monitoring.
The paper is organized in the following sections: initially, a detailed description of the architecture of the developed MIS, with its components and features is given. Therefore, the following section will be devoted to an in-depth description of various available and current sensors and systems for capturing data for marine and maritime environmental monitoring. Furthermore, the applied methods for performing a real-time assessment of risk based on the heterogeneous sensor data collected into the MIS are introduced. Subsequently, a description is given regarding the proactive services implemented as part of the DSS of the MIS. This section is followed by a description of results obtained following the operational implementation of the MIS and its application in real-case test scenarios. Finally, discussion and conclusions are drawn regarding also the validation of the proposed model.
2. Architectural Design
The MIS aims at an effective and feasible detection and management of marine pollution events, by integrating a number of monitoring resources that are exploited to get useful and relevant information about the controlled sites. Each resource is one of the sensors and/or devices available in a specific scenario, collecting specific types of data that are processed by a dedicated module that can be nominally considered a subsystem of the MIS. The main task of the MIS is, then, to serve as a catalyst for integrating data, information and knowledge from various sources by means of adequate Information Technology tools. More precisely, the MIS has been conceived as a connected group of subsystems for performing data storage, data mining and analysis over data warehouses, decision-support, as well as a web-GIS portal for the access and usage of products and services released to the users of the system.
2.1. MIS Architecture
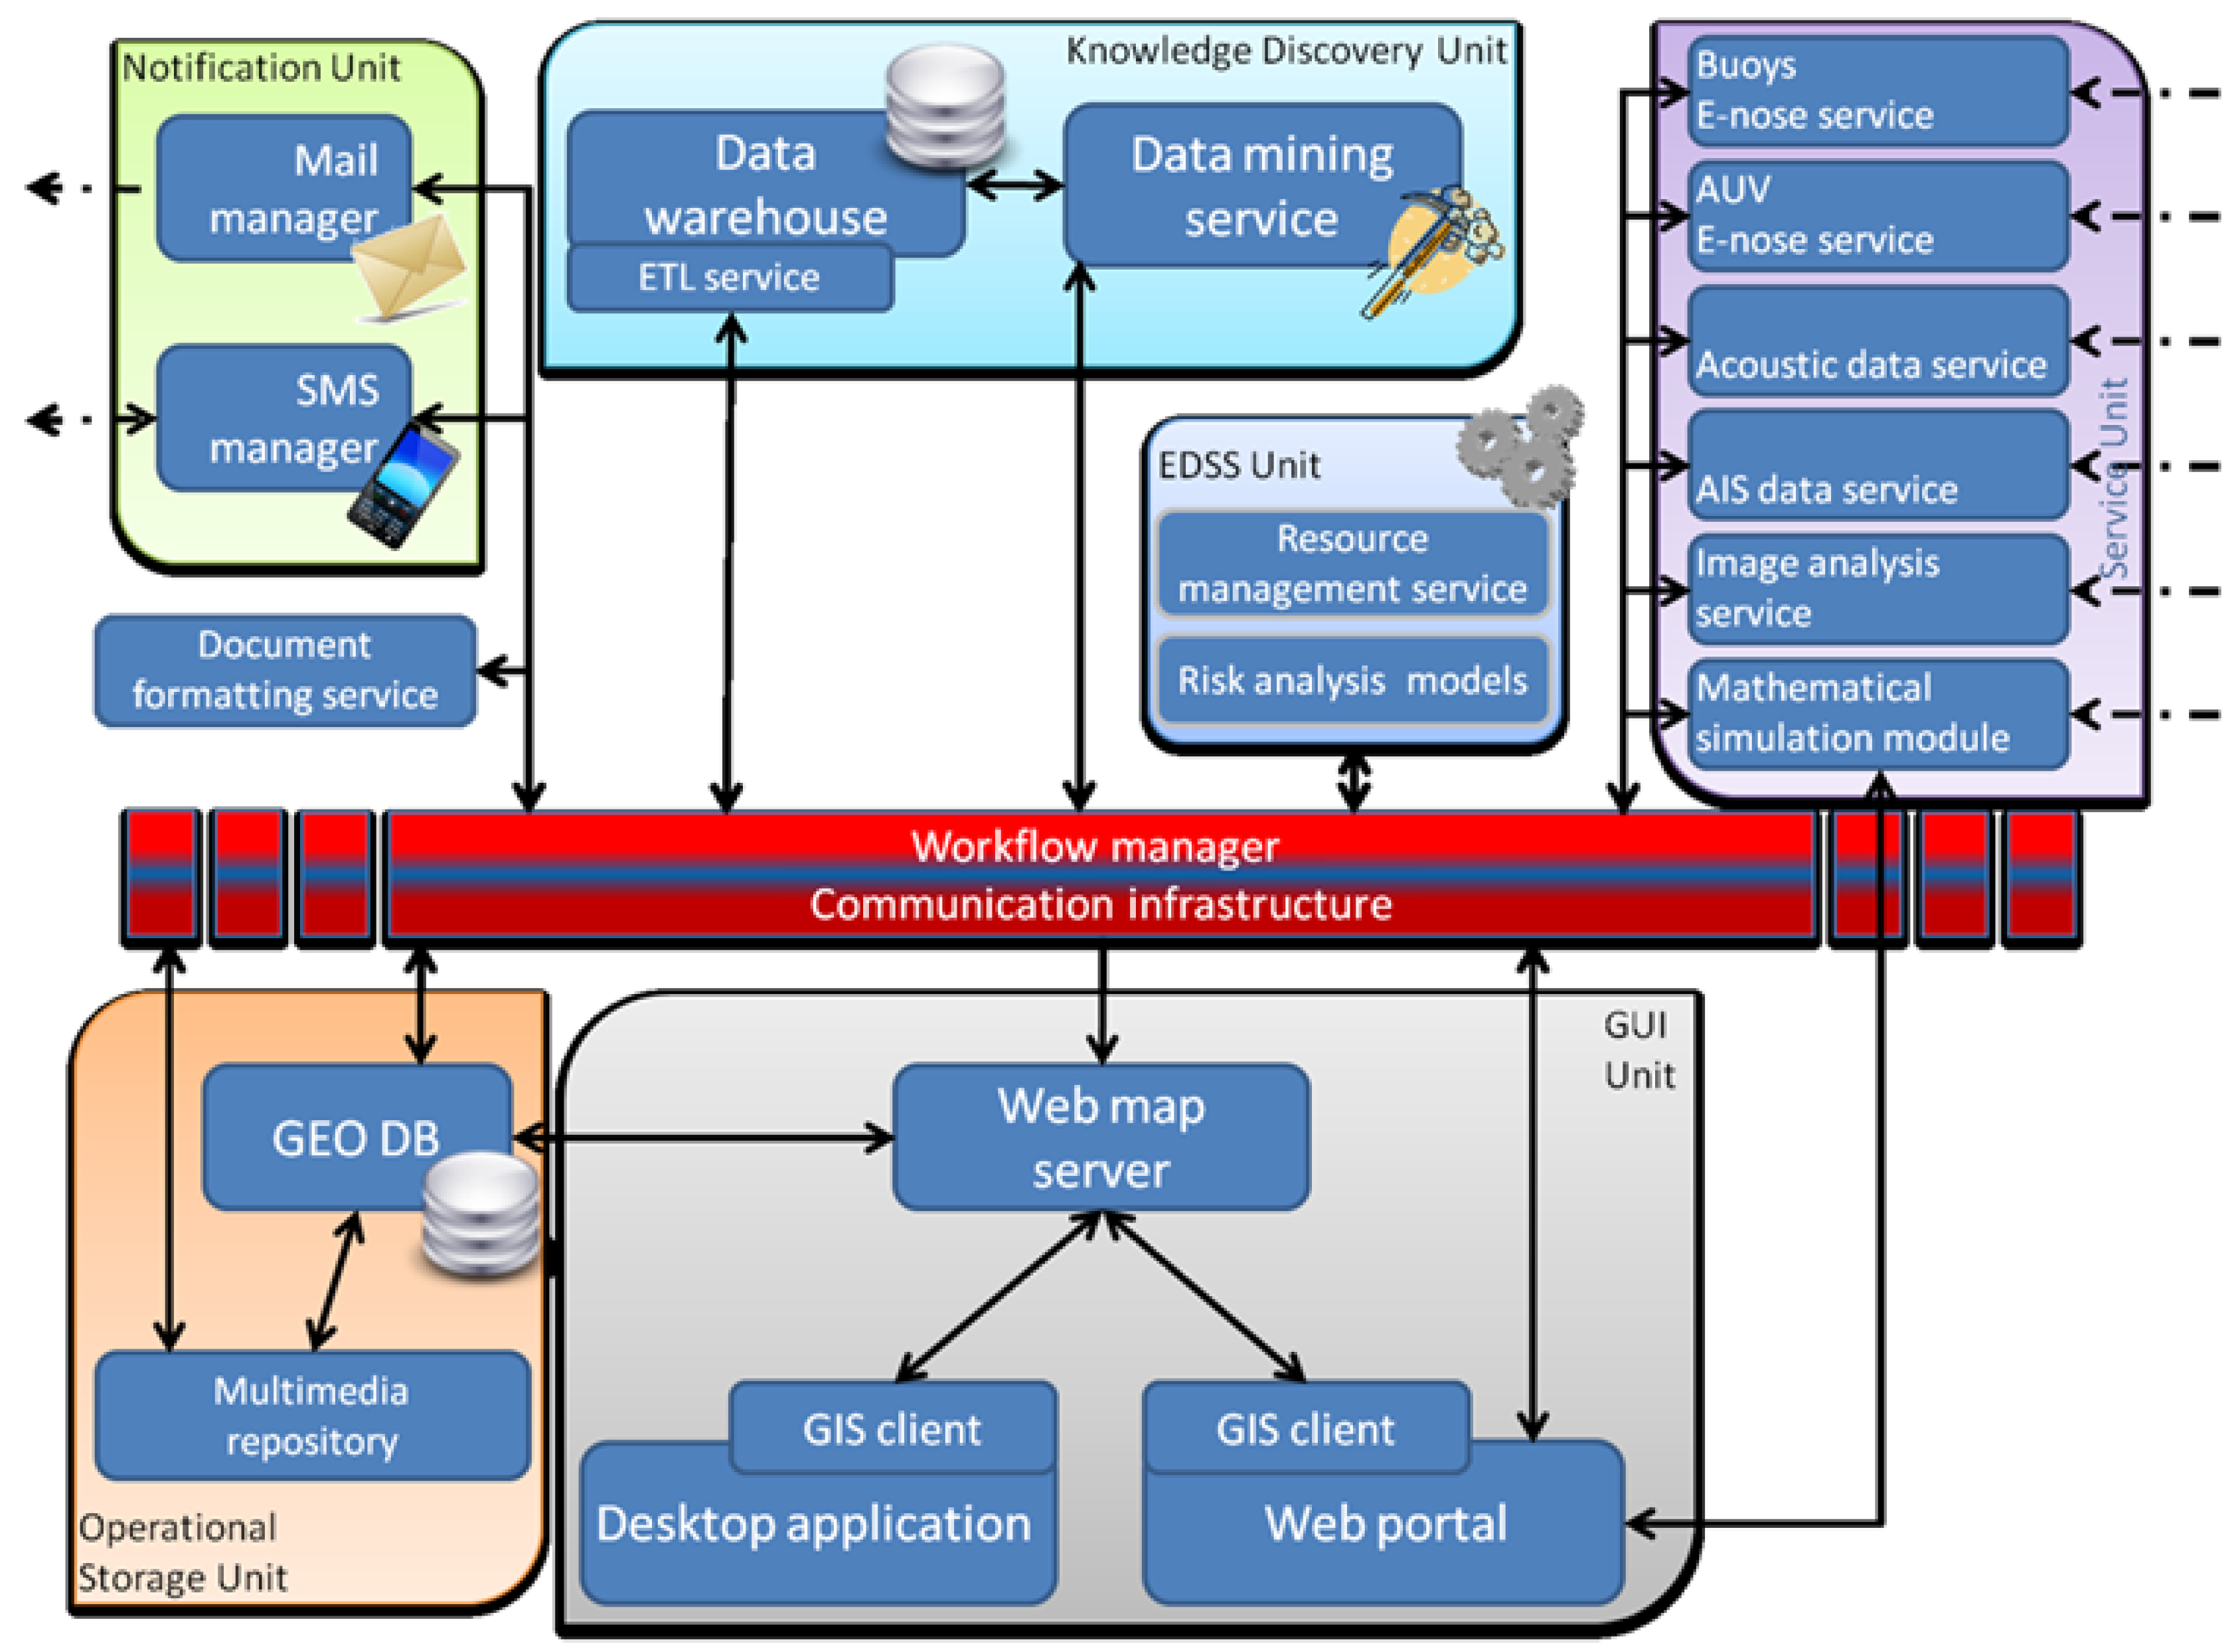
The architecture is generally conceived as a modular and flexible system, where the addition or modification of single modules does not affect the global functionality and does not require a complete structural redesign. A detailed MIS architectural design is shown in Figure 1, where the composing units and their components are identified, along with the communication paths that exist and are needed for the MIS to work.
The six identified units are:
- Service Unit,
- Operational Storage Unit,
- Knowledge Discovery Unit,
- Notification Unit,
- Graphical User Interface Unit,
- Environmental Decision Support System Unit.
The two-sided component composed of a Workflow manager and a Communication infrastructure can be identified as the middleware of the system. The first part, the Workflow manager, orchestrates business processes in the MIS. An internal business logic engine is included for managing complex sequences of process executions and for coping with branching in the case of connection failures. The Workflow manager incorporates a scheduler of the event driven stream of information/requests. The Communication infrastructure covers the connectivity logic part of the MIS and manages the message based communications between the single units and services, routing and transforming the needed data and requests.
The Workflow manager is also in charge of acting as a logging facility, by keeping traces about the platform workflow and saving the performed operations into a log.
2.2. Service Unit
The Service Unit consists of a collection of interfaces for accessing external data sources and for collecting and integrating the acquired data. The Service Unit is introduced to decouple the heterogeneity of the information considered within the MIS by providing a set of modular and highly specialized services, according to the interoperability and portability philosophy underlying the MIS design. Indeed, each service is in charge of managing the specificity of the addressed data type and communication standard and of transforming the incoming data in an interoperable format for their deployment in the MIS.
In particular, each module provides a connector, which either waits for incoming requests (e.g., by means of a web service or more generally by listening on some ports) or performs queries to an external data source according to its proper communication protocol. The identified services in Figure 1 are identified with sample sensors acquiring data and sending them to the MIS platform. A particular interface is the one devoted to the acquisition of mathematical simulation of the oil-spillage spread. In principle, this could be based on the results obtained in [14], or, if coupled with an interface for meteorological and sea surface (currents, waves...), data could be computed as part of a dedicated internal mathematical simulation module.
2.3. Operational Storage Unit
The Operational Storage Unit aims at storing and providing all the data needed by the MIS in order to identify and detect an oil spill, and managing the administration and user information. It is composed of a GIS-based database and a multimedia repository. In order to quickly satisfy the MIS requests, the unit maintains the information for few days by exploiting a scheduled procedure that checks the stored data, and deletes the least recent ones.
2.4. Knowledge Discovery Unit
The Knowledge Discovery Unit is devoted to managing the procedures related to the analysis of all the information collected and produced by the platform with the ultimate goal of gaining more insight (i.e., knowledge) in the monitored processes. With the aim of designing a pluggable architecture, the Knowledge Discovery Unit has been separated and endowed with an internal data storage unit, i.e., the data warehouse. In this way, the Knowledge Discovery Unit is not dependent from the actual implementation of other units and may be easily reconfigured in case of changes in other units or even in case of inclusion of additional units not foreseen in advance. Three components of the Knowledge discovery Unit have been identified, namely the Extract, Transform and Load (ETL) service, the Data warehouse and the Data mining service [15]. In brief, the ETL service is a component providing extract, transform and load functionalities to the Data Mining Unit. Indeed, this component is in charge of retrieving, aggregating and filtering data from heterogeneous sources and finally saving the data in the data warehouse. The data warehouse is a database optimized for Online Analytical Processing (OLAP) procedures, and it will contain the bulk of data, possibly organized in multidimensional cubes, on which data mining algorithms may work both for discovering new patterns and for extracting significant statistical parameters. Finally, the data mining service provides a library of methods and algorithms for data mining as well as suitable interfaces for accessing data in the warehouse and presenting results to the users.
2.5. Notification Unit
The Notification Unit is in charge of packing, queuing and dispatching notification to the users and to possibly external personnel, including oil spill authorities, in accordance with the specific requirements that should have been defined in advance. In Figure 1, two notification methods have been considered, as actually implemented in the test case scenarios, namely email and text messages, though other types may be added in the future.
2.6. GUI Unit
The GUI Unit is not to be intended as a graphical interface to a Geographic Information System (GIS) (see [16] for example), but it is an integrated access point to the MIS through its components. The unit provides a set of functionalities proper to Web-GIS systems and the operations to interact with the components external to the MIS; the unit is composed by a Web map server, a Desktop GIS client and a Web portal with a Web-GIS client integrated.
The Web map server is the layer through which the user interfaces can interact with the operative data stored into GIS-based Database. Indeed, in order to lighten the workflow manager and to increase the data transfer rate, the connection between the Web map server and the Operational Storage Unit is obtained through their dedicated communication structure. It publishes data from Database using open standards and offers a set of Web-services exploited by the User interfaces for data display and editing. The Web map server has an input connection with the middleware through which geo-tagged data stored into the data warehouse will be displayed. The connection is one way because the data requests are performed exploiting the Web Portal.
2.7. Environmental Decision Support System
The Environmental Decision Support System (EDSS) is the component that constitutes the MIS intelligence and that is in charge for the detection and monitoring of oil pollutions. EDSS analyzes and combines the heterogeneous multi-source data acquired from several different sensors sources and from the different processing subsystems within the MIS itself [13]. In order to properly detect and monitor oil slicks, issue alarms and support their management, advanced risk analysis models have been developed and applied for characterizing and monitoring the observed sites. In particular, a dynamic risk map is defined for assessing the hazard of oil slicks by evaluating several risk factors through the combination of the data collected by the MIS. This map is used for planning a prioritization of the available monitoring resources in order to improve the degree of monitoring and control of specific high-risk areas. This activity is performed autonomously in a proactive way by the MIS, so to improve the knowledge and degree of information about the monitored area. In more detail, as an example, the EDSS could ask a monitoring resource to perform a specific available analysis, or to repeat it with a different frequency, or to ask for a more detailed local monitoring with available resources such as Autonomous Underwater Vehicles, or floating buoys. The design of the EDSS required understanding of the likeliness of a pollution event is determined by the risk analysis or reported by the processing results of one of the other MIS subsystems, the EDSS is in charge of drawing an optimized plan of exploitation of the monitoring resources and of the data analysis models so as to confirm the detection of the event and issue an alarm.
According to the above description, the EDSS has been organized into a three-level structure: firstly, (1) data are gathered through the Service Unit and stored into the Operational Storage Unit. Planning of their collection and retrieval is performed through requests that are orchestrated by the middleware. Then, (2), an analysis and prediction is realized through the risk assessment models applied to the collected data, while (3) decisions are supported by defining an optimized exploitation plan of the monitoring resources available in order to confirm the detection of the event and issue an alarm. Thus, finally suggestions are supplied in order to support feasible event management and recovery interventions.
3. Sensors
These above-mentioned monitoring resources are none other than the various and diverse typologies of sensors, which may or may not be available in a specific scenario. A variety of data from a variety of sensors and platforms (e.g., satellite and airborne remote sensors, chemical/physical sensors, electronic noses on vessels, landers, drifters and and buoys, etc.) can be used to derive information on water quality and spread of hydrocarbons/oil slicks over large areas [17,18,19]. Additionally, external data such as weather station data, weather operational models and large scale hydrodynamic and wave models can be gathered from the external providers.
3.1. Space-Borne SAR Imaging and Analysis
Synthetic Aperture Radar (SAR) systems are extensively used for the identification of oil spills in the marine environment. SAR systems detect spills on the sea surface indirectly, through the modification spills cause on the wind generated short gravity—capillary waves [20]. Oil film damps such waves, which are the primary backscatter agents of the radar signals. Consequently, provided that a moderate wind field is present, an oil spill appears dark on SAR imagery in contrast to the surrounding clean sea [21]. The whole Mediterranean Sea has been granted the status of “special area” in accordance to the International Convention for the Prevention of Pollution from Ships (MARPOL 73/78) [22]. In such areas, ship oil discharges are prohibited almost totally.
Satellite SAR imagery is not only capable of oil spill detection, but also to detect ships in areas of interest. In the case of oil spill event detection, SAR images can reveal ships presence, potentially linked to the spill, triggering interventions of local inspection. Furthermore, the pollution distribution and risk is closely tied to the geographical distribution of the shipping density. Satellite SAR can reveal these patterns, giving information about shipping density as a function of ship size and season, when adequate data is collected over a certain region during sufficient time. At present, European countries have installed shore-based AIS (Automatic Identification System), giving a very complete picture of the shipping density, even though only referred to AIS-carrying vessels [23]. Satellite SAR can further complete this picture by adding information on shipping activities by smaller vessels (<300 GT) without any distance limitations from shore.
3.2. Ground Based Monitoring Technology (GBMT)
It is well understood that a key driver to minimizing oil spill damage in the marine environment is early detection and continuous monitoring of the spill during clean-up. Microwave radar, based on marine X-band radar has been proven effective in monitoring waves and currents, as well as the detection of oil on water. These radars can be installed on clean up vessels, along sensitive coastal areas or on board any type of platform. The footprint of these radars is a circle with a radius of about 3.5 km. Wind waves create ripples on the sea surface, which are detected by standard navigational radars, known as sea clutter. Underlying ocean waves modulate this sea clutter, which allows the determination of surface waves and currents. The detection of oil is accomplished by distinguishing a reduced signal return where the wind-generated capillary waves on the ocean’s surface (i.e., the sea clutter) are suppressed due to the presence of oil and other pollutants that change the sea surface roughness. Wave and current measuring system can be combined with oil spill software detection systems, thus meeting the Norwegian Clean Seas Association for Operating Companies (NOFO) compliance standard for oil spill detection requirement [24]. Both technologies (wave/current monitoring and oil spill software detection) are typically based on the same radar and data capturing unit. Their integration at MIS level operationally allows not only the identification of potential oil on water slicks, but also their tracking on the basis of local wind, wave and current situation. This capability is being proved much helpful during any clean up scenario across a wide range of sea and weather conditions, including poor visibility scenarios. During vessel clean-up operations requiring slick delineation, the ability to detect oil slicks while moving provides significant benefit. The addition of on site measured wave and current data can speed up the process to identify the movement of the slick on a small scale.
Sensitivity studies are carried out based on simulated data, defining the operational limits of nautical X-Band radar within that context [25]. Nautical X-band radar data is seen as complementary to satellite data. While satellite data covers larger areas on a course temporal grid, nautical radar covers small areas with high temporal resolution. Especially offshore leakages could be picked up easily and their size and drift direction could be monitored at all times, thus combining into the MIS two existing environmental data gathering systems with additional satellite information.
3.3. Hyperspectral Imaging and Analysis
Hyperspectral imaging is one of the latest tools in the hands of remote sensing scientists. Hyperspectral sensors were developed in order to deal with fundamental limitations of multispectral imaging, such as acquiring data in few broad (100–200 nm in width) and irregularly spaced spectral bands [26]. Using hyperspectral images, detailed spectral signatures can be extracted for the imaged objects/appearances. Research on oil spectroscopy, conducted in laboratory conditions, has shown that based on spectral signatures, information about oil spill type and thickness can be derived [27] and quantified through best-fit functions and relationships [28].
Airborne remote sensing techniques have already become a standard tool for routine maritime pollution surveillance mainly concentrating on the detection of oil spills. Airborne oil spill remote sensing is usually performed using multi-sensor systems. Today’s sensor suites for the detection of oil spills at least include a side-looking airborne radar (SLAR) for the far-range detection, and an infrared/ultraviolet (IR/UV) imaging system, such as an IR/UV line scanner, for the near-range analysis of oil spills. Furthermore, there are advanced sensors such as laser fluorosensors (LFS) or microwave radiometers (MWR) that allow measurements of oil thickness in specific thickness ranges and, with regard to laser fluorosensors, a remote classification of the involved oil. Those aircraft are routinely flown over thousands of hours per year in their respective responsibility area collecting huge amount of multispectral data from the marine environment. Although the application of airborne maritime surveillance platforms has become an international accepted standard in oil spill monitoring and an indispensable part of any modern contingency measures, there is still a substantial gap in knowledge in how to apply those systems with the same quality of information also for the detection of Hazard Noxious Substances (HNS). The main reason for this gap is that, due to the nearly endless number of different HNS that are frequently transported at sea and their different behavior in sea water, the detection of those substances by means of remote sensing techniques is much more complex than oil. One main issue to be solved, in order to make airborne systems also available for the detection of HNS, a systematic catalog of the physiochemical behavior of different types of HNS in seawater together with their optical properties with respect to hyperspectral and fluorescence data has to be assembled [29]. This catalog would form the basis for the development of algorithms for the detection, mapping and quantification of HNS in the seawater where similar to application for oil spills these results should be available in real-time. A spectral library (SL) can be built including oil-spills of various types, thickness and weathering stage, under real biophysical conditions [30,31]. Such an SL significantly contributes not only to a very detailed detection, identification and quantification of oil-spills, but also to advanced monitoring and management of the marine environment.
3.4. Electronic Noses for Hydrocarbons and Oil Spill Detection
Electronic noses were first described in the late 1970s and the early models were demonstrated in the 1980s, particularly at the University of Warwick, UK. They are usually described as being constructed of an array of different chemical sensor devices having broad overlapping selectivity to volatile organic compounds (VOCs), where the sensor outputs are processed by some type of statistical or artificial neural network to give a smell “fingerprint”. The whole system is designed to mimic mammalian olfaction and especially the capabilities of dogs, who can smell VOCs at less than part per billion (ppb) levels. Strictly speaking, traditional electronic nose technology is not analytical in the sense of accurate quantification of analytes, but rather a technique that detects changes or the appearance of a new set of VOCs in complex mixtures of volatile compounds. The approach to be taken is to screen a number of sensor types to detect VOCs associated with oil and fuel and then construct them into a sensitive array.
The sensitivity of the sensors will be one particular area of development for the project and, using doping techniques, these will be tuned to be sensitive to the hydrocarbons associated with oil. Background responses from the seawater surrounding the instrumentation is minimized by the use of hydrophobic semi-conducting polymers and types of metal oxides that operate at higher temperatures. The sampling port itself is typically custom designed to prevent water entrance. A sensor array is typically chosen for several reasons: (i) measurements are rapid—30 s to 1 min being the usual sample profile; (ii) sample is the air above the sea—no interferences by turbidity or particulates; (iii) discrimination between background VOCs and fuel/oil related VOCs is extremely clear, no oil/fuels VOCs should be present so occurrence must indicate an event; (iv) the whole system can run on battery power; (v) systems can be operated and data collected remotely; and (vi) prototype systems for similar applications (fuel and diesel in fresh water) already exist, therefore the probability of success is high and the corresponding risks are low.
E-Nose can be operative in different set-ups; as a buoy hosted sensor, the device will be put on a anchored buoy platform with all the needed interfaces for data transmissions and power supply. The goal is the simulation/test of the capability of this sensors to be remotely operated and to monitor a far area. Additionally, e-Nose deployment can also be actuated by integrating the sensor system into an Autonomous Underwater Vehicle (AUV). In this case, the engineering issues are simply to have an air inlet and exhaust that are completely watertight and which can be flushed and opened when the AUV is brought to the surface. Sampling of the surface air surrounding the AUV will be no different to a buoy mounted device and the treatment, processing and transmission of results will be identical. The data output of the sensor array is unlikely to require complex data processing and simple data logging of sensor responses can suffice to indicate an event. The continuous operation of such sensor arrays have been seen to be stable for many months up to two years, so stability should be a minor issue.
3.5. Underwater Monitoring Technology
Underwater monitoring technologies can be used for two applications: preventive action to detect possible unauthorized access to a sensitive protected area (e.g., a marine park) by adopting passive acoustic monitoring of ship traffic provided by underwater platforms (minimum environmental impact); environmental monitoring and post-accident action to detect and localize oil spillage in a confined area by using autonomous vehicles that can easily provide the ground truth to an alarm generated by analyzing satellite images. Underwater, sound is the most reliable and efficient method for detecting, classifying and track vessels in the sea. Due to the low frequency noise generated by ships, the detection range is much higher compared to standard video technologies and allows for a precise classification/identification of the targets much more difficult with radar technologies otherwise. The NATO Center for Maritime Research and Experimentations (CMRE) has developed a new technology to sample underwater sound with an extremely high signal-to-noise ratio and a large bandwidth. This technology is using the Service Oriented Architecture (SOA) electronic components (FPGA, 24 bits Sigma/delta A/D, 192 kHz IQ sampling rate), allowing the implementation on an embedded system, of dedicated signal processing algorithms to perform detection and classification of the targets, in order to reduce the data transfer rate requirements. This system is combined with a digital tetrahedronal array that allows for recording sounds generated by vessels and thus to estimate the 3D angle of arrival of the acoustic wave [32]. By having multiple underwater platforms connected on the sea-floor by optical fiber cables, it is possible to precisely track the acoustic target in the area of interest. The goal of the system is to use underwater monitoring of vessels, from small pleasure boats to large ships, in a protected area with the purpose of identifying the presence, the typology and to localize the position and the direction of the target. All of the detections are stored on a large database that contains the information of the type of vessel detected and of its position. This database can be used in case of a detection of an oil spill to provide a confirmation of the remote detection (i.e., a ship was present in that position) and in order to identify the source of the spillage (see also cross-correlation in Section 6).
Nowadays, technological developments could support a new methodology to track the emulsified petroleum in the water column during an oil spill. This methodology relies on in situ observations rapidly carried out by coordinated fleets of autonomous robotic platforms, specially designed for real-time observation of the ocean environment, complemented by remote sensing systems. Among these platforms are gliders, AUVs and autonomous surface vehicles (ASVs). Gliders are AUVs designed to observe vast areas of the interior ocean [33]. Gliders make use of their hydrodynamic shape and small fins to induce horizontal motions while controlling their buoyancy. AUVs are submarine robots able to carry out expeditionary campaigns autonomously. Their hydrodynamic shape, electrical propulsion, submarine navigation and positioning allows continuous sampling of environmental conditions. Their present main limitations are related with battery duration and the sophistication of submarine positioning and navigation. ASVs show certain advantage with respect to AUVs. ASVs can benefit from other propulsion systems than electric ones, increasing their autonomy; their navigation and communication systems are simpler than those required in AUV technology; construction costs are very low and the speeds that these platforms can reach are higher than those obtained in AUVs. ASVs can only provide information of ocean surface [34,35].
This technology can provide a further extension of MIS capability to a wide-area littoral network for monitoring purposes. The network is constituted by static nodes (bottom mounted systems), nodes with uncontrolled motion (drifting buoys) and nodes with controlled motion (AUVs and gliders) and complemented by remote sensors (including acoustic, aerial or space based). This creates a demand for allocating and complementing observational resources, to maximize the information content of the collected data. Compatibility between the observing capabilities of the different nodes must be found in the design of optimal sampling strategies. These sampling strategies could adapt to the evolution of the environment, considering the motion capabilities of some of the sensor nodes of the network.
4. Near Real-Time Risk Assessment
In the frame of environmental management processes, mainly done by using some kind of decision support system, four main activities can be identified [1,12]:
- Hazard identification,
- Risk assessment,
- Risk evaluation,
- Intervention decision-making.
In this section, we focus on the second item, once the hazard has been (potentially) identified, and before being able to apply some kind of reasoning in order to perform an evaluation, on the basis of previously learned experiences, a quantitative and qualitative measurements of the hazard should be performed. The main goal of risk assessment, once the risk and its sources have been identified, lies in the evaluation of the likelihood of occurrence balanced with the severity of the consequences [36]. Following this, some intelligent system can be applied in order to obtain a reduced risk and the possible adoption of measures for facing the accident/event. In our case, this is identified and described in Section 5 below, with the EDSS functionalities and the running of proactive services, which can increase the knowledge over the risk under examination.
The multidisciplinary nature of the environmental problems implies the heterogeneity of acquired data from various sources and with many different levels of precision, as well as different dependencies among them. An example of data fusion modeling, based on the use of rules in order to obtain a decision over the available data, is reported in [37]. This complex problem may be faced by using either a Model-based System, a Knowledge-based one, or Case-based one, each one using, respectively, different reasoning models, such as: model-based, rule-based, or case-based reasoning. In any case, in order to be effective and useful, risk analysis models are applied for diagnosis and prediction. In particular, the environmental data acquired by the various monitoring resources are fused by applying simulation and optimization models for site characterization and observation, in order to detect possible marine pollution events, and to interpret these data according to prediction models for understanding the situation and assess the risk.
In detail, we introduced a method for providing a near real-time risk assessment, with the goal to produce risk-related information in a geographic area of interest that can be both automatically analyzed by proactive services, and visually analyzed by the deputed authorities or stakeholders to help reduce the risks and possibly improve the efficiency of the intervention chain [38]. In order to obtain a risk evaluation, the likelihood and consequences of events are combined. Thus, the estimated risks can be compared and ranked considering the as low as reasonably practicable (ALARP) criteria of acceptability. Once the estimates have been computed, based on the acquired and collected data that have been weighted and integrated, they can be represented in an interactive dynamic risk map related to the region of interest. The overall risk assessment is obtained by composing the various risk terms. It has to be taken into account that data arrive to the system asynchronously and each piece of different information has its own frequency of updating (e.g., some like AIS data flow into the systems every minute, others like AUV reports are acquired only on specific occasions). Nevertheless, the risk assessment is performed every time a new piece of information is acquired by the MIS and the produced risk map is updated consequently with available data.
In the following, the specific risk analysis variables and their weighted computation are presented.
Risk Assessment Computation
The first variable considered is the maritime traffic density, and this based on the various pieces of information acquired and available in the MIS, among these the real-time AIS messages [39], which gives lots of information on the vessels’ typology and position. The followed approach is based on Kernel Density Estimation (KDE) [40], where each vessel contributes to an increase of traffic-related risk in a region R around the vessel itself that is determined by a kernel function K, which can be a Gaussian kernel, although non-isotropic kernel elongated in the direction of vessel course over the ground might be employed. Then, the for a geographic position at time , is computed as follows:
where the sum runs over all the vessels that reported their position within the time window of size , which depends also on the sensitivity needed for the system (e.g., typical value for the test case was 15 min), and is a weight associated to the vessel depending on its speed, course and typology.
Another important variable is represented by the processing of remote sensing images, which is usually the most used mean of detection for larger oil spills. Even though this processing has a main drawback in the reduced degree of confidence each detection has, using it in a cumulative risk assessment can be a very important factor in the global estimate. Starting from a received oil spill report , it is related to a possible oil spill in a region , with a judged degree of confidence , occurred at time . We can use a binary function of the region , which returns 1 only for the positions internal to the region. Thus, the second variable, the remote sensing reported risk is given as:
where the sum runs over all the received oil spill reports within the same time window of size , and is a convolution kernel with representing the reported region spread by the convolution kernel. The kernel can be designed so as to optimally control the influence area of the report, with the last term of Equation (2) representing a weight of the report in terms of age. It is high with close to (i.e., recent reports), and decreasing for very different from (i.e., older reports); the decay factor determines the velocity of this weight to become negligible.
A third variable is represented by the in situ acquired and processed data. As reported in Section 3, among various sensors, AUVs and buoys can perform important local observations, yielding reports that can be treated in the same way as previous remote sensing reports, with the difference of the latter ones to be localized (i.e., considered as points) and not relative to wider regions (i.e., obviously this is valid with respect to the size of the case study scenarios). Thus, considering Equation (2) with the binary function F applied to the single point (i.e., thus yielding 1 for the report location), the in situ reported risk can be evaluated as follows:
where the sum runs over all in situ reports , is again a degree of confidence associated with the report, is again a convolution kernel, and is the time when the in situ report was issued.
Once the quantitative measurements were considered, qualitative data has also been integrated into the total risk assessment as a variable. In particular, an area with an increased monitoring level (i.e., close to a number of monitoring resources) is statistically less affected by accidents, and, moreover, in case of an accident, the effects and remediation actions can be started in a more timely manner. In order to evaluate this qualitative measure, a further variable for the monitoring quality is computed as follows:
where the sum runs over all the monitoring resources M (each placed in the point ), which are operational in the time window of size and is a weight associated to M depending on the characteristics of the monitoring resource (autonomy, mitigation power,…). is a convolution kernel such as a Gaussian kernel.
Finally, an overall risk assessment value can be computed by integrating all the above variables (Equations (1)—(4)), taking into account that the variable has a negative influence with respect to a risk increment. Thus, we can obtain a function defined for each point in the monitoring area at time as:
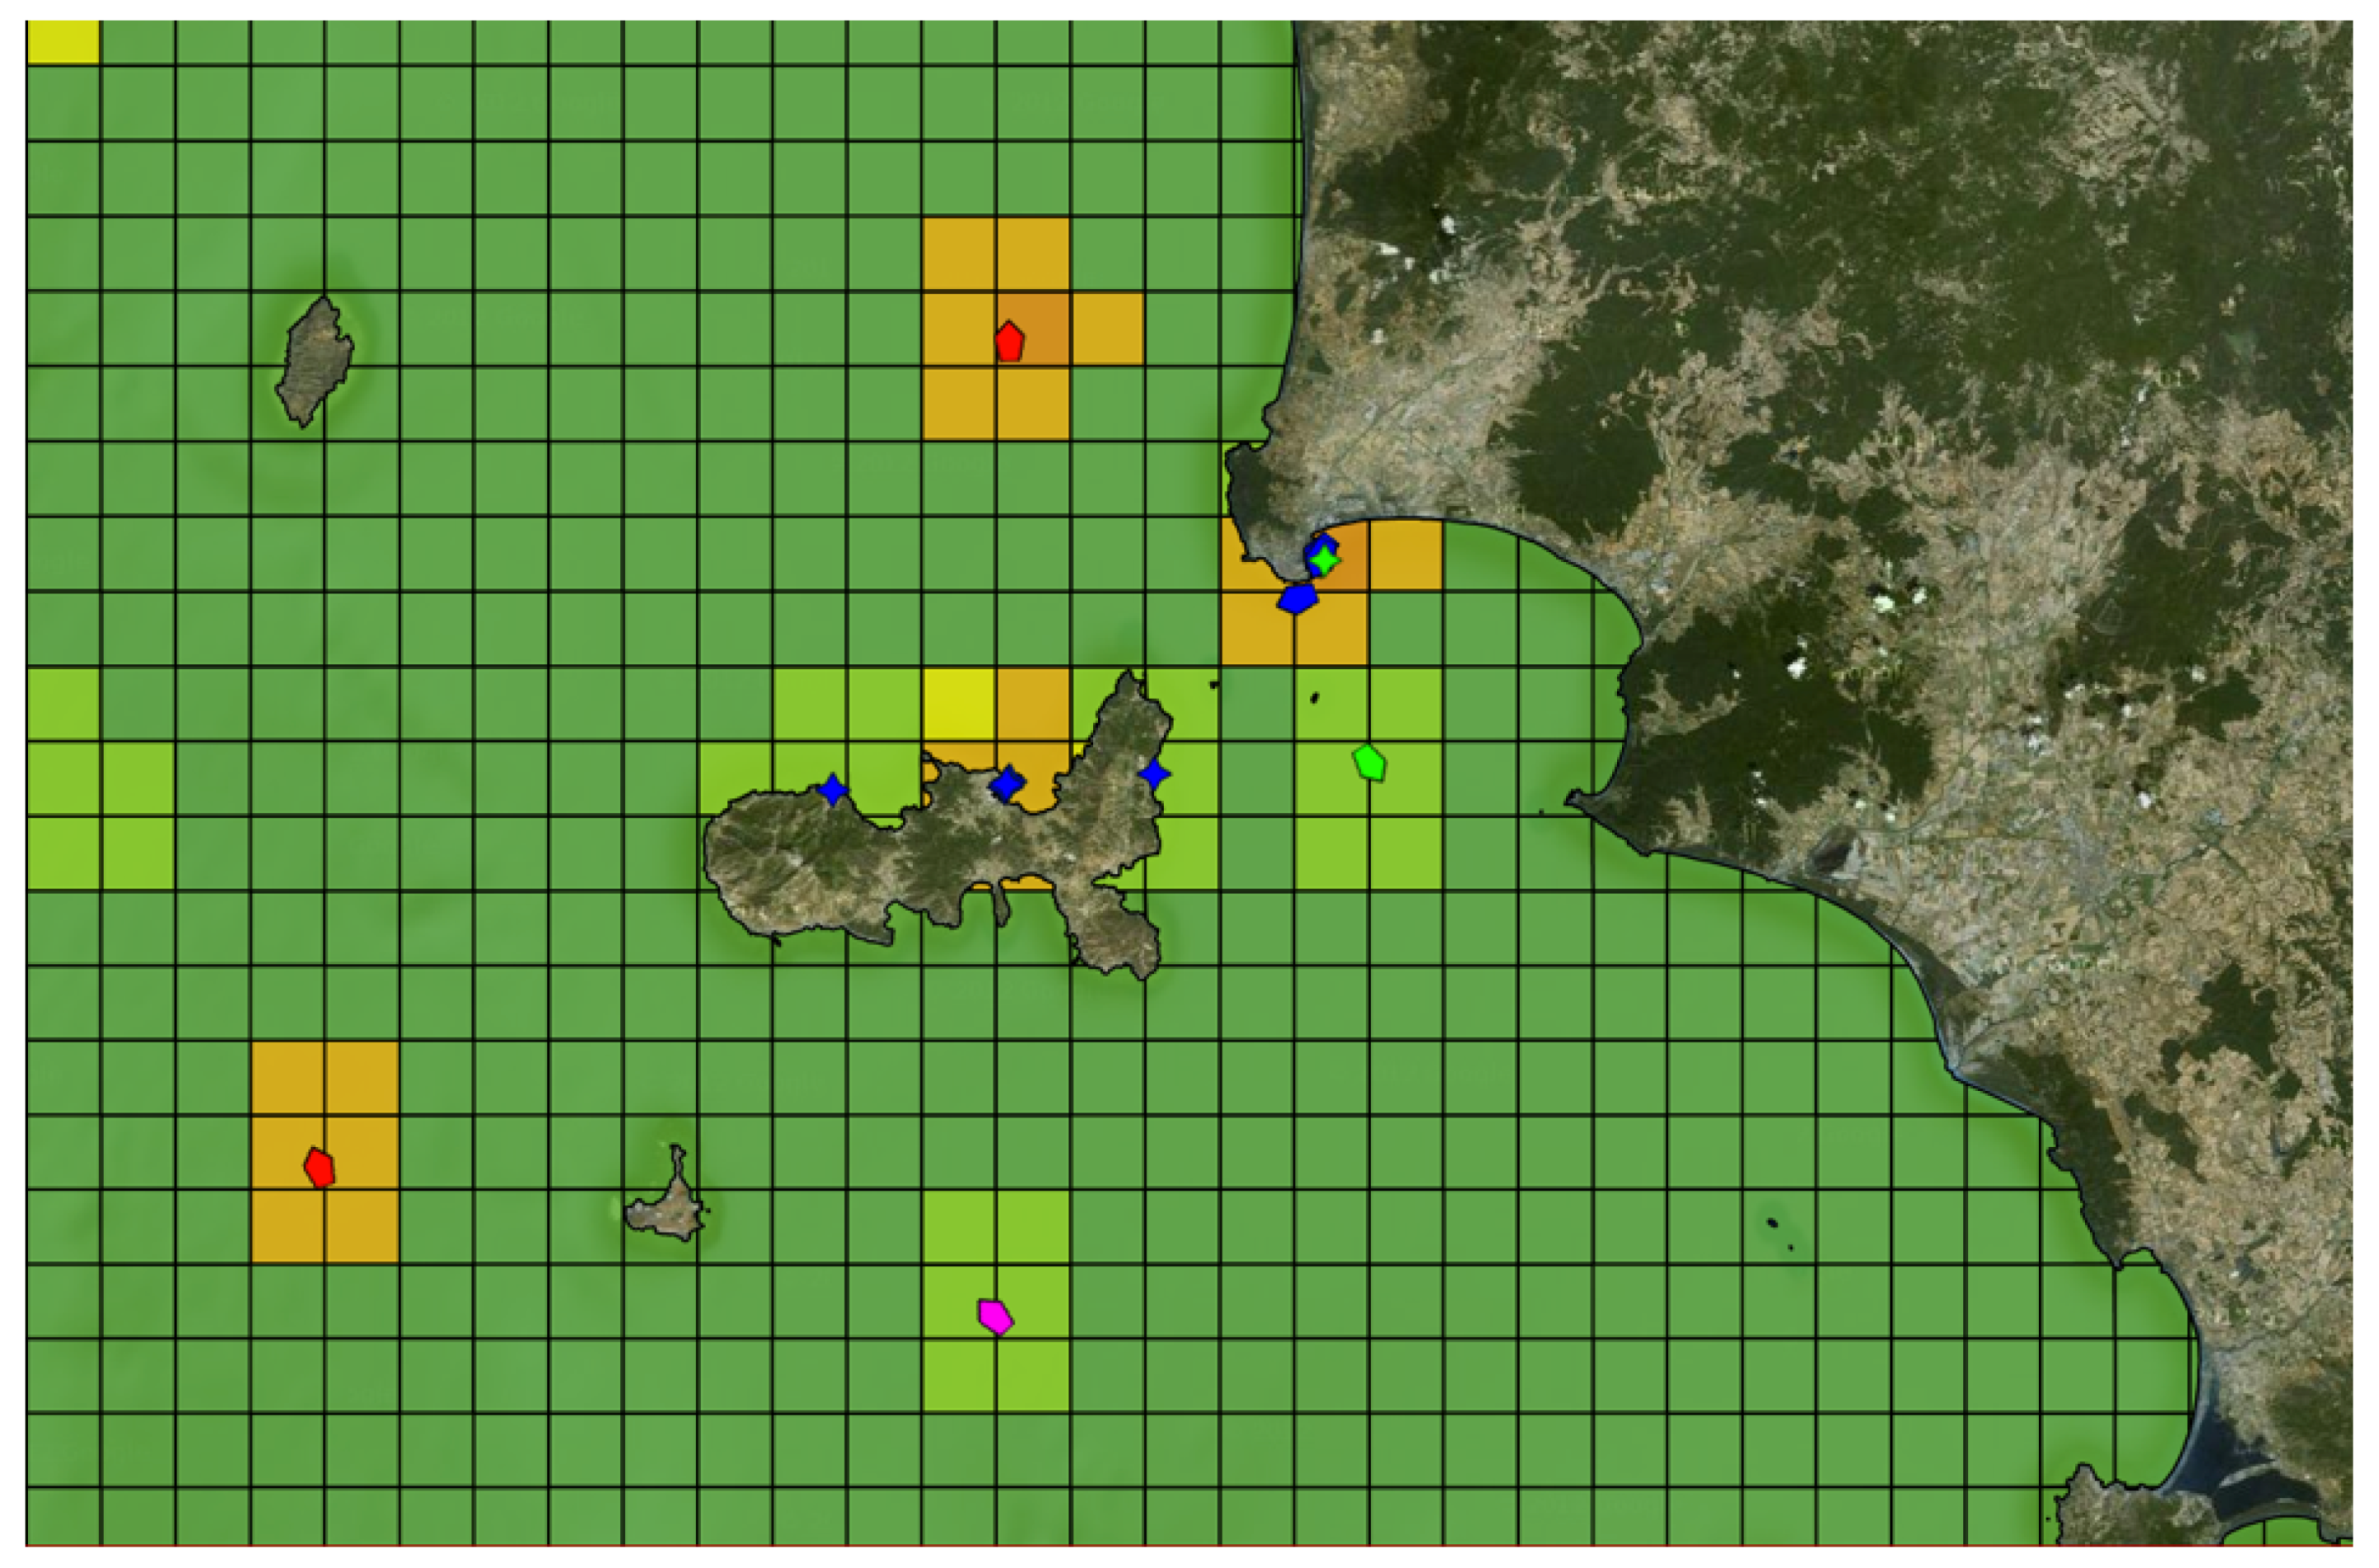
where () are coefficients heuristically determined on the basis of the tests performed and refined also on the basis of the feedbacks received by end-users. As mentioned at the beginning, can be represented by means of an interactive dynamic risk map related to the specific region of interest. Following its definition, it is valued for each point in the region, but the level of detail (i.e., the pixel size of the map) can be defined at different levels for a better understanding and visualization purpose. For this reason, the region of interest has been divided by means of grids having different steps that can be viewed as different layers depending both: on the level of zoom, they are visualized, and on the associated risk value. In detail, for the test case scenarios, three different sizes were defined for the grid element (8 km, 4 km and 1 km squares), each square in the risk map has a risk value associated. In more detail, a square at the coarsest grid level in the map having a low level of risk (shown as a green one) does not need a further refinement into finest grid layers, while areas with higher risk (yellow or red squares) have an evaluation also on the finer scale grid layer (see an example of the map in Figure 2).
5. Proactive Services for Marine Monitoring
One of the main goals of the proposed MIS is the continuous environmental monitoring of an area of interest. The main issues are: (i) a proactive management of the available resources; and (ii) the provision of services for notification and alerting. Each of the services as well as the notification unit (see Figure 1) are built based on intelligent software agents that work autonomously and independently, but integrated into the MIS by means of an inner logic representing a work-flow composed of specific tasks, which it is committed to carry out. Each task follows a condition-action rule. Among the various actions that each service can provide, there is either acquisition of further data from specific sensors, or processing of new simulation or methods for risk assessment. Each service (i.e., the software agent mentioned above) retrieves at regular time intervals, which can be different ones among the others, its specific data from the repositories; moreover, it can be activated for its specific processing on demand by other services or through specific direct requests from users. As an example of these services, the simple resource management, which is in charge of controlling adaptively the sampling frequency of the in situ resources can be described: various sensors (e.g., buoys and AUVs) are battery powered with strict energy constraints, which should be taken into account for deciding sensor sampling rate and periods for data transfer. In this case, the service can perform a balance between risk status around the resource (i.e., given by the dynamic risk map) and its trends as well as the status of batteries and energy harvesting system; in case of a low risk and no increment in risk having been observed, then the sampling rate can be reduced; on the other hand, this value can be increased in a higher risk situation. A different example of a proactive service is related to mission planning for sensor based AUVs. Following the reception of an oil spill report, the analysis of the dynamic risk map and the available resources (e.g., AUVs ready for mission) are analyzed and a possible route with way-points for water sampling has been produced [38].
Another case can be described regarding specifically the notification services. Let us make the case of reception of an oil spill report having an high confidence ratio (e.g., with an alignment with other sensors acquisitions); then, an alert is generated. Moreover, alerts can be generated also on the basis of the dynamic risk map considering both the absolute value of the risk and its trend. With the alert generation, the service composes a message including all of the information that might be useful for understanding and evaluating the alert. In particular, the location to which the alert refers, the level of severity, the observations that have triggered the event and eventual link to specific resources through the MIS web interface. The final notification is then performed through the suitable dispatcher (e.g., mail or SMS) using specific APIs.
6. Results
The developed Marine Information System was made available through its web interface as shown in Figure 3: the view of the map with the possible layers in overlay, while a series of sample layers are visible in overlay (e.g., hyperspectral report, AIS data, AUVs tracks, Oil spill report, etc.), and on the right side a list of all available layers. Furthermore, tabs are available for performing simulations and a review analysis on historical data, as shown in Figure 4.
The MIS has been tested in different field tests performed in Zakynthos, Greece (hosted by the Zakynthos Marine Park) and in Elba Island, Italy (hosted by National Park of Tuscany Archipelago). Such field tests were performed in order to check all the chain from the acquisition and processing of heterogeneous data from various sensors, to the issue of proactive decision support services. As already mentioned among the various data acquired from sensors in these field tests, there have been: (1) AIS receivers, (2) airborne and space-borne image sensors and their interpretative reports regarding both oil spills and vessel detection, (3) AUVs, (4) static ad drifting buoys (see Figure 5 and discussed in detail in [41]), (5) e-Nose mounted on board buoys and AUVs, (6) volunteer alerts and (7) hand-held spectroradiometer. Some of the external data to be processed and then acquired by the MIS, due to their intrinsic nature and also to the fact that these experiments were performed during the course of a research project, were not acquired directly in real-time during the short time of the field experiments (e.g., the SAR processed data at the time of the experiment, the airborne acquired data...). Nevertheless, those data were acquired at a later stage as off-line data and integrated so as to be able to perform historical views as mentioned above. Obviously, the real-time integration of all processed and available data is discussed in the following section and will be investigated in case this system becomes adopted as a running service by the competent authorities.
Among the several tests performed, two main goals were envisaged: verifying the global storage and integration capabilities of the MIS, and its near real-time functionalities. The first part regarding the data integration was mainly tested by injection of a large amount of dummy data (both self-created and true previously acquired data) to the platform. The results, after overcoming some interoperability issues, shown that such a system has a satisfactory structure and reasonable size in order to be able to manage the amount of information needed for the case scenarios under monitoring. For the second aspect, both dummy and real acquired data were used in connection with the assistance of experienced users. As an example of dummy data, talking about AIS data, those data were meaningful NMEA (from the National Marine Electronics Association) strings representing AIS signals injected into the system and treated by the MIS as real AIS data. The methods for real-time risk assessment were run automatically at regular time intervals in order to produce risk maps (and store the information in the appropriate databases) under the control and visual inspection of the end-users. The produced dynamic maps and layers were thus considered as a meaningful and significant mean of producing information and obtain a management tool capable of focusing the attention on the areas that deserve a more accurate monitoring. Moreover, in order to test the proactive functionalities, the services in charge for that were activated with requests for data polling from various GIS-databases, i.e., all different data integrated into the MIS architecture, including the above produced risk maps, thus delivering suggestions regarding resource management and alert notifications.
In order to better describe this latter, but central aspect of the MIS, among the performed tests, dummy data were fed to the system so as to represent different scenarios. As an example, in Figure 6, a simulation of an event of a possible oil spill detected by a sensor mounted on a mooring buoy is shown. In detail, on the left, the sensors detect some altered level of monitored substances in the water, and this event triggers a series of actions, shown on the right: the dynamic risk map is updated, and a proactive action is taken following the DSS to send notification to the authorities in charge. Such notification is sent by the specific Notification Unit through both text messages and emails containing a description of the event (different descriptions can be set depending on the different recipients), and where possible a link to the MIS web interface where the user can eventually explore and visualize further information and inquire for different data and measurements from other relevant sensors.
Moreover, a cross-correlation was performed among different data sources acquired in order to give a quantitative proof of the results, and also to test the efficiency and reliability of the different available information.
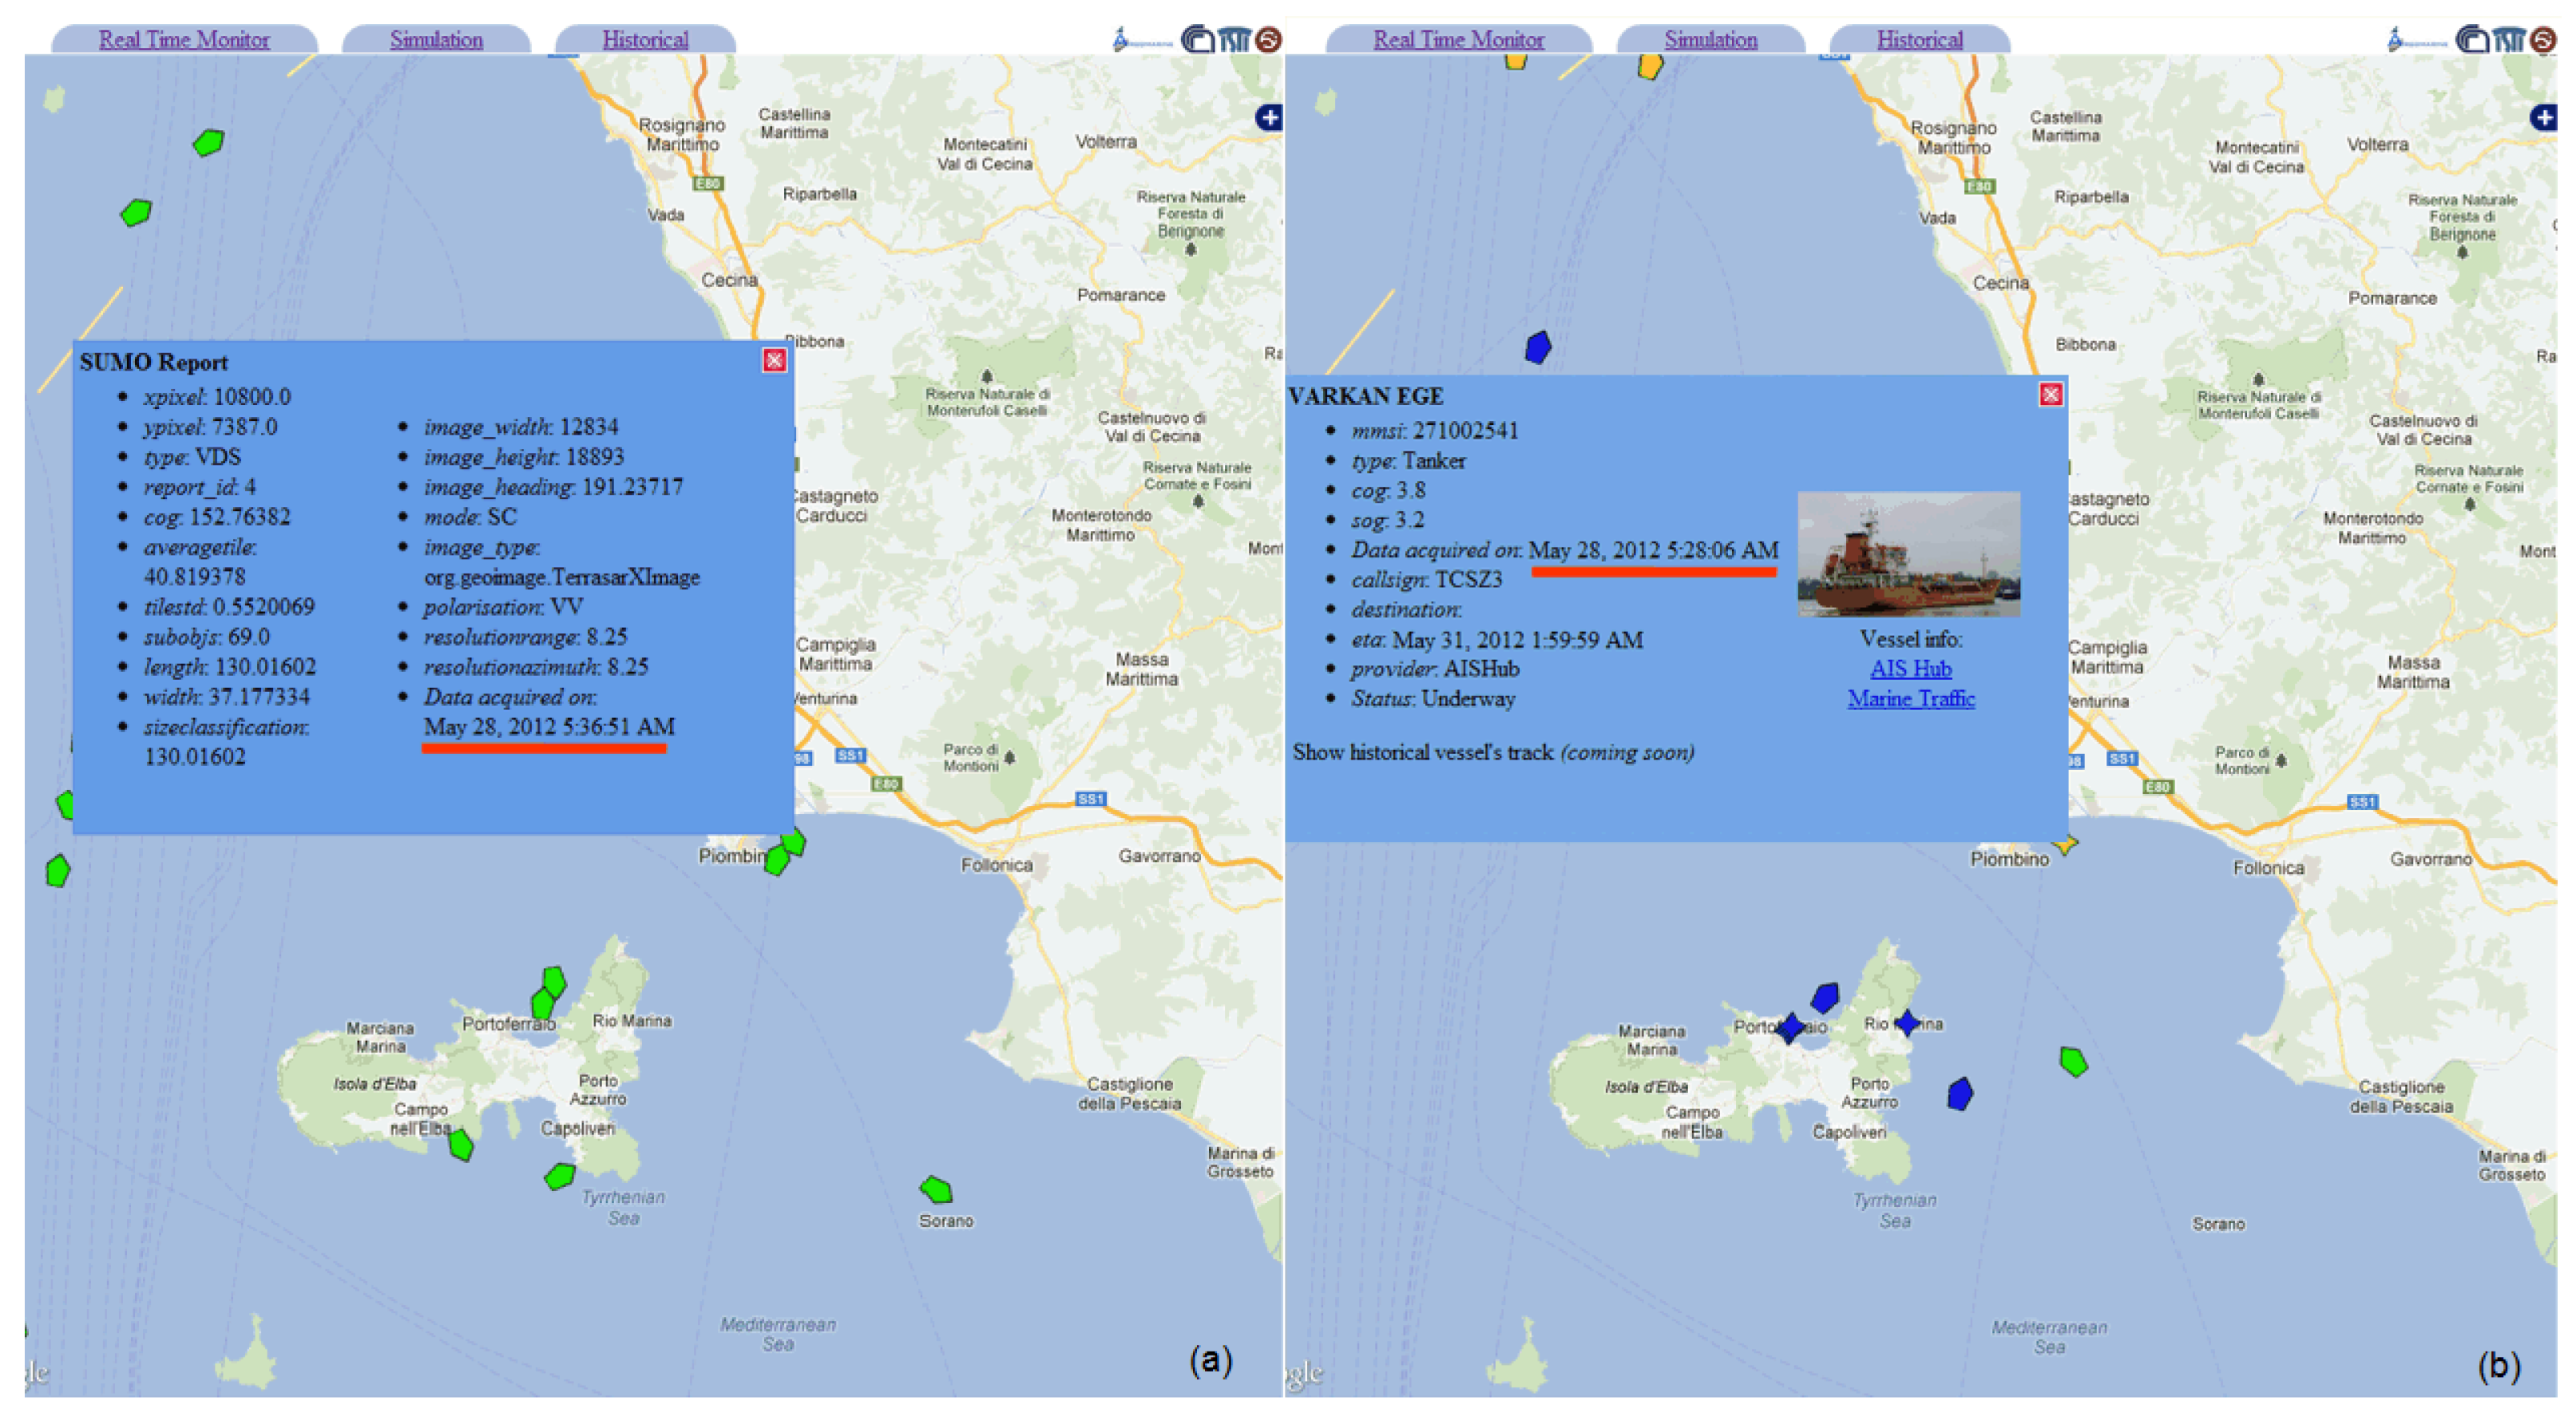
As an example, a comparison was performed between classified SAR images and AIS data acquired (mentioned in Section 3.1). In more detail, the geo-referenced report from SAR classification (classification performed through the SUMO software from JRC (SUMO, Joint Research Centre, EU) [42]) has been temporally registered with the correspondent AIS data, and overlapping data on the respective layers compared for correlation. Among the different information that can be extracted and compared, the most useful is the size of the vessels, considering also that not all the vessels are compelled to emit the AIS signal, whereas larger ships like tankers are obligated. Once a synchronization is performed between the various heterogeneous data, and that a confidence interval both in terms of time and space is taken into account, the classified ship corresponds and it is positively correlated to the SAR detection; in the following Figure 7, an example of this correlation is shown for a specific vessel; as a further confirmation, the size class (130 m detected versus 100 m actual) is acceptably close to the actual size. Furthermore, we could see that the number of vessels detected through SAR images (Figure 7a) is greater than the ones acquired through the AIS data (Figure 7b), but, as mentioned above, this is also due to the fact that the majority of smaller vessels are not obliged to send AIS signals.
7. Discussion
This paper describes the behavior of a Marine Information System, and its outcomes were visualized and made available to experienced users such as local authorities and stakeholders in the monitoring and management of sea and coastal oil pollutions (e.g., responsible authorities). By visual inspection through the web interface, the users found the dynamic risk map to convey meaningful and significant information, which were acquired from a variety of heterogeneous sensors. Indeed, the dynamic risk map has been considered as a useful tool to better focus the attention on the areas that deserve a more accurate monitoring. The Environmental Decision Support System provide a quantitative representation of the risk factors, and most notably a proactive notification of events and suggestion useful in the intervention chain for the management of pollution situations.
The detailed architecture of the MIS has been described, along with specifications on the methods used for real-time risk estimation, and the services realized for environmental monitoring. Moreover, a screening over the potential sensors available nowadays for environmental sea monitoring has been discussed. In addition, thanks to the tests, mainly performed in the framework of FP7 Project Argomarine [43], the MIS has demonstrated having enough modularity and flexibility to accommodate heterogeneous data and provide configurable services. A future integration of new data sources (i.e., new sensors providing data) does not pose problems since it is enough to provide a new service unit. At the same time, other proactive decision support services can be easily configured. As an example of further improvement in the system, a unit for modeling the forecast of oil-spillage spread due to weather and sea conditions, as described for example in [14], could be included and added as a layer to the dynamic risk map. Obviously, this should come along with a service unit deputed to acquiring meteorological data, but, as explained in the paper due to the modular nature of the connected units, this will not be a structural problem. In particular, the “Mathematical simulation module” of the Service Unit (see Figure 1) is intended to perform this task. As often happens when aiming to provide an integrated representation, a validation of the predictive accuracy is generally hard to prove due to the lack of appropriate data for this validation [1]. This makes the MIS a suitable candidate not only for oil spills’ monitoring systems, but also for more general geospatial data management for marine and maritime applications. This system has been implemented in the frame of the above-mentioned EU Project and its information made available through the web interface of the project [44]; all acquired data have been included until provided by each single partner in the project. Unfortunately, as often happens with tools implemented specifically for a funded research project, once its lifespan is over, it becomes difficult to gather together all the partners that gave life to it and find new opportunities of funding and improving the system, as well as possible ways to exploit its results through provision of services.
8. Conclusions
A Marine Information System, namely ARGO-MIS, is described which acts as an integrated and inter-operable tool for the monitoring of oil-spills. A babel of heterogeneous data flow seamlessly through the system, where they are integrated with the purpose to produce a set of services, in particular proactive services such as a Decision Support. These services, can then be used by the authorities in charge of remediation operations, as an addition to the actually available resources, with the goal to improve the efficiency and the response during oil-spillages. By means of ARGO-MIS, we wanted to demonstrate that an environmental management system can be valuably improved by being supported by a MIS, which provides quick and effective links among the various aspects involved: data, models, resources, users.
Acknowledgments
This paper has been partially supported by the EU FP7 Project ARGOMARINE (Automatic oil-spill recognition and geopositioning integrated in a marine monitoring network, FP7-Transport-234096).
Author Contributions
Gabriele Pieri contributed to the architectural design of the MIS, the development of the ICT services, as well as the paper preparation; Ovidio Salvetti has promoted the ideas behind this paper and has participated in the design of this research and the preparation of the paper; Michele Cocco contributed to the sensors’ state-of-the-art research, design and integration, as well as the paper preparation.
Conflicts of Interest
The authors declare no conflict of interest.
Abbreviations
The following abbreviations are used in this manuscript:
| AIS | Automatic Identification System |
| ASV | Autonomous Surface Vehicles |
| AUV | Autonomous Underwater Vehicle |
| GIS | Geographic Information System |
| GT | Gross Tonnage |
| GUI | Graphical User Interface |
| HNS | Hazard Noxious Substances |
| KDE | Kernel Density Estimation |
| LSF | Laser Fluorosensors |
| MWR | Microwave Radiometers |
| OLAP | Online Analytical Processing |
| SAR | Synthetic Aperture Radar |
| SLAR | Side-Looking Airborne Radar |
| VOCs | Volatile Chemicals |
References
- Kelly, R.A.; Jakeman, A.J.; Barreteau, O.; Borsuk, M.E.; ElSawah, S.; Hamilton, S.H.; Henriksen, H.J.; Kuikka, S.; Maier, H.R.; Rizzoli, A.E.; et al. Selecting among five common modelling approaches for integrated environmental assessment and management. Environ. Model. Softw. 2013, 47, 159–181. [Google Scholar] [CrossRef]
- Nevalainen, M.; Helle, I.; Vanhatalo, J. Preparing for the unprecedented—Towards quantitative oil risk assessment in the Arctic marine areas. Mar. Pollut. Bull. 2017, 114, 90–101. [Google Scholar] [CrossRef] [PubMed]
- Abascal, A.J.; Castanedo, S.; Medina, R.; Liste, M. Analysis of the reliability of a statistical oil spill response model. Mar. Pollut. Bull. 2010, 60, 2099–2110. [Google Scholar] [CrossRef] [PubMed]
- Kinerson, R.S.; Kittle, J.L.; Duda, P.B. BASINS: Better assessment science integrating point and nonpoint sources. In Decision Support Systems for Risk-Based Management of Contaminated Sites; Springer: New York, NY, USA, 2009; pp. 1–24. [Google Scholar]
- Paine, R.T.; Ruesink, J.L.; Sun, A.; Soulanille, E.L.; Wonham, M.J.; Harley, C.D.; Brumbaugh, D.R.; Secord, D.L. Trouble on oiled waters: Lessons from the Exxon Valdez oil spill. Annu. Rev. Ecol. Syst. 1996, 27, 197–235. [Google Scholar] [CrossRef]
- Balseiro, C.; Carracedo, P.; Gómez, B.; Leitao, P.; Montero, P.; Naranjo, L.; Penabad, E.; Pérez-Muñuzuri, V. Tracking the Prestige oil spill: An operational experience in simulation at MeteoGalicia. Weather 2003, 58, 452–458. [Google Scholar] [CrossRef]
- Fingas, M. Oil Spill Science and Technology; Gulf Professional Publishing: Cambridge, MA, USA, 2016. [Google Scholar]
- Ferraro, G.; Meyer-Roux, S.; Muellenhoff, O.; Pavliha, M.; Svetak, J.; Tarchi, D.; Topouzelis, K. Long term monitoring of oil spills in European seas. Int. J. Remote Sens. 2009, 30, 627–645. [Google Scholar] [CrossRef]
- Fingas, M.; Brown, C. Review of oil spill remote sensing. Mar. Pollut. Bull. 2014, 83, 9–23. [Google Scholar] [CrossRef] [PubMed]
- Guo, W.; Wang, Y. A numerical oil spill model based on a hybrid method. Mar. Pollut. Bull. 2009, 58, 726–734. [Google Scholar] [CrossRef] [PubMed]
- Jordi, A.; Ferrer, M.; Vizoso, G.; Orfila, A.; Basterretxea, G.; Casas, B.; Alvarez, A.; Roig, D.; Garau, B.; Martínez, M. Scientific management of Mediterranean coastal zone: A hybrid ocean forecasting system for oil spill and search and rescue operations. Mar. Pollut. Bull. 2006, 53, 361–368. [Google Scholar] [CrossRef] [PubMed]
- Cortés, U.; Sànchez-Marrè, M.; Ceccaroni, L.; R-Roda, I.; Poch, M. Artificial intelligence and environmental decision support systems. Appl. Intell. 2000, 13, 77–91. [Google Scholar] [CrossRef]
- Fedra, K.; Winkelbauer, L. A hybrid expert system, GIS, and simulation modeling for environmental and technological risk management. Comput.-Aided Civ. Infrastruct. Eng. 2002, 17, 131–146. [Google Scholar] [CrossRef]
- Janeiro, J.; Zacharioudaki, A.; Sarhadi, E.; Neves, A.; Martins, F. Enhancing the management response to oil spills in the Tuscany Archipelago through operational modelling. Mar. Pollut. Bull. 2014, 85, 574–589. [Google Scholar] [CrossRef] [PubMed]
- Kimball, R. The Data Warehouse Lifecycle Toolkit; John Wiley & Sons: Hoboken, NJ, USA, 2008. [Google Scholar]
- U.S. Environment Protection Agency. BASINS 4.1 (Better Assessment Science Integrating Point and Non-Point Sources) Modeling Framework; National Exposure Research Laboratory, RTP: Durham, NC, USA, 2015. Available online: https://www.epa.gov/exposure-assessment-models/basins (accessed on 22 November 2017).
- Bourgeois, W.; Hogben, P.; Pike, A.; Stuetz, R. Development of a sensor array based measurement system for continuous monitoring of water and wastewater. Sens. Actuators B Chem. 2003, 88, 312–319. [Google Scholar] [CrossRef]
- Persaud, K.C.; Wareham, P.; Pisanelli, A.M.; Scorsone, E. “Electronic Nose”—A New Monitoring Device for Environmental Applications (S & M 0613). Sens. Mater. 2005, 17, 355. [Google Scholar]
- Lukowiak, A.; Maciejewska, M.; Szczurek, A.; Maruszewski, K. Application of a titania thin film for the discrimination between diesel fuel and heating oil. Thin Solid Films 2007, 515, 7005–7010. [Google Scholar] [CrossRef]
- Alpers, W.; Hühnerfuss, H. The damping of ocean waves by surface films: A new look at an old problem. J. Geophys. Res. Oceans 1989, 94, 6251–6265. [Google Scholar] [CrossRef]
- Hovland, H.A.; Johannessen, J.A.; Digranes, G. Slick detection in SAR images. In Proceedings of the IGARSS’94 Surface and Atmospheric Remote Sensing: Technologies, Data Analysis and Interpretation International Geoscience and Remote Sensing Symposium, Pasadena, CA, USA, 8–12 August 1994; Volume 4, pp. 2038–2040. [Google Scholar]
- Clark, R.B.; Frid, C.; Attrill, M. Marine Pollution; Clarendon Press: Oxford, UK, 1989; Volume 4. [Google Scholar]
- International Maritime Organisation (IMO). Guidelines for the Onboard Operational Use of Shipborne Automatic Identification Systems (AIS), as Amended by ITU-1371. Resolution A.917(22); London, 2001. Available online: https://www.navcen.uscg.gov/pdf/AIS/IMO_A_917(22)_AIS_OPS_Guidelines.pdf (accessed on 20 January 2017).
- Brekne, T.M.; Holmemo, S.; Engen, F.; Skeie, G.M. Norwegian Clean Seas Association for Operating Companies (NOFO)—Research and Development Program for Next Generation Arctic Recovery Equipment. In Proceedings of the Interspill Conference 2004, Trondheim, Norway, 14–17 June 2004. [Google Scholar]
- Nieto-Borge, J.C.; Mata-Moya, D.; Jarabo-Amores, P.; Reichert, K.; Hessner, K. Application of conventional marine radars for measuring ocean wave fields in shallow water conditions. In Proceedings of the 2010 IEEE International Geoscience and Remote Sensing Symposium (IGARSS), Honolulu, HI, USA, 25–30 July 2010; pp. 4338–4341. [Google Scholar]
- Van der Meer, F.D.; De Jong, S.M. Imaging Spectrometry: Basic Principles and Prospective Applications; Springer Science & Business Media: Amsterdam, The Netherlands, 2011; Volume 4, pp. xxi–xxxiii. [Google Scholar]
- Lammoglia, T.; de Souza Filho, C.R. Spectroscopic characterization of oils yielded from Brazilian offshore basins: Potential applications of remote sensing. Remote Sens. Environ. 2011, 115, 2525–2535. [Google Scholar] [CrossRef]
- Andreou, C.; Karathanassi, V.; Kolokoussis, P. Spectral library for oil types. In Proceedings of the 34th International Symposium on Remote Sensing of Environment, Sydney, Australia, 10–15 April 2011; pp. 10–15. [Google Scholar]
- Andreou, C.; Karathanassi, V. Estimation of the number of endmembers using robust outlier detection method. IEEE J. Sel. Top. Appl. Earth Obs. Remote Sens. 2014, 7, 247–256. [Google Scholar] [CrossRef]
- Andreou, C.; Karathanassi, V. Endmember detection in marine environment with oil spill event. In Proceedings of the SPIE 8180, Image and Signal Processing for Remote Sensing XVII, Prague, Czech Republic, 27 October 2011; Volume 8180, p. 81800P. [Google Scholar]
- Andreou, C.; Karathanassi, V. New automated method for estimating the number of endmembers in hyperspectral images. In Proceedings of the 2012 4th Workshop on Hyperspectral Image and Signal Processing (WHISPERS), Shanghai, China, 4–7 June 2012; pp. 1–4. [Google Scholar]
- SOLMAR Project. Available online: http://www.solmar.nurc.nato.int (accessed on 1 January 2017).
- Stommel, H. The slocum mission. Oceanography 1989, 2, 22–25. [Google Scholar] [CrossRef]
- Alvarez, A.; Caiti, A.; Onken, R. Evolutionary path planning for autonomous underwater vehicles in a variable ocean. IEEE J. Ocean. Eng. 2004, 29, 418–429. [Google Scholar] [CrossRef]
- Alvarez, A.; Garau, B.; Caiti, A. Combining networks of drifting profiling floats and gliders for adaptive sampling of the Ocean. In Proceedings of the 2007 IEEE International Conference on Robotics and Automation, Roma, Italy, 10–14 April 2007; pp. 157–162. [Google Scholar]
- Gasparotti, C.; Rusu, E. Methods for the risk assessment in maritime transportation in the Black Sea basin. J. Environ. Prot. Ecol. 2012, 13, 1751–1759. [Google Scholar]
- Vergara, L.; Soriano, A.; Safont, G.; Salazar, A. On the fusion of non-independent detectors. Digit. Signal Process. 2016, 50, 24–33. [Google Scholar] [CrossRef]
- Martinelli, M.; Moroni, D.; Pieri, G.; Tampucci, M. A proactive gis infrastructure for environmental monitoring. In Proceedings of the Seventeenth International Water Technology Conference (IWTC17), Istanbul, Turkey, 5–7 November 2013. [Google Scholar]
- Tampucci, M.; Martinelli, M.; Moroni, D.; Pieri, G.; Salvetti, O.; Villa, P. A Proactive System for Oil Spills and Marine Environment Monitoring. Bollettino di Geofisica Teorica e Applicata 2013, 54, 222–223. [Google Scholar]
- Laxhammar, R.; Falkman, G.; Sviestins, E. Anomaly detection in sea traffic-a comparison of the gaussian mixture model and the kernel density estimator. In Proceedings of the 12th International Conference on Information Fusion (FUSION’09), Seattle, WA, USA, 6–9 July 2009; pp. 756–763. [Google Scholar]
- Moroni, D.; Pieri, G.; Salvetti, O.; Tampucci, M.; Domenici, C.; Tonacci, A. Sensorized buoy for oil spill early detection. Methods Oceanogr. 2016, 17, 221–231. [Google Scholar] [CrossRef]
- Schwartz, G.; Kourti, N. Algorithm Development Searching for Unidentified Maritime Objects (SUMO). Jt. Res. Centre Tech. Note I 2001, 1, 1–11. [Google Scholar]
- Moroni, D.; Pieri, G.; Tampucci, M.; Salvetti, O. A proactive system for maritime environment monitoring. Mar. Pollut. Bull. 2016, 102, 316–322. [Google Scholar] [CrossRef] [PubMed]
- ARGOMARINE Project. FP7-Transport-234096. Available online: http://www.argomarine.eu/ (accessed on 31 December 2017).
Figure 1.
Architectural design of the Marine Information System with modular structure made evident.
Figure 1.
Architectural design of the Marine Information System with modular structure made evident.

Figure 2.
The dynamic risk map shown; the squares of the grid have dimension 4 by 4 km.

Figure 3.
The MIS interface with the map a view with several overlay layers, as well as all the available layers. (scale 1 cm:10 km).
Figure 3.
The MIS interface with the map a view with several overlay layers, as well as all the available layers. (scale 1 cm:10 km).
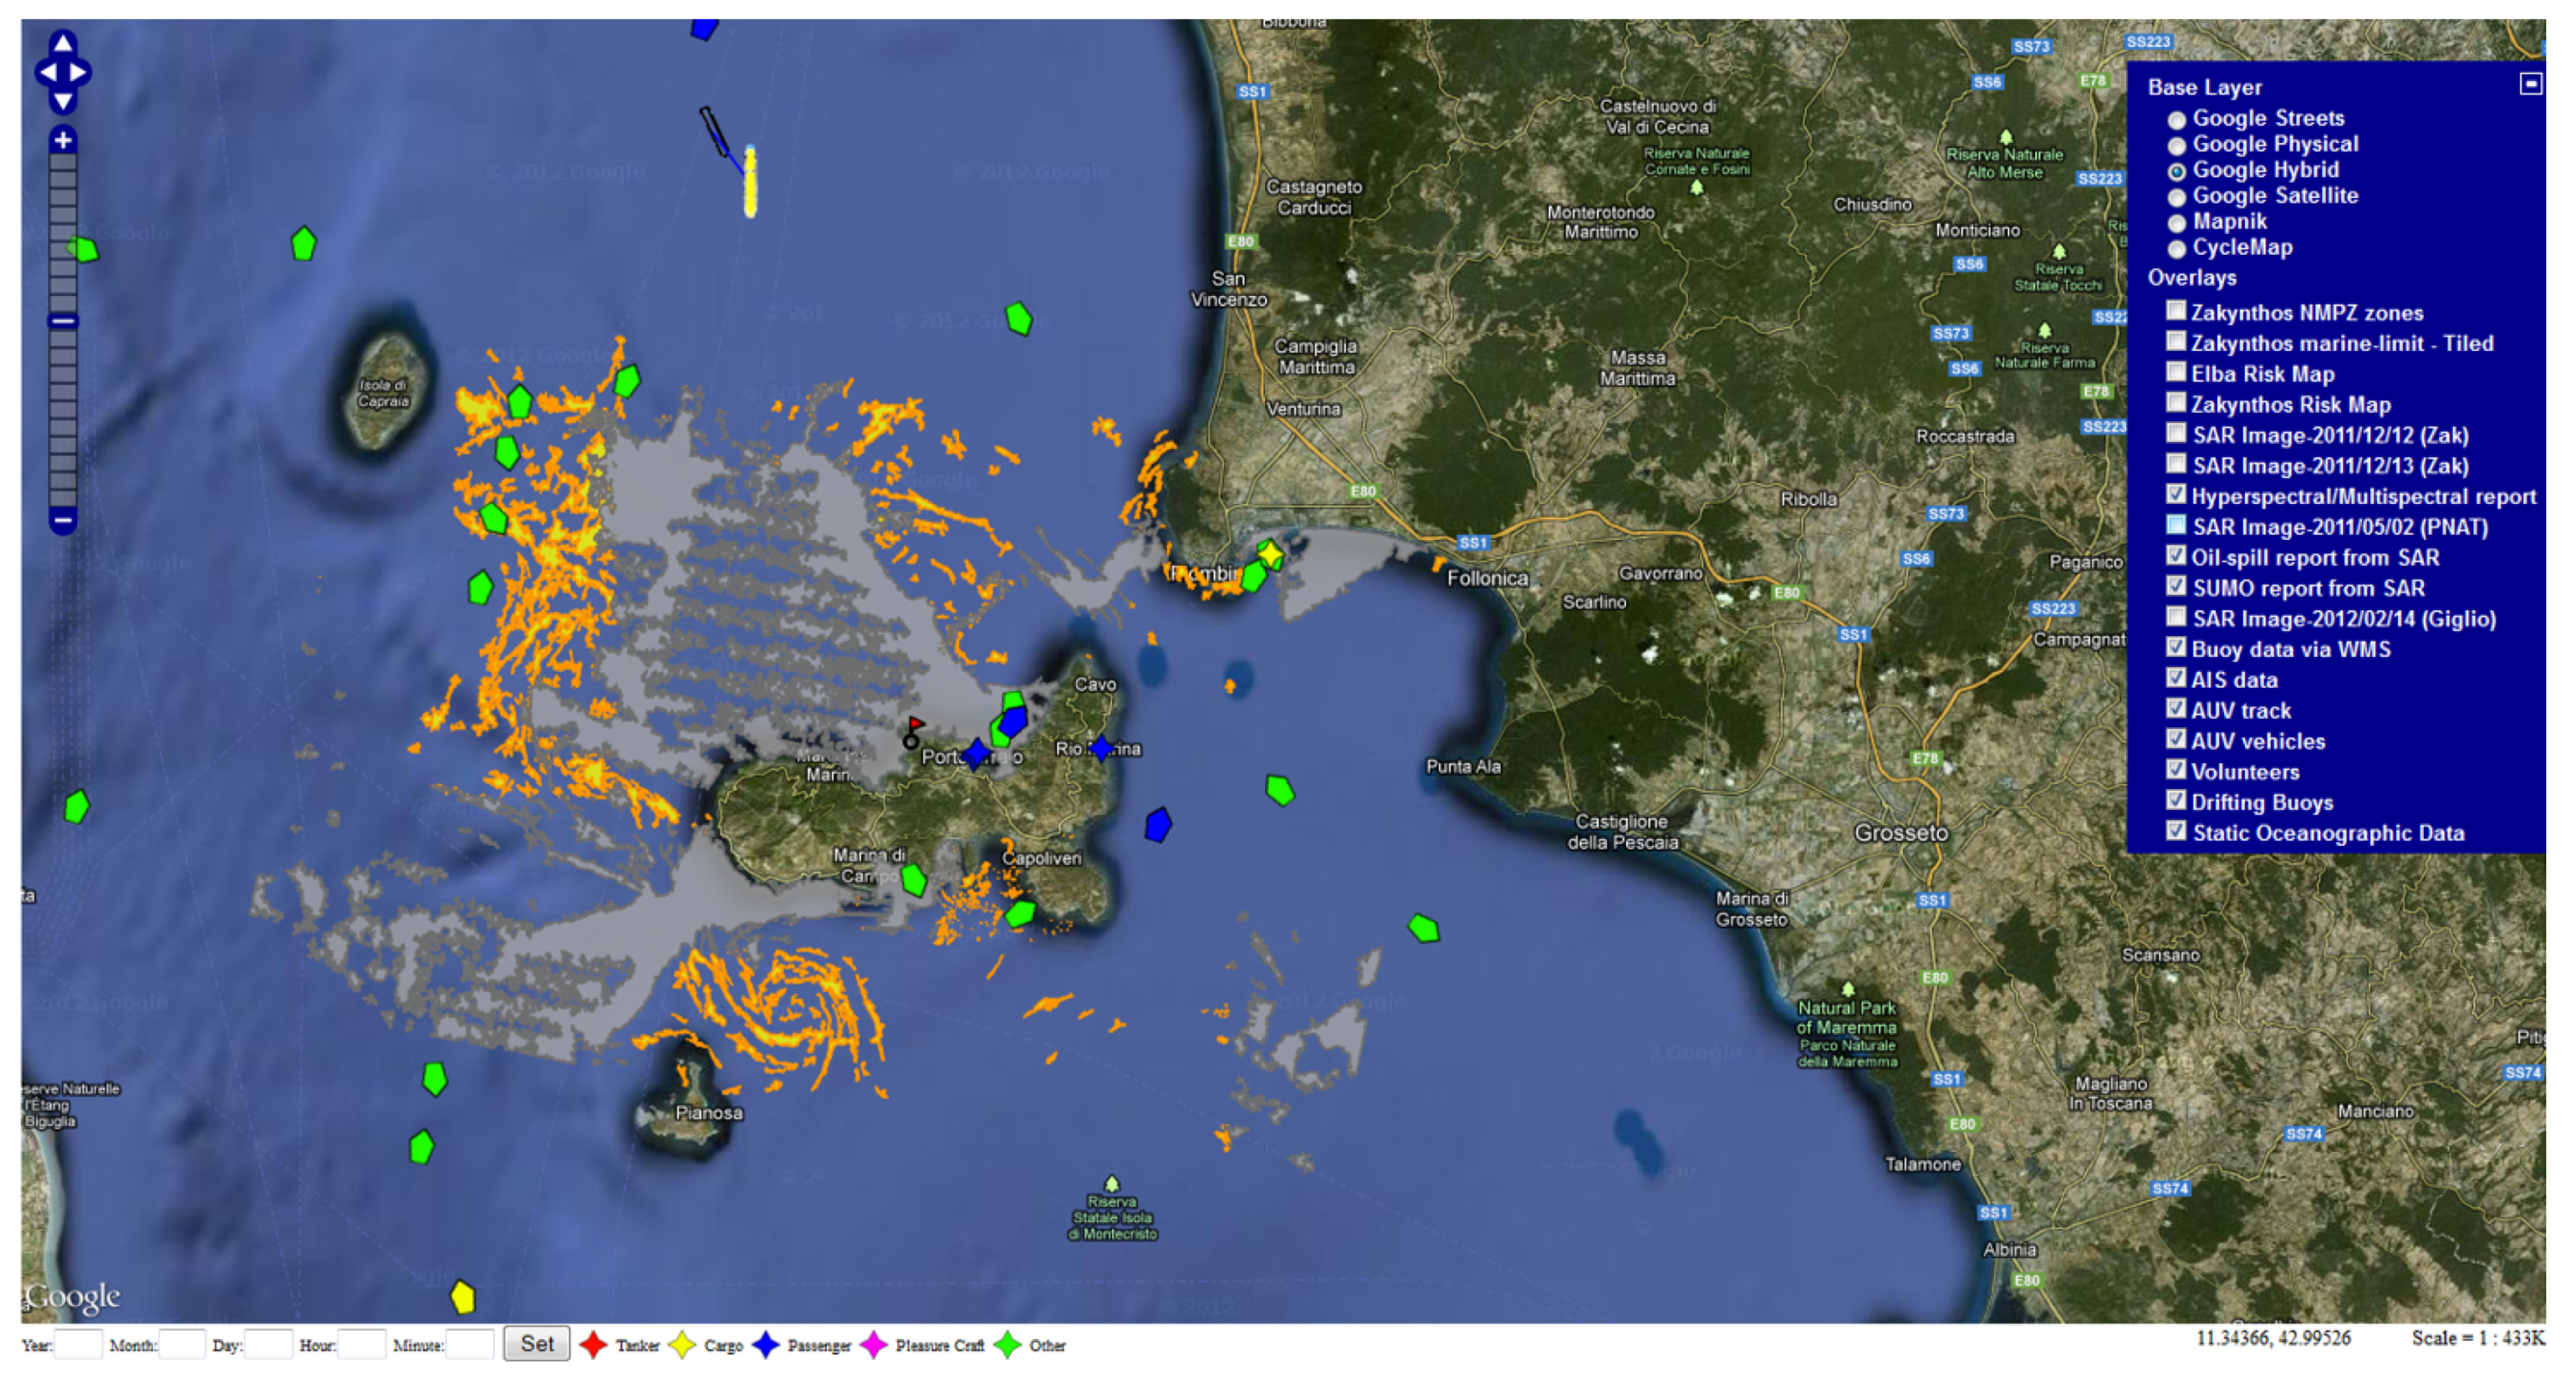
Figure 4.
MIS interface showing the historic data selection available for visualization. (scale 1 cm:20 km).
Figure 4.
MIS interface showing the historic data selection available for visualization. (scale 1 cm:20 km).
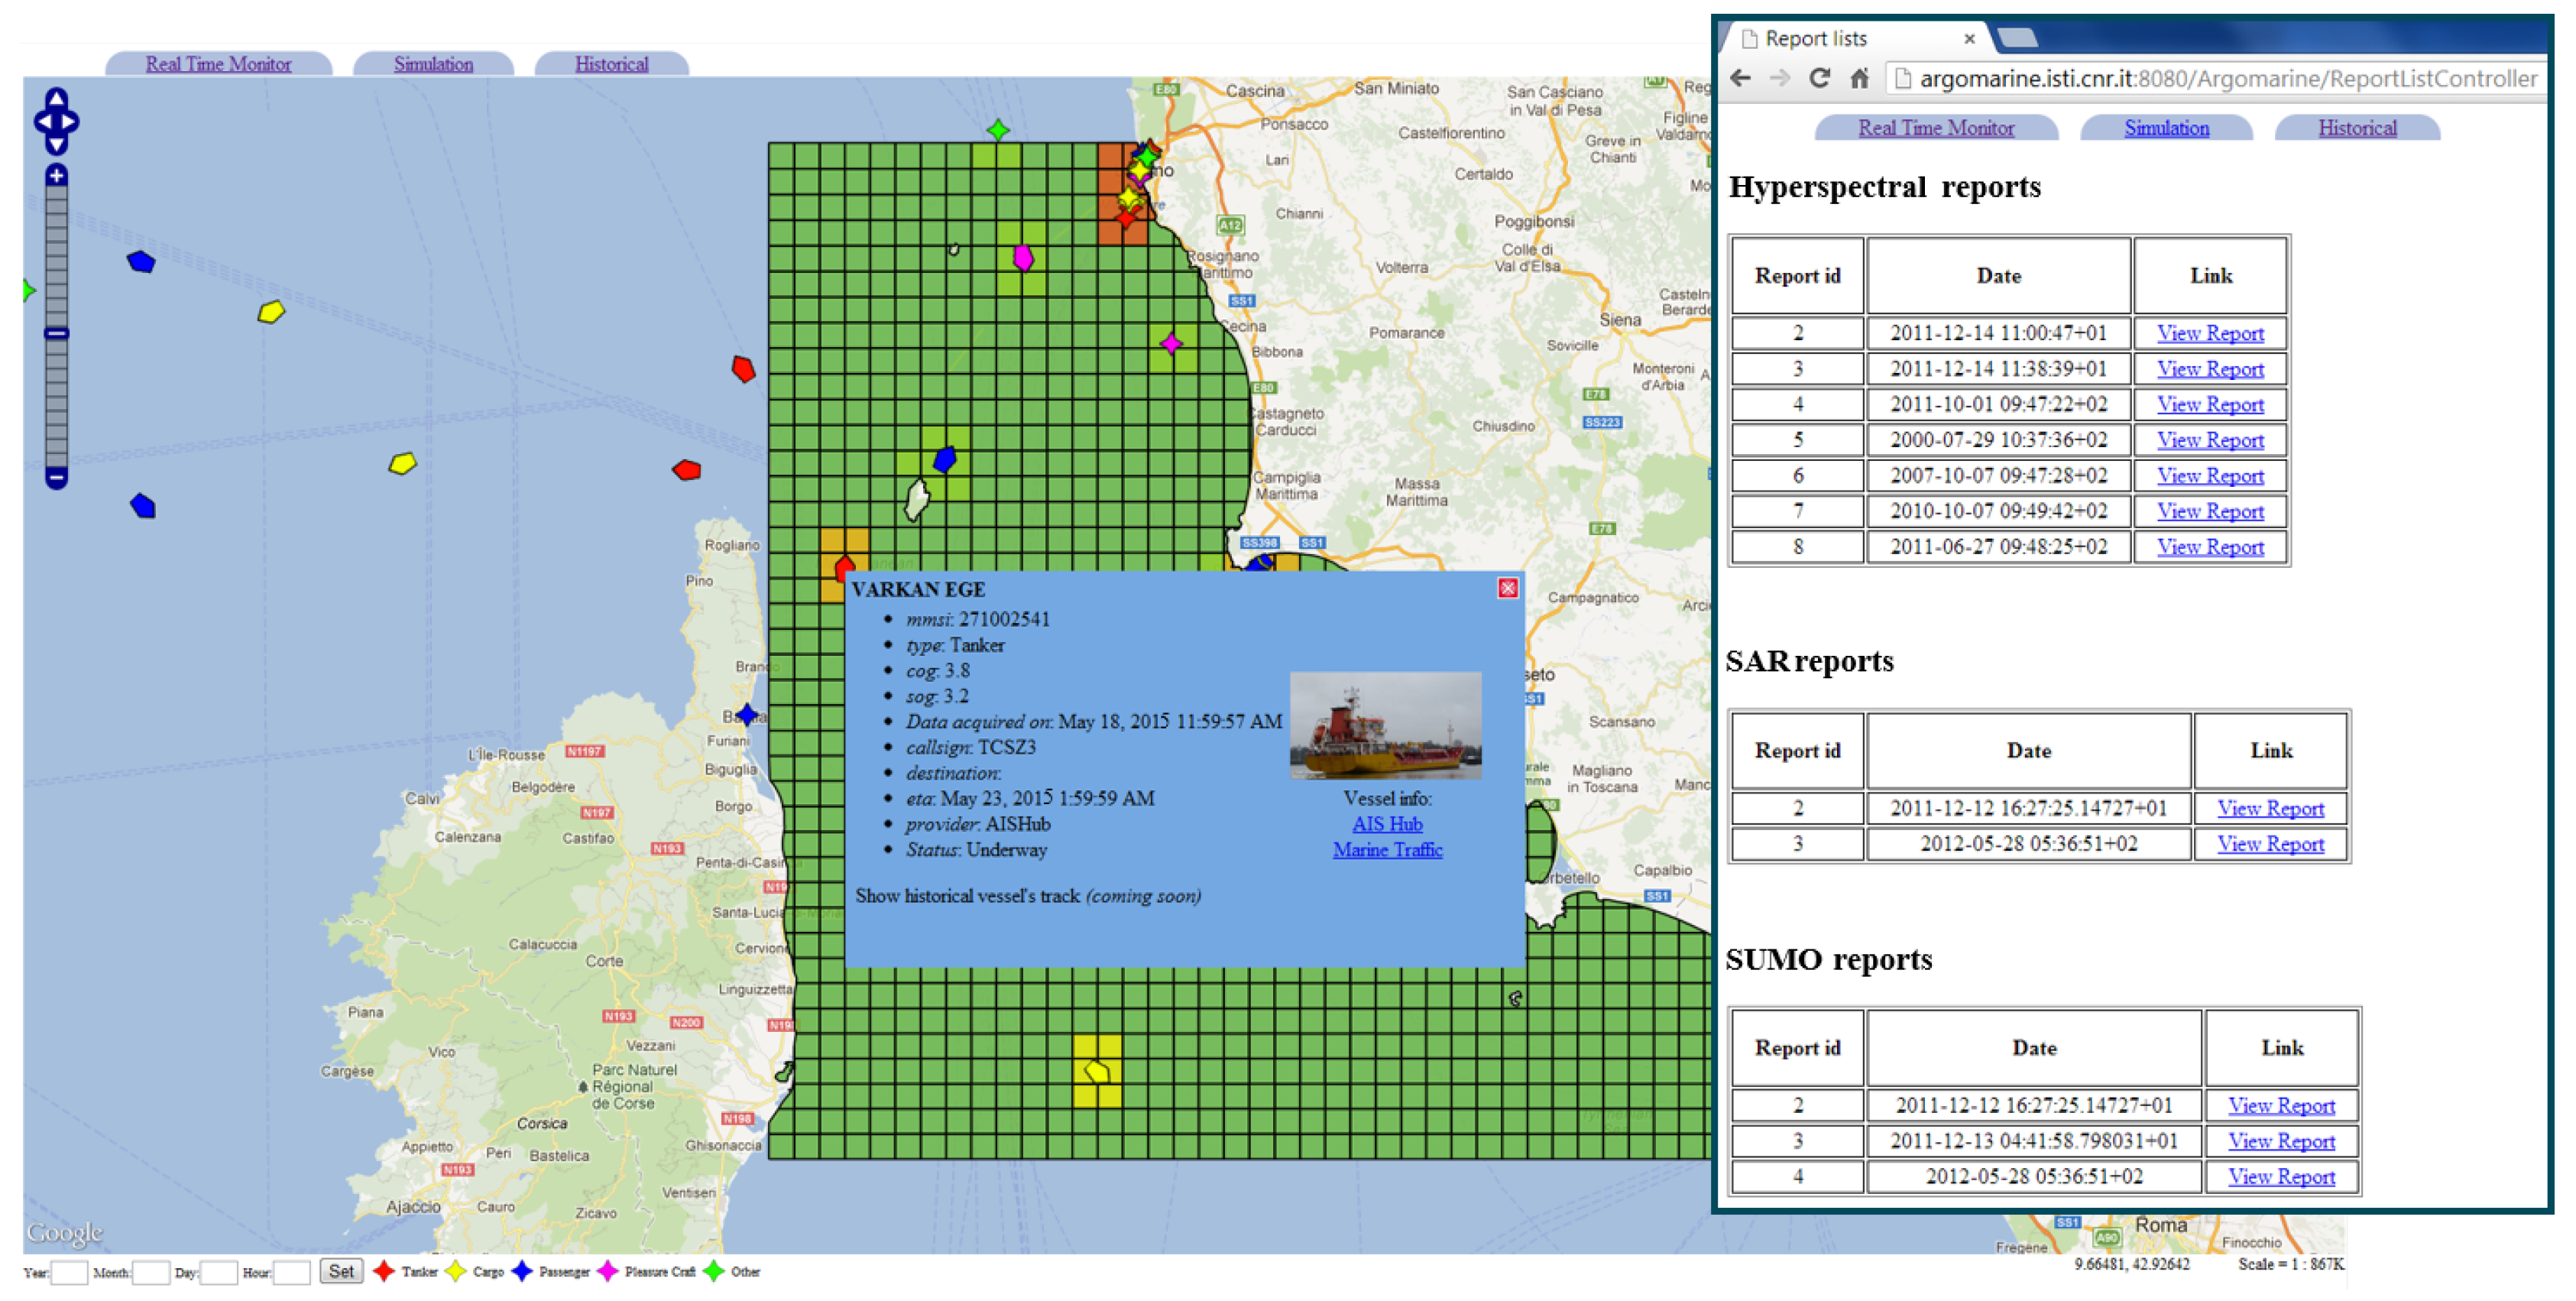
Figure 5.
MIS interface showing acquired data from drifting buoys sensors as an overlay layer on the map. (scale 1 cm:2 km).
Figure 5.
MIS interface showing acquired data from drifting buoys sensors as an overlay layer on the map. (scale 1 cm:2 km).
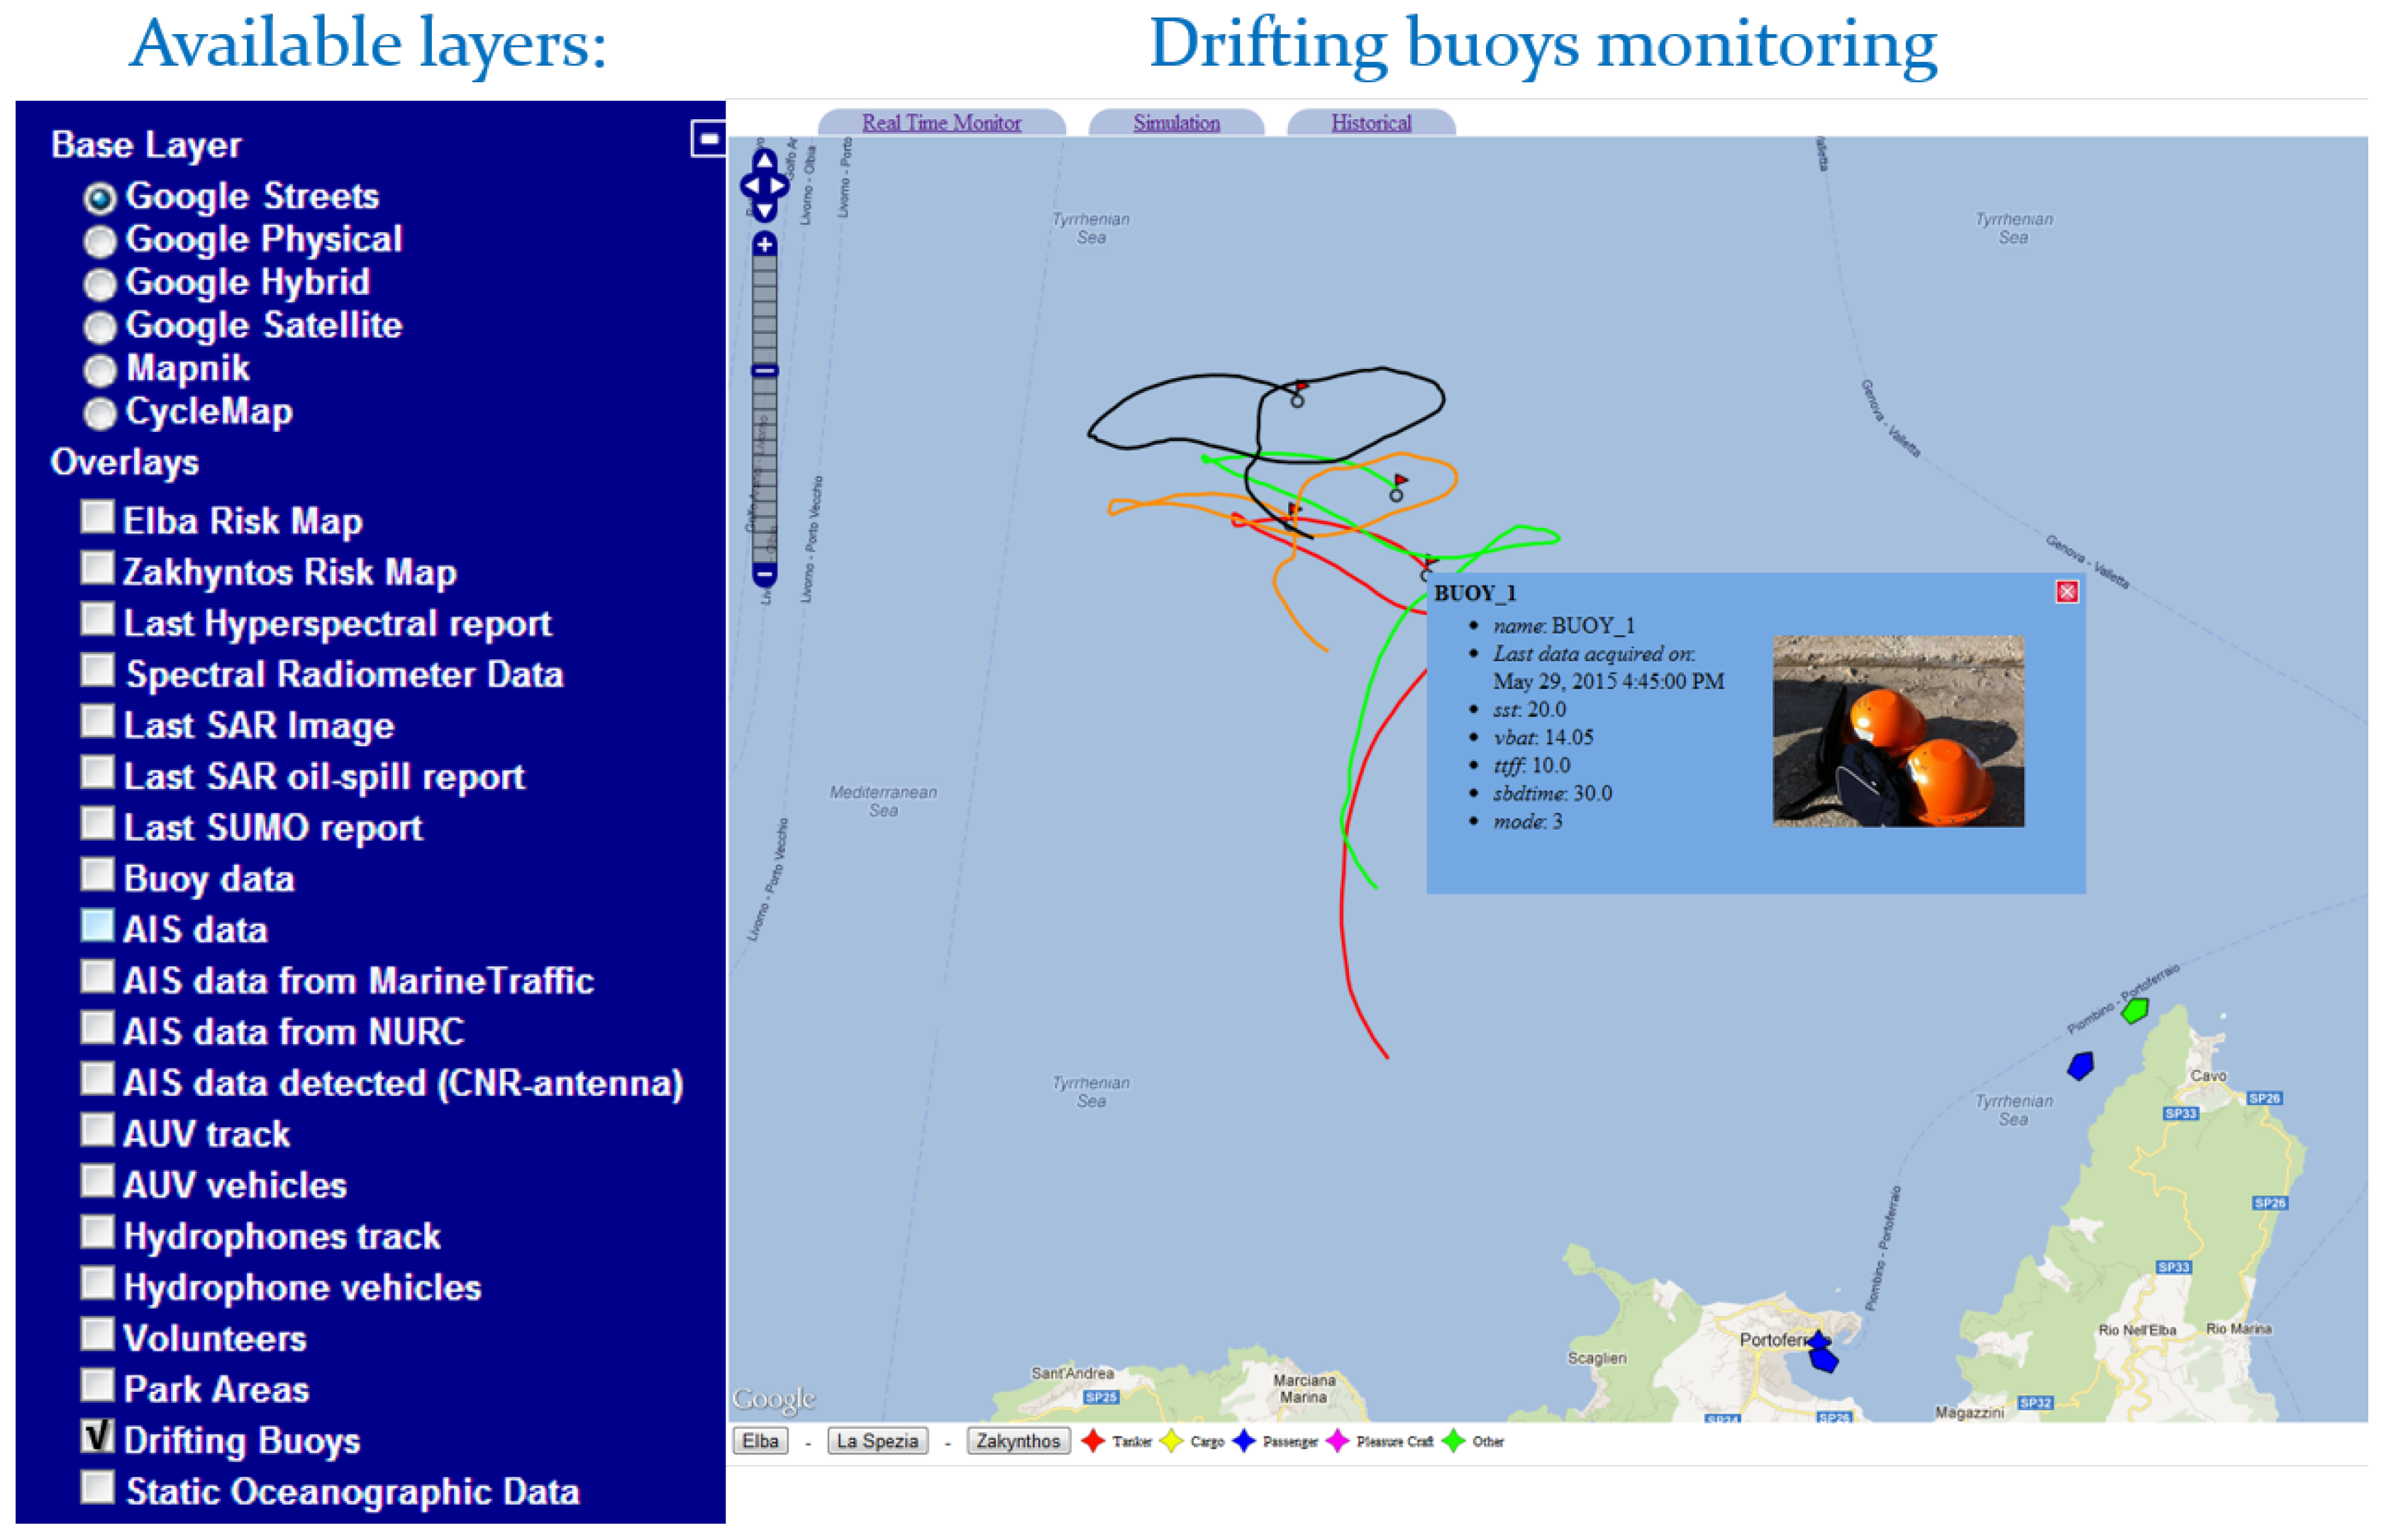
Figure 6.
Example of the MIS interface operating: (a), the generating event detected from a sensor is processed and transmitted to the MIS; (b), the DSS generates a preliminary alert, the risk map is modified dynamically, and a warning is eventually sent to the responsible authorities. (dynamic risk map scale: each square is 1 ).
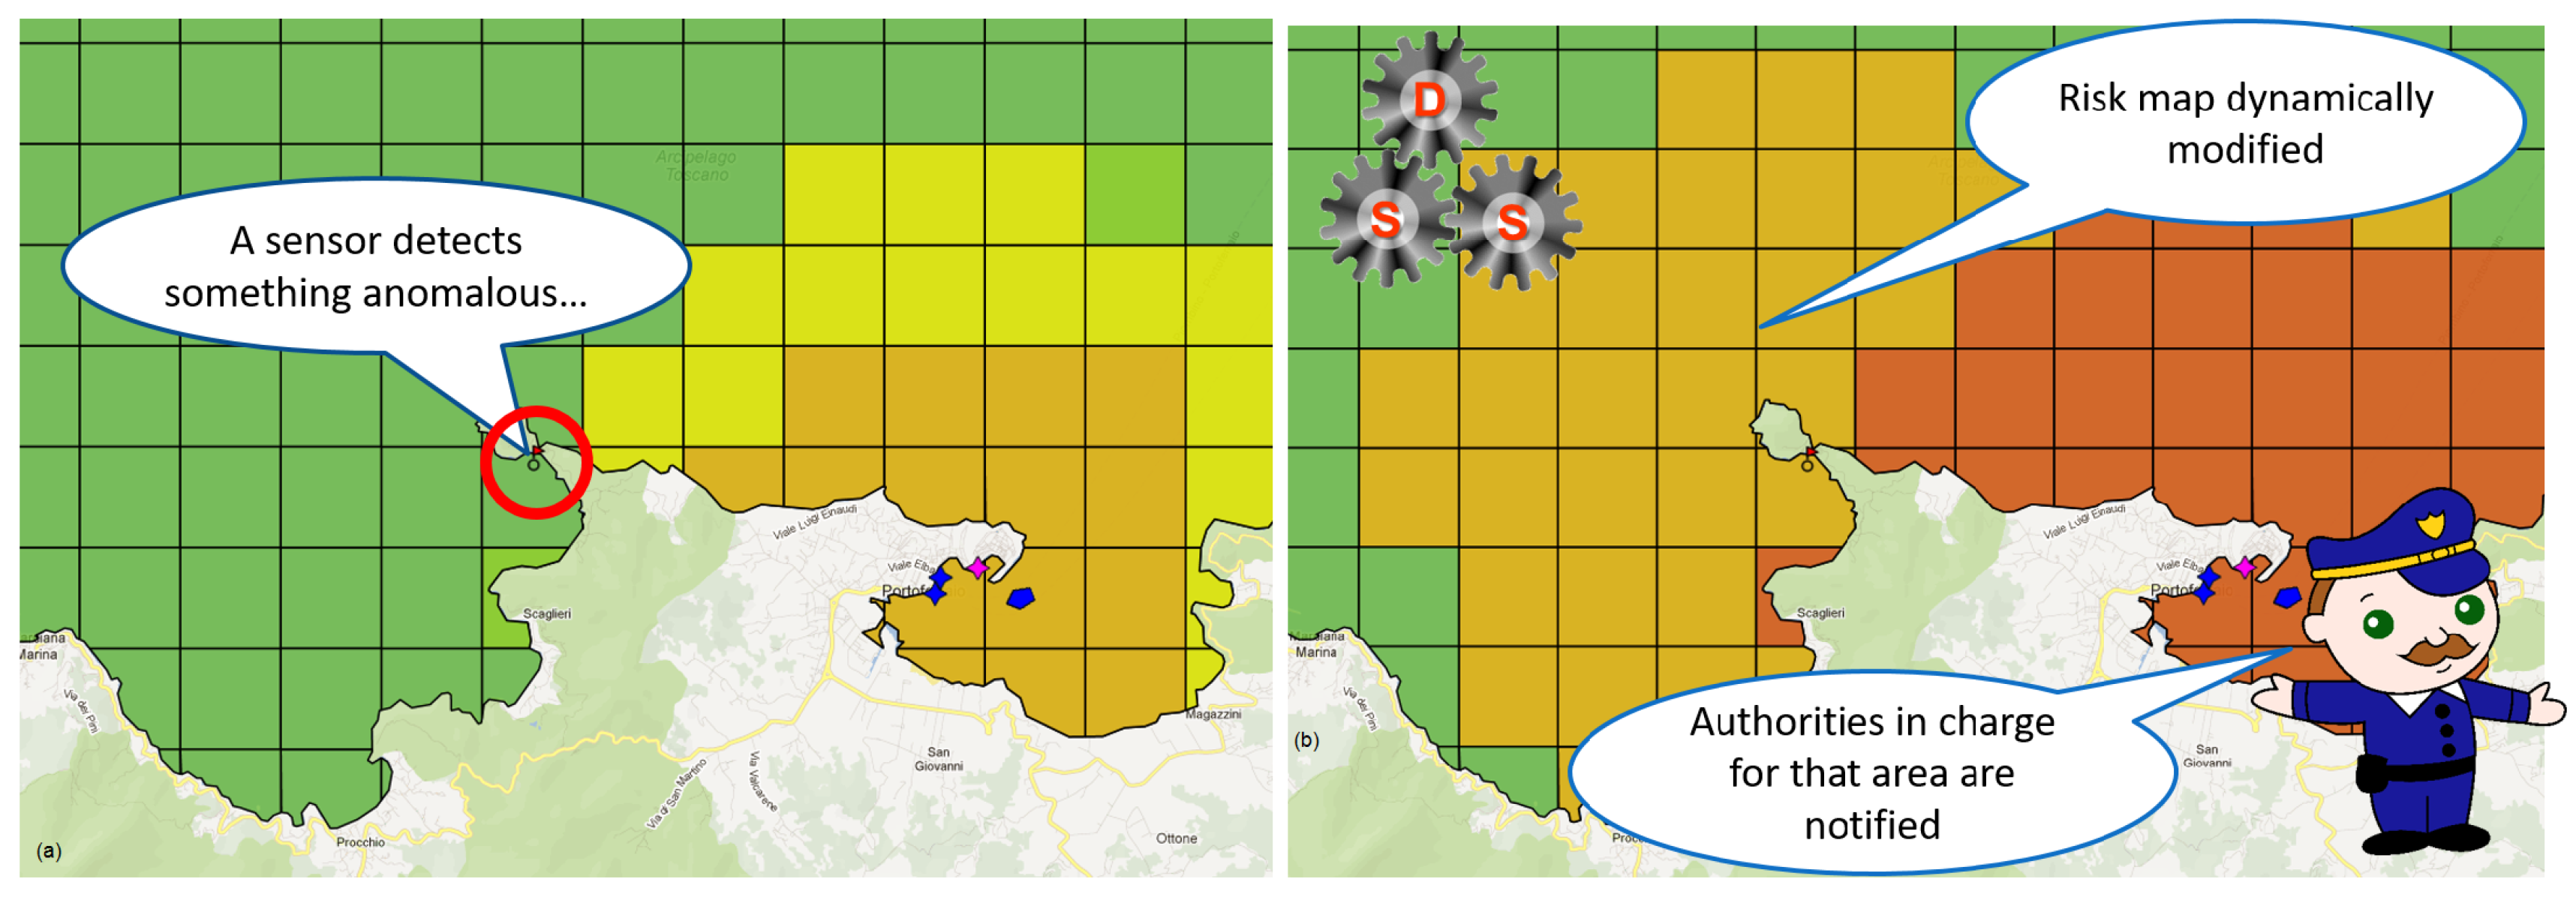
Figure 7.
Example of cross correlation between Synthetic-aperture radar processed data (a) and AIS acquired data (b) following temporal data registration. (scale 1 cm:10 km).
Figure 7.
Example of cross correlation between Synthetic-aperture radar processed data (a) and AIS acquired data (b) following temporal data registration. (scale 1 cm:10 km).
© 2018 by the authors. Licensee MDPI, Basel, Switzerland. This article is an open access article distributed under the terms and conditions of the Creative Commons Attribution (CC BY) license (http://creativecommons.org/licenses/by/4.0/).
Share and Cite
MDPI and ACS Style
Pieri, G.; Cocco, M.; Salvetti, O. A Marine Information System for Environmental Monitoring: ARGO-MIS. J. Mar. Sci. Eng. 2018, 6, 15. https://doi.org/10.3390/jmse6010015
AMA Style
Pieri G, Cocco M, Salvetti O. A Marine Information System for Environmental Monitoring: ARGO-MIS. Journal of Marine Science and Engineering. 2018; 6(1):15. https://doi.org/10.3390/jmse6010015
Chicago/Turabian StylePieri, Gabriele, Michele Cocco, and Ovidio Salvetti. 2018. "A Marine Information System for Environmental Monitoring: ARGO-MIS" Journal of Marine Science and Engineering 6, no. 1: 15. https://doi.org/10.3390/jmse6010015
Note that from the first issue of 2016, this journal uses article numbers instead of page numbers. See further details here.