Quantitative Analysis of 3D Reconstruction Parameters of Multi-Materialsin Soft Clay


1
School of Earth Science and Engineering, Sun Yat-sen University, Guangzhou 510275, China
2
Guangdong Province Key Laboratory of Geological Processes and Mineral Resources, Guangzhou 501275, China
3
Manufacturing BU, The Commonwealth Scientific and Industrial Research Organisation (CSIRO), Clayton, VIC 3168, Australia
*
Author to whom correspondence should be addressed.
J. Mar. Sci. Eng. 2018, 6(1), 23; https://doi.org/10.3390/jmse6010023
Submission received: 10 December 2017
/
Revised: 9 February 2018
/
Accepted: 26 February 2018
/
Published: 5 March 2018
Abstract
:The results of the three-dimensional reconstruction of soil were derived from the X-ray absorption coefficient of the material itself. However, the absorption coefficient is not a fixed value, and is related to densities, chemical molecular weight, and the weight percentages of chemical components. How to accurately obtain the density of one component is a vital issue in multi-materials. In this study, the influence of the physical parameters of each component in the data-constrained modeling (DCM) of the microstructure of soft clay was investigated. The results showed that density changes were more prominent. A reasonable multi-component density was calculated, and the density of organic matter had a significant effect on the volume percentage of three-dimensional soft clay. In the clay mineral montmorillonite, the density significantly affected the volume percentage data, which directly limited the accuracy of the material distribution analysis. Based on this, other physical parameters of each component in the data constraint model could be further explored. Based on the density value of the simple material, a reasonable multi-materials density was calculated, which provides a quantitative method for the evolution analysis of soil structure.
1. Introduction
Soft clay is widely distributed in the coastal plains, deltas, and other areas around the lake basin, and is a kind of soil with special characteristics. It has the characteristics of high water content, large void ratio, and low water permeability. Therefore, the reinforcement of this soft clay foundation is a technical problem in the engineering field [1,2,3]. The interaction of the structural characteristics of the soil constituents is the main object of the study. The complexity of soil properties stems from the differences, changes, and interactions of the physical structure of the various components within the soil [4,5]. Analyzing the basic nature of soil from its structural characteristics is a reliable way of knowing the mechanical performance of the material.
Soft clay has a variety of material components, with a mineral composition mainly consisting of quartz, illite, and montmorillonite, and contains a certain amount of organic matter [6,7,8]. Clay minerals such as montmorillonite and illite in soft clay easily interact with pore water in soil to form a combined electric double layer [9,10]. The organic matter in soil has the characteristics of a loose structure and large compressibility. Its existence reduces the strength of soil [11,12,13].The mechanical properties of soft clay and its special engineering properties all result from the interaction between the various substances. The main material properties of soft clay have a great impact on their overall nature [13,14,15].
Data constrained modeling (DCM), which takes into account the differences in the absorption coefficients of various substances in a variety of samples under the Multi-Energy X-ray (ME), establishes a three-dimensional mathematical model of the soil [16,17,18].For soft clay, DCM can be used to establish a soil three-dimensional structure model with a pixel size above a micron scale [19,20,21,22]. Understanding the influences of the physical parameters of each material component on the overall structure of soft clay is vital. Micro-macro quantitative analysis of soil structures is controlled by the parameters of mineral density.
Based on the density value of simple matter, a reasonable multi-component density can be calculated to provide a quantitative method for soil structure evolution analysis. In this paper, these problems will be discussed, and will provide a theoretical basis for the actual engineering of soft soil foundation reinforcement.
2. Data and Methods
Clay Component Classification Based on the Data Constrained Modelling
Before using the data constrained model to establish the three-dimensional structural model of soft clay, the material composition of soft clay needs to be determined. Using X-ray diffraction and other technical means to obtain the percentage of each element in soft clay, a large number of experimental experience, statistical data, and chemical formula can then be used to calculate the percentage of each mineral in the soft clay content [23,24,25].
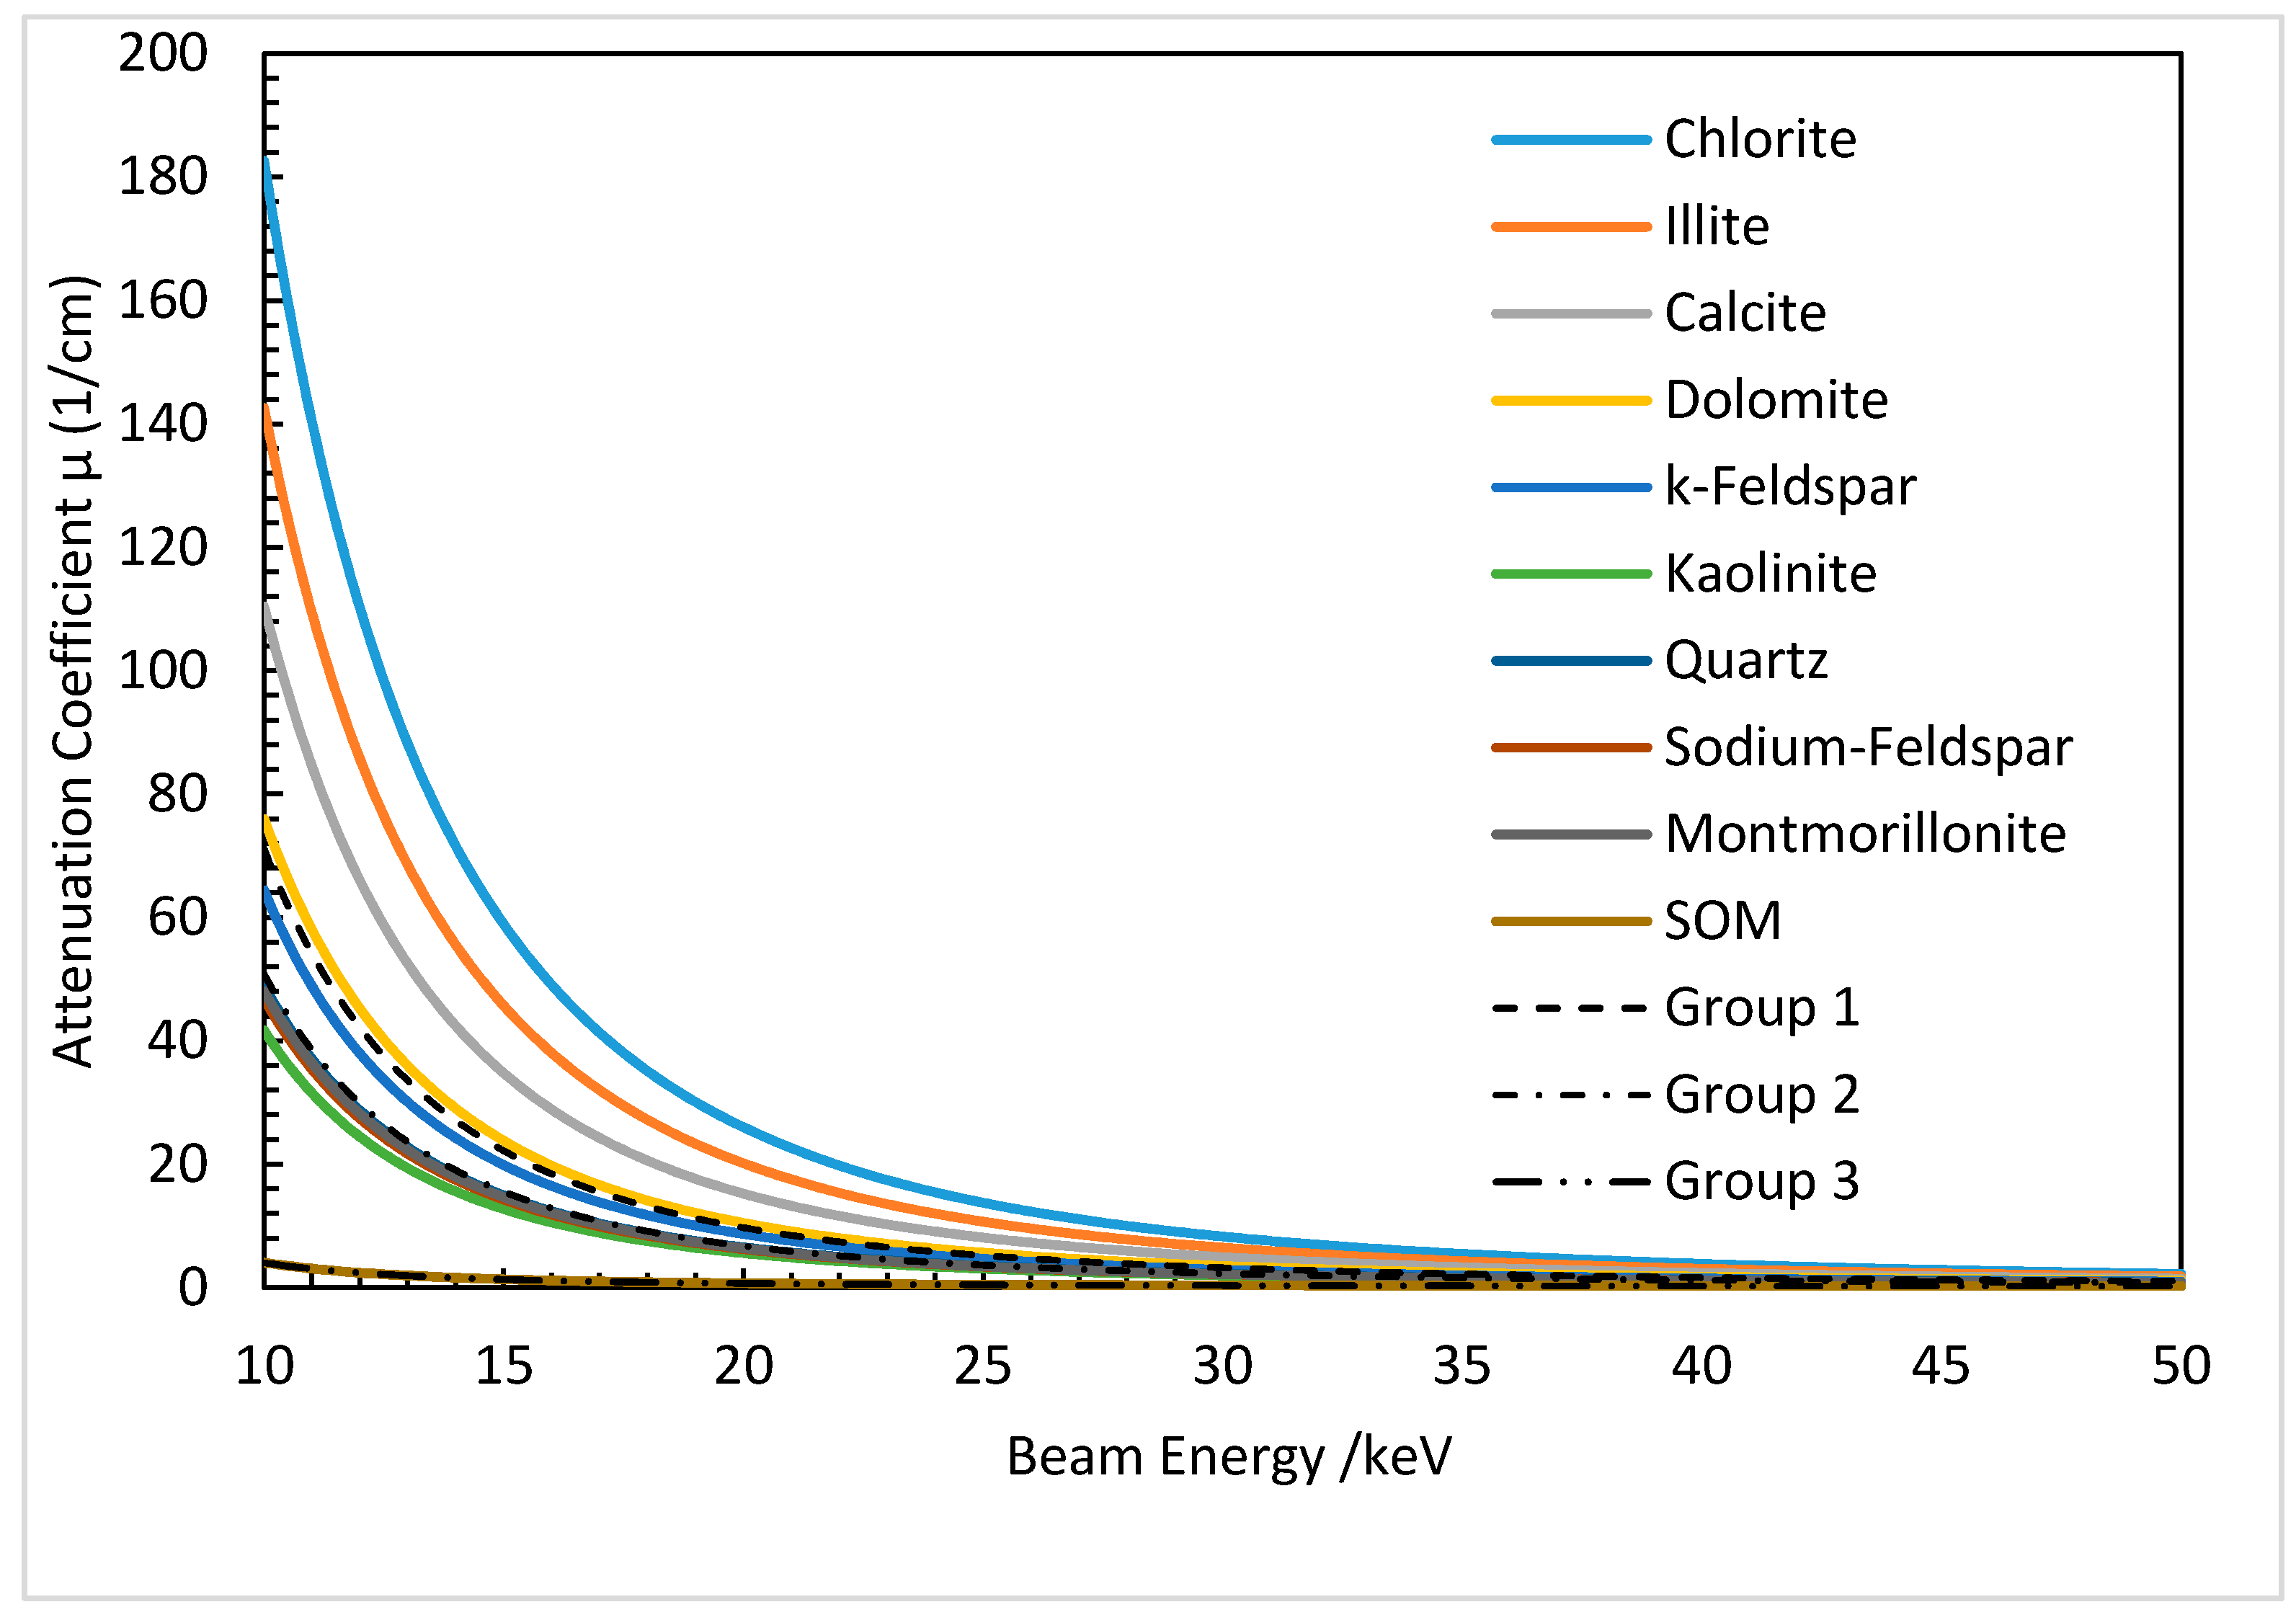
The X-ray absorption coefficient could be obtained by Data Constrained Modelling software [19]. The nonlinear constraint algorithm was used in DCM to minimize the discrepancy between the expected and the measured linear absorption coefficients, and maximizes the Boltzmann distribution probability. Firstly, the chemical equation of each mineral component was defined by X-Ray Diffraction (XRD). Organic matter content was measured in Guangdong Province Key Laboratory of Geological Processes and Mineral Resources. The measurement method was loss on ignition method. In this experiment, the raw material dried at 105–110 °C is dried at 1000–1100 °C, and then the dried soil samples were burned under high temperature. The organic matter and the molecules of the bound water are destroyed and lost. Calculating organic matter according to the lost weight after calcination is a reliable measure of the organic matter content. Secondly, the content of each mineral component was calculated by the XRD and X-Ray Fluorescence(XRF) experimental data. Thirdly, the X-ray absorption of each substance in the soil was obtained by DCM software. Finally, the curves shown in Figure 1 were obtained.
According to the X-ray absorption coefficient image, it can be seen that the change characteristics of the X-ray absorption coefficient of organic matter were obviously different from those of other minerals (Figure 1). This is a significant difference between the composition and structure of organic matter and other minerals. In the component classification, the organic matter and other material components can be distinguished alone as a three-dimensional soft clay microstructure established a group. Therefore, the soft clay material composition was divided into three groups: pores, minerals, and organic matter.
According to the above method based on X-ray diffraction experiments, the results of the Daya Bay soft clay material composition and its content are shown in Table 1.
3. Resultsand Discussions
3.1. The Effect of the Density of Organic Matter on the Percentage
According to the lost weight after calcination calculating organic matter is a reliable measure of the organic matter content. The calculation process is as follows. First, set the organic chemical formula CHON, according to the reference to find the formula. Calculate the number of moles based on the mass percentage of organic matter, then calculate the chemical element subscript based on the volume percentage.
According to the parameters in Table 2 and the X-ray diffraction experiments, the DCM was run to calculate the organic chemical formula as following: O0.04798C0.11812H0.10151N0.00738.
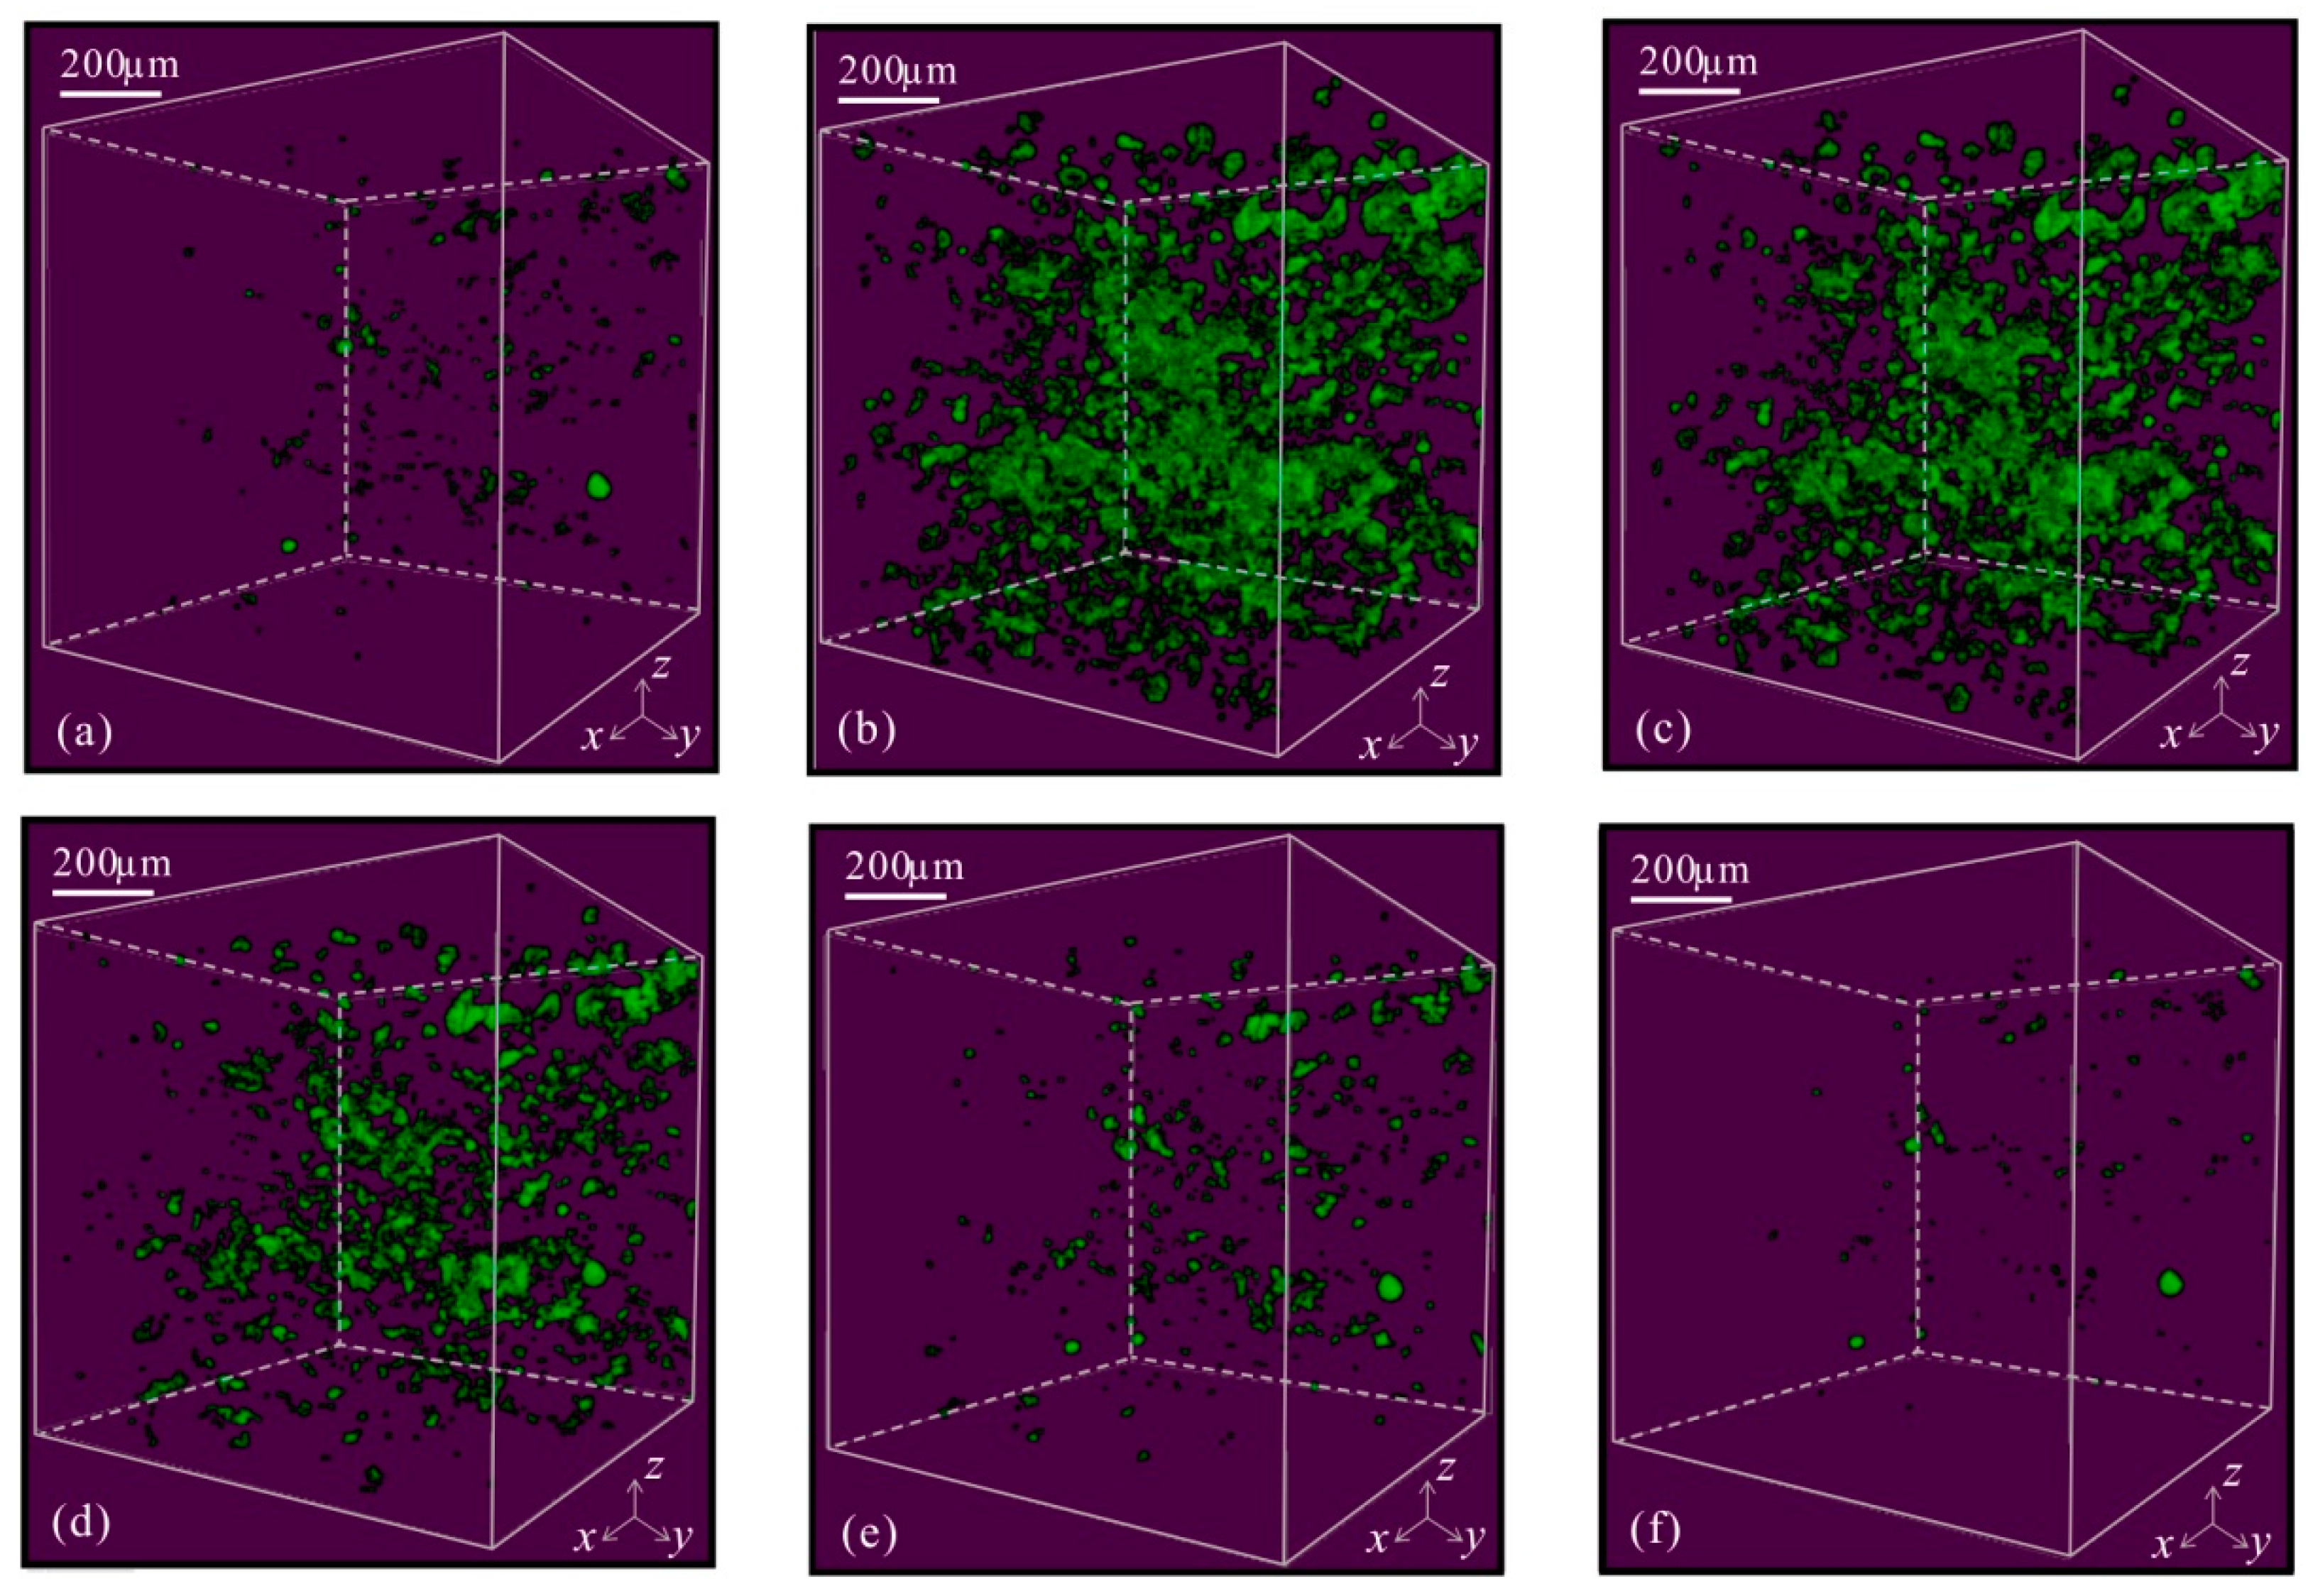
The density of organic matter was adjusted at 1.0, 1.10, 1.15, 1.20, 1.25, 1.30, and 1.40 g/cm3. It can be seen that the microscopic three-dimensional structural model of soft clay had a significant change by DCM. The microscopic three-dimensional structure of soft clay was obtained under different organic matter densities. The volume percentage was the observation and comparison as shown in Figure 2.
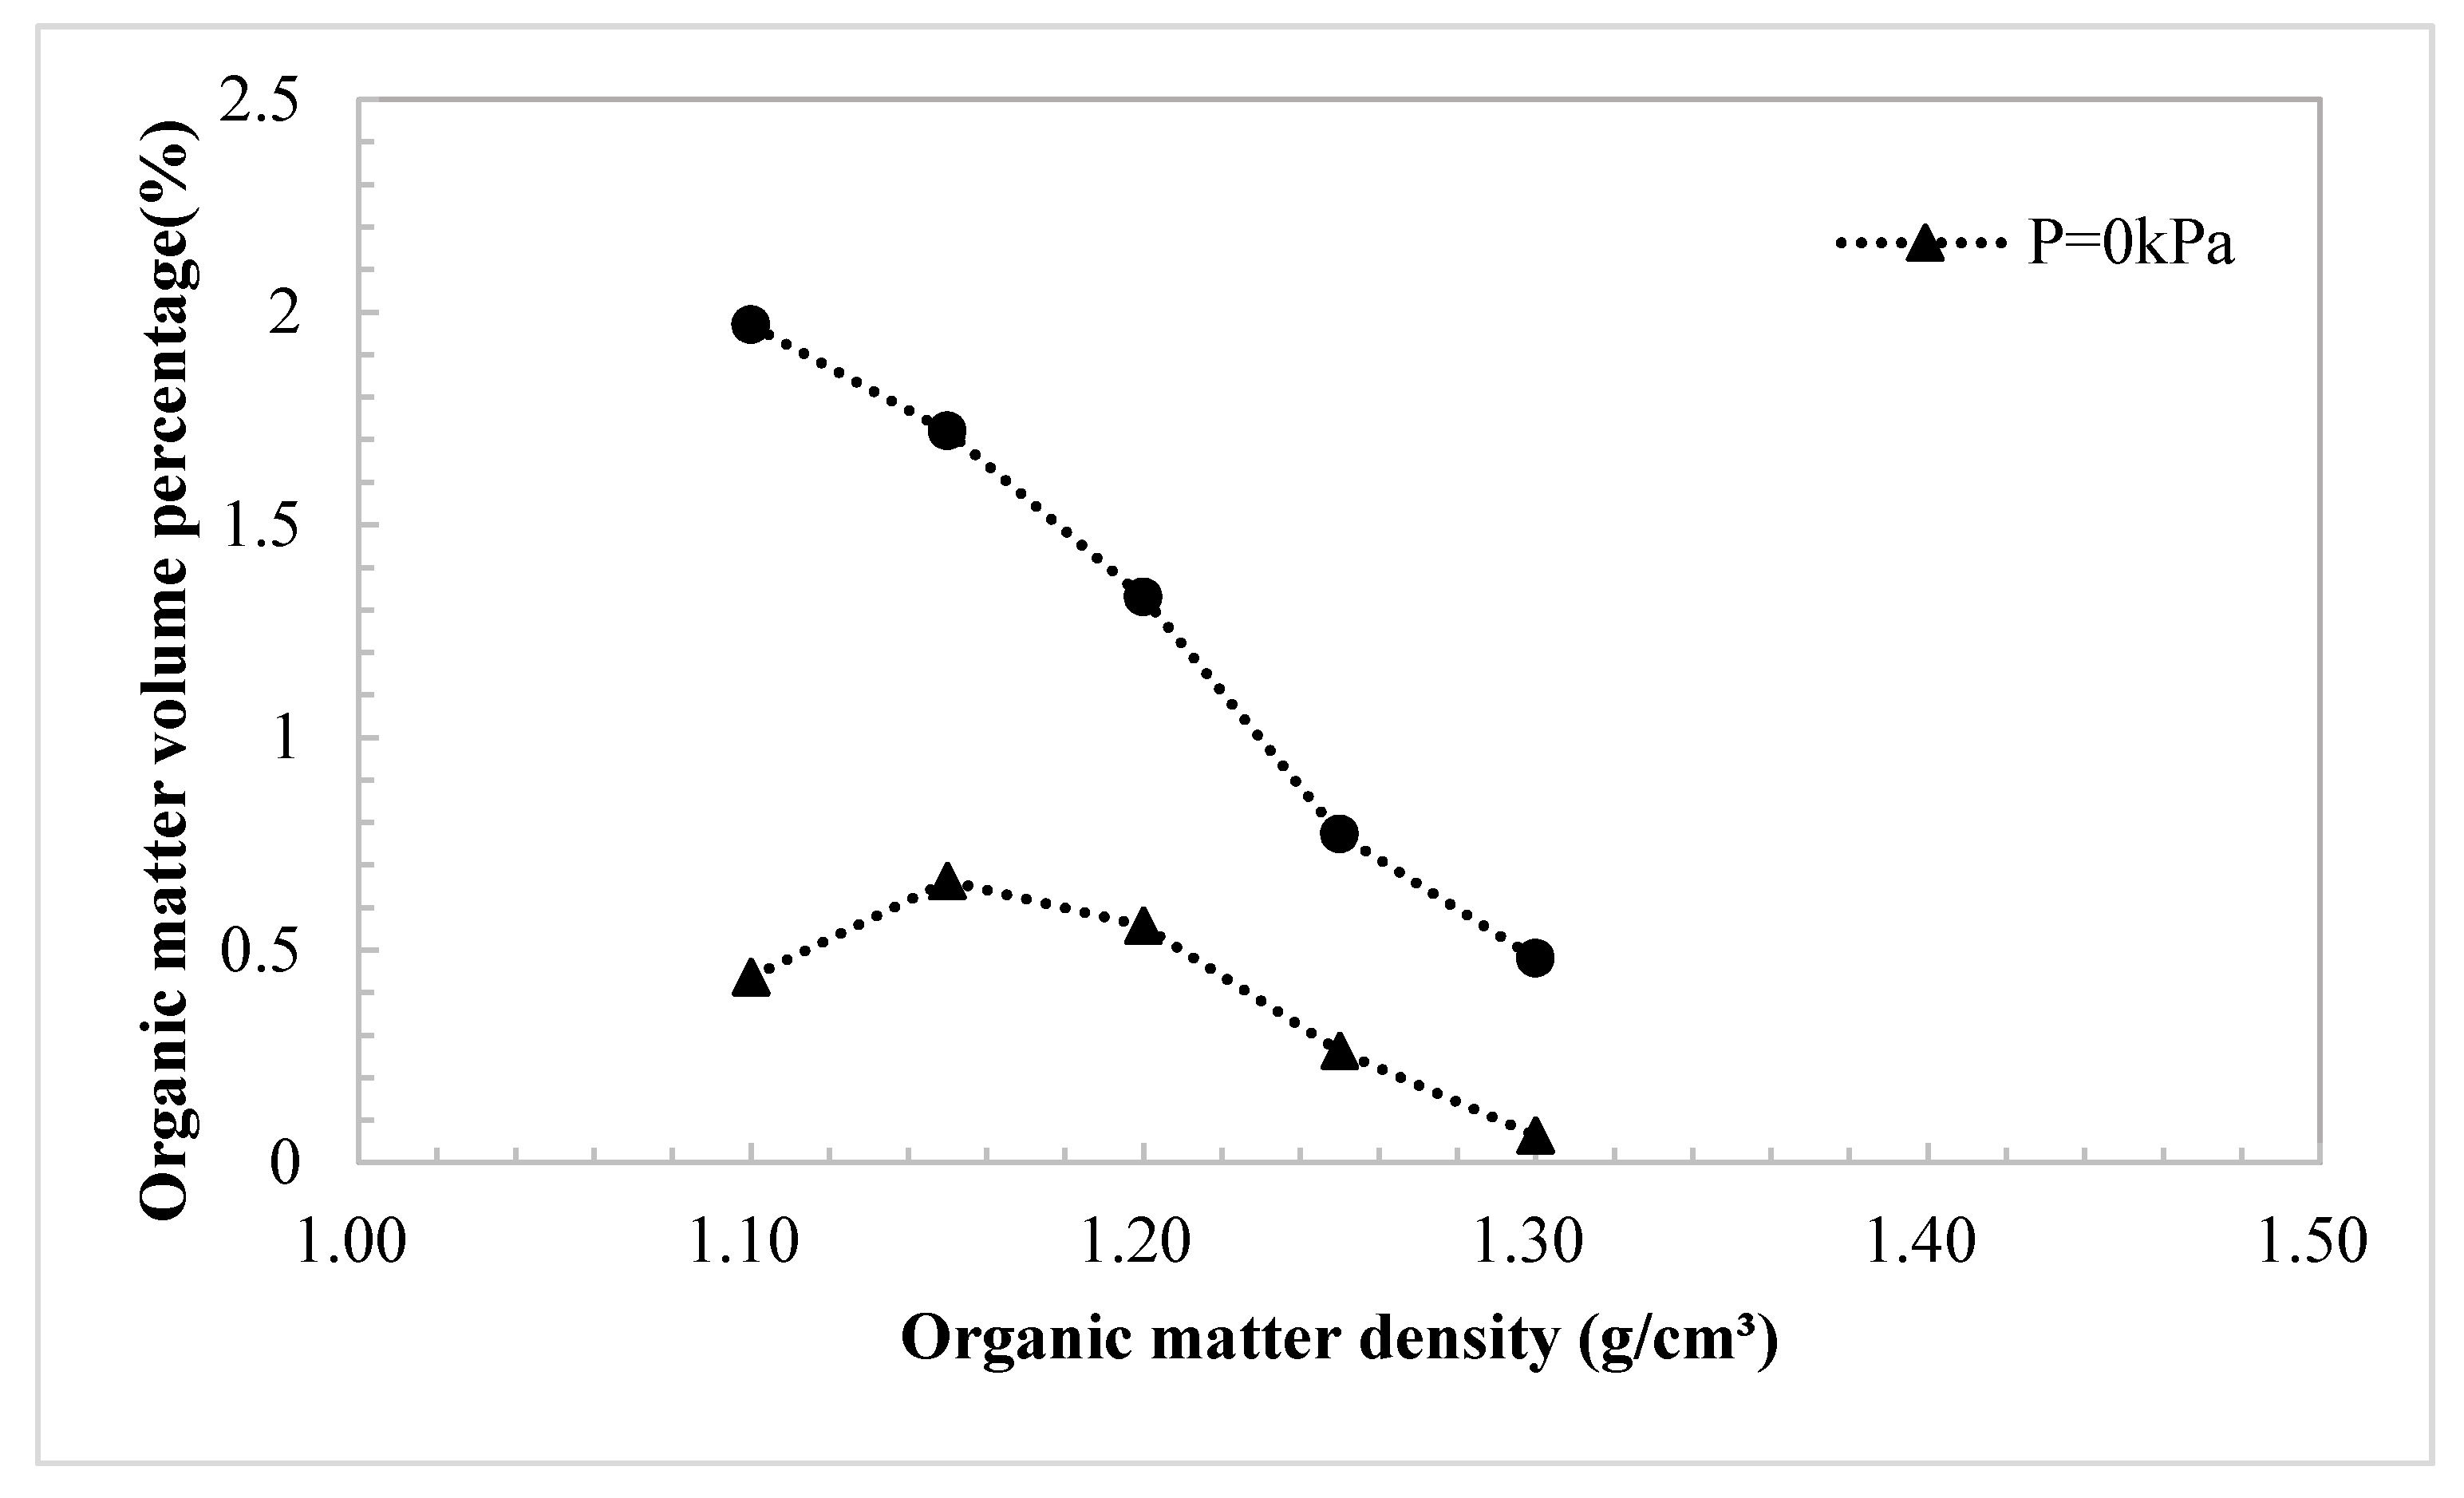
From the calculated structure of DCM, it can be seen that with the increase of the density of organic components, the volume ratio of organic components in the voxels first increased, then decreased. At the density of 1.10 g/cm³ for the volume of organic components, there was the largest volume percentage. The obtained data was plotted as a graph, which could more directly reflect the influence of the organic matter component density in the soft clay on the volume percentage of the soft clay, as shown in Figure 3.
The results of the DCM fitting reflected that under constant consolidation pressure, the volume percent of organic matter decreased with increasing density. As the pressure increased, the volume percent of organic matter in the sample increased. At the same time, when comparing the calculated result of DCM and the experimental result of organic matter, the volume percentage under different pressure was similar to the experimental result when the density was 1.2.
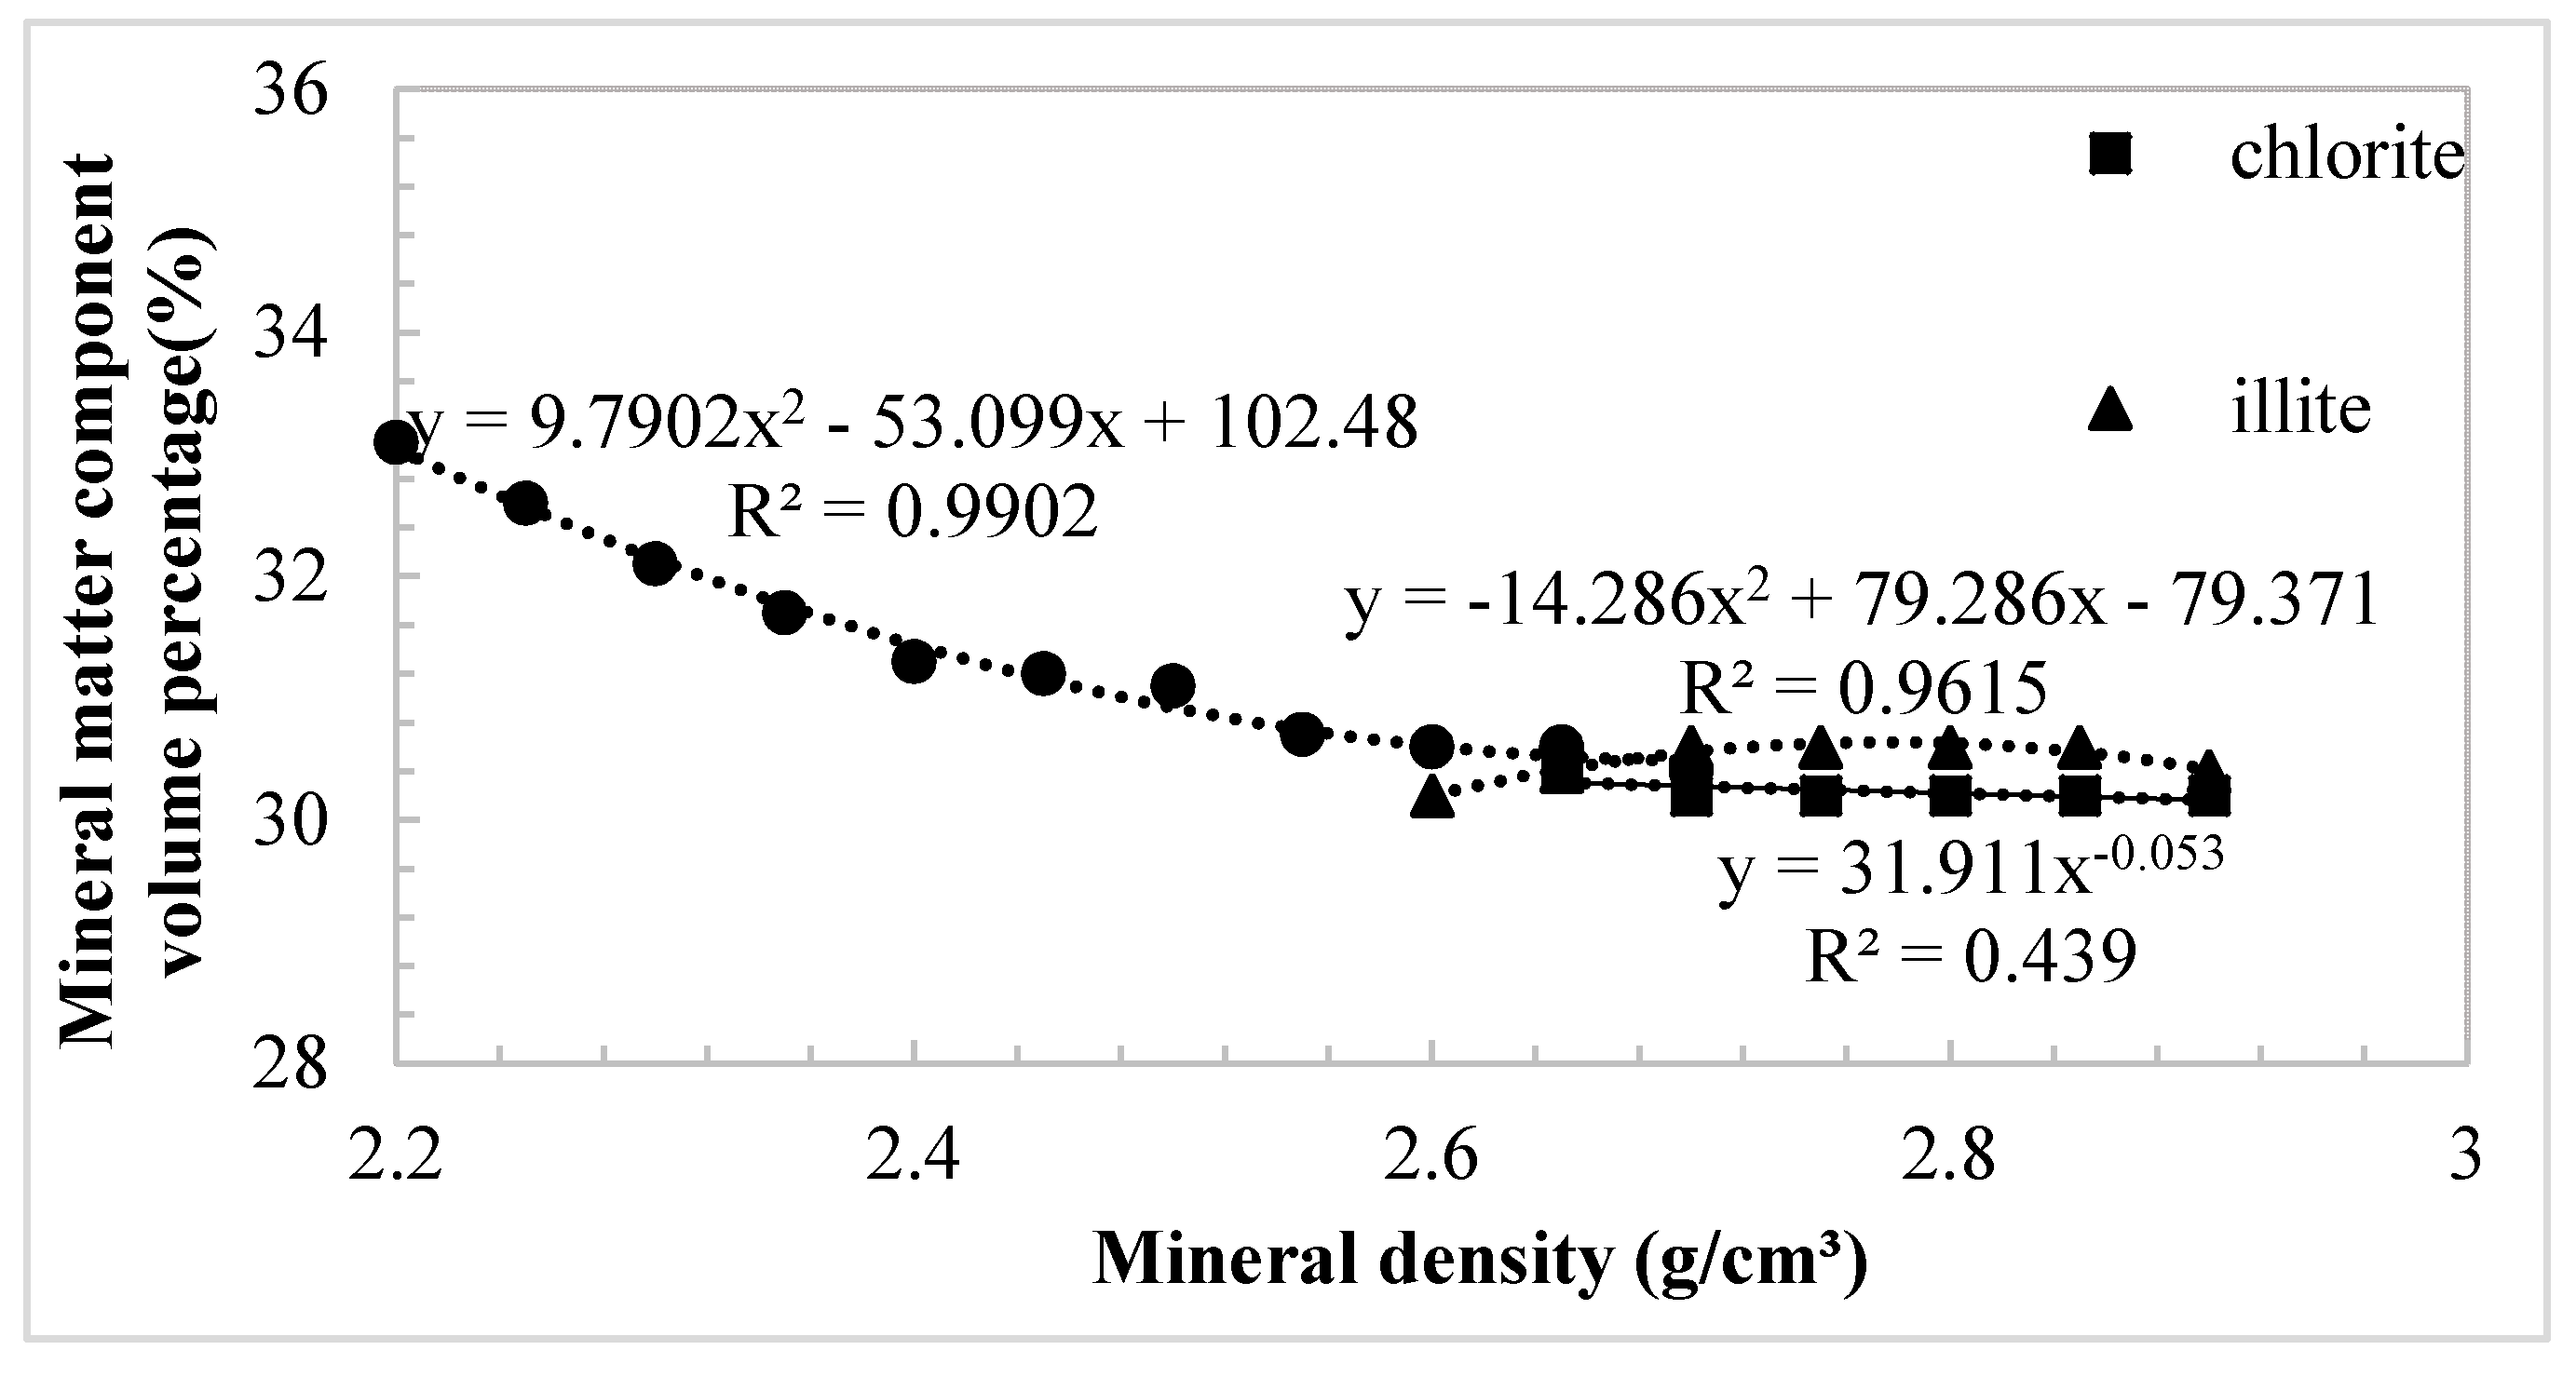
3.2. The Effect of the Density of Clay Minerals on the Percentage
The chlorite mineral has the formula(Mg,Fe,Al)6(Si,Al)4O8(OH)8 and its density varies from 2.65 to 2.90. The chlorite mineral content changed after the density change of chlorite, as shown in Table 3.
It can be seen from the table that the density of the entire mineral composition did not vary with the density of chlorite. By calculating the DCM of 2.73 and 2.72 for the mineral composition, the volume ratio of each material component was obtained. The volume fraction of the pore volume was 69.3% and the density of the whole mineral component was 2.73. The volume fraction of the mineral component was 30.2% and the density of the whole mineral component was 2.72. When the volume percentage of organic matter was 0.557%, the volume percentage of pore volume was 69.2%, the volume percentage of mineral component was 30.48%, and the volume percentage of organic matter was 0.558%. Visible chlorite density changes on the percentage of the entire soft clay material had little effect.
The chemical formula of illite is K2H8O26Si8Al4Mg4Fe4, which has a density range of 2.60–2.90. The density of total mineral components after the change in illite density was calculated. Table 3shows the percentage of each component with different illite densities. From the three-dimensional microstructure diagram, it can be seen that when the density of organic components changed, the value of volume percentage of organic matter was broadly stable. Therefore, the microstructure of soft clay was not sensitive to the change of illite density.
Montmorillonite has the chemical formula O16H8Si8Al4 and its density varies from 2.60 to 2.90 [27,31]. The density of the total mineral components after the montmorillonite density change was calculated, as shown in Table 3.
Using the above data, the relationship between the volume percentage of each component and the density, and more intuitively observed the influence of the density of each mineral component in the soft clay on the volume percentage of the mineral component, as shown in Figure 4.
4. Conclusions
In this study, the influence of the physical parameters of each component on the microstructure of soft clay was investigated and the following conclusions were drawn.
- (1)
- Based on the density value of the simple material, combined with the volume and mass percentage of the material, a reasonable multi-component density was calculated. The microstructure of soft clay was not sensitive to the change of illite density.
- (2)
- The density significantly affected the volume percentage data, which directly limited the accuracy of the material distribution analysis. The organic component was the most significant parameter. Montmorillonite, as one of the clay minerals, was the most sensitive material in soil.
Acknowledgments
The study was financially supported by the Natural Science Foundation of China (41402239, 41572277), the Natural Science Foundation of Guangdong Province China (S2012040007331), the National Basic Research Program of China (2014CB239004), the Foundation for University Young Teacher by the Ministry of Sun Yat-sen University (13lgpy63). Thanks to students for their supporting on the work and the reviewer’s valuable comments. YS Yang would like to acknowledge hospitality by Shanxi University.
Author Contributions
J.S. is mainly responsible for the experiment and analyzing the data. Z.L. did experiments, data processing and wrote the paper. Y.Y. is the inventor of data constrained modelling technology which was used in analyzing. X.L. set up the model and adjusted parameters.
Conflicts of Interest
The authors declare no conflict of interest.
References
- Le, T.M.; Fatahi, B.; Khabbaz, H. Numerical optimisation to obtain elastic viscoplastic model parameters for soft clay. Int. J. Plast. 2015, 65, 1–21. [Google Scholar] [CrossRef]
- Hu, X.; Zhang, Y.; Guo, L.; Wang, J.; Cai, Y.; Fu, H.; Cai, Y. Cyclic behavior of saturated soft clay under stress path with bidirectional shear stresses. Soil Dyn. Earthq. Eng. 2018, 104, 319–328. [Google Scholar] [CrossRef]
- Sun, L.; Gu, C.; Wang, P. Effects of cyclic confining pressure on the deformation characteristics of natural soft clay. Soil Dyn. Earthq. Eng. 2015, 78, 99–109. [Google Scholar] [CrossRef]
- Cui, Z.D.; Tang, Y. Microstructures of different soil layers caused by the high-rise building group in Shanghai. Environ. Earth Sci. 2011, 63, 109–119. [Google Scholar] [CrossRef]
- Buck, B.J.; Brock, A.L.; Johnson, W.H.; Ulery, A.L. Corrosion of depleted uranium in an arid environment: Soil-geomorphology, SEM/EDS, XRD, and electron microprobe analyses. Soil Sediment Contam. 2004, 13, 545–561. [Google Scholar] [CrossRef]
- Seaman, J.C. Thin-Foil SEM Analysis of soil and groundwater colloids: Reducing instrument and operator bias. Environ. Sci. Technol. 2000, 34, 187–191. [Google Scholar] [CrossRef]
- Guyot, J.L.; Jouanneau, J.M.; Soares, L.; Boaventura, G.R.; Maillet, N.; Lagane, C. Clay mineral composition of river sediments in the Amazon Basin. Catena 2007, 71, 340–356. [Google Scholar] [CrossRef]
- Steinke, S.; Hanebuth, T.J.J.; Vogt, C.; Stattegger, K. Sea level induced variations in clay mineral composition in the southwestern South China Sea over the past 17,000 yr. Mar. Geol. 2008, 250, 199–210. [Google Scholar] [CrossRef]
- Kennedy, M.J.; Pevear, D.R.; Hill, R.J. Mineral surface control of organic carbon in black shale. Science 2002, 295, 657–660. [Google Scholar] [CrossRef] [PubMed]
- Blachier, C.; Jacquet, A.; Mosquet, M.; Michot, L.; Baravian, C. Impact of clay mineral particle morphology on the rheological properties of dispersions: A combined X-ray scattering, transmission electronic microscopy and flow rheology study. Appl. Clay Sci. 2014, 87, 87–96. [Google Scholar] [CrossRef]
- Markgraf, W.; Watts, C.W.; Whalley, W.R.; Hrkac, T.; Horn, R. Influence of organic matter on rheological properties of soil. Appl. Clay Sci. 2012, 64, 25–33. [Google Scholar] [CrossRef]
- Schulten, H.R.; Leinweber, P.; Sorge, C. Composition of organic matter in particle-size fractions of an agricultural soil. Eur. J. Soil Sci. 1993, 44, 677–691. [Google Scholar] [CrossRef]
- Shen, Y.H. Sorption of humic acid to soil: The role of soil mineral composition. Chemosphere 1999, 38, 2489–2499. [Google Scholar] [CrossRef]
- Rathossi, C.E.; Lampropoulou, P.G.; Skourlis, K.C.; Katagas, C.G. Mineralogy and microfabrics of claybearing sediments of NE Peloponnese (Greece): Indices for physical behaviour in civil engineering works. Clay Mine. 2012, 47, 259–274. [Google Scholar] [CrossRef]
- Ma, R.; Cai, C.; Li, Z.; Wang, J.; Xiao, T.; Peng, G.; Yang, W. Evaluation of soil aggregate microstructure and stability under wetting and drying cycles in two Ultisols using synchrotron-based X-ray micro-computed tomography. Soil Tillage Res. 2015, 149, 1–11. [Google Scholar] [CrossRef]
- Sleutel, S.; Leinweber, P.; Van Ranst, E.; Kader, M.A.; Jegajeevagan, K. Organic matter in clay density fractions from sandy cropland soils with differing land-use history. Soil Sci. Soc. Am. J. 2011, 75, 521–532. [Google Scholar] [CrossRef]
- Wang, Y.D.; Yang, Y.S.; Cole, I.; Trinchi, A.; Xiao, T.Q. Investigation of the microstructure of an aqueously corroded zinc wire by data-constrained modelling with multi-energy X-ray CT. Mater. Corros. 2013, 64, 180–184. [Google Scholar] [CrossRef]
- Yang, S.; Gao, D.C.; Muster, T.; Tulloh, A.; Furman, S.; Mayo, S.; Trinchi, A. Microstructure of a paint Primer—A data-constrained modeling analysis. Mater. Sci. Forum 2010, 654–656, 1686–1689. [Google Scholar] [CrossRef]
- Yang, Y.S.; Tulloh, A.; Chen, F.; Liu, K.Y.; Clennell, B.; Taylor, J. Data-constrained characterization of sandstone microstructures with multi-energy X-ray CT. J. Phys. 2013, 463, 12048. [Google Scholar] [CrossRef]
- Liu, Z.; Song, J.; Li, X.; Yang, Y.; Ren, Y. Three-dimensional characterization of mineral and organic compositions in process of consolidation of saturated fine-grained soil. J. Eng. Geol. 2017, 8, 273–281. [Google Scholar] [CrossRef]
- Xue, L.I.; Liu, Z.Q.; Song, J.; Yang, Y.S. Micro-Macro characteristics of organic matters in dredger fill consolidation. Period. Ocean Univ. China 2017, 47, 28–35. [Google Scholar] [CrossRef]
- Song, J.; Yang, S.; Ren, Y.Q.; Chu, C.; Maksimenko, A.; Mayo, S. Microstructure Characterizations of Saturated Fine-Grained Soil in Consolidation Process; v3. CSIRO Data Collection; CSIRO: Canberra, Australia, 2017. [Google Scholar] [CrossRef]
- Reijneveld, A.; Wensem, J.V.; Oenema, O. Soil organic carbon contents of agricultural land in the Netherlands between 1984 and 2004. Geoderma 2009, 152, 231–238. [Google Scholar] [CrossRef]
- Golchin, A.; Clarke, P.; Baldock, J.A.; Higashi, T.; Skjemstad, J.O.; Oades, J.M. The effects of vegetation and burning on the chemical composition of soil organic matter in a volcanic ash soil as shown by 13C NMR spectroscopy. I. Whole soil and humic acid fraction. Geoderma 1997, 76, 155–174. [Google Scholar] [CrossRef]
- Fang, X.; Chua, T.; Schmidt-Rohr, K.; Thompson, M.L. Quantitative 13C NMR of whole and fractionated Iowa Mollisols for assessment of organic matter composition. Geochim. Cosmochim. Acta 2010, 74, 584–598. [Google Scholar] [CrossRef]
- Joswig, W. Neutron Diffraction Study of a One-Layer Monoclinic Chlorite. Clays Clay Miner. 1989, 37, 511–514. [Google Scholar] [CrossRef]
- Hong, H.; Fang, Q.; Cheng, L.; Wang, C.; Churchman, G.J. Microorganism-induced weathering of clay minerals in a hydromorphic soil. Geochim. Cosmochim. Acta 2016, 184, 272–288. [Google Scholar] [CrossRef]
- Zanazzi, P.F.; Montagnoli, M.; Nazzareni, S.; Comodi, P. Structural effects of pressure on monoclinic chlorite: A single-crystal study. Am. Mineral. 2006, 91, 1871–1878. [Google Scholar] [CrossRef]
- Vieillard, P. A new method for the prediction of Gibbs free energies of formation of hydrated clay minerals based on the electronegativity scale. Clays Clay Miner. 2000, 48, 459–473. [Google Scholar] [CrossRef]
- Güven, N. Mica Structure and Fibrous Growth of Illite. Clays Clay Miner. 2001, 49, 189–196. [Google Scholar] [CrossRef]
- Ogorodova, L.P.; Kiseleva, I.A.; Melchakova, L.V.; Vigasina, M.F.; Krupskaya, V.V. Thermochemical study of natural montmorillonite. Geochem. Int. 2013, 51, 484–494. [Google Scholar] [CrossRef]
- Harrison, A.D.; Whale, T.F.; Carpenter, M.A.; Holden, M.A.; Neve, L.; O’Sullivan, D.; Vergara Temprado, J.; Murray, B.J. Not all feldspars are equal: a survey of ice nucleating properties across the feldspar group of minerals. Atmos. Chem. Phys. 2016, 16, 10927–10940. [Google Scholar] [CrossRef] [Green Version]
- Fernandez, R.; Martirena, F.; Scrivener, K.L. The origin of the pozzolanic activity of calcined clay minerals: A comparison between kaolinite, illite and montmorillonite. Cem. Concr. Res. 2011, 41, 113–122. [Google Scholar] [CrossRef]
- Wang, H.P.; Yang, Y.S.; Wang, Y.D.; Yang, J.L.; Jia, J.; Nie, Y.H. Data-constrained modelling of an anthracite coal physical structure with multi-spectrum synchrotron X-ray CT. Fuel 2013, 106, 219–225. [Google Scholar] [CrossRef]
Figure 1.
The composition of the X-ray absorption coefficient.

Figure 2.
DCM calculated soft clay three-dimensional microstructure. Each square in the figure represents a voxel unit, and the green color indicates the organic matter component in the voxel. (a) density of organic matter = 1.0; (b)density of organic matter = 1.10; (c)density of organic matter = 1.15; (d) density of organic matter = 1.20; (e) density of organic matter = 1.25;and (f) density of organic matter = 1.4.

Figure 3.
The volume percentage of organic components varies with organic matter density.

Figure 4.
Effect of mineral density on volume percent of soft clay mineral components.

Table 1.
Soft clay material composition.
| Material Name | Molecular Formula | Molecular Weight (g/mol) | Reproduced Densities (g/cm3) | Average Density (g/cm3) | Weight Percentage (%) | |
|---|---|---|---|---|---|---|
| Chlorite [26,27,28] | (Mg,Fe,Al)6(Si,Al)4O8(OH)8 | 1126 | 2.65–2.90 | 2.78 | 2.01 | |
| Illite [29,30] | (K,H2O)2Si8(Al,Mg,Fe)4O20(OH)4 | 1154 | 2.60–2.90 | 2.75 | 19.14 | |
| Calcite [31] | CaCO3 | 100 | 2.60–2.90 | 2.75 | 1.75 | |
| Dolomite [31] | CaMg(CO3)2 | 184 | 2.80–2.86 | 2.83 | 3.79 | |
| K-Feldspar [32] | KNaAlSi3O8 | 301 | 2.50–2.60 | 2.55 | 1.96 | |
| Kaolinite [33] | (OH)8Si4Al4O1 | 516 | 2.60–2.63 | 2.62 | 5.31 | |
| Quartz [34] | SiO2 | 60 | 2.65 | 2.65 | 33.20 | |
| Sodium-Feldspar [32] | NaAlSi3O8 | 262 | 2.61–2.76 | 2.68 | 2.00 | |
| Montmorillonite [33] | (OH)4Si8Al4O102H2O | 596 | 2.20–2.80 | 2.50 | 28.46 | |
| Organic matrix [34] | C64H55O26N4 | 1295 | 1.2 | 1.2 | 2.39 |
Table 2.
Calculation of organic chemistry equation.
| Mineral Names | Molecular Formula | Weight Percentage (%) | Molecular Weight (g/mol) | Mole (Mole = Weight Percentage/Molecular Weight) (%g/mol) |
| SOM | C64H55O26N4 | 2.39 | 1295 | 0.001846 |
| O (26 × Mole) | C (64 × Mole) | H (55 × Mole) | N (4 × Mole) | Group Molecular formula |
| 0.04798 | 0.11812 | 0.10151 | 0.00738 | O0.04798C0.11812H0.10151N0.00738 |
Table 3.
Percentage change of mineral components corresponding to the change of density of chlorite, illite and montmorillonite.
Table 3.
Percentage change of mineral components corresponding to the change of density of chlorite, illite and montmorillonite.
| Chlorite density | 2.65 | 2.70 | 2.75 | 2.80 | 2.85 | 2.90 | |||||
| Mineral composition density | 2.72 | 2.73 | 2.73 | 2.73 | 2.73 | 2.73 | |||||
| Illite density | 2.60 | 2.65 | 2.70 | 2.75 | 2.80 | 2.85 | 2.90 | ||||
| Mineral composition density | 2.67 | 2.68 | 2.69 | 2.70 | 2.71 | 2.72 | 2.72 | ||||
| Montmorillonite density | 2.20 | 2.25 | 2.30 | 2.35 | 2.40 | 2.45 | 2.50 | 2.55 | 2.60 | 2.65 | 2.70 |
| Mineral composition density | 2.55 | 2.57 | 2.59 | 2.61 | 2.63 | 2.64 | 2.66 | 2.68 | 2.69 | 2.71 | 2.72 |
© 2018 by the authors. Licensee MDPI, Basel, Switzerland. This article is an open access article distributed under the terms and conditions of the Creative Commons Attribution (CC BY) license (http://creativecommons.org/licenses/by/4.0/).
Share and Cite
MDPI and ACS Style
Liu, Z.; Song, J.; Yang, Y.; Li, X. Quantitative Analysis of 3D Reconstruction Parameters of Multi-Materialsin Soft Clay. J. Mar. Sci. Eng. 2018, 6, 23. https://doi.org/10.3390/jmse6010023
AMA Style
Liu Z, Song J, Yang Y, Li X. Quantitative Analysis of 3D Reconstruction Parameters of Multi-Materialsin Soft Clay. Journal of Marine Science and Engineering. 2018; 6(1):23. https://doi.org/10.3390/jmse6010023
Chicago/Turabian StyleLiu, Zhiqing, Jing Song, Yushuang Yang, and Xue Li. 2018. "Quantitative Analysis of 3D Reconstruction Parameters of Multi-Materialsin Soft Clay" Journal of Marine Science and Engineering 6, no. 1: 23. https://doi.org/10.3390/jmse6010023
Note that from the first issue of 2016, this journal uses article numbers instead of page numbers. See further details here.