Two Centuries of Climate Change and Climate Variability, East Coast Australia


Griffith Centre for Coastal Management, Griffith University, Gold Coast 4222, Australia
*
Author to whom correspondence should be addressed.
J. Mar. Sci. Eng. 2018, 6(1), 3; https://doi.org/10.3390/jmse6010003
Submission received: 11 December 2017
/
Accepted: 19 December 2017
/
Published: 3 January 2018
(This article belongs to the Special Issue Climate Change, Coasts and Coastal Risk)
Abstract
:On the east Australian coast, climate change is expressed as a slowly rising sea level. Analysis of records, dating back over two centuries, also shows oscillating multidecadal ‘storm’ and ‘drought’ dominated climate periods that are distinct from long-term climate change. Climate variability, as expressed by these distinct multidecadal periods, is generally associated with phases of the Interdecadal Pacific Oscillation Index (IPO). Two centuries of climate and coastline response are examined for the central east coast of Australia, between Fraser Island and Coffs Harbour. The long record has been compiled by analysing a wide range of indicators and observations, including: historical accounts, storm records, sea level trends, assessment of storm erosion faces, and coastal movement in relation to fixed monuments, surveys, and maps. Periods of suppressed sea level, beach accretion, and drought were found to be associated with strongly positive IPO. Periods of higher sea level, increased storminess, and beach erosion were associated with strongly negative IPO. Understanding the behaviour of climate variability over different timescales has the potential to improve the understanding of, and responses to, climate change. This will be important in the sustainable management of geomorphic and ecological systems.
1. Introduction
Climatic and geomorphic evidence indicates that the east Australian coastline observed by the first Europeans settlers 200 years ago was experiencing a relatively stable climatic period, when the sea level was slightly below that in the present. Consistent findings of slowly receding shorelines and erosion of Holocene dunes suggest that the coast was influenced by slowly rising sea levels from the early 1800s to present day [1]. Simulation from HadCM3 [2] shows a trend of global sea level rise from 1820. The east coast sea level rise follows, but has been below the global mean, due to the non-uniform distribution of thermal expansion resulting in different regional rates of sea level rise [3]. Pacific Ocean sea surface temperature (SST) has been recorded in ships’ logs from the mid-1800s and has been modelled to show an Interdecadal Pacific Oscillation (IPO). The IPO index oscillates irregularly as positive and negative phases over several decades, resulting in major climate shifts [4,5,6,7]. References [8,9] relate oceanic ecosystem production and salmon catches in the North Pacific Ocean to decadal phases of IPO. The authors of Reference [10] observed that sea level at Auckland rises at a slower rate during positive IPO phases than in negative phases. IPO interacts with, and modifies, the inter-annual variation described by El Niño-Southern Oscillation (ENSO). The Southern Oscillation Index (SOI) gives an indication of the development and intensity of El Niño or La Niña events in the Pacific Ocean and is calculated using the pressure differences between Tahiti and Darwin. The variability in SOI is largely due to the influence of the widely understood and discussed two- to seven-year ENSO cycles.
Inter-annual variation of the annual mean sea level from Sydney shows a far greater magnitude of change than long-term trends (over 100 years). The IPO also appears to modulate the frequency of El Niño events, whereby the occurrence of El Niño events is shown to be significantly elevated during the positive phase, with the last 350 years showing that the frequency of La Niña is significantly higher during negative IPO phases [6]. Reference [11] reported that for recent decades (1979–2015), coastal vulnerability across the Pacific correlates with ENSO. The combination of IPO and ENSO provides the broad framework for understanding Australian climate episodic behaviour.
2. Methods
Projecting trends from studies such as Reference [11], which analyse data from periods of years to decades, is questioned. Analysis over decadal or centennial scales provides a method for separating the influence of climate change from climatic variation in coastal dynamics. Two centuries of climate and coastline response are examined for the central east coast of Australia, between Fraser Island and Coffs Harbour. The long record has been compiled by analysing a wide range of indicators and observations, including historical accounts, storm records, sea level trends, assessment of storm erosion faces, coastal movement in relation to fixed monuments, surveys, and maps [1].
To identify underlying climate change trends, recorded changes to the coastline were compared to estimates of sea level, observed records of annual mean sea level, and projected sea level trends. Climate variability was analysed by identifying storm, drought, and flood events on the coast.
3. Findings
3.1. Sea Level and Climate Change
On the east coast of Australia, a slowly rising sea level (Figure 1) has resulted in permanent coastal changes: breaching of coastal dunes, barrier island formation, loss of spits, and growth of flood tide deltas [1,12,13,14]. The coastline has been moving inland throughout the last two centuries, largely unperceived as the rate of sea level rise has been low and movement well within the range of climatic variability. Little concern has been raised as most of the eroded land is public reserve which has acted as an effective coastline buffer.
3.2. IPO and Sea Level
Quarterly IPO indices from the Hadley Centre, UK1 were converted to annual means from 1871 and compared to detrended Sydney annual mean sea level (Figure 2). When IPO is plotted inversely, the relationship with the annual mean sea level is clear and can be statistically analyzed. On the basis of 91 paired comparisons of annual mean detrended Sydney sea level and IPO, the time series correlation is p < 0.0001, R = −0.3842, demonstrating a significant inverse relationship between the two time series. An apparent change in correlation occurred around 1976 at the end of the previous negative phase, with mean sea level being elevated during positive IPO. However, this trend did not continue into the 21st century, and the record is too short for definitive statistical analysis to assess whether this may indicate any significant climate change influence.
3.3. IPO and Climate Variability
The relationship between IPO and climatic factors affecting the Australian east coast have been analysed with past records being used to explore the relationship between drought, floods, storminess, and IPO.
3.3.1. Drought Periods
Due to the impact on agricultural production, droughts are reasonably well recorded in regional and local histories (Figure 3). From the late 1880s droughts have been well documented, especially since the Federation Drought in 1901–1902. When the central eastern Pacific SST is warm and IPO is positive, eastern Australia tends to be warm and dry [4]. Phases of positive IPO are associated with east coast drought conditions and the most severe droughts occur when IPO is positive and SOI is negative [16].
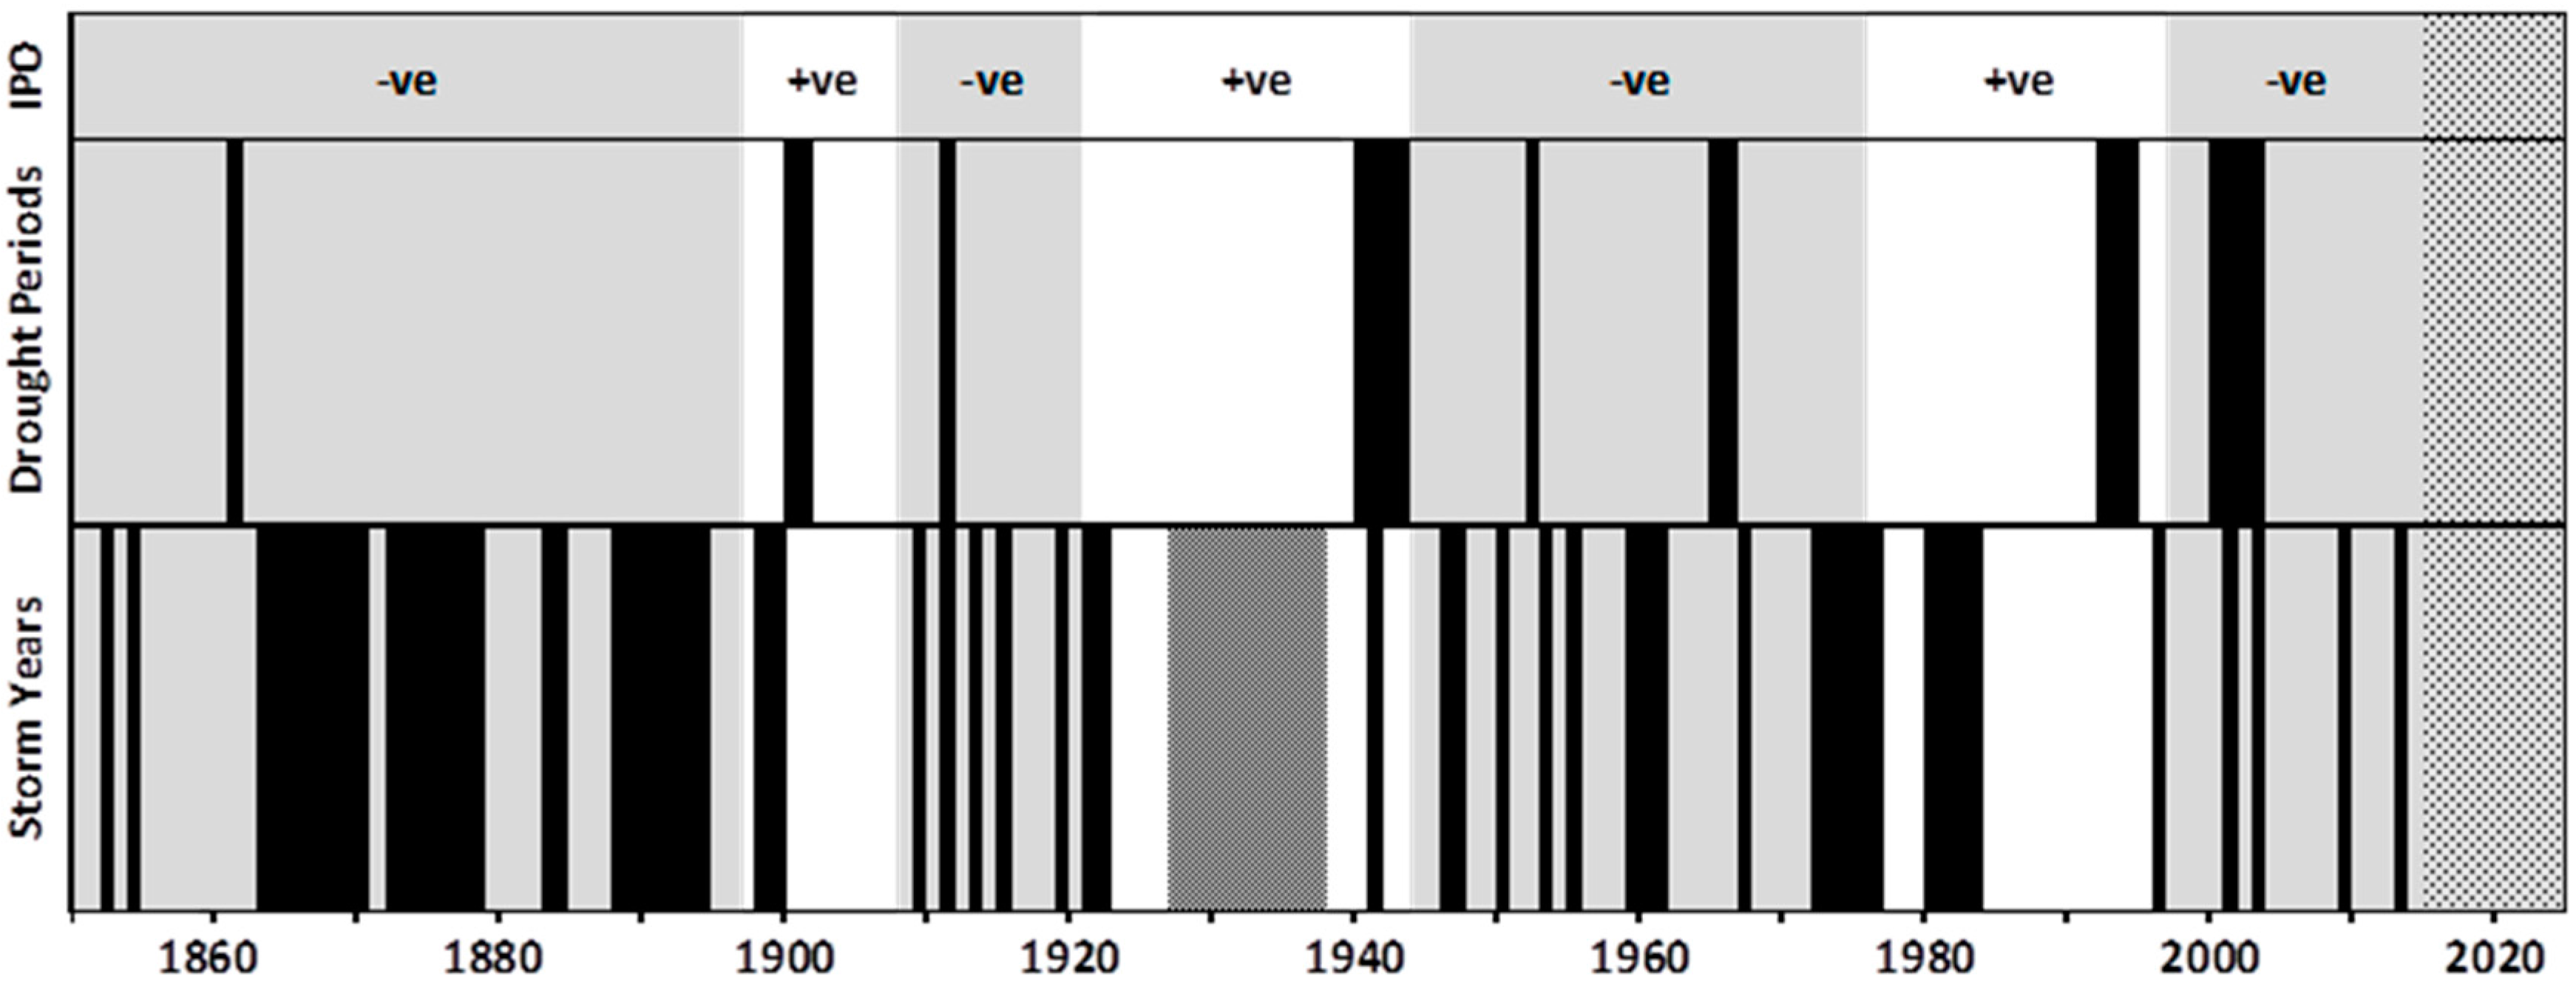
During drought on the coast, river flow is low with little scouring of entrances, especially flood tide deltas, and there is limited hydraulic pressure on spits and barriers. Drought periods as shown in Figure 4 are associated with low numbers of severe storms, lower than trend sea level and, in the past, inshore sand accretion of beaches and barriers along the coast.
3.3.2. Storm Periods
The variation in storminess throughout the 200-year record has several distinct features, especially where it is related to inter-annual variation and IPO phases. Inter-annual oscillations related to ENSO are usually associated with rainfall; however, wet years may not always be associated with severe storms on the coast. Severe coastal storms are those which have caused severe impacts such as beach erosion, inundation, or damage to property or natural assets. The annual number of severe storms per calendar year was derived from past records [17]. Between 1860 and 2014, the number of severe storms per year shows considerable annual variation. 1967 was the most extreme storm year, occurring when both ENSO and IPO were neutral. By contrast, the period between the 1860s and 1890s was the stormiest recorded during a mostly negative IPO.
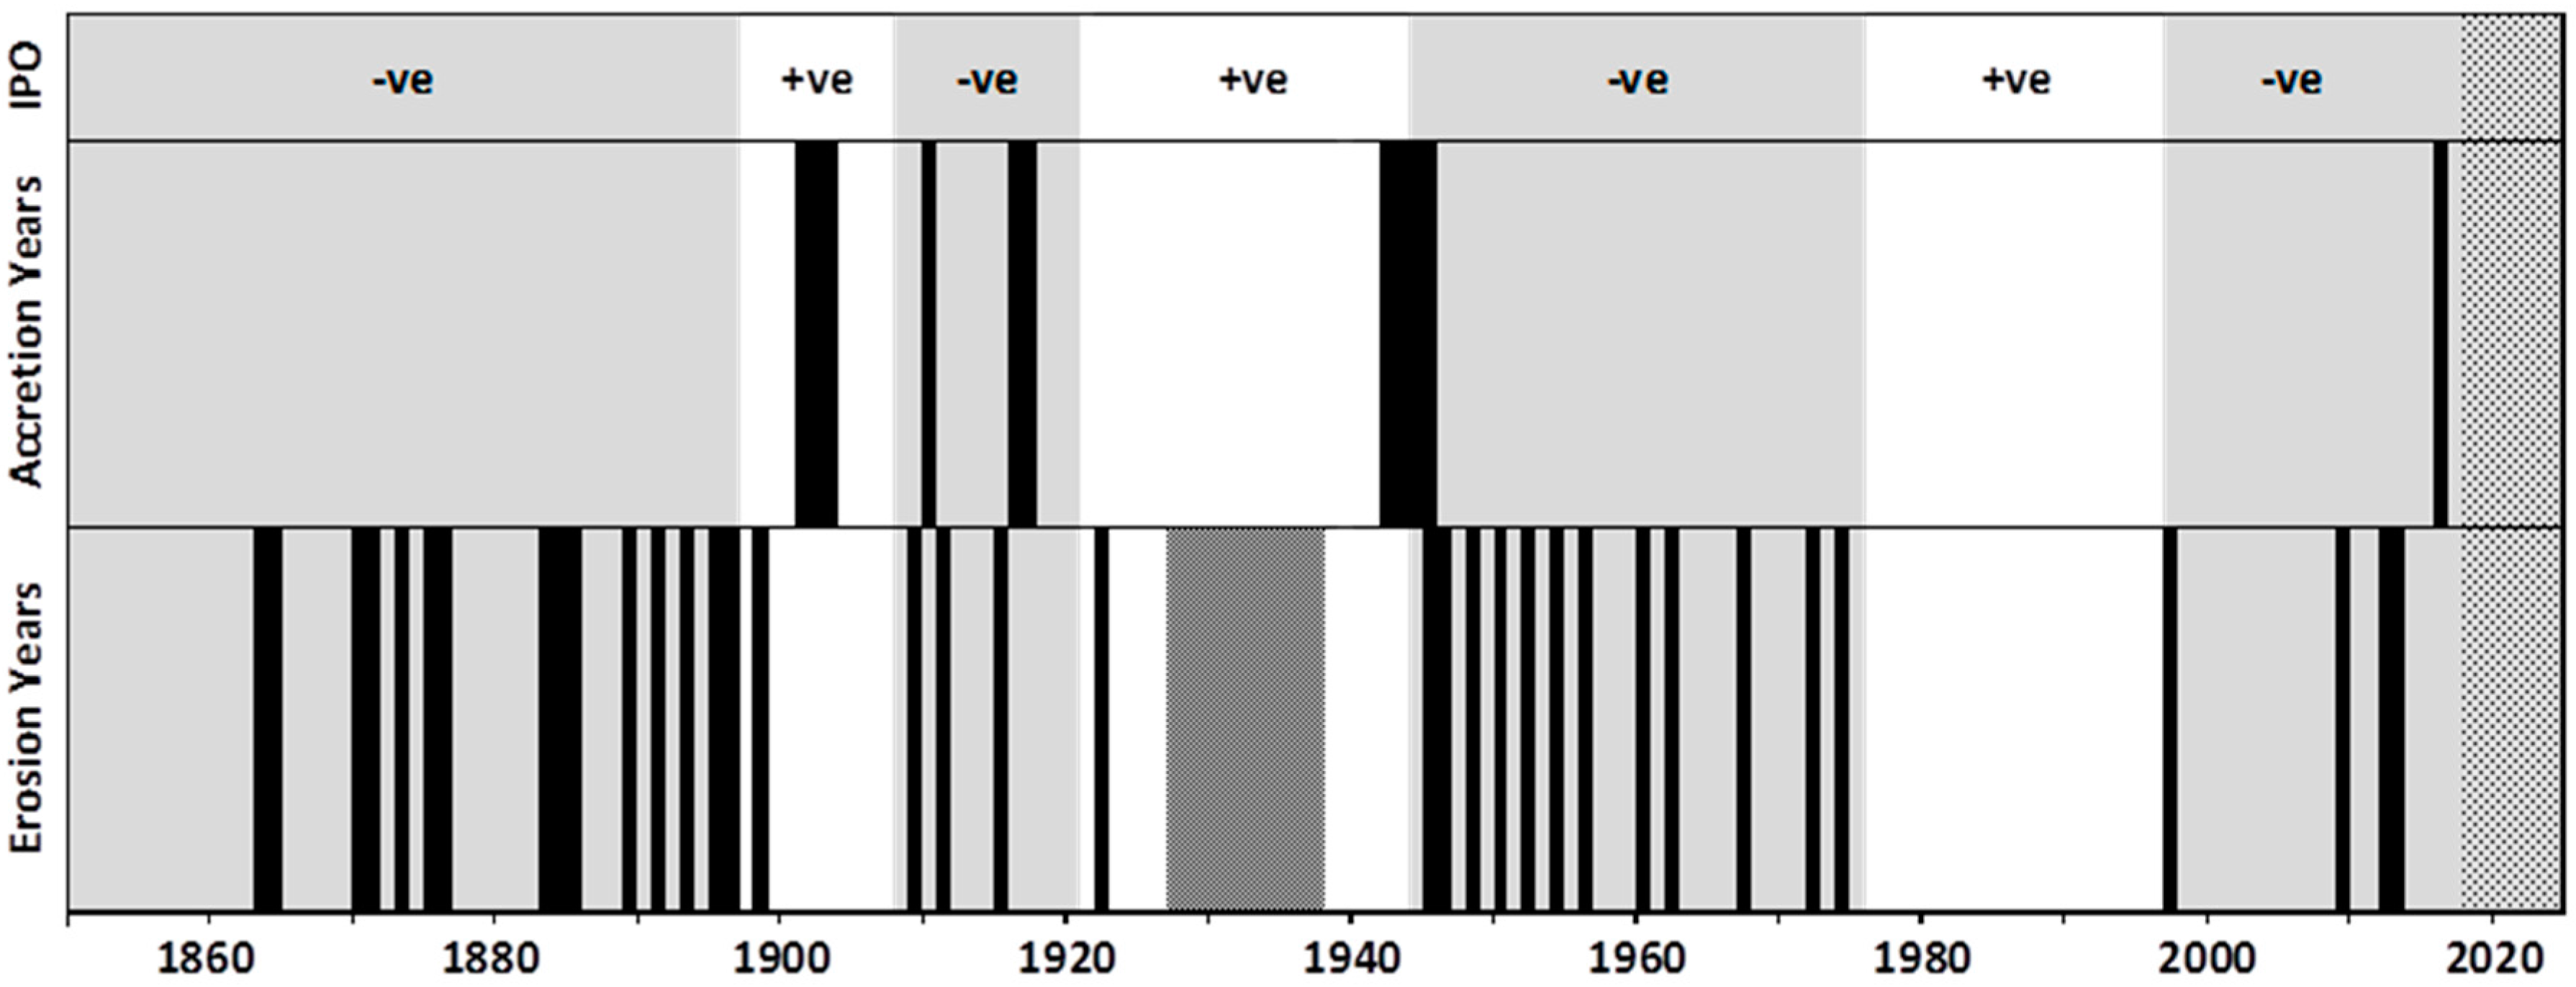
Records have been used to classify erosion years, as shown against IPO phase in Figure 5, and reveal erosion years during negative IPO phase. Erosion years between 1926 and 1938 were from severe storms not related to IPO (as above).
Examination of the storm erosion record indicates significant erosion events are most likely related to individual very severe storms or a sequence of severe storms (storm periods) [12]. Many problems assessing individual, sequential, or annual storminess from incomplete and changing records can be overcome by considering coastline change outcomes of erosion and accretion [17].
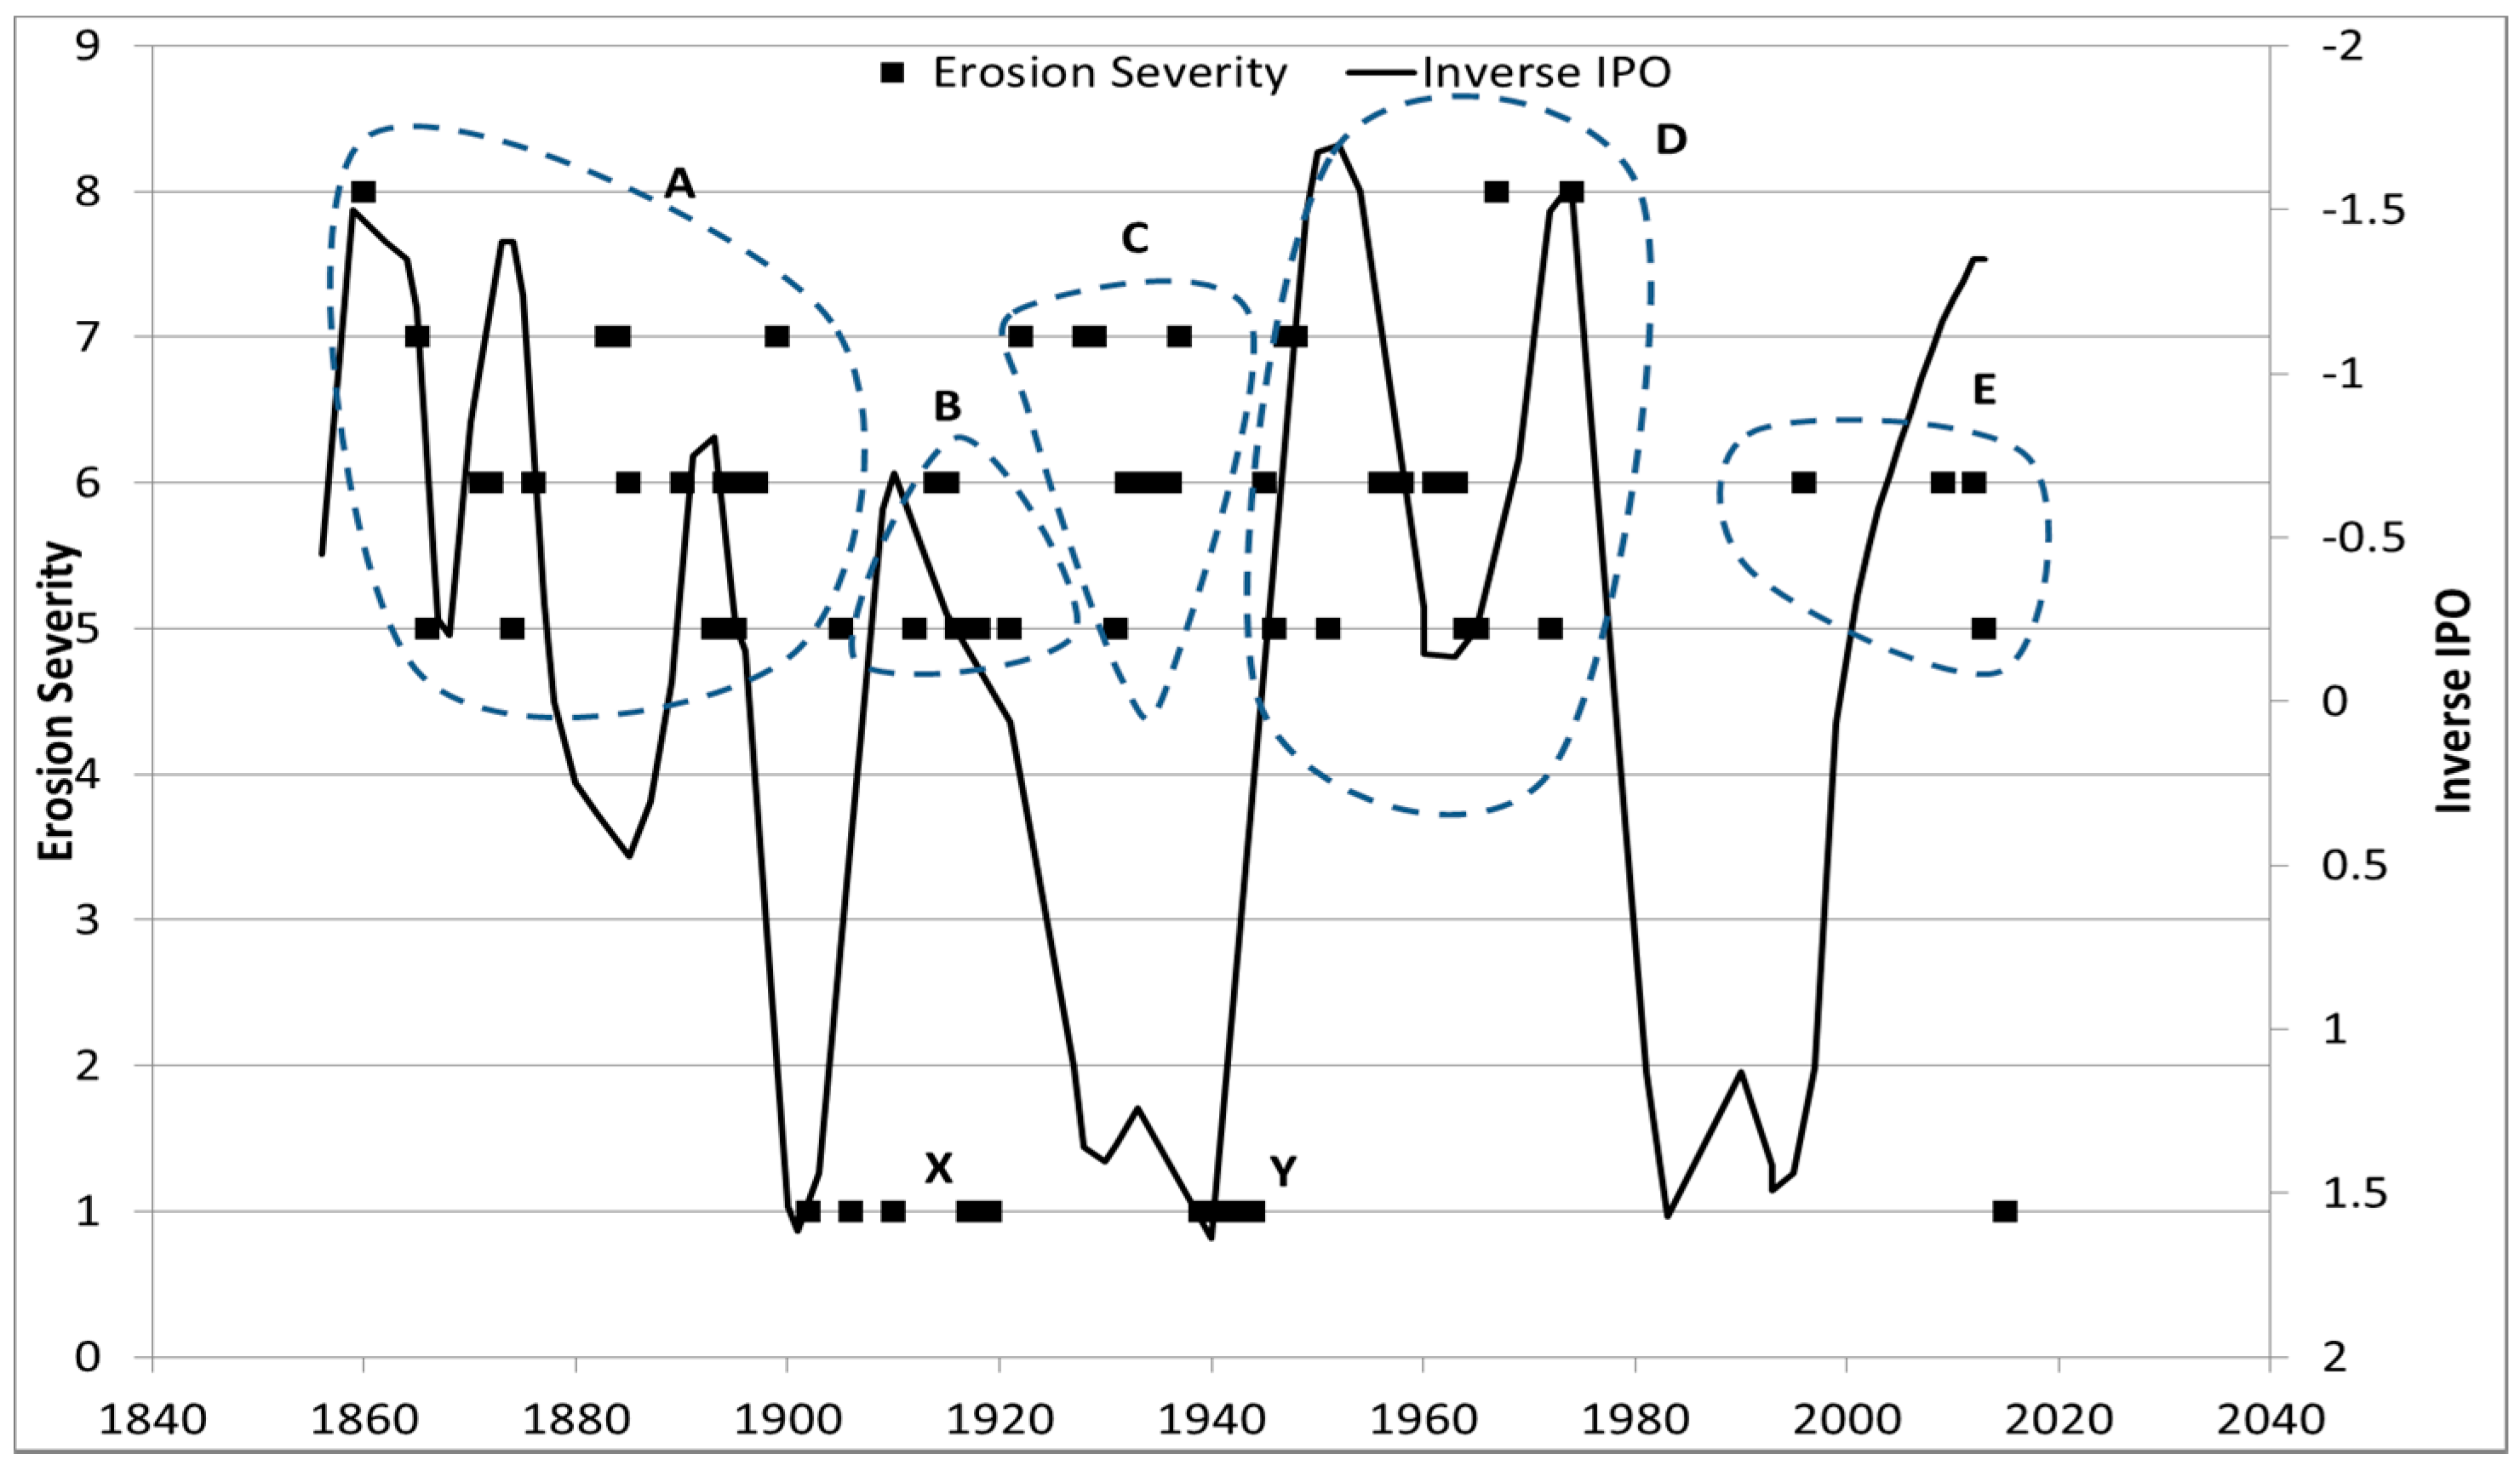
Long-term erosion response is plotted against inverse IPO (Figure 6). Erosion period ‘A’ from 1857 to 1898 is related to the long period of negative IPO and is the most severe storm period in the record. During this period, there was significant coastal change:
- Exposure of heavy mineral lenses on beaches (mined by hand for gold).
- Serious problems with construction of breakwaters; at Trial Bay, New South Wales they were continually destroyed during construction and abandoned; at the Clarence River, New South Wales they were continually damaged due to breakwaters during construction.
- Permanent breach of the barrier dune and the permanent division of Stradbroke Island, southern Queensland.
- Storm erosion restricted the use of the beach for travel along the coast’s most eastern beaches (Seven Mile and Tallow beaches, northern New South Wales).
There appears to be a significant sequencing of erosion events, for example the long storm period from 1860 to 1890 culminating in 1893, with record Brisbane River floods and severe erosion on the coast. The following years, 1894 to 1897, were low storm years, yet erosion and barrier dune wash-overs continued. The impacts of extreme individual storms and ‘storm periods’ or ‘sequences of storms’ have a cumulative impact, for example the breaches of barrier dunes at Southport and Jumpinpin, Stradbroke Island in southern Queensland occurred from cumulative impacts of several events over a number of years [1].
Erosion period ‘B’ is related to negative IPO and is short-lived. The significant erosion period ‘C’, in the mid-1930s, is not related to IPO. The reason for this inconsistency is uncertain, although a similar anomaly has been recognised in ENSO [18]. Erosion period ‘D’, 1946 to 1974, is well documented [19,20] and is related to negative IPO, but includes 1967, an unusual year that is discussed later in this paper. The erosion face cut at the end of this period, in 1974, remains the most inland face on the majority of the coast. Recent significant erosion events ‘E’ appear to correlate to the current negative IPO, which is anticipated to continue into the foreseeable future.
Prior to beach photographs in late 1800s, accretion years are difficult to determine from past records. Later surveys and photographs have provided evidence of foredune accretion with two accretion periods identified and referred to as ‘X’ and ‘Y’ in Figure 6.
Accretion period ‘X’ was initiated during a period of positive IPO and severe Federation Drought. Accretion years continue between 1911 and 1918 during a period of below average rainfall and years of generally low storminess. Accretion period ‘Y’ was initiated during a positive IPO phase during World War II drought, continuing as IPO changed phase before storm period ‘D’.
3.3.3. IPO Influence on Climate and Coastal Change
IPO is characterized by positive and negative phases that are linked to distinct periods of Australian climate and coastal behaviour:
- Negative IPO phase—sea level is above long-term trend, with storm periods and major coastal erosion. For example, the 1860s to 1890s and from the early 1950s to mid-1970s.
- Positive IPO phase—sea level is below long-term trend with drought periods and beach accretion. For example, early 1900s, 1940s.
- Periods of transition between these phases—an example is from 1946 to 1952, when IPO was changing from positive to negative. During this transition, the sea level rose rapidly with increasing storminess and erosion.
With positive IPO over the last few decades, accretion would have been expected on the coast, but has not occurred. Instead there has been erosion, especially in the southern end of compartments and western shores of barrier islands. The absence of accretion is attributed to more rapidly rising sea levels.
A long-term study of beach change on the Californian coast [21] showed IPO-related phase behaviour but an inverse response; a positive IPO phase related to storm energy and coastal erosion, and a negative IPO phase with low energy and beach accretion.
3.3.4. Anomalous Periods
Reference [18] considers that the importance of SOI was not recognised earlier due to the anomalous relationship between SOI and climate in the late 1920s and 1930s. It is suggested that a similar anomalous relationship appears between IPO and climate during this period, particularly the mid-1930s. For example, the storm period between 1933 and 1936 resulted in the severe erosion of the southern Queensland coast, and similarly in New Zealand the most severe storms of the 20th century occurred during this period. The Great Cyclone in February 1936 caused widespread damage to the north island of New Zealand and was followed by a second severe storm in March 1936 [22].
The most severe storm year recorded for southeast Queensland was 1967, with severe erosion experienced along the coast. The year was dominated by severe storms from January to August, including four tropical cyclones (including Tropical Cyclone Dinah with a central pressure of 945 hPa) and a record storm surge on the Gold Coast of 1.5 m. Of six east coast lows, the one between 25 and 28 June was very severe [19]. The year corresponded with a reversal in IPO; however, it is considered to have been in an overall negative IPO phase.
4. Discussion
Past positive IPO phases have been associated with lower than trend sea levels and periods of beach and dune accretion with abundant inshore sand supply. Periods of higher sea level, increased storminess, and beach erosion have been shown to be associated with strongly negative IPO. However, in the most recent positive IPO phase, with characteristically low storm activity, erosion is observed in the southern sections of ocean compartments and on the western shorelines of barrier islands. This minor erosion and lack of dune accretion provides evidence for the influence of sea level rise and raises the possibility that sections of the present coastal alignment are under-adjusted to sea level change due to the unusually long period of low storm energy from 1974 to 2009. However, Reference [10] suggested that climate change-driven sea level rise on the New Zealand coast was masked by the positive phase of IPO experienced over the past 30 years, and that for the decades following the year 2000, sea level rise from climate change would likely to be accompanied by a return of a negative IPO phase, associated with higher than trend sea levels, storm energy, and severe erosion.
An analysis of the current trend in IPO (Figure 6), annual mean sea level, and the evidence of more storms in recent years suggest that on the east coast of Australia, there has been a return to climate conditions and responses associated with a negative IPO phase. In the Gold Coast region, recent storminess has been experienced in 2012 and 2013, with more widespread storms along the east coast in 2009 and 2016.
The coincidence of the underlying climate trend of sea level rise and the return of the storm energy associated with negative IPO phases raises a concern that the impacts of future erosion periods are likely to be far more severe than any experienced during the last 200 years.
Coastal management decisions are commonly based on analysis from aerial photography and even shorter periods of measured data from wave rider buoys. Projection of trends from these short period studies is questioned. When compared to the variability shown over the last 200 years, coastal responses in recent decades, during which rapid infrastructure development has occurred, appear unrepresentative of long-term patterns. Analysis over long time periods provides a method for separating the influence of climate change from climatic variation in coastal dynamics.
Although projections of future sea level rise [23] are considered in coastline planning, the impact of climate variability resulting in shorter decadal periods with higher than long-term mean sea levels, accompanied by more storminess, should not be ignored. As has been seen on the east coast of Australia, these periods result in major coastal responses in terms of beach erosion and inundation. In future coastline planning, an allowance for sea level rise from climate change and decadal climate variability will need to be made.
Acknowledgments
The authors acknowledge the valuable contributions to this work by Danielle Verdon and Scott Power.
Author Contributions
Peter Helman conceived and designed the historical data analysis methods and undertook the analysis; Peter Helman and Rodger Tomlinson wrote the paper.
Conflicts of Interest
The authors declare no conflict of interest.
References
- Helman, P. Two Hundred Years of Coastline Change and Future Change, Fraser Island to Coffs Harbour, East Coast Australia. Ph.D. Thesis, Southern Cross University, Lismore, Australia, 2007. [Google Scholar]
- Hadley Centre MetOffice. Available online: http://www.cru.uea.ac.uk/cru/projects/soap/pw/data/model/hadcm3/hadcm3_sealevel.htm (accessed on 3 March 2017).
- Cazenave, A.; Nerem, R.S. Present-day sea level change: Observations and causes. Rev. Geophys. 2004, 42. [Google Scholar] [CrossRef]
- Power, S.; Casey, T.; Folland, A.; Colman, A.; Mehta, V. Inter-decadal modulation of the impact of ENSO on Australia. Clim. Dyn. 1999, 15, 319–324. [Google Scholar] [CrossRef]
- Salinger, M.J.; Renwick, J.A.; Mullan, A.B. Interdecadal Pacific Oscillation and South Pacific climate. Int. J. Climatol. 2001, 21, 1705–1721. [Google Scholar] [CrossRef]
- Verdon, D.C.; Franks, S.W. Long term behaviour of ENSO—Interactions with PDO over the last 400 years inferred from paleoclimate records. Geophys. Res. Lett. 2006, 33. [Google Scholar] [CrossRef]
- Verdon, D.C. Pacific and Indian Ocean Climate Variability-Implications for Water Resource Management in Eastern Australia. Ph.D. Thesis, University of Newcastle, Callaghan, Australia, 2007. [Google Scholar]
- Francis, R.C.; Hare, S.R. Decadal scale regime shifts in the large marine ecosystems of the north-east Pacific: A case of historical science. Fish. Oceanogr. 1994, 3, 279–291. [Google Scholar] [CrossRef]
- Francis, R.C.; Hare, S.R.; Mantua, N.J.; Wallace, J.M.; Zhang, Y. A Pacific Interdecadal climate oscillation with impacts on salmon production. Bull. Am. Meteorol. Soc. 1997, 78, 1069–1079. [Google Scholar]
- Goring, D.; Bell, R. Sea level on the move? Water Atmos. 2001, 9, 20–21. [Google Scholar]
- Barnard, P.L.; Short, A.D.; Harley, M.D.; Splinter, K.D.; Vitousek, S.; Turner, I.L.; Allen, J.; Banno, M.; Bryan, K.R.; Doria, A.; et al. Coastal vulnerability across the Pacific dominated by El Nino/Southern Oscillation. Nat. Geosci. 2015, 8, 801–807. [Google Scholar] [CrossRef]
- Helman, P.; Tomlinson, R.B. Coastal Storms and Climate Change Over the Last Two Centuries, East Coast Australia. In Solutions to Coastal Disasters 2008; Wallendorf, L., Ewing, L., Jone, C., Jaffe, B., Eds.; ASCE: Reston, VA, USA, 2008; pp. 139–146. [Google Scholar]
- Goodwin, I.D.; Stables, M.A.; Olley, J.M. Wave climate, sediment budget and shoreline alignment Eeolution of the Iluka—Woody Bay sand barrier, northern New South Wales, Australia since 3000 yr BP. Mar. Geol. 2006, 226, 127–144. [Google Scholar] [CrossRef]
- Sloss, C.R.; Jones, B.G.; Murray-Wallace, C.V.; McClennan, C.E. Holocene Sea Level Fluctuations and the Sedimentary Evolution of a Barrier Estuary: Lake Illawarra, New South Wales, Australia. J. Coast. Res. 2005, 21, 943–959. [Google Scholar] [CrossRef]
- Pugh, R.S. Briefing: Some observations on the influence of recent climate change on the subsidence of shallow foundations. Proc. Inst. Civ. Eng. Struct. Build. 2002, 155, 23–25. [Google Scholar] [CrossRef]
- Mckeon, G.M.; Hall, W.B.; Yee Yet, J.; Stone, G.S.; Crimp, S.J.; Peacock, A.; Richards, R.; Tynan, R.W.; Watson, I.W.; Power, S.B. Learning from history: Land and pasture degradation episodes in Australia’s rangelands. In Proceedings of the Conference on Managing Australian Climate Variability (CVAP), Albury, Australia, 23–25 October 2000; Power, S.B., Della Marta, P., Eds.; Bureau of Meteorology: Melbourne, Australia, 2000; pp. 64–67. [Google Scholar]
- Callaghan, J.; Helman, P. Severe Storms on the East Coast of Australia 1770–2008, Griffith Centre for Coastal Management; Griffith University: Gold Coast, Australia, 2008. [Google Scholar]
- Nicholls, N. Climate outlooks: From revolutionary science to orthodoxy. In A Change in the Weather: Climate and Culture in Australia, 2005; Sherratt, T., Griffiths, T., Robin, L., Eds.; National Museum of Australia Press: Canberra, Australia, 2005; pp. 18–29. [Google Scholar]
- Smith, A.W.; Jackson, L.A. Assessment of the past extent of cyclone beach erosion. J. Coast. Res. 1990, 6, 73–86. [Google Scholar]
- Chapman, D.M.; Geary, M.; Roy, P.S.; Thom, B.G. Coastal Evolution and Coastal Erosion in New South Wales; Coastal Council of New South Wales: Sydney, Australia, 1982.
- Zoulas, J.G.; Orme, A.R. Multidecadal-scale beach changes in the Zuma littoral cell, California. Phys. Oceanogr. 2007, 28, 277–300. [Google Scholar] [CrossRef]
- Brenstrum, E. The cyclone of 1936: The most destructive storm of the Twentieth Century? Weather Clim. 2000, 20, 23–27. [Google Scholar]
- Horton, B.P.; Rahmstorf, S.; Engelhart, S.E.; Kemp, A.C. Expert assessment of sea-level rise by AD 2100 and AD 2300. Quat. Sci. Rev. 2014, 84, 1–6. [Google Scholar] [CrossRef]
| 1 | IPO (plotted inverse) 1856 to 1870 after Reference [4]. 1871–2013 version HADISST IPO JFM1871-AMJ2004, low pass 11-year Chebyshev filtered from Hadley Centre, Meteorology Office, UK. Dataset supplied by Scott Power, Research Centre, Bureau of Meteorology, Melbourne. |
Figure 1.
Trend of sea level rise, east coast Australia, 1830–2080. Estimated from 1840 [15]; observed (Sydney Permanent Service for Mean Sea Level (PSMSL) data), projections—Intergovernmental Panel on Climate Change (IPCC) 2007.
Figure 1.
Trend of sea level rise, east coast Australia, 1830–2080. Estimated from 1840 [15]; observed (Sydney Permanent Service for Mean Sea Level (PSMSL) data), projections—Intergovernmental Panel on Climate Change (IPCC) 2007.
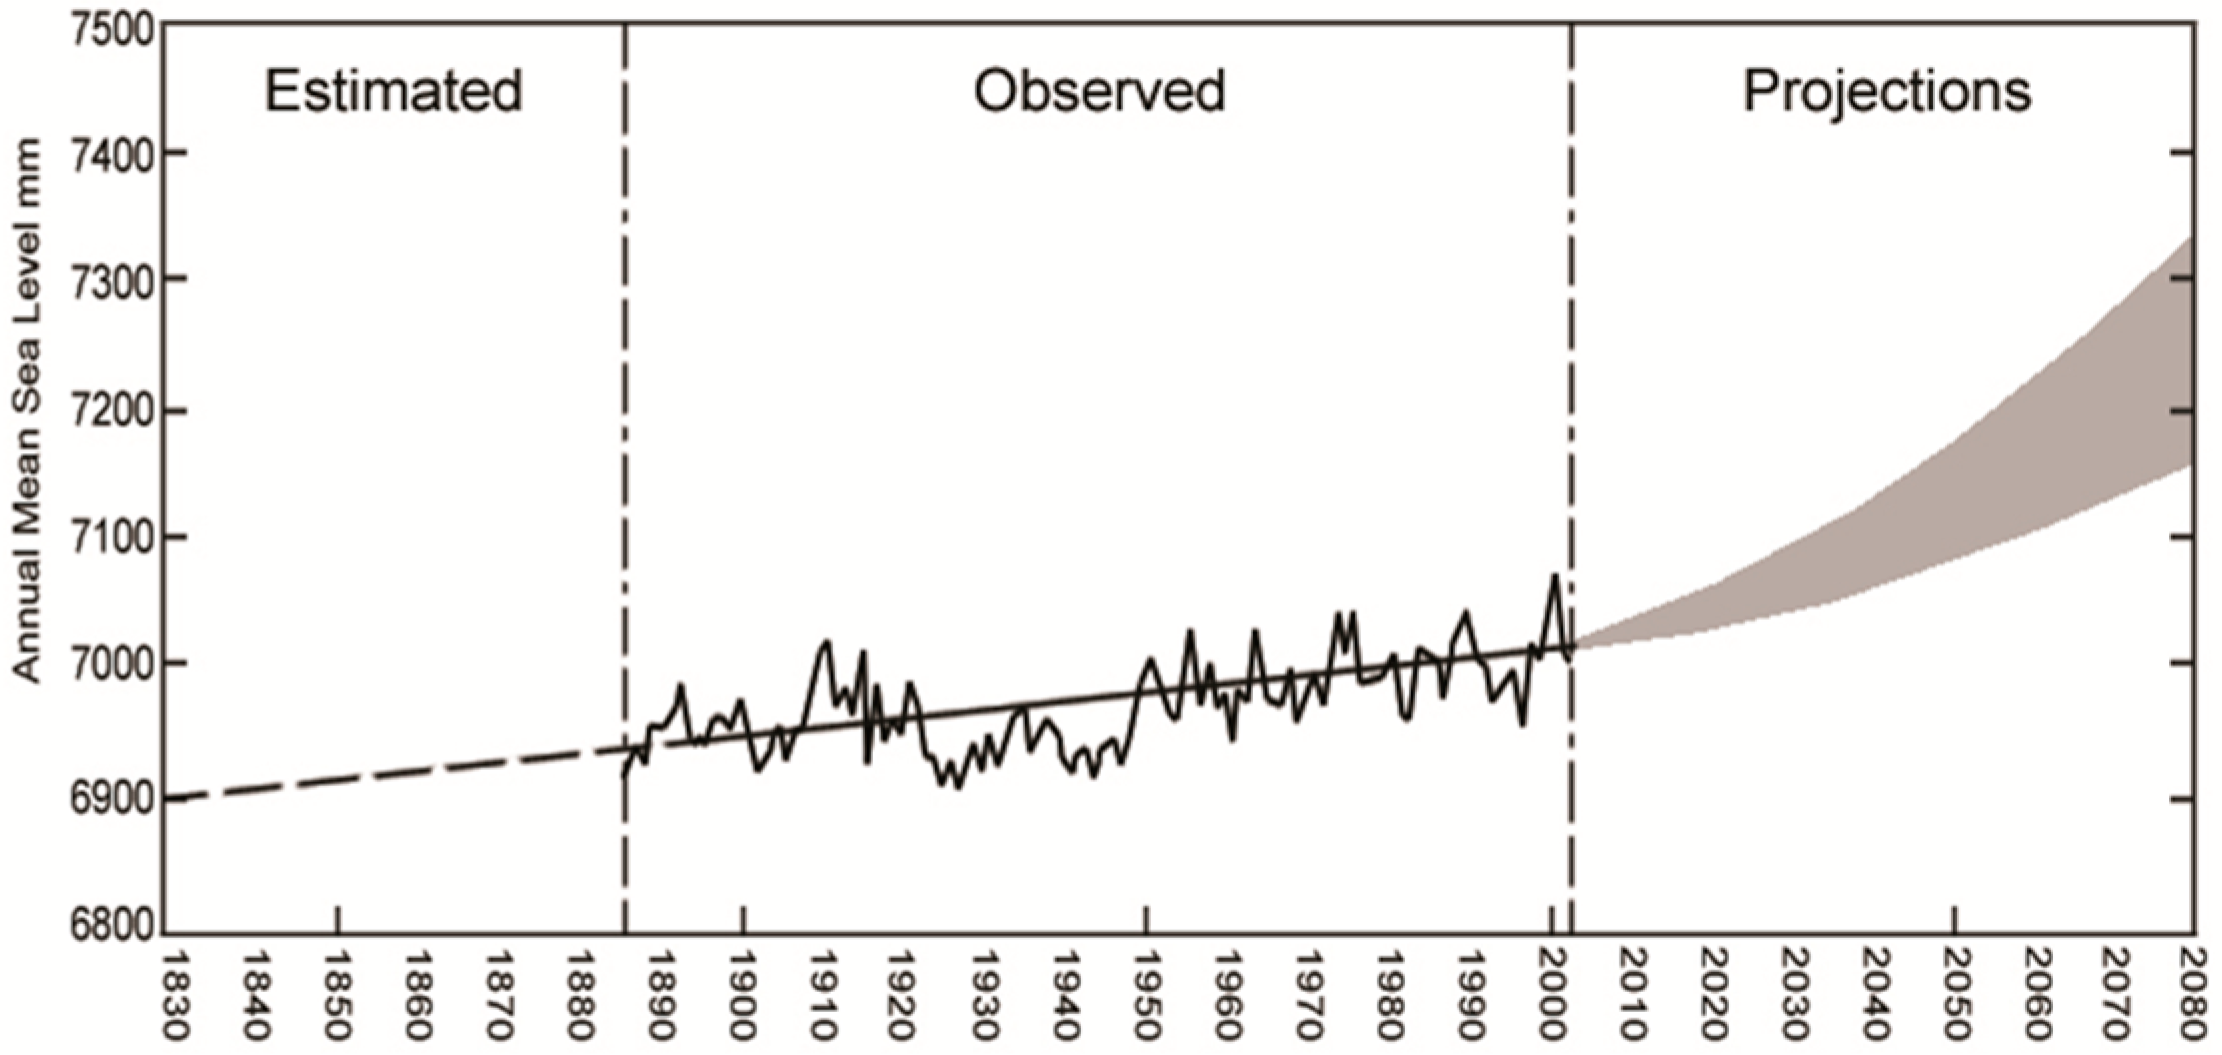
Figure 2.
Sydney detrended annual mean sea level from 1886 compared to episodic oscillation of the Interdecadal Pacific Oscillation Index.
Figure 2.
Sydney detrended annual mean sea level from 1886 compared to episodic oscillation of the Interdecadal Pacific Oscillation Index.
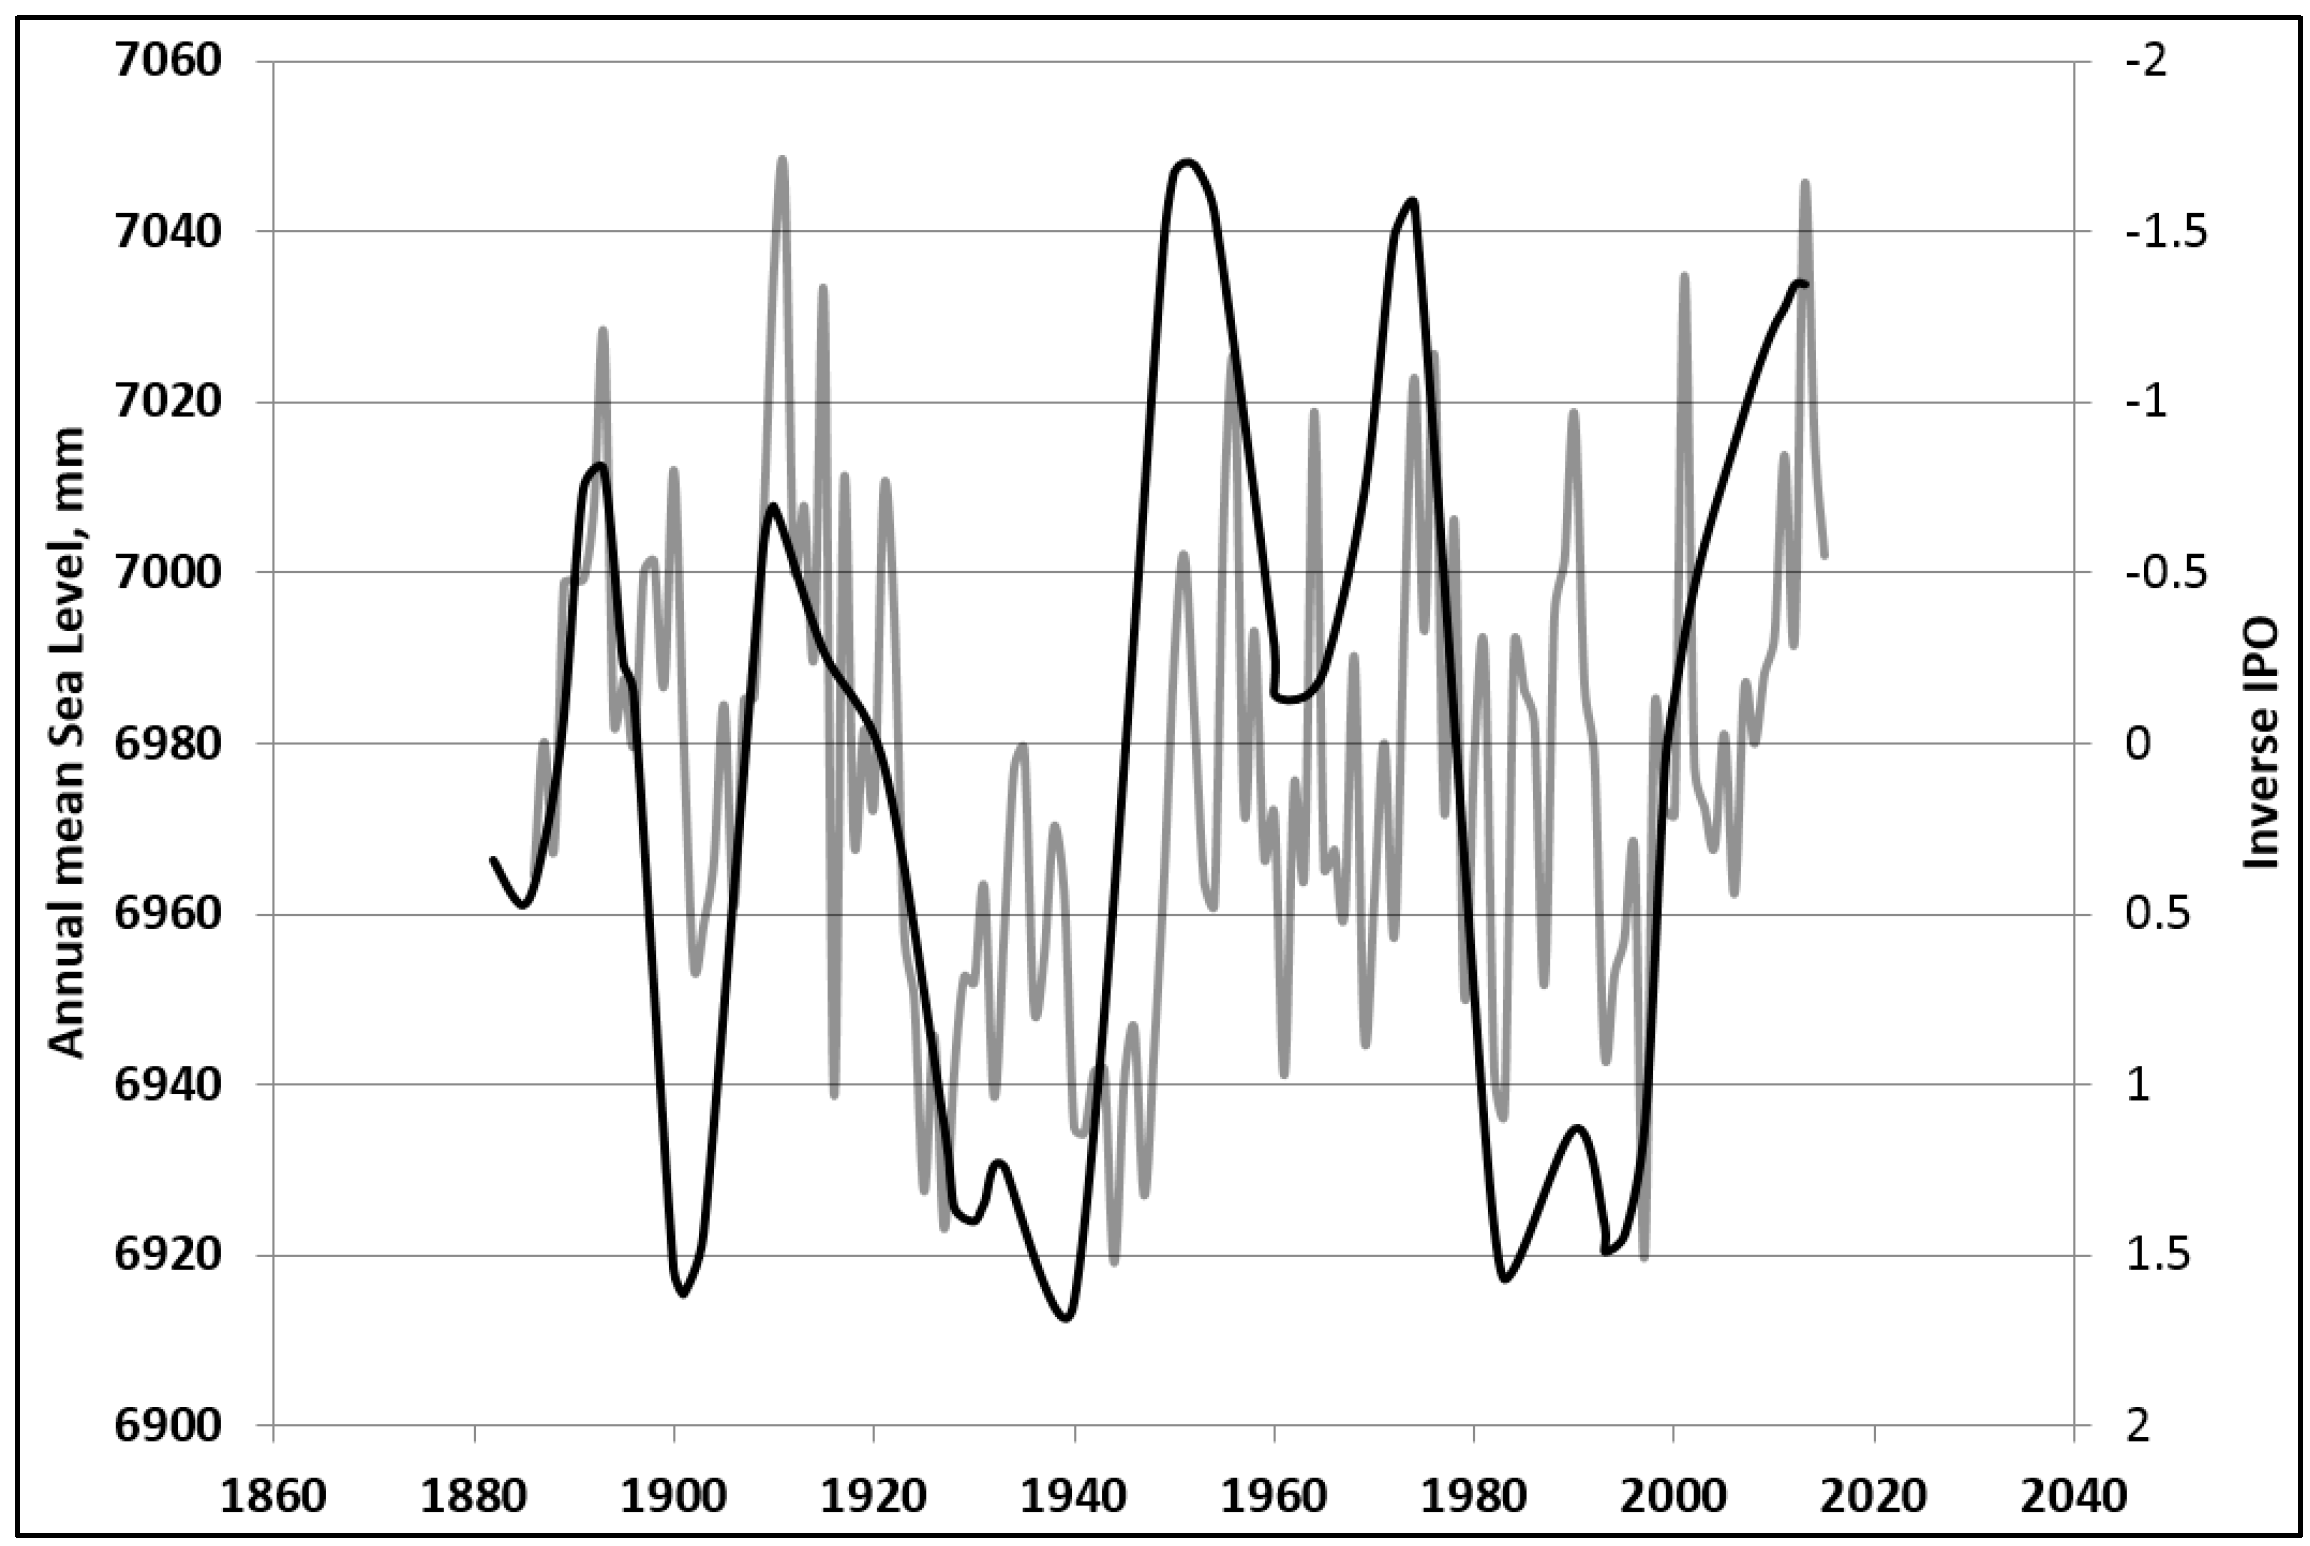
Figure 3.
Major drought periods correlate with phases of positive IPO after Reference [16]. (IPO plotted inversely).
Figure 3.
Major drought periods correlate with phases of positive IPO after Reference [16]. (IPO plotted inversely).
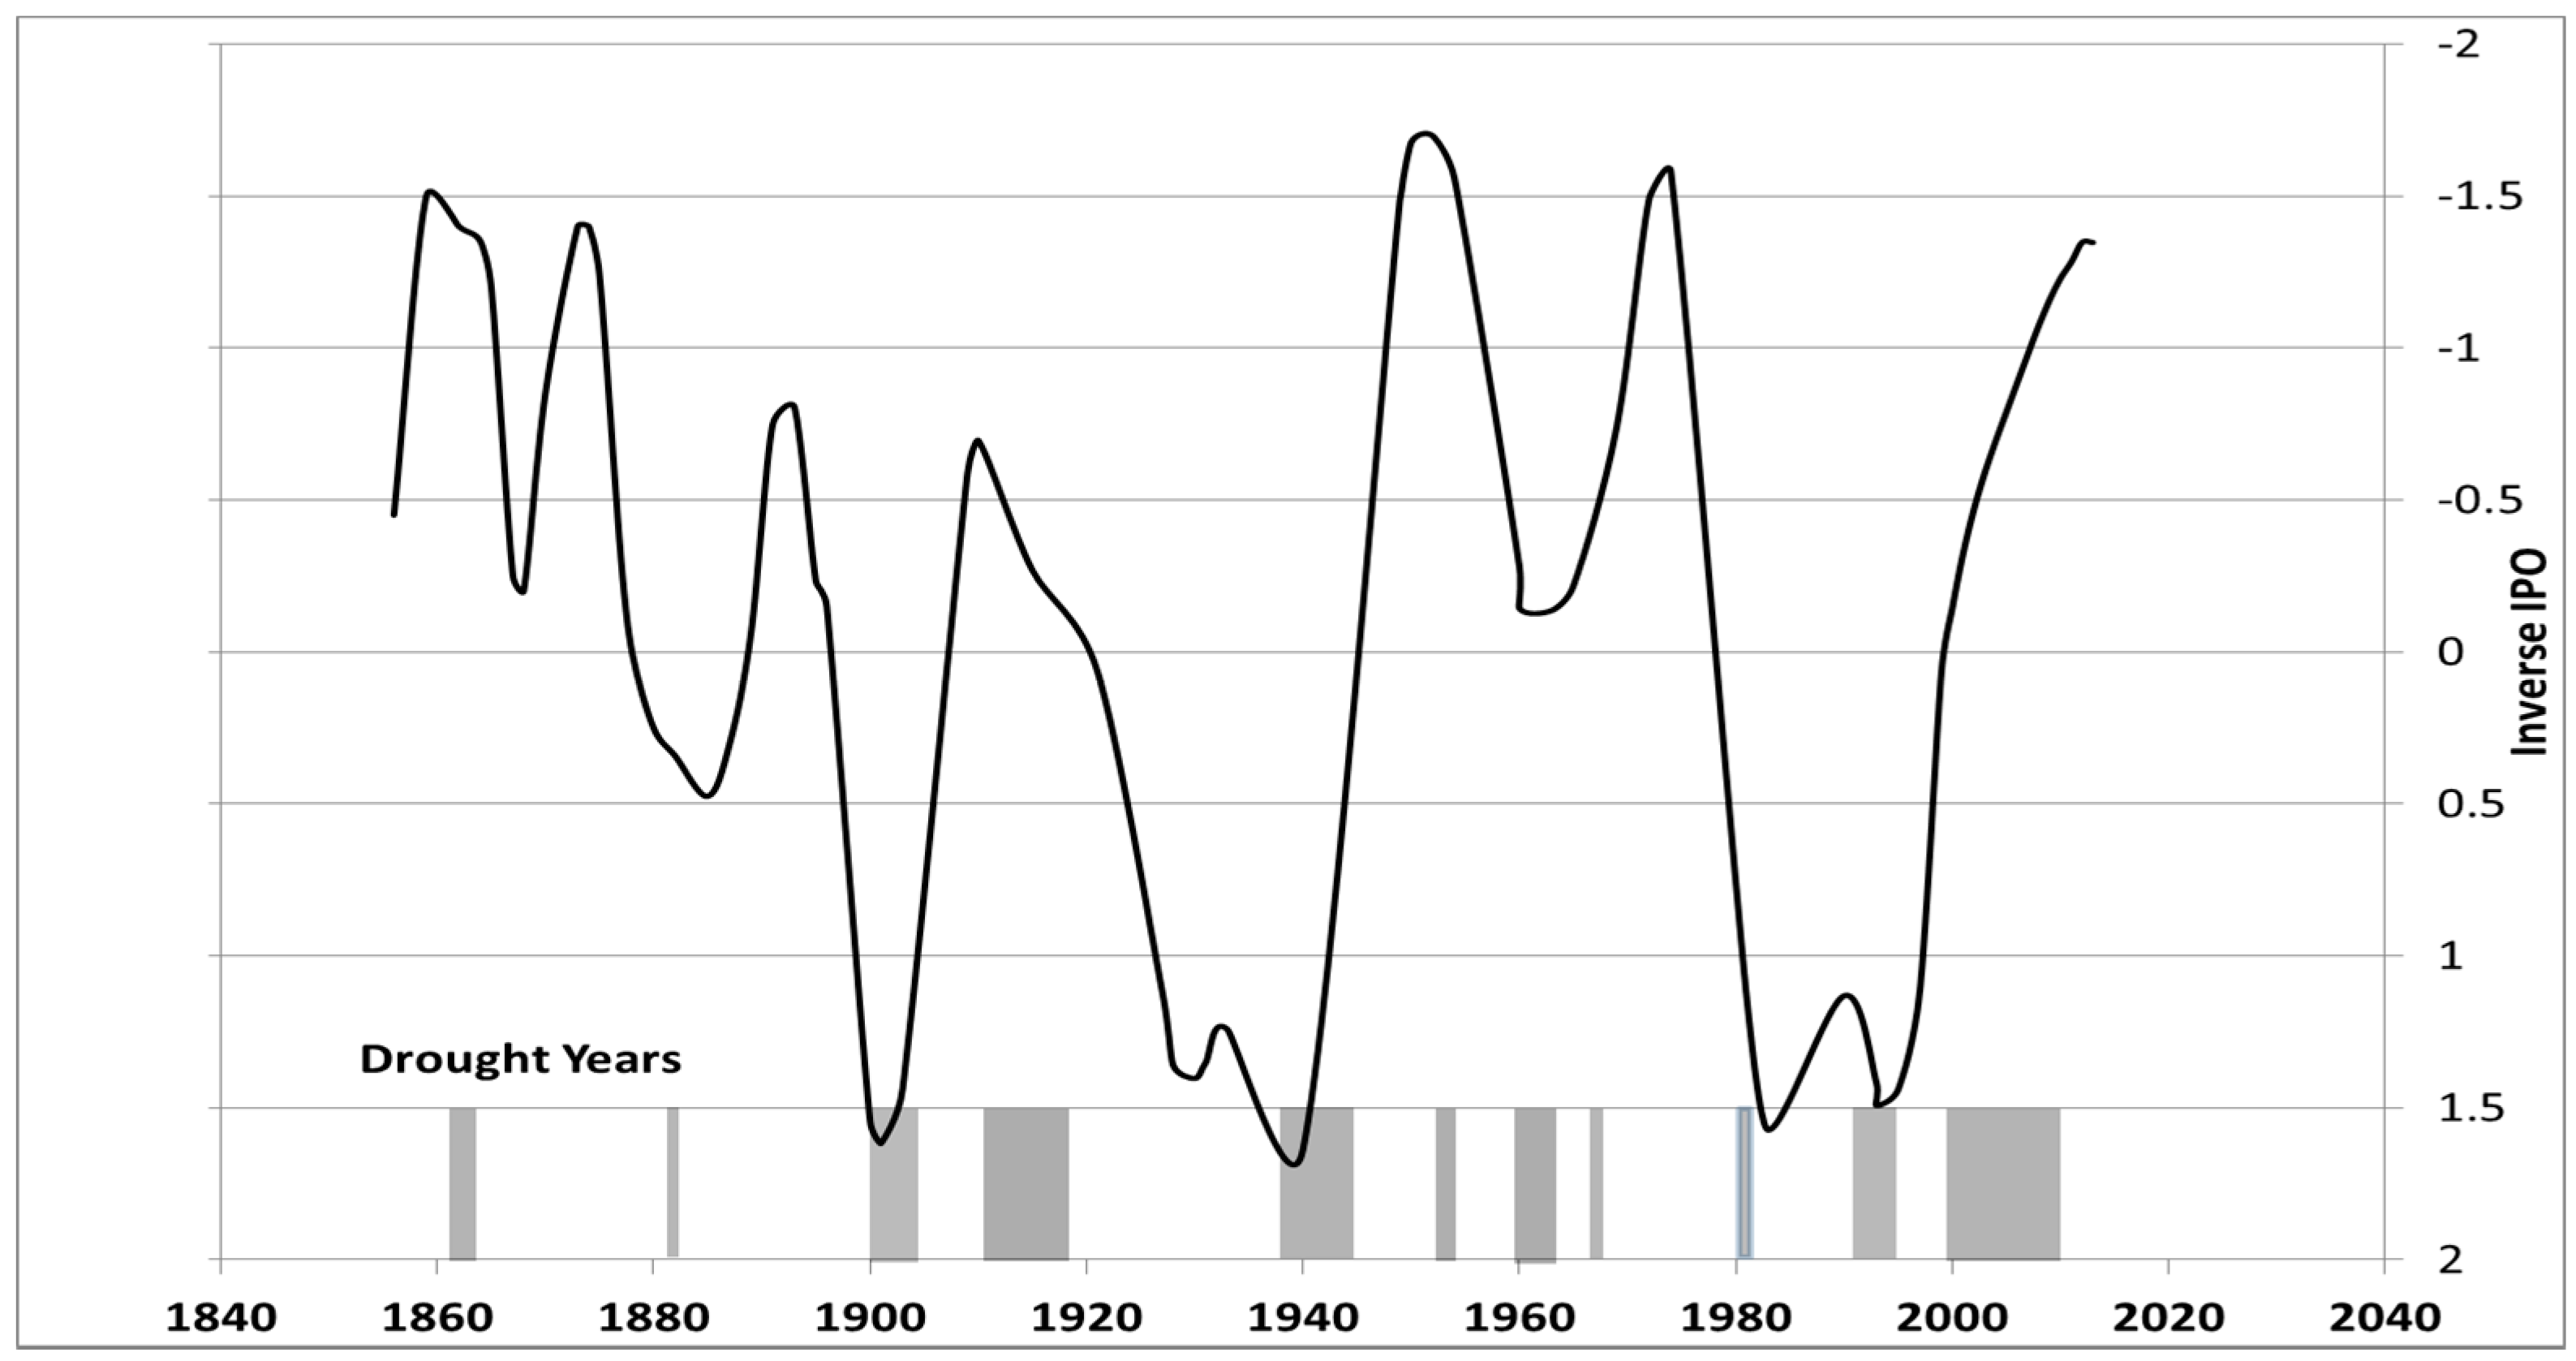
Figure 4.
Relationship between IPO phase and severe storm and drought years along the east coast of Australia (storm years in the 1930s are shown but are not considered to be related to IPO). The current negative IPO phase is anticipated to continue into the foreseeable future.
Figure 4.
Relationship between IPO phase and severe storm and drought years along the east coast of Australia (storm years in the 1930s are shown but are not considered to be related to IPO). The current negative IPO phase is anticipated to continue into the foreseeable future.

Figure 5.
Erosion and accretion years shown against IPO phases. Erosion years in the 1930s are shown but are not considered to be related to IPO.
Figure 5.
Erosion and accretion years shown against IPO phases. Erosion years in the 1930s are shown but are not considered to be related to IPO.

Figure 6.
Long-term erosion response related to IPO. Erosion Severity values of 1 indicate an accretion year.
Figure 6.
Long-term erosion response related to IPO. Erosion Severity values of 1 indicate an accretion year.

© 2018 by the authors. Licensee MDPI, Basel, Switzerland. This article is an open access article distributed under the terms and conditions of the Creative Commons Attribution (CC BY) license (http://creativecommons.org/licenses/by/4.0/).
Share and Cite
MDPI and ACS Style
Helman, P.; Tomlinson, R. Two Centuries of Climate Change and Climate Variability, East Coast Australia. J. Mar. Sci. Eng. 2018, 6, 3. https://doi.org/10.3390/jmse6010003
AMA Style
Helman P, Tomlinson R. Two Centuries of Climate Change and Climate Variability, East Coast Australia. Journal of Marine Science and Engineering. 2018; 6(1):3. https://doi.org/10.3390/jmse6010003
Chicago/Turabian StyleHelman, Peter, and Rodger Tomlinson. 2018. "Two Centuries of Climate Change and Climate Variability, East Coast Australia" Journal of Marine Science and Engineering 6, no. 1: 3. https://doi.org/10.3390/jmse6010003
Note that from the first issue of 2016, this journal uses article numbers instead of page numbers. See further details here.