Article

Description and Mechanisms of the Mid-Year Upwelling in the Southern Caribbean Sea from Remote Sensing and Local Data

by
Digna T. Rueda-Roa
1,*,
Tal Ezer
2 and
Frank E. Muller-Karger
1
1
Institute for Marine Remote Sensing, University of South Florida, College of Marine Science, 140 7th Ave. S., St. Petersburg, FL 33701, USA
2
Old Dominion University, Center for Coastal Physical Oceanography, 4111 Monarch Way, Norfolk, VA 23508, USA
*
Author to whom correspondence should be addressed.
J. Mar. Sci. Eng. 2018, 6(2), 36; https://doi.org/10.3390/jmse6020036
Submission received: 6 February 2018 / Revised: 23 March 2018 / Accepted: 27 March 2018 / Published: 5 April 2018
(This article belongs to the Special Issue Applications of Satellite Remote Sensing in Marine Science)

Abstract

:
The southern Caribbean Sea experiences strong coastal upwelling between December and April due to the seasonal strengthening of the trade winds. A second upwelling was recently detected in the southeastern Caribbean during June–August, when local coastal wind intensities weaken. Using synoptic satellite measurements and in situ data, this mid-year upwelling was characterized in terms of surface and subsurface temperature structures, and its mechanisms were explored. The mid-year upwelling lasts 6–9 weeks with satellite sea surface temperature (SST) ~1–2° C warmer than the primary upwelling. Three possible upwelling mechanisms were analyzed: cross-shore Ekman transport (csET) due to alongshore winds, wind curl (Ekman pumping/suction) due to wind spatial gradients, and dynamic uplift caused by variations in the strength/position of the Caribbean Current. These parameters were derived from satellite wind and altimeter observations. The principal and the mid-year upwelling were driven primarily by csET (78–86%). However, SST had similar or better correlations with the Ekman pumping/suction integrated up to 100 km offshore (WE100) than with csET, possibly due to its influence on the isopycnal depth of the source waters for the coastal upwelling. The mid-year upwelling was not caused by dynamic uplift but it might have been enhanced by the seasonal intensification of the Caribbean Current during that period.

Graphical Abstract

1. Introduction

The southern Caribbean Sea experiences pronounced seasonal coastal upwelling from December to April. This well-documented phenomenon is due to offshore Ekman transport caused by the seasonal intensification of the trade winds in the Caribbean Sea [1,2,3,4,5,6]. The upwelling occurs along the coasts of Trinidad, Venezuela, and Colombia between 61° W and 75.5° W [7,8].
The CARIACO Ocean Time-Series Program collected monthly oceanographic observations off northeastern Venezuela, within the eastern region of this upwelling system, between November 1995 and January 2017 (10.50° N, 64.66° W, Figure 1b). The three first years of this time series allowed the detection of a shorter and warmer upwelling between June and August [9]. This mid-year upwelling was subsequently seen in other years of this time series and is distinct and separated from the primary upwelling season [5,8,10,11,12]. In the southeastern Caribbean Sea, coastal upwelling causes sea levels to drop because of both geostrophic adjustment and cooling of the water [3]. Sea-level time series (1992–2001, averaged monthly to remove the tidal effects) in eastern Venezuela explains 78% of SST variability in that area; and historical monthly sea level records on that region dating back to 1948 show the annual manifestation of both the principal and the mid-year upwelling [10]. The mid-year upwelling was also detected on the Colombian Guajira Peninsula [13] and satellite sea surface temperatures have allowed its detection along the entire southern Caribbean upwelling region (Figure 1a) [8,10].
The mid-year upwelling off northeastern Venezuela coincides with the seasonal weakening in wind intensities measured at local coastal meteorological stations [9,11]. This raised the question of which mechanism may drive this mid-year upwelling process. For example, upwelling can be driven by the curl of the wind [8,14,15,16] and by variations in the strength and position of a fast current flowing next to the continental slope [17]. Spatial gradients of wind stress over the sea surface causes wind stress curl that, depending on its direction, generates Ekman suction (upwelling) or pumping (downwelling) [14,15,16]. Curl-driven open-sea upwelling has been documented for the southern portion of the Caribbean Sea [8]. Dynamic uplift is an upwelling mechanism completely independent of local winds. Variations in the strength and/or position of a fast flowing current next to the continental slope produces changes in the thermocline’s depth and position on the inshore side of the current [17]. A faster boundary current will cause a shallower thermocline on the inshore side of the current. When the current changes position and impinges on the outer shelf, it produces an upwelling event through dynamic uplift [17]. The southern Caribbean upwelling system has a fast current next to the continental slope, the Caribbean Current. In situ data and models indicate an intensification of the Caribbean Current during June and July [18,19], which coincides with the mid-year upwelling.
Here we examined the surface and subsurface temperature structures of the mid-year upwelling period and determined the dominant driving process, i.e., whether it be the wind or the variations in the Caribbean Current. The upwelling system along the entire southern Caribbean Sea, and in particular at the two strongest upwelling foci located in the east (63–65° W) and west (70–72.5° W) areas (Figure 1a, [8]) were analyzed. Satellite sea surface temperature (SST) and vertical profiles of temperature from the CARIACO Ocean Time-Series Program were used to describe and contrast the mid-year upwelling with the principal upwelling. Satellite ocean winds were used to calculate upwelling transport due to alongshore wind (cross-shore Ekman transport, csET) and to the wind curl (Ekman suction/pumping, WE). To measure the variations in the position and strength of the Caribbean Current along the continental slope, satellite-derived ocean currents were used to find the core of the maximum speed and its latitudinal position. We describe the seasonal and regional differences between the principal and mid-year upwellings and between the three upwelling mechanisms studied.

2. Data and Analysis Methods

2.1. Synoptic Satellite Data

Sea surface temperature (SST): Infrared satellite images collected by the Advanced Very High-Resolution Radiometer (AVHRR, 1 km pixel resolution) were used to construct weekly SST means over the period January 1994–December 2009 for the Caribbean Sea. Images were collected by a ground-based L-band antenna located at the University of South Florida (St. Petersburg, Florida, U.S.A.; available at http://imars.usf.edu/). Cloud masking of the AVHRR images followed the method of Hu et al. [20] based on the standard deviations of a weekly SST climatology derived for each pixel for the region [8]. Long-term SST regional averages (1994–2009) were calculated on two broad regions: for the Caribbean Sea south of Puerto Rico (8° N to 18° N and 61° W to 84° W) and for the southern Caribbean upwelling system (10° N to 13.5° N and 61° W to 75.5° W); see Figure 1a.
Wind: Daily ocean wind fields for November 1999–October 2009 were derived using the SeaWinds instrument on the QuikSCAT satellite (Quick Scatterometer, spatial resolution of 0.25 degree per pixel). Data were obtained from the JPL Physical Oceanography Distributed Active Archive Center (PO.DAAC). Due to contamination by radar backscatter from land, there is at least a ~25 km gap between the QuikSCAT measurements and the coast [21]. From 25 km offshore and beyond, scatterometer wind retrievals are expected to be accurate to better than 2 m s−1 in speed and 20° in direction [22]. Daily zonal and meridional QuikSCAT wind components were used to calculate weekly and long-term averages of wind speed and wind stress components [23] using a drag coefficient that includes curve fit for low and high wind speeds [24,25]. All average stress estimates were computed based on daily observations. The relative vorticity of the wind (wind stress curl) was calculated using wind stress components from one pixel to the east/west and to the north/south from each grid point [26].
Ekman transport (ET m2 s−1) was calculated as per Bakun [23]. Cross-shore Ekman transport due to alongshore wind (csET, m3 s−1, depth integrated transport per meter of coastline) was calculated by projecting the nearshore wind vector to a direction parallel to the local coastline [23,27,28]. Vertical velocity due to Ekman pumping/suction (WE [m d−1]) was calculated with the wind stress curl [29]. To compare the upwelling transport produced by alongshore winds to the upwelling transport generated by the wind curl, we converted WE velocity to WE transport (m3 s−1 per meter of coast) by integrating WE vertical velocity from the coast to 25, 50, 100, and 200 km offshore (named WE25, WE50, WE100, and WE200, respectively). Total transport was calculated as the sum of csET and integrated WE. For more information on the calculations of those parameters, see Rueda-Roa and Muller-Karger [8].
Weekly coastal time series of SST and wind products were extracted nearshore along the coastline of the southern Caribbean upwelling system. To evaluate the agreement between nearshore winds measured with satellite with those measured on the coast, we compared the wind annual cycles from two mainland coastal stations (Cumaná, 1986–2007, and Coro, 1996–2007) and one island station (Aruba, 1999–2006) with the QuikSCAT wind extracted from the pixels closest to those locations. Daily averaged wind speeds from the land-based locations were obtained from the National Climatic Data Center (NCDC). Weekly time series of SST and csET were spatially averaged within two boxes defined as the east (10–11.5° N, 63–65.5° W) and west (11.3–12.9° N, 70–72.5° W) upwelling areas (Figure 1). After masking the land and areas with marked fresh-water influence (determined by Rueda-Roa and Muller-Karger [8]), the effective area within each box was close to 26,400 km2 (26,356 and 26,361 km2 for the east and west boxes, respectively). Integrated WE transports were averaged along the longitudinal extension of each area (i.e., east 63–65.5° W, west 70–72.5° W).
Caribbean Current: The Caribbean Current variability was studied using the near-surface ocean current estimates from the Ocean Surface Current Analyses project (OSCAR; Earth Space Research, https://www.esr.org/research/oscar/). OSCAR currents are a combination of Ekman and geostrophic currents and are based on QuikSCAT winds and TOPEX Poseidon sea level height measurements [30,31]. The OSCAR model calculates the average current speed and direction over the top 30 m of the upper ocean every 5 days and for 1/3-degree grids. Near-surface currents were derived using quasi-linear and steady flow momentum equations, neglecting local acceleration; non-linearity was not accounted for in the product. The latitude and speed (CCspeed and CClat) of the core of the Caribbean Current, identified as the region of maximum speed, were extracted every 1/3 degree of longitude along the southern Caribbean. Current velocities were interpolated to weekly resolution for correlation analyses with other variables.

2.2. In Situ Data

Monthly CTD data collected by the CARIACO Ocean Time-Series Program (b, 1996–2013) were used to examine vertical temperature profiles with a depth resolution of 1 m. For details about the hydrography at this location, the reader is referred to [11,32,33,34,35].

3. Results

3.1. Temporal and Spatial Temperature Characteristics of the Mid-Year Upwelling

Throughout the year, surface coastal waters in the upwelling region showed lower temperatures compared to surface water of the Caribbean Sea. The long-term (1994–2009) sea surface temperature (SST) average for the upwelling area box was one degree cooler than that in the Caribbean Sea box (Figure 1a, 26.9 ± 1.1° C and 27.9 ± 0.9° C, respectively, p < 0.0001). Closer to the coastline, SST was even cooler (25.9 ± 1.5° C, Figure 2). During the mid-year upwelling, the upwelling system also had lower SSTs than the Caribbean Sea (Figure 1a, average June–August 27.2 ± 0.7° C and 28.1 ± 0.5° C, respectively, p < 0.0001). From December to July, the SST in the upwelling box was at least one degree cooler than the Caribbean Sea box. During the season of weaker upwelling (September–November), the upwelling SST was still at least 0.6° C cooler than the Caribbean Sea. This yearlong SST difference between the Caribbean Sea and the upwelling area allows the use of SST to characterize the upwelling intensity in the upwelling region.
The mid-year upwelling occurred between June and August along the entire Caribbean upwelling system, from 61° W to 75.5° W, at the same geographical locations as the principal upwelling. However, the signal was weaker at the eastern and western extremes of the study area (Figure 1a and Figure 2a). In the westernmost area, the Magdalena River discharges and the Panama–Colombia Gyre attenuate upwelling [36], and in the easternmost portion, the Orinoco plume masks the upwelling SST signal [8]. Therefore, the region between 62° W and 74° W was chosen for the SST description. The average coastal SST during the mid-year upwelling (June–August) was 25.7 ± 1.2° C, with minima typically occurring between mid-June and mid-July (24.1 ± 1.1° C, at 6.9 ± 0.6 months). The principal upwelling occurred between December and April (seasonal SST average 24.7 ± 1.2° C), with minima around the end of March (SST average 23.1 ± 1.1° C, at 3.3 ± 0.3 months). Warmer coastal SSTs occurred between September and October (27.3 ± 1.0° C), which was still cooler than the Caribbean Sea box during the same period (29.0 ± 2.4° C).
The mid-year upwelling extends the period during which cooler and nutrient-rich waters are present in the coastal region. Using a threshold of SST <26° C to define upwelling (which is 0.9° C cooler than the long-term average of the upwelling box, Figure 1a), the principal upwelling lasted 4.8 ± 0.8 months. When including the mid-year upwelling, the upwelling season lasted over half of the year (6.5 ± 1.5 months) and up to 9.5 months in some areas (Figure 2c).
The principal upwelling SST minimum occurred synchronously along the southern Caribbean upwelling system. However, the mid-year upwelling peak, derived from the average coastal SST, showed a time lag toward the west (R2 = 0.68, p < 0.001, dotted line on Figure 2a). The westward propagation speed of the mid-year SST minimum, as calculated by the linear regression equation, was 1.1 m s−1; taking ~12 days to propagate ten degrees of longitude along the coast. For example, at 63° W, the mid-year SST minimum occurred at the end of June while at 72° W it occurred in the second week of July.
Monthly temperature–depth profiles from the southeastern Caribbean Sea (Figure 3, CARIACO Ocean Time-Series station, 1996–2013) show a similar upwelling cycle as Figure 2. Long-term temperature averages close to the surface (2 m) show the primary upwelling temperature minimum in February–March (23.9 ± 1.4° C) and the secondary upwelling peak in July (25.7 ± 1.2° C). At a depth of 25 m, the cooler waters of both upwellings lasted longer: from February to April for the principal upwelling (22.8 ± 1.2° C) and from July to August for the mid-year upwelling (23.6 ± 1.4° C). At 25 m, the temperature difference between the principal and the mid-year upwellings was only 0.8° C, compared to 1.8° C at the surface (Figure 3b). Oceanographic cruises at the CARIACO Ocean Time-Series station were typically done around the tenth of the month. Hence, the measurements taken during June were collected before the mid-year upwelling usually starts (Figure 2). The seasonal maximum temperature at the surface was in September, while at 25 m it occurred in November.

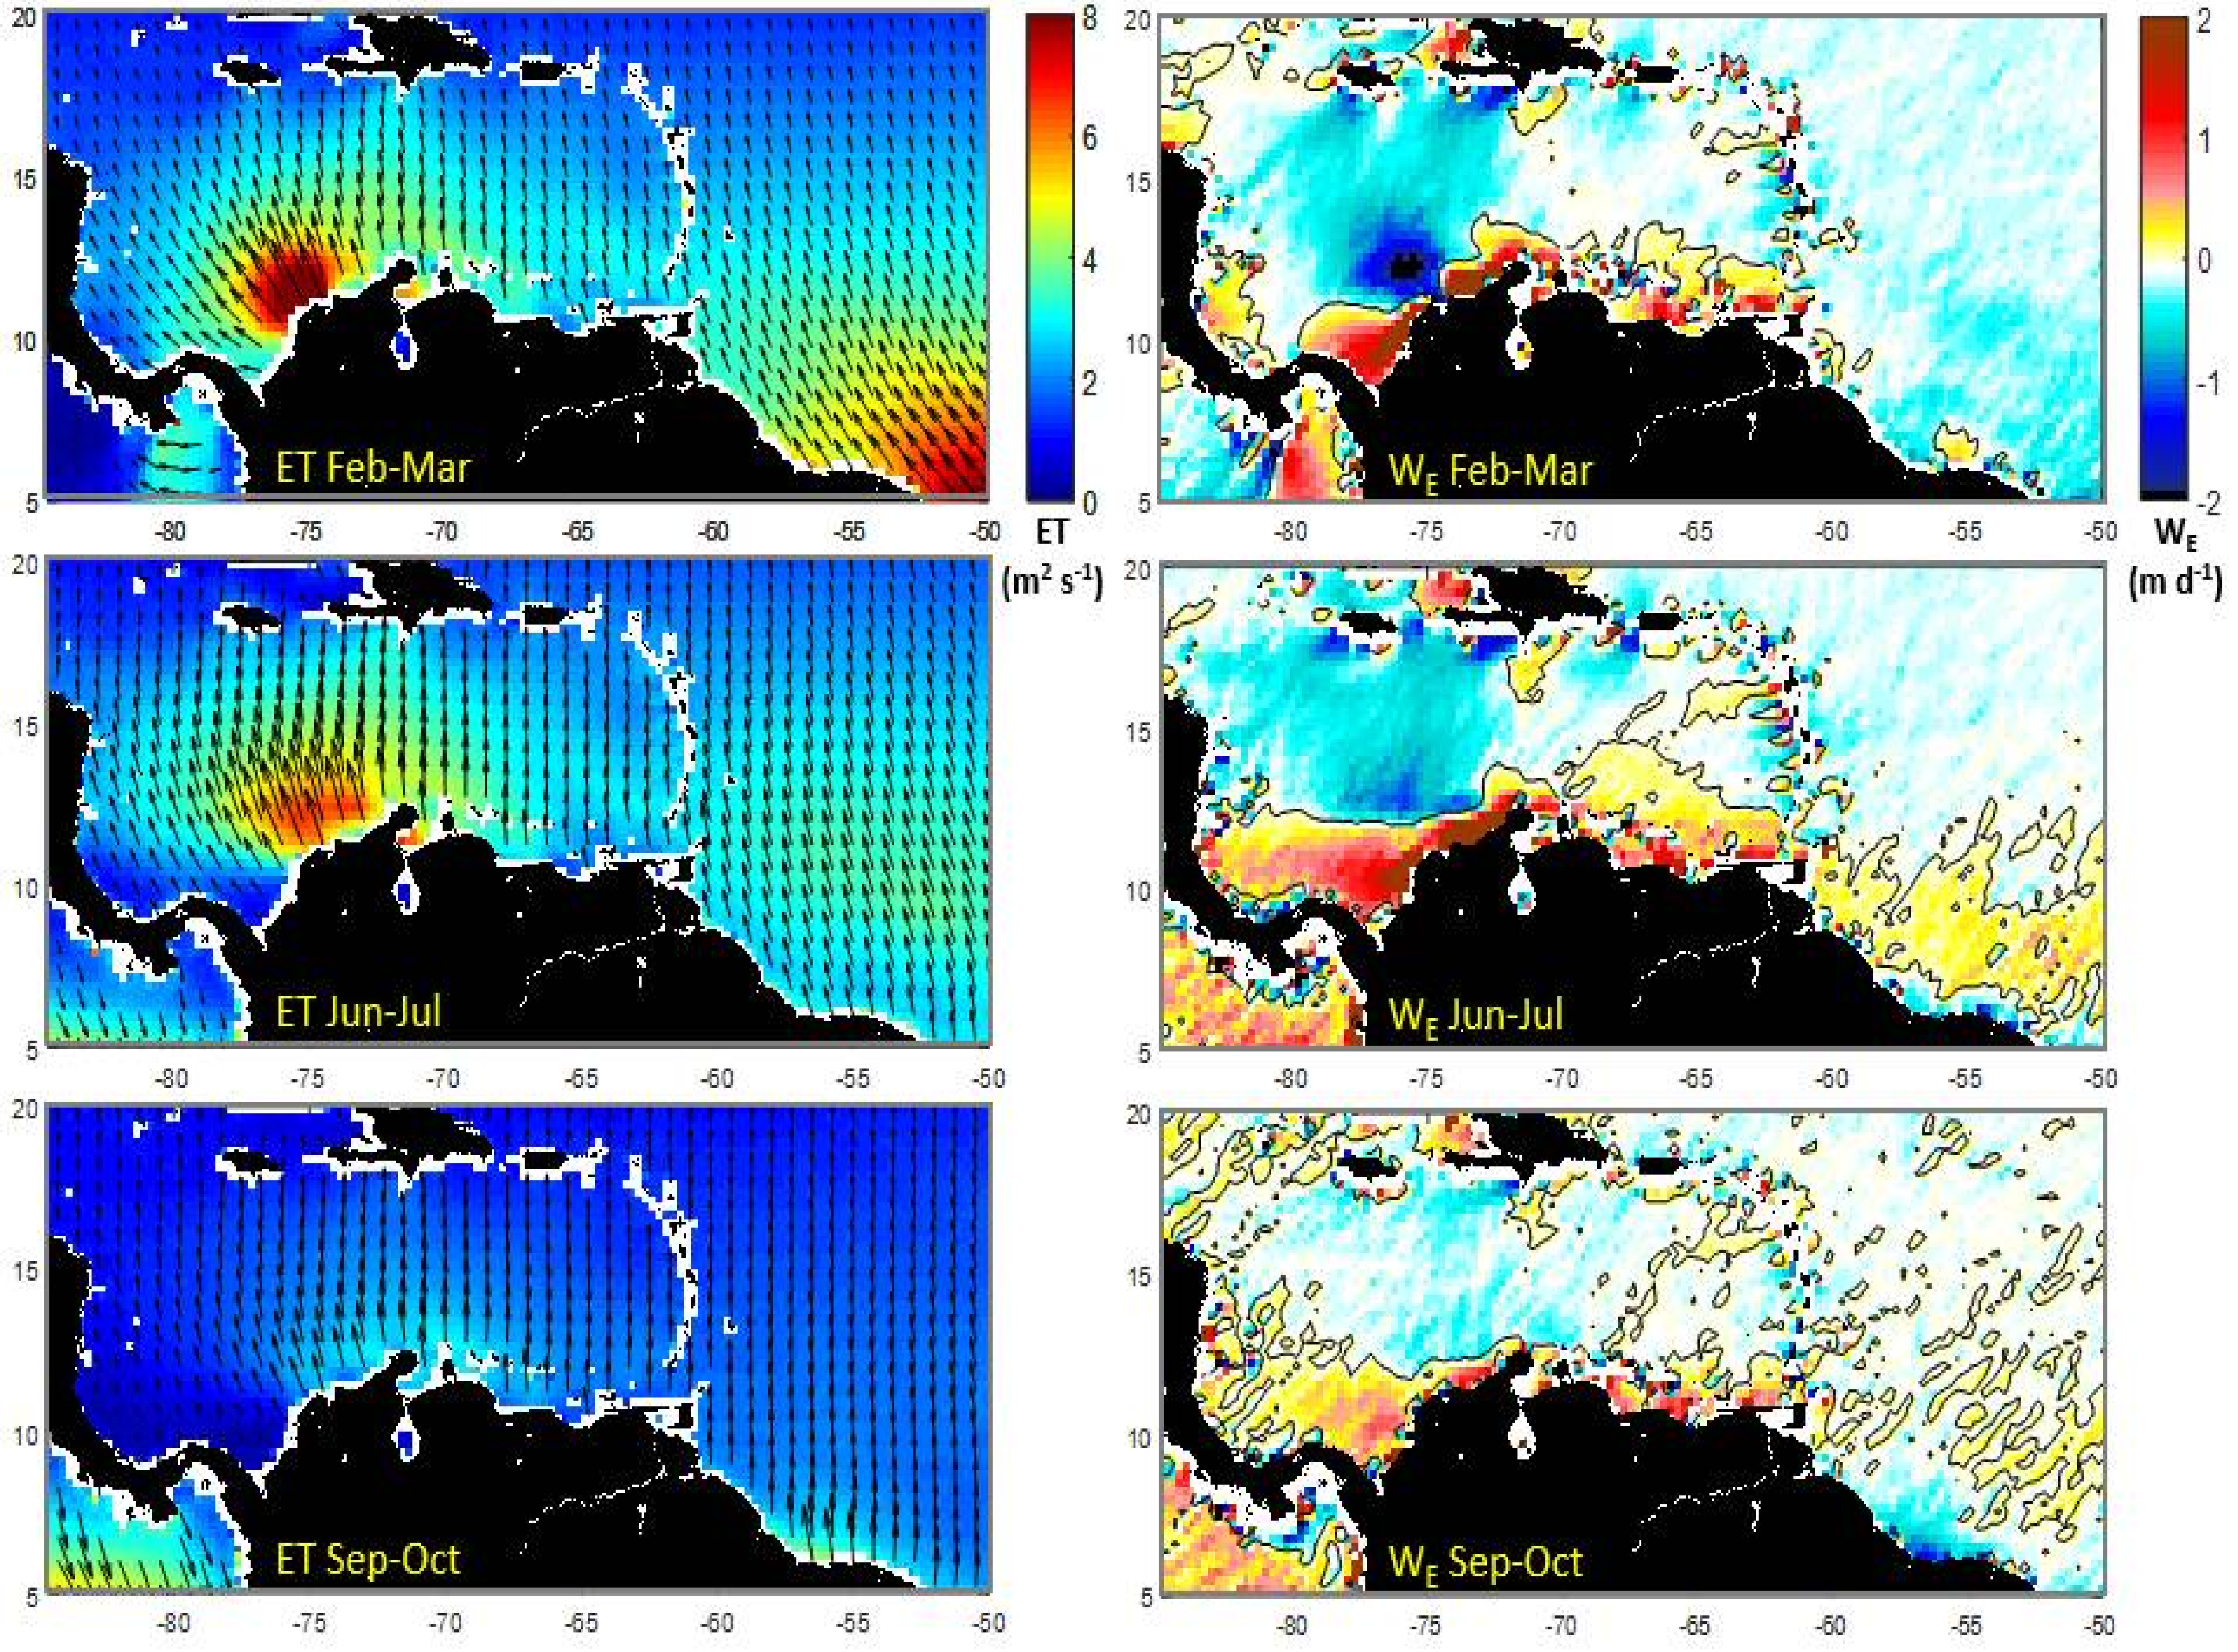
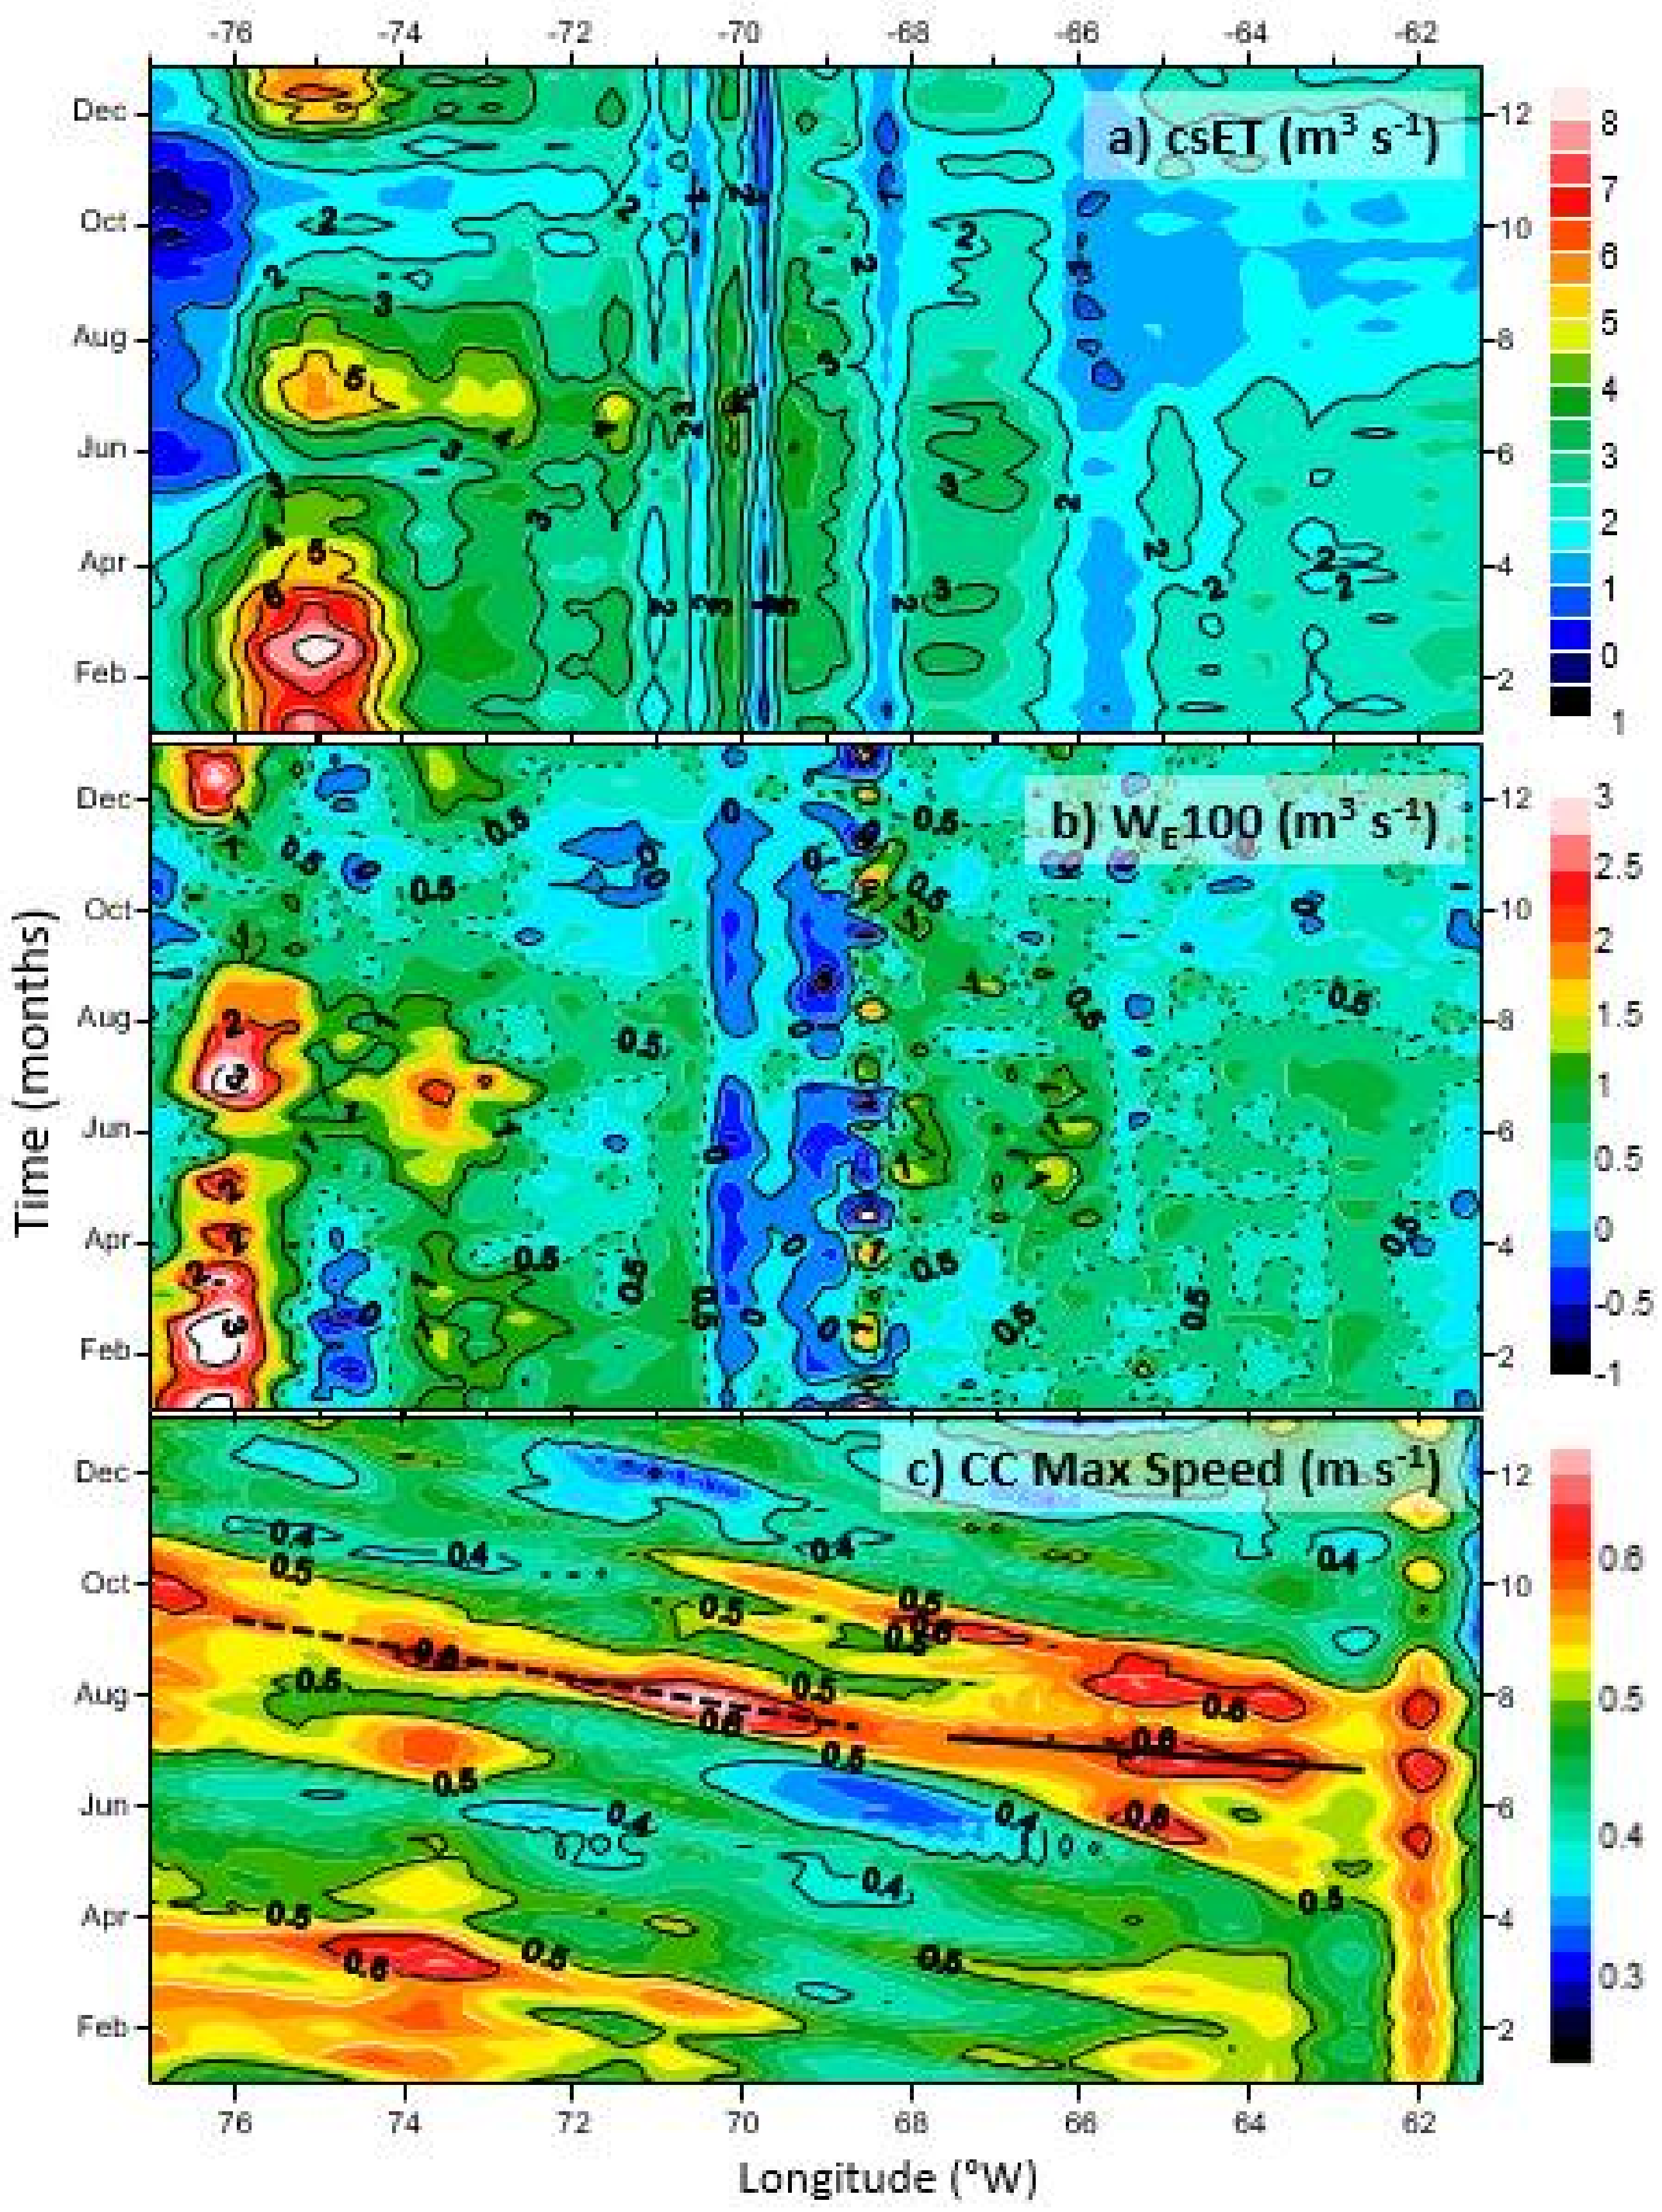
3.2. Regional Wind-Induced Transport

The southern Caribbean experienced upwelling favorable offshore Ekman transport (ET, 1999–2009) year round, even during the warmer season of September–October (Figure 4). During the mid-year upwelling, the ET average (June–July 3.5 ± 1.4 m2 s−1) for the upwelling area (red box in Figure 1a) was only slightly smaller than during the principal upwelling (February–March, 3.7 ± 1.6 m2 s−1). During the warmer season with minimum wind speed, ET values were still on average around 60% of those seen during the upwelling season.
Wind curl was always positive in the southern Caribbean Sea. This caused year-round open-sea upwelling in the region (positive values for Ekman pumping/suction velocity WE, Figure 4). During June–July, positive WE was observed from the eastern tropical North Atlantic to the western Caribbean when the offshore extent of positive WE was wider. This was caused by the seasonal intensification of the Caribbean low-level jet [37,38]. The WE for the upwelling area during the mid-year upwelling was 1.5 times as large as during the peak of the principal upwelling (June–July 0.47 ± 1.47 m d−1, February–March, 0.32 ± 1.23 m d−1). The WE average during September–October was smaller but still positive (0.11 ± 2.05 m d−1).

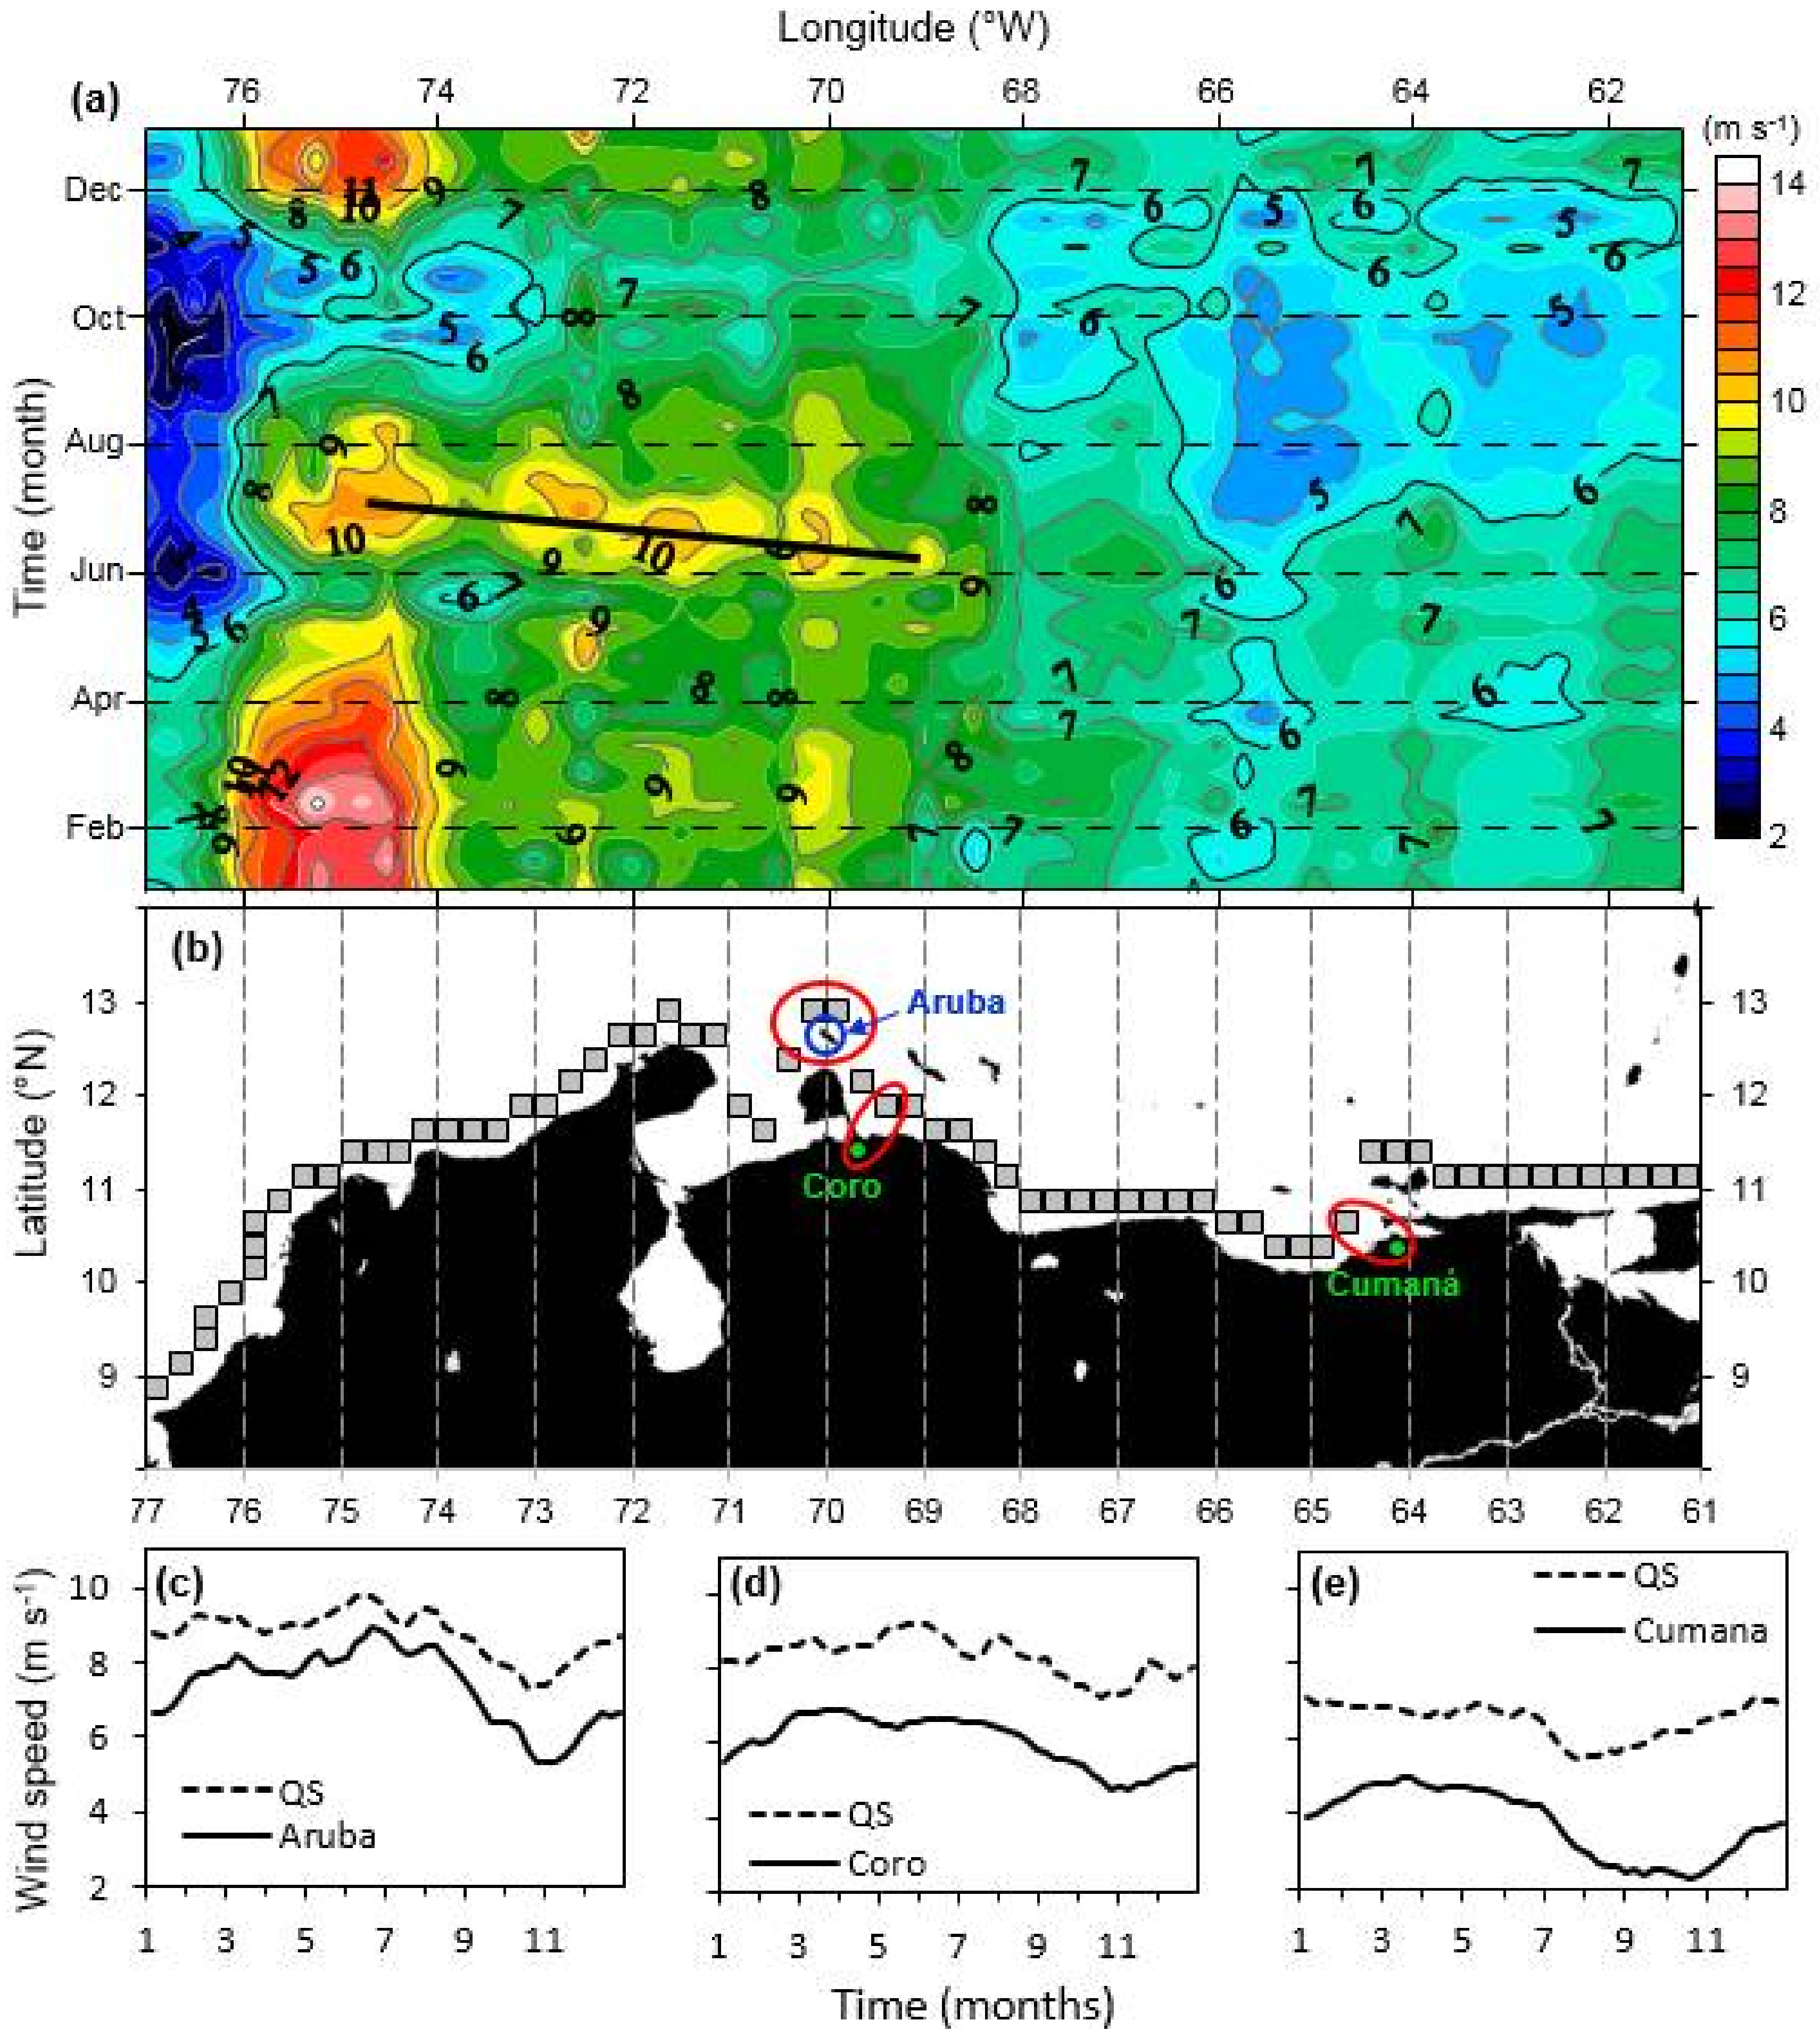
3.3. Nearshore Wind-Derived Parameters

The long-term average (1999–2009) of wind speed along the coast between 62° W and 74° W was 7.3 ± 1.7 m s−1 and the climatological minima were over 4 m s−1 (Figure 5a). This value exceeded the minimum threshold of 3 m s−1 for accurate wind retrievals by QuikSCAT [39]. QuikSCAT wind parameters were extracted at least 25 km off the coast (Figure 5b) to avoid backscatter contamination from land [19].
The nearshore QuikSCAT weekly winds were compared to the wind measurements from two mainland coastal meteorological stations (Coro and Cumaná), which were located close to the west and east upwelling areas, and with one meteorological station in the Aruba Island that is exposed to open sea conditions (Figure 5c–e). Linear regressions between the wind time series from land-based and satellite showed direct and significant relationships (p < 0.001, r = 0.77, 0.55, and 0.41 for Aruba, Coro, and Cumaná, respectively). The three coastal stations and particularly the mainland stations had lower values than the satellite nearshore winds. Winds recorded at Aruba, Coro, and Cumaná were 16%, 27%, and 33% slower than their nearest satellite pixels. Decreased wind speed toward the coast is expected and it is attributed to increased friction with the land [40,41].
The mid-year upwelling was first detected with data from the CARIACO Ocean Time-Series station for the period 1995–1998 [9]; but, contemporaneous wind data from the nearby Cumana meteorological station slowed down during the mid-year upwelling [9]. However, the coastal satellite wind analyzed in this work showed that the wind speed remained high during the mid-year upwelling in this region. The annual wind speed cycles at Aruba and Coro were similar to those of QuikSCAT (Figure 5c,d). However, in northeastern Venezuela the wind cycle at Cumaná was sinusoidal with a maximum in February–June and a minimum in August–November. The corresponding satellite wind cycle displayed a maximum between December and June, a minimum in August, and a gradual increase during September–November until December (Figure 5e). This is consistent with ship-based observations in this region [42]. Cumaná is flanked by mountains to the east and south of the meteorological station, which blocks wind from due east or winds coming between the east and southeast, which are typical during September–October. The similarities between the winds from Aruba and Coro with their nearshore satellite winds and the similarity of nearshore wind at 64.5° W with the historical ship-based wind [40] gave reliability to the nearshore ocean wind retrieved by QuikSCAT. It also indicates that the differences in wind intensity and wind seasonal cycles between nearshore and coastal winds were real.
The seasonal cycle of nearshore wind speed showed winds ≥6 m s−1 along the entire coastal upwelling system during the mid-year upwelling (Figure 5a). West of 68° W, nearshore speeds were ~30% higher than to the east. Winds >10 m s−1 occurred December to April in the westernmost region of the upwelling system (74–76° W). However, this region showed the warmest SST and weakest SST upwelling signal of the study region with seasonal SST minima >25° C (Figure 2a). Nearshore wind directionality was between east and northeast during the principal upwelling and it became more aligned to due east for the rest of the year (January–February, 79 ± 7°; June–July, 86 ± 6°; September–October, 88 ± 14°). The seasonal standard deviations indicate very constant wind directionality during both upwelling periods and a more variable directionality during the season of lower winds. Similar to the coastal SST climatology, there was a westward lag in the nearshore wind speed during the middle of the year (Figure 5a). This lag occurred in the western half of the study region (between 69° and 75° W). However, the propagation speed of the wind lag (0.39 m s−1) was only a third of the propagation speed of the mid-year coastal SST.
Cross-shore Ekman transport (csET) was upwelling favorable (positive) year round (Figure 6a), including during the season of lowest wind speed (e.g., Figure 5a). The seasonal cycle of csET closely followed changes in the nearshore wind speed cycle due to the high prevalence of alongshore winds in the region (86%). The exception was where the coastline was nearly perpendicular to the predominant wind direction (e.g., Figure 5b). Although upwelling intensity (SST) was closely related to csET, there were two areas with coastlines fairly aligned to the wind where the SST did not follow csET. The first area was between 74° W and 75.5° W, and had the strongest csET of the region, but the principal upwelling SST expression was weak and the mid-year upwelling SST was minimal (Figure 2a). The other area was between 61° W and 62° W, which showed high csET from December to July. Nevertheless, this region also showed a weak upwelling SST signal. Both areas had a strong influence of freshwater input from riverine discharge [8].
Upwelling transport due to the wind curl integrated to 100 km offshore (WE100) was positive nearly all year along the southern Caribbean (Figure 6b), which facilitated upwelling by Ekman suction. The exception areas were between 68° W and 70° W with negative values most of the year, and 74–75° W with negative values during the principal upwelling. The rest of the upwelling system showed WE100 at least 0.5 m3 s−1 or higher from December–January and July–August (Figure 6b). This value peaked between 72.5° W and 75° W during the mid-year upwelling. The highest values of WE100 were outside the upwelling system, west of 76° W, which was also the area with very high SST and a muted seasonal SST signal.
The total transport, calculated as the sum of the transport due to alongshore winds (csET) and the transport due to the wind curl (WE100), was positive all year round. These results indicate that the southern Caribbean showed perpetual upwelling with two periods of strong upwelling (principal and mid-year upwelling) and a period of weak upwelling (September–November). The transport due to alongshore winds was the most important upwelling mechanism, comprising around 87% of the total transport.

3.4. Caribbean Current Maximum Speed

The core of the Caribbean Current was identified as the region of maximum speed and its velocity and latitudinal location (CCspeed and CClat) were extracted every 1/3 degree of longitude along the southern Caribbean (Figure 6c). The Caribbean Current core had a long-term mean (1999–2009) of 0.48 m s−1 (SD 0.14 m s−1, range 0.07–1.20 m s−1) and it was located on average ~2.2° degrees north of the southern Caribbean coastline. CCspeed showed a strong seasonality with a principal maximum between June and September and a secondary maximum between January and April (Figure 6c). The highest mean speed was observed during June–August (0.53 ± 0.15 m s−1) with localized maxima between 0.74 and 1.17 m s−1.
CCspeed showed westward propagation of variations in the current west of ~63° W. The propagation velocity varied with both longitude and season (Figure 6c). For example, the fastest propagation speed occurred between 63° W and 67° W during the CCspeed seasonal maximum of June–July (average of 0.34 m s−1). Between 69° W and 76° W, the propagation speed during the CCspeed maximum (July–August) was slower and similar to that for other seasons in the whole area (0.16 m s−1, Figure 6c). In the Caribbean Sea, the features that propagate westward are eddies or meanders of the Caribbean Current (e.g., [43,44,45,46,47,48]). The propagation speeds of such anomalies were estimated at 0.11–0.15 m s−1 using satellite altimeter data [43,48,49] and models [44] and they agree with our estimates. The propagating features in the Caribbean Current occurred all year round. The propagation speeds of these features were around 10 times slower than the westward development of the mid-year SST minimum (1.1 m s−1).

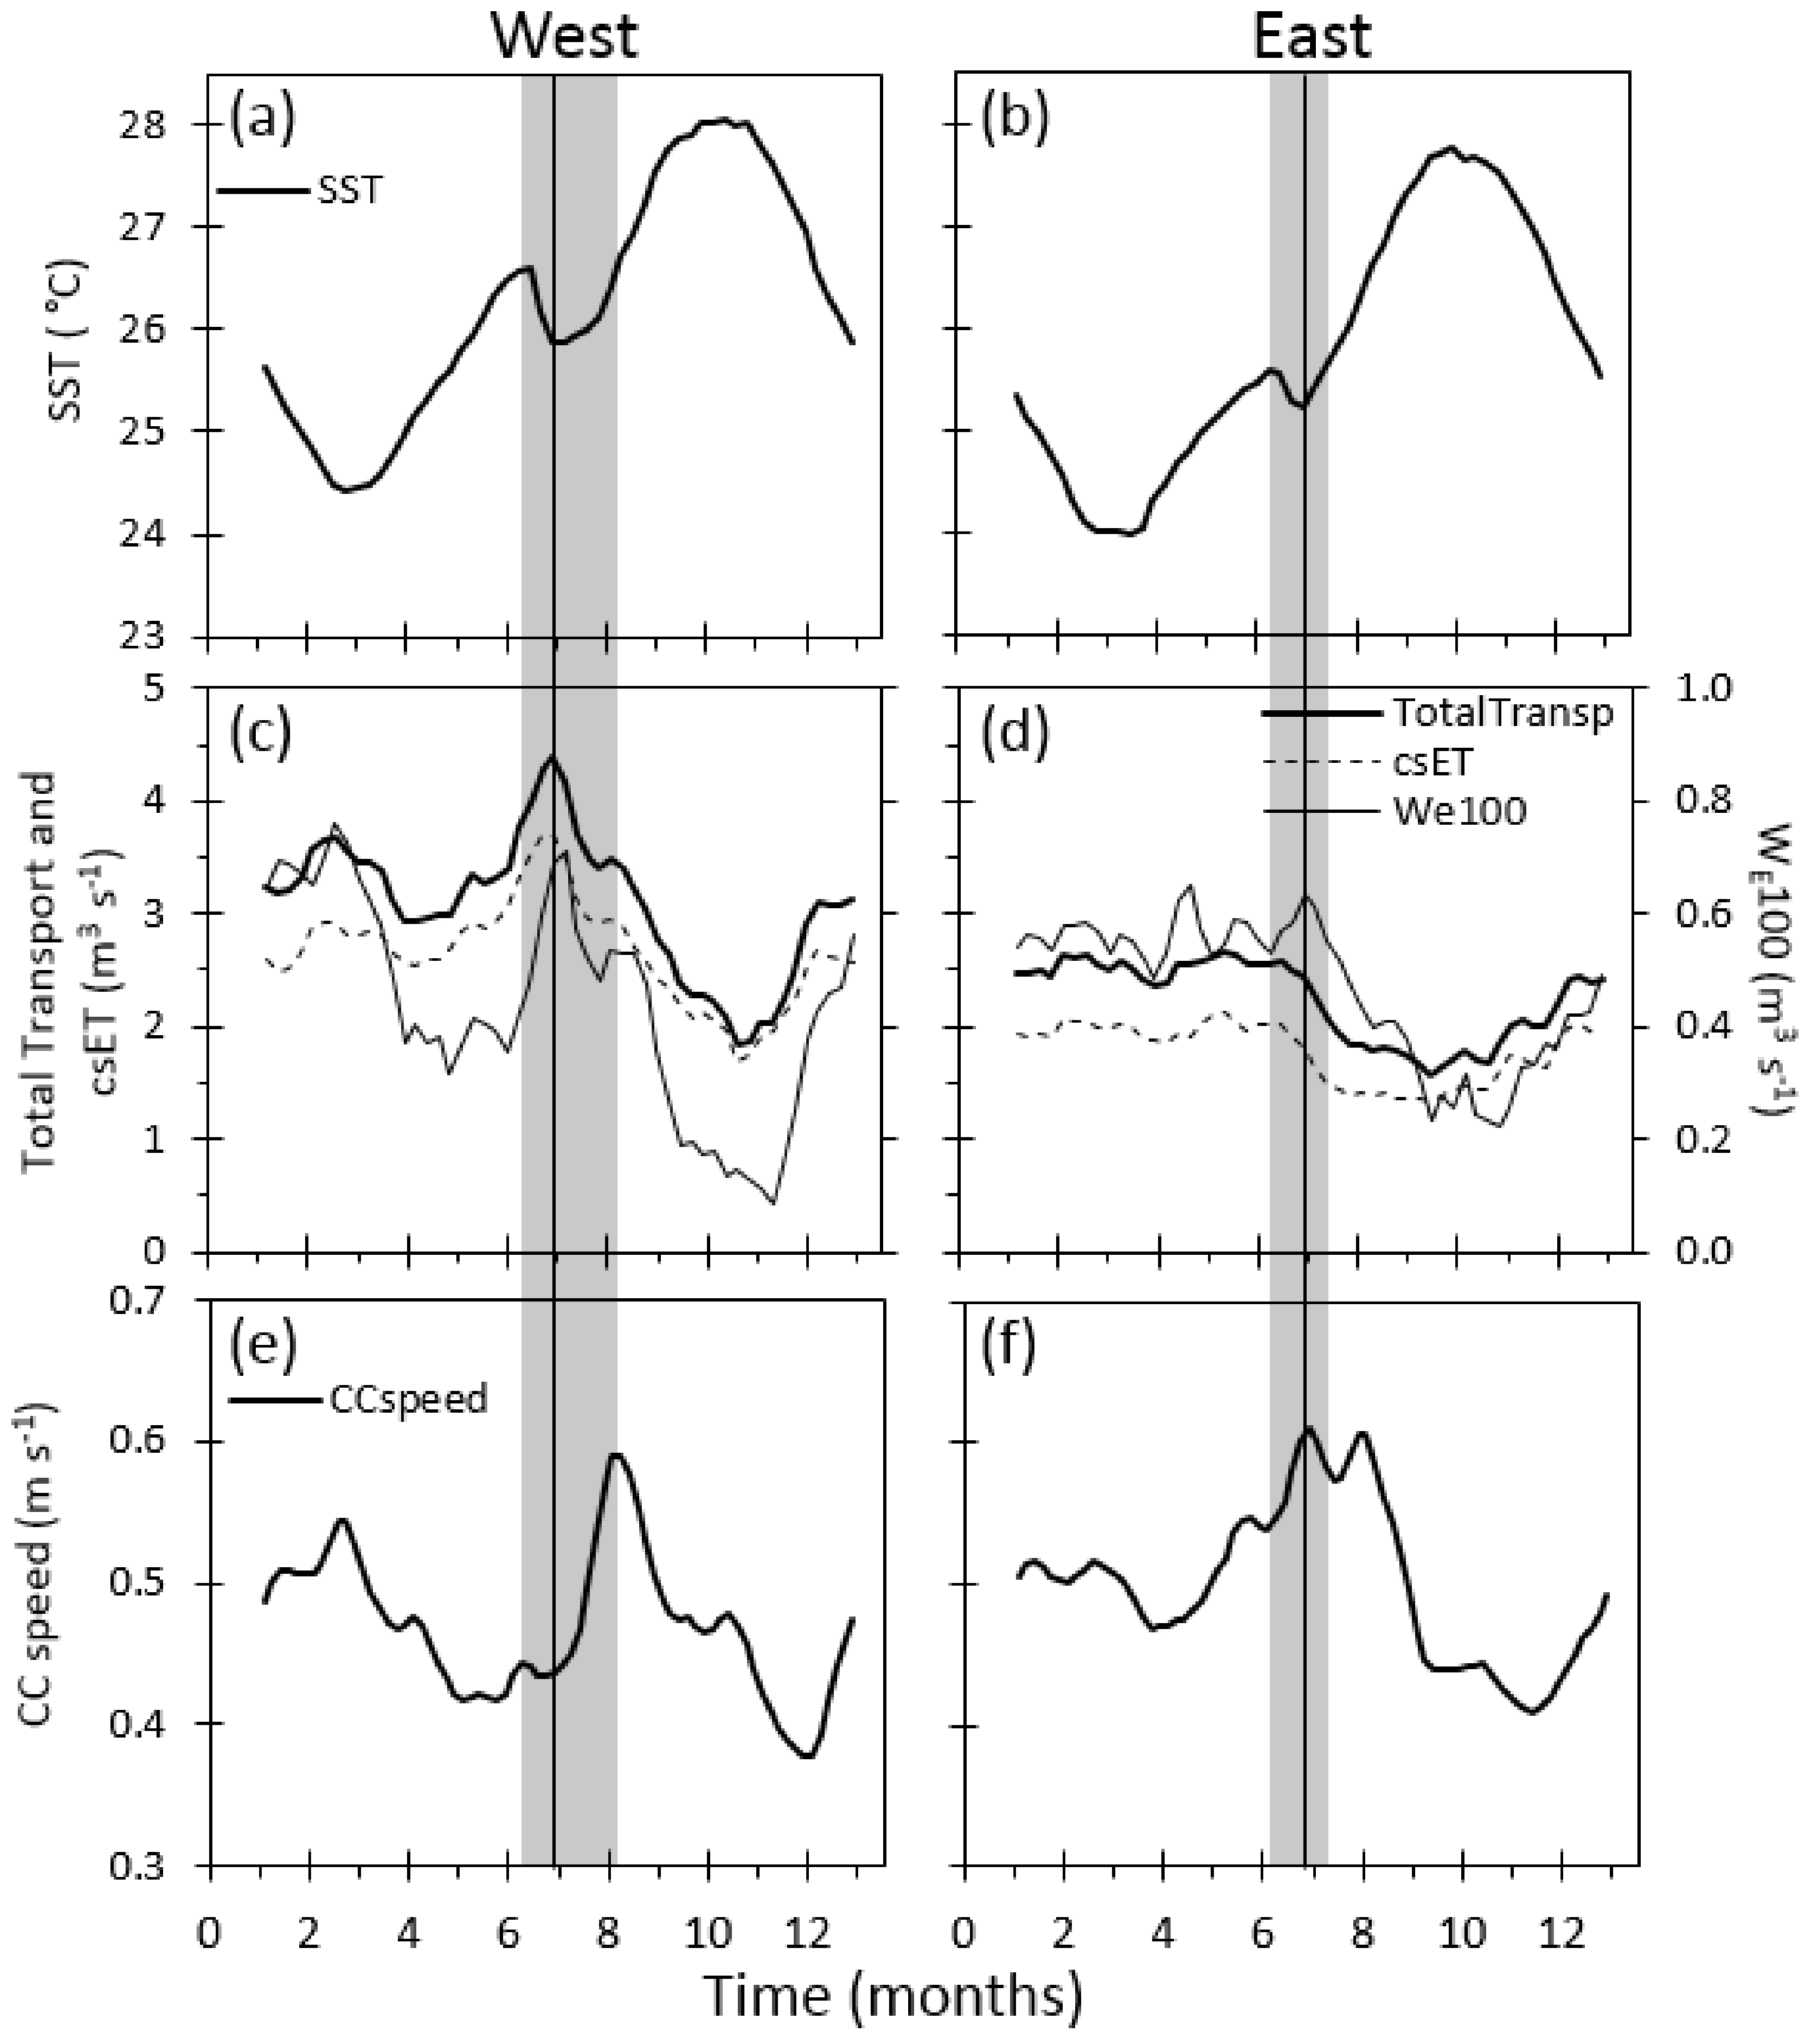
3.5. Averages over the West and East Upwelling Areas

Two areas (east and west areas; Figure 1, [8]) that showed the maximum upwelling cooling were examined to evaluate the variability in upwelling intensity due to the three upwelling mechanisms. The continental shelf extension in the east area is relatively uniform at ~100 km. Instead, the west area shows a shelf of variable width (20–150 km, with a mean of 40 km; Figure 1b, [50]). Both areas show continental shelves with gentle cross-shelf slopes (east 2 m km−1, west 5 m km−1).
The seasonal SST cycles were similar for both upwelling areas (Figure 7a,b) with cooler SSTs in the east than in the west region (Table 1). The minimum SST during the principal upwelling occurred in February–March for both areas. The onset and peak of the mid-year upwelling also occurred at the same time in both areas but it lasted longer in the west area (Figure 7a,b). This result was different from the upwelling duration obtained following the 26° C threshold (Figure 2c). Under this criterion, the west area’s mid-year upwelling was shorter than in the east area. The reason for this discrepancy was that the west area showed a warmer mid-year upwelling SST than the threshold (i.e., >26° C, Table 1).
Positive (upwelling inducing) cross-shore Ekman transport occurred all year round at both the west and east areas (Figure 7c,d). Only ~0.7% of negative csET occurred in the west during the time series and none for the east. Both upwelling regions had a high prevalence of alongshore winds, which led to a high proportion of csET in relation to Ekman transport (west 82%, east 91%). The west upwelling area had csET ~50% higher than the east (Table 1, Figure 7c,d). Both zones had higher csET values between December and June (1.98 ± 0.50 and 2.84 ± 0.86 m3 s−1, for east and west, respectively). While in the east area csET started to diminish at the end of June, the west zone had a prominent csET maximum at that time (average June–July: 1.66 ± 0.42 and 3.29 ± 0.71 m3 s−1, for east and west areas, respectively). Since the correlations between SST and the wind curl integrated to different offshore distances were higher for WE integrated to 100 km offshore, the seasonality of WE100 is presented in Figure 7 c and d. The vertical transport generated by the wind curl from the coast to 100 km offshore was upwelling favorable (positive) all year round in both areas, with positive values during most of the time series (88% and 93% for the west and east areas, respectively). The annual means of WE100 for both upwelling areas were similar (Table 1). The west area had two pronounced maxima of similar intensity, one during December–March and another from mid-June to mid-July. In the east area, WE100 had stable high values from December until the end of July, one month longer than for the csET cycle. The upwelling total transport (csET + WE100) followed the same annual cycle as that of the csET due to the high contribution of csET to the total transport (west 85.7%, east 78.4%, Figure 7c,d, Table 1). The WE100 contributions to the total upwelling transport were higher during December–August (west 15.5%, east 22.3%) and lowest during September–November (west 7.6%, east 15.5%).
The annual averages of the Caribbean Current maximum speed were similar for both areas (Table 1), except for differences in seasonal phasing (Figure 7e,f). In the east area, CCspeed started to increase in May, reached a maximum at the end of June, and had a secondary peak at the end of July. In the west area, the CCspeed started to increase rapidly in July and reached a maximum at the beginning of August. The difference in the timing of the two maximum peaks was due to the westward propagation of the Caribbean Current’s maximum speed (Figure 6c). Both areas showed a secondary peak of CCspeed during the principal upwelling in January–March.
The mid-year upwelling period is highlighted in Figure 7 in order to contrast it with the seasonality of the forcing mechanisms studied. The Caribbean Current had a concurrent maximum with the mid-year upwelling in the east area but it peaked at the end of the mid-year upwelling in the west area. Both the Ekman transport due to alongshore winds (csET) and due to the wind curl (WE100) had high values during both upwelling periods. The mid-year upwelling SST minimum of the west area coincided with the seasonal maxima on csET and WE100. In the east region, it corresponded with a small seasonal maximum of WE100 and with high csET values. As soon as both types of Ekman transport started to decline, so did the mid-year upwelling intensity (SST). In the west area, the decline of the cross-shelf Ekman transport during the middle of the year occurred more gradually than for the east region, which explains the extended mid-year upwelling SST in the west. However, the SST cycle did not follow the seasonal variability of csET or WE100 in any of the upwelling areas. These results indicate that both Ekman transports were important for the mid-year upwelling but also suggest that other parameter(s) exerted an important influence on the SST/upwelling seasonality. The only mechanism that increased during the mid-year upwelling at both upwelling areas was WE100; however, it accounted for less than 20% of the total upwelling transport.

3.6. Upwelling Relationship with Forcing Mechanisms

Cross-correlations of SST with different forcing variables for the original time series and their deseasonalized values were calculated (Table 2). The different parameters were deseasonalized by subtracting their weekly climatology from the original weekly time series, and are hereafter called anomalies. Among all the different coastal widths used to calculate the vertical transport generated by the wind curl (25, 50, 100 and 200 km), the distance from the coast to 100 km offshore (WE100) gave the highest correlations with SST for both upwelling areas. The total upwelling calculated with csET + WE100 also rendered the highest correlations with SST. Consequently, only WE100 and csET + WE100 results are shown. Higher correlations were found with no lag or when SST was lagged one week after the dependent variable. Other lags did not yield better correlations. No significant correlations were found with the anomaly of the latitudinal position of the Caribbean Current maximum speed (CClat).
Correlations among the original values of the time series were typically higher than among their deseasonalized anomalies (Table 2). This was expected as the seasonal cycle dominated the correlation in the original time series. The original values of the SST time series were highly autocorrelated up to 9–10 weeks, while their deseasonalized anomalies showed autocorrelations up to 4 weeks. This prolonged SST autocorrelation was due to the large thermal inertia of the oceans because of its high heat storage capacity. Autocorrelations for the other parameters were for shorter lag periods: three weeks for CCspeed, and one week for CClat, csET, and WE100. Correlations between the short-term fluctuations of two time series anomalies are more likely linked to cause–effect processes; therefore, the correlations described below were those obtained for the time-series deseasonalized anomalies. SST showed a better correlation with one-week earlier Ekman transport. One-week leading csET anomalies explained 12% (coefficient of determination R2) of the SST variance in the west area and 6% in the east area. SST correlations with WE100 anomalies were slightly better with a one-week lag and explained around 12% of the SST variance at both upwelling areas (Table 2). The time resolution of our time series was one week and, therefore, those lags could be higher or lower than 7 days. A one to two week lag between water temperature and wind has been observed at the CARIACO Ocean Time-Series Station with weekly data [11]. A daily time series showed higher correlations between zonal wind and lagged SST from eastern Venezuela with maximum correlations around 2 days, but high seasonal correlations still ranged between 10 and 20 days [51], indicating the cumulative influence of wind on this coastal upwelling system.
The inclusion of wind curl upwelling into the upwelling transport calculation (one-week leading anomalies of total upwelling transport, csET + WE100) explained better the SST variability in both areas compared to correlations with the cross-shore Ekman transport alone: west 17%, east 13%, which were 2.1 and 1.5 higher than with the csET alone. Since the direct contributions of WE100 to the total upwelling were relatively low (14–21% of the annual total upwelling for the west and east areas, respectively), the improved correlations with total transport might be more closely related to the wind curl effects on thermocline depth. This was supported by the similarity between the lagged and nonlagged WE100 correlations with SST (not shown). The east area SST had somewhat higher correlations with the Caribbean Current speed than the west area SST. However, SST correlations with the Caribbean Current were much lower than with the wind parameters (Table 2).

4. Discussion

The mid-year upwelling occurred along the entire south central Caribbean Sea, at the same upwelling foci as the principal upwelling (61–75.5° W), and was usually stronger between 62 and 74° W (Figure 2a). The southern Caribbean experienced stronger upwelling from December through August, depending on location, extending what was previously considered the upwelling season (i.e., December–April [1,2,3]). On average, the entire region experienced perpetual coastal upwelling. Both the cross-shore Ekman transport and the total transport were positive year round, indicating wind-induced upwelling transport during the season of weaker winds (September–October). Even at this period, coastal SSTs were 1.7° C cooler compared to the Caribbean interior. The prolonged coastal upwelling in the southern Caribbean upwelling system explained the elevated fish resources found along that region [50].
Data from the CARIACO Ocean Time-Series station showed that at a 25-m depth, cooler waters from both the principal and the mid-year upwelling were observed about one month longer (Figure 3b) than at the surface. Off eastern Venezuela, both turbulence and heat transfer changes the thermal conditions of surface waters [52], which explains how at 25 m the upwelled waters remained cooler longer than at the surface. The depth of the euphotic zone of the CARIACO Ocean Time-Series station is 36.7 ± 12.3 m during the upwelling season (1% PAR, [53]). The extended upwelling at a depth of 25 m led to the sustained high primary production observed in the Cariaco Basin [32].
We analyzed the influence of three upwelling mechanisms: upwelling due to alongshore wind (cross-shore Ekman transport, csET), upwelling due to the wind curl (Ekman suction/pumping, WE), and upwelling due to dynamic uplift by changes in the speed and/or position of the Caribbean Current (CC). The latitudinal position of the CC maximum speed (CClat) was used as a measure of the CC closeness/impinging to the shelf break. However, CClat did not show any correlation with SST. Possibly, the direction of the current might serve as a better proxy for detecting the impingement of the current on the shelf break. Changes in the CCspeed showed weak (but significant) inverse correlations with SST, especially in the east area (Table 2). This correlation might be loosely related to the rising thermocline along the continent as the Caribbean Current gains strength. However, the CC velocity reached maximum values at the end of the mid-year upwelling in the west area, while in the east region it was concurrent with the mid-year upwelling (Figure 7). In this region, the seasonal coincidence between CC velocity and SST might explain the higher correlation between those parameters. However, the temporal asynchrony between those parameters during the middle of the year in the west demonstrated that the Caribbean Current intensification was not the forcing mechanism of the mid-year upwelling.
The results suggest that the mid-year upwelling is not generated by dynamic uplift due to instabilities of the Caribbean Current, but it might be enhanced by the seasonal intensification of the Caribbean Current. Possibly, the satellite ocean current product used might not be suitable for these analyses. The Ocean Surface Current Analyses Project (OSCAR) has some problems reproducing currents in the Intra-Americas Sea due to smoothing and inaccuracies due to land or shallow water [54]. In addition, OSCAR currents do not represent well the energy at time-scales smaller than 40 days [55], which are the time-scales necessary to study upwelling due to dynamic uplift.
The total upwelling transport along the upwelling system was largely due to cross-shore Ekman transport caused by alongshore wind (>78%). Often, csET is the dominant upwelling forcing mechanism in the nearshore region of wind-induced coastal upwelling [56]. However, although wind curl contribution to the total upwelling transport was lower, WE100 anomalies had a significant inverse correlation with SST. This was similar to or higher than those obtained for csET anomalies. Comparable results have been found for the Guajira Peninsula, located on the west upwelling area studied here, showing high and similar SST correlations with both wind stress and wind stress curl (R2 > 0.48, [57]). Cross-shore Ekman transport had much lower variability (low standard deviation relative to its mean) compared to WE100 (Table 1), indicating a relatively stable offshore transport rate, which indicates little variation in the depth of the water source being upwelled. The WE100 low contribution to the total transport but higher correlation with SST anomalies and the higher and relatively constant values of csET indicate that the importance of WE100 in this upwelling system might be related to the lifting of isotherms from the coast to 100 km offshore [14]. Models in the California Current system show that a wide band of positive wind curl (100 km offshore) raises isotherms [58]. The 100 km width is close to the first baroclinic Rossby radius for the southern Caribbean Sea (i.e., ~80 km [59]), which is the preferential length scale at which baroclinic instability will occur.
Although the southern Caribbean SST had significant correlations with wind-driven transport, those correlations were moderate (Table 2) and the seasonal SST cycle did not mirror the seasonality of the upwelling transport due to the wind (Figure 7). Discrepancies between SST and Ekman transport upwelling indexes have been found in different upwelling systems [60,61]. SST captures the spatial upwelling variation due to coastline geometry, terrain, and ocean current circulation but it is influenced by subsurface water temperature and intrusion of other water masses into the upwelling region [62]. In coastal upwelling areas, the coastal zone receives waters from the subsurface offshore zone [63]. Hence, similar wind speed and direction should have the same Ekman transport, but the SST signal of the upwelling would depend additionally on the thermal conditions of the surrounding waters.
Future research in the region should include other SST-derived upwelling indices such as the SST difference between coastal and offshore waters [60,64]. Although warmer, the central Caribbean Sea has similar SST seasonality to the southern Caribbean upwelling region but the SST difference between these regions appears larger during the upwelling period [8]. Further research should also take into account other factors that might influence the wind-driven coastal upwelling in this region, such as the onshore/offshore geostrophic flow [65] and the shape of the continental shelf [66].

5. Conclusions

  • The mid-year upwelling contributes to the extension (December to August) of the upwelling season of the southern Caribbean (previously known from December to April).
  • The principal upwelling mechanism in the southern Caribbean upwelling system, for both the principal and the mid-year upwelling seasons, is the cross-shore Ekman transport, which accounts for more than 78% of the total wind-driven transport.
  • The wind curl integrated over the first 100 km from the coast has a better correlation with the upwelling SST signature than the cross-shore Ekman transport. The process most likely involved is changes in the isopycnal depth due to the curl of the wind. The total transport, calculated by adding both wind-driven mechanisms, has significantly higher correlations with SST than with the cross-shore Ekman transport alone.
  • The mid-year upwelling is not caused by dynamic uplift due to instabilities of the Caribbean Current; however, it might be enhanced by the seasonal intensification of the Caribbean Current.

Acknowledgments

This publication was greatly improved thanks to the insightful commentaries of three anonymous reviewers. We thank the personnel working at Fundación La Salle, EDIMAR, Venezuela, for their continuous efforts in maintaining the CARIACO Ocean Time-Series Program and for their support in acquiring the in situ data presented in this manuscript. This research was carried out under the CARIACO Ocean Time-Series Program. Support was provided by the National Science Foundation (NSF, USA, Grants OCE-0752139, OCE-9216626, OCE-9729284, OCE-9401537, OCE-9729697, OCE-9415790, OCE-9711318, OCE-0326268, and OCE 0963028), the National Aeronautics and Space Administration (NASA, USA, Grants NAG5-6448 and NAS5-97128), the Consejo Nacional de Investigaciones Cientificas y Tecnológicas (CONICIT, Venezuela, Grant 96280221), the Fondo Nacional de Investigaciones Científicas y Tecnológicas (FONACIT, Venezuela, Grants 2000001702 and 2011000353), and Ley Orgánica de Ciencia, Tecnología, e Innovación (LOCTI, Venezuela, Grant CON-EDIMAR 23914).

Author Contributions

D.T.R.-R. and F.E.M.-K.: conceptualization, methodology, and collection of data sets; D.T.R.-R.: data curation and original draft; D.T.R.-R. and T.E.: data analysis and analysis tools; F.E.M.-K.: acquisition of research funding; D.T.R.-R., F.E.M.-K., and T.-E.: reviewing and editing.

Conflicts of Interest

The authors declare no conflict of interest. The founding sponsors had no role in the design of the study; in the collection, analyses, or interpretation of data; in the writing of the manuscript, and in the decision to publish the results.

References

  1. Herrera, L.; Febres-Ortega, G. Kinematics of the wind-generated velocity field in the surface waters off eastern Venezuela, Caribbean Sea. Bol. Inst. Oceanogr. Univ. Oriente 1975, 14, 165–186. [Google Scholar]
  2. Isemer, H.-J.; Bunker, A.F.; Hasse, L. The Bunker Climate Atlas of the North Atlantic Ocean; Air–Sea Interactions; Springer: Berlin, Germany, 1985. [Google Scholar]
  3. Muller-Karger, F.E.; Castro, R.A. Mesoscale Processes Affecting Phytoplankton Abundance in the Southern Caribbean Sea. Cont. Shelf Res. 1994, 14, 199–221. [Google Scholar] [CrossRef]
  4. Muller-Karger, F.; Varela, R.; Thunell, R.; Astor, Y.; Zhang, H.; Luerssen, R.; Hu, C. Processes of coastal upwelling and carbon flux in the Cariaco Basin. Deep Sea Res. Part II Top. Stud. Oceanogr. 2004, 51, 927–943. [Google Scholar] [CrossRef]
  5. Muller-Karger, F.; Varela, R.; Thunnell, R.; Scranton, M.; Taylor, G.; Capelo, J.; Astor, Y.; Tappa, E.; Akl, J.; Ho, T.-Y. Características de la fosa de Cariaco y su importancia desde el punto de vista oceanográfico. Mem. Fund. La Salle Cien. Nat. 2004, 161–162, 215–234. [Google Scholar]
  6. Peterson, L.C.; Haug, G.H. Variability in the mean latitude of the Atlantic Intertropical Convergence Zone as recorded by riverine input of sediments to the Cariaco Basin (Venezuela). Palaeogeogr. Palaeoclimatol. Palaeoecol. 2006, 234, 97–113. [Google Scholar] [CrossRef]
  7. Castellanos, P.; Varela, R.; Muller-Karger, F. Descripción de las áreas de surgencia al sur del Mar Caribe examinadas con el sensor infrarrojo AVHRR. Mem. Fund. La Salle Cien. Nat. 2002, 154, 55–76. [Google Scholar]
  8. Rueda-Roa, D.T.; Muller-Karger, F.E. The southern Caribbean upwelling system: Sea surface temperature, wind forcing and chlorophyll concentration patterns. Deep Sea Res. Part I Oceanogr. Res. Pap. 2013, 78, 102–114. [Google Scholar] [CrossRef]
  9. Rueda, D. Variabilidad Temporal de la Distribución Vertical de la Biomasa Fitoplanctónica en la Cuenca de Cariaco y Sus Relaciones con Los Aspectos Hidrográficos del Estrato Superficial (1996–1998). Master’s Thesis, Universidad de Oriente, Puerto La Cruz, Venezuela, 2000. [Google Scholar]
  10. Rueda-Roa, D. On the Spatial and Temporal Variability of Upwelling in the Southern Caribbean Sea and Its Influence on the Ecology of Phytoplankton and of the Spanish Sardine (Sardinella Aurita). Ph.D. Thesis, University of South Florida, Tampa, FL, USA, 2012. [Google Scholar]
  11. Astor, Y.; Muller-Karger, F.; Scranton, M.I. Seasonal and interannual variation in the hydrography of the Cariaco Basin: Implications for basin ventilation. Cont. Shelf Res. 2003, 23, 125–144. [Google Scholar] [CrossRef]
  12. Goni, M.A.; Aceves, H.L.; Thunell, R.C.; Tappa, E.; Black, D.; Astor, Y.; Varela, R.; Muller-Karger, F. Biogenic fluxes in the Cariaco Basin: A combined study of sinking particulates and underlying sediments. Deep Sea Res. Part I Oceanogr. Res. Pap. 2003, 50, 781–807. [Google Scholar] [CrossRef]
  13. Andrade, C.A.; Barton, E.D. The Guajira upwelling system. Cont. Shelf Res. 2005, 25, 1003–1022. [Google Scholar] [CrossRef]
  14. Gill, A.E. International Geophysics, 30: Atmosphere-Ocean Dynamics; Elsevier: Burlington, VT, USA, 1982. [Google Scholar]
  15. Oey, L.Y. A forcing mechanism for the poleward flow off the southern California coast. J. Geophys. Res. Oceans 1999, 104, 13529–13539. [Google Scholar] [CrossRef]
  16. Capet, X.; Marchesiello, P.; McWilliams, J. Upwelling response to coastal wind profiles. Geophys. Res. Lett. 2004, 31. [Google Scholar] [CrossRef]
  17. Tomczak, M. Upwelling Dynamics in Deep and Shallow Water, Chapter 6. In Shelf and Estuarine Oceanography: An Introduction; Flinders University of South Australia: Adelaide, Australia, 1996. [Google Scholar]
  18. Johns, W.E.; Townsend, T.L.; Fratantoni, D.M.; Wilson, W.D. On the Atlantic inflow to the Caribbean Sea. Deep Sea Res. Part I Oceanogr. Res. Pap. 2002, 49, 211–243. [Google Scholar] [CrossRef]
  19. Rhein, M.; Kirchner, K.; Mertens, C.; Steinfeldt, R.; Walter, M.; Fleischmann-Wischnath, U. Transport of South Atlantic Water through the passages south of Guadeloupe and across 16°N, 2000–2004. Deep Sea Res. Part I Oceanogr. Res. Pap. 2005, 52, 2234–2249. [Google Scholar] [CrossRef]
  20. Hu, C.; Muller-Karger, F.; Murch, B.; Myhre, D.; Taylor, J.; Luerssen, R.; Moses, C.; Zhang, C.; Gramer, L.; Hendee, J. Building an Automated Integrated Observing System to Detect Sea Surface Temperature Anomaly Events in the Florida Keys. IEEE Trans. Geosci. Remote Sens. 2009, 47, 2071–2084. [Google Scholar] [CrossRef]
  21. Hoffman, R.N.; Leidner, S.M. An introduction to the near-real-time QuikSCAT data. Weather Forecast. 2005, 20, 476–493. [Google Scholar] [CrossRef]
  22. Freilich, M.H.; Dunbar, R.S. The accuracy of the NSCAT 1 vector winds: Comparisons with national data buoy center buoys. J. Geophys. Res. Oceans 1999, 104, 11231–11246. [Google Scholar] [CrossRef]
  23. Bakun, A. Coastal Upwelling Indices, West Coast of North America, 1946–1971; NOAA Technical Report NMFS SSRF-671; U.S. Department of Commerce: Washington, DC, USA, 1973; p. 103. [Google Scholar]
  24. Oey, L.Y.; Ezer, T.; Wang, D.P.; Fan, S.J.; Yin, X.Q. Loop Current warming by Hurricane Wilma. Geophys. Res. Lett. 2006, 33. [Google Scholar] [CrossRef]
  25. Oey, L.-Y.; Ezer, T.; Wang, D.-P.; Yin, X.-Q.; Fan, S.-J. Hurricane-induced motions and interaction with ocean currents. Cont. Shelf Res. 2007, 27, 1249–1263. [Google Scholar] [CrossRef]
  26. Stewart, R.H. Introduction to Physical Oceanography; Texas A & M University: College Station, TX, USA, 2008. [Google Scholar]
  27. Mendo, J.; Pizarro, L.; Castillo, S. Monthly Turbulence and Ekman Transport Indexes 1953 to 1985, Based on Local Wind Records from Trujillo and Callao, Peru. In The Peruvian Anchoveta and Its Upwelling Ecosystem: Three Decades of Change; Pauly, D., Tsukayama, I., Eds.; ICLARM: Manila, Philippines, 1987; Volume 15, pp. 75–88. [Google Scholar]
  28. Castelao, R.M.; Barth, J.A. Upwelling around Cabo Frio, Brazil: The importance of wind stress curl. Geophys. Res. Lett. 2006, 33. [Google Scholar] [CrossRef]
  29. Smith, R.L. Upwelling. Oceanogr. Mar. Biol. Ann. Rev. 1968, 6, 11–46. [Google Scholar]
  30. Lagerloef, G.S.; Mitchum, G.T.; Lukas, R.B.; Niiler, P.P. Tropical pacific near-surface currents estimated from altimeter, wind, and drifter data. J. Geophys. Res. Oceans 1999, 104, 23313–23326. [Google Scholar] [CrossRef]
  31. Bonjean, F.; Lagerloef, G.S. Diagnostic model and analysis of the surface currents in the tropical Pacific Ocean. J. Phys. Oceanogr. 2002, 32, 2938–2954. [Google Scholar] [CrossRef]
  32. Muller-Karger, F.; Varela, R.; Thunell, R.; Scranton, M.; Bohrer, R.; Taylor, G.; Capelo, J.; Astor, Y.; Tappa, E.; Ho, T.Y. Annual cycle of primary production in the Cariaco Basin Response to upwelling and implications for vertical export. J. Geophys. Res. Oceans 2001, 106, 4527–4542. [Google Scholar] [CrossRef]
  33. Scranton, M.I.; McIntyre, M.; Astor, Y.; Taylor, G.T.; Muller-Karger, F.; Fanning, K. Temporal variability in the nutrient chemistry of the Cariaco Basin. In Past and Present Marine Water Column Anoxia; Nato Science Series IV; Neretin, L.N., Ed.; Springer: New York, NY, USA, 2006; Volume 64, pp. 139–160. [Google Scholar]
  34. Thunell, R.; Benitez-Nelson, C.; Varela, R.; Astor, Y.; Muller-Karger, F. Particulate organic carbon fluxes along upwelling-dominated continental margins: Rates and mechanisms. Glob. Biogeochem. Cycles 2007, 21, GB1022. [Google Scholar] [CrossRef]
  35. Taylor, G.T.; Muller-Karger, F.E.; Thunell, R.C.; Scranton, M.I.; Astor, Y.; Varela, R.; Trocoli-Ghinaglia, L.; Lorenzoni, L.; Fanning, K.A.; Hameed, S. Ecosystem responses in the southern Caribbean Sea to global climate change. Proc. Natl. Acad. Sci. USA 2012, 109, 19315–19320. [Google Scholar] [CrossRef] [PubMed]
  36. Andrade, C.A. The Circulation and Variability of the Colombian Basin in the Caribbean Sea. Ph.D. Thesis, University of Wales, Cardiff, UK, 2000; p. 227. [Google Scholar]
  37. Amador, J. A climate feature of the tropical Americas: The trade wind easterly jet. Tóp. Meteorol. Oceanogr. 1998, 5, 91–102. [Google Scholar]
  38. Wang, C. Variability of the Caribbean Low-Level Jet and its relations to climate. Clim. Dyn. 2007, 29, 411–422. [Google Scholar] [CrossRef]
  39. Pickett, M.H.; Tang, W.; Rosenfeld, L.K.; Wash, C.H. QuikSCAT satellite comparisons with nearshore buoy wind data off the U. S. West Coast. J. Atmos. Ocean. Technol. 2003, 20, 1869–1879. [Google Scholar] [CrossRef]
  40. Jouanno, J.; Sheinbaum, J.; Barnier, B.; Molines, J.M.; Candela, J. Seasonal and Interannual Modulation of the Eddy Kinetic Energy in the Caribbean Sea. J. Phys. Oceanogr. 2012, 42, 2041–2055. [Google Scholar] [CrossRef]
  41. Schwing, F.B.; Blanton, J.O. The Use of Land and Sea Based Wind Data in a Simple Circulation Model. J. Phys. Oceanogr. 1984, 14, 193–197. [Google Scholar] [CrossRef]
  42. Fréon, P.; Ans, L. Comparison between coastal wind data, merchant ship data and sea surface temperature in northeastern Venezuela. In The Sardine (Sardinella Aurita), Its Environment and Exploitation in Eastern Venezuela; Fréon, P., Mendoza, J., Eds.; IRD Editions: Paris, France, 2003; pp. 233–262. [Google Scholar]
  43. Carton, J.A.; Chao, Y. Caribbean Sea eddies inferred from TOPEX/Poseidon altimetry and a 1/6 Atlantic Ocean model simulation. J. Geophys. Res. Oceans 1999, 104, 7743–7752. [Google Scholar] [CrossRef]
  44. Murphy, S.J.; Hurlburt, H.E.; O’Brien, J.J. The connectivity of eddy variability in the Caribbean Sea, the Gulf of Mexico, and the Atlantic Ocean. J. Geophys. Res. Oceans 1999, 104, 1431–1453. [Google Scholar] [CrossRef]
  45. Richardson, P.L. Caribbean current and eddies as observed by surface drifters. Deep Sea Res. Part II Top. Stud. Oceanogr. 2005, 52, 429–463. [Google Scholar] [CrossRef]
  46. Molinari, R.L.; Spillane, M.; Brooks, I.; Atwood, D.; Duckett, C. Surface current in the Caribbean Sea as deduced from Lagrangian observations. J. Geophys. Res. Oceans 1981, 86, 6537–6542. [Google Scholar] [CrossRef]
  47. Pratt, R.W.; Maul, G.A. Sea surface height variability of the Intra-Americas Sea from TOPEX/Poseidon satellite altimetry: 1992–1995. Bull. Mar. Sci. 2000, 67, 687–708. [Google Scholar]
  48. Andrade, C.A.; Barton, E.D. Eddy development and motion in the Caribbean Sea. J. Geophys. Res. Oceans 2000, 105, 26191–26201. [Google Scholar] [CrossRef]
  49. Alvera-Azcárate, A.; Barth, A.; Weisberg, R.H. The surface circulation of the Caribbean Sea and the Gulf of Mexico as inferred from satellite altimetry. J. Phys. Oceanogr. 2009, 39, 640–657. [Google Scholar] [CrossRef]
  50. Stromme, T.; Saetersdal, G. Final Report, Surveys of the Fish Resources in the Shelf Areas between Surinam and Colombia, 1988; Reports on Surveys with RV ‘Dr. Fridtjof. Nansen’; Institute of Marine Research: Bergen, Norway, 1989. [Google Scholar]
  51. Jury, M.R. Eastern Venezuela coastal upwelling in context of regional weather and climate variability. Reg. Stud. Mar. Sci. 2017, 18, 219–228. [Google Scholar] [CrossRef]
  52. Herrera, L.; Febres, G.; Andres, J. Distribución de las masas de agua y sus vinculaciones dinámicas en el sector centro-occidental venezolano, mar caribe. Bol. Inst. Oceanogr. Univ. Oriente 1980, 19, 93–118. [Google Scholar]
  53. Lorenzoni, L.; Hu, C.; Varela, R.; Arias, G.; Guzman, L.; Muller-Karger, F. Bio-optical characteristics of Cariaco Basin (Caribbean Sea) waters. Cont. Shelf Res. 2011, 31, 582–593. [Google Scholar] [CrossRef]
  54. Robinson, M.J. Improvements to a Real-Time, Satellite-Derived Surface Current Product (OSCAR) and Evaluation in the Intra-American Sea. Master’s Thesis, University of South Florida, Tampa, FL, USA, 2011. [Google Scholar]
  55. Johnson, E.S.; Bonjean, F.; Lagerloef, G.S.; Gunn, J.T.; Mitchum, G.T. Validation and error analysis of OSCAR sea-surface currents. J. Atmos. Ocean. Technol. 2007, 24, 688–701. [Google Scholar] [CrossRef]
  56. Koracin, D.; Dorman, C.E.; Dever, E.P. Coastal perturbations of marine layer winds, wind stress, and wind stress curl along California and Baja California in June 1999. J. Phys. Oceanogr. 2004, 34, 1152–1173. [Google Scholar] [CrossRef]
  57. Ruiz-Ochoa, M.; Beier, E.; Bernal, G.; Barton, E.D. Sea surface temperature variability in the Colombian Basin, Caribbean Sea. Deep Sea Res. Part I Oceanogr. Res. Pap. 2012, 64, 43–53. [Google Scholar] [CrossRef]
  58. Song, H.; Miller, A.J.; Cornuelle, B.D.; Di Lorenzo, E. Changes in upwelling and its water sources in the California Current System driven by different wind forcing. Dyn. Atmos. Oceans 2011, 52, 170–191. [Google Scholar] [CrossRef]
  59. Jouanno, J.; Sheinbaum, J.; Barnier, B.; Molines, J.-M. The mesoscale variability in the Caribbean Sea. Part II: Energy sources. Ocean Model. 2009, 26, 226–239. [Google Scholar] [CrossRef]
  60. Nykjær, L.; Van Camp, L. Seasonal and Interannual Variability of Coastal Upwelling along Northwest Africa and Portugal from 1981 to 1991. J. Geophys. Res. Oceans 1994, 99, 14197–14207. [Google Scholar] [CrossRef]
  61. Benazzouz, A.; Pelegrí, J.L.; Demarcq, H.; Machín, F.; Mason, E.; Orbi, A.; Peña-Izquierdo, J.; Soumia, M. On the temporal memory of coastal upwelling off NW Africa. J. Geophys. Res. Oceans 2014, 119, 6356–6380. [Google Scholar] [CrossRef]
  62. Zhaoyun, C. Coastal Upwelling Study: Observations, Dynamic Analysis and Modelling. Ph.D. Thesis, University of Delaware, Newark, DE, USA, 2014. [Google Scholar]
  63. Jewell, P.W. Mass balance models of Ekman transport and nutrient fluxes in coastal upwelling zones. Glob. Biogeochem. Cycles 1994, 8, 165–177. [Google Scholar] [CrossRef]
  64. Demarcq, H.; Faure, V. Coastal upwelling and associated retention indices derived from satellite SST. Application to Octopus vulgaris recruitment. Oceanol. Acta 2000, 23, 391–408. [Google Scholar] [CrossRef]
  65. Marchesiello, P.; Estrade, P. Upwelling limitation by onshore geostrophic flow. J. Mar. Res. 2010, 68, 37–62. [Google Scholar] [CrossRef]
  66. Estrade, P.; Marchesiello, P.; Verdière, D.; Colin, A.; Roy, C. Cross-shelf structure of coastal upwelling: A two-dimensional extension of Ekman’s theory and a mechanism for inner shelf upwelling shut down. J. Mar. Res. 2008, 66, 589–616. [Google Scholar] [CrossRef]
Figure 1. Study area. (a) Long-term average (1994–2009) of sea surface temperature (SST) for July, showing the boxes used to calculate spatial averages for the Caribbean Sea (8–18° N, 61–84° W, white box), the whole upwelling system (10–13.5° N, 61–75.5° W, red box), the west (W) upwelling area (11.3–12.9° N, 70–72.5° W), and the east (E) upwelling area (10–11.5° N, 63–65.5° W); yellow boxes. The Pacific Ocean is masked in gray. (b) Map of the southeastern Caribbean Sea showing the isobaths of 200 and 100 m (dark gray and light gray lines, respectively). The map also shows the location of the CARIACO Ocean Time-Series station (10.50° N, 64.66° W), major river deltas, and sites where in situ data were analyzed.
Jmse 06 00036 g001
Figure 2. Seasonal coastal sea surface temperature (SST) in the southern Caribbean upwelling system. (a) Seasonal SST cycle along the coast, calculated with long-term weekly SST means (1994–2009) derived from AVHRR satellite imagery (isotherm contours are every 1° C). SST time series were extracted at 172 coastal stations approximately 13 km offshore, at locations shown as red dots in the map (b), along the coastlines (gray), from left to right, of Colombia, Venezuela, and Trinidad. (c) Mean duration of coastal waters under 26° C during the principal upwelling (December to May) and for the whole year. The principal upwelling season was synchronous along the southern Caribbean and peaked in February–March; the mid-year upwelling peaked around June–July with a lag of ~2 weeks toward the west between 61–75° W, as shown by the black broken line in panel (a). Coastal SST at the longitude of the CARIACO Ocean Time-Series station is highlighted with a vertical black solid line in panel (a), and the station position is shown with a black star in panel (b).
Jmse 06 00036 g002
Figure 3. Seasonal averages of in situ temperature-depth profiles in the southeastern Caribbean. (a) Long-term seasonal temperature profile of the upper 80 m depth. (b) Long-term seasonal temperature extracted at 2 m and 25 m depths. Seasonal averages calculated from monthly profiles of 1 m depth interval (1996–2013) taken at the CARIACO Ocean Time-Series station (Figure 1b).
Jmse 06 00036 g003
Figure 4. Seasonal averages of Ekman transport (ET, left) and Ekman pumping/suction velocity (WE, right) in the Caribbean Sea. Seasonal averages for the peak of the principal upwelling (February–March), the peak of the mid-year upwelling (June–July), and for the minimum upwelling season (September–October). ET and WE were derived from the QuikSCAT satellite-based sensor (1999–2009). The southern Caribbean upwelling system had year-round offshore ET and positive WE (positive/negative WE induces open-sea upwelling/downwelling). During the mid-year upwelling, positive WE was higher and with a wider offshore extension. ET magnitude/direction is denoted by color/arrows. WE equaling zero is denoted by the black isoline.
Jmse 06 00036 g004
Figure 5. Seasonal cycles of nearshore satellite and land-based coastal wind. (a) Seasonal cycle in satellite-derived nearshore wind speed along the southern Caribbean Sea coast, calculated with long-term weekly means of QuikSCAT winds (1999–2009, 0.25° spatial resolution). During the mid-year upwelling, there was a 3-week westward lag in the wind intensity between 69° W and 75° W (solid black line). (b) Sampling locations for satellite nearshore winds, with 0.25° spatial resolution (gray squares). (ce) Two mainland coastal stations (Coro and Cumaná, green circles), one island coastal station (Aruba, blue circle), and their closest QuikSCAT pixels (red ovals) were used to compare weekly nearshore satellite-derived wind data with weekly land-based wind data. Data was centered in the middle of the week; hence, values at 12.88 months are for the last week of December. Land-based measurements for Cumaná (1999–2008), Coro, and Aruba (1999–2007) were obtained from the National Climatic Data Center (NCDC).
Jmse 06 00036 g005
Figure 6. Southern Caribbean Sea seasonal cycles of (a) cross-shore Ekman transport; (b) integrated wind curl Ekman pumping/suction; and (c) speed at the core of the Caribbean Current (CC) maximum speed. (a) Cross-shore Ekman transport (csET, m3 s−1 per meter of coast) was calculated with alongshore winds from the nearshore wind pixels shown in Figure 7b from QuikSCAT winds (1999–2009, 0.25° spatial resolution). (b) Ekman pumping/suction transport (WE100, m3 s−1 per meter of coast) was calculated integrating WE velocities from the coast to 100 km offshore. (c) Ocean current data were obtained from near-surface ocean current estimates from the Ocean Surface Current Analyses Project (OSCAR, 1999–2009). The speed at the core of maximum Caribbean Current speed was calculated for every 1/3 degree of the longitudinal extension of the southern Caribbean upwelling area (CCspeed). Changes in the CCspeed propagated westward from 63° W. Solid and broken straight black lines show different propagation speeds during the mid-year upwelling (solid line: 0.34 m s−1, dotted line: 0.16 m s−1).
Jmse 06 00036 g006
Figure 7. Seasonal weekly averages of SST, upwelling transport, and Caribbean Current maximum speed for the west (left) and east (right) upwelling areas (see areas in Figure 1a). The mid-year upwelling period (gray bar) and peak (straight black line) are highlighted. (a,b) SST averaged within the west and east areas. (c,d) Upwelling transport generated by alongshore winds (csET), by the wind curl integrated from the coast to 100 km offshore (WE100), and total transport (csET plus WE100) averaged over the longitudes of the west and east areas. (e,f) Speed at the core of the maximum of the Caribbean Current (CCspeed) was averaged over the longitudes corresponding to the west and east areas. All variables were filtered with a centered 3-week running mean.
Jmse 06 00036 g007
Table 1. Seasonal statistics (averages and standard deviation) of satellite-derived dynamic parameters on the east and west upwelling areas of the southern Caribbean margin.
VariableAreaAnnual(SD)December–April(SD)February–March(SD)June–August(SD)September–October(SD)
SSTE25.82(1.38)24.76(0.93)24.05(0.67)26.05(0.93)27.66(0.60)
(°C)W26.26(1.29)25.18(0.85)24.52(0.58)26.46(0.78)27.96(0.50)
csETE1.67(0.52)1.85(0.51)1.86(0.53)1.49(0.43)1.42(0.35)
(m3 s−1)W2.58(0.92)2.61(0.73)2.71(0.71)3.02(0.77)1.95(0.93)
WE100E0.46(0.32)0.54(0.31)0.55(0.30)0.50(0.27)0.26(0.34)
(m3 s−1)W0.43(0.36)0.56(0.37)0.62(0.38)0.53(0.30)0.17(0.27)
CCspeedE0.49(0.10)0.47(0.08)0.49(0.08)0.57(0.10)0.45(0.09)
(m s−1)W0.47(0.11)0.47(0.11)0.48(0.12)0.51(0.14)0.46(0.09)
CClatE13.3(1.07)12.93(0.94)12.94(0.75)13.55(1.13)13.48(0.99)
(°N)W14.3(0.94)14.25(0.95)14.1(0.87)14.09(0.92)14.71(0.88)
SST: AVHRR sea surface temperature (1994–2009); CCspeed/CClat: OSCAR Caribbean Current maximum speed and latitude (2000–2009); QuikSCAT (2000–2009) ocean wind-derived parameters; csET: cross-shore Ekman transport; and WE100: wind curl vertical transport from the coast to 100 km offshore.
Table 2. Correlation between sea surface temperature (SST) and different upwelling forcing parameters. Correlation coefficients (r) are shown for analysis with time series values (TS), and with time series deseasonalized anomalies (calculated as the observed weekly value minus the weekly climatology). The best r between the nonlagged and lagged (L, SST lagged one week after the forcing mechanism) correlation is shown; other lags did not yield better correlations. Correlations were significant at p < 0.01 (ns: no significant).
SST WSST E
TSAnomaliesTSAnomalies
csET−0.38L−0.35L−0.46L−0.25L
WE100−0.52L−0.35L−0.44L−0.35L
csET + WE100−0.48L−0.41L−0.54L−0.36L
CCspeed−0.18−0.19−0.25−0.28
CClat0.23ns0.17Lns

