Optimized Reliability Based Upgrading of Rubble Mound Breakwaters in a Changing Climate


Division of Hydraulics and Environmental Engineering, School of Civil Engineering, Aristotle University of Thessaloniki, 54124 Thessaloniki, Greece
*
Author to whom correspondence should be addressed.
J. Mar. Sci. Eng. 2018, 6(3), 92; https://doi.org/10.3390/jmse6030092
Submission received: 20 June 2018
/
Revised: 16 July 2018
/
Accepted: 18 July 2018
/
Published: 2 August 2018
(This article belongs to the Special Issue Climate Change, Coasts and Coastal Risk)
Abstract
:The present work aims at presenting an approach on implementing appropriate mitigation measures for the upgrade of rubble mound breakwaters protecting harbors and/or marinas against increasing future marine hazards and related escalating exposure to downtime risks. This approach is based on the reliability analysis of the studied structure coupled with economic optimization techniques. It includes the construction of probability distribution functions for all the stochastic variables of the marine climate (waves, storm surges, and sea level rise) for present and future conditions, the suggestion of different mitigation options for upgrading, the construction of a fault tree providing a logical succession of all events that lead to port downtime for each alternative mitigation option, and conclusively, the testing of a large number of possible alternative geometries for each option. A single solution is selected from the total sample of acceptable geometries for each upgrading concept that satisfy a probabilistic constraint in order to minimize the total costs of protection. The upgrading options considered in the present work include the construction or enhancement of a crown wall on the breakwater crest, the addition of the third layer of rocks above the primary armor layer of the breakwater (combined with crest elements), the attachment of a berm on the primary armor layer, and the construction of a detached low-crested structure in front of the breakwater. The proposed methodology is applied to an indicative rubble mound breakwater with an existing superstructure. The construction of a berm on the existing primary armor layer of the studied breakwater (port of Deauville, France), seems to be advantageous in terms of optimized total costs compared to other mitigation options.
1. Introduction
Global climate change is expected to cause significant long-term changes in mean sea level (MSL), characteristics of the wave fields and storm surges, as well as in the trajectory and intensity of storms [1,2]. Significant fluctuations in the frequency and the intensity of storms, and in the wave climate, were observed in the recent past in the North Sea [3,4,5,6,7], without however identifying significant general trends. Studies conducted in larger areas, i.e., in the Northern Atlantic or along the European coastline, proved certain changes in the wind fields, in storm surge levels, as well as in the wave climate [8,9,10,11,12,13].
The general inception of a changing climate, characterized by extreme marine events of higher intensity and frequency and MSL rise [14], increases vulnerability and exposure of port and harbor structures to different failure modes, resulting in their inability to fulfill their requirements. The increased probability of failure of such structures under higher (than those designed for) hydraulic loading conditions and the limited residual service lifetime of many of them, combined with the fact that economic activity is assembled in trade, cruise home, cargo and fishing ports, and harbors, creates an urgent need for a reliable upgrading solution to maintain or increase the safety level of engineered water basins in the future, while ensuring that construction and performance costs are kept low. Since most port or harbor structures to date have been designed neglecting the effects of climate change, an upgrading procedure is required to ensure new optimal geometries characterized by a low probability of future failure, minimizing the total expected damages.
Port or harbor structures ensure that downtime risks (defined as the stoppage of operations within the basins due to malfunction of the protection system) are kept low. Such risks are a combination of the failure probability of a structure and its relevant impact, usually estimated as the product of the occurrence probability of the event and its consequences [15]. Coastal risks arise due to hazards consisting of a source or an initiator event (i.e., high wave/sea level), a receptor (i.e., protected basins, local communities, and local infrastructure) and a pathway between them (i.e., failure of defenses). The predicted failure probability results from the sources and pathways of risk, while the expected damages, including economic, social, or environmental impacts, are estimated from the receptors. Rubble mound breakwaters, consisting of large heaps of loose elements, primarily aim at protecting coastal areas against flooding and erosion and ports, harbors, or marinas against wave action, significantly reducing the flooding hazard of the protected areas in case of extreme marine storms. However, the predicted sea level rise and a possible increase in extreme marine storms will expose such structures to larger and longer waves, which in turn will lead to greater wave overtopping and transmission, and greater water penetration into the protected areas. Hence, functionality and safety of such structures has to be re-evaluated under climate change conditions. The proposed work aims at contributing to the reinforcement of selected port, harbor or marina rubble mound structures in order to withstand the threat of increased hydraulic loading due to climate change effects.
1.1. Literature Review
Studying the effects of climate change on coastal and harbor structures started receiving considerable attention since the early 21st century [16,17,18]. Suh et al. [19] developed a methodology that incorporates the effects of climate change in the design of caisson breakwaters. Becker et al. [20], Suh et al. [21], and Sánchez-Arcilla et al. [22] studied the possible effects of climate change on port and harbor operations and related infrastructure. Chini & Stansby [23] and Mase et al. [24] investigated the influence of both sea level rise (SLR) and future wave and storm surge climate on overtopping of a sea wall, and the stability of composite breakwaters with wave-dissipating blocks, respectively. Hoshino et al. [25] applied a methodology to change the intensity of tropical cyclones in Japan under future climate conditions and assessed the performance of selected sea defenses to the new forcing conditions. Sekimoto et al. [26] proposed time-dependent return periods and a modified residual life for coastal structures to make decisions on adaptation strategies under climate change. Isobe [27] used simple formulas and diagrams to provide rough quantitative estimates of global warming impact on coastal defense structures and proposed a roadmap for the coastal zone to respond to SLR and tropical cyclone intensification. Lee et al. [28] developed a risk-based system to evaluate safety of coastal structures subject to SLR, emphasizing reinforcement needs for current standards of protection maintained under climate change conditions. Within THESEUS (Innovative Technologies for Safer European Coasts in a Changing Climate, 2009–2013) research project [29], the vulnerability and resilience of coastal structures to climate change effects were studied and environmentally friendly upgrading solutions were investigated. Burcharth et al. [30] presented methods to upgrade typical embankments under climate change conditions and estimated the associated construction costs to determine the most effective alternative. Within CCSEAWAVS (Estimating the Effects of Climate Change on Sea Level and Wave Climate of the Greek seas, Coastal Vulnerability and Safety of Coastal and Marine Structures, 2012–2015) research project [31], a first assessment of the vulnerability of coastal and harbor structures to climate change in Greece was attempted and indicative upgrading methods were proposed [32,33].
The overall framework of integrated risk management includes analysis and assessment of risks and implementation of risk reduction/mitigation options [34]. Since the 1953 major flood, the Dutch authorities have used risk-based principles in the design and maintenance of flood defenses, i.e., [35,36]. Mai et al. [37,38] and Jonkman et al. [39] applied risk-based models to design flood protection systems, and Lee et al. [28] developed a risk-based system to evaluate safety of coastal structures subject to sea level rise, emphasizing reinforcement needs for current standards of protection maintained under climate change conditions. Within the EU research project FLOODsite (Integrated flood risk analysis and management methodologies, 2004–2009) [40], an inherent part of a risk-based approach to designing flood defenses reliability (corresponding to the probability of failure under given hydraulic loading conditions) analysis has been further developed to support a range of decisions and adopt different levels of complexity. Research on reliability analysis within FLOODsite [40] focused on developing methods and techniques to incorporate up-to-date knowledge on the different failure modes of the structures considered, as well as on the interactions between these failure mechanisms.
Reliability-based optimal structural design has been applied by numerous authors in the past, i.e., [41,42,43,44]. Castillo et al. [45], Dai Viet et al. [46], Prasad Kumar [47], Suh et al. [19], and Galiatsatou & Prinos [48] selected optimized geometries of rubble mound or caisson breakwaters combining structural reliability and methods of economic optimization. In this framework possible economic benefits from including Wave Energy Converters as part of the upgrading scheme (e.g., [49]) could be considered, yet only in cases of low energy sea-sates. Van Gelder et al. [50] provided an outline of methods and tools for reliability analysis of flood defenses. Buijs et al. [51] established time-dependent reliability models for flood defense systems, combing stochastic, hierarchical, and parametric processes to represent their main deterioration mechanisms. Kim & Suh [52] and Naulin et al. [53,54] performed reliability analysis of coastal and harbor structures to determine failure probabilities including different mechanisms. Buijs et al. [51] and Nepal et al. [55] established time-dependent reliability models for coastal embankments using stochastic deterioration models.
1.2. Scope of Work
Safety assessments of flood defense assets are increasingly performed with the technique of structural reliability. Reliability-based design utilizes the probability of failure as a measure of the performance of the coastal or harbor structure. A maximum failure probability is defined and the structure should meet the requirements. In order to make a probabilistic optimization, the mechanisms that lead to structural instability or losing of a specific level of functionality should be considered. Therefore, different failure modes and their relation to overall failure of the structure should be represented in fault trees. Quantitative analysis starts at the level of failure modes with the definition of limit state functions and the probabilistic analysis of all random input variables. The total failure probability of the structure can be defined from a quantification of the probability of occurrence of each failure mode. Reliability-based optimization can be performed on the grounds of minimizing the total cost function of the structure, thus finding a cost-effective design that also meets certain probabilistic requirements.
The present work aims at presenting an improved approach for evaluating the performance of rubble mound breakwaters in a changing climate and at suggesting and implementing appropriate mitigation measures for upgrading to face the increasing marine hazards and exposure to downtime risks. Therefore, the study mainly intends to assess the future safety levels of existing structures under climate change conditions and to propose measures for structural upgrading utilizing a reliability-based procedure. The whole domain of upgrading structures to face climate change impacts is an original research field and reliability-based approaches will significantly contribute to handle the problem posed by balancing the compromises and investments made on the side of the defense system/structure, due to increased safety levels, with the accompanying benefits (limiting losses) in the protected areas. The comparative advantages and main innovation of the proposed work with regard to former research studies on reliability-based approaches are mainly focused on this argument. Thus, it combines the quickly progressing framework of reliability-based optimization, with upgrading mitigation measures and engineering solutions to reinforce port and harbor structures against climate change effects. Such approaches are expected to significantly outperform deterministic methods and can significantly contribute to include hazard, as well as vulnerability determination in the decision process, and to realize appropriate and sustainable measures to minimize port or harbor downtime risks.
The proposed approach can fully consider uncertainties in stress and resistance parameters, it can examine different mitigation measures for upgrading port and harbor breakwaters in a changing climate, and compare their effectiveness within the general framework of minimizing the total downtime risks of the protected areas. It can contribute to increasing protection of ports/harbors against climate change with minimum possible impacts (only economic impacts are examined here) during the service lifetime of the upgraded structures and to achieve high benefits (corresponding to limiting losses) for the protected areas reflected to the regional and national economy. It can also contribute to facilitate adaptation of coastal areas to climate change in a quite adverse and unstable financial environment, which hinders the construction of new and modern defenses. The proposed reliability-based approach can provide a basis for reasonable decision-making and can allow the choice of further rationalized safety levels of port/harbor basins if the consequences of downtime and the costs of protection are made explicit.
In Section 2 of the present work the main aspects of the proposed methodology for reliability-based upgrading are presented. The governing loading variables of the studied structures are represented as random variables and appropriate distribution functions are selected to represent uncertainties in their estimates for future climate conditions. Upgrading options are suggested and the main failure modes of the structures are considered. Appropriate limit state functions are then defined in accordance with the selected failure criterion. A maximally acceptable failure probability is defined and reliability analysis is performed to define the space of acceptable geometries of the structures considered. Finally, the cost of all acceptable geometries within the solution space is estimated for each mitigation option and an economical optimization is performed. In Section 3 the proposed methodology is implemented to a selected rubble mound breakwater. Different optimized and upgraded geometries of the structure are proposed and estimated to withstand loads under expected future climate conditions. Section 4 presents a summary of the presented work and methodology together with the main conclusions of the study.
2. Methodology for Optimized Reliability-Based Upgrading of Rubble Mound Breakwaters
2.1. Proposed Upgrading Scheme
As a more holistic and robust approach compared to conventional design methods, a novel reliability-based upgrading method is introduced in the present work to compare different mitigation options on their effectiveness to withstand the adverse consequences of climate change and to select an optimal solution that minimizes port/harbor downtime risks.
The methodology of reliability-based upgrading followed in this work consists of the following actions:
- Fitting appropriate cumulative distribution functions (CDFs) to stochastic variables of the marine climate, i.e., offshore wave height and sea level due to storm surge for present climate conditions.
- Transfer extracted CDFs to the selected breakwater site.
- Definition of CDFs for future sea states considering climate change scenarios or assumptions.
- Investigation of the ability of selected breakwaters to withstand impacts due to future sea states, given their design characteristics.
- Definition of different mitigation options for rubble mound breakwaters to limit damages under future climate conditions.
- Creation of a fault tree that gives a logical succession of all events leading to port/harbor downtime for each alternative mitigation option (or combination of options if applicable).
- Investigation of both Ultimate Limit States (ULS) and Serviceability Limit States (SLS) of the rubble mound breakwater to define its total probability of failure.
- Generation of a large number of possible alternative geometries for each upgrading concept.
- Definition of an acceptable flooding probability.
- Selection of an optimal geometry from the sample of acceptable geometries for each upgrading concept, minimizing the total costs of protection. The methodology described above is schematically presented in Figure 1.
A reliability analysis should start with the definition of an unwanted “top event”, which in the present work coincides with failure of the rubble mound breakwater to fulfill its requirements. Such an event can be defined as port/harbor downtime and can be caused under both extreme marine conditions, or under restrictive conditions for the normal prosecution of daily port/harbor operations. The former can cause the collapse of the studied structure (which amounts to large quantities of water entering the protected basin causing severe damage to the structure itself and to port infrastructure), resulting in the loss of its protective properties. The latter are characterized by excessive wave height in the harbor basin, resulting in suspension of port operations. Collapse of the rubble mound breakwater belongs to the Ultimate Limit States (ULS), while cessation of port operations on a daily basis belongs to the Serviceability Limit States (SLS). A fault tree is constructed containing the mechanisms that cause failure of the rubble mound structure (failure modes).
Principal failure mechanisms of conventional rubble mound breakwaters (with or without crest elements) include:
- Failure or instability of the seaside armor layer (e.g., [56]),
- Failure of the rear-side slope (e.g., [57]),
- Scouring of the toe structure (e.g., [58]),
- Excessive overtopping (e.g., [59]),
- The slip cycle (e.g., [60]),
- Sliding and tilting of existing superstructure/crown-wall (e.g., [61]),
- Excessive settlement (e.g., [62]).
The analysis begins with the determination of limit state functions and the description of CDFs of variables in these functions. For port/harbor structures both ULS and SLS are examined. A reliability-based optimized breakwater geometry results from minimizing the total costs (adding upgrading and possible costs of failure) during the service lifetime of each upgraded geometry of the breakwater. Failure costs are estimated considering the failure probability for each type of upgraded geometry of the breakwater within its service lifetime.
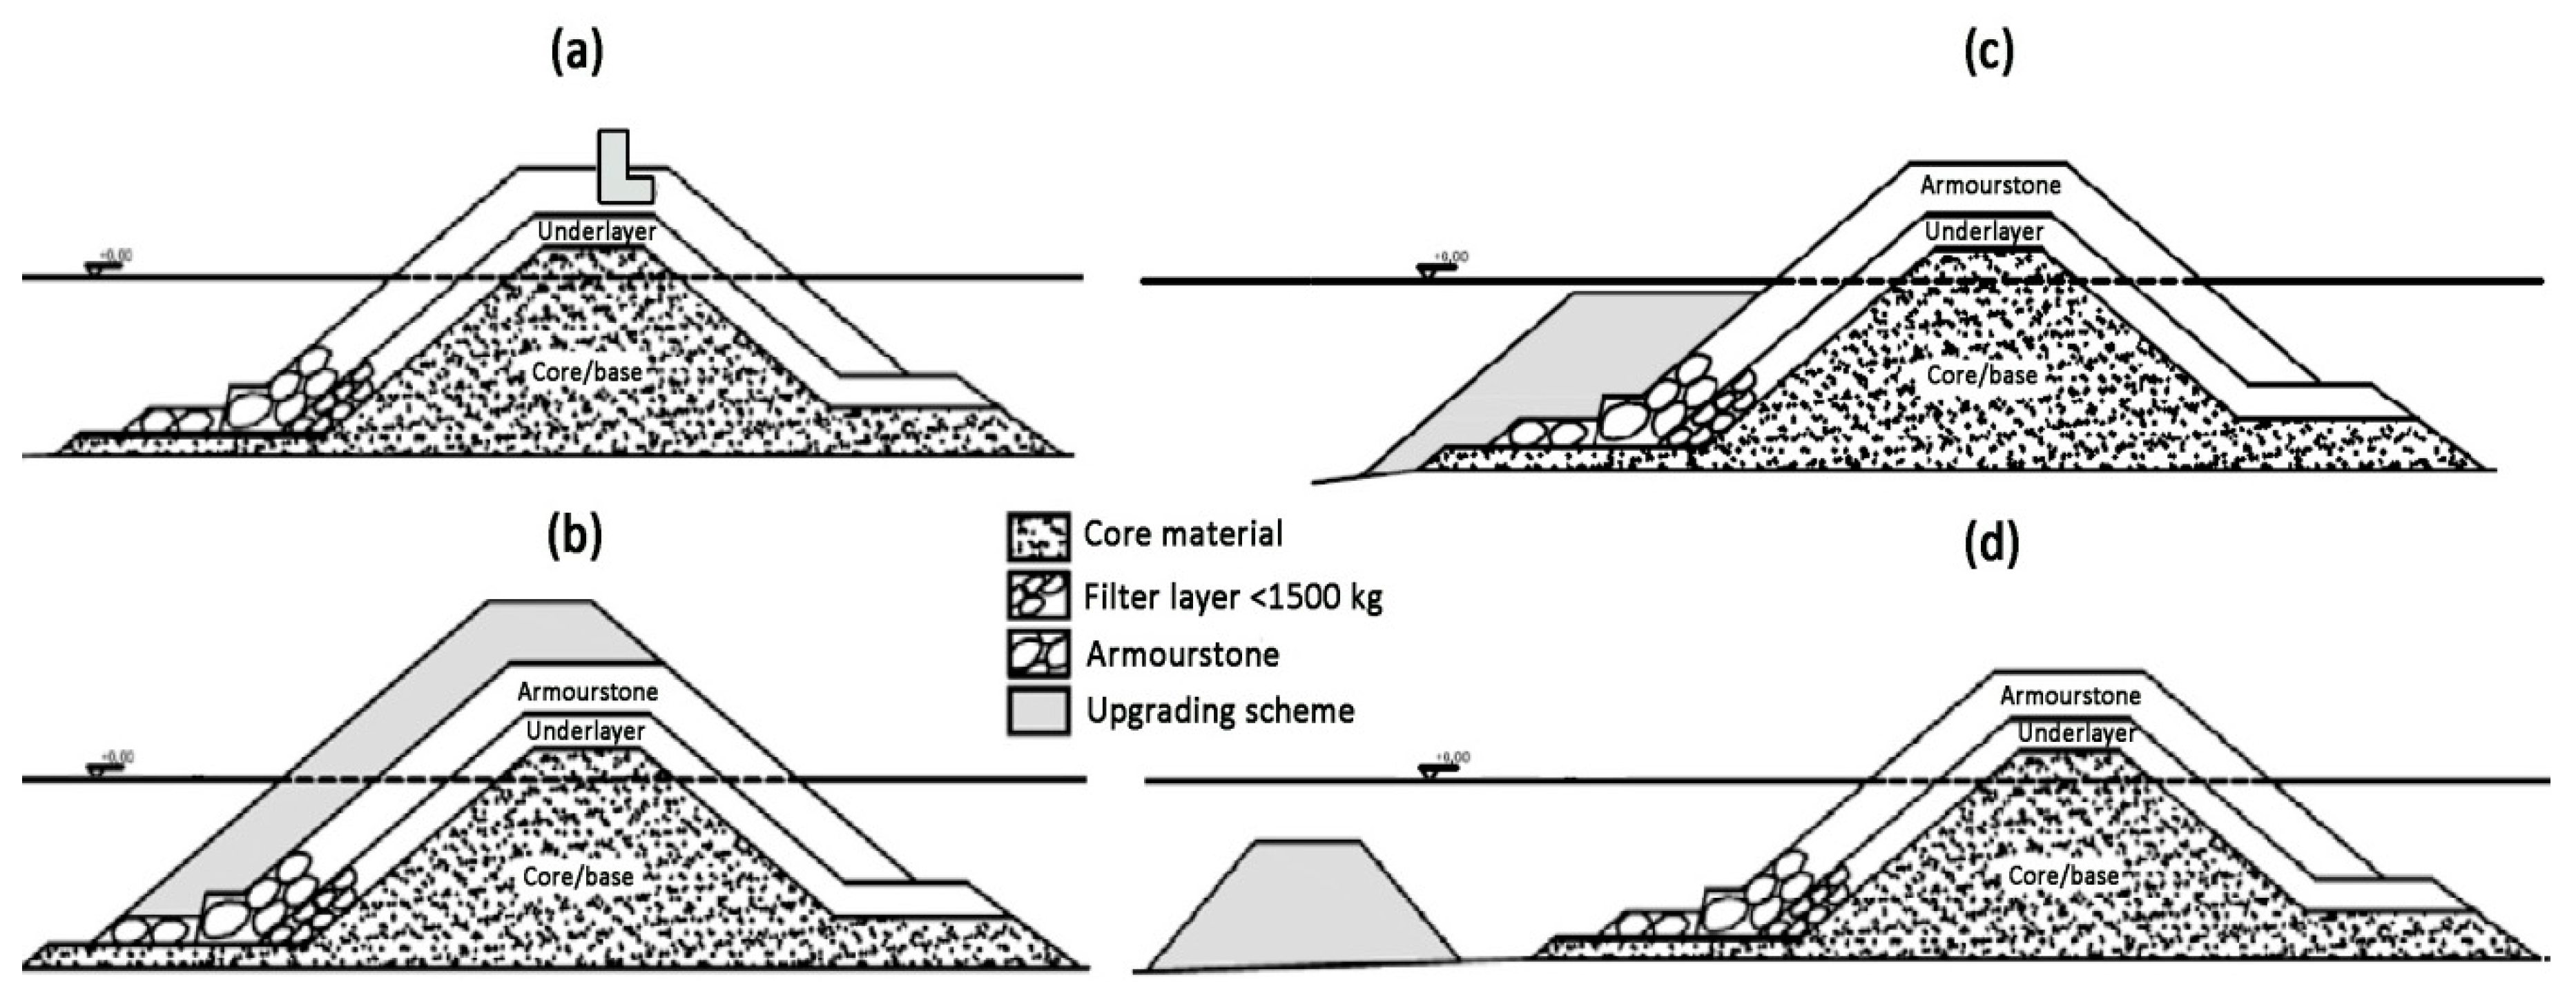
Upgrading conceptual options to be examined are presented in Figure 2, and include:
- Increasing the breakwater crest level by adding a crown wall or existing crest elements being heightened and strengthened.
- Adding a new protective layer of armor units on the windward slope of the studied rubble mound breakwater combined with new or elevated existing crest elements.
- Construction of a berm structure in front of the seaside slope.
- Construction of a low-crested structure in the windward front of the existing breakwater.
The failure probability which minimizes the total lifetime costs for each of the four mitigation options and corresponds to an optimized geometry will be finally selected. The requirement of minimization of the lifetime costs can be combined with a direct limitation of the solution space in the form of a constraint on the port/harbor downtime probability.
2.2. Probability Distribution Functions for Variables of the Marine Climate
Considering ULS for the studied structure, assumed to happen under extreme marine conditions, extrapolation of the marine variables to high return periods has to be performed. Methods and techniques of the well-established univariate and multivariate Extreme Value Theory (EVT) can be used for such purpose. Considering SLS, maximum daily wave height conditions are analyzed, using a CDF for short term prediction. Extreme value (EV) methods are powerful statistical methods for drawing an inference about the extremes of a process, using only data on relatively extreme values of it. The statistical methodology is motivated by EVT, which relies on the assumption that the limiting models suggested by the asymptotic theory continue to hold at finite but extreme levels [63]. Univariate analysis of extreme marine conditions (i.e., extremes of the significant wave heights and storm surges) can be performed using the Generalized Extreme Value (GEV) distribution function for annual maxima. The GEV distribution function is of the form:
where σ > 0 and θ = (μ, σ, ξ) the vector of parameters, namely the location (μ), scale (σ), and shape (ξ) parameters, determined by the tail behavior of Gθ. The model of Equation (1) can be fitted to annual maxima wave heights and storm surges and the parameter vector for both variables can be estimated by means of the L-moments estimation procedure.
To estimate the design wave height for the port/harbor structure considered, the extreme wave height CDF at the breakwater’s site is approximated using a statistical approach proposed by Kim and Suh [52] and Suh et al. [64]. The latter is based on the assumption that the wave height CDF in coastal water reduces in the mean and in the standard deviation compared with the respective theoretical model for deep water waves, so that the coefficient of variation (CV) remains constant. This assumption seems quite realistic for extreme wave heights, as their CDF becomes narrower and is shifted toward smaller values as they propagate in coastal waters, while its shape does not undergo any significant changes. Therefore it is assumed that extreme wave heights at the breakwater site are also represented by a GEV distribution with shape parameter, ξ, equal to the one estimated for deep water conditions. The CV for the GEV distribution function is:
where Γ(·) corresponds to the Gamma CDF. To estimate the GEV parameters for wave height at the breakwater site, the constant CV of Equation (2) is combined with the formula used to calculate the design wave height of the structure i.e., the 100-year nearshore wave height (return period commonly used in the design of coastal and harbor structures):
where p = 1/T (T is the return period of 100 years) and z100 is the 100-year design wave height of the studied breakwater.
Considering SLS for the studied structure, daily maxima of significant wave height are analyzed. More specifically, it is assumed that maximum daily offshore random wave heights (both breaking and nonbreaking) follow a Rayleigh CDF, when based on energy flux-balance single-parameter transformation models or daily observations [65]:
with parameter vector θ = (μ, σ). L-moments estimation procedure is used to calculate the parameter vector of the Rayleigh CDF, whose CV is given by:
Following the methodology used for extreme wave conditions, the CV of wave heights CDF at the breakwater site is assumed to be equal to the one for deep water wave conditions. Goodness of fit for all CDFs of the marine variables has been checked by means of the Kolmogorov–Smirnov test (significance level set to 5%).
2.3. Reliability Functions for Upgrading Options
Reliability-based design hinges on the use of the probability of failure as a measure of the structure performance. To calculate the probability of failure for a certain limit state, it is necessary to know the difference between the resistance of the structure, RZ, and the load it is exposed to, SZ. The reliability function, Z, for a certain limit state is therefore defined as:
If Z > 0 the structure is in a safe state, while for Z ≤ 0 the failure domain is defined. The probability of failure can generally be expressed as:
In the present work reliability functions are defined for both ULS and SLS based on formulas describing the main failure modes of rubble mound breakwaters. These reliability functions contain variables of the marine climate at the windward side of the studied breakwater, as well as variables describing geometrical and material properties of the studied structure. Therefore:
For each limit state, a reliability function is therefore defined, CDFs of input variables (Section 2.2) are considered and level II and III reliability methods [66] are used to estimate the failure probabilities corresponding to each failure mode. Level II reliability methods include the linearization of the reliability function at an appropriately defined design point of the failure space. A standard Normal distribution is used to approximate the CDF of each variable present in the reliability function. Level III reliability methods calculate the failure probability by considering the probability density functions (PDFs) of all variables involved, based on Monte Carlo simulation techniques. In this case the probability of failure is approximated as nf/n where n is the total number of simulations and nf the number of simulations for which the condition of Equation (7) is satisfied. In the following, the reliability functions Z are provided as Zij, with the indices i and j referring to the mitigation option (i = 1–4) and the failure mechanism (j = 1–4), respectively.
A fault tree is constructed giving a logical succession of all events leading to the unwanted “top event”, defined as port/harbor downtime, containing both the ULS and SLS of the rubble mound breakwater. For the former, the objective of the structure is the protection of the port area against flooding, while for the latter excessive wave height within the protected basin, causing problems to the standard port operations, defines the failure probability of the breakwater. In this study it is assumed that operations within the port, harbor or marina are only active during normal weather conditions [46]. Extreme marine conditions resulting in ULS failure of the protective structure are assumed to cause partial downtime of the port, harbor, or marina for quite a long period of time, since the basin will then be unprotected until the repair stage is completed.
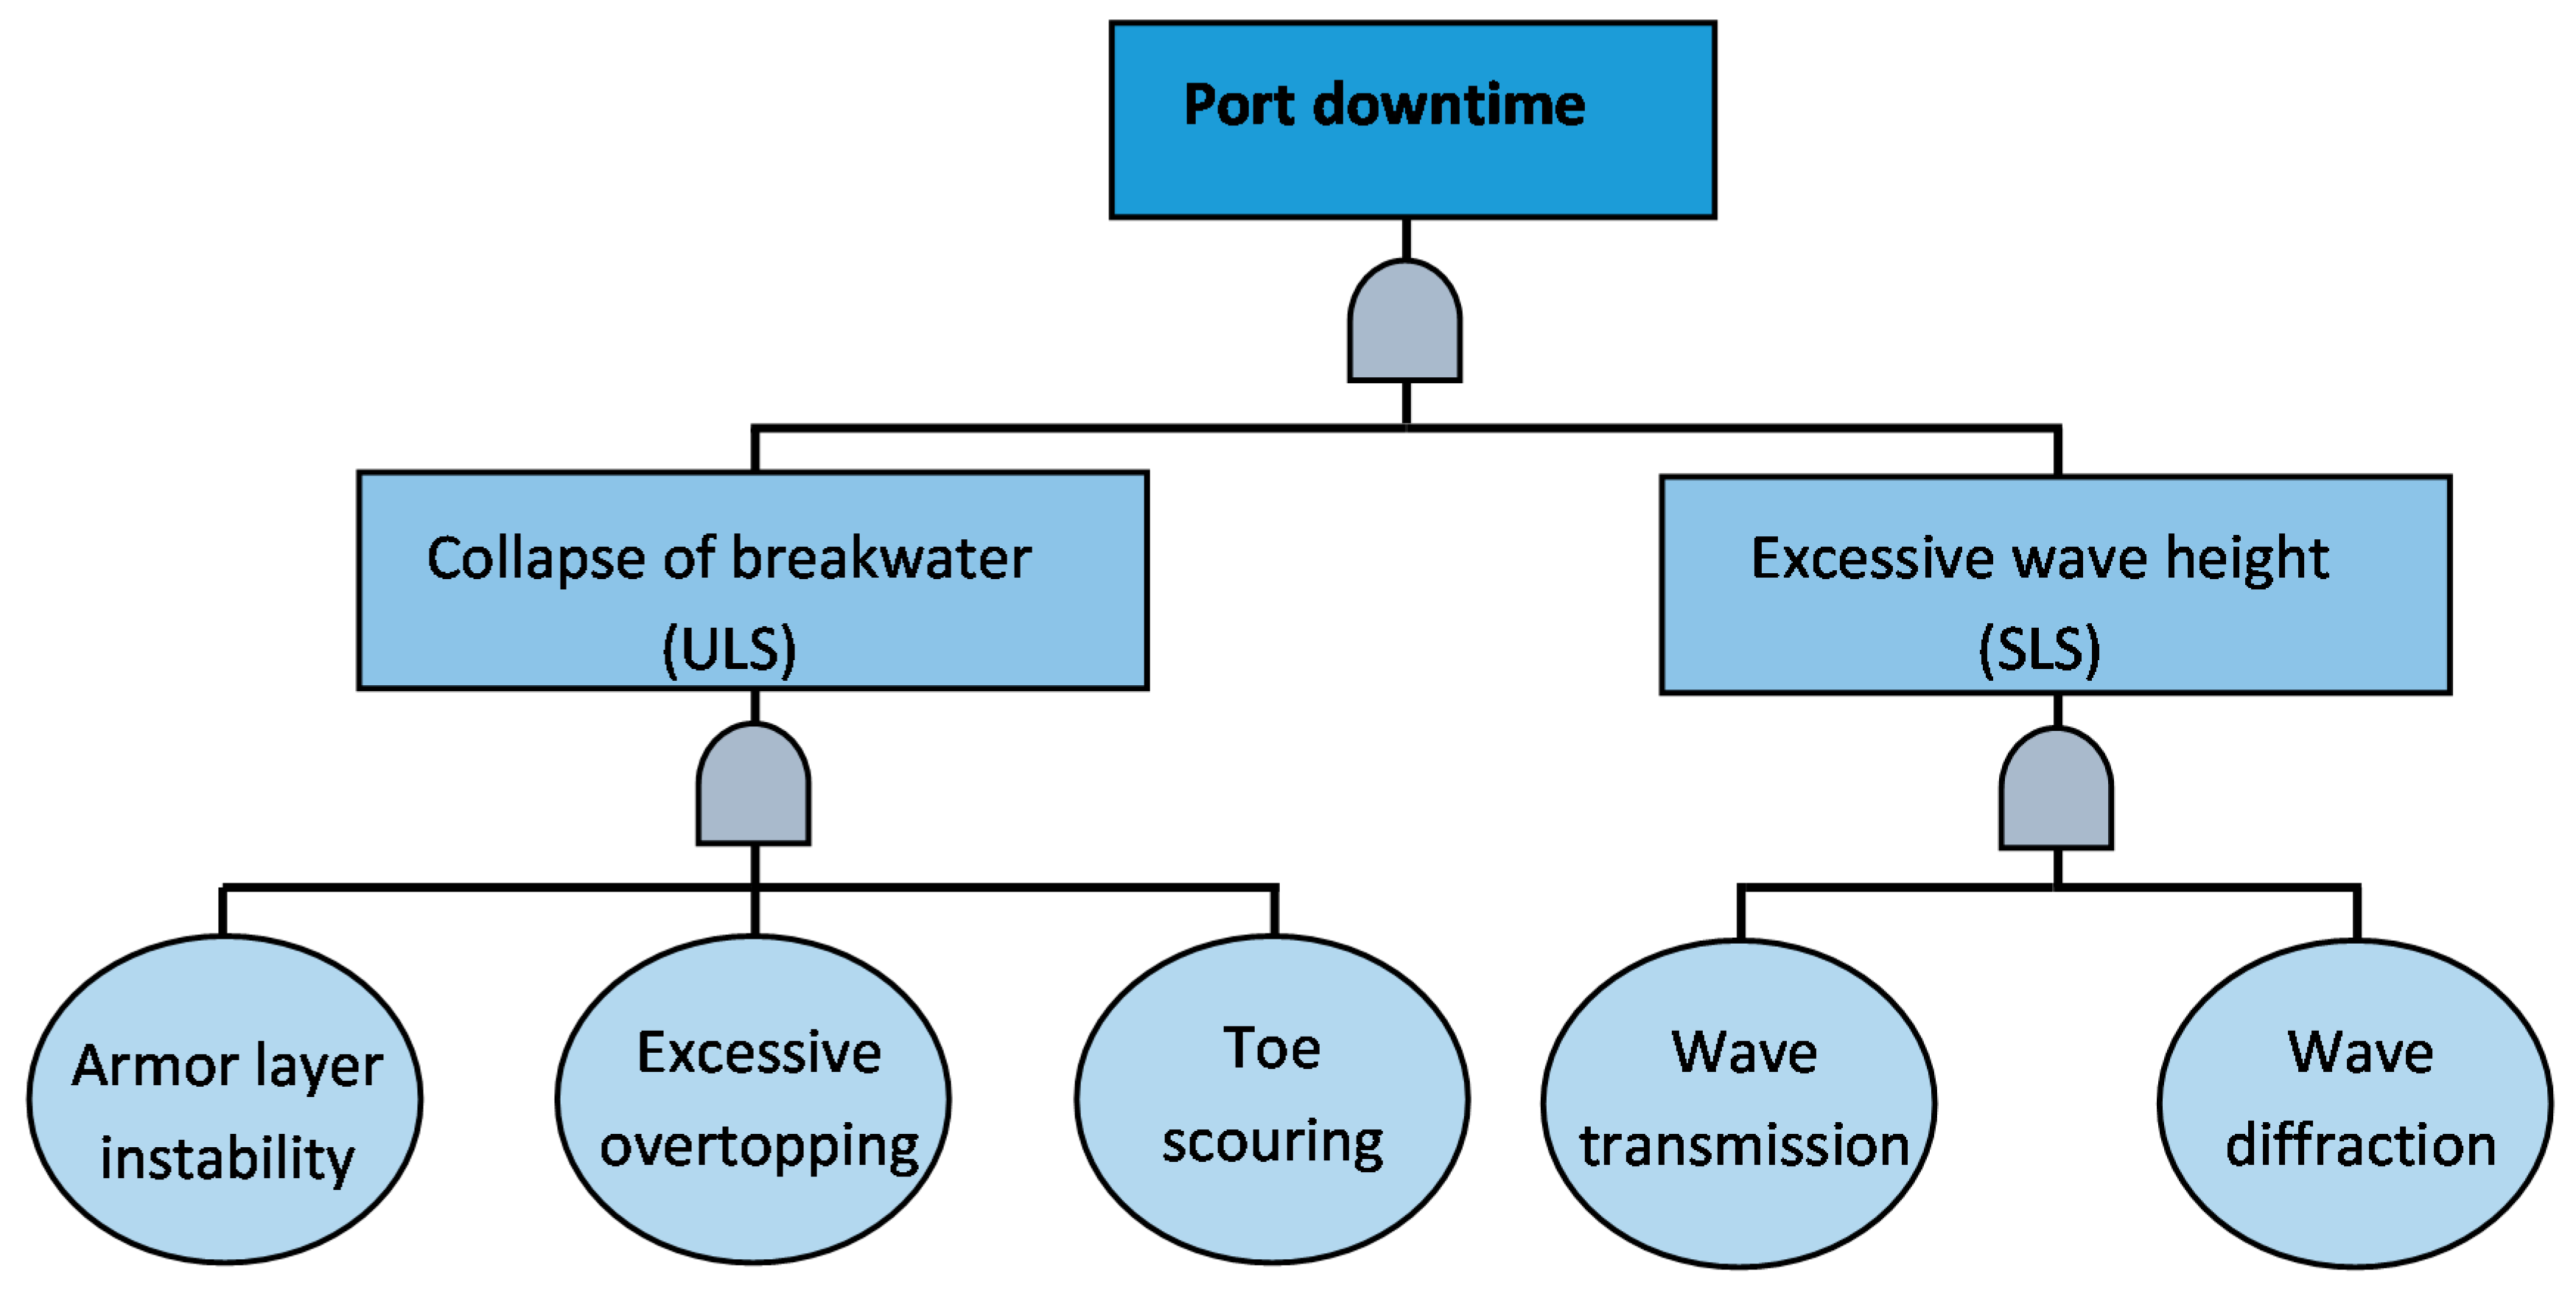
A rubble mound breakwater usually consists of many parts, such as the core, the armor layers (underlayers and cover layer), the concrete cap and/or crown wall on the crest, and the toe structure. Failure of each one of them under extreme marine conditions can cause malfunction of the entire structure. Only principle failure modes are considered here as the main types of instability under extreme marine climate conditions (ULS), namely instability of the seaside primary armor layer, excessive wave overtopping, and scouring of the breakwater toe. The wave height inside the protected basins in the SLS will be considered as a combination of wave refraction-diffraction via the entrance of the protective system and wave transmission through and overtopping the breakwaters [46]. Figure 3 presents the fault tree corresponding to the port downtime “top event”.
Future marine climate conditions are generally expected to increase the probability of failure of coastal, port, or harbor structures. For the structures that shall not be able to meet their future requirements, an upgrading method should be suggested and applied. The construction of a crown wall or parapet or strengthening and heightening of an existing superstructure (mitigation option 1) is expected to have no prominent effects on the global stability of the breakwater considered. Nevertheless, it is expected to increase the hydraulic performance of the structure by reducing overtopping and to indirectly contribute to the structure’s stability by minimizing hydraulic loads and impact of wave forces on the structure [67]. The addition of a new seaside armor layer (mitigation option 2) is expected to have a mild effect on global stability of the structure [66], while overtopping will decrease due to possible elevation of existing crest elements. A berm structure (mitigation option 3) protects the breakwater toe against scouring and also increases the hydraulic performance of the structure by reducing overtopping [66]. Finally, a detached low-crested structure in the seaward front of the existing breakwater (mitigation option 4) assists in the transformation of the incident wave characteristics that impact the breakwater, inducing lower significant wave heights and peak spectral periods due to breaking, bottom friction, and percolation, and therefore increases both the stability of the main structure and also its defense against overtopping [68]. For each aforementioned mitigation option a large number of possible alternative geometries are implemented and failure probabilities are calculated using the fault tree of Figure 3.
2.3.1. Addition of a Crown Wall or Heightening of an Existing Crest Element
When a new crown wall or parapet is added on the breakwater crest, or when existing crest elements are heightened and strengthened (mitigation option 1; Figure 2a), hydraulic stability of the rock seaside primary armor layer of the structure can be estimated by means of the Hudson stability formula [69]:
where Hsu [m] is the significant wave height in front of the studied rubble mound breakwater corresponding to its ULS, Δ = (ρr/ρw)−1, and ρr and ρw are the rock and water density [ton/m3] respectively, Dn [m] is the mean nominal diameter of armor elements (i.e., the equivalent cube length of median rock), KD is the stability coefficient of the formula, and θ is the seaward slope angle of the breakwater. The reliability function, Z11, used for primary armor layer stability is given by:
Hydraulic stability of the seaside primary armor layer of a rubble mound breakwater can also be assessed by means of the semi-empirical formulas of van der Meer [70] for plunging and surging type breaking conditions for rock structures. The formula corresponding to the former conditions is given below:
where P is the permeability coefficient of the structure, N is the number of waves, S is the damage level (ratio of area eroded in a given cross-section), ξm is the surf similarity parameter or Irribaren number, som = Hsu/Lp is the average wave steepness, and Lp is the wave length corresponding to the peak spectral period Tp. The respective reliability function is given by:
For the ULS of excessive wave overtopping, the formula proposed by Coeveld et al. [71] which considers the effect of relatively small crest elements on top of permeable structures is combined with the formula of EurOtop [72] which calculates overtopping discharge for structures with no crest elements. Coeveld et al. [71] introduced a reduction factor for the influence of crest elements on wave overtopping, emphasizing the fact that the crest element height significantly modifies overtopping discharge. The suggested prediction formula for wave overtopping is:
where Rc2 [m] is the height of the crown element with respect to crest level, Gc [m] is the crest width in front of the crest element, NL [m] is the nose length of crest element, and qm [m2/s] is the overtopping discharge per linear meter. The overtopping discharge for a breakwater with no crest elements is considered as follows [72]:
where, Rc [m] is the crest freeboard with no crest elements and γf is the influence factor for roughness. The reliability function for excessive wave overtopping used for mitigation option 1, Z12, is:
where qallow is the maximum allowable overtopping discharge. The formula of van der Meer et al. [58] is used to estimate the damage of the breakwater toe in depth-limited breaking conditions:
where hb [m] is the (incident breaking wave) water depth at the toe expressed as the sum of the MSL, the tide and the storm surge and Nodtoe is the number of displaced units within a strip of width Dn at the breakwater toe. The reliability function for toe stability, Z13, is:
2.3.2. Addition of A Third Protective Armor Layer Combined with Heightening Crest Elements
When a third rock layer is added on the seaward side of the primary armor layer of the studied breakwater (mitigation option 2; Figure 2b), a mild effect is expected on the global stability of the armor stone. A third layer is assumed to improve the wave energy dissipation, and therefore, an increase of about 10% can be expected in the stability of the structure [66]. The reliability function, Z21, used for primary armor layer stability is given by:
The formula of van der Meer [70] can be also used to assess reliability function Z21 for mitigation option 2 (Equation (12) including a 10% increase in the structure stability).
If the addition of a third layer on the breakwater seaside primary armor layer is combined with crest elements, i.e., a crown wall on the breakwater crest, Equation (15) can be used to express the reliability function for excessive wave overtopping, Z22. In case the addition of a third armor layer is not combined with elevated superstructures on breakwater crest, the EurOtop [72] formula is used to construct the reliability function for excessive wave overtopping:
where Cr is the reduction factor due to the effect of armored crest berm and Gc [m] is the crest berm width. For toe stability the reliability function of Equation (17) can be utilized also for this case (Z23).
2.3.3. Construction of a Berm Structure in Front of the Breakwater Seaside Slope
Constructing a berm on the windward side of the studied breakwater (mitigation option 3; Figure 2c), a significant effect is generally expected on the global stability and the overtopping discharge of the rubble mound breakwater. The primary armor layer of the breakwater should suffer reduced damage due to the transmission of decreased wave height on the berm crest. The reliability function for primary armor layer stability, Z31, becomes:
where Kt is the transmission coefficient which is estimated utilizing the formula of D’Angremond et al. [73] for (berm) low-crested structures [74] with crest widths B/Hsu ≤ 10:
The previous formula was extended by Briganti et al. (2003) [75] to cover crest widths of B/Hsu > 10:
where Rc [m] is the freeboard height, which is negative if the low-crested structure is submerged below MSL [76], B [m] is the berm width, ξ is the surf similarity parameter ξ = tanθ/s0.5, and s = Hsu/Lp is the wave steepness. Equation (21) (a,b) has a minimum value of 0.075 and a maximum of 0.8. Herein 3-D wave transmission effects are not considered in a holistic approach, yet overtopping, percolation, transmission, and diffraction are treated separately. In future implementations of Kt in the framework of reliability-based upgrading studies, the combined effects of wave diffraction and 2-D transmission (overtopping and filtration) for a 3-D Kt calculation [77] will be examined in order to avoid possible overestimations. It should be noted that the notion of damage does not exist for a berm breakwater, because such a rubble mound breakwater is considered reshaping. Reliability function Z31 can be also assessed based on the formula of van der Meer [70] (Equation (12) including the wave transmission coefficient, Kt, to decrease hydraulic loading on the seaside primary armor layer of the breakwater). For excessive wave overtopping the formula of EurOtop [59] for berm breakwaters can be used [66,69]:
where γb is the berm coefficient, Bberm is the berm width [m], Lberm is a length consisting of Bberm, and two horizontal distances corresponding to the projection of one Hsu [m] above and one below the berm reference level, hberm is the reference level of the berm width with respect to sea water level and xberm is considered to be equal to 2Hsu if the berm is below still water level (SWL) and Ru2% if berm is above SWL [66]. Therefore, reliability function for excessive wave overtopping for mitigation option 3, Z32, is:
For toe stability the reliability function of Equation (17) can be utilized also for this case (Z33).
2.3.4. Construction of A Low-crested Structure in Front of Existing Breakwater
Considering the construction of a low-crested structure in front of the rubble mound breakwater (mitigation option 4; Figure 2d), the fault tree of the ULS for the studied structure also includes the main failure mechanisms for the low-crested structure. Figure 4 presents the ULS fault tree for mitigation option 4 considering the primary armor layer instability for the low-crested structure.
For mitigation option 4, the primary armor layer of the studied breakwater suffers reduced damage caused by the wave transmission over the low-crested structure. Equations (20) and (21)(a,b) can be used to estimate the reliability of the structure for the failure mechanism of primary armor layer instability, Z41. Considering excessive wave overtopping, the reliability function, Z42, used is:
where Kt is the transmission coefficient estimated utilizing Equations (21a) and (21b) [74,76]. Equation (17) can again be used as the reliability function for toe stability, Z43. According to DELOS Project Guidelines [78] for environmental design of low-crested coastal defense structures, it is recommended to select the stone size of the low-crested structure utilizing the formula:
where Rcdet [m] is the freeboard of the low-crested structure (negative, if the structure is submerged under MSL) and Dn50det [m] is the mean nominal diameter of the rock armor of the low-crested structure. Application limits of the aforementioned formula are defined by −3 < Rcdet/Dn50 < 2. The corresponding reliability function is:
2.3.5. Serviceability Limit State of a Rubble Mound Breakwater
Excessive wave height in the protected basin is considered as a SLS of the breakwater under study for all four mitigation options considered. The wave height transformation inside the protected basin is considered as a combination of wave refraction and shoaling, wave diffraction due to sub-aerial protection works, wave transmission through and overtopping of the breakwater [46]. The derived reliability function to represent the SLS is:
where Hallow is the maximum allowable wave height inside the protected basin and Hss [m] is the incident significant wave height corresponding to the SLS of the studied breakwater. The transmission coefficient, Ktrans, is substituted in Equation (28) by means of a simple formula used in “The Rock Manual” [66]:
where Rc [m] is the freeboard of the studied breakwater. Application limits of the aforementioned formula are defined by −1.13 < Rc/Hss < 1.2. The diffraction coefficient is estimated using the formula of Kraus [79]:
where smax is the maximum directional concentration parameter due to wave refraction in shallow water, defined in terms of the deepwater parameter smax,o, using the water depth at the breakwater tip, deepwater wavelength and the angle of the wave crest with respect to bottom contours where the wave enters the shallow water [80], θD (radians) is the wave diffraction angle and WD is given by:
2.4. Quantification of Total Costs
Breakwater design or upgrading requires a detailed representation of hydraulic boundary conditions (wave height, mean water level, storm surge, and tide), as well as of geotechnical parameters (gradation of bottom material, Dn50 values of sediment and rocks, and bottom friction coefficients) and topographical conditions (geometries of structures, obliqueness of wave impact, and bathymetry in the vicinity of the structure) and other features. Considering the stochastic variables of the marine climate, the distribution functions derived earlier (Section 2.2) are used for the variables entering the limit state functions. Boundary conditions of both present and future climate conditions are used as input in the present work. A fault tree is constructed including both ULS and SLS for the breakwater under study for every mitigation option (Section 2.3). A large number of possible alternative geometries (cross sections) for each mitigation option can then be tested, according to their performance for the limit state functions. A failure probability is defined using probabilistic and numerical methods for each geometric option. To decide whether a geometry option is applicable in one structural concept, an acceptable value of the failure probability should be prescribed. The combination of the calculated failure probabilities and the probability constraint define the set of acceptable geometries as [35]:
where z is the vector of the design variables, Pf is the failure probability, and Pf,max is the maximum acceptable failure probability of the studied rubble mound breakwater.
Equation (32) provides a large number of alternative geometries, which fulfill the probabilistic constraint. To select among these solutions, it would be really useful to estimate the costs of every alternative geometric setup for each mitigation option considered. Therefore, the geometry is selected to satisfy the probabilistic constraint while minimizing the total economic expenses. In the present study, only the costs of upgrading and the expected costs of a possible failure of the upgraded structure in its expected lifetime are taken into account in the optimization process [46]. For each upgrading concept and geometry, a construction cost is estimated, depending on structure length, L, the upgrading methodology, and construction materials as follows:
where z is the vector of design variables in each upgrading mitigation option, A corresponds to the areas of the cross sections of the breakwater layers, and I represent the respective costs by volume.
The expected costs of failure are calculated for the expected lifetime of the upgraded breakwater, which in the present work is set to 100 years and represent economic damages in case of failure, as well as costs of repair. The formula to extract the costs of failure is [46]:
where CULS and CSLS are damage costs and Pf,ULS and Pf,SLS are probabilities of failure in case of ULS and SLS, respectively, r is the interest rate, and M is the reference period for ULS and SLS failure. The probability of failure for the ULS, Pf,ULS, is expressed on an annual scale, while the probability of failure for the SLS, Pf,SLS, is expressed on a daily scale (see Section 2.2). ULS economic costs, CULS , include: (a) structural and (b) economic damage costs [46]. Structural costs correspond to damages to the upgraded breakwaters and other infrastructure. Economic damage costs include loss of direct income caused by the downtime of port/harbor or marina operations, expenses for alternative transportation of goods and passengers, loss of indirect income caused by bad reputation and competitive activities, and indirect economic damage to the local and national economy. ULS economic damage costs can be approximated considering that the protected basin has to cut its capacity for a long period of time, depending on the upgrading concept and the repair strategy.
3. Upgrading of A Rubble Mound Breakwater in the Port of Deauville
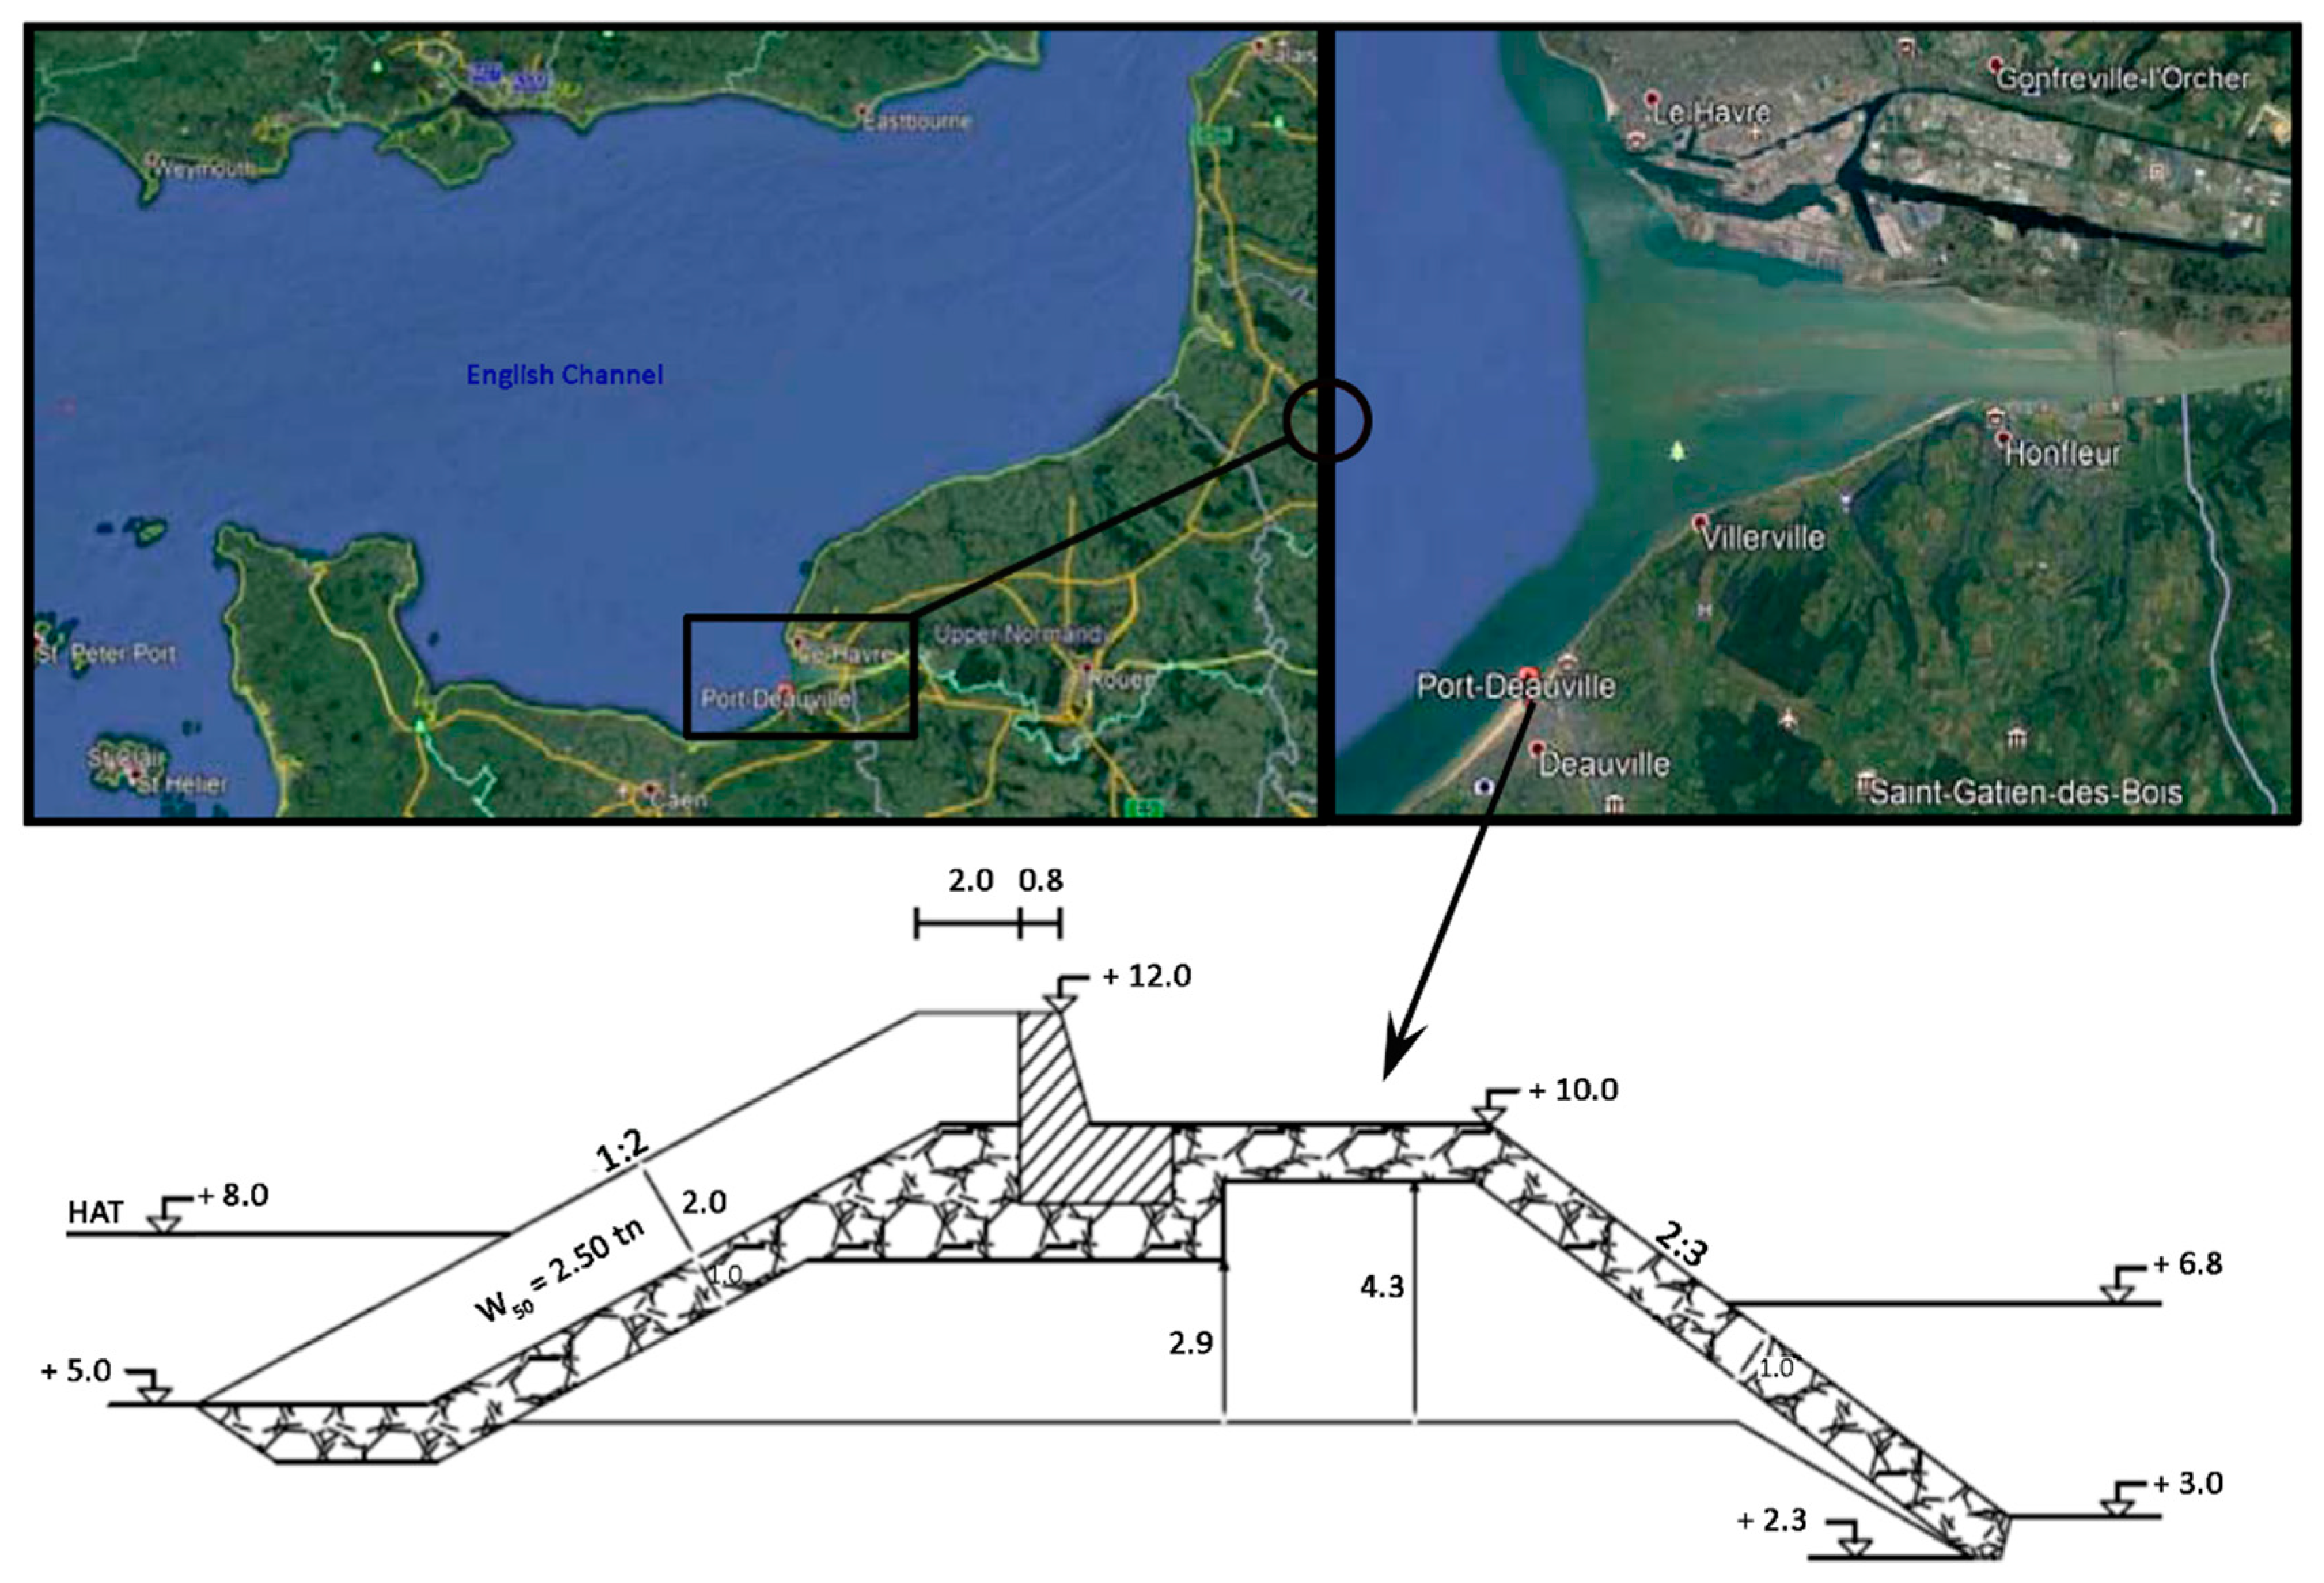
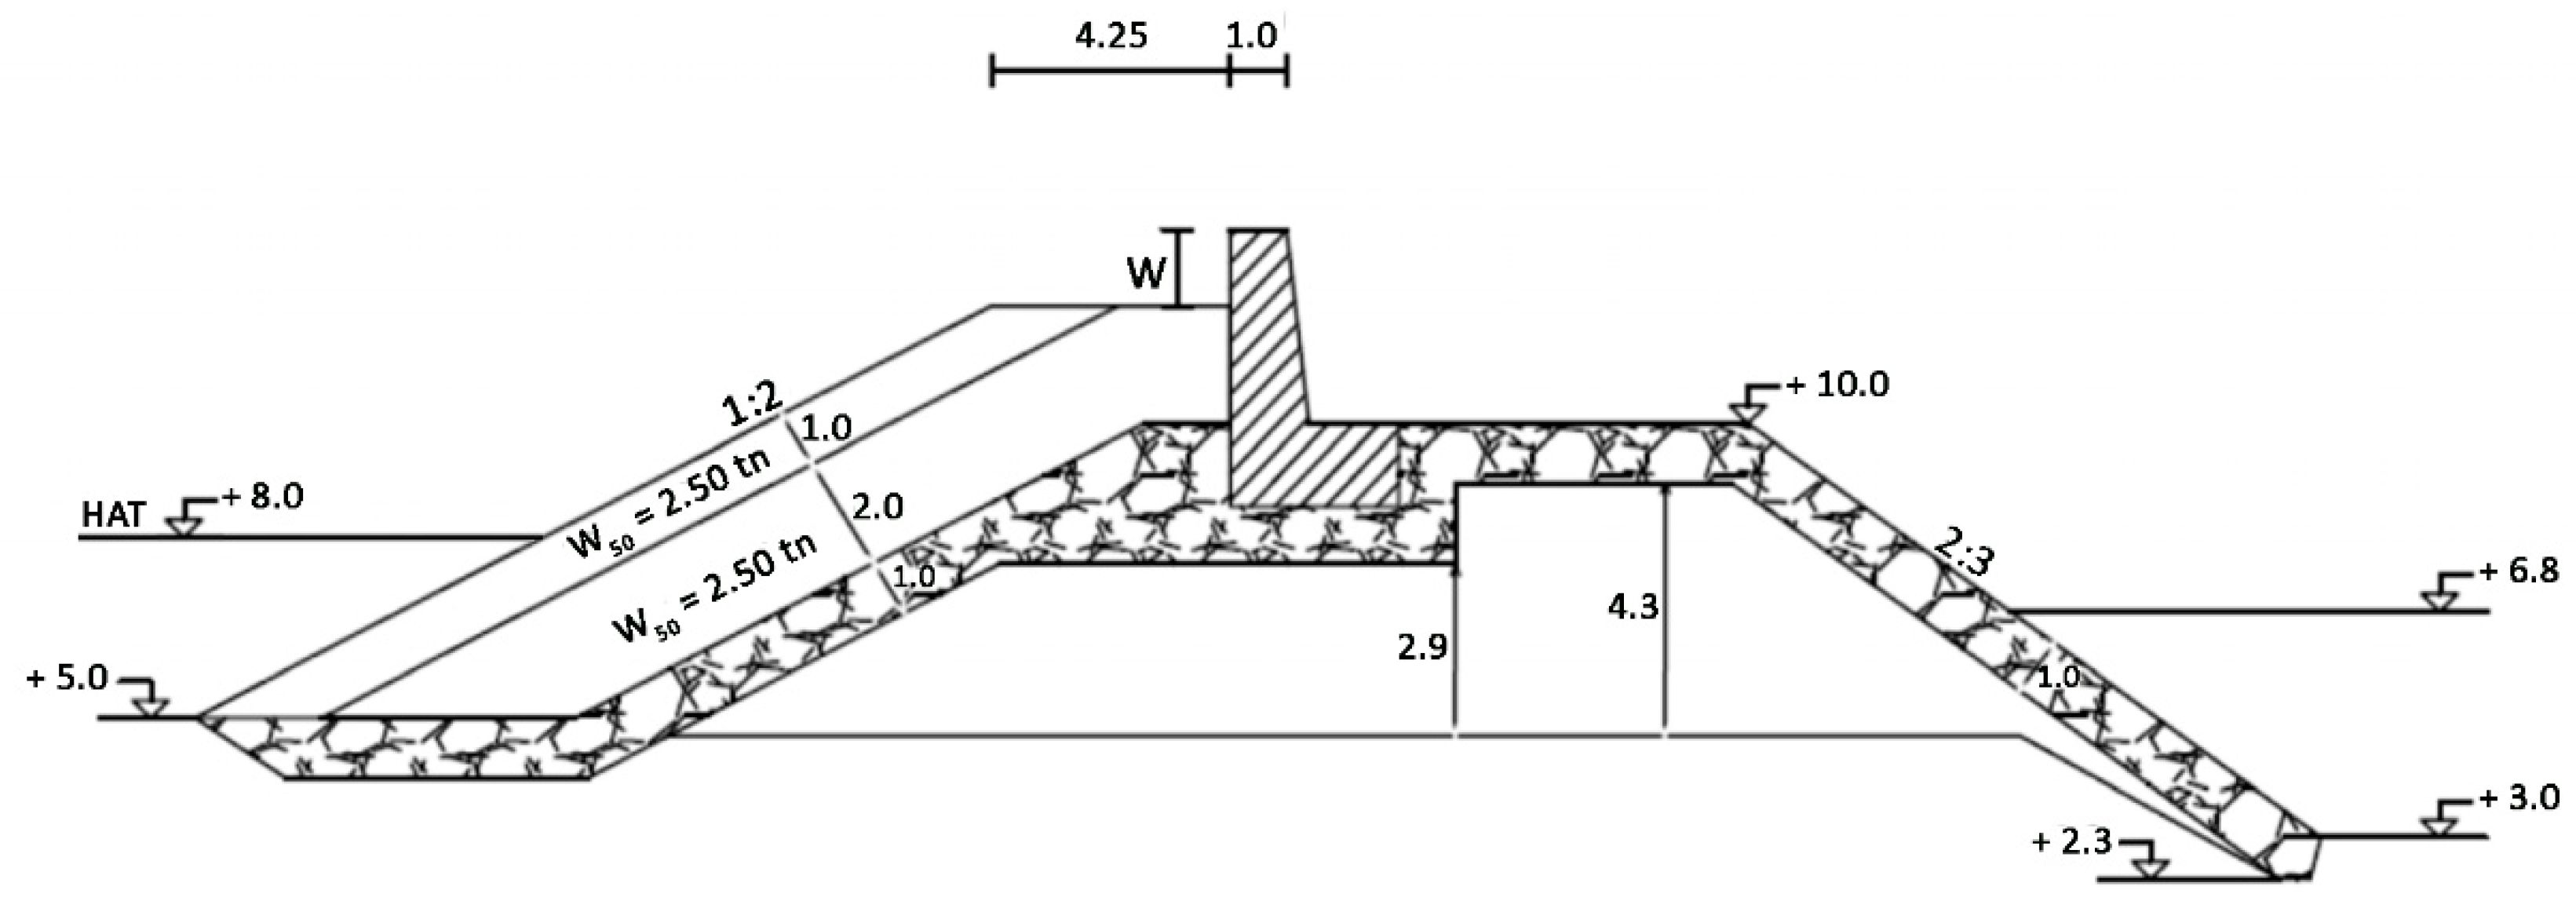
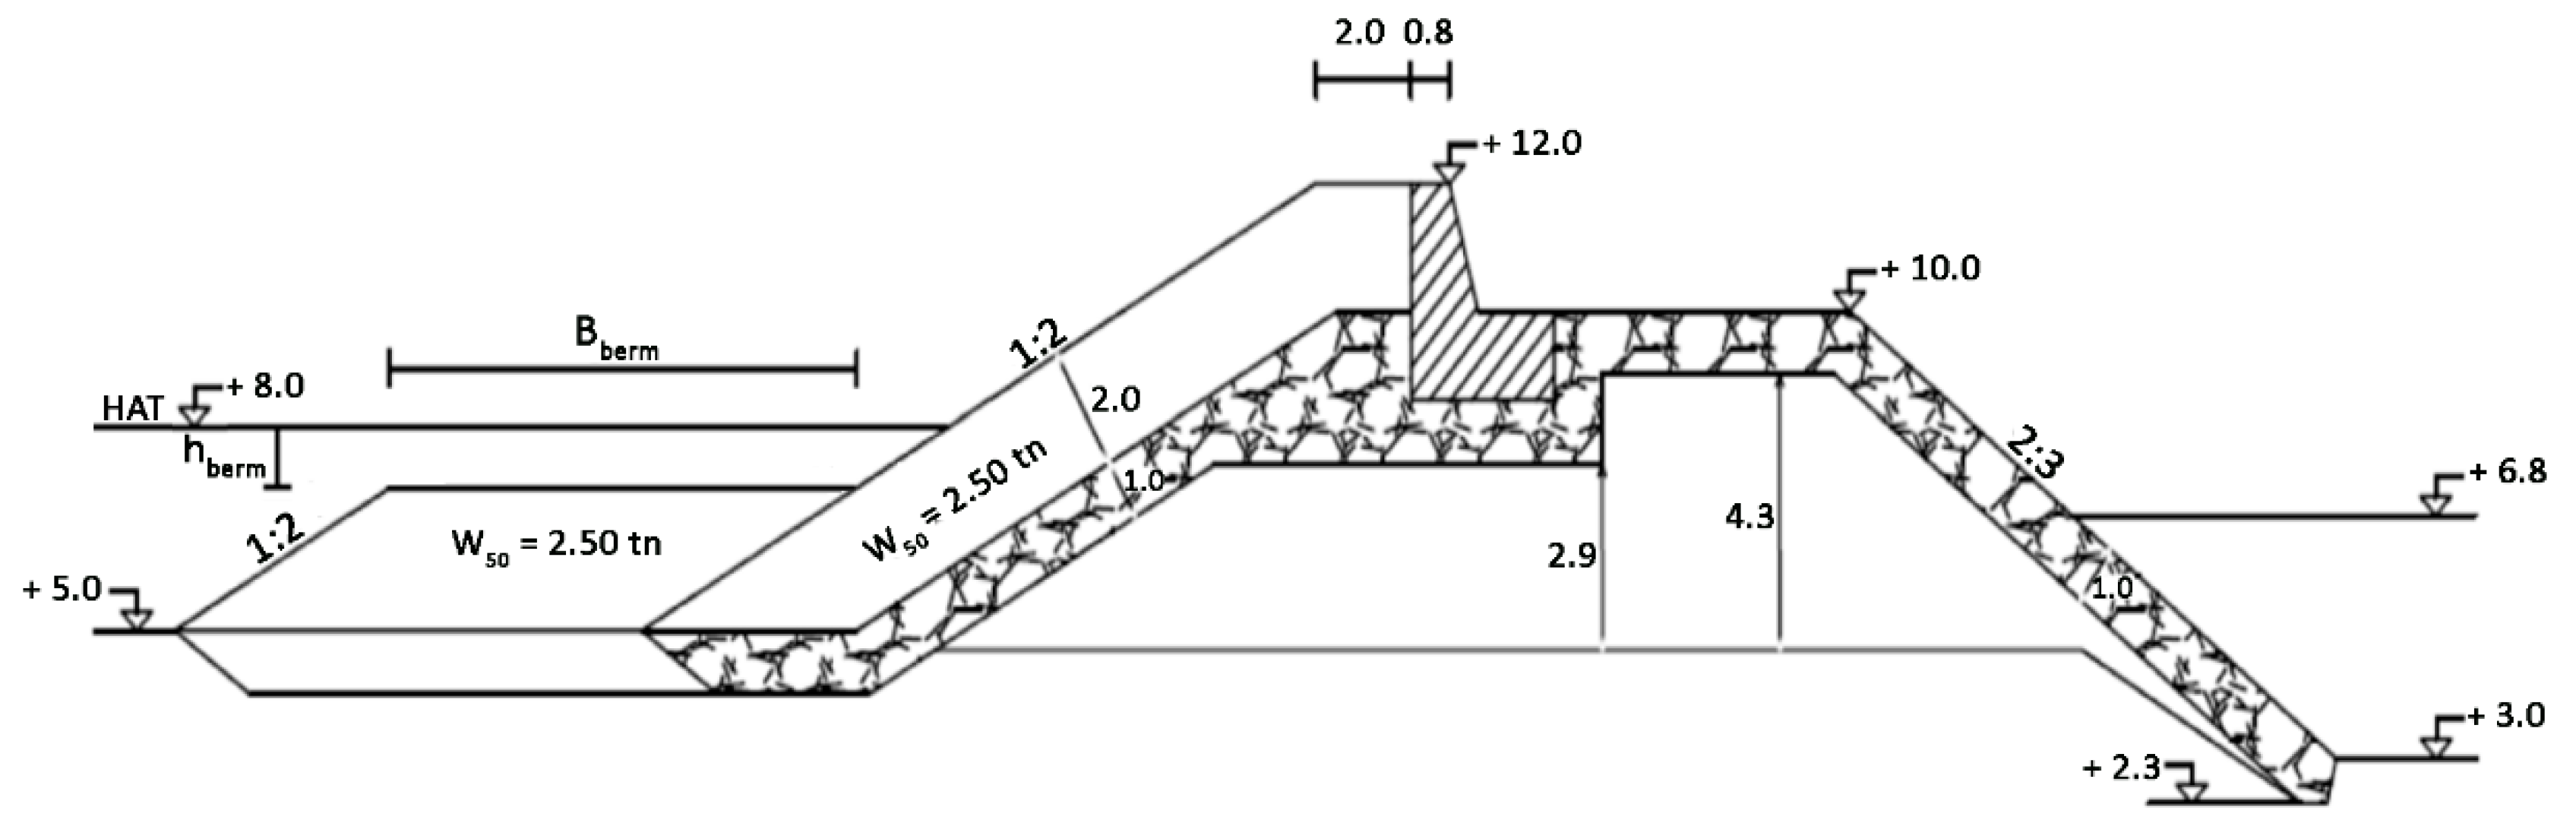
In the present work different upgrading mitigation options (Section 2.3) are applied within a reliability analysis and lifetime cost minimization framework to a selected rubble mound breakwater located in the marine area of the northwestern French city of Deauville, so that the structure and the associated protected basin can withstand future climate conditions. The studied breakwater resembles the one protecting the marina built within the residential complex of port Deauville to compensate for the saturation of the yacht basin at port Morny. The main characteristics of the existing breakwater, i.e., basic layers, layer materials, geometry of layer units, crest width, base and crest level, etc. are preserved. Performed minor changes aid the implementation of the proposed methodological framework. The rubble mound breakwater of the port of Deauville is 770 m long. The typical cross-section of the breakwater includes a core made of limestones, a secondary (inner) armor layer made of quarry rock (rip-rap) weighting up to 0.5, and a primary (outer) armor layer made of blocks reaching a maximum weight of 3.5 to 5 ton, with W50 = 2.5 ton. The windward slope of the primary armor layer is 1/2, while the leeward slope of the breakwater is 2/3. The crest height is +7 m (+9 m) from the seabed level in front of the upstream (downstream) slope, and +12 m from reference level of the submerged basement. Figure 5 shows the (typical) cross-section of the studied rubble mound breakwater of the present work, located in the port of Deauville on the northern coast of France in the English Channel.
The marine conditions that were available to us for the Deauville port area represent daily data for joint offshore waves and sea levels under high-tide conditions, for a period of 104 years [84,85]. The aforementioned database has been created combining the method of Hawkes et al. [86] to model the relationship of simultaneous wave and surge observations with Monte Carlo simulation [84]. The method of Hawkes et al. [86] has been applied to in situ measurements (tide gauges, wave data buoys) and the database ANEMOC covering the period from 1 January 1979 to 31 August 2002 [87]. The resulting Monte Carlo simulations include 7.06 × 10⁶ couples of significant wave height, storm surge, tide, and water level corresponding to the peak of the semi-diurnal tide, i.e., one record every 12−13 h. The available datasets are based on stationary simulations and are considered to represent present climate conditions, ignoring the possible effects of climate change on the marine environment. Future marine climate conditions are assessed based on existing literature (i.e., [88,89]). Indicative values of significant wave heights in the broader Area of Le Havre correspond to 4.5–5.5 m, based on a 24-year period analysis (during 1979–2002) by using the Generalized Paretto Distribution with a 2.5 m threshold for 100-years return period.
Annual maxima of offshore significant wave height and storm surge are extracted from the 10000-year simulated time series, and the GEV distribution (Equation (1)) is fitted to the data samples using the method of L-moments [90]. The extreme tails of offshore wave heights and storm surges are described by the GEV parameter vectors θ1 = (4.19, 0.48, −0.078) and θ2 = (0.69, 0.14, 0.109), respectively. The Normal distribution function N(0.066, 0.0062) is fitted to offshore wave steepness data during extreme conditions. Maximum daily wave heights in the area are fitted by a Rayleigh distribution (Equation (4)) using L-moments and the resulting parameter vector is θ3 = (−0.26, 1.11).
To estimate the distribution function of extreme significant wave heights at the breakwater site, the approach described in Section 2.2, viz. Equations (2) and (3) can be used for present climate conditions. To implement the approach, the design wave height of the studied breakwater is assumed to correspond to a return period of 100 years, which is considered to be quite a common return period for designing port and harbor protection structures. Applying Equations (2) and (3), the GEV distribution of extreme wave height for present climate conditions at the breakwater site is characterized by a parameter vector θ1’ = (1.69, 0.22, −0.078). For regular wave conditions (represented by the CDF of daily maximum offshore wave heights), the approach of Section 2.2 (Equation (5)) results in the Rayleigh distribution with parameter vector θ3’ = (−0.11, 0.45) characterizing the SLS of the studied breakwater. The level of the highest astronomical tide (HAT) at the breakwater location is estimated to reach almost 3 m from seabed. Considering future climate conditions, some general estimations are used in the present study to assess extreme marine conditions, caused by lack of data for future sea states at the site of interest.
- an optimistic scenario of +40 cm,
- a pessimistic scenario of +60 cm,
- an extreme scenario of +1 m, compared to the year 2000.
Because of shortage of available information, the estimated extreme value distribution function for the stochastic component of total sea level, namely the storm surge, is assumed unchanged compared to present climate conditions. However, it has been assumed that the total sea level presents an increase by the end of the 21st century based on the optimistic scenario of ONERC [89]. According to a CETMEF (Centre d’Etudes Techniques Maritimes et Fluviales) study [88] extreme waves could increase by 0 to 30 cm in the North-East Atlantic. Along the French coast, an increase of the offshore wave height between 20 and 40 cm is expected until 2100, according to greenhouse gasses emission scenarios B1 and A2, respectively. In the present study an increase of 40 cm in the 100-years extreme wave height has been assumed. Therefore, the extreme tail of wave heights is described by the parameter vector θ1’ = (1.69, 0.33, −0.078), retaining the mean and the shape parameters of the present climate distribution function unchanged and changing the scale parameter, so that the 100-years wave height increases by 40 cm. Changes applied to the scale parameter of the GEV distribution function imply that the future marine climate presents an increase in extreme waves variability compared to present climate conditions, while their mean extreme values hardly change during this interval (the location parameter remains unchanged). The shape parameter of the GEV, which governs the tail behavior of extreme values, remains unchanged with respect to present climate conditions to facilitate the extraction of wave extremes future distribution. However, an increase in this parameter could also be assumed, since it describes whether extreme events are likely to occur and it is well known that climate change is associated with changes in both the magnitude and frequency of such events.
For all four mitigation options, the minimization problem can be represented as:
The maximum tolerable wave height in the port basin during regular weather conditions is set at Hallow = 0.5 m. The maximum allowable overtopping discharge for extreme wave conditions is qallow = 0.01 m3/s/m [72]. The number of displaced units within a strip with width Dn at the toe of the structure is set at Nodtoe = 2, allowing some flattening out of the toe of the structure. The permeability factor of the structure is P = 2, the number of waves N = 3000, while the damage level of the van der Meer [70] formula for hydraulic stability is set at S = 2–3 (initial damage). The diffraction coefficient at the breakwater site is estimated using the formula of Kraus [79] as Kdif = 0.217 (Equations (30) and (31)) assuming an angle of wave crest with respect to bottom contours where the wave enters shallow water equal to 30°. For each upgrading concept and geometry, a construction/upgrading cost is estimated, depending on structure length, the upgrading methodology, and construction materials.
Typical approximated values of upgrading costs (per unit length) used in this work include (actual values are not considered critical, and could be arbitrarily selected out of current prices based on market research):
- 1500 € for a parapet wall being strengthened and heightened by 50 cm,
- 2500 € for adding a third rock layer on the primary armor layer of the studied breakwater,
- 5000 € for constructing a berm at the seaside slope of the existing structure,
- 25,000 € for constructing a low-crested structure in front of the studied breakwater.
The expected costs of failure of the upgraded structures represent damages or losses in case of the marina downtime and costs of repair. The economic costs of failure are estimated separately for the ULS and the SLS. ULS economic costs include: (a) structural and (b) economic damage costs [46]. Structural costs correspond to damages to the upgraded breakwaters and other infrastructure. Economic damage costs include loss of direct income (port revenue) caused by the downtime of marina operations, expenses for alternative transportation of goods and passengers, loss of indirect income caused by bad reputation and competitive activities, and indirect economic damage to the local and national economy. In the present work, it is assumed that the cost of repairing the upgraded breakwater in case of failure reaches 20% of the initial upgrading expenses. The marina of Deauville, which can accommodate up to 850 yachts with 150 berths reserved for visitors, is utilized in this paper to assess total failure costs (for both ULS and SLS) for the optimization process. To estimate the direct economic damage, it is assumed that when a collapse by an extreme storm occurs, the marina has to cut its capacity by half and this can last for up to half a year. Indirect economic damage is also included in the optimization process by increasing the aforementioned economic damage costs by 50%. SLS costs, CSLS, are estimated per day of downtime of the operations in the protected basin. Daily losses of direct and indirect income are also estimated for each downtime day. Indirect economic damage is also accounted for by increasing the cost of daily suspension of marina operations by 50%. The reference time, M, for the ULS and the SLS in the present work is set to M = 100 years and the interest rate is considered 5%.
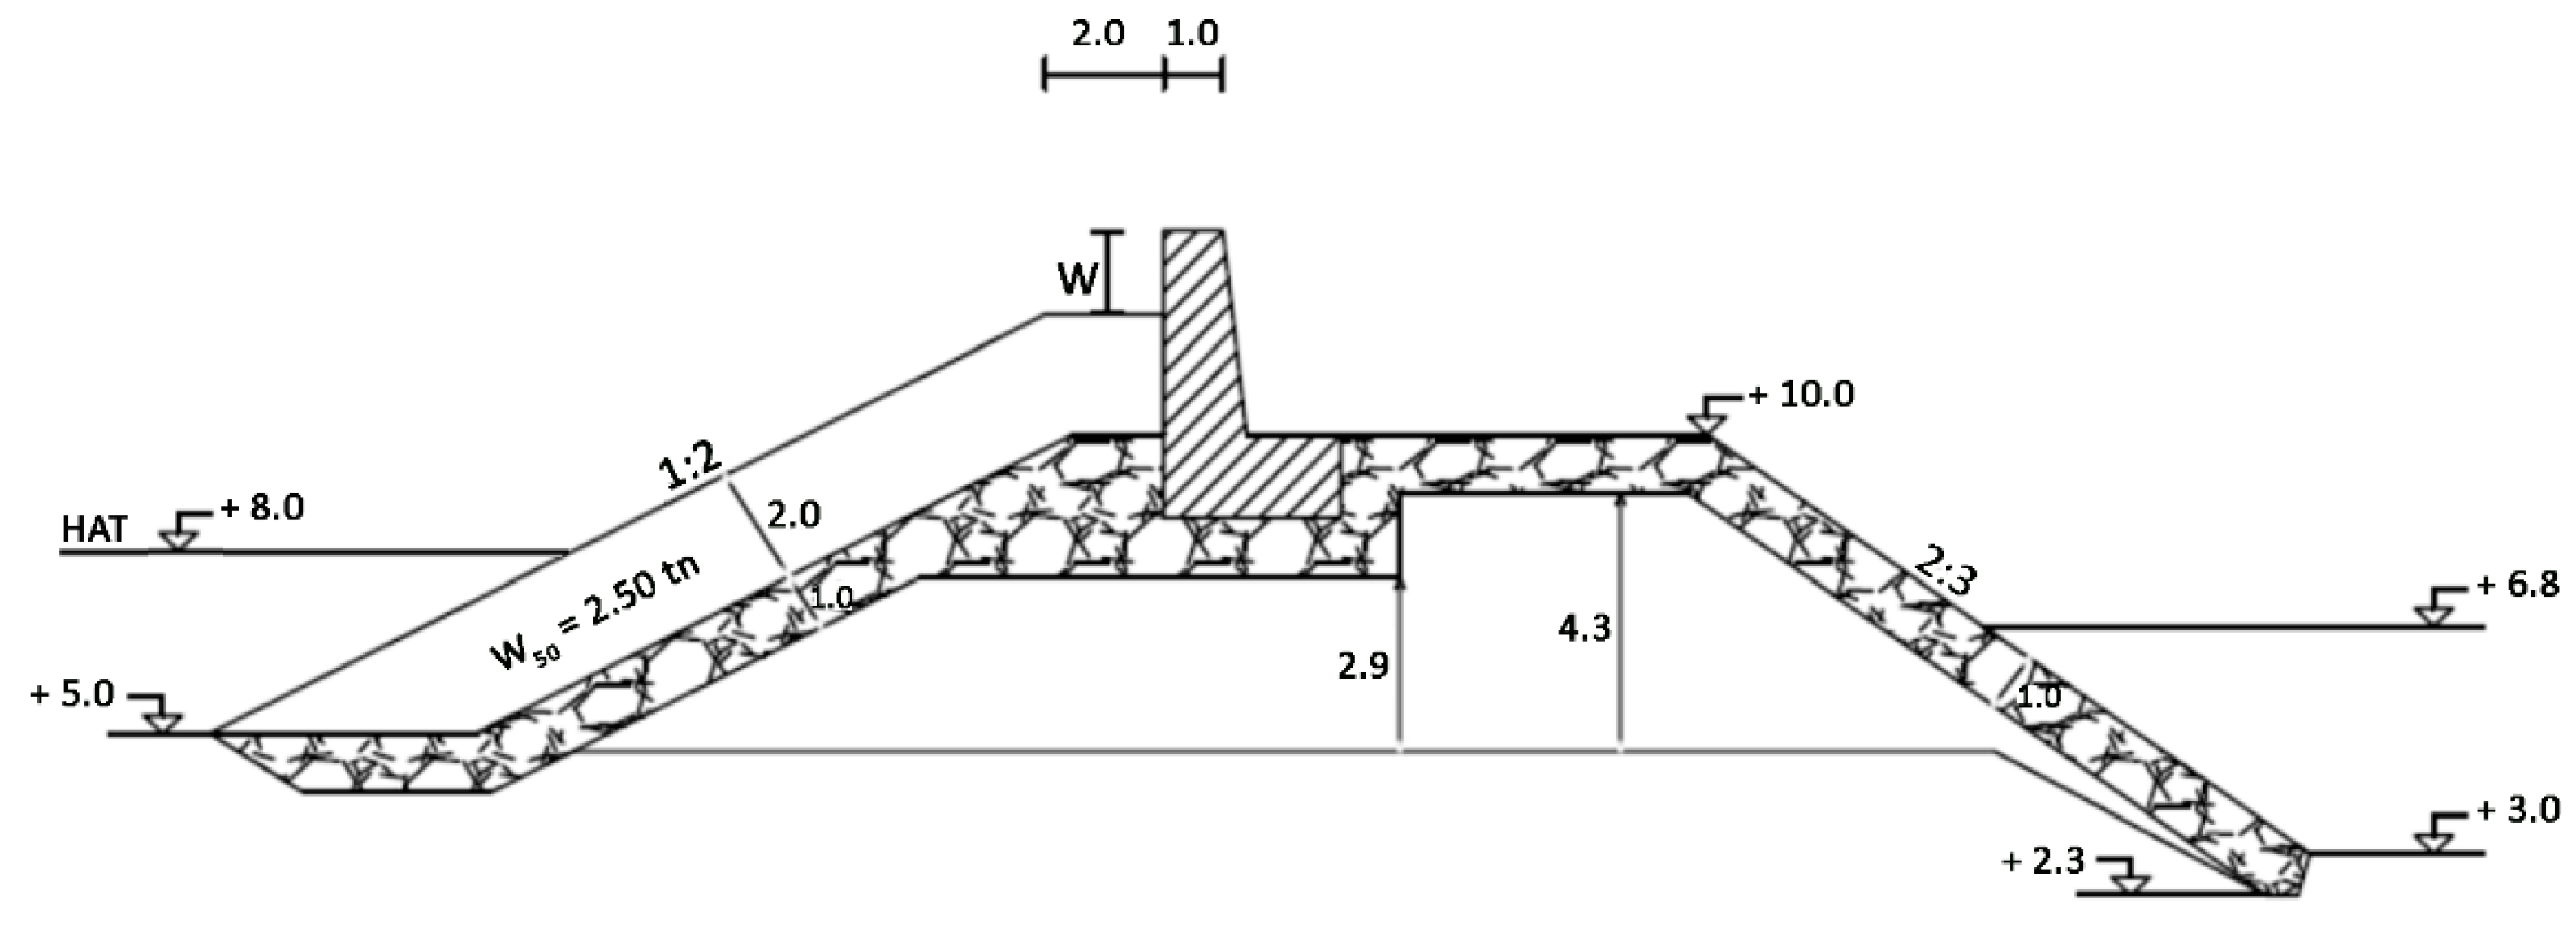
3.1. Results of Mitigation Option 1: Crest/Crown Elements
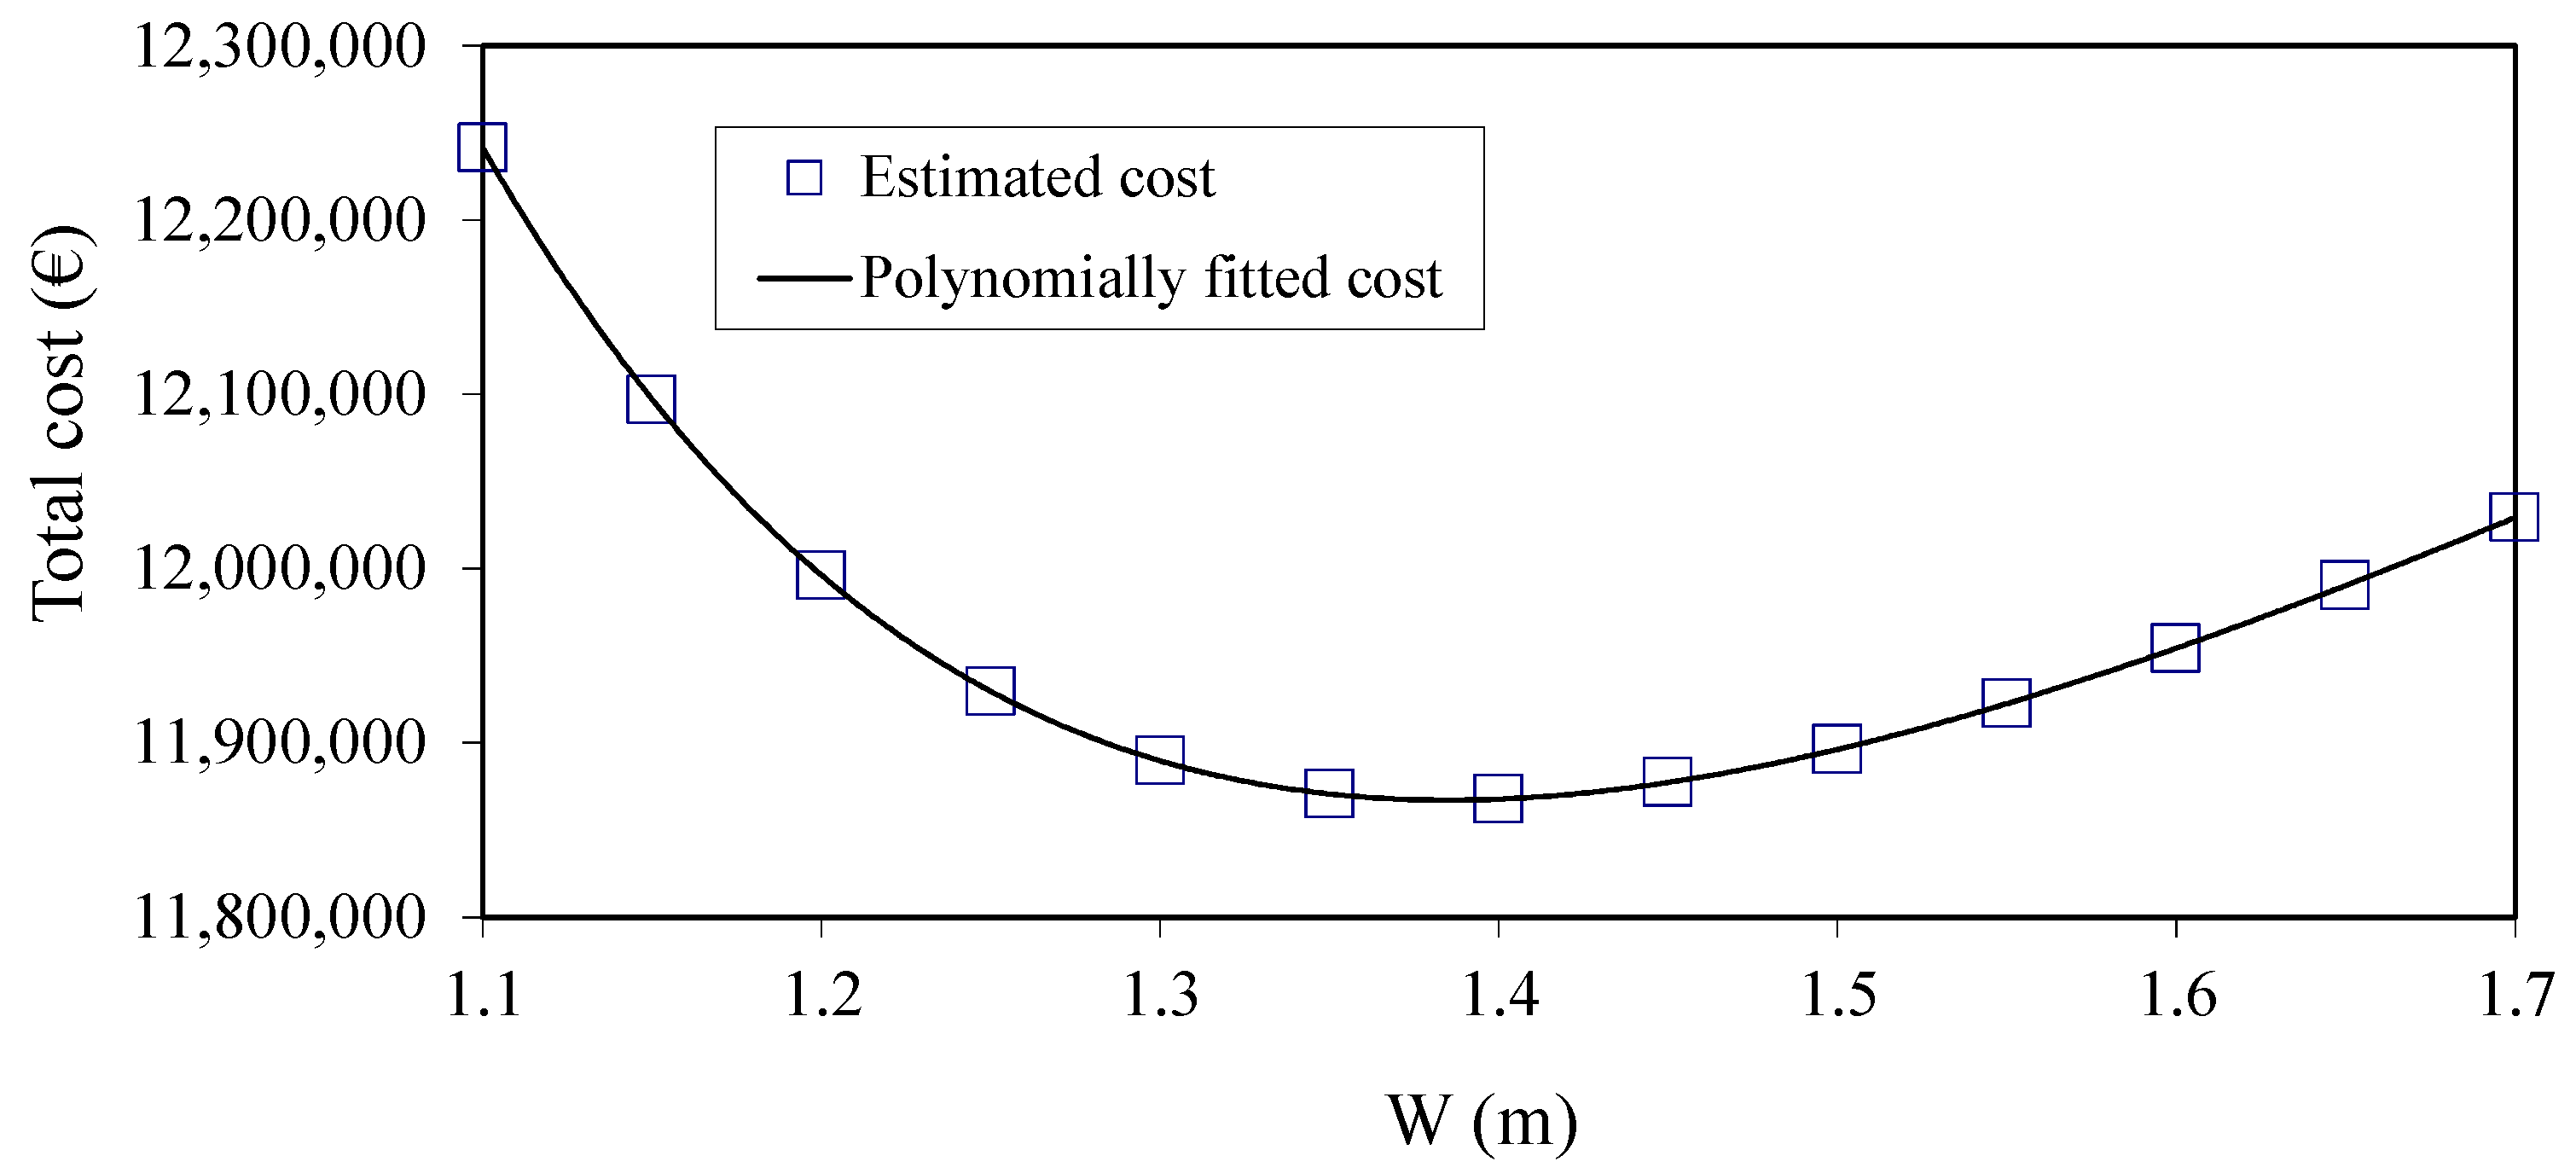
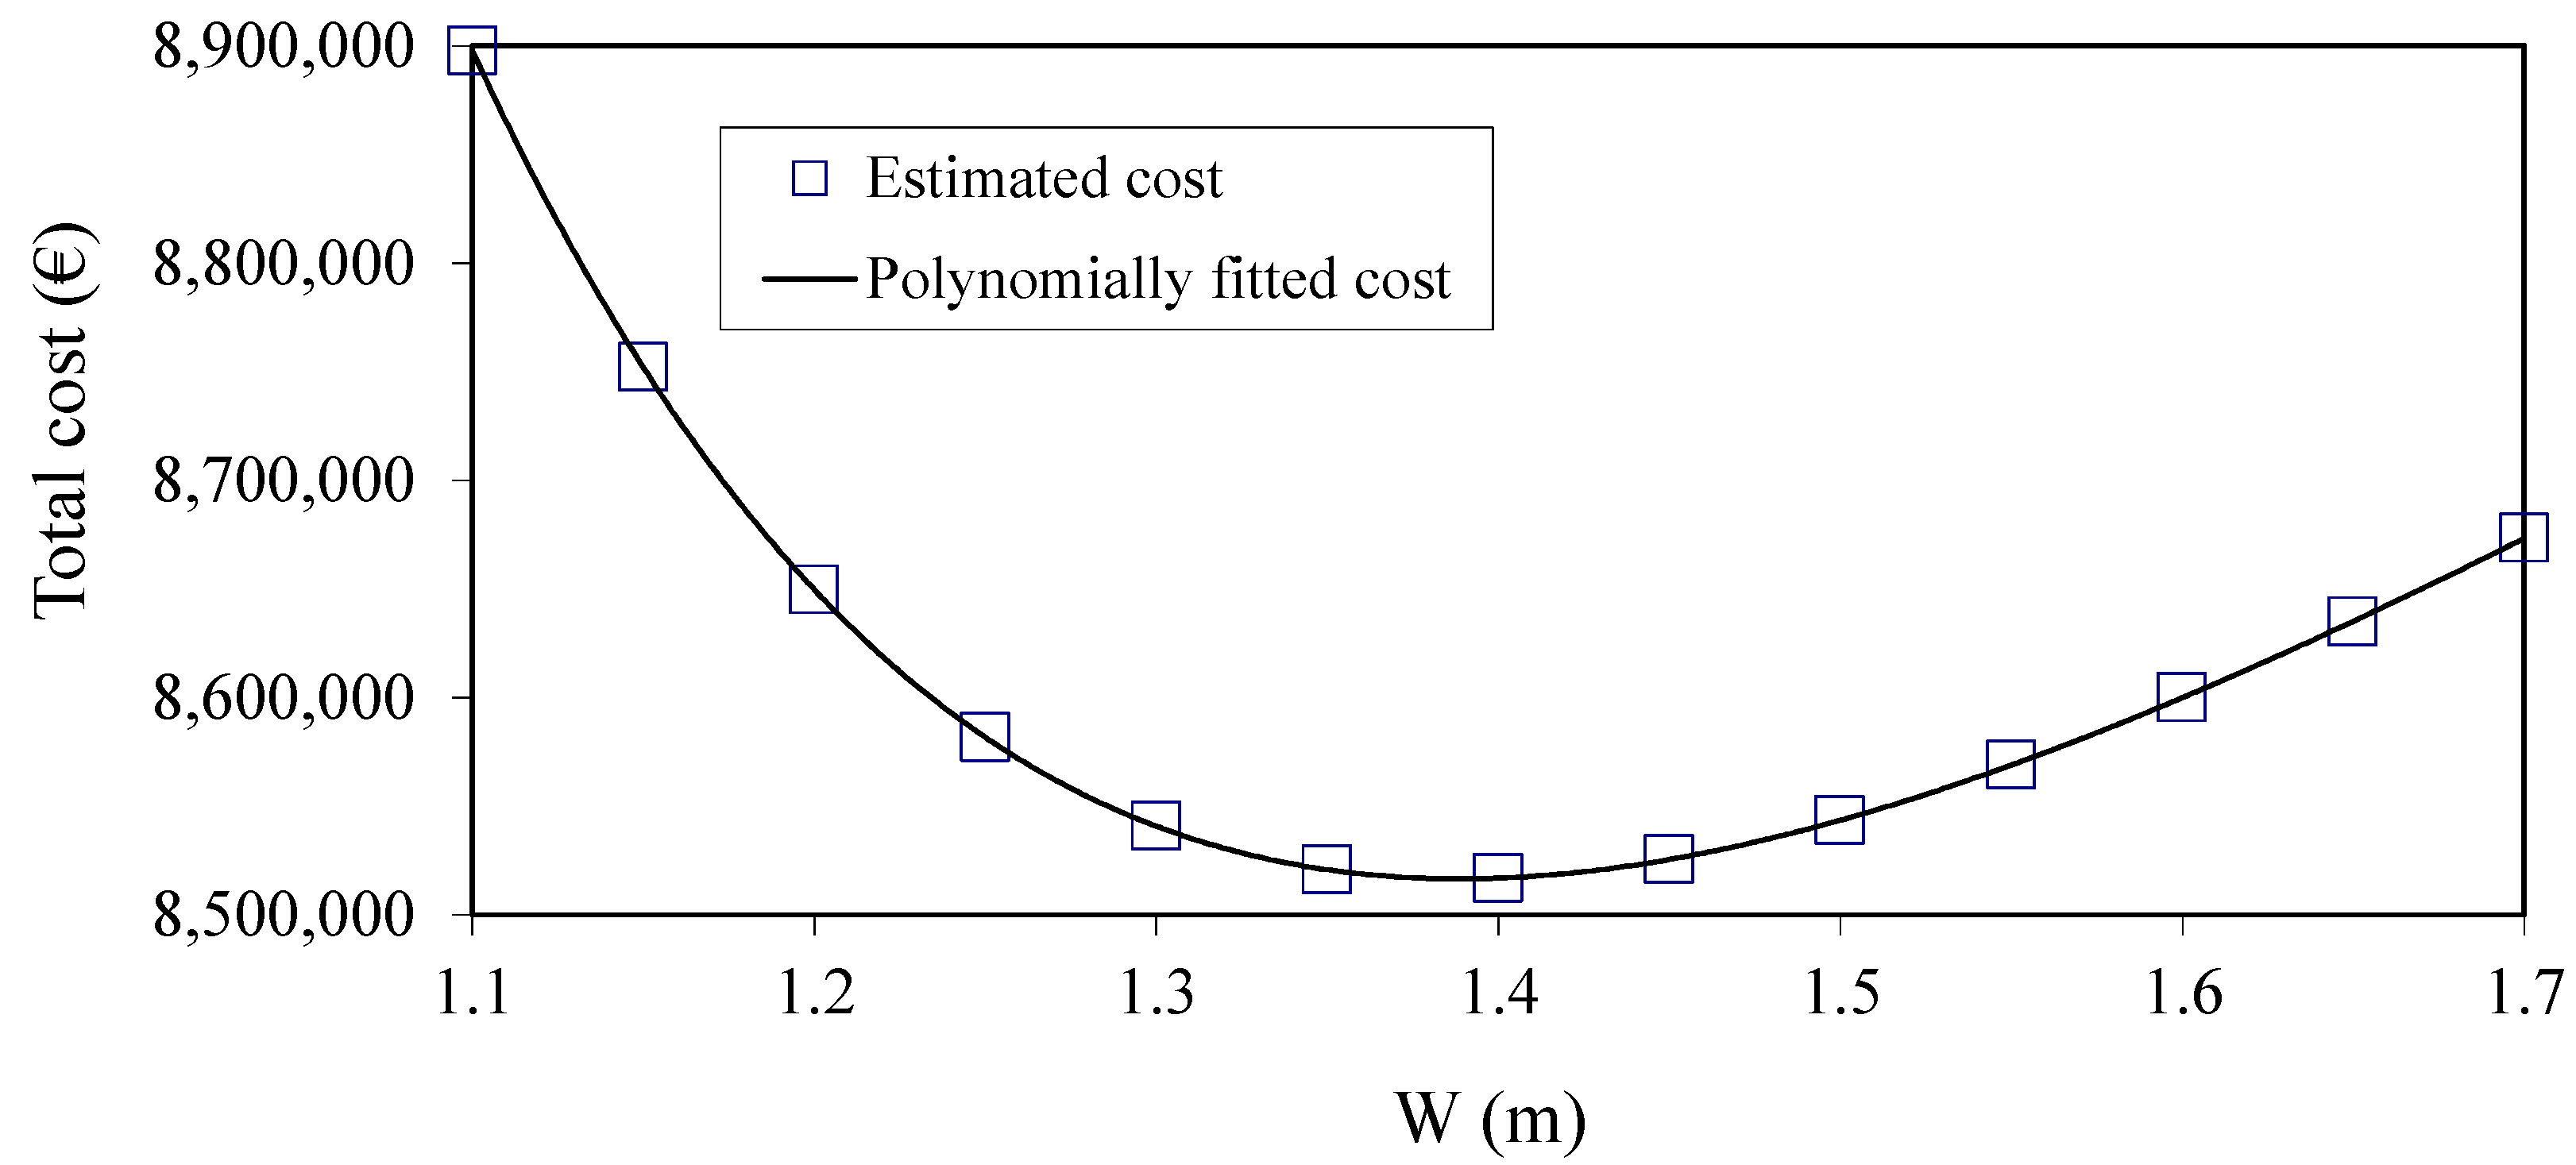
Regarding mitigation option 1, with crest elements added to the structure or existing crown structures being heightened and strengthened, the upgrading procedure for the studied breakwater is presented in Figure 6. The height of the existing crest element is in fact raised to face the increased future marine hazards. The crown structure exceeds the breakwater crest by a dimension equal to W, which serves as a variable of the total cost optimization process (see Section 2.4). Figure 7 and Figure 8 present the total costs, estimated using Equations (33) and (34), as functions of the crest element height with respect to the breakwater crest. Figure 7 presents results of the optimization process allowing 0%–5% damage (KD = 4), while Figure 8 displays optimized costs allowing 5%–10% damage to the primary armor layer (KD = 4.9). For almost no damage to the primary armor layer, the optimization procedure results in Wopt = 1.4 m, while the minimum total cost is estimated to be Itot 11.868 × 10⁶ €. The respective values are Wopt = 1.4 m and Itot ≈ 8.517 × 10⁶ € for 5%–10% damage to the primary armor layer. Therefore, the amount of allowed damage to the primary armor layer does not seem to influence results of the reliability-based optimization process in terms of the magnitude of the crown wall elevation. The upgrading costs (Icons) cover almost 54% and 75% of the total costs (Itot), respectively. It should be noted that application of van der Meer [70] formula for armor layer stability (Equations (11) and (12)) produced quite similar results with the ones shown in Figure 7.
3.2. Results of Mitigation Option 2: Additional Armour Layer with Enahncement of Crest/Crown Elements
In mitigation option 2 a third layer is added to the primary armor layer of the structure, thus the upgrading procedure is presented in Figure 9. In the case of inadequate covering by the third layer of the crest width, it has to be combined with a crest element in the form of mitigation option 1. The third armor layer should be of the same mean nominal diameter Dn50 (with W50 = 2.5 ton) as the two underlayers of the studied breakwater, therefore the height, W, of the concrete element exceeding the breakwater crest is the sole variable that has to be estimated during the total cost optimization process.
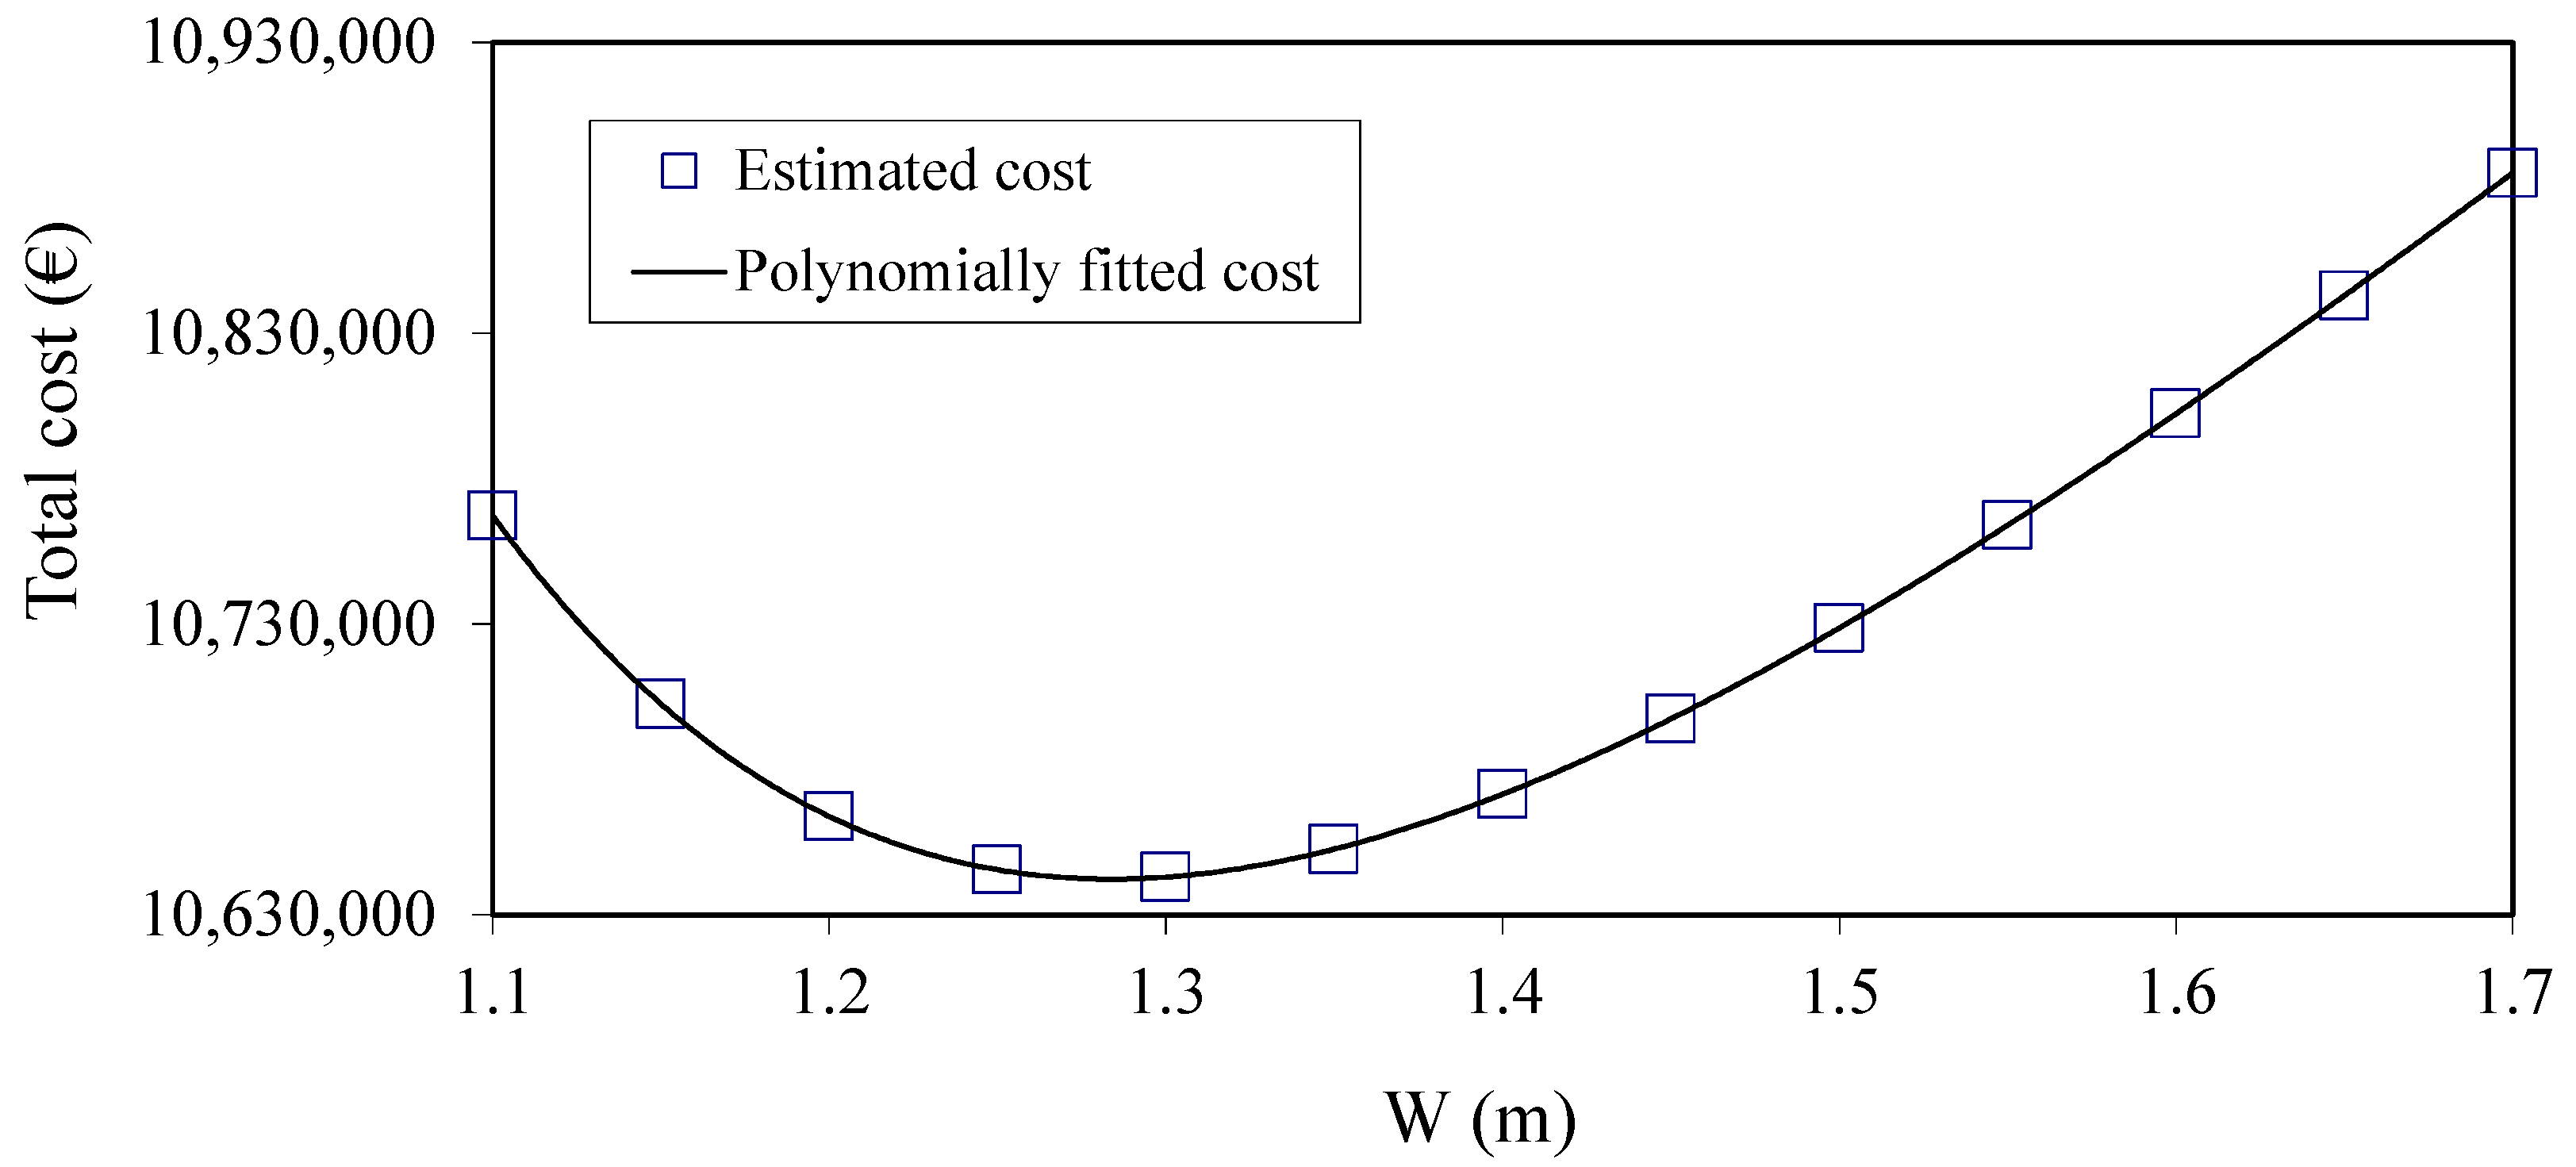
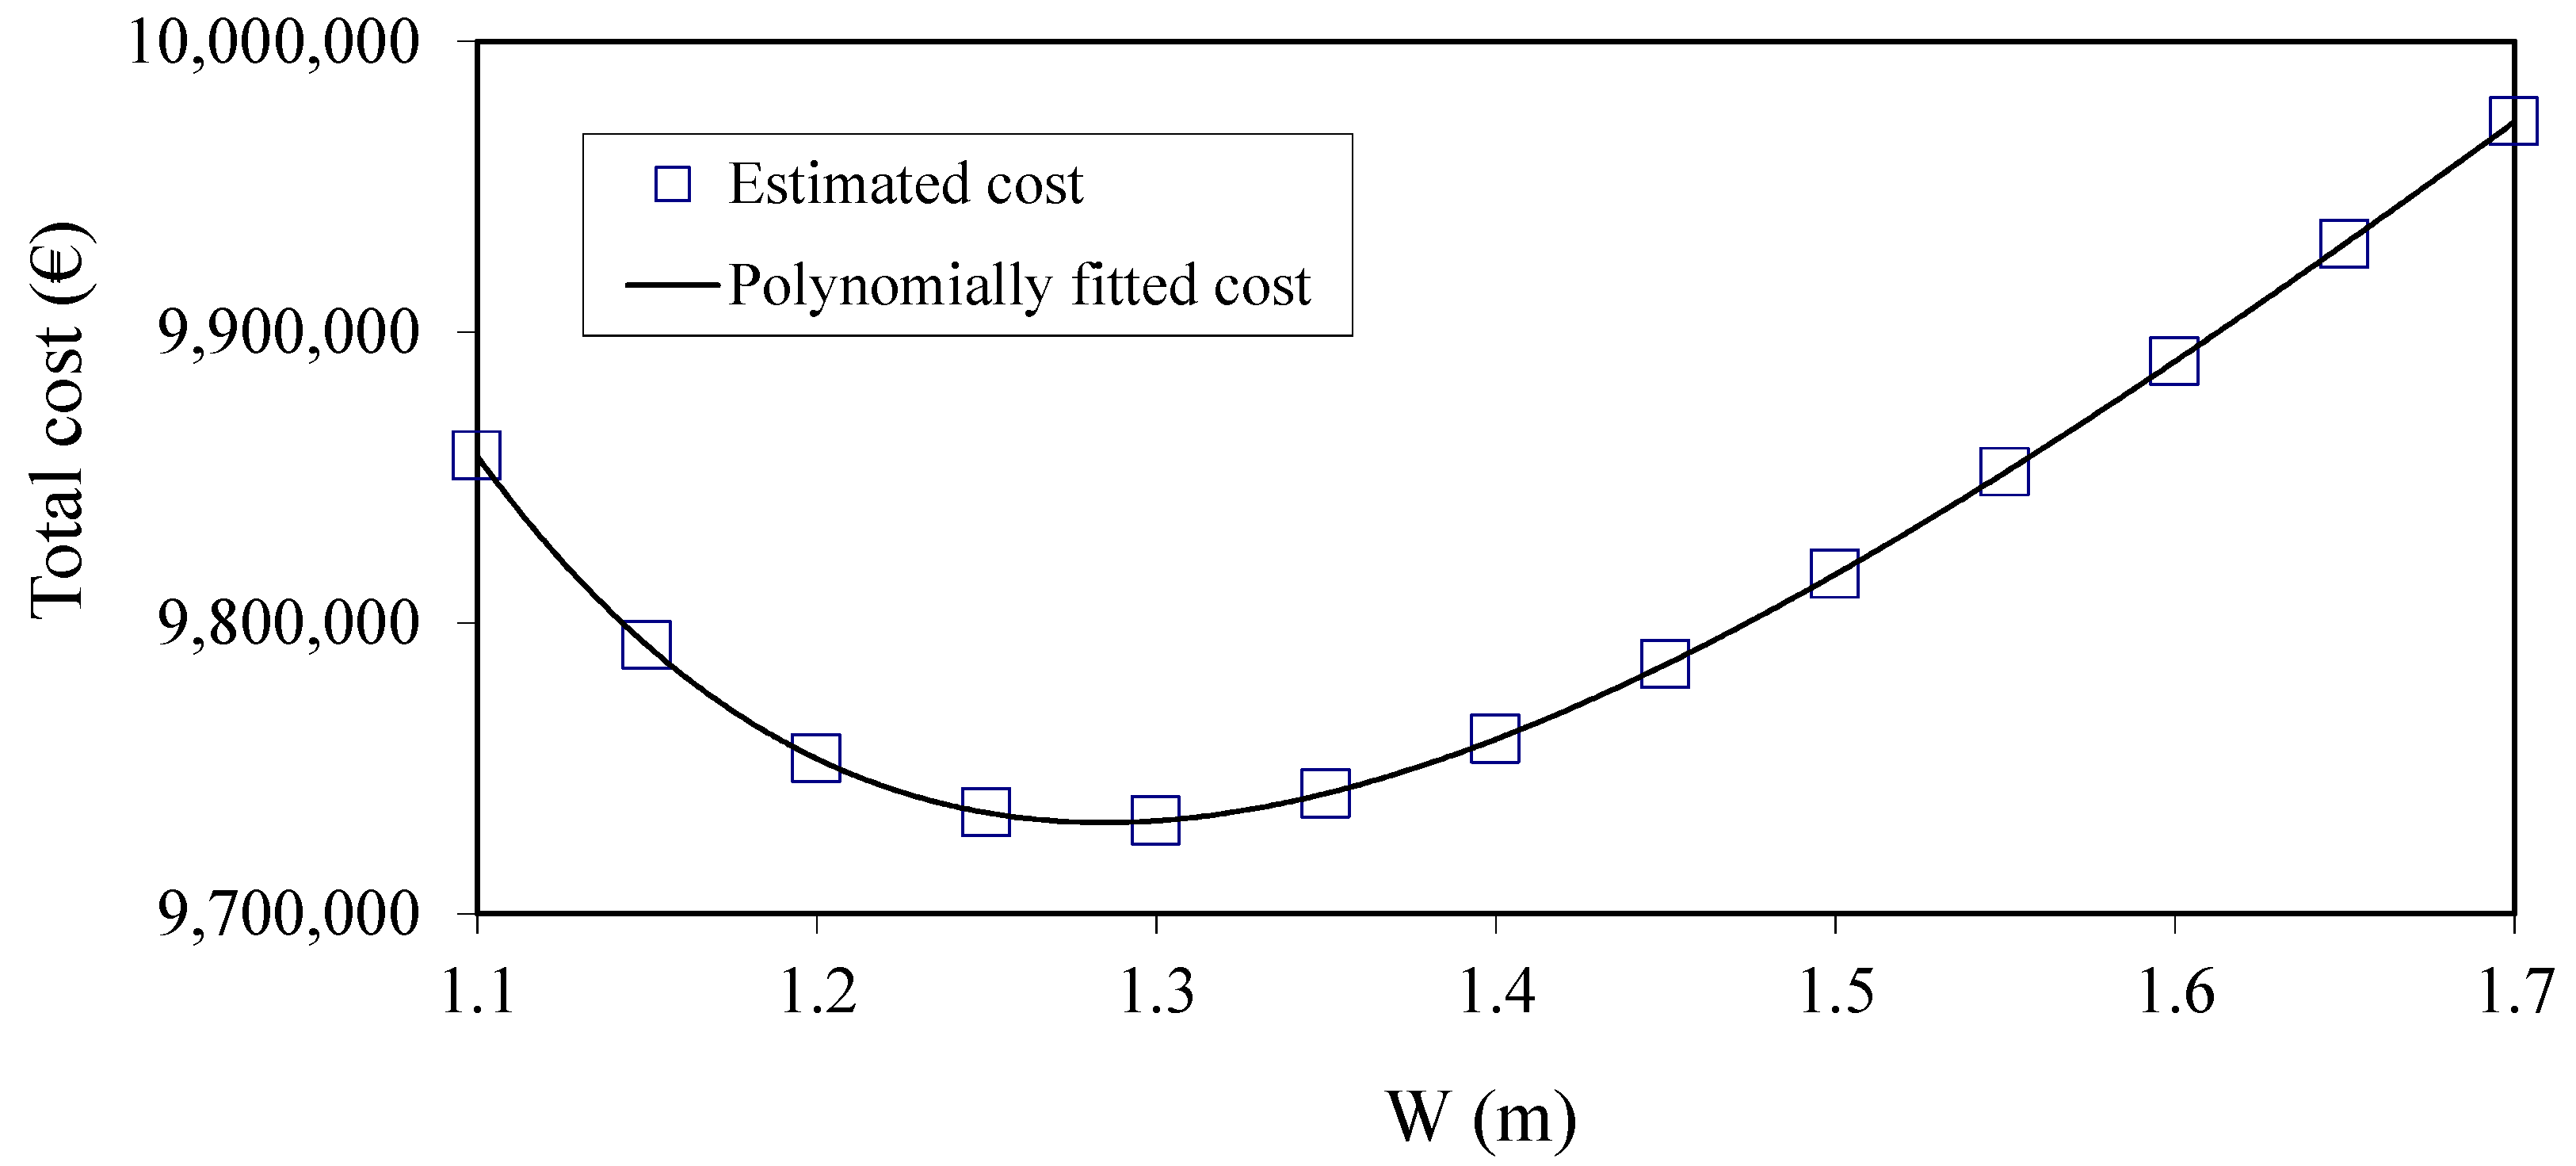
Figure 10 and Figure 11 present the total costs as a function of the additional height of the crest element. Figure 10 presents results of the optimization process allowing 0%–5% damage (KD = 4), while Figure 11 allows 5%–10% damage to the primary armor layer (KD = 4.9). For almost no damage to the primary armor layer, the optimization procedure results in Wopt = 1.3 m, while the minimum total cost is estimated Itot ≈ 10.643 × 10⁶ €. For 5%–10% damage to the primary armor layer the respective values of optimal crest height and total cost are Wopt = 1.3 m and Itot ≈ 9.732 × 10⁶ €. The upgrading costs (Icons) cover almost 87% and 94% of the total costs (Itot), respectively. In regard to mitigation option 2, the amount of damage to the primary armor layer mainly affects the third layer of rocks added above the two existing underlayers. Therefore the primary armor layer suffers reduced damage compared to mitigation option 1 (no protective armor layer) and the maintenance on the armor stone for mitigation option 2 is significantly reduced. Results similar to Figure 10 are also produced using the van der Meer [74] formula to calculate hydraulic stability of the seaside primary armor layer of the studied structure (Equations (11) and (12)).
3.3. Results of Mitigation Option 3: Additional Berm
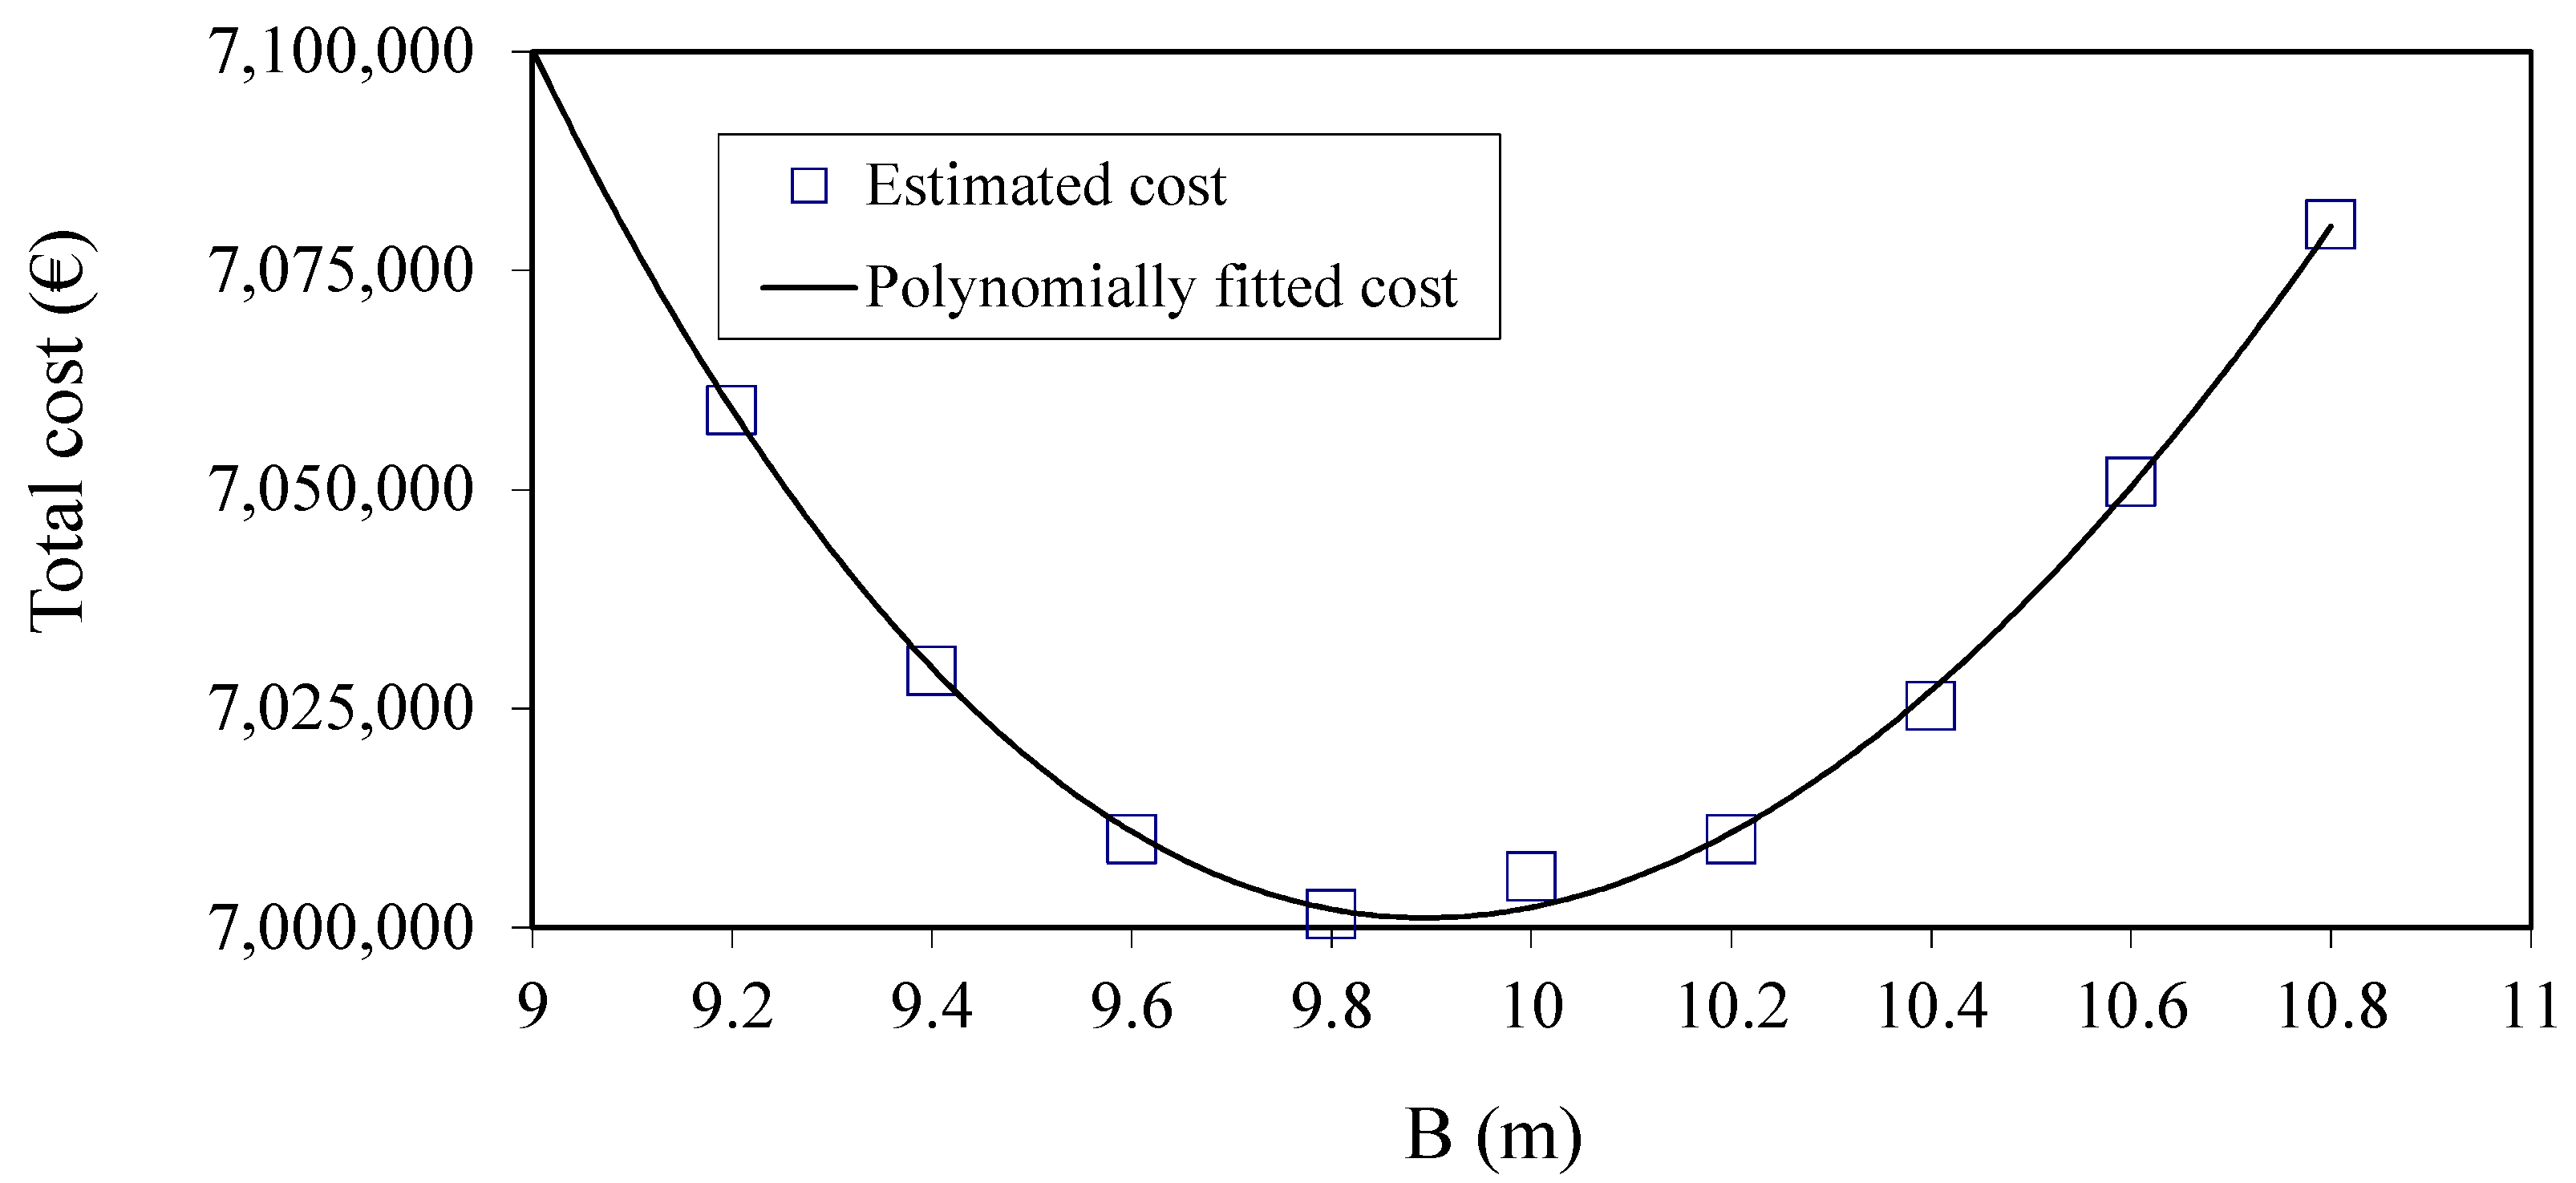
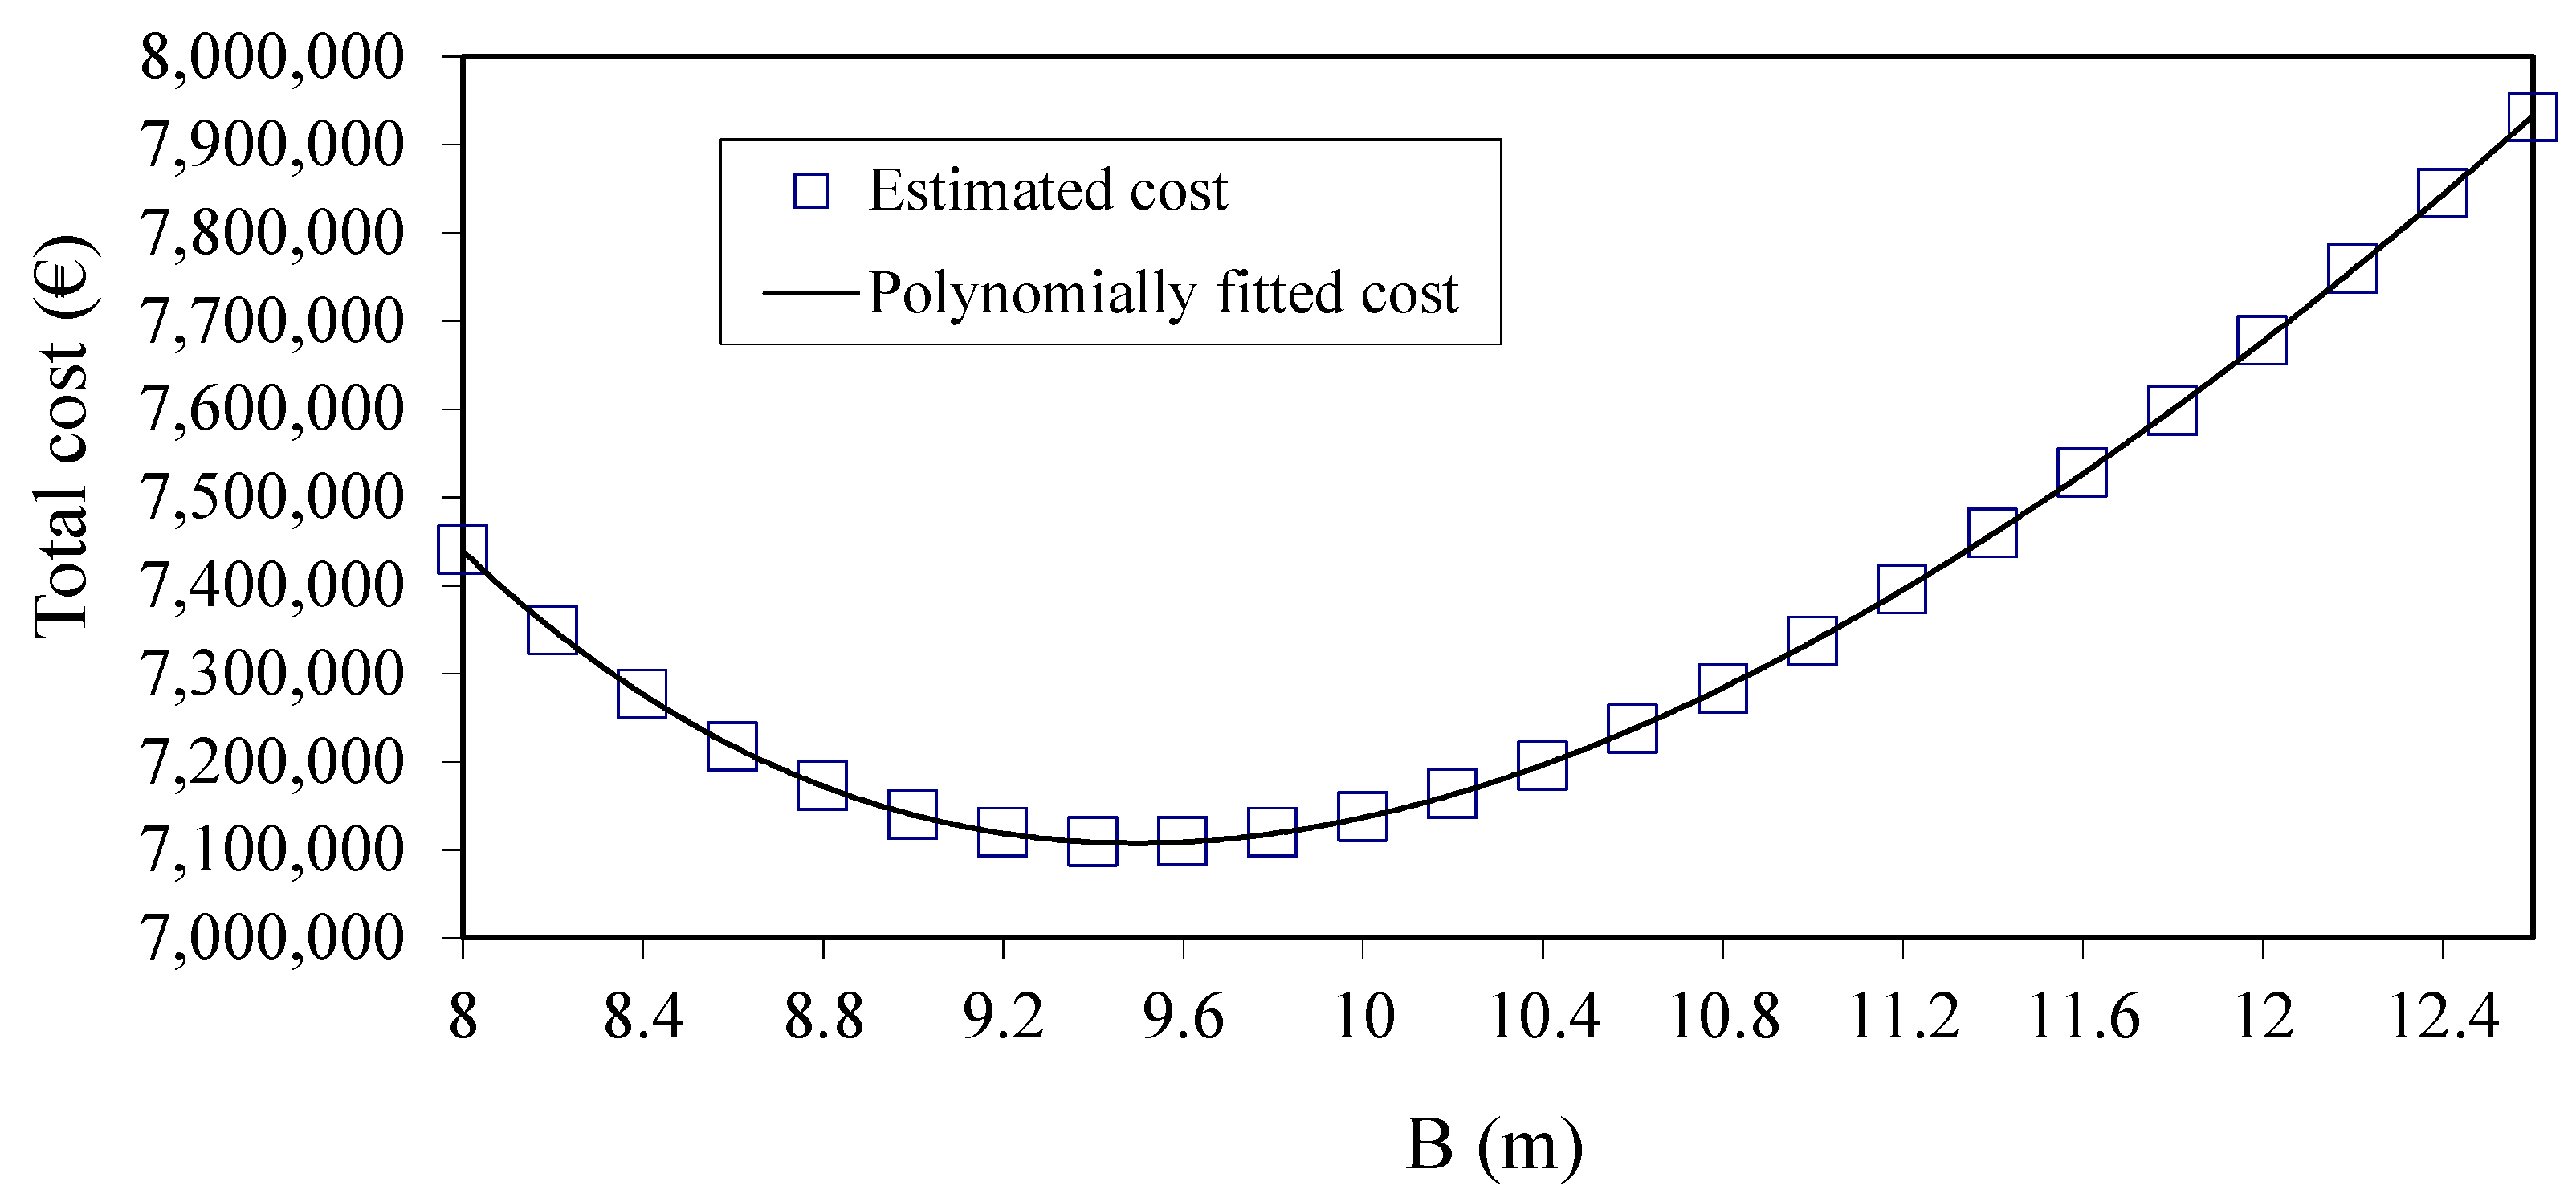
The upgrading procedure of mitigation option 3 (berm added to the structure) is presented in Figure 12. The berm width, Bberm, and the reference level of the berm width with respect to sea level, hberm, are estimated during the total cost optimization process. The mean nominal weight of the rocks used to construct the berm is 2.5 ton, similar to the one used for the rocks of the primary armor layer. Figure 13 presents the total costs, estimated using Equations (33) and (34), as a function of the berm width, Bberm; the lowest total cost has been observed for hberm = 1 m. However, Figure 14 presents the total costs, as a function of the Bberm for hberm = 0.8 m. The differences in optimized amounts of total costs are not significant between the two crest berm depths. More specifically, for hberm = 1 m, the optimized berm width is Bbermopt = 9.8 m, while the minimum total cost is estimated Itot ≈ 7.002 × 10⁶ €. For hberm = 0.8 m, the optimized berm width is Bbermopt = 9.4 m, while the minimum total cost is estimated Itot ≈ 7.11 × 10⁶ €. The upgrading costs (Icons) cover almost 76% and 78% of the total costs (Itot), respectively.
3.4. Results of Mitigation Option 4: Detached Low-Crested Structure
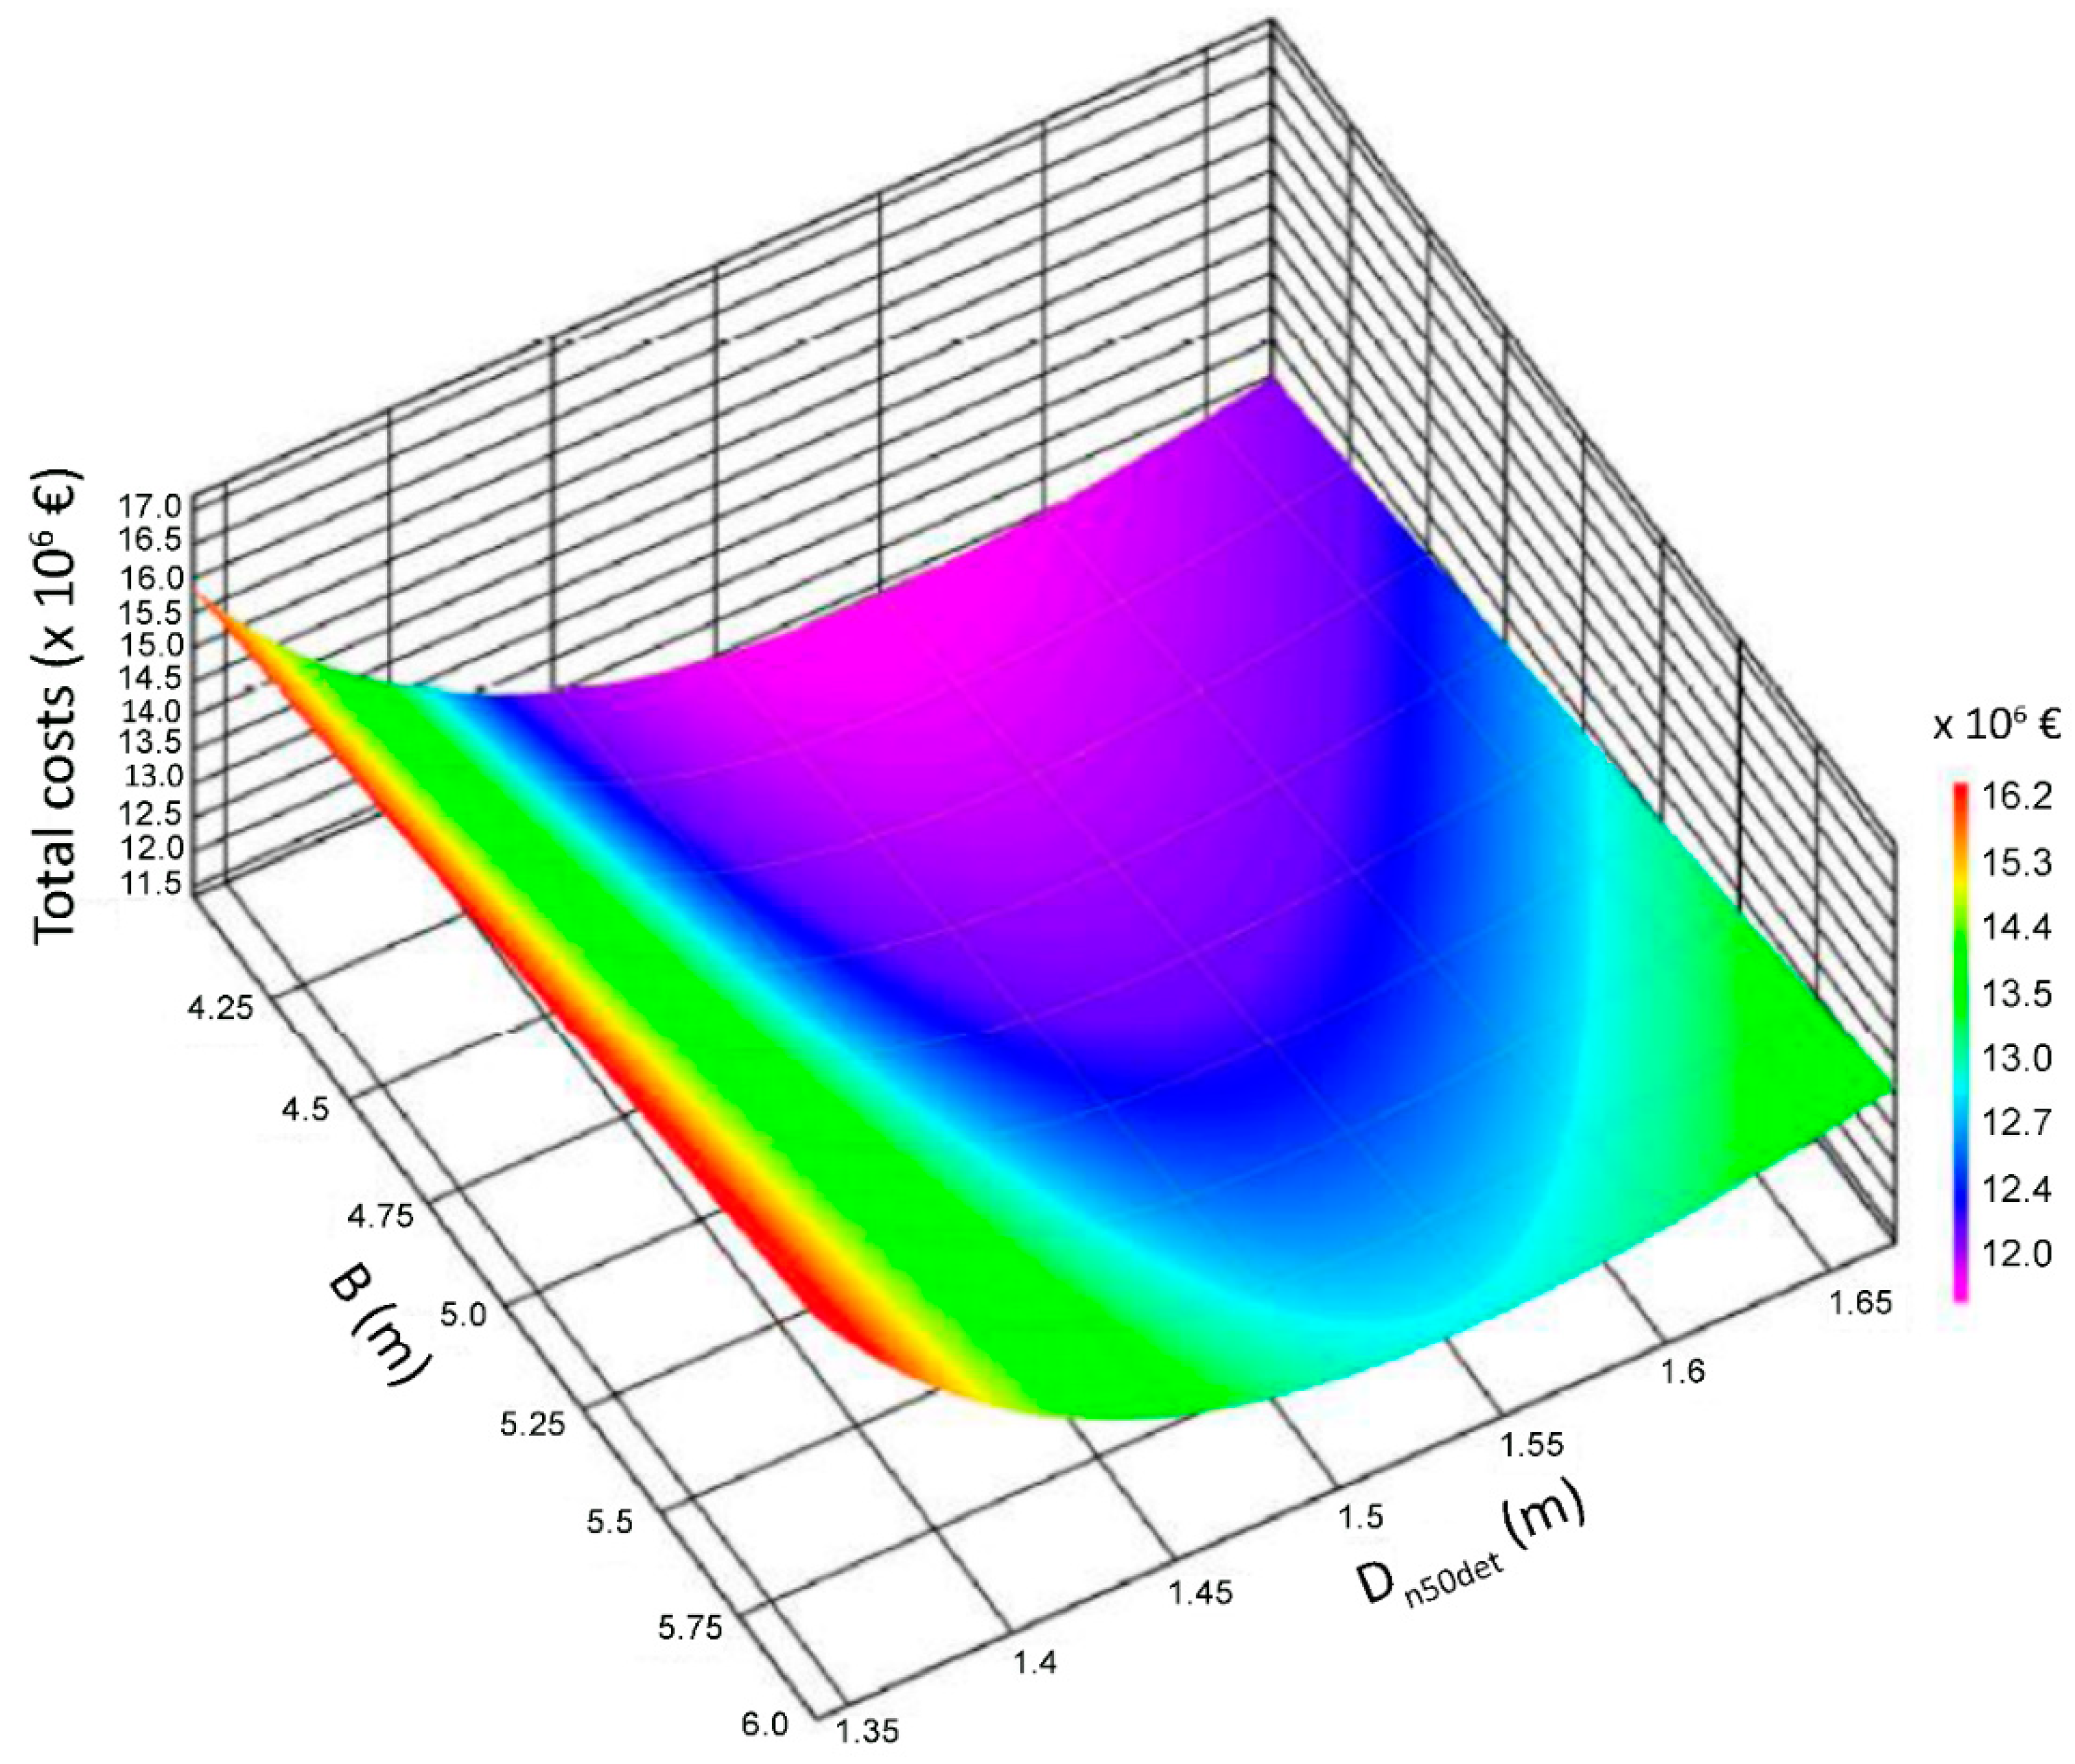
Mitigation option 4 includes the construction of a protective structure in the upwind front of the studied breakwater. The detached low-crested structure is designed to have both its slopes equal to 1/2. The crest width, B, the mean nominal diameter, Dn50det, and the freeboard level, Rcdet, of the low-crested structure are the variables of the total cost optimization process. The basic constructional constraints for mitigation option 4 impose a minimum height and crest width of the low-crested structure equal to at least three stones, namely ≥3 × Dn50det. For the armor layers of the low-crested breakwater, the armor units are considered to be imbricated rip-rap type stones with a general size requirement of Dn50det ≥ 0.9144 m, i.e., the armor units are custom order quarry rocks of Class I with Dn50det = 1.3–1.65 m corresponding to typical weights of W50 = 2.5–6 t. The defending detached structure is a submerged breakwater with Rcdet ranging from 0 to −2 m (by 0.25 m; only two representative cases are shown herein). Figure 15 presents the total costs, estimated using Equations (33) and (34), as a function of the crest width, B, and the mean nominal diameter, Dn50det for Rcdet = −0.5 m (the negative sign means 0.5 m below SWL). Figure 16 presents a similar plot for Rcdet = −1 m. The optimized low−crested structure geometry is Bopt = 4.6 m and Dn50opt = 1.53 m for Rcdet = −0.5 m, therefore the detached breakwater height is h = 4.6 m in waters with depth equal to d = 5.1 m for a total cost of Itot ≈ 11.816 × 10⁶ €. Similarly, for Rcdet = −1 m the optimized low-crested structure geometry is Bopt = 4.3 m and Dn50opt = 1.43 m, therefore, the detached breakwater height is h = 4.3 m in water depth of d = 5.3 m for a total cost Itot ≈ 10.433 × 10⁶ €. The upgrading costs (Icons) cover almost 88% and 87% of the total costs (Itot), respectively.
4. Summary and Conclusions
Port or harbor downtime risks are considered to be crucial for all countries characterized by high concentration of critical infrastructure and economic activities in coastal areas, and by high significance of seaport industry, maritime transport, communications due to tourism, and sea-related activities. The latter are determining factors of national economic performance, development, and regional growth. However, it should be considered that a lot of such structures and defenses are aging and have already exceeded their service lifetime. The abovementioned challenges coupled with the general inception of a changing climate are expected to increase exposure and vulnerability of coastal areas to future risks. Hence, functionality and safety of such structures have to be re-evaluated under climate change conditions and appropriate upgrading mitigation measures must be considered.
The approach presented in this work is based on reliability analysis of the studied structure coupled with economic optimization techniques. CDFs for the extremes of the stochastic variables of the marine climate, i.e., extreme significant wave height, are first extracted for the area under study and for present climate conditions and then transformed to represent the marine climate in front of the studied breakwater. CDFs for future sea states are then extracted taking account of climate change scenarios or assumptions. If the breakwater cannot withstand the newly defined marine conditions, different mitigation options for upgrading are suggested. The engineering mitigation options considered in the present work focus on: (1) increasing the breakwater crest level by adding a crown wall or existing crest elements being heightened and strengthened; (2) adding a new protective layer of armor units on the front slope of the studied rubble mound breakwater combined with new or elevated existing crest elements; (3) constructing of a berm structure in front of the seaside slope, and (4) constructing a low-crested structure in front of the existing breakwater. A fault tree is constructed giving a logical succession of all events that lead to port/harbor downtime for each alternative mitigation option including both ULS and SLS. For each upgrading concept a large number of possible alternative geometries are tested, according to their performance for the limit state functions. From the total sample of acceptable geometries for each upgrading concept that satisfy a probabilistic constraint, a single solution is selected minimizing the total costs of protection during the service lifetime of the upgraded structure.
The proposed work aims to propose a reliable and robust framework to upgrade port and harbor rubble mound breakwaters against climate change, combining the conceptual framework of risk with modern optimization techniques and statistical methods. The recommended reliability-based upgrading approach, allows one to determine the safety levels of the respective basins, considering the protection costs and savings of the protected areas. It also allows one to compare different mitigation measures for upgrading port and harbor breakwaters under climate change in terms of their effectiveness within the general framework of minimizing the total downtime risks of the respective basins. The recommended framework introduces risk-based approaches in the field of upgrading coastal structures to face climate change impacts. Such methods are expected to significantly contribute facing increasing marine hazards and minimizing exposure of coastal areas and defenses to more severe future climate conditions.
The presented methodology is applied to a rubble mound breakwater resembling to the existing one in the port of Deauville, France. Three main failure mechanisms are considered here as the main types of instability under extreme marine climate conditions, namely the instability of the primary armor layer, the excessive wave overtopping, and the scouring of the toe of the breakwater. Considering the SLS, the wave height transformation inside the port basin is considered as a combination of wave refraction-diffraction caused by penetration via the entrance of the port, wave transmission through, and overtopping of the breakwater. The construction of a berm in the upwind front of the studied breakwater (mitigation option 3), resulting in optimized values of the parameters of the berm width, Bbermopt = 9.8 m, and water depth at the reference level of the berm, hbermopt = 1 m, presented the lowest total costs during the service lifetime of the upgraded structure (Itot 7.002 × 10⁶ €) set equal to 100 years. The total costs of mitigation option 3 are lower by 41% and 34% than those estimated for the mitigation option 1 and 2, respectively. Therefore adding a berm on the windward armor slope of the studied breakwater is found to be the most advantageous mitigation option, compared to alternatives comprising increased breakwater crest levels and crown walls, supplement of extra armor layers, and construction of an upwind low-crested defense structure. But it should be emphasized that in the present work the amount of damage to the constructed berm has been ignored, thus our analysis applies to non-reshaping berms. The inclusion of the formulas for limit states of reshaping berm breakwaters (allowing a considerable amount of rearrangements and displacements of rocks to occur) could modify the extracted results under the same hydraulic conditions, as the failure probabilities for global stability of the rubble mound breakwater would decrease, adding to a further reduction of downtime costs for the studied marina.
List of Symbols (in order of appearance)
| Gθ | Generalized Extreme Value (GEV) distribution function |
| θ | Vector of GEV parameters |
| μ | Location parameter of the GEV |
| σ | Scale parameter of the GEV |
| ξ | Shape parameter of the GEV |
| x | Arbitrary variable of GEV distribution function (e.g., annual maxima of wave heights or storm surge) |
| CV | Coefficient of variation |
| Γ(∙) | Gamma Cumulative Distribution Function (CDF) |
| z100 | Design event value for any parameter (e.g., wave height) for a 100-year return period |
| p | Probability of 1 in T years [1/yrs] |
| T | Return period [yrs] |
| Fθ | Rayleigh CDF |
| Hsu | Significant wave height (design wave height at the toe of the structure) [m] |
| Δ | Dimensionless relative buoyant density of rock [= (ρr/ρw) − 1] |
| ρr | Rock density [ton/m3] |
| ρw | Water density [ton/m3] |
| Dn | Mean nominal diameter of armor elements of the rubble mound breakwater [m] |
| θ | Seaward slope angle of the breakwater [°] |
| KD | Dimensionless stability coefficient of the Hudson formula |
| Z | Reliability function for a limit state |
| Zij | Reliability function for mitigation option i and failure mechanism j |
| i | Index of the mitigation option (i = 1–4) |
| j | Index of the failure mechanism (j = 1–4) |
| RZ | Resistance of the structure |
| SZ | Loading of the structure |
| n | Total number of simulations |
| nf | Number of simulations for which the condition Z ≤ 0 is valid |
| Pf | Failure probability |
| Z11 | Reliability function for breakwater stability under mitigation option 1 |
| P | Permeability coefficient of breakwater structure |
| N | Number of waves |
| S | Damage level (ratio of area eroded in a given cross-section) |
| ξm | Surf similarity parameter (Irribaren number) |
| som | Average wave steepness |
| Lp | Wave length corresponding to Tp [m] |
| Tp | Peak spectral wave period [sec] |
| Q’ | Dimensionless wave overtopping rate |
| Rc2 | Height of the crown element with respect to crest level [m] |
| Gc | Crest width in front of the crest element [m] |
| NL | Nose length of crest element [m] |
| qm | Overtopping discharge per linear meter [m2/s] |
| Rc | Crest freeboard height [m] |
| γf | Influence factor for roughness |
| z12 | Reliability function for wave overtopping of the breakwater under mitigation option 1 |
| qallow | Maximum allowable overtopping discharge per linear meter [m2/s] |
| hb | Water depth at the breakwater toe as sum of MSL, tide and storm surge [m] |
| Nodtoe | Number of displaced units within a strip of width Dn at the breakwater toe |
| Z13 | Reliability function for breakwater toe stability under mitigation option 1 |
| Z21 | Reliability function for breakwater’s primary armor layer stability under mitigation option 2 |
| Cr | Reduction factor due to the effect of armored crest berm |
| Gc | Crest berm width [m] |
| Z22 | Reliability function for excessive wave overtopping of the breakwater under mitigation option 2 |
| Z23 | Reliability function for breakwater toe stability under mitigation option 2 |
| Z31 | Reliability function for breakwater’s primary armor layer stability under mitigation option 3 |
| Kt | Wave transmission coefficient (for low-crested structures) |
| B | Berm width [m] |
| ξ | Surf similarity parameter or Irribaren number (=tanθ/s0.5) |
| s | Irregular wave steepness (=Hsu/Lp) |
| Z32 | Reliability function for excessive wave overtopping of the breakwater under mitigation option 3 |
| γb | Berm coefficient |
| Bberm | Berm width [m] |
| Lberm | Length consisting of Bberm and two horizontal distances corresponding to projection of Hsu above and below the berm reference level [m] |
| hberm | Reference level of the berm width with respect to sea water level [m] |
| xberm | Horizontal distance equal to 2Hsu if berm is below still water level (SWL) and Ru2% if berm is above SWL [m] |
| Ru2% | Run-up height (of 2% probability) above SWL [m] |
| Z33 | Reliability function for breakwater toe stability under mitigation option 3 |
| Z41 | Reliability function for breakwater’s primary armor layer stability under mitigation option 4 |
| Z42 | Reliability function for excessive wave overtopping of the breakwater under mitigation option 4 |
| Z43 | Reliability function for breakwater toe stability under mitigation option 4 |
| Rcdet | Freeboard height of the low-crested structure [m] |
| Dn50det | Mean nominal diameter of the rock armor of the low-crested structure [m] |
| Z44 | Reliability function for selection of Dn50 of low-crested structures under mitigation option 4 |
| ZSLS | Reliability function for the representation of SLS |
| Hallow | Maximum allowable wave height inside the protected basin [m] |
| Hss | Incident significant wave height corresponding to SLS of the studied breakwater [m] |
| Ktrans | Wave transmission coefficient for sub-aerial breakwaters |
| Kdif | Wave diffraction coefficient for sub-aerial breakwaters |
| smax | Maximum directional concentration parameter due to wave refraction in shallow water |
| smax,o | Maximum directional concentration parameter in deep water |
| θ | Wave diffraction angle [rad] |
| WD | Diffraction parameter |
| D | Set of acceptable geometries |
| z | Vector of design variables in each upgrading mitigation option |
| Pf | Failure probability of the rubble mound breakwater |
| Pf,max | Maximum acceptable failure probability of the rubble mound breakwater |
| L | Structure length [m] |
| A | Area of the cross section of the breakwater layers [m2] |
| I | Respective costs by volume [€] |
| Icons | Upgrading costs [€] |
| Ifailure | Costs of failure [€] |
| CULS | Damage costs under ULS [€] |
| CSLS | Damage costs under SLS [€] |
| Pf,ULS | Probabilities of failure in case of ULS |
| Pf,SLS | Probabilities of failure in case of SLS |
| r | Interest rate [%] |
| M | Reference period for ULS and SLS failure [yrs] |
| W50 | Weight of armor rock corresponding to Dn50det [ton] |
| N(∙) | Normal distribution function |
| HAT | Highest astronomical tide [m] |
| Itot | Minimum total cost [€] |
| Wopt | Optimized weight of armor rock [ton] |
| Bbermopt | Optimized berm width [m] |
| Dn50opt | Optimized mean nominal diameter of the rock armor of the low-crested structure [m] |
| Bopt | Optimized crest width of the detached low-crested structure [m] |
Author Contributions
P.G. formulated the basic concept of the paper; P.G. and C.M. performed the formal analysis; P.P. conducted the funding acquisition; P.G., C.M. and P.P. contributed on the investigations; P.G. and C.M. implemented the methodology; P.P. was the project administrator; P.G. was in charge of the software; P.P. supervised the research; C.M. validated the presented data; P.G. formulated the visualizations; P.G. wrote the original draft; C.M. and P.P. co-wrote parts of the manuscript, reviewed and edited the paper.
Funding
This research was funded by the European Commission through FP7.2009-1 grant number “Contract 244104-THESEUS Innovative technologies for safer European coasts in a changing climate”. Part of the work was funded by NSRF 2007–2013 “CCSEAWAVS project (2012–2015) Estimating the Effects of Climate Change on Sea Level and Wave Climate of the Greek seas, Coastal Vulnerability and Safety of Coastal and Marine Structures”.
Acknowledgments
The authors want to thank Philippe Sergent, Scientific Director of CETMEF for providing the datasets used in the paper.
Conflicts of Interest
The authors declare no conflicts of interest.
References
- IPCC. Climate change 2007: The Scientific Basis, Contribution of Working Group I to the Fourth Assessment Report of the Intergovernmental Panel on Climate change; Cambridge University Press: New York, NY, USA, 2007. [Google Scholar]
- IPCC. Managing the Risks of Extreme Events and Disasters to Advance Climate change Adaptation, A Special Report of Working Groups I and II of the Intergovernmental Panel on Climate change; Cambridge University Press: Cambridge, UK; New York, NY, USA, 2012. [Google Scholar]
- WASA-Group. Changing waves and storms in the Northeast Atlantic? Bull. Am. Meteorol. Soc. 1998, 79, 741–760. [Google Scholar] [CrossRef]
- Alexandersson, H.; Tuomenvirta, H.; Schmith, T.; Iden, K. Trends of storms in NW Europe derived from an updated pressure data set. Clim. Res. 2000, 14, 71–73. [Google Scholar] [CrossRef] [Green Version]
- Woth, K.; Weisse, R.; Storch, H. Climate change and North Sea storm surge extremes: An ensemble study of storm surge extremes expected in a changed climate projected by four different regional climate models. Ocean Dyn. 2006, 56, 3–15. [Google Scholar] [CrossRef]
- Weisse, R.; von Storch, H.; Niemeyer, H.D.; Knaack, H. Changing North Sea storm surge climate: An increasing hazard? Ocean Coast. Manag. 2012, 68, 58–68. [Google Scholar] [CrossRef]
- De Winter, R.C.; Sterl, A.; de Vries, J.W.; Weber, S.L.; Ruessink, G. The effect of climate change on extreme waves in front of the Dutch coast. Ocean Dyn. 2012, 62, 1139–1152. [Google Scholar] [CrossRef] [Green Version]
- Wolf, J.; Woolf, D.K. Waves and climate change in the north-east Atlantic. Geophys. Res. Lett. 2006, 33. [Google Scholar] [CrossRef] [Green Version]
- Wang, X.; Swail, V. Climate change signal and uncertainty in projections of ocean wave heights. Clim. Dyn. 2006, 26, 109–126. [Google Scholar] [CrossRef]
- Debernard, J.; Roed, L. Future wind, wave and storm surge climate in the Northern Seas: A revisit. Tellus 2008, 60, 427–438. [Google Scholar] [CrossRef]
- Cid, A.; Castanedo, S.; Abascal, A.J.; Menéndez, M.; Medina, R. A high resolution hindcast of the meteorological sea level component for Southern Europe: The GOS dataset. Clim. Dyn. 2014, 43, 2167–2184. [Google Scholar] [CrossRef]
- Vousdoukas, M.I.; Voukouvalas, E.; Annunziato, A.; Giardino, A.; Feyen, L. Projections of extreme storm surge levels along Europe. Clim. Dyn. 2016, 47, 3171–3190. [Google Scholar] [CrossRef] [Green Version]
- Vousdoukas, M.I.; Mentaschi, L.; Voukouvalas, E.; Verlaan, M.; Feyen, L. Extreme sea levels on the rise along Europe’s coasts. Earths Future 2017, 5, 304–323. [Google Scholar] [CrossRef]
- Galiatsatou, P.; Makris, C.; Prinos, P.; Kokkinos, D. Nonstationary joint probability analysis of extreme marine variables to assess design water levels at the shoreline in a changing climate. Nat. Hazards 2018. submitted. [Google Scholar]
- FLOODsite. Language of Risk—Project Definitions; Report T32-04-01; HR Wallingford Ltd: Wallingford, Oxfordshire, UK, 2009. [Google Scholar]
- Townend, I.; Burgess, K. Methodology for Assessing the Impact of Climate Change upon Coastal Defence Structures. In Proceedings of the 29th ICCE, Lisbon, Portugal, 19–24 September 2004; pp. 3953–3965. [Google Scholar]
- Okayasu, A.; Sakai, K. Effect of Sea Level Rise on Sliding Distance of a Caisson Breakwater: Optimisation with Probabilistic Design Method. In Proceedings of the 30th ICCE, San Diego, CA, USA, 3–8 September 2006; World Scientific: Singapore, 2006; pp. 4883–4893. [Google Scholar]
- Olabarrieta, M.; Medina, R.; Losada, I.J.; Mendez, F.J. Potential Impact of Climate Change on Coastal Structures: Application to the Spanish Littoral. In Proceedings of the Coastal Structures Conference, Venice, Italy, 2–4 July 2007; pp. 1728–1739. [Google Scholar]
- Suh, K.D.; Kim, S.W.; Mori, N.; Mase, H. Effect of climate change on performance-based design of caisson breakwaters. J. Waterw. Port Coast. Ocean Eng. 2011, 138, 215–225. [Google Scholar] [CrossRef]
- Becker, A.; Inoue, S.; Fischer, M.; Schwegler, B. Climate change impacts on international seaports: Knowledge, perceptions, and planning efforts among port administrators. Clim. Chang. 2012, 110, 5–29. [Google Scholar] [CrossRef]
- Suh, K.D.; Kim, S.W.; Kim, S.; Cheon, S. Effects of climate change on stability of caisson breakwaters in different water depths. Ocean Eng. 2013, 71, 103–112. [Google Scholar] [CrossRef]
- Sánchez-Arcilla, A.; García-León, M.; Gracia, V.; Devoy, R.; Stanica, A.; Gault, J. Managing coastal environments under climate change: Pathways to adaptation. Sci. Total Environ. 2016, 572, 1336–1352. [Google Scholar] [CrossRef] [PubMed] [Green Version]
- Chini, N.; Stansby, P.K. Extreme values of coastal wave overtopping accounting for climate change and sea level rise. Coast. Eng. 2012, 65, 27–37. [Google Scholar] [CrossRef]
- Mase, H.; Tsujio, D.; Yasuda, T.; Mori, N. Stability analysis of composite breakwater with wave-dissipating blocks considering increase in sea levels, surges and waves due to climate change. Ocean Eng. 2013, 71, 58–65. [Google Scholar] [CrossRef] [Green Version]
- Hoshino, S.; Esteban, M.; Mikami, T.; Takabatake, T.; Shibayama, T. Climate Change and Coastal Defences in Tokyo Bay. In Proceedings of the 33rd ICCE, Santander, Spain, 1–6 July 2012; Volume 1, p. 19. [Google Scholar]
- Sekimoto, T.; Isobe, M.; Anno, K.; Nakajima, S. A new criterion and probabilistic approach to the performance assessment of coastal facilities in relation to their adaptation to global climate change. Ocean Eng. 2013, 71, 113–121. [Google Scholar] [CrossRef]
- Isobe, M. Impact of global warming on coastal structures in shallow water. Ocean Eng. 2013, 71, 51–57. [Google Scholar] [CrossRef]
- Lee, C.E.; Kim, S.W.; Park, D.H.; Suh, K.D. Risk assessment of wave run-up height and armor stability of inclined coastal structures subject to long-term sea level rise. Ocean Eng. 2013, 71, 130–136. [Google Scholar] [CrossRef]
- THESEUS. Innovative Technologies for Safer European Coasts in a Changing Climate. Contract Number: 244104, 2009–2013. Available online: http://www.theseusproject.eu/ (accessed on 20 July 2018).
- Burcharth, H.F.; Andersen, T.L.; Lara, J.L. Upgrade of coastal defence structures against increased loadings caused by climate change: A first methodological approach. Coast. Eng. 2014, 87, 112–121. [Google Scholar] [CrossRef]
- CCSEAWAVS (2012–2015). Estimating the Effects of Climate Change on Sea Level and Wave Climate of the Greek Seas, Coastal Vulnerability and Safety of Coastal and Marine Structures. Available online: http://www.thalis-ccseawavs.web.auth.gr/en (accessed on 20 June 2018).
- Karambas, T.; Koftis, T.; Tsiaras, A.; Spyrou, D. Modelling of Climate Change Impacts on Coastal Structures-Contribution to their Re-Design. In Proceedings of the CEST 2015, Rhodes, Greece, 3–5 September 2015. [Google Scholar]
- Koftis, T.; Prinos, P.; Galiatsatou, P.; Karambas, T. An Integrated Methodological Approach for the Upgrading of Coastal Structures due to Climate Change Effects. In Proceedings of the 36th IAHR World Congress, The Hague, The Netherlands, 28 June–3 July 2015. [Google Scholar]
- Schanze, J. A conceptual framework for flood risk management research. In Flood Risk Management Research from Extreme Events to Citizens Involvement, Proceedings of the EFRM Dresden, Germany 6–7 February 2007; Leibniz Institute of Ecological and Regional Development (IOER): Dresden, Germany, 2007; pp. 1–10. [Google Scholar]
- Voortman, H.G. Risk-Based Design of Large Scale Flood Defence System. Ph.D. Thesis, Delft University of Technology, Delft, The Netherlands, 2003. [Google Scholar]
- Vrijling, J.K. Probabilistic design of flood defence systems in the Netherlands. Reliab. Eng. Syst. Saf. 2001, 74, 337–344. [Google Scholar] [CrossRef]
- Mai, C.V.; van Gelder, P.H.A.J.M.; Vrijling, J.K. Safety of coastal defences and flood risk analysis. Saf. Reliab. Manag. Risk 2006, 2, 1355–1366. [Google Scholar]
- Mai, C.V.; van Gelder, P.H.A.J.M.; Vrijling, H.; Stive, M. Reliability- and risk-based design of coastal flood defences. Coast. Eng. 2008, 10, 4276–4288. [Google Scholar]
- Jonkman, S.N.; Kok, M.; Van Ledden, M.K.; Vrijling, J.K. Risk-based design of flood defence systems: A preliminary analysis of the optimal protection level for the New Orleans metropolitan area. J. Flood Risk Manag. 2009, 12, 170–181. [Google Scholar] [CrossRef]
- FLOODsite. Integrated Flood Risk Analysis and Management Methodologies. Contract Number: GOCE-CT-2004-505420, 2004–2009. Available online: www.floodsite.net (accessed on 20 July 2018).
- Buijs, F.A.; van Gelder, P.H.A.J.M.; Vrijling, J.K.; Vrouwenvelder, A.C.W.M.; Hall, J.W.; Sayers, P.B.; Wehrung, M.J. Application of Dutch Reliability-Based Flood Defence Design in the UK. In Proceedings of the ESREL Conference, Maastricht, The Netherlands, 15–18 June 2003; Volume 1, pp. 311–319. [Google Scholar]
- Burcharth, H.F.; Sørensen, J.D. On Optimum Safety Levels of Breakwaters. In Proceedings of the 31st PIANC Congress, Estoril, Portugal, 14–18 May 2006; pp. 634–648. [Google Scholar]
- Stedinger, J.R. Expected probability and annual damage estimators. J. Water. Resour. Plan. Manag. 1997, 132, 125–135. [Google Scholar] [CrossRef]
- Steenbergen, H.M.G.M.; Lassing, B.L.; Vrouwenvelder, A.C.W.M.; Waarts, P.H. Reliability analysis of flood defence systems. Heron 2004, 49, 51–73. [Google Scholar]
- Castillo, C.; Mínguez, R.; Castillo, E.; Losada, M.A. An optimal engineering design method with failure rate constraints and sensitivity analysis. Application to composite breakwaters. Coast. Eng. 2006, 53, 1–25. [Google Scholar] [CrossRef]
- Dai Viet, N.; Verhagen, H.J.; van Gelder, P.H.A.J.M.; Vrijling, J.K. Conceptual Design for the Breakwater System of the South of Doson Naval Base: Optimization versus Deterministic Design. In Proceedings of the PIANC-COPEDEC VII: 7th International Conference on Coastal and Port Engineering in Developing Countries. “Best Practises in the Coastal Environment”, Dubai, United Arab Emirates, Paper No. 053. 24–28 February 2008. [Google Scholar]
- Prasad Kumar, B. Reliability based design method for coastal structures in shallow seas. Indian J. Geo-Mar. Sci. 2010, 39, 605–615. [Google Scholar]
- Galiatsatou, P.; Prinos, P. Reliability-based design optimization of a rubble mound breakwater in a changing climate. In Comprehensive Flood Risk Management: Research for Policy and Practice; Klijn, F., Schweckendiek, T., Eds.; CRC Press: London, UK; Balkema: London, UK, 2013; ISBN 978-0-41-562144-1. [Google Scholar]
- Naty, S.; Viviano, A.; Foti, E. Feasibility Study of a WEC Integrated in the Port of Giardini Naxos, Italy. In Proceedings of the 35th International Conference on Coastal Engineering, Antalya, Turkey, 17–20 November 2016. [Google Scholar]
- Van Gelder, P.; Buijs, F.; Horst, W.; Kanning, W.; Mai Van, C.; Rajabalinejad, M.; de Boer, E.; Gupta, S.; Shams, R.; van Erp, N.; et al. Reliability analysis of flood defence structures and systems in Europe. In Flood Risk Management: Research and Practice; Samuels, P., Huntington, S., Allsop, W., Harrop, J., Eds.; Taylor & Francis Group: London, UK, 2009; ISBN 978-0-415-48507-4. [Google Scholar]
- Buijs, F.A.; Hall, J.W.; Sayers, P.B.; van Gelder, P.H.A.J.M. Time-dependent reliability analysis of flood defences. Reliab. Eng. Syst. Saf. 2009, 94, 1942–1953. [Google Scholar] [CrossRef]
- Kim, T.M.; Suh, K.D. Reliability analysis of breakwater armor blocks: Case study in Korea. Coast. Eng. J. 2010, 52, 331–350. [Google Scholar] [CrossRef]
- Naulin, M.; Kortenhaus, A.; Oumeraci, H. Reliability Analysis and Breach Modelling of Coastal and Estuarine Flood Defences. In Proceedings of the ISGSR 2011, Munich, Germany, 2–3 June 2011; Vogt, N., Schuppener, B., Straub, D., Bräu, G., Eds.; Bundesanstalt für Wasserbau: Karlsruhe, Germany, 2011; ISBN 978-3-93-923001-4. [Google Scholar]
- Naulin, M.; Kortenhaus, A.; Oumeraci, H. Reliability-based flood defense analysis in an integrated risk assessment. Coast Eng. J. 2015, 57, 1540005. [Google Scholar] [CrossRef]
- Nepal, J.; Chen, H.P.; Simm, J.; Gouldby, B. Time-dependent reliability analysis of Flood defence assets using generic fragility curve. In E3S Web of Conferences (7); EDP Sciences: Les Ulis, France, 2016. [Google Scholar]
- Van der Meer, J.W. Deterministic and probabilistic design of breakwater armor layers. J. Waterw. Port Coast. Ocean Eng. 1988, 114, 66–80. [Google Scholar] [CrossRef]
- Van Gent, M.R.; Pozueta, B. Rear-side stability of rubble mound structures. In Proceedings of the 29th ICCE, Lisbon, Portugal, 19–24 September 2004; pp. 3481–3493. [Google Scholar]
- Van der Meer, J.W.; D’Angremond, K.; Gerding, E. Toe structure stability of rubble mound breakwaters. In Proceedings of the Advances in Coastal Structures and Breakwaters Conference, London, UK, 27–29 April 1995; Institution of Civil Engineers, Thomas Telford Publishing: London, UK, 1995; pp. 308–321. [Google Scholar]
- EurOtop. Manual on Wave Overtopping of Sea Defences and Related Structures. An Overtopping Manual Largely Based on European Research, but for Worldwide Application. Van der Meer, J.W., Allsop, N.W.H., Bruce, T., de Rouck, J., Kortenhaus, A., Pullen, T., Zanuttigh, B., Eds.; 2016. Available online: www.overtopping-manual.com (accessed on 25 May 2018).
- Schiereck, G.J. Introduction to Bed, Bank and Shore Protection; CRC Press: Boca Raton, FL, USA, 2003. [Google Scholar]
- Nørgaard, J.Q.H.; Andersen, L.V.; Andersen, T.L.; Burcharth, H.F. Displacement of Monolithic Rubble-Mound Breakwater Crown-Walls. In Proceedings of the 33rd ICCE, Santander, Spain, 1–6 July 2012; Volume 1. [Google Scholar]
- De Rouck, J.; Van Doorslaer, K.; Goemaere, J.; Verhaeghe, H. Geotechnical design of breakwaters in Ostend on very soft soil. In Proceedings of the 32nd International Conference on Coastal Engineering (ICCE), Shangai, China, 30 June–5 July 2010; Volume 1, p. 67. [Google Scholar]
- Coles, S.; Heffernan, J.; Tawn, J. Dependence measures of extreme value analysis. Extremes 1999, 2, 339–365. [Google Scholar] [CrossRef]
- Suh, K.D.; Kwon, H.D.; Lee, D.Y. Some statistical characteristics of large deepwater waves around the Korean Peninsula. Coast. Eng. 2010, 57, 375–384. [Google Scholar] [CrossRef]
- Thornton, E.B.; Guza, R.T. Transformation of wave height distribution. J. Geophys. Res. Oceans 1983, 88, 5925–5938. [Google Scholar] [CrossRef]
- CIRIA, CUR, CETMEF. The Rock Manual. The Use of Rock in Hydraulic Engineering, 2nd ed.; CIRIA: London, UK, 2007; Volume 683. [Google Scholar]
- Tuan, T.Q.; Vu, M.C.; Le, H.T. Experimental Study on Wave Overtopping at Seadikes with Vertical Crown-Wall. In Proceedings of the 5th International Conference on Asian and Pacific Coasts, Singapore, 22–25 September 2009; World Scientific: Singapore, 2009; pp. 79–85. [Google Scholar]
- Gómez Pina, G.; Valdés, J.M. Experiments on Coastal Protection Submerged Breakwaters: A Way to Look at the Results. In Proceedings of the 22th International Conference on Coastal Engineering, Delft, The Netherlands, 2–6 July 1990; pp. 1592–1605. [Google Scholar]
- U.S. Army Corps of Engineers (USACE). Coastal Engineering Manual; Chapter VI-5—Fundamentals of Design; Burcharth, H.F., Hughes, S.A., Eds.; U.S. Army Corps of Engineers: Washington, DC, USA, 2006.
- Van der Meer, J.W. Stability of Breakwater Armour Layers-Design Formulae. Coast. Eng. 1987, 11, 219–239. [Google Scholar] [CrossRef]
- Coeveld, E.M.; Busnelli, M.M.; van Gent, M.R.A.; Wolters, G. Wave Overtopping of Rubble Mound Breakwaters with Crest Elements. In Proceedings of the 30th International Conference on Coastal Engineering, San Diego, CA, USA, 3–8 September 2006; Volume 5, pp. 4592–4604. [Google Scholar]
- EurOtop. Wave Overtopping of Sea Defences and Related Structures: Assessment Manual; Pullen, T., Allsop, N.W.H., Bruce, T., Kortenhaus, A., Schüttrumpf, H., van der Meer, J.W., Eds.; Environment Agency (EA): Bristol, UK; Expertise Netwerk Waterkeren (ENW): Utrecht, The Netherlands; Kuratorium für Forschung im Küsteningenieurwesen (KFKI): Hamburg, Germany, 2007. [Google Scholar]
- D’Angremond, K.; van der Meer, J.W.; de Jong, R.J. Wave Transmission at Low-Crested Structures. In Proceedings of the 25th International Conference on Coastal Engineering, Orlando, FL, USA, 2–6 September 1996; pp. 2418–2426. [Google Scholar]
- Van der Meer, J.W.; Briganti, R.; Zanuttigh, B.; Wang, B. Wave transmission and reflection at low-crested structures: Design formulae, oblique wave attack and spectral change. Coast. Eng. 2005, 52, 915–929. [Google Scholar] [CrossRef]
- Briganti, R.; van der Meer, J.W.; Buccino, M.; Calabrese, M. Wave Transmission behind Low-Crested Structures. In Proceedings of the Coast Structures Conference, Portland, OR, USA, 26–30 August 2003; ASCE: Reston, VA, USA, 2003; pp. 580–592. [Google Scholar]
- Makris, C.V.; Memos, C.D. Wave Transmission over Submerged Breakwaters: Performance of Formulae and Models. In Proceedings of the 17th International Offshore and Polar Engineering Conference (ISOPE), Lisbon, Portugal, 1–6 July 2007; pp. 2613–2620. [Google Scholar]
- Vicinanza, D.; Cáceres, I.; Buccino, M.; Gironella, X.; Calabrese, M. Wave disturbance behind low crested structures: Diffraction and overtopping effects. Coast. Eng. 2009, 56, 1173–1185. [Google Scholar] [CrossRef]
- Delos. D 59 Design Guidelines: Environment Design Guidelines of Low Crested Coastal Defence Structures; Burcharth, H., Lamberti, A., Eds.; Pitagora Editrice Bologna: Bologna, Italy, 2004. [Google Scholar]
- Kraus, N.C. Estimate of breaking wave height behind structures. J. Waterw. Port Coast. Ocean Eng. 1984, 110, 276–282. [Google Scholar] [CrossRef]
- Goda, Y. Random Seas and Design of Maritime Structures, 1st ed.; University of Tokyo Press: Tokyo, Japan, 1985. [Google Scholar]
- Karambas, T.V.; Memos, C.D. Boussinesq model for weakly nonlinear fully dispersive water waves. J. Waterw. Port Coast. Ocean Eng. 2009, 135, 187–199. [Google Scholar] [CrossRef]
- Memos, C.D.; Karambas, T.V.; Avgeris, I. Irregular wave transformation in the nearshore zone: Experimental investigations and comparison with a higher order Boussinesq model. Ocean Eng. 2005, 32, 1465–1485. [Google Scholar] [CrossRef]
- Viviano, A.; Musumeci, R.E.; Foti, E. A nonlinear rotational, quasi-2DH, numerical model for spilling wave propagation. Appl. Math. Model. 2015, 39, 1099–1118. [Google Scholar] [CrossRef]
- Prevot, G.; Kergadallan, X.; Sergent, P. Overtopping Evolution due to the Climate Change and Consequences on the Structures with an Analytical Method and a Statistical Method. In Proceedings of the AIPCN-France Third Mediterranean Days of Coastal and Port Engineering, Marseilles, France, 22–24 May 2013. [Google Scholar]
- Sergent, P.; Prevot, G.; Mattarolo, G.; Brossard, J.; Morel, G.; Mar, F.; Benoît, M.; Ropert, F.; Kergadallan, X.; Trichet, J.-J.; et al. Adaptation of coastal structures to mean sea level rise. La Houille Blanche 2014, 6, 54–61. [Google Scholar] [CrossRef]
- Hawkes, P.J.; Gouldby, B.P.; Tawn, J.A.; Owen, M.W. The joint probability of waves and water levels in coastal engineering design. J. Hydraul. Res. 2002, 40, 241–251. [Google Scholar] [CrossRef]
- Benoît, M.; Lafon, F.; Goasguen, G. Constitution et exploitation d’une base de données d’états de mer le long des côtes françaises par simulation numérique sur 23 ans. Base ANEMOC en Atlantique-Manche-Mer du Nord. Eur. J. Environ. Civ. Eng. 2012, 12, 35–50. [Google Scholar] [CrossRef]
- Morellato, D.; Benoît, M. Vagues et Changement Climatique-Simulation des états de mer dans l’Océan Atlantique de 1960 à 2100 pour trois Scénarios de Changement Climatique. In Proceedings of the Les 8èmes Journées Scientifiques et Techniques, Brest, France, 8–9 December 2010. [Google Scholar] [CrossRef]
- ONERC. Synthèse n°2, Prise en Compte de L'élévation du Niveau de la mer en vue de L'estimation des Impacts du Changement Climatique et des Mesures D'adaptation Possibles; Direction Générale Energie et Climat Grande Arche: Paroi nord 92 055 La Défense Cedex, France, 2010; 6p.
- Hosking, J.R.M. L-moments: Analysis and estimation of distribution using linear combination of order statistics. J. R. Stat. Soc. B 1990, 52, 105–124. [Google Scholar]
- LiCCo. Two Countries, One Sea—A Cross Channel Perspective on Climate Change and the Coast. Report of the LiCCo Project, Interreg IVA France (Channel)—England Programme. 2014. Available online: http://www.licco.eu (accessed on 20 July 2018).
Figure 1.
Schematic representation of reliability-based upgrading of a rubble mound structure.

Figure 2.
Sketch portrayal of four basic upgrading conceptual options of a rubble mound breakwater used for mitigation against climate change: (a) crown wall or heightening of existing crest element; (b) additional protective armor layer; (c) additional berm on the seaside breakwater slope; (d) low-crested structure in front of existing breakwater.

Figure 3.
Fault tree for the port downtime “top event”.

Figure 4.
Fault tree for the ULS of a rubble mound breakwater with a detached structure.

Figure 5.
Typical cross-section of the studied rubble mound breakwater in the port of Deauville, Le Havre, northern France.
Figure 5.
Typical cross-section of the studied rubble mound breakwater in the port of Deauville, Le Havre, northern France.

Figure 6.
Cross-section of the studied rubble mound breakwater in Deauville, France, for mitigation option 1.
Figure 6.
Cross-section of the studied rubble mound breakwater in Deauville, France, for mitigation option 1.

Figure 7.
Total costs (€) as function of additional height of the crest element, W (m) for KD = 4.

Figure 8.
Total costs (€) as function of additional height of the crest element, W (m) for KD = 4.9.
Figure 8.
Total costs (€) as function of additional height of the crest element, W (m) for KD = 4.9.

Figure 9.
Cross-section of the studied rubble mound breakwater in Deauville France, for mitigation option 2.
Figure 9.
Cross-section of the studied rubble mound breakwater in Deauville France, for mitigation option 2.

Figure 10.
Total costs (€) as a function of the additional height of the crest element, W (m), when a third layer is added above the primary armor layer (KD = 4).
Figure 10.
Total costs (€) as a function of the additional height of the crest element, W (m), when a third layer is added above the primary armor layer (KD = 4).

Figure 11.
Total costs (€) as a function of the additional height of the crest element, W (m), when a third layer is added above the primary armor layer (KD = 4.9).
Figure 11.
Total costs (€) as a function of the additional height of the crest element, W (m), when a third layer is added above the primary armor layer (KD = 4.9).

Figure 12.
Cross-section of the studied rubble mound breakwater in Deauville, France for mitigation option 3.
Figure 12.
Cross-section of the studied rubble mound breakwater in Deauville, France for mitigation option 3.

Figure 13.
Total costs (€) as a function of the berm width, B (m), for hberm = 1 m.

Figure 14.
Total costs (€) as a function of the berm width, B (m), for hberm = 0.8 m.

Figure 15.
Total costs (€) as a function of the crest width, B (m), and the mean nominal diameter of rocks, Dn50det (m), for the detached low-crested structure of Rcdet = −0.5 m.
Figure 15.
Total costs (€) as a function of the crest width, B (m), and the mean nominal diameter of rocks, Dn50det (m), for the detached low-crested structure of Rcdet = −0.5 m.

Figure 16.
Total costs (€) as a function of the crest width, B (m), and the mean nominal diameter of rocks, Dn50det (m), for the detached low-crested structure of Rcdet = −1 m.
Figure 16.
Total costs (€) as a function of the crest width, B (m), and the mean nominal diameter of rocks, Dn50det (m), for the detached low-crested structure of Rcdet = −1 m.

© 2018 by the authors. Licensee MDPI, Basel, Switzerland. This article is an open access article distributed under the terms and conditions of the Creative Commons Attribution (CC BY) license (http://creativecommons.org/licenses/by/4.0/).
Share and Cite
MDPI and ACS Style
Galiatsatou, P.; Makris, C.; Prinos, P. Optimized Reliability Based Upgrading of Rubble Mound Breakwaters in a Changing Climate. J. Mar. Sci. Eng. 2018, 6, 92. https://doi.org/10.3390/jmse6030092
AMA Style
Galiatsatou P, Makris C, Prinos P. Optimized Reliability Based Upgrading of Rubble Mound Breakwaters in a Changing Climate. Journal of Marine Science and Engineering. 2018; 6(3):92. https://doi.org/10.3390/jmse6030092
Chicago/Turabian StyleGaliatsatou, Panagiota, Christos Makris, and Panayotis Prinos. 2018. "Optimized Reliability Based Upgrading of Rubble Mound Breakwaters in a Changing Climate" Journal of Marine Science and Engineering 6, no. 3: 92. https://doi.org/10.3390/jmse6030092
Note that from the first issue of 2016, this journal uses article numbers instead of page numbers. See further details here.