1. Introduction
One of the most interesting outcomes of the quantum vacuum fluctuation is the prediction of the Casimir force by Hendrik G. Casimir in 1948 [
1]. The Casimir force in its original form is formulated between two neutral conducting plates in parallel that are attracted towards each other mainly due to the zero-point energy between them [
2,
3]. Under ideal conditions, for a plane parallel geometry with ideally reflecting material and at zero temperature, the Casimir force is given by [
1]:
which depends only on the surface area
A and separation distance
d and the fundamental constants
ħ, the reduced Planck constant, and
c, the speed of light in vacuum. The attraction is attributed to fluctuations in quantum vacuum of the electromagnetic fields within the cavity formed by two conducting plates in parallel acting as perfect mirrors. Inside the cavity one component of the momentum is quantized whereas outside the cavity all possible values of momentum are allowed. At such condition, the radiation pressure from outside is larger than that from the inside and, as a result, the plates attract each other. In practice, the experiments conducted to measure the force deal with deposited materials having finite roughness and far from ideal reflectivity; besides the experiments are conducted at finite temperature. This gives a deviation in the measurement results when compared to the theoretical prediction. The corrections to Equation (1) due to these effects can be as large as 50% for a separation distance of ~100 nm [
4] and even larger for smaller separations.
The Lifshitz theory developed in 1955 discusses in detail the dispersive forces between macroscopic structures that account for the real optical properties of used metal [
5]. Moreover, within this theory the retarded Casimir force and the non-retarded van der Waals force are the limit cases for one and the same force, which is sometimes called the Casimir-Lifshitz (CL) force. This force is given by the Lifshitz formula and it coincides with the Casimir force in the large distance limit and with the van der Waals force in the short distance limit. This is well described in [
6].
The CL force becomes important at distances smaller than 100 nm, where it becomes comparable with the electrostatic force and at separations below 10 nm the Casimir/van der Waals force dominates any other force. These properties make the forces important players in both the micro and nano world. The CL force can significantly influence operation of MEMS [
7,
8,
9] and it has a special significance for stiction due to adhesion which is the major failure mode in MEMS [
10,
11,
12].
Since its prediction, many attempts have been made to quantify the Casimir force based on several geometries; between parallel plates [
13,
14], crossed cylinders [
15], sphere-plate [
8,
16,
17,
18,
19,
20], cylinder-plate [
21,
22,
23,
24] and using different experimental techniques such as atomic force microscopy [
18,
25,
26,
27], MEMS devices and also using macro devices as described in [
8,
19,
20,
28,
29]. As it is difficult to keep two plates exactly parallel, the sphere-plate measurement is the best alternative option with the highest precision measurement so far. The measurement with parallel plates performed by Sparnay in 1958 was the first experimental indication on the existence of the Casimir force [
13]. This was repeated more than 40 years later by the Padova group [
14]. The CL force measured with this experiment was with a precision of 15% which is relatively low in comparison with the precision of ~1% as claimed for the sphere-plate configuration in [
18,
20]; the latter is however still under debate [
30,
31].
In this paper we present a measurement setup based on a micromachined parallel plate structure. The plate-plate geometry was chosen because using MEMS technology it can be fabricated relatively easy. Furthermore, this geometry is less investigated experimentally and the force between parallel plates can be reliably predicted without the use of additional approximations. The basic principle of the measurement setup is discussed in
Section 2, which we initially proposed in [
32]. The most important feature of the setup is that the movements of both plates are monitored using a Polytec MSA-400 laser scanning vibrometer at vibration frequencies around 1 kHz. This allows measurement of displacement amplitudes in the order of picometers. Especially at small average plate distances and depending on the actuation amplitude the displacements due to the Casimir force can be two or three orders of magnitude larger. Next, in
Section 3, a fabrication route for the realization of the structure is presented. In
Section 4, an outlook on possible experiments to measure the Casimir force with the realized MEMS parallel plate structures is described. Furthermore, this section presents calculated vibration amplitudes due to the Casimir force as a function of initial plate distance and actuation amplitude. Finally, preliminary experimental results are discussed in
Section 5.
2. Proposed Measurement Setup
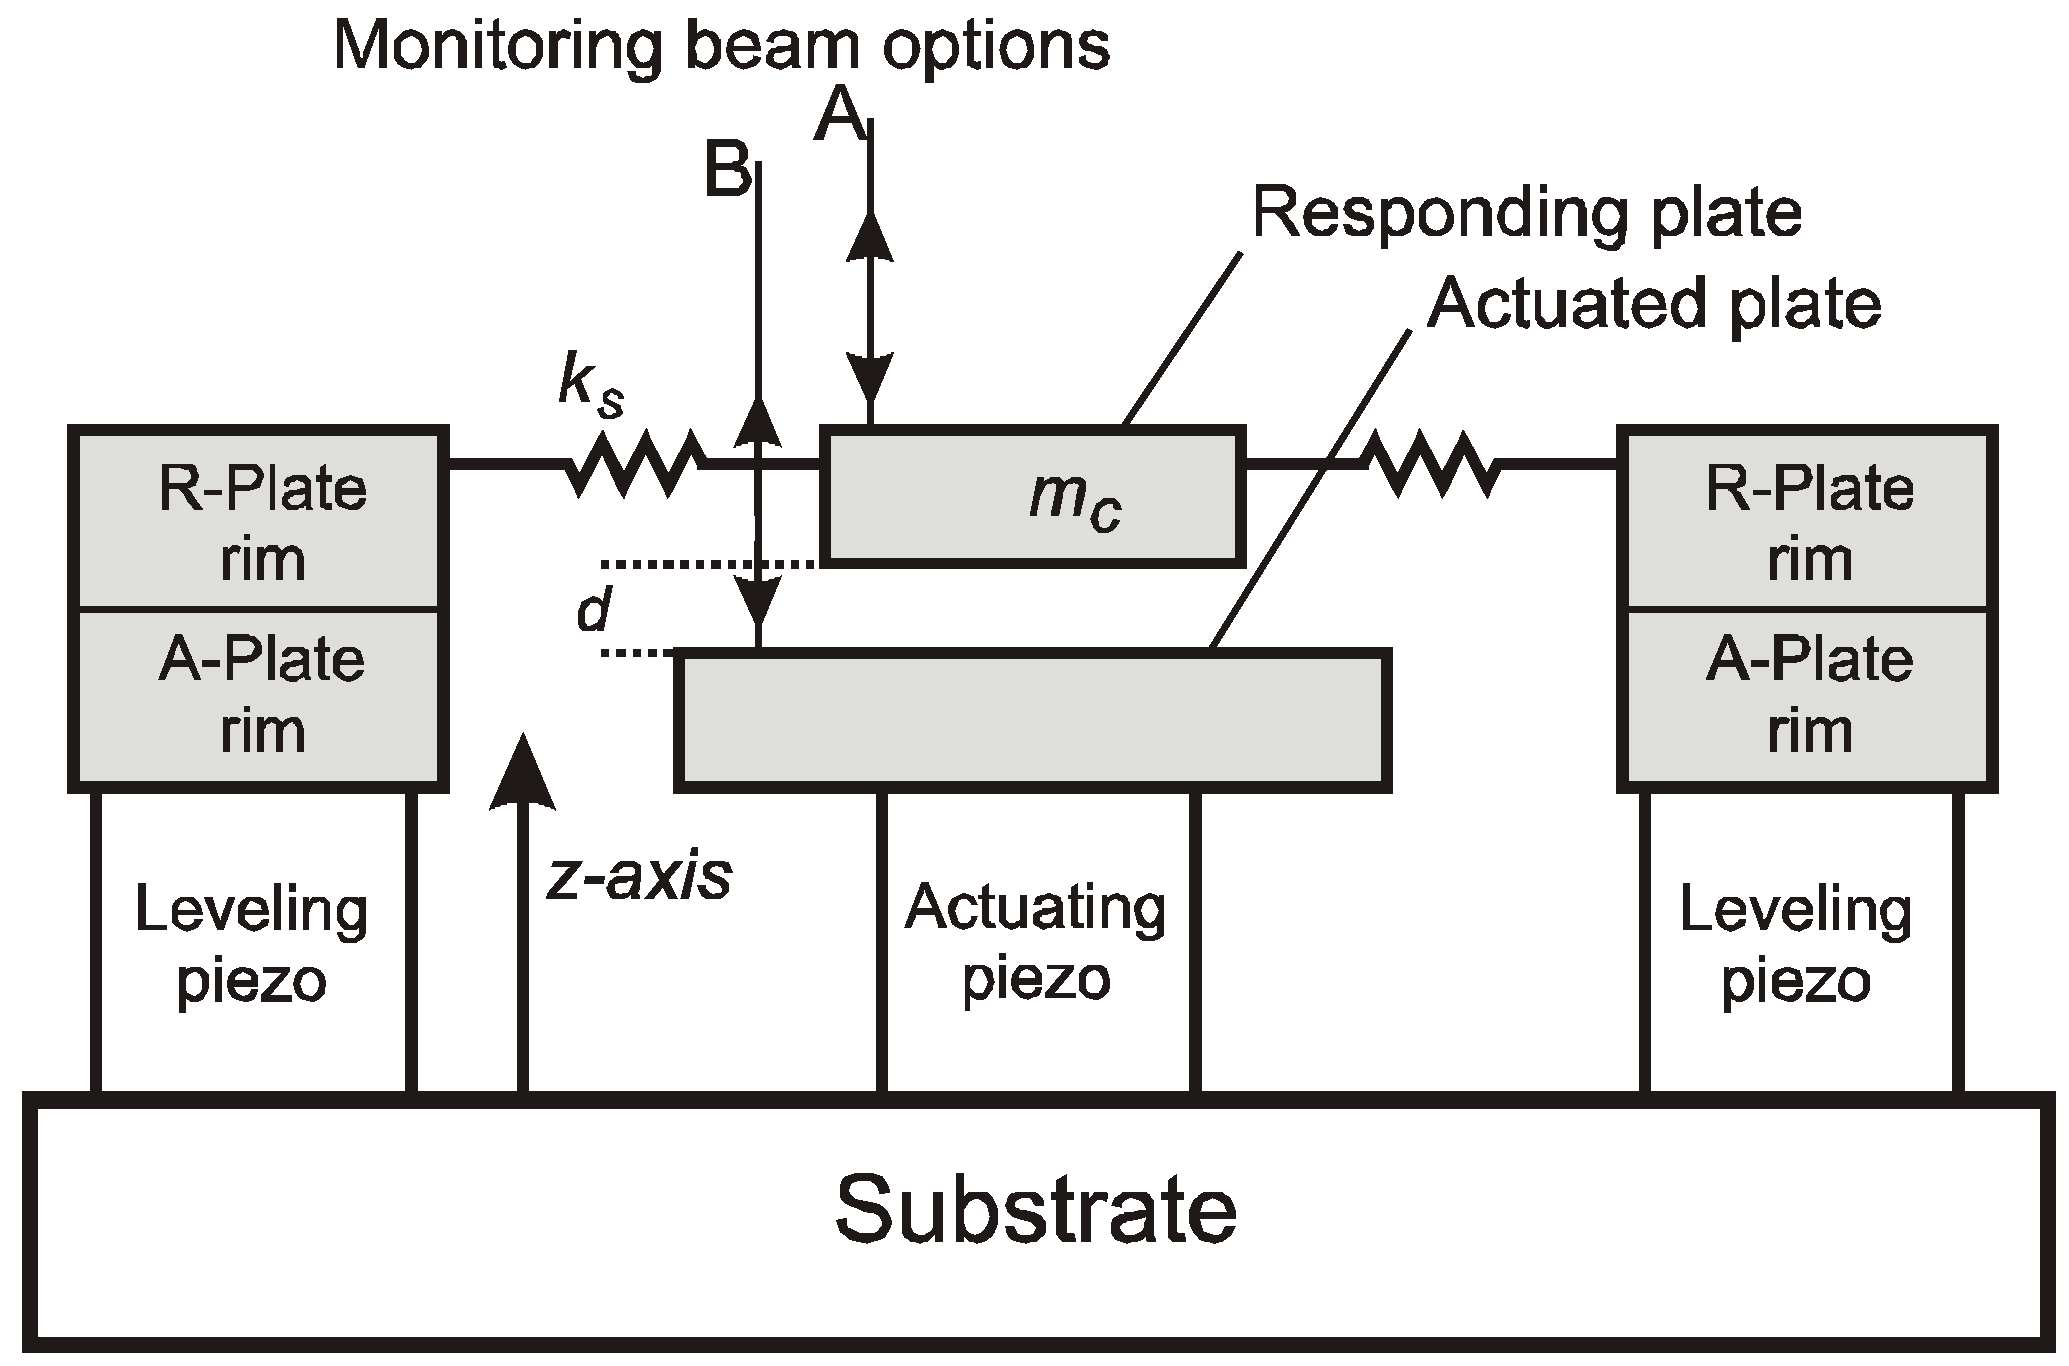
A schematic overview of the measurement setup is shown in
Figure 1. The design is based on the methodology described in [
32]. The setup consists of two parallel plates, the “actuated” plate and the “responding” plate, measuring a surface of 1mm
2. Both plates are coated with a thin layer of gold. The plates are separated at an initial distance
d in the order of 1–2 µm, which is defined by the fabrication process. The plates are fabricated using silicon micromachining and wafer bonding as described in
Section 3. The lower, actuated plate is mounted on a piezoelectric actuator (actuating piezo), so that upon actuation it can be moved along the
z-axis.
Figure 1.
Cross sectional view of the measurement set-up. With monitoring beam option A, the responding-plate position is monitored. With option B, the actuated-plate position is monitored.
Figure 1.
Cross sectional view of the measurement set-up. With monitoring beam option A, the responding-plate position is monitored. With option B, the actuated-plate position is monitored.
The rim of the setup is supported by 3 or 4 additional piezoelectric actuators that are mainly used to keep the upper, responding plate in parallel with the lower plate by applying suitable bias voltages to the actuators. The actuating piezo in the center is driven by a combination of a DC bias and an AC signal. The DC bias controls the static distance between the parallel plates and the AC signal results in a vibration that modulates the CL force. An upward movement of the lower plate due to the central piezoelectric actuator results in a reduction of the plate separation d and thus an increase in force. Consequently, a vibration of the lower plate results in a vibration of the upper plate, which is exactly in counter phase.
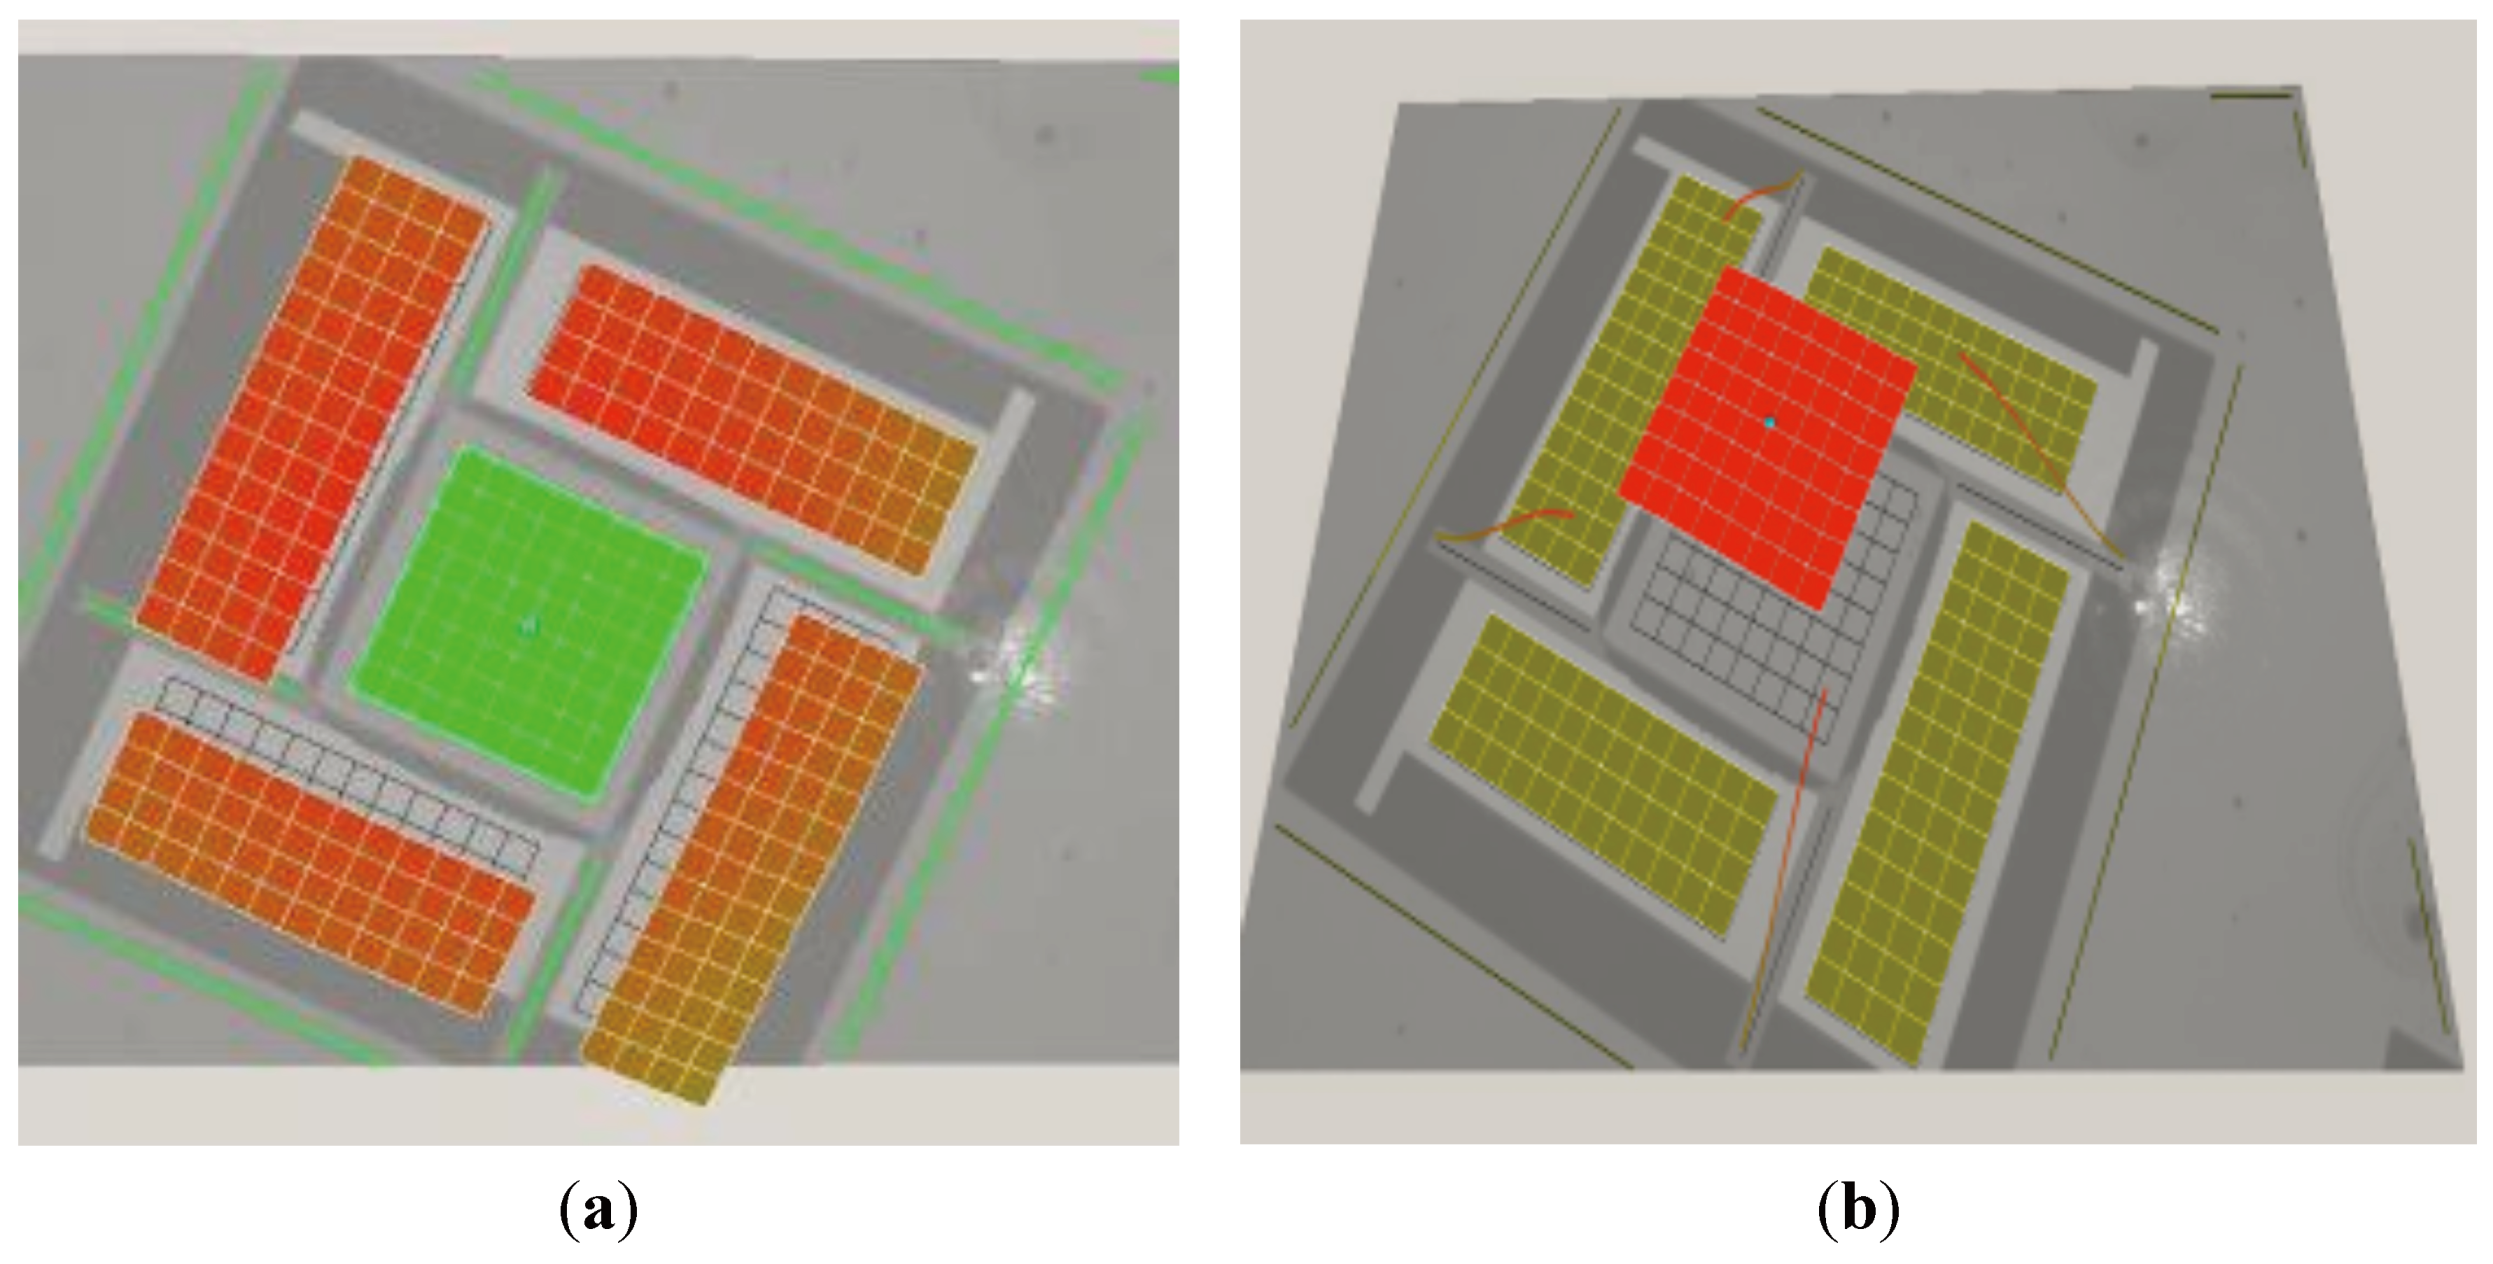
Here, both plates need to be monitored by a laser vibrometer system such as the Polytec MSA-400. Therefore, the top plate is designed slightly smaller than the bottom plate. The laser vibrometer provides the means to monitor the parallelism between the plates, since it can scan the entire top plate and the rim of the actuated plate and thus detect any asymmetry in the vibration modes. At plate separations of 100 nm to 300 nm the vibration amplitude of the top plate will be in the order of hundreds of picometers, which is substantially larger than the resolution of the vibrometer. The voltages at the leveling piezoelectric actuators are controlled such that the motion of the top plate is a pure up and down motion without tilting of the plate. The setup is operated in vacuum; otherwise the movements of the plates would be strongly coupled by the thin layer of air between the plates. The attainable accuracy will ultimately be limited by the quality of the vacuum, mismatch between the suspension springs and/or asymmetries of the top plate, and by non-idealities in the actuation piezos. For example, the central actuation piezo should result in a pure up-down motion of the lower plate, but in practice some bending and tilting of the plate will be inevitable.
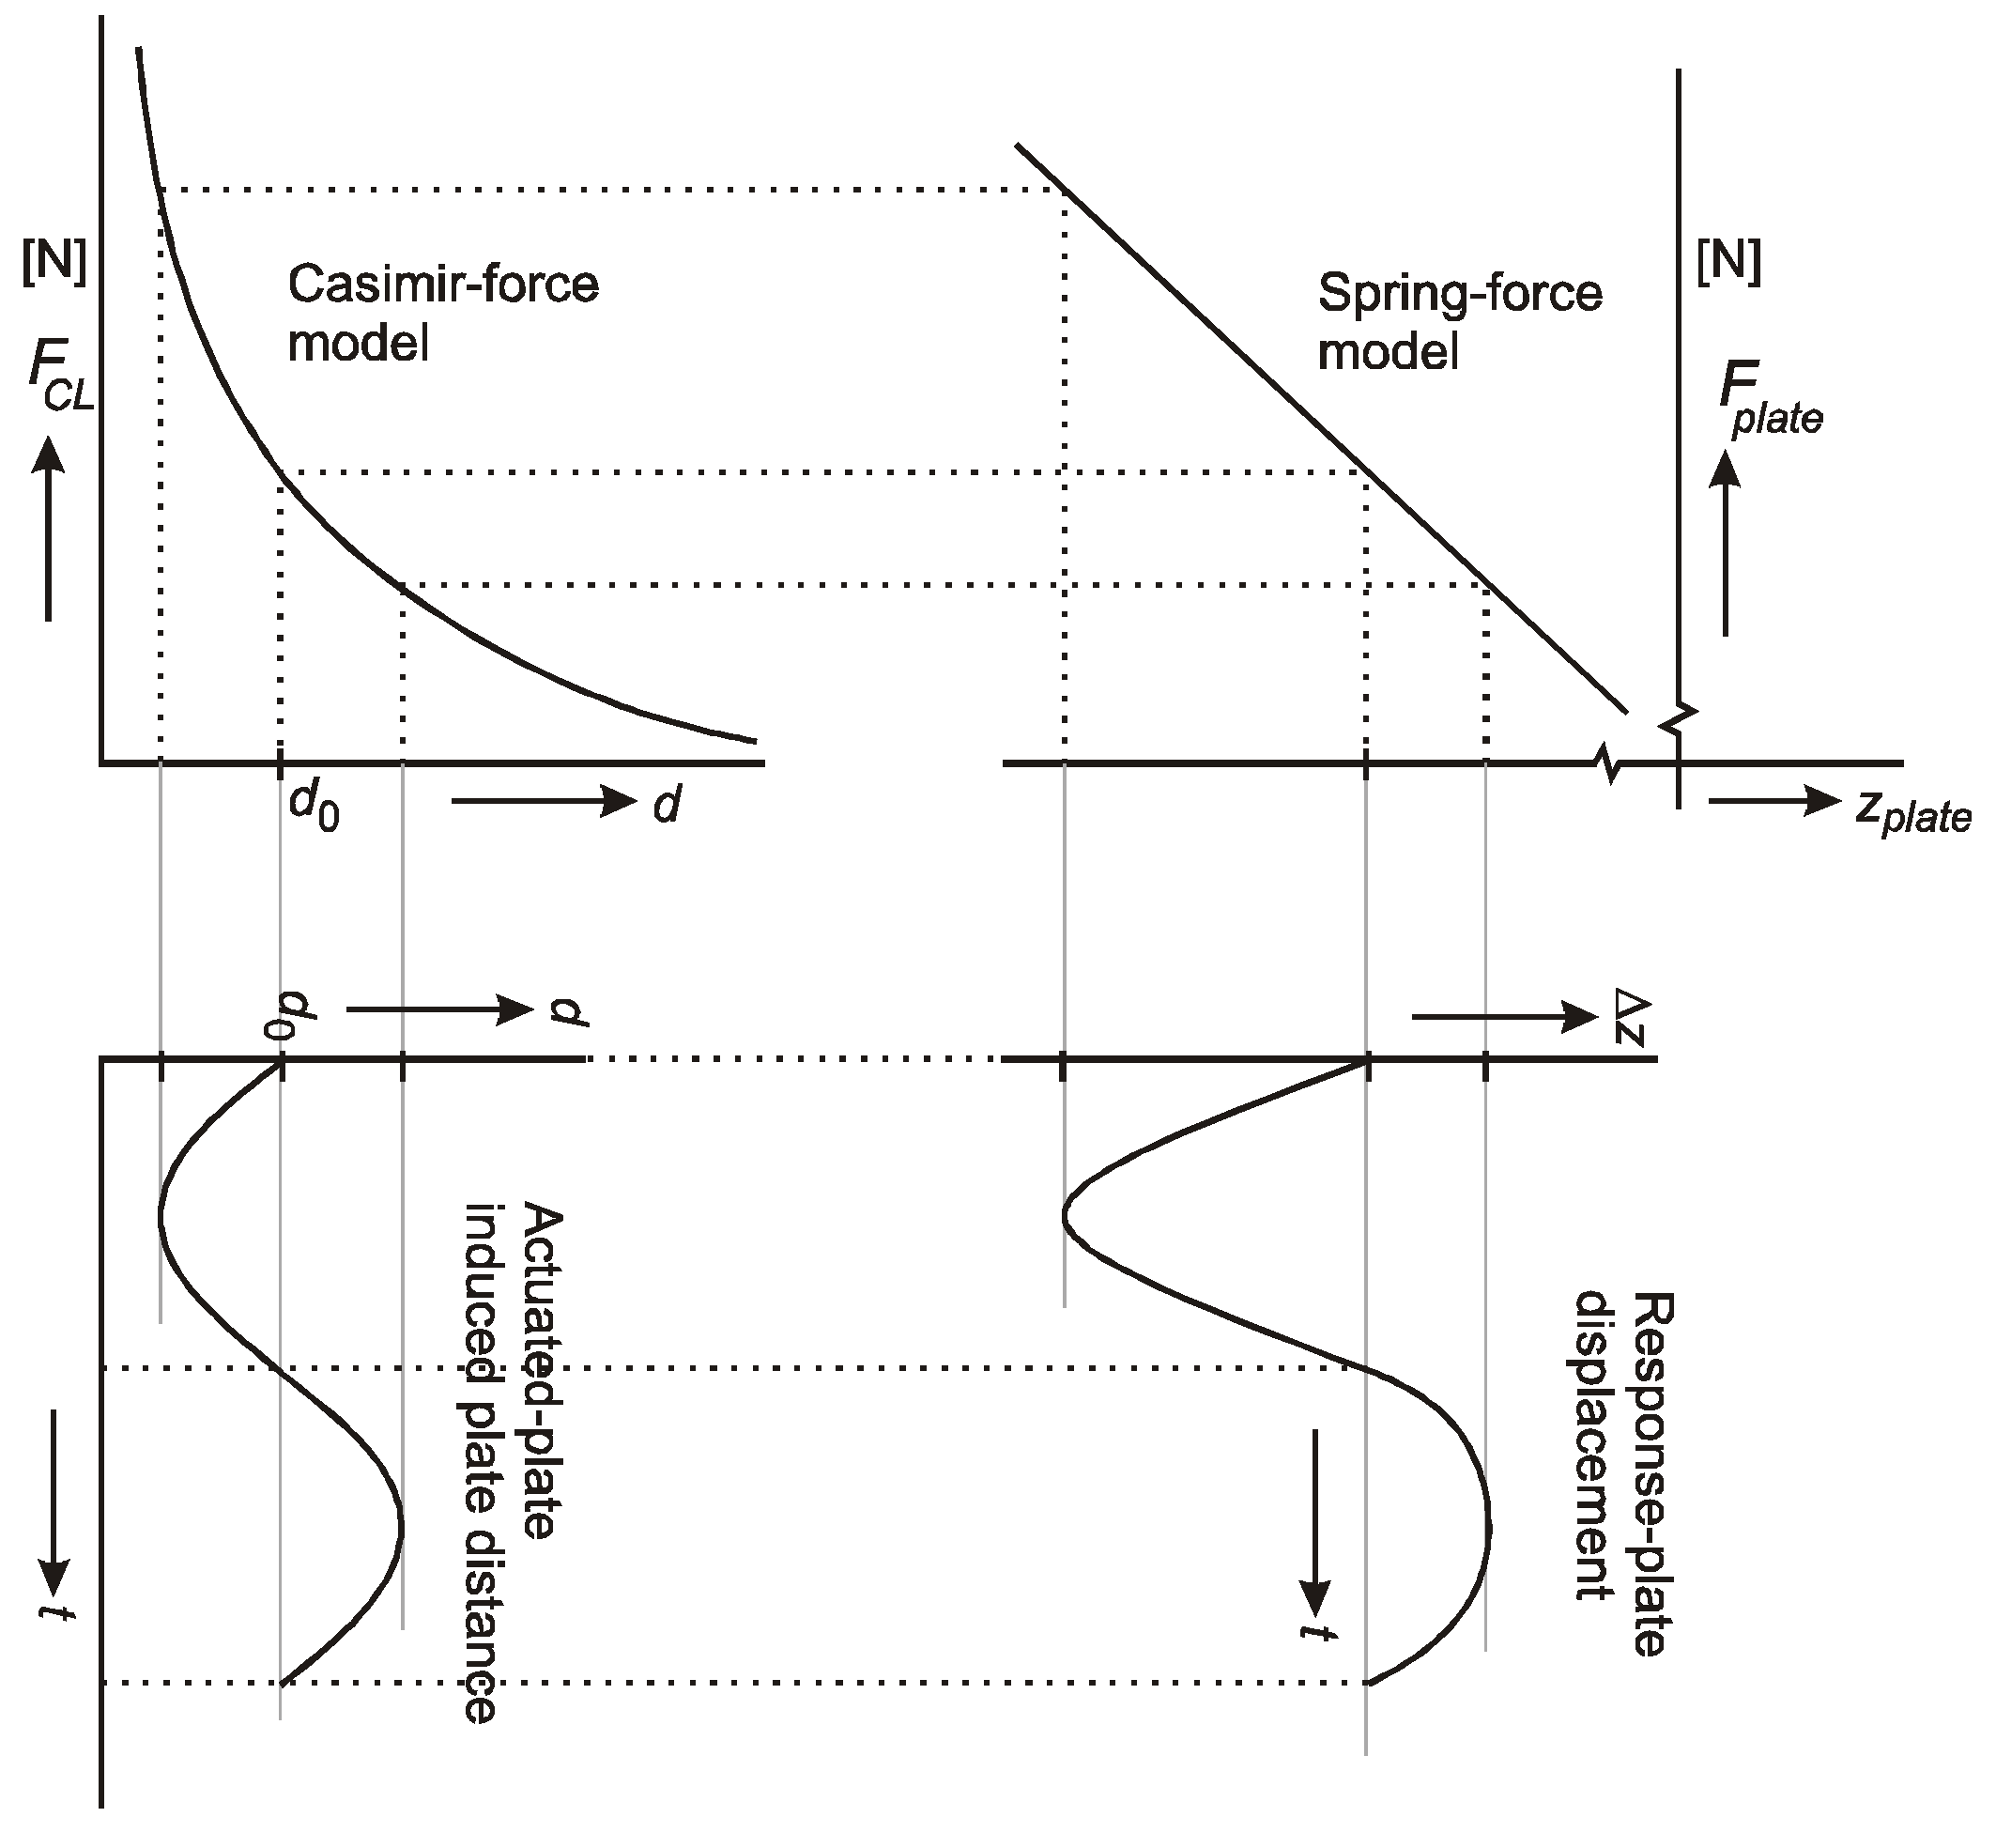
Figure 2 graphically illustrates the movement of the top plate in response to the actuated movement of the bottom plate.
Figure 2.
Variation of the actuated plate with a harmonic function of time gives rise to variation of the response-plate due to the acting Casimir-Lifshitz (CL) force. Note that the response-plate displacement function in the z-direction contains higher order harmonics due to thenon-linear characteristic of the CL force with respect to the distance. (Fel is assumed to be zero, i.e., the applied potential difference V between the plates is tuned towards a minimum in electrostatic force).
Driving the actuated plate at relatively large amplitudes compared to the average distance d0 will result in a non-linear response, as indicated in the figure. In that case the movement of the response plate contains higher order harmonics that can in fact be used to identify the nonlinear characteristic of the CL force. Alternatively, small actuation amplitudes can be used while measuring the response amplitude as a function of d0.
3. Fabrication Requirements
The Casimir force theory was formulated under ideal conditions such as plane parallel geometry with perfectly flat surfaces and perfect reflection. It is a challenge to realize a practical setup approaching these conditions. Moreover, an important factor that increases the correction of the measured CL force with respect to the theoretical prediction is the surface roughness of the bodies used for measurement. As the surfaces of the real bodies after deposition of gold becomes rougher, it is essential to have a low surface roughness for the plates before depositing the gold layer. So that, upon deposition of gold, the ultimate roughness will then be the roughness of the gold layer alone. Besides, bulk micromachining is preferred over surface micromachining, as a thick mass is needed because a thin surface micromachined mass would bend due to the deposited gold layer. Further, to realize complete parallel plate structure separated at a distance of ~1 µm, both the plates are ultimately bonded at the end of the processing, for which an Au-Si eutectic bonding is used.
3.1. Fabrication Process
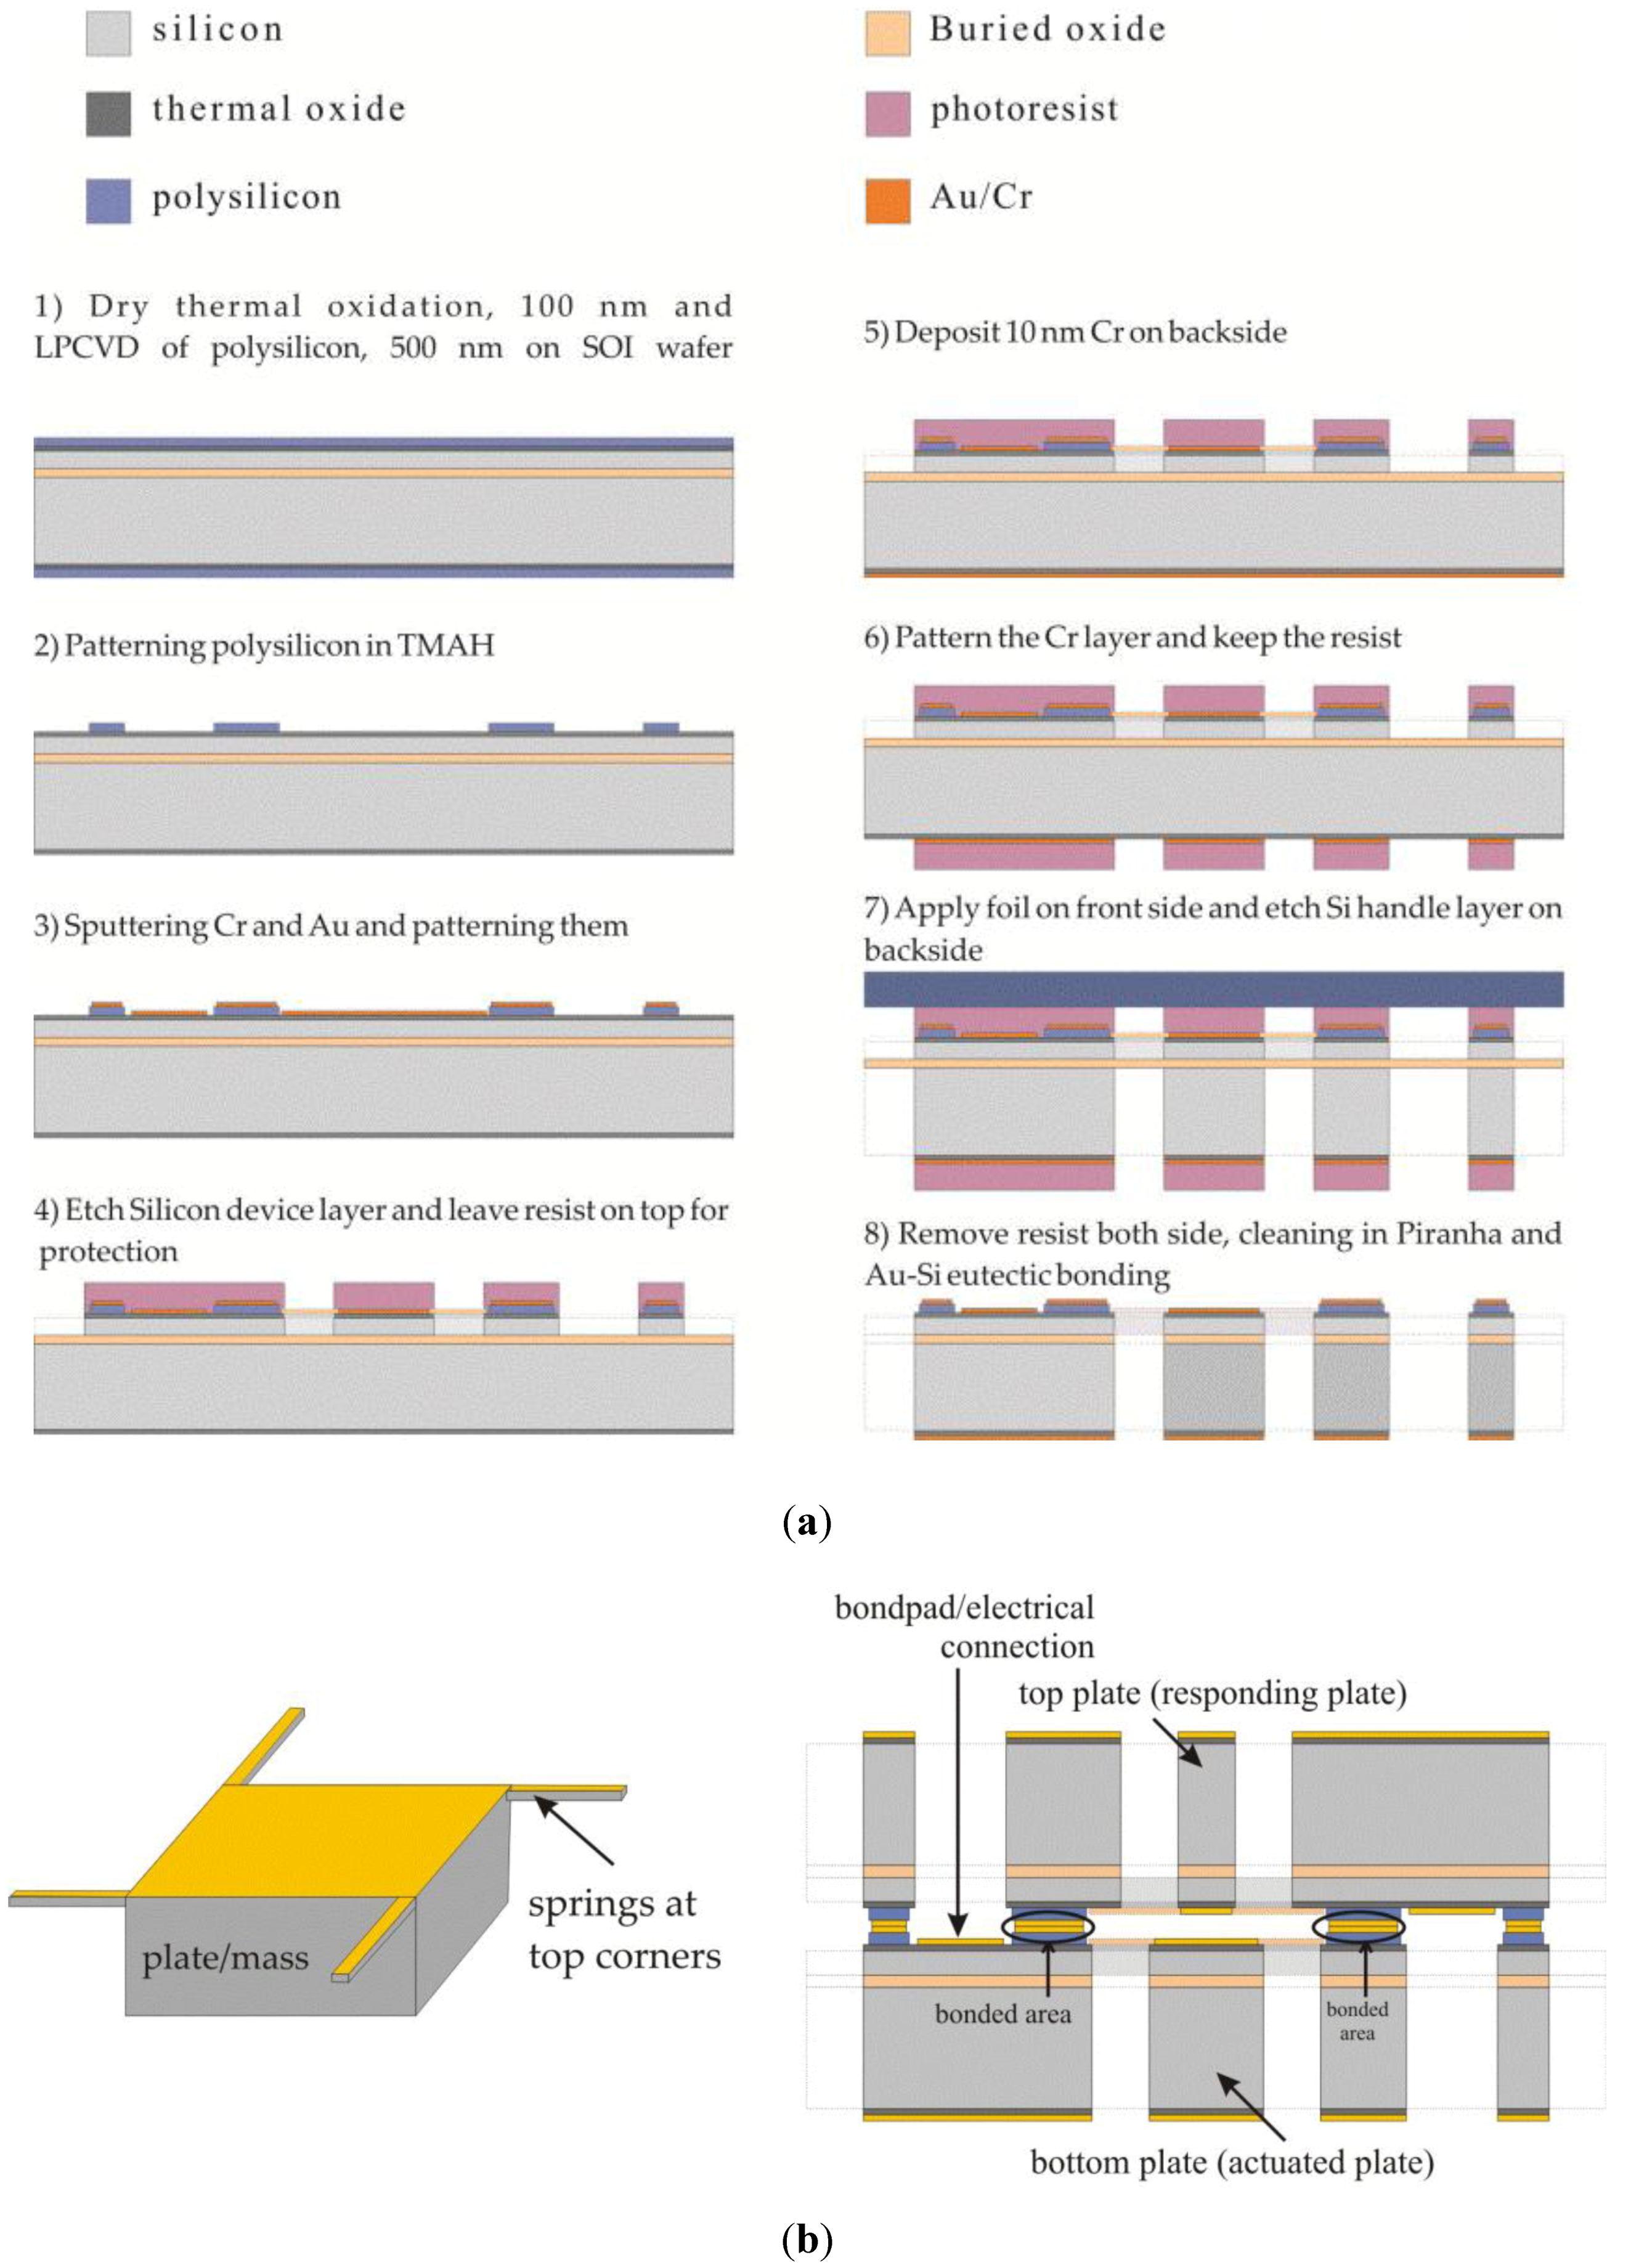
The process starts with SOI wafers having a device layer of 50 μm, a buried oxide (BOX) layer of 3 μm and a 380 μm thick handle layer. The outline of the complete process is shown in
Figure 3(a). The parallel plate chip is formed by bonding two similar processed substrates; a cross section of the final device is shown in
Figure 3(b), also shown is the 3D image of plate with springs at top corners.
The bonding used here is gold-silicon eutectic bonding, for which a combination of a gold layer and polysilicon is used. The process starts with creating the spacing layer that defines the initial separation distance between the bonded plates. To realize this, 100–150 nm thermal oxide is formed, followed by the deposition of a layer of 500 nm polysilicon, step 1 in
Figure 3(a). To get a separationof 1 μm ± 100 nm between the bonded plates, the tolerance on the thickness of the polysilicon layer should be within 5%.
After patterning the polysilicon layer, a 100 nm thick gold layer is deposited with 10 nm chromium as adhesion layer (step 3). After removing the resist, lithography with a new mask defining the plate and springs connected to the solid frame of silicon is performed. Chip break lines are also defined in this mask which are etched together with the patterning/etching of silicon device layer (step 4). While keeping the resist on the top side as protective layer, a thin layer of chromium (Cr) is sputter deposited on backside (step 5). This metallic layer at the back side of the wafer is necessary to have a good reflection for the measurements done using the laser vibrometer. To release the springs, the back side layers of oxide, handle layer and BOX layer are etched using DRIE (step 6–8). To prevent leakage from the Helium backside cooling during this etch step, the front side of the wafer is covered with a foil (DuPont Mx5000). A 3500 nm thick layer of photoresist is used as mask material to withstand the DRIE to etch through all the layers.
Finally, two similar wafers are aligned and placed with their device structures facing each other. At the contact interface of the two wafers, gold on top of a polysilicon layer is present, which forms the Au-Si eutectic bond. When they are heated at a temperature higher than the eutectic melting point, the contacted surface layer containing the eutectic composites melts, forming a liquid phase alloy. This accelerates further mixing processes and diffusion until the saturation composition is reached. The cross-section of a complete bonded device is shown in
Figure 3 (b). Finally, the wafers are broken into separate devices by breaking at the break-lines that are etched in steps 4 & 8.
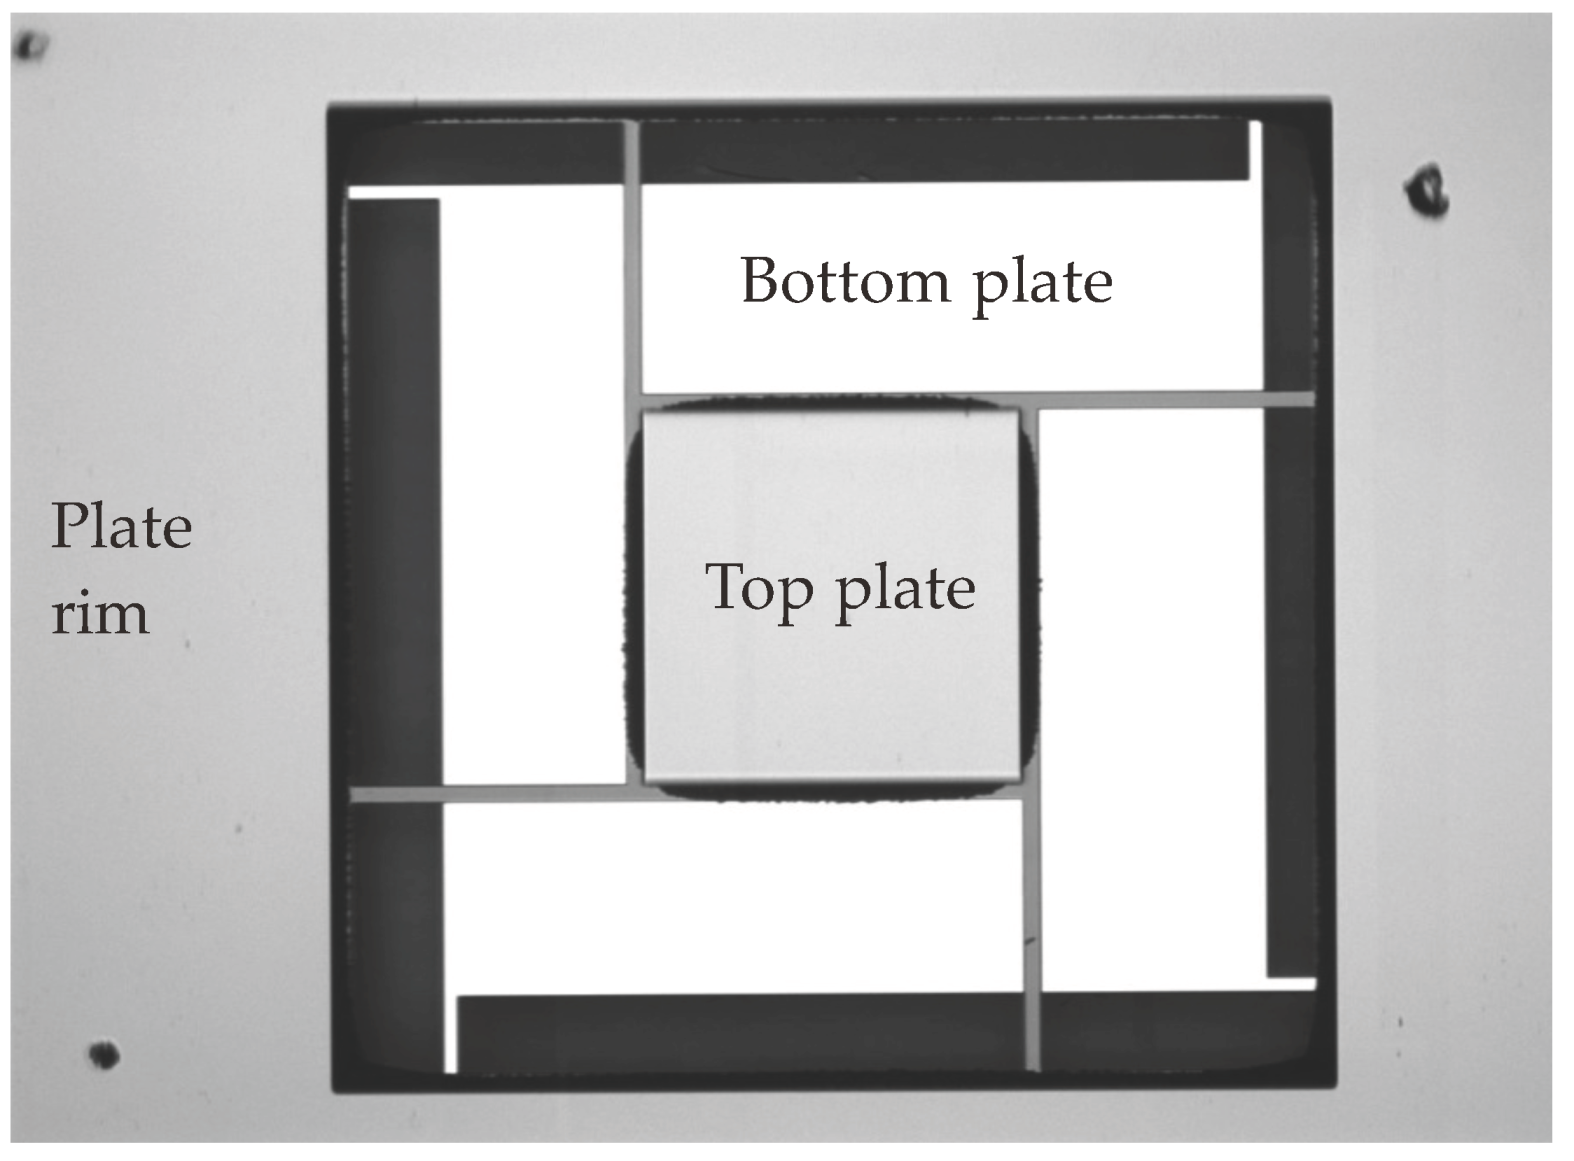
Figure 4 shows a microscope image of a realized bonded structure as seen from top.
Figure 3.
(a) Process outline for the fabrication of Casimir force sensor with parallel plate structures; (b) 3D drawing of plate with springs and bonded plates to form complete Casimir force sensor chip.
Figure 3.
(a) Process outline for the fabrication of Casimir force sensor with parallel plate structures; (b) 3D drawing of plate with springs and bonded plates to form complete Casimir force sensor chip.
Figure 4.
Microscopic image showing the top view of bonded top and bottom plates.
Figure 4.
Microscopic image showing the top view of bonded top and bottom plates.
4. Outlook
4.1. Correction Factors Involved in Real Experiments
The CL force in our experiment is measured at finite temperature between the deposited materials that have finite conductivity and roughness. The measured CL force values are comparable with the theoretical values only when the correction factor accounting for the deviation is included in calculation. Hence the CL force is often expressed via the pure Casimir force (1) using the so-called reduction factor
η(
d) [
4]:
This factor accounts for the deviation of the plate materials from ideal reflectors and for finite temperature. A correction for the roughness of the parallel plates can also be included in the definition of
η [
33,
34,
35] and the reduction factor can be calculated using the Lifshitz theory [
5]. As input information in the Lifshitz formula one has to use the dielectric functions
ε(
ω) of the interacting materials. The main problem here is that the dielectric functions have to be known in a wide frequency range. A detailed analysis of gold films deposited at different conditions was made in [
36], where the dielectric functions were measured using ellipsometry in the range of wavelengths 0.14–33 µm. The reduction factors
η(
d) for these gold films can also be obtained from [
36]. For measurements below 2 μm separation distance, the effect due to temperature is relatively small and is therefore not taken into account. This is because at room temperature, the thermal wavelength can be calculated as
λT =
ħc/kT = 7.6 µm [
37]. When
d << λ
T, the contribution of the zero-point fluctuations dominates over the thermal fluctuation and hence it can be neglected [
38].
4.2. Design of the Experiment
The vibration amplitude of the top plate is a direct measure for the force between the plates; this force will be a combination of the CL force and the electrostatic force acting between the plates due to residual potential difference between plates. The net resulting force can be expressed as:
where
FCL is the CL force as in Equation (2) and
Fel is the electrostatic force, which is given by
Here
ε0 is the permittivity of vacuum,
V is an applied external voltage and
V0 is the residual voltage, which inevitably arises due to built-in charges and the presence of different metals in the electrical circuit. The CL force does not depend on the applied potential, therefore, the net force will be minimal when
V = −
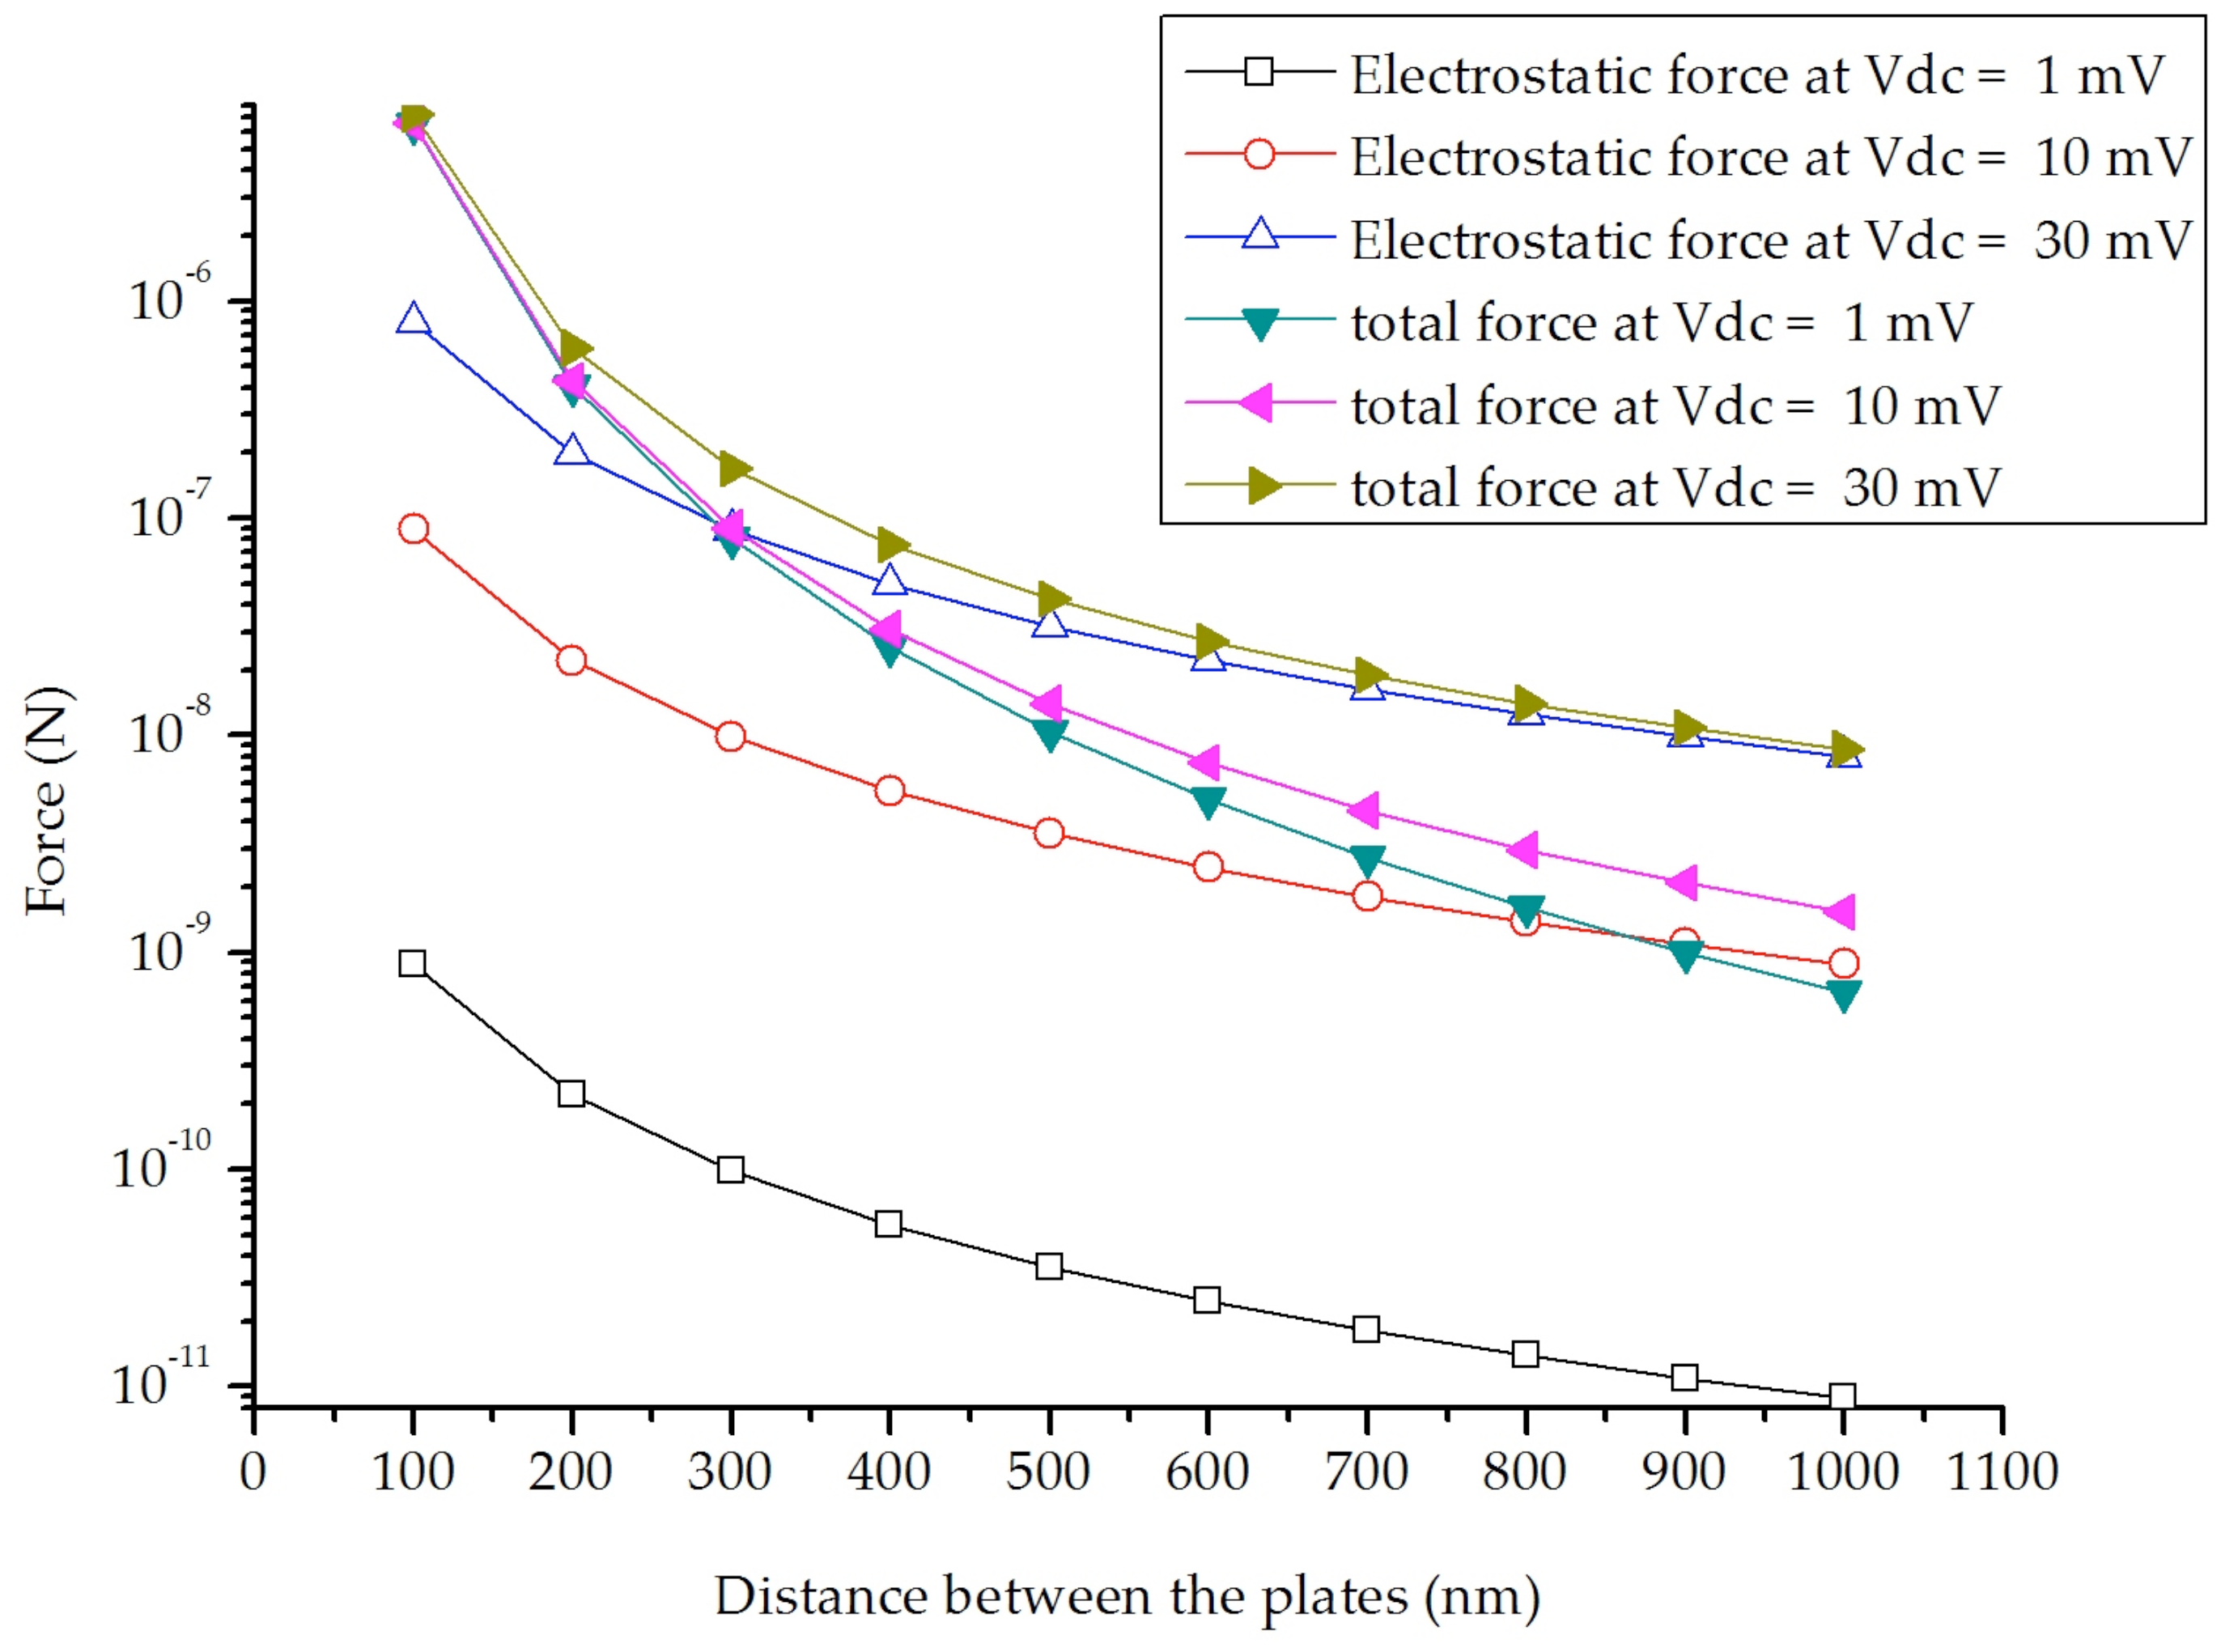
V0. A plot showing the total forces and the electrostatic forces acting between the plates for varying DC voltages with varying distance between the plates is shown in
Figure 5. It clearly shows that the voltage has to be controlled to below 1 mV in order for the CL force to be the dominant force.
Figure 5.
Calculated CL and electrostatic forces between the plates for varying separation distance and varying DC bias voltages.
Figure 5.
Calculated CL and electrostatic forces between the plates for varying separation distance and varying DC bias voltages.
The force between the plates results in a movement of the top plate towards the bottom plate. For relatively slow changes in time,
i.e., well below the resonance frequency of the top plate mass-spring system, quasi static operation can be assumed and the displacement is given by:
where
Ft is the total force between the plates as given in Equation (3) and
Keff is the total spring constant of the four springs connected at the top corners of the plate. Equation (5) is only valid as long as the resulting displacement is small compared to the movement of the bottom plate, as otherwise the additional reduction of the separation distance due the top plate movement has to be taken into account.
4.2.1. Small Signal Actuation for Linear Operation
When the lower plate is actuated by the middle piezoelectric actuator, this results in a variation of the plate distance
d given by
assuming that the resulting movement of the upper plate can be neglected compared to the movement of the actuated plate. Here,
d0 is the average distance between the plates,
zact the actuation amplitude and
ωact the actuation angular frequency. The change in CL force and the associated movement of the upper plate due to this variation in distance can be calculated using Equations (3) and (5). As mentioned above, the actuation frequency
ωact should be well below the resonance frequency of the top plate mass-spring system so that the movement can be considered quasi-static.
In addition to an AC signal to drive the actuator, a DC bias voltage can be applied. In this way, the average distance
d0 between the plates can be decreased, which results in increased vibration amplitude of the top plate due to the larger CL force.
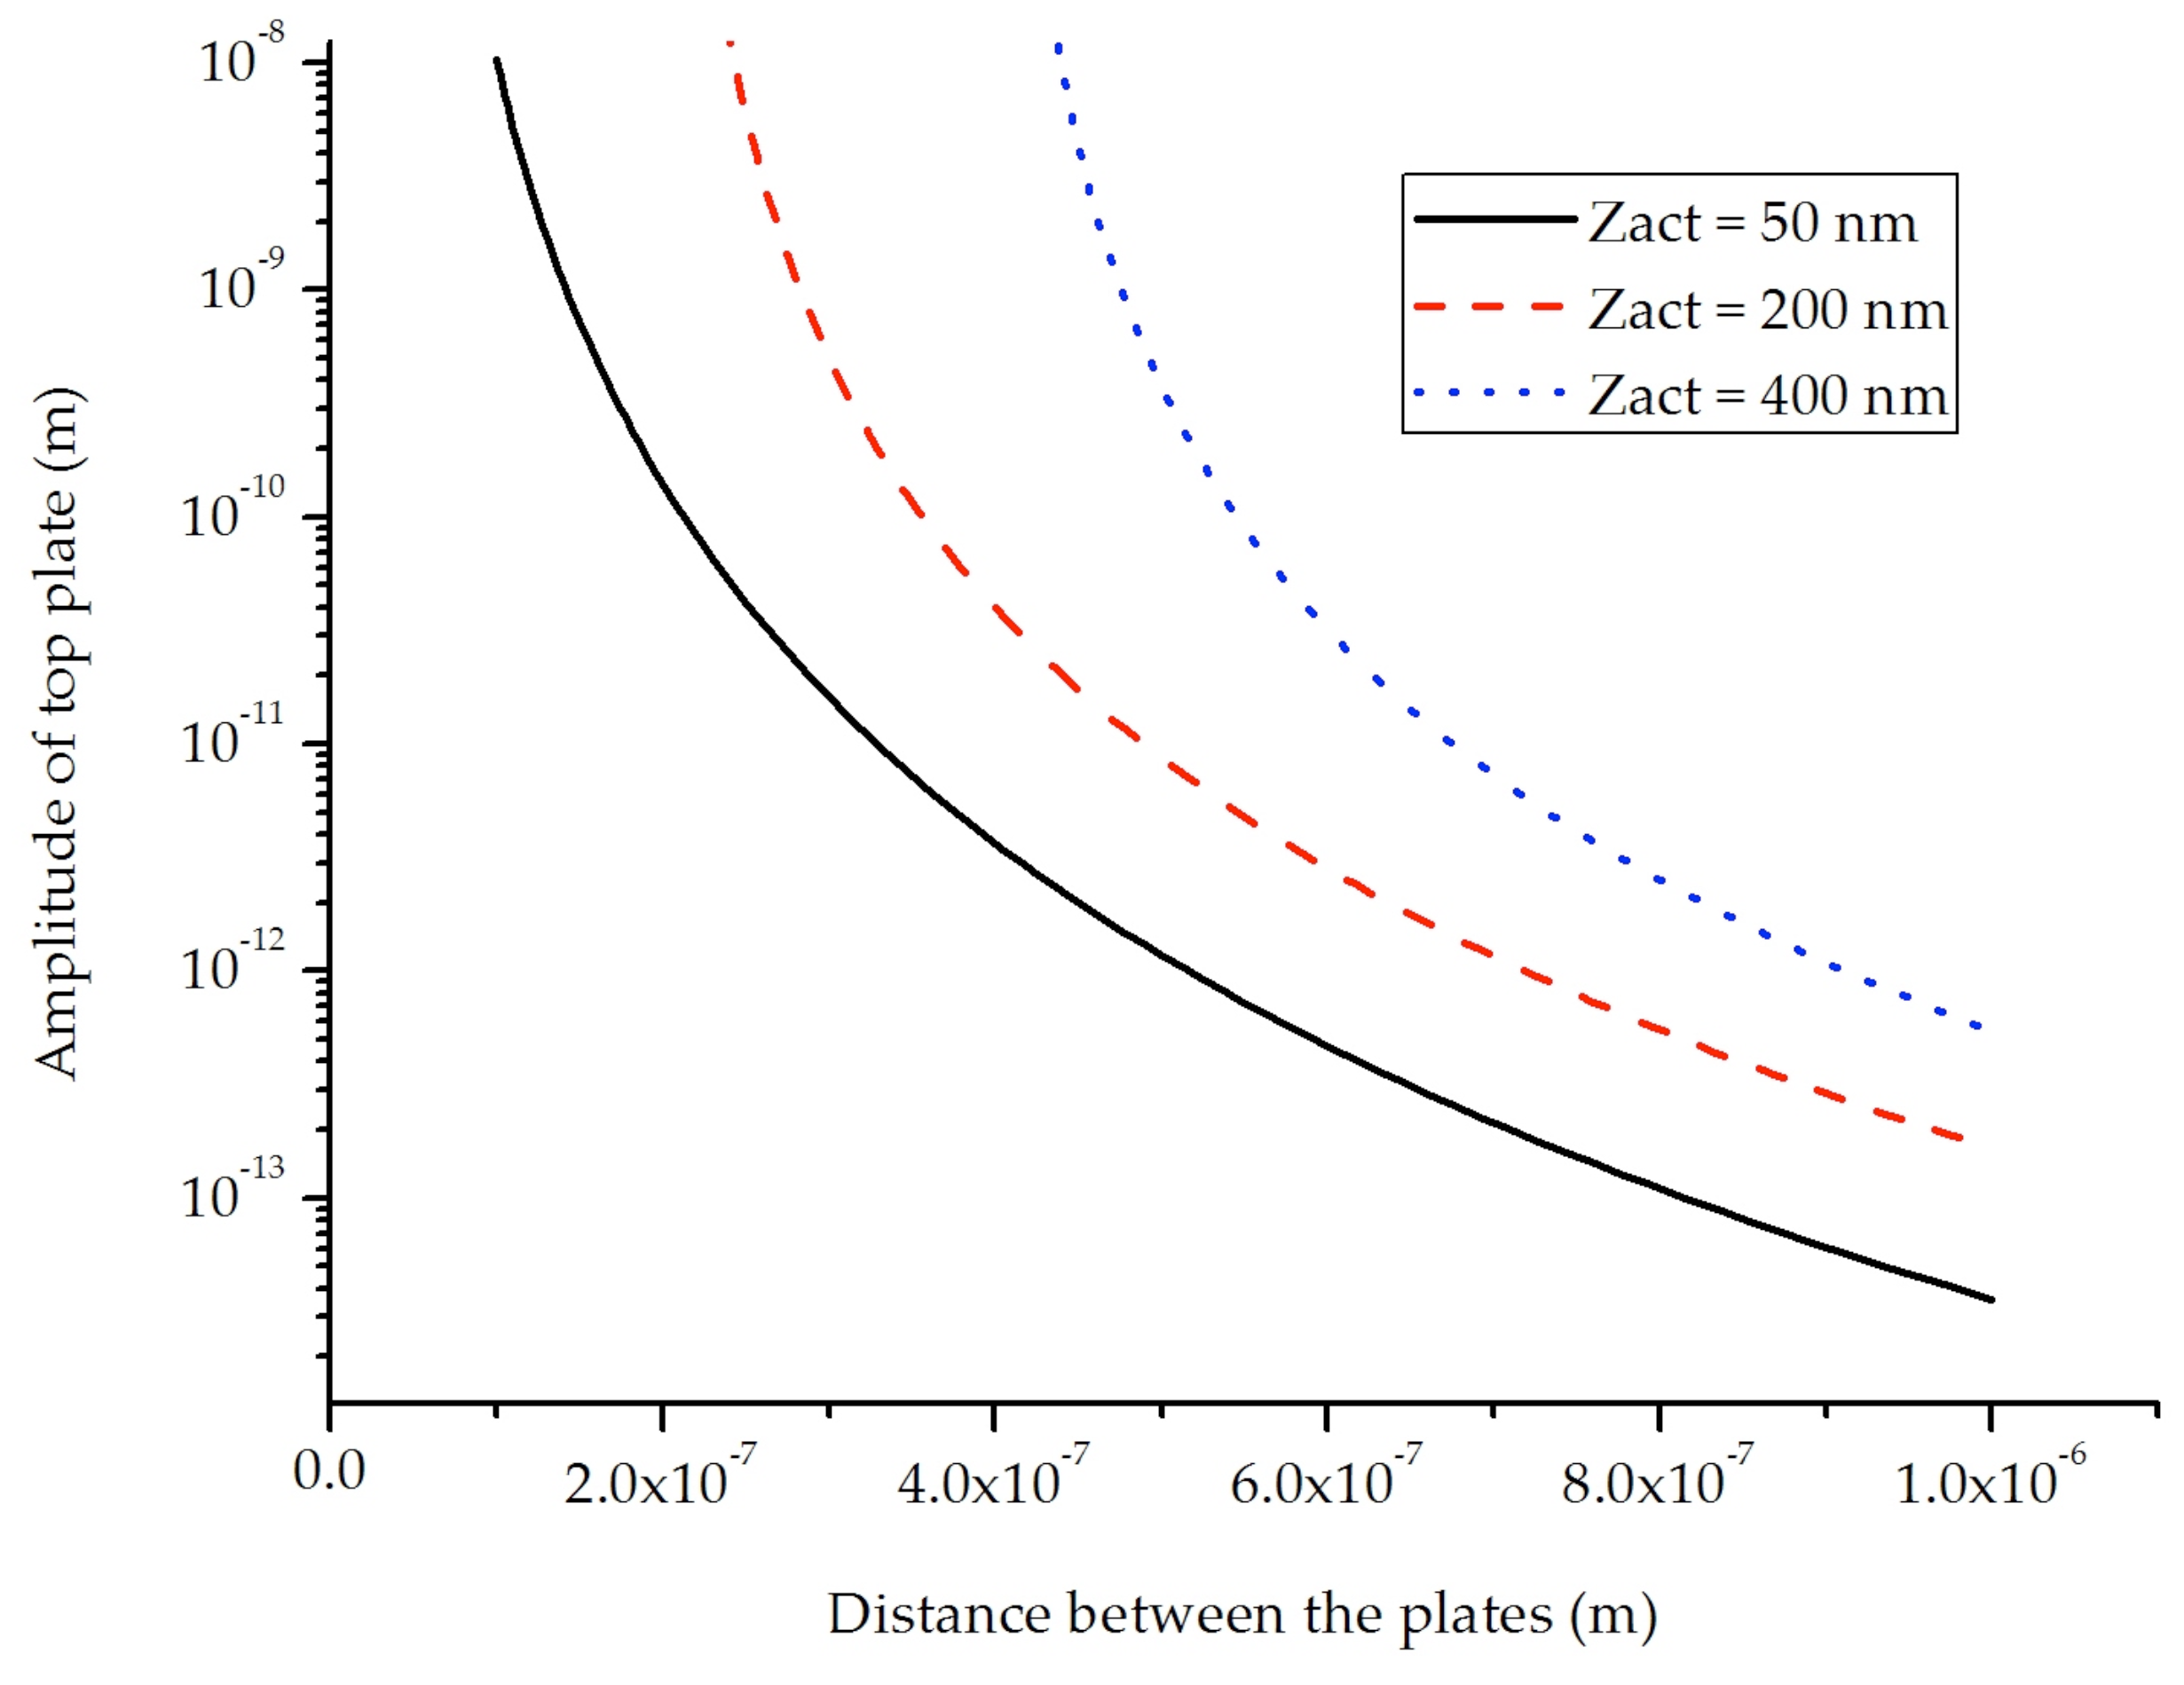
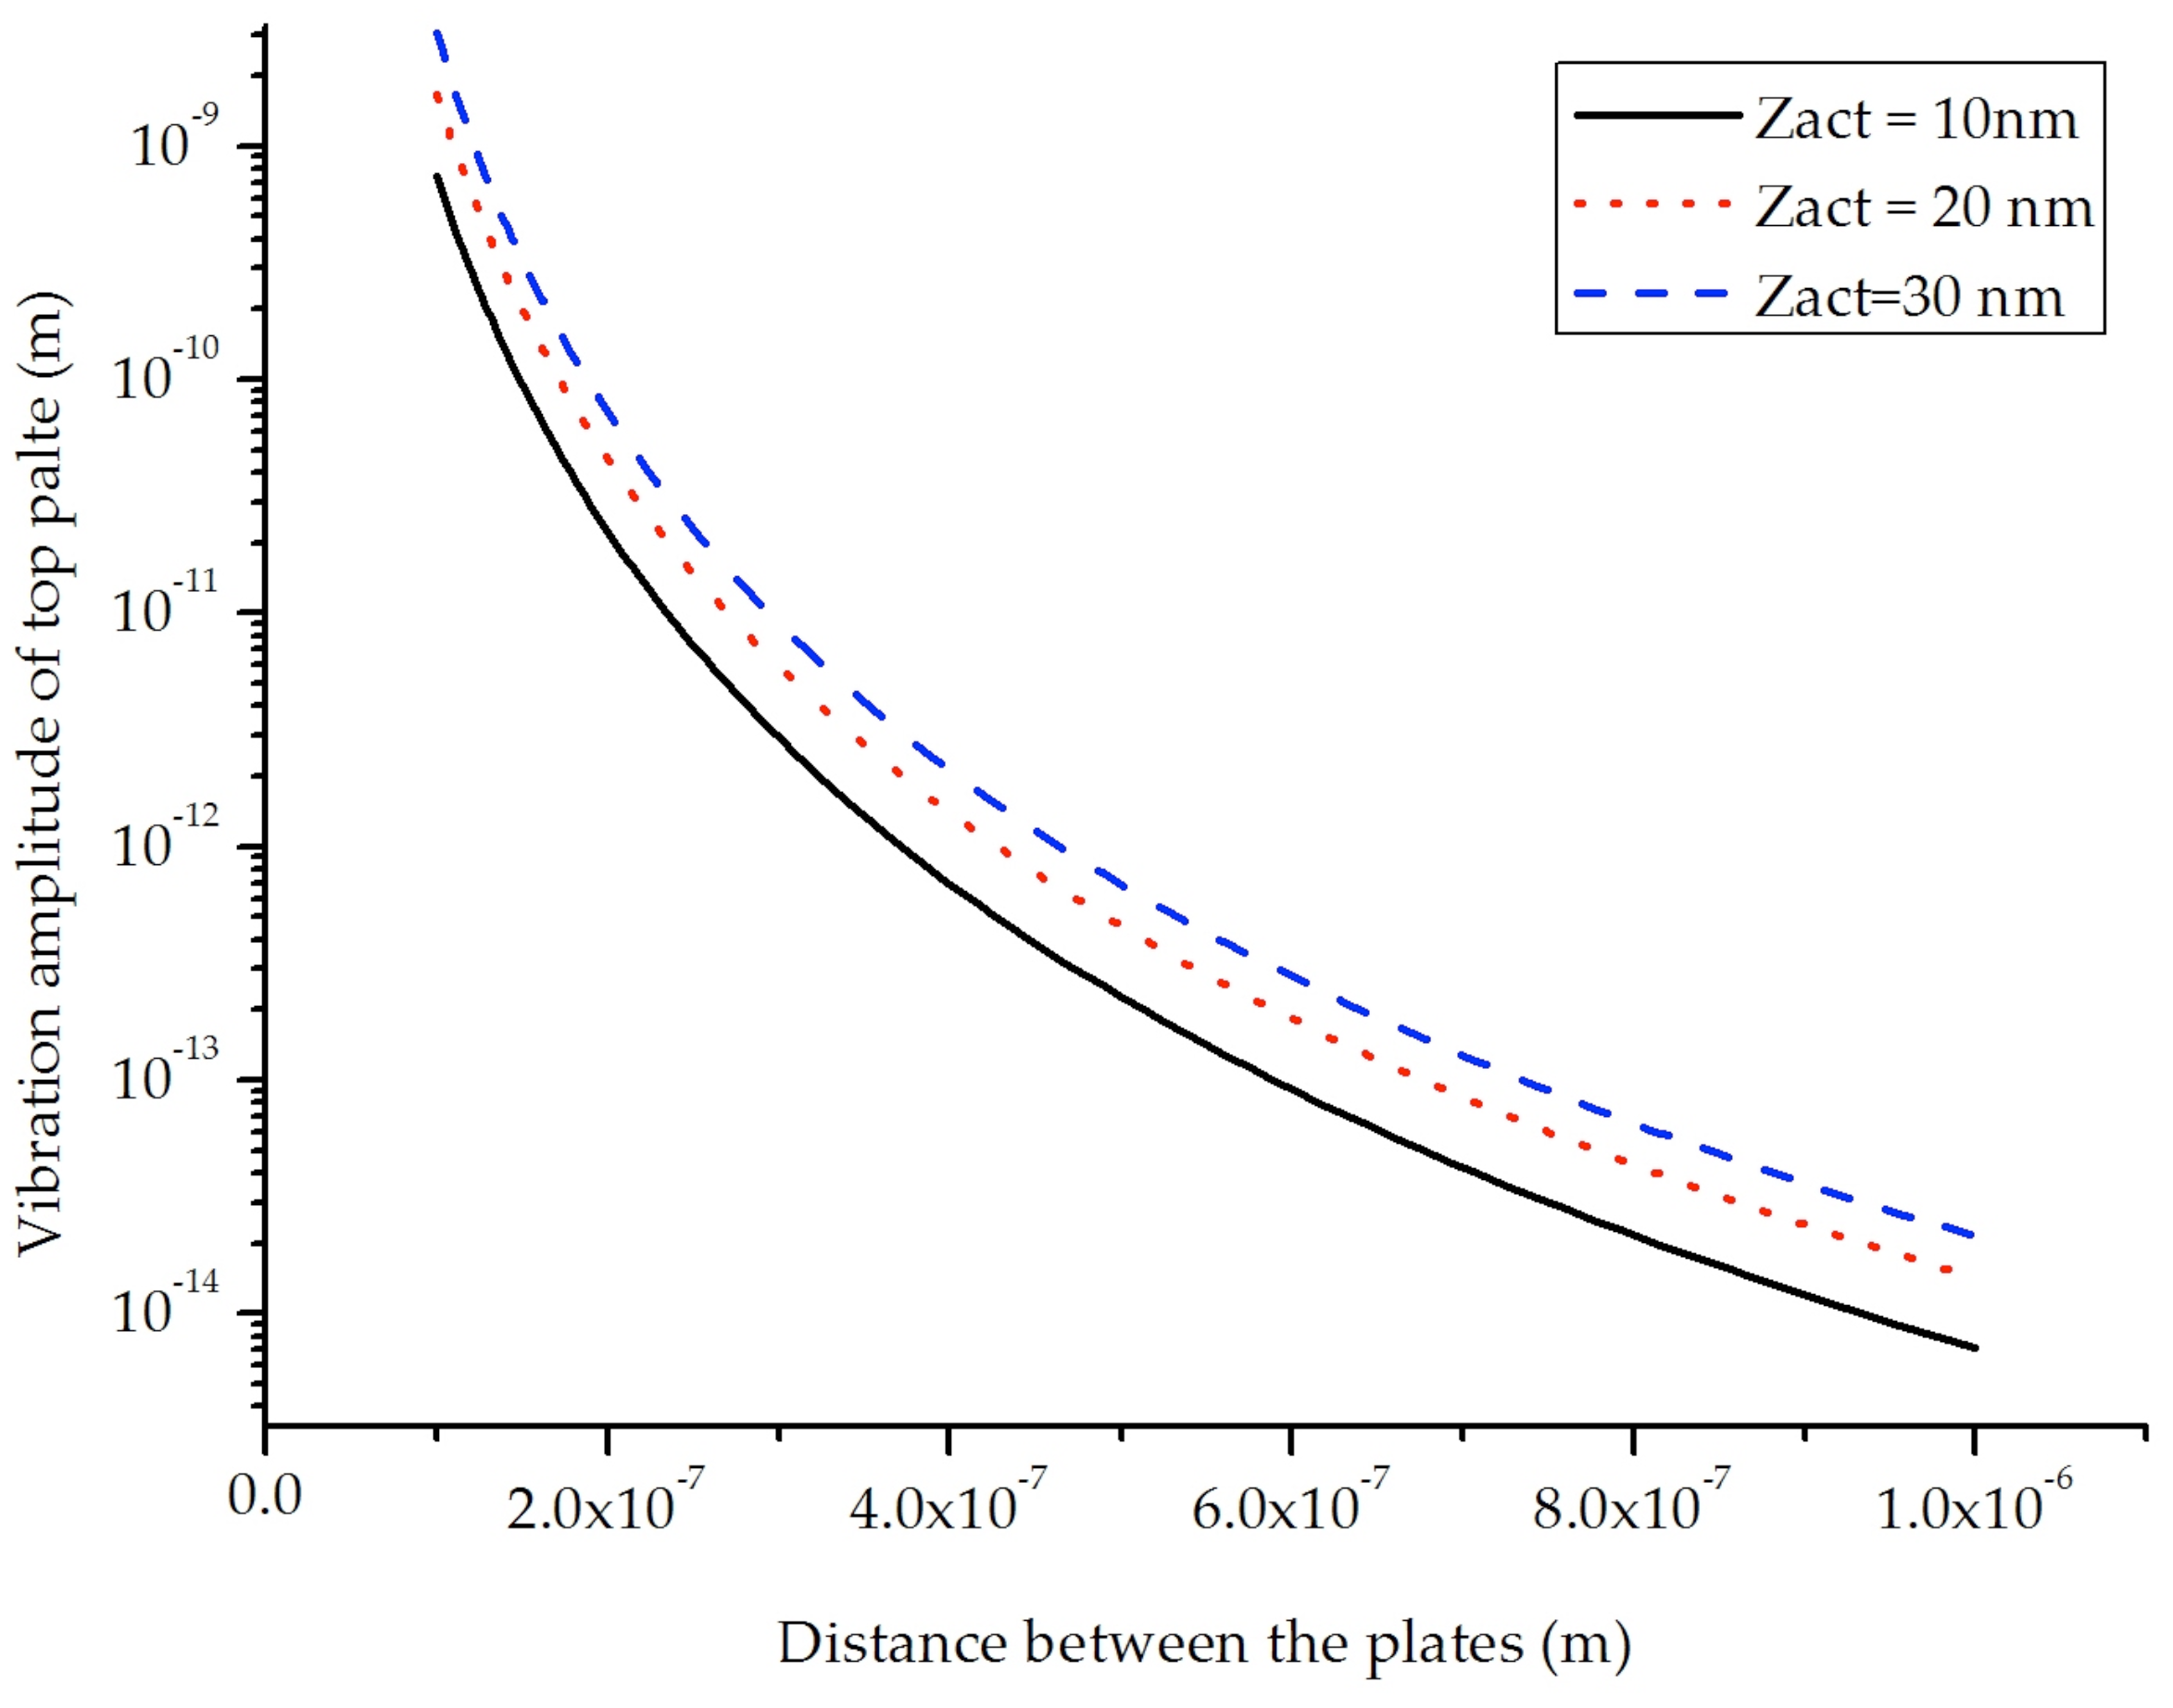
Figure 6 shows the calculated vibration amplitude of the top plate as a function of the average distance
d0 and for three different AC actuation amplitude
zact (10 nm, 20 nm and 30 nm).
From the figure we can conclude that the movement of the top plate is much smaller than zact so that the additional reduction of the plate distance due to this movement can be neglected. We can also see that for separation distances above 500 nm the top plate movement becomes extremely small and difficult to detect.
Figure 6.
Calculated vibration amplitude of top plate as a function of the average distance d0 for three different AC actuation amplitudes.
Figure 6.
Calculated vibration amplitude of top plate as a function of the average distance d0 for three different AC actuation amplitudes.
4.2.2. Nonlinear Behavior and Higher Harmonics
To increase the movement of the top plate, larger actuation amplitude of the bottom plate can be used. However, in that case the top plate movement will no longer be proportional to the bottom plate movement, resulting in the non-linear response as indicated in
Figure 2. In this case, Equations (3), (5) and (6) can still be used to calculate the instantaneous displacement of the top plate as a function of the bottom plate position. Using a sinusoidal actuation signal, the resulting top plate movement as a function of time can be calculated. Next, a Fourier transform gives the amplitudes of the 1st and higher harmonics.
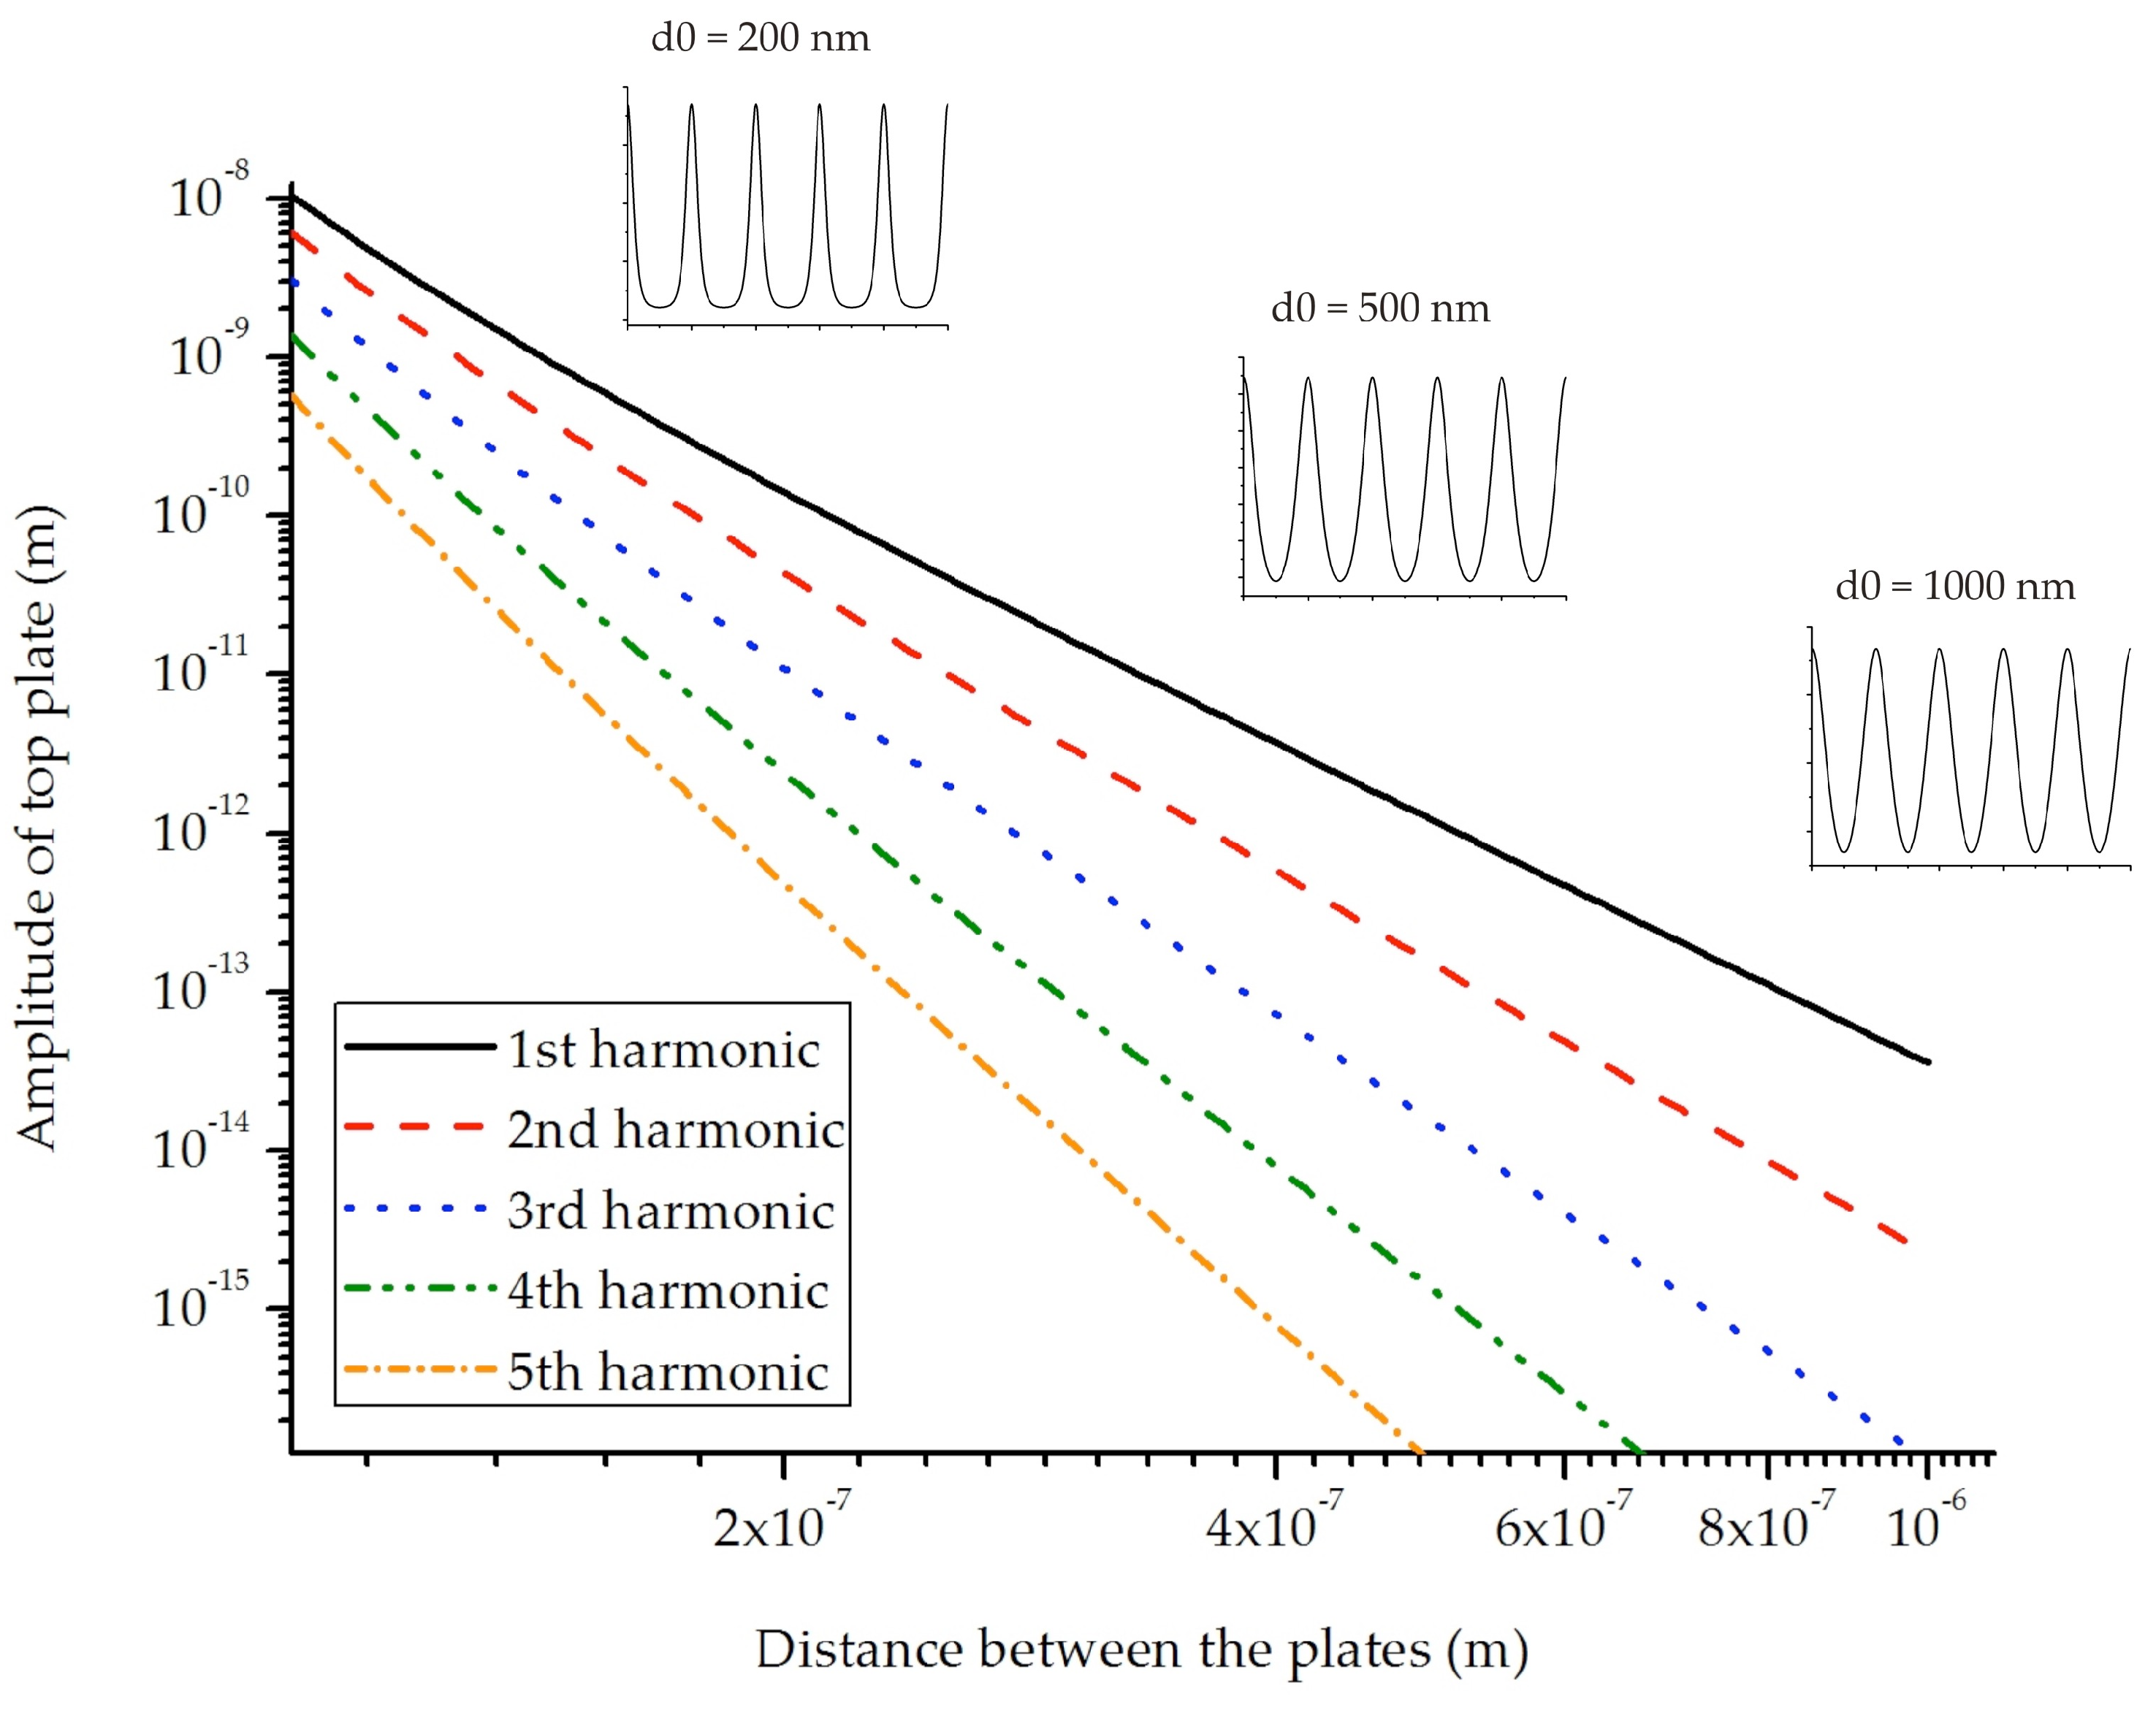
Figure 7 shows the calculated 1st harmonic as a function of separation distance for several actuation amplitudes.
Figure 8 shows the higher harmonics.
Figure 7.
First harmonic of top plate movement for different actuation amplitudes.
Figure 7.
First harmonic of top plate movement for different actuation amplitudes.
Figure 8.
Harmonics of top plate movement for an actuation amplitude of 100 nm.
Figure 8.
Harmonics of top plate movement for an actuation amplitude of 100 nm.
5. Preliminary Results
5.1. Chip Assembly
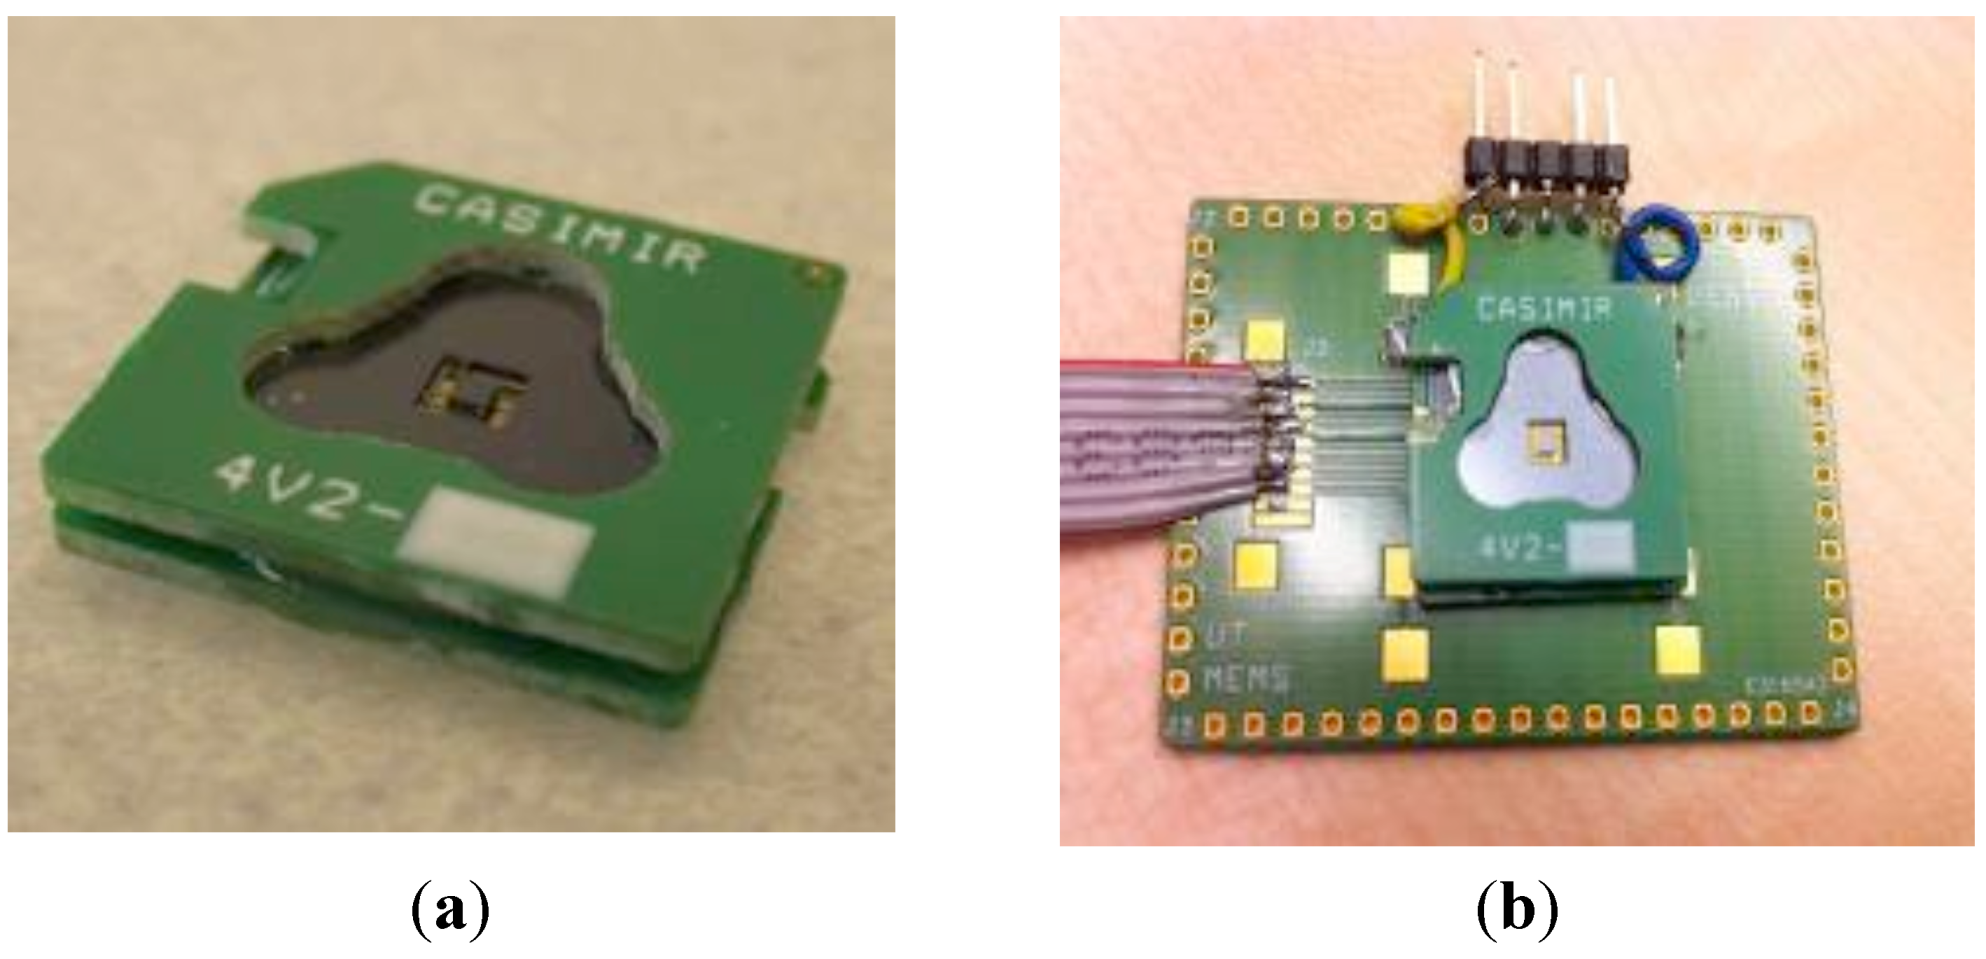
After separation into chips, the device is carefully assembled in a module using thin printed circuit boards (PCB) at either side for connection of the gold electrodes by wire bonding and protection of the fragile spring structures; see
Figure 9(a). The entire module is then mounted on a third PCB containing the piezoelectric actuators; see
Figure 9(b). The piezoelectric actuators are glued to the main PCB and characterized before mounting the sensor module. The piezoelectric actuators allow a displacement in the order of 2 μm at the maximum voltage of 100V, which is sufficient to completely close the gap between the parallel plate structures.
Figure 9.
(a) Photograph showing the silicon chip mounted between two thin PCBs; (b) Complete assembled sensor module.
Figure 9.
(a) Photograph showing the silicon chip mounted between two thin PCBs; (b) Complete assembled sensor module.
5.2. Surface Roughness
The roughness and quality of the deposited gold layer can influence the measured Casimir force significantly. From the earlier experiments, it was observed that surface roughness increases the actual Casimir force, leading to systematic errors in the measurement [
33,
34,
35]. Furthermore, the surface roughness introduces a lower limit on the separation distance in the parallel plate geometry [
36]. Even upon contact, the surfaces are still separated by a distance defined by the roughness of the plates. Therefore, before bonding the plates, the surface roughness was measured using both AFM and white light interferometry, see
Figure 10.
At sub-micron scale the surface roughness is completely defined by the sputtered gold layer as shown by the AFM measurements. Without the gold layer it is below 1 nm, both before and after oxidation. After deposition of the 100 nm thick gold layer it increases to about 3 nm RMS. At larger scale, especially on the plate surface area (1000 × 1000 μm
2), it is seen that the waviness of the silicon surface dominates the roughness which is in the order of 10–20 nm over a distance of 1200 μm. This waviness may result in the non-parallelism of the surfaces under interaction, which may result in the increased Casimir force [
39].
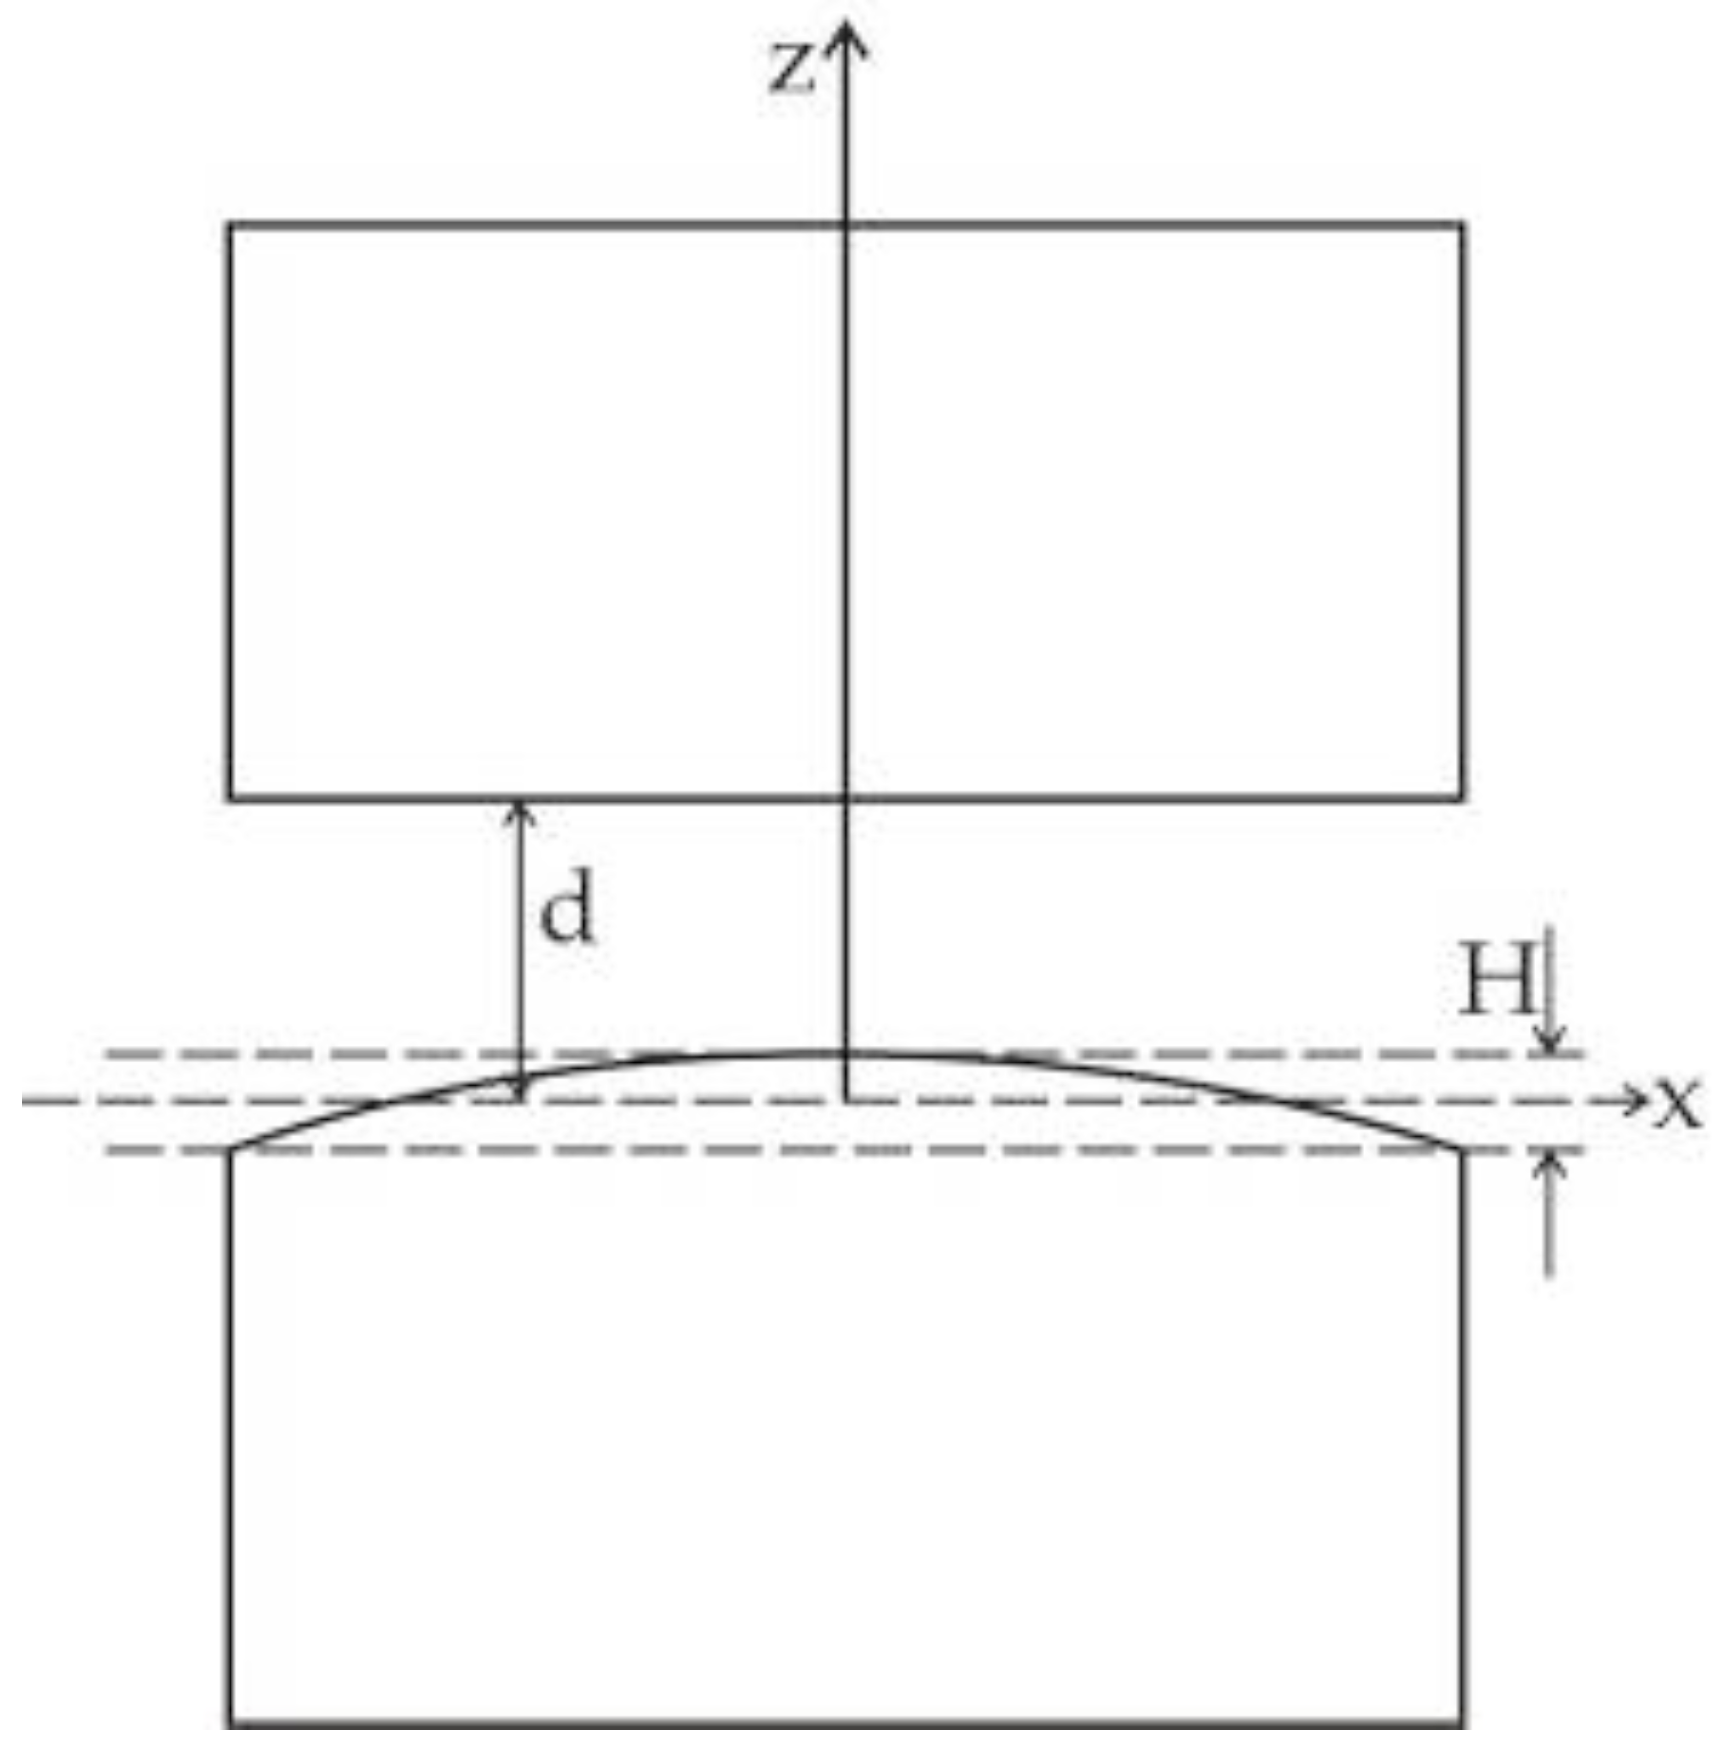
Figure 11 shows the deviation of one of the plates due to inhomogeneties in the plate surface. The Casimir force increases if the split between the surfaces is a convex-convex or concave-concave lens. The force thus reads [
39].
Figure 10.
(a) Surface roughness measurement over a distance of 2 μm using AFM; (b) Waviness over a distance of 1200 μm using White Light Interferometry (WLI).
Figure 10.
(a) Surface roughness measurement over a distance of 2 μm using AFM; (b) Waviness over a distance of 1200 μm using White Light Interferometry (WLI).
Figure 11.
Parallel plate configuration with paraboloidal deviation at one plate [
39].
Figure 11.
Parallel plate configuration with paraboloidal deviation at one plate [
39].
5.3. Preliminary Experimental Verification
Initial experiments were carried out using a Laser Doppler Vibrometer (LDV Polytec MSA-400 Micro System Analyzer) at atmospheric pressure and room temperature. The piezoelectric actuator beneath the lower plate is actuated at relatively low frequency: 1 kHz sine signal with 1 V
pp and the movements of both plates were scanned and measured. As expected, due to the presence of air between the plates, in-phase movement of the plates was observed, with the top plate having exactly the same vibration amplitude as the actuated plate. Next, the setup was placed inside a vacuum chamber that allowed reducing the pressure down to approximately 7 × 10
−6 mbar. The lower plate was actuated again with a 1 V
pp actuation voltage at 1 kHz. In this case, the upper plate vibrated in opposite phase with respect to the lower plate, as shown in
Figure 12. However, the measured vibration amplitude of the upper plate is extremely small, due to the low vibration amplitude of the actuated plate and the large initial separation distance of about 1 μm. The measured vibration amplitude of lower/actuated plate was in the order of 4 nm which resulted in the quite low vibration amplitude of upper/response plate as 0.01 nm.
Figure 12 shows the measured results of both the lower and upper plates.
To tune the separation distance between the plates, a DC bias voltage is applied to the piezoelectric actuator in addition to the AC actuation voltage, resulting in a decreasing distance between the plates. As a result the force between the plates increases, which in turn increases the vibration amplitude of the upper plate. For every increase in bias voltage, due to the CL force the vibration amplitude of the upper plate should increase with d4. Unfortunately, our initial experiments were not sufficient to demonstrate this relation. When the plate separation was reduced this resulted in in-phase movement of the plates, which may be due to insufficient vacuum or the presence of particles on the surfaces. More measurements with new devices are needed to verify the d4 dependency of force.
Figure 12.
Vibrometer measurement results showing (a) the vibration amplitudes of the plates, and (b) the relative phase between them. The measured lower plate amplitude was 4 nm for 1 Vpp which resulted in upper plate vibration amplitude in the order of 0.01 nm.
Figure 12.
Vibrometer measurement results showing (a) the vibration amplitudes of the plates, and (b) the relative phase between them. The measured lower plate amplitude was 4 nm for 1 Vpp which resulted in upper plate vibration amplitude in the order of 0.01 nm.
6. Conclusions
A novel MEMS chip was presented for measuring the Casimir force between parallel plates with tunable separation distance. Much attention was given to the realization of structures with large surface area and sub-micron separation distance. Some first devices were successfully fabricated using a fabrication process based on SOI wafers and wafer bonding using Au-Si eutectic bonding. The wafer bonding process results in devices with initial separation distances in the order of 1–2 µm between the plates, which can be reduced after assembly using piezo actuators. The obtained surface roughness and waviness of the parallel plate structures is in the order of 10–20 nm, which should be sufficient for measurements down to a separation distance of 100 nm.
Initial characterization of the fabricated devices in a vacuum environment indicates that the devices behave as expected. However, actual CL force measurements could not be performed. Already a slight reduction in plate separation resulted in in-phase movement of the plates, which is either due to insufficient vacuum conditions or due to the presence of particles between the plates.
