1. Introduction
Low-Energy District Heating (DH) systems have been defined as the 4th generation DH systems which operate at very low temperatures such as 55 °C in terms of supply and 25 °C in terms of return. Here “low energy” is highlighted as the merit for such DH systems instead of using “low temperature”, because of the great energy savings achieved due to low temperature operation, which shows a greater benefit than the low temperature operation itself [
1,
2]. Low-energy DH systems could become the key energy solution to mediate between the future’s low-energy buildings and renewable energy sources. In addition to the proven benefits of employing DH systems [
3,
4,
5,
6,
7], several advantages can be gained with the low-temperature operation, such as increased efficiency in the production of heat at the source, reduced overall heat loss from the DH system, exploitation of the low grade heat sources, for example low temperature renewable sources and the surplus heat from industry, and lowered thermal stress in the system equipment [
8,
9,
10].
Some studies in this field have presented the conceptual and detailed analysis of utilizing low-energy DH systems. Olsen
et al. and Paulsen
et al. [
9,
10] found that the low-energy DH systems compete well with alternative heating systems in the socio-economic point of view, in which low temperature operation was obtained by means of using substations with an adequate control philosophy adopted in each building. Two pilot projects in operation with low-energy DH systems have been demonstrated in Lystrup, Denmark and in the SSE Greenwatt Way development in Chalvey, UK, their details being given, respectively, in [
1,
2,
9,
10,
11] and in [
8,
12]. Another example can be directed to the geothermal based low-energy DH system which has been in operation at Kırşehir, Turkey, supplying heat to residents with an overall heated area of 180,000 m
2 since 1994. Kırşehir low-energy district heating system has the limitation for the supply temperature which is supplied at 54 °C due to a local source of low grade geothermal field available at a temperature of 57 °C [
13,
14]. More information regarding low-energy DH systems can be found in [
15,
16,
17,
18,
19,
20,
21,
22,
23].
In the studies of Tol
et al. [
24,
25,
26], a pipe dimensioning method was presented for low-energy DH networks with an optimization method formulated to reduce the pipe dimensions of the network as much as possible with the aim of minimizing the heat loss from the DH network. The nonlinear constraint formulated in the optimization algorithm was provided with reducing the diameters of the piping network until the pressure loss in each route of the DH network reaches to the level of the head lift provided from the main pump station. The case study presented in [
24] resulted in a particular optimal solution under a certain level of maximum static pressure being appointed during the design stage of the low-energy DH network. However, one should note that the level of the maximum design static pressure can affect the DH network dimension considerably. Hence the research question of this study was formed with consideration directed to investigating the effect of the maximum design static pressure on the energetic, exergetic, economic, and environmental performance of the low-energy DH network. The parameters such as optimal dimensions of the network, heat loss from the DH network, and pressure loss were considered to show variations each of which was expected to have a different weight. The reason for different expectations for the variation of each parameter is due to the limitations and properties of the pipe types involved, such as the maximum design static pressure limit, the heat insulation class, and the available range of the pipe diameter, each of which may change in accordance with the pipe catalogue considered in the design stage. Hence this study was formulated optimizing the piping network with various levels of maximum static pressure, in order to evaluate the variation of each parameter in question from different perspectives of performance evaluation. The method was carried out for a case area that was given in [
24].
2. Background
The traditional pipe dimensioning methods used so far in the design of DH networks relied on the rule-of-thumb methods which were, most commonly, based on reducing the pipe dimension of each pipe segment of the DH network until reaching the defined criteria limit, whether it is defined as maximum pressure gradient, as maximum velocity of the heat carrier medium, or as simultaneous consideration of both [
27,
28,
29]. However, in [
24] it was found that lower pipe dimensions could be achieved by means of the optimization method in question compared to the pipe dimensions observed with the traditional rule-of-thumb methods, based on using the maximum pressure gradient as the maximum limit. Although another dimensioning method was formed on the basis of the rule-of-thumb—but in this case distinctive maximum pressure gradient limits were defined, each specific to one of the routes—the over-dimensioning of the piping network could not be avoided [
24].
The heat requirement of a consumer can be met as soon as the substation equipped in the consumer site is provided with adequate levels of supply temperature and of pressure difference between the supply and the return line, their values being defined in accordance with the configuration of the substation of each consumer. The heat carrier medium circulates in the DH network, which is basically a closed loop both in the formation of layouts as branched (tree-like) or as looped [
18,
27,
30]. This study deals with a branched type DH network formed in the case district.
3. Description of the Case Area
The Trekroner area located in Roskilde, Denmark, was studied in order to evaluate the effect of the pressure levels appointed in the design stage of the DH network on the resultant optimal pipe dimensions. The overall length of the DH piping network was found to be 1.2 km, supplying heat to 165 single family houses. The heat demand of each house was defined as 2.9 kW for space heating and 3 kW for domestic hot water requirement with a storage tank of 120 litres equipped in the substation of the house. More details regarding the substation can be found in [
1,
2,
9,
10,
11,
15,
24,
31,
32,
33,
34].
The duration curve of heat load given for the low-energy DH system located in Lystrup, Denmark [
11] was used to derive the annual hours of operation together with the partial load of the requiring overall flow defined on the basis of heat load factors given in
Table 1.
Table 1.
The heat load factors with duration of occurrence for Lystrup, Denmark [
11].
Table 1.
The heat load factors with duration of occurrence for Lystrup, Denmark [11].
| Parameters | Units | Annual Periods |
| Heat Load Factor | - | 1.00 | 0.89 | 0.74 | 0.53 | 0.40 | 0.30 | 0.17 | 0.07 |
| Duration | h | 8 | 19 | 111 | 653 | 1724 | 1399 | 1565 | 3281 |
In the calculations regarding the yearly operation of the low-energy DH network, heat load factors were used to account for defining the mass flow rates required in the periods that are lower in heat demand than the peak period. It should be noted that supply temperature through the whole network has to be maintained at 55 °C. However the return temperature does not show a significant variation for different values of heat load factors
i.e., the return temperature showed a variation at 25.4 ± 0.29 in case of a heat load factor of 0.75 and at 28.6 ± 0.92 in case of a heat load factor of 0.25; data taken from [
18,
24]. Hence the supply and return temperatures were defined as constant at 55 °C and 25 °C, respectively, throughout the whole year period.
4. Methods
The methods in this section describe the calculations and evaluations considered in the case study given in this paper. It should be noted that each district has to be dimensioned and investigated individually by following the methods given but in accordance with the design conditions of the district and with the commercially available catalogues.
4.1. Optimization
The mass flow demand of each house was used as input value to the optimization method instead of using heat demand values due to the fixed temperature operation at 55 °C for supply and at 25 °C for return. The required mass flow rate on each pipe segment was considered with a simultaneity factor, its value based on the cumulative number of consumers to which the pipe segment supplies heat. Once determined, the mass flow rate on each pipe segment was kept constant for each level of the maximum static pressure. The dimensioning of the DH network was carried out with the optimization method that was presented in [
24], its modified form to be used in this study being shown in Equation (1).
Subject to the constraints:
The static pressure of a DH network has to be provided with a certain level above atmospheric pressure. Hence in this way it can be guaranteed that each pipe segment is full with the heat carrier medium and that the heat carrier medium does not boil in locally-lower-pressure (than atmospheric pressure) sites through the DH network, avoiding any possible cavitation. The reason for the latter is due to the boiling temperature of water varying according to the pressure level. The static pressure for the whole DH network can be managed by means of a pressure vessel that keeps the DH network pressurized with a certain amount of holding pressure [
35]. The holding pressure was defined as 1.5 bara (the unit bara refers to the absolute pressure) for this case area. Maximum allowable pressure loss value was therefore defined by use of Equation (2) for each maximum static pressure values defined. The pressure loss through the house connection branch and the substation was defined as 0.5 bara at maximum [
10,
15,
26].
where
∆PMax,k is the maximum pressure loss for the routes of the DH network (bar),
SPMax,k refers to the maximum static pressure [bara] for the scenario
k (
Table 2),
Ph is holding pressure (bara), and
Ps is pressure loss occurring through the substation and house connection branch (bar).
Table 2.
Maximum Static Pressure Values Appointed in the Design Stage (bara).
Table 2.
Maximum Static Pressure Values Appointed in the Design Stage (bara).
| SPMax,1 | SPMax,2 | SPMax,3 | SPMax,4 | SPMax,5 | SPMax,6 |
| 4 | 6 | 8 | 10 | 15 | 25 |
The maximum static pressure is a major limitation while employing the instruments such as valves, gages, and meters; and the pipes at the DH network,
i.e., AluFlex twin pipes have a design pressure limit of 10 bara. However, AluFlex twin pipes were privileged in the optimization algorithm due to their heat saving potential. Therefore the optimization algorithm was carried out with only steel twin pipes when the maximum static pressure values exceeded the 10 bara limit (
Table 3).
Table 3.
The range of the nominal diameter in the unit (mm) applicable under the constraint of the design maximum static pressure limit for the pipe types involved.
Table 3.
The range of the nominal diameter in the unit (mm) applicable under the constraint of the design maximum static pressure limit for the pipe types involved.
| Pipe Types | Maximum Static Pressure Levels (bara) |
| ≤10 | >10 |
| AluFlex Twin Pipe | 10–26 | - |
| Steel Twin Pipe | 37.2–82.5 | 21.9–82.5 |
The overall heat loss from the DH network was calculated by using Equation (3) in which the heat loss coefficient values are being derived by means of the multi-regression applied on the data retrieved from the commercial software LOGSTOR calculator [
36], as shown in Equation (4).
where
![Challenges 04 00001 i004]()
refers to the overall heat loss from the DH network (W), calculated with the multiplication of the length
L [m] and of the heat loss coefficient
uL (W/m) for a pipe segment
pi-1,i.
The heat loss coefficient data can be found by using Equation (4), which was derived by means of the multi-regression method carried out in the basis of parameters such as: (i) the pipe diameter range given in
Table 3; (ii) the insulation class chosen as Series 2 for the twin-pipes; and (iii) the application limit that the twin pipes have direct contact with the surrounding soil [
36].
where T is the temperature (°C) with the subscripts S, R, and G indicating the temperatures of supply, return, and ground, respectively; and d is the inner diameter of the pipe segment (mm).
4.2. Evaluation Methods
The optimal pipe dimensions found by use of the optimization algorithm in question was later assessed from different perspectives, such as: (i) the energy; and (ii) the exergy loss evaluation considered with the annual heat loss from the district heating network and the annual pump electricity consumption; (iii) the economic impact of the investment costs involving of constructing the pipe network and employing pipe and the operating costs regarding the heat loss from the network and pump consumption; and (iv) the environmental impact of varying losses in two energy forms.
4.2.1. Exergy Measures
The exergy is a measure of the quality of an energy form [
37,
38,
39]. In this study the evaluation was carried out with the exergetic values of both losses, one being the overall heat loss from the DH network and the second being the pump electricity consumption observed as a result of the optimizations that were carried out with differing maximum static pressure. These two different energy forms can be compared on equal terms by their exergy values that can be found by means of exergetic factors, given as 0.17 and as 1 (both in the unit of (MJ
ex/MJ
en)) for heat energy form, and for electricity, respectively, by [
39]. For example, heat loss energy of 100 MJ
en corresponds to an exergy value of 17 MJ
ex by employing the aforementioned exergetic factor for the energy form of heat, while in the case of electricity energy 100 MJ
en corresponds to 100 MJ
ex. The reason behind this is because electrical energy is a pure form of energy. The exergy value of each annual energy losses—one with respect to the heat loss from the DH network and the other to pump electricity consumption—was obtained to provide the basis for having an equal quality term to be used in the assessment of the exergy measures.
4.2.2. Economic Investigation
The economic cost calculations involved the investment costs of the pump and piping network and with the operating costs of heat loss from the DH network and the pumping power consumption, all of which vary with the changing values of maximum static pressure appointed in the design stage of the low-energy DH network.
The operating costs were calculated from two aspects: (i) the heat loss from the DH network and (ii) the pumping power consumption. The specific cost data was considered with the projections of the heat price for natural gas and of the electricity price that was reported for a period of 20 years by ENS (the report can be found in [
40]). The future costs related to losses (excluding the common cost such as the production of the heat due to it being same for each analysis) were brought to their present value by means of the Net Present Value (NPV) equation considering an interest rate value of 1.29% that was taken for Denmark from [
41]. The investment costs were calculated considering the DH piping network and the pump, their specific cost data being taken from, respectively [
9,
42].
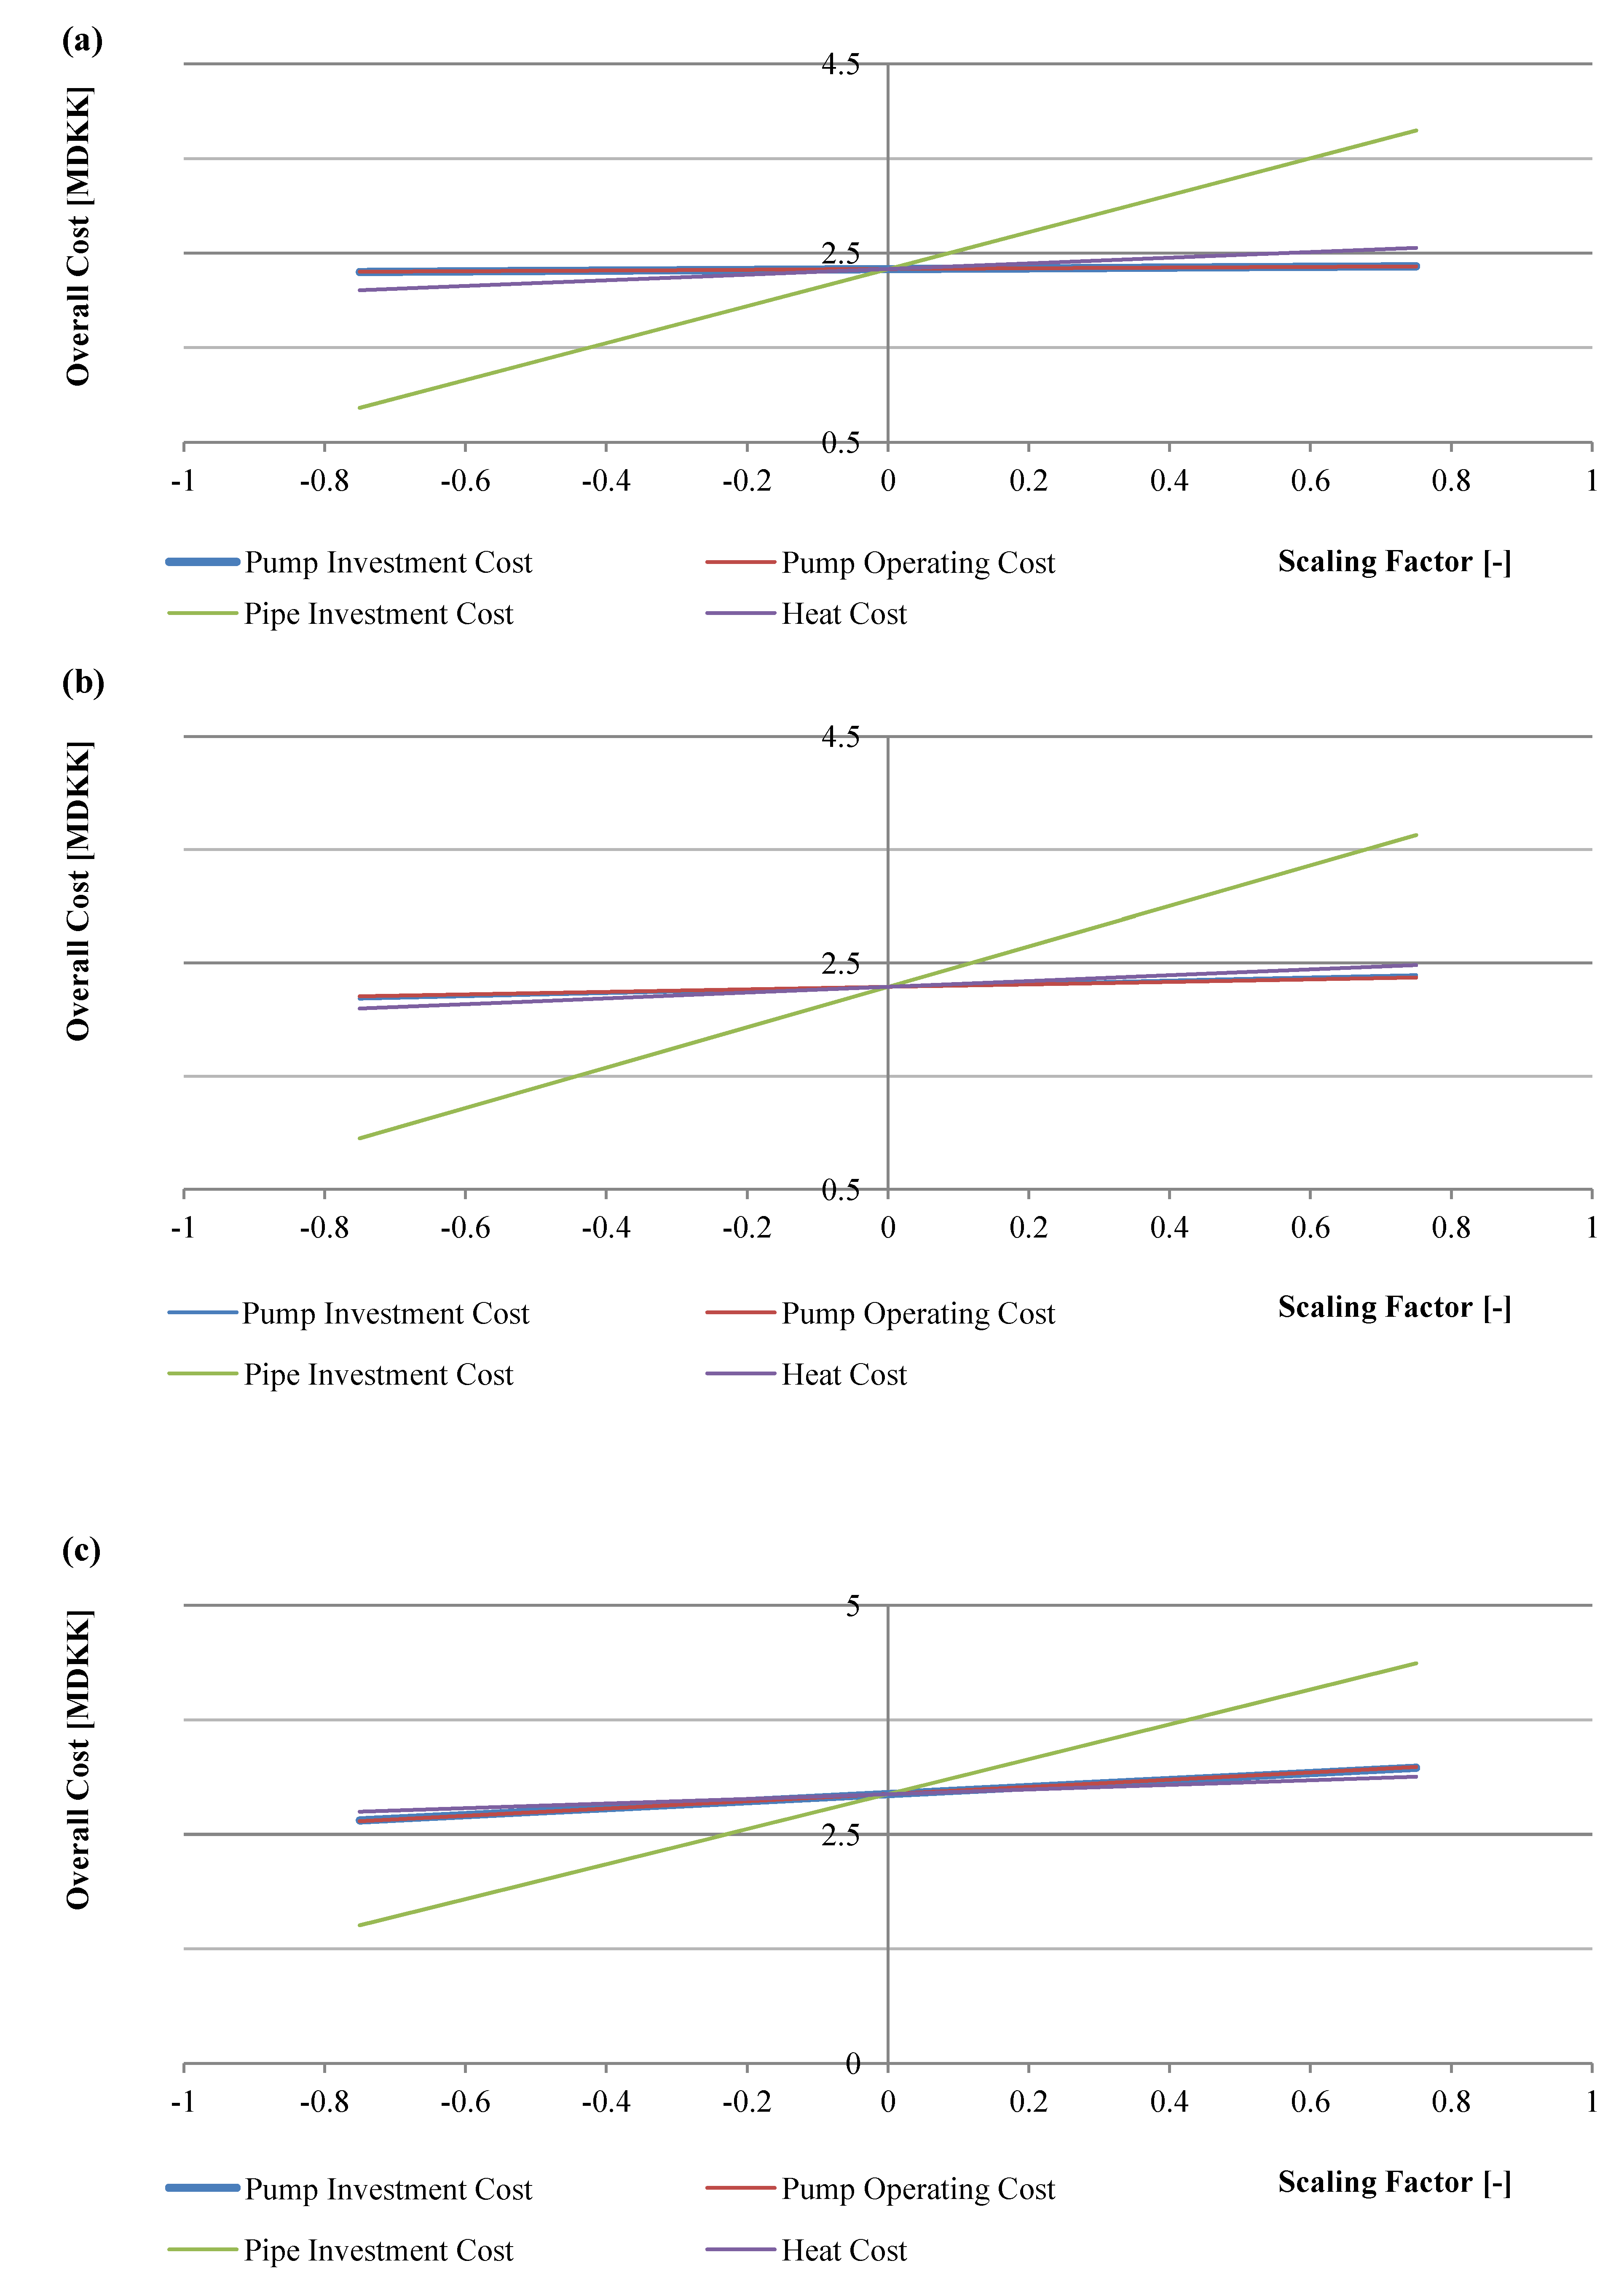
A sensitivity analysis was performed with respect to the specific prices of heat and electricity regarding the future operating costs, and of pipe and pump regarding the investment costs, in order to evaluate the impact of all specific cost data on the overall cost of the low-energy DH network [
43]. The sensitivity analysis was performed with various values appointed for each specific cost data. The appointed values defined for each specific cost data were determined by means of scaling factors ranging between −0.75 and +0.75 with an interval value of 0.25.
4.2.3. Environmental Impact
The environmental impact was also investigated for various values of the maximum static pressure appointed in the design stage of the low-energy DH network. The specific emission data based on the analysis reported for 2010 by CTR, Københanvs E, and VEKS was used in the calculations in [
44], shown in
Table 4.
Table 4.
Specific emission data for the productions of DH and of electricity in the case of Copenhagen, Denmark (mg/kWh (except CO
2)) [
44].
Table 4.
Specific emission data for the productions of DH and of electricity in the case of Copenhagen, Denmark (mg/kWh (except CO2)) [44].
| | DH | Electricity |
| CO2 | 133 * | 502 * |
| CH4 | 13 | 272 |
| N2O | 3 | 7 |
| SO2 | 18 | 93 |
| NOx | 135 | 401 |
| CO | 80 | 188 |
| Unburned Hydrocarbon | 6 | 56 |
| Particle | 7 | 12 |
5. Results
In this paper, the DH piping network was dimensioned by means of the optimization method (details described in
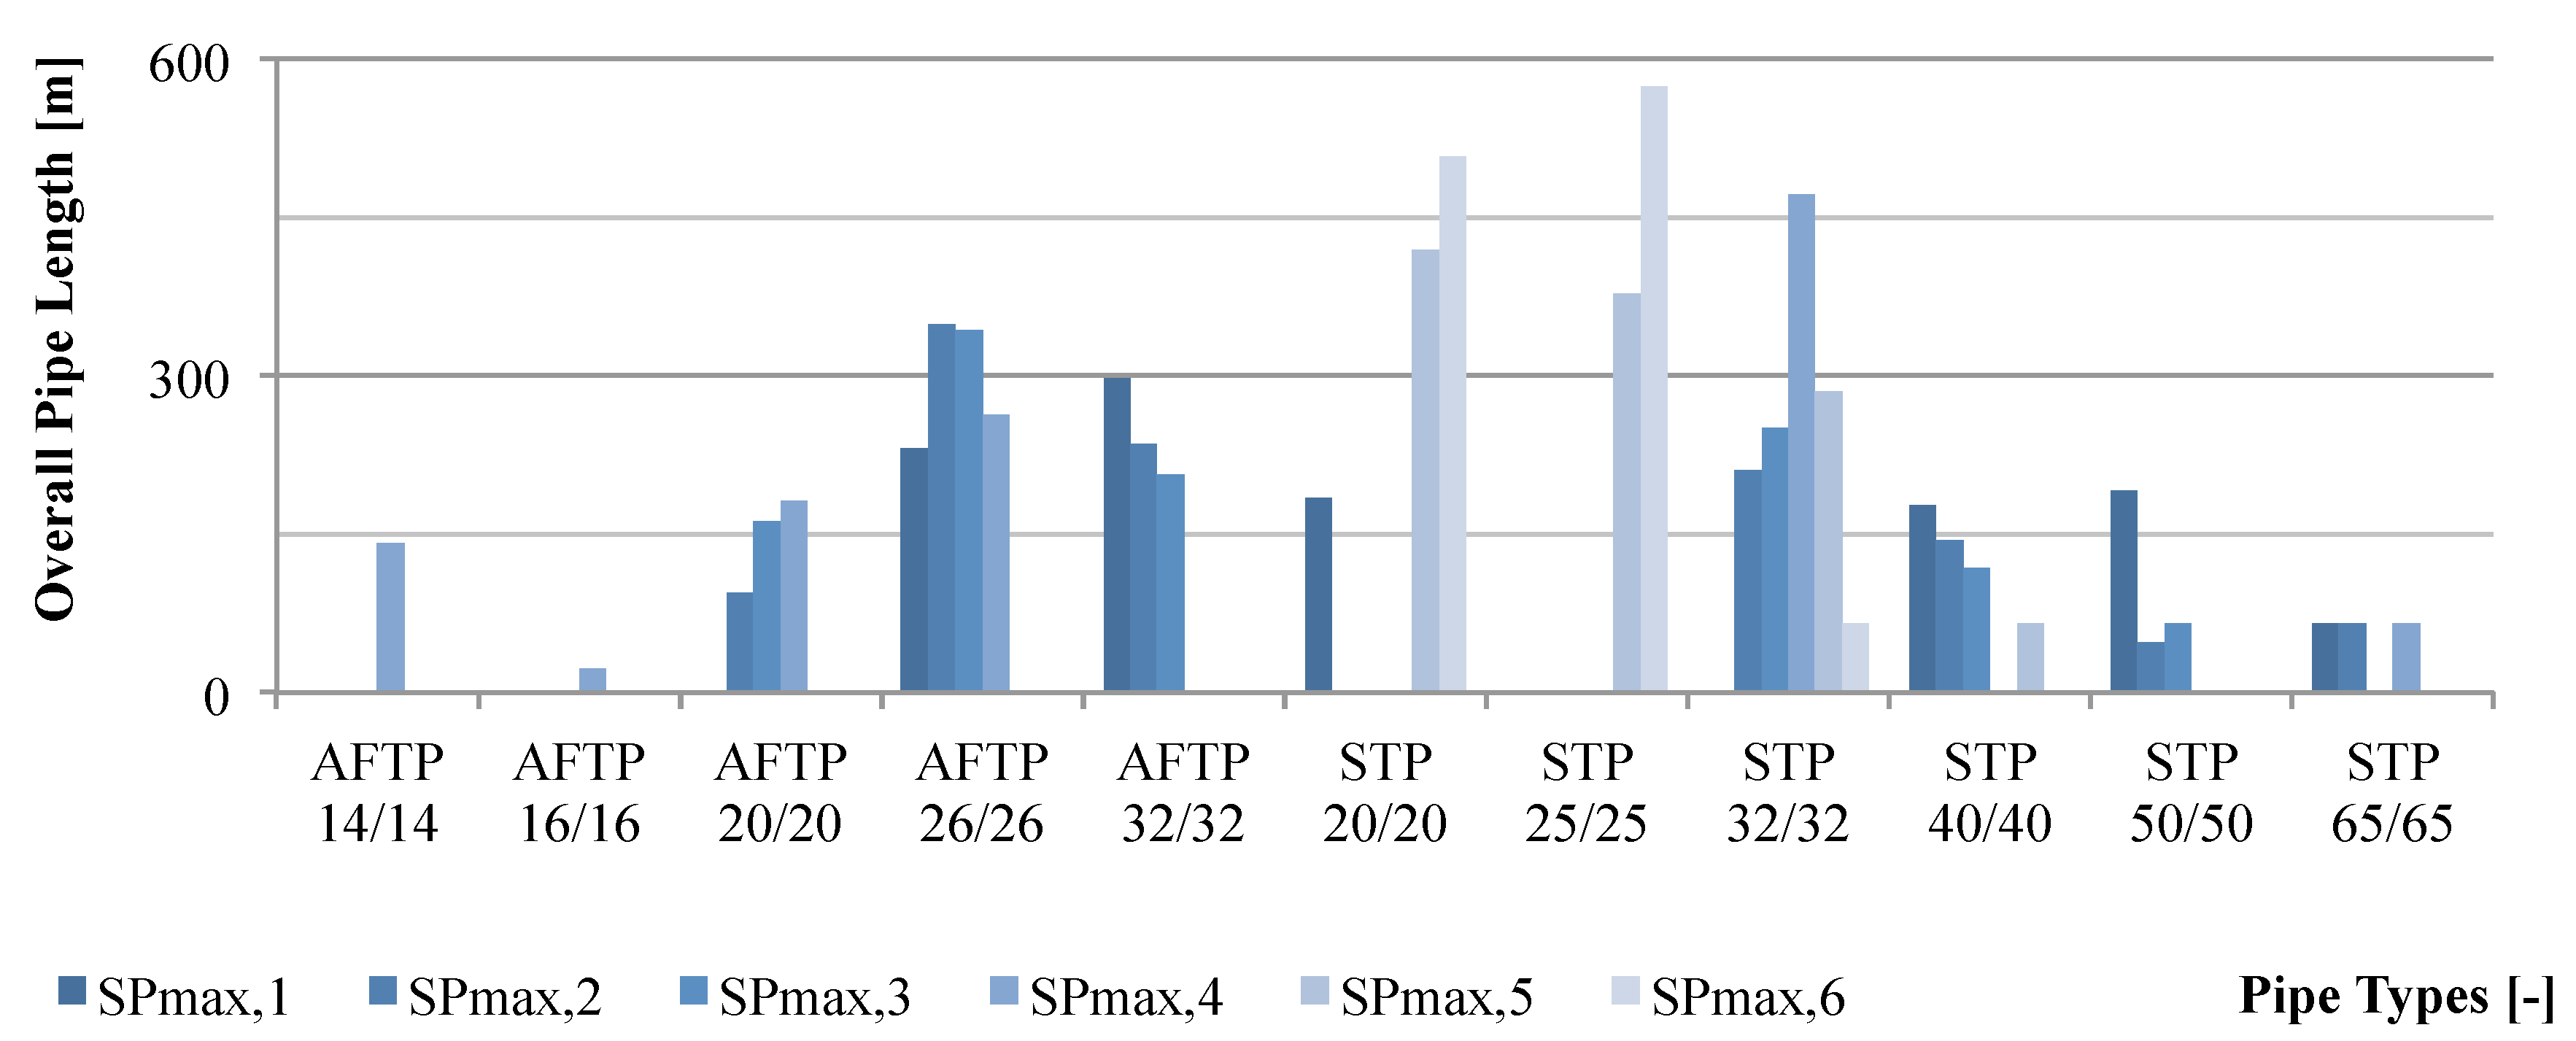
Section 4.1.) with different values of the maximum static pressure defined in the design stage. The resultant pipe dimensions were examined in terms of the exergetic values of the losses due to overall heat loss from the DH network and pump power consumption. The overall length of the resulting pipe diameters is shown in
Figure 1 (In
Figure 1; AFTP refers to AluFlex Twin Pipe and STP to Steel Twin Pipe while the numbering in the label shows the nominal diameters of the inner pipes carrying the heat carrier medium,
i.e., 14/14 has two inner pipes each of which has a nominal diameter of 14 mm).
Figure 1.
Pipe diameters as obtained for differing values of maximum design static pressure values.
Figure 1.
Pipe diameters as obtained for differing values of maximum design static pressure values.
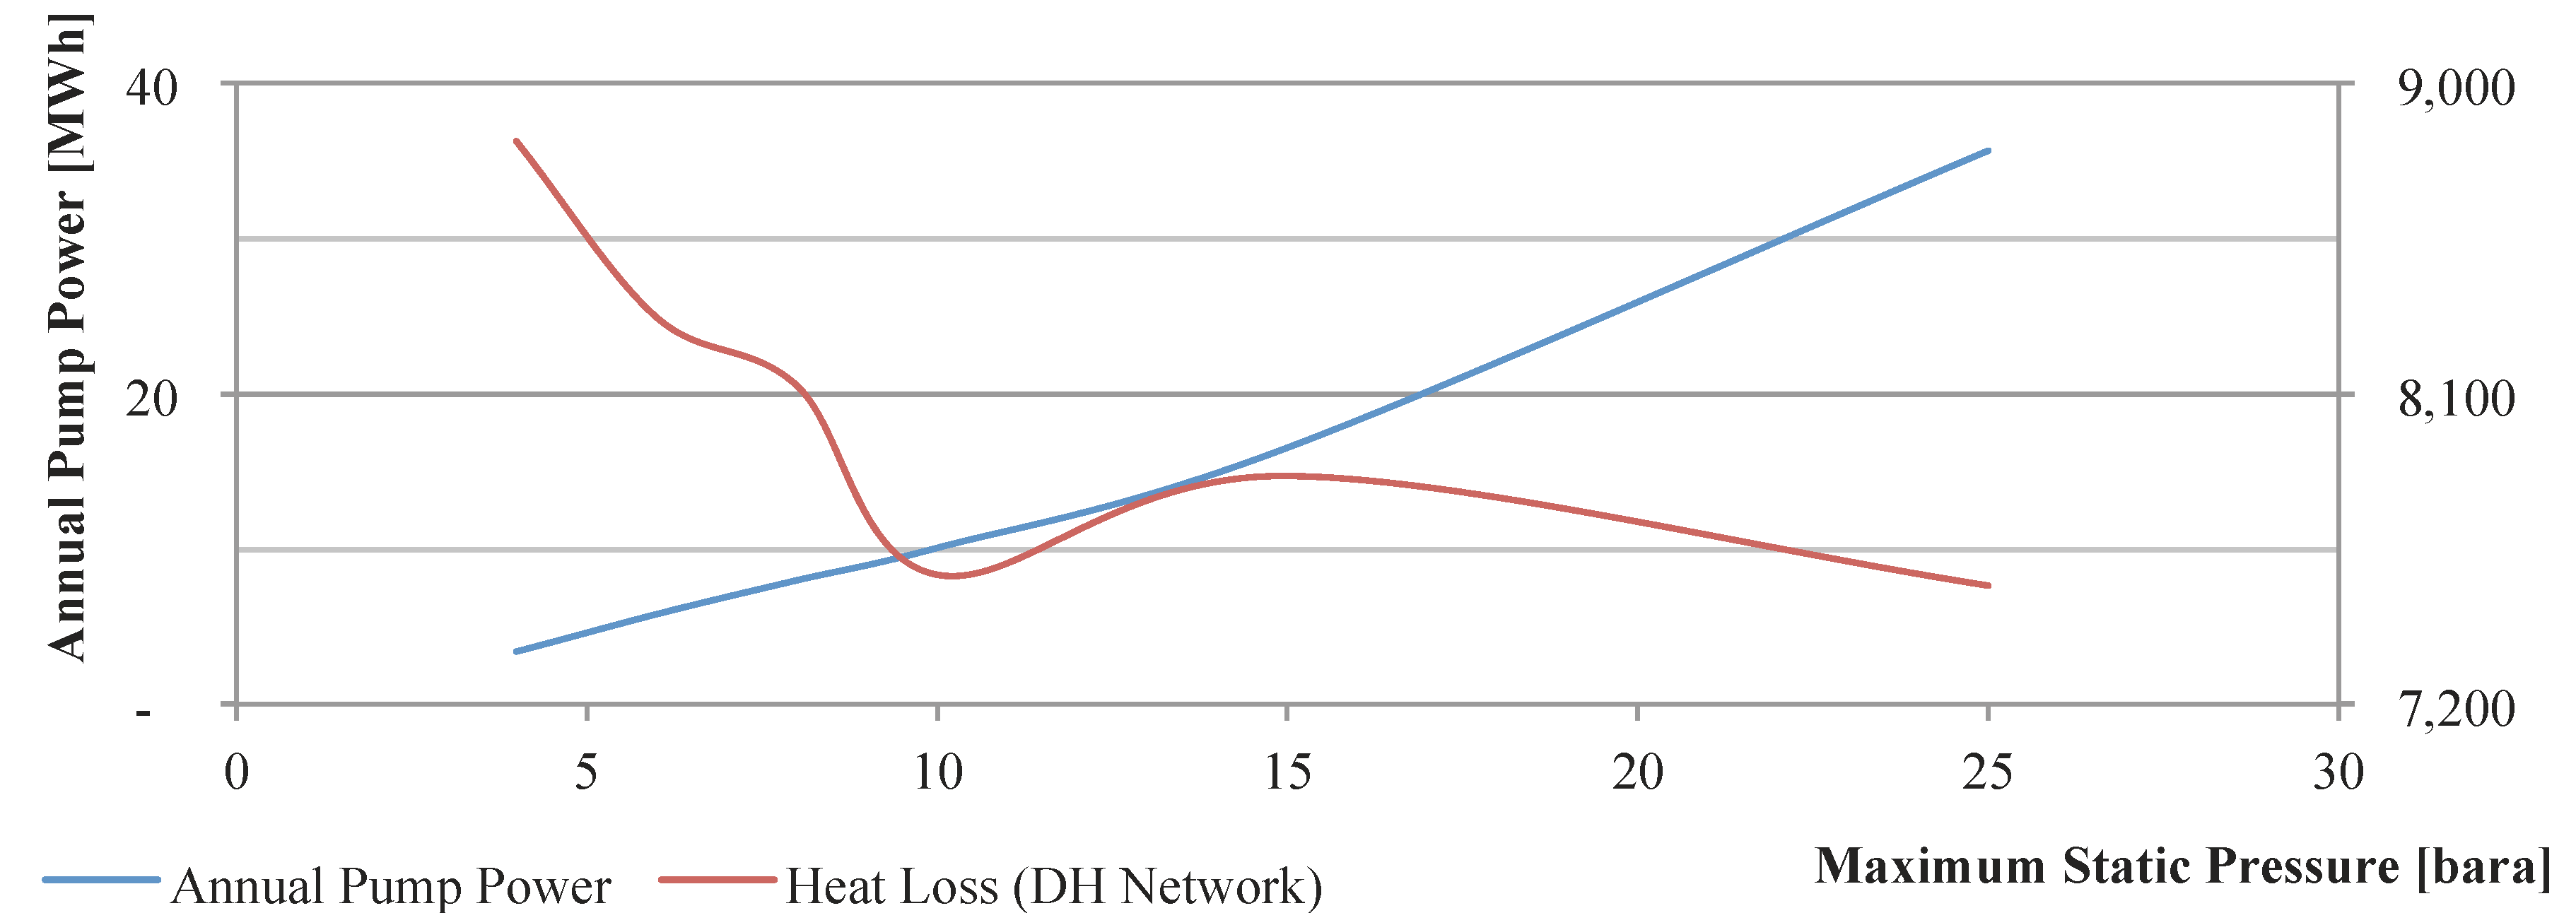
The annual pump electricity consumption and the overall heat loss of the DH network were obtained in terms of energy as shown in
Table 5, the annual operation of DH system being based on the load duration data given in
Table 1.
Table 5.
The annual pump power consumption and the overall heat loss, as obtained for differing maximum design static pressure.
Table 5.
The annual pump power consumption and the overall heat loss, as obtained for differing maximum design static pressure.
| Parameters | Unit | Maximum Static Pressure Levels Defined |
| Max. Static Pressure | bara | SPmax,1 | SPmax,2 | SPmax,3 | SPmax,4 | SPmax,5 | SPmax,6 |
| Annual Pump Electricity Consumption | MWh | 3.4 | 5.8 | 8.0 | 10.1 | 16.6 | 35.6 |
| Annual Overall Heat Loss | MWh | 51,964 | 48,950 | 47,788 | 44,564 | 46,249 | 44,379 |
The comparison of the annual pump electricity consumption and the overall heat loss from the DH network was performed with respect to their exergy values, as shown in
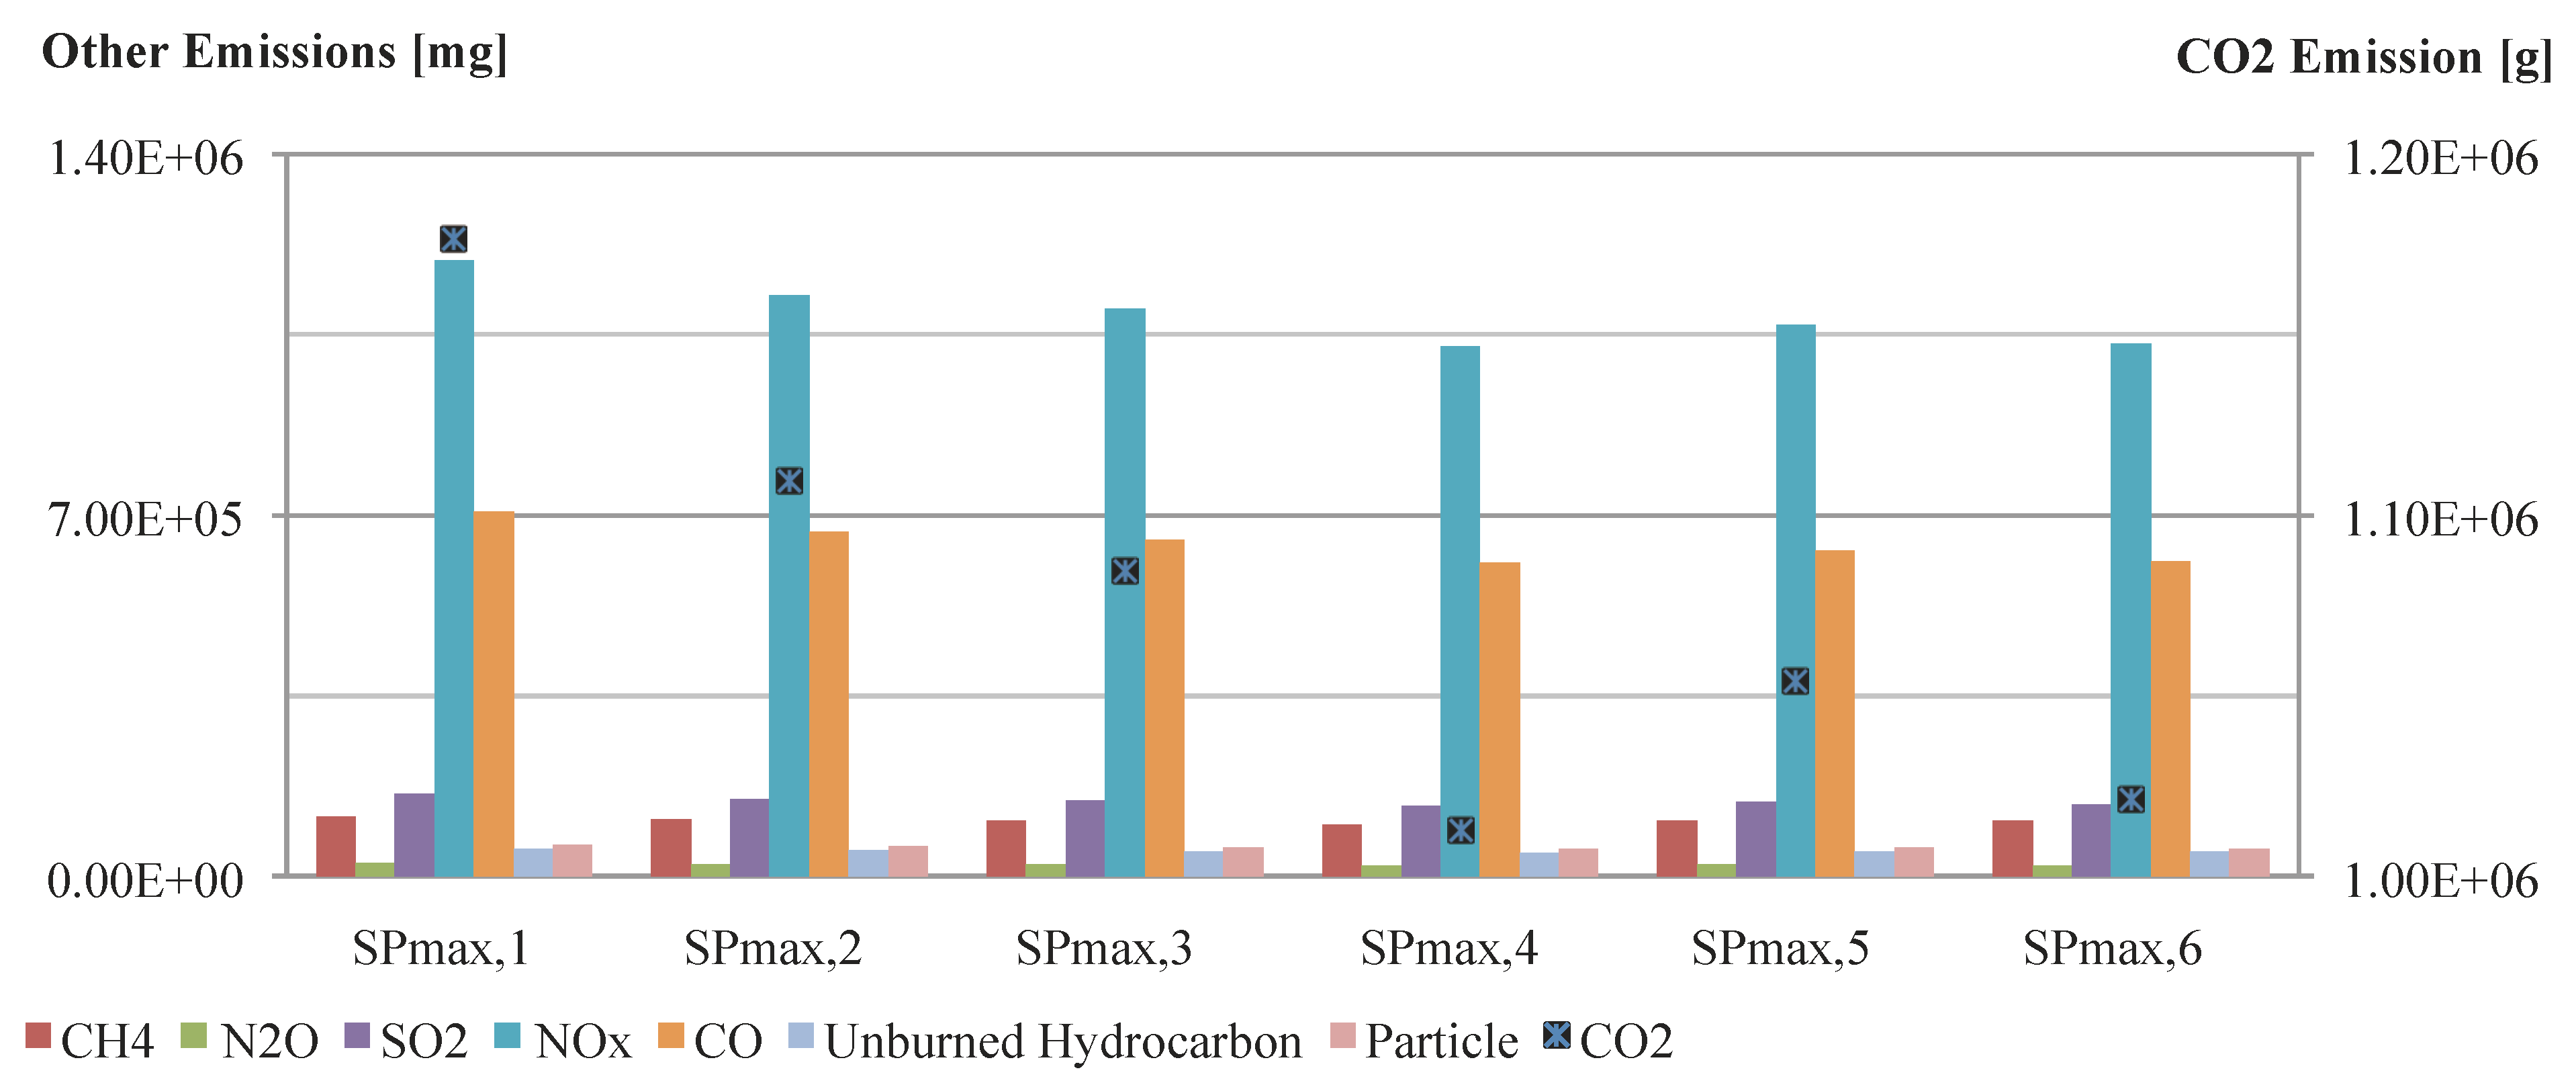
Figure 2. The environmental impact of differing maximum design static pressure is shown in
Figure 3.
Figure 2.
Exergy values as obtained for the annual pump electricity consumption and for the overall heat loss from the DH network.
Figure 2.
Exergy values as obtained for the annual pump electricity consumption and for the overall heat loss from the DH network.
Figure 3.
The environmental impact of DH system in differing maximum static pressure values.
Figure 3.
The environmental impact of DH system in differing maximum static pressure values.
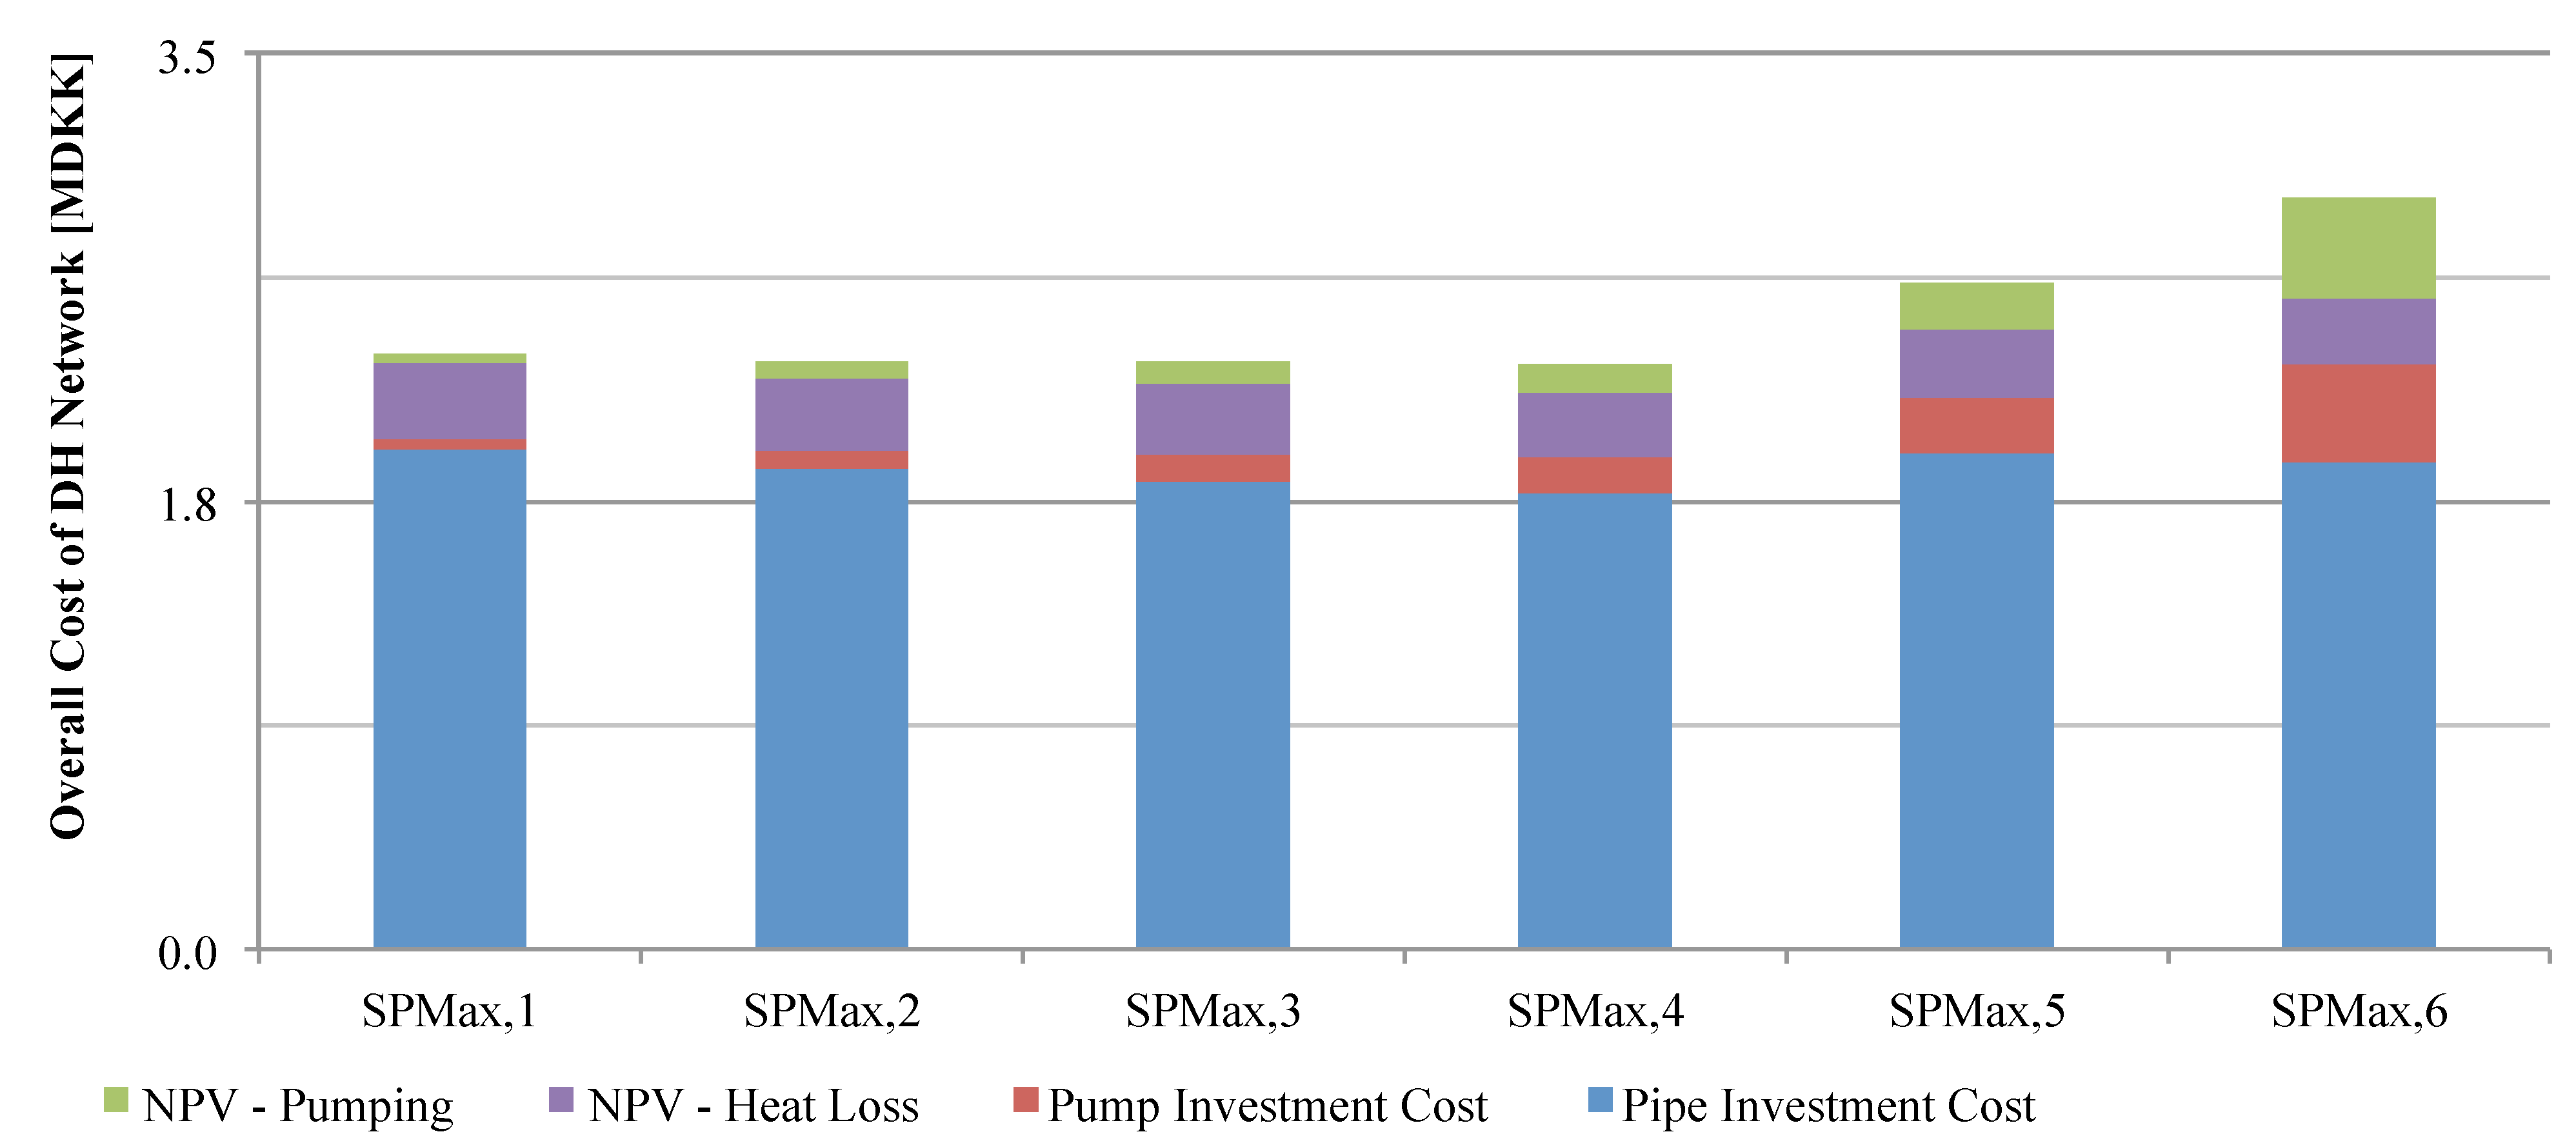
The economic comparison involving the investment costs for the piping network, the pump equipment and the operating costs related to the heat loss from the DH network, and the pumping electricity consumption is shown in
Figure 4. It should be noted that the cost of the heat requirement that is equivalent to the heat demand of all houses in the district is the same for each analysis considered with different static pressure values, which was found to be 0.241 MDKK (Million Danish Kroner) in case the heat is produced by means of natural gas (excluding the efficiency of the heat production plant). The heat supply needed to satisfy the heat demand of all houses in the district has to considered with the heat loss from the DH network,
i.e., the heat supply is equal to the overall heat requirement plus the heat loss from the DH network.
Figure 4.
The comparison of the overall costs of the DH system with differing maximum static pressure values (the labels refer to the increment ratio compared to the reference case SPMax,4).
Figure 4.
The comparison of the overall costs of the DH system with differing maximum static pressure values (the labels refer to the increment ratio compared to the reference case SPMax,4).
The sensitivity analysis was presented for three scenarios of SP
Max,1, SP
Max,4 and SP
Max,6, as shown in
Figure 5.
Figure 5.
The sensitivity analysis with respect to specific cost data observed for various maximum static pressures obtained for: (a) SPMax,1, (b) SPMax,4 and (c) SPMax,6.
Figure 5.
The sensitivity analysis with respect to specific cost data observed for various maximum static pressures obtained for: (a) SPMax,1, (b) SPMax,4 and (c) SPMax,6.
It was observed that the main pipe segments (the first-order pipe segment supplied by the heat source and the second-order pipe segments in the following sequential pipe) were observed with high velocity levels up to 3.8 m/s for the first-order pipe segments and up to 3.37 m/s for the second-order pipe segments for the coldest peak winter period in scenario SPMax,6.
6. Discussion
This study analyses the effect of different pressure levels on the pipe dimensioning of a low-energy DH network, with regard to Trekroner, a suburban area located in the Municipality of Roskilde in Denmark.
The same layout of low-energy DH network defined with a similar input of mass flow rate requirements was dimensioned using the same optimization method. The differing values of maximum static pressure appointed in the design stage of the DH network resulted in different optimal solutions, each of which obtained with varying overall lengths of the pipe types involved (
Figure 1). Two reasons were found when addressing this issue: (i) the limitation of employing AluFlex twin pipes above the maximum static pressure defined as 10 bara, since their insulation properties are better than steel twin pipes; and (ii) the allowance of reducing the pipe diameters further through an optimization algorithm with increasing amounts of allowable pressure loss is appointed as maximum in the design stage. The latter reason is valid except when the former reason occurs. The idea behind (ii) is due to the existence of an inverse proportion between the pipe dimension and the pressure loss, since in this study the mass flow was defined as constant and the optimization method was modelled to decrease the pipe dimension until the pressure loss reached the defined maximum allowable pressure drop value.
The energetic and exergetic evaluation of the annual pump electricity consumption and the overall heat loss from the DH network (
Table 5 and
Figure 2) substantiated observations given for the Lystrup project that the annual pump electricity consumption is significantly lower than the overall heat loss from the DH network in all maximum static pressure values employed. The increase in the pump power requirement was observed to be significantly lower than the overall heat loss value with the increasing maximum static pressure below the maximum static pressure level of 10 bara. However, in high levels of the maximum static pressure values appointed, the allowable pressure loss through the routes of the DH network was defined to be as high as 23 bar, yielding significant reduction in pipe dimensions down to steel twin pipe 25/25 and steel twin pipe 32/32 as the longest in the overall length obtained. Such a high reduction being observed in the pipe dimensions resulted with an overall heat loss value almost as low as the maximum static pressure of 10 bara and resulted with pipe dimensions down to AluFlex twin pipe 10/10 (the high performance of heat saving in AluFlex twin pipes should be noted). The reason for having comparatively higher heat loss in the maximum static pressure of 10 bara rather than appointing 25 bara was due to the optimal solution found with a high variation in pipe dimensions observed,
i.e., the main pipe segment that was defined as the successor to the heat production plant, resulted in steel twin pipe 65/65 while the pipe segments close to the end-users (the nodes without successor pipe segments) were optimized to small pipe dimensions such as AluFlex 10/10.
The economic results showed that the investment cost for the piping network was found to be relatively higher compared to the other costs involved, which was valid for all of the maximum static pressure levels. The operating costs involving the heat loss from the DH network and the pumping power consumption constitute only a small percentage of the overall cost. However, the increasing static pressure resulted in a slight increase in the cost of heat loss, while a comparatively higher increase was observed in the pumping power consumption costs. The pipe investment cost was observed to have a considerable impact on the overall cost of the low-energy DH network. The degree of the sensitivity observed for the pipe investment cost was found to decrease in the high levels of maximum static pressure, i.e., in case the specific pipe cost was reduced to −75% of its original value, the relative change of the overall cost (to the reference optimal point) was obtained with a reduction of −62.9% for the SPMax,1 and with a reduction of −48.6% for the SPMax,6.
In the simulation with the maximum static pressure level of 25 bara employed, the velocity of the heat carrier medium was observed to be in comparatively higher levels on the main pipe segments than the other pipe segments of the DH network for the coldest peak period, due to the excessive reductions achieved on the dimensions of these pipes by means of the optimization algorithm. The dimensions of these pipe segments can be increased to an upper diameter available in the pipe catalogue, which will lead to an increase in the heat loss from the DH network.
Based on the current specific data given for the environmental impact in
Table 4, the emissions observed with the simultaneous consideration of the heat loss and the pumping power consumption showed a minimum of 10 bara as well as the results of the other evaluation methods from the energetic, exergetic and economic points of view.
7. Conclusion
The aim of this study was not to adjudge the best possible solution to any of the problems investigated, but rather to explore the effects of the parameter “the maximum static pressure” appointed in the design stage of a low-energy district heating network from the energy, exergy, economic and environmental points of view. One should note that district heating systems should always be designed in accordance with what works best within the district itself. It is rewarding to point out, however, some general conclusions found regarding the study and its results. The main conclusion refers to the maximum static pressure level of 10 bara resulting in a minimum impact on all these above-mentioned perspectives. However generally speaking, it is highly important to determine the level of the maximum static pressure and hence the maximum allowable pressure drop, while dimensioning the DH network according to local geographical conditions together with the heat demand properties of the heat consumers located in the area. Another particular observation is the increment in the maximum static pressure level yielding a reduction in the heat loss of which the exergetic value outweighed by far the increase of exergy use due to increased pumping power below 10 bara. The great energy saving potential due to the high insulation properties of the AluFlex pipe type can certainly be stressed for areas where the low levels of the maximum static pressure are applicable. However the increment in the maximum static pressure while being higher above 10 bara not only causes high pump power requirements, but also may cause an increase in the heat loss from the DH network. In addition, the lowered durability of piping and equipment in the DH network should be noted, which can be caused by the long-term effects of the high maximum static pressure levels. One should also note that a high level of velocity should be one of the main concerns while designing the piping networks due to the risk of noise and flow corrosion. However the coldest peak winter period lasted for 8 hours but only intermittently throughout the case study period presented in this paper.
Prevailing use of low-energy district heating systems can be rewarding for the future energy supply schemes since any type of heat source can be utilized to produce low temperature heat and supplied to low-energy houses by means of low-energy district heating networks. The research method presented in this paper can greatly help in pressure considerations regarding low-energy district heating systems. The obtained results together with their evaluations of various aspects, will provide reasons to overcome barriers that may be directed to the optimization algorithm in question due to its unique aim of utilizing the head lift provided from the pump station excessively by reducing the dimensions of the piping network until pressure loss of each route reaches the level of the head lift considered. One can see that employing AluFlex twin pipes provides superior measures from most evaluation aspects considered in this study. These two concluding points will advance the design of low-energy district heating systems being considered in future energy supply schemes.
Some shortcomings of this study should be specified in order to form the scope of further studies in this field: The design of a DH network must consider the elevation variations of the district, which was not considered in this study. The scope of the investigation would be further widened by including various types of pipes that are commercially available and by carrying out pressure investigations for different network layouts, such as looped and mixed layouts involving branched and looped forms together.
Acknowledgments
This research work has been financed partly by Roskilde and Gladsaxe Fjernvarmeforsyning A/S. Also the external study being currently carried out in collaboration with UOIT, Oshawa, ON, Canada has been supported financially, partly by the COWIfonden, the Oticon Fonden, and the Marie & M.B. Richter’s Fond. We are thankful for their technical and financial supports.
References
- Christiansen, C.H.; Worm, J.; Jørgensen, H.; Thorsen, J.E.; Bennetsen, J.; Larsen, C.T.; Juhl, Ole; Lang, S.; Rosenberg, F.; Olsen, P.K.; et al. Demonstration Af Lavenergifjernvarme Til Lavenergibyggeri i Boligforeningen Ringgårdens Afd. 34 i Lystrup (In Danish); Technical Report for Project CO2-Reductions in Low Energy Buildings and Communities by Implementation of Low Temperature District Heating Systems; Demonstration cases in EnergyFlexHouse and Boligforeningen Ringgården: Århus, Denmark, May 2011. [Google Scholar]
- Christiansen, C.H.; Paulsen, O.; Bøhm, B.; Thorse, J.E.; Larsen, C.T.; Jepsen, B.K.; Olsen, P.K.; Lambertsen, H.; Hummelshøj, R.; Svendsen, S.; et al. Udvikling og Demonstration af Lavenergi-Fjernvarme til Lavenergibyggeri. Hovedrapport og Bilag (In Danish); Technical Report; Project Development and Demonstration of Low-Energy District Heating for Low Energy Buildings: Copenhagen, Denmark, March 2009. [Google Scholar]
- Rosen, M.A.; Le, M.N.; Dincer, I. Efficiency Analysis of a Cogeneration and District Energy System. Appl. Therm. Eng. 2005, 25, 147–159. [Google Scholar] [CrossRef]
- Dincer, I.; Hepbasli, A. District Energy Systems. In Encyclopedia of Energy Engineering and Technology; Capehart, B.L., Ed.; CRC Press: Gainesville, FL, USA, 2007; Volume 3, pp. 316–331. [Google Scholar]
- Persson, U.; Werner, S. Heat Distribution and the Future Competitiveness of District Heating. Appl. Energy 2011, 88, 568–576. [Google Scholar]
- Lund, H.; Möller, B.; Mathiesen, B.V.; Dyrelund, A. The Role of District Heating in Future Renewable Energy Systems. Energy 2010, 35, 1381–1390. [Google Scholar]
- Skagestad, B.; Mildenstein, P. District Heating and Cooling Connection Handbook; IEA: Paris, France, 2002; pp. 1–86. [Google Scholar]
- Wiltshire, R. Low Temperature District Energy Systems. In Proceedings of the Urban Energy Conference, Debrecen, Hungary, October 2011; pp. 1–13.
- Olsen, P.K.; Lambertsen, H.; Hummelshøj, R.; Bøhm, B.; Christiansen, C.H.; Svendsen, S.; Larsen, C.T.; Worm, J. A New Low-Temperature District Heating System for Low-Energy Buildings. In Proceedings of the 11th International Symposium on District Heating and Cooling, Reykjavik, Iceland, August 31–September 2, 2008; pp. 1–8.
- Paulsen, O.; Fan, J.; Furbo, S.; Thorsen, J.E. Consumer Unit for Low Energy District Heating Net. In Proceedings of the 11th International Symposium on District Heating and Cooling, Reykjavik, Iceland, August 31–September 2, 2008; pp. 1–8.
- Thorsen, J.E.; Christiansen, C.H.; Brand, M.; Olesen, P.K.; Larsen, C.T. Experiences on Low-Temperature District Heating in Lystrup-Denmark. In Proceedings of the International Conference on District Energy, Portorož, Slovenia, March 2011; pp. 1–10.
- SSE Zero Carbon Homepage. Available online: http://www.ssezerocarbonhomes.com (accessed on 1 October 2012).
- Mertoğlu, O.; Dokuz, İ.; Canlan, A.; Bakır, N. Alternatif Enerji Kaynakları ve DüÅşük Sıcaklıklı Jeotermal Bölgesel Isıtma (In Turkish). Tesisat Muhendisligi 2000, 55, 52–62. [Google Scholar]
- Mertoglu, O.; Bakir, N.; Kaya, T. Geothermal Applications in Turkey. Geothermics 2003, 32, 419–428. [Google Scholar] [CrossRef]
- Brand, M.; Thorsen, J.E.; Svendsen, S. Numerical Modelling and Experimental Measurements for a Low-Temperature District Heating Substation for Instantaneous Preparation of DHW with Respect to Service Pipes. Energy 2012, 41, 392–400. [Google Scholar] [CrossRef]
- Dalla Rosa, A.; Li, H.; Svendsen, S. Steady State Heat Losses in Pre-Insulated Pipes for Low-Energy District Heating. In Proceedings of the 12th International Symposium on District Heating and Cooling, Talinn, Estonia, September 2010; pp. 81–89.
- Hasan, A.; Kurnitski, J.; Jokiranta, K. A Combined Low Temperature Water Heating System Consisting of Radiators and Floor Heating. EnergyBuild. 2009, 41, 470–479. [Google Scholar]
- Tol, H.İ.; Svendsen, S. A Comparative Study on Substation Types and Network Layouts in Connection with Low-Energy District Heating Systems. Energy Convers. Manag. 2012, 64, 551–561. [Google Scholar] [CrossRef]
- Tol, H.İ.; Svendsen, S. Effects of Boosting the Supply Temperature on Pipe Dimensions of Low-Energy District Heating Networks: A Case Study in Gladsaxe, Denmark. Energy Build. 2012. Submitted for publication. [Google Scholar]
- Li, H.; Dalla Rosa, A.; Svendsen, S. Design of Low Temperature District Heating Network with Supply Water Recirculation. In Proceedings of the 12th International Symposium on District Heating and Cooling, Talinn, Estonia, September, 2010; pp. 73–80.
- Schmidt, D. New Ways for Energy Systems in Sustainable Buildings—Increased Energy Efficiency and Indoor Comfort through the Utilisation of Low Exergy Systems for the Heating and Cooling of Buildings. In Proceedings of the 21st Conference on Passive and Low Energy Architecture, Eindhoven, The Netherlands, September 2004; pp. 1–6.
- Schmidt, D.; Ala-Juusela, M. Low Exergy Systems for Heating and Cooling of Buildings. In Proceedings of the 21st Conference on Passive and Low Energy Architecture, Eindhoven, The Netherlands, September 2004; pp. 1–6.
- Torío, H.; Schmidt, D. Development of System Concepts for Improving the Performance of a Waste Heat District Heating Network with Exergy Analysis. Energy Build. 2010, 42, 1601–1609. [Google Scholar] [CrossRef]
- Tol, H.İ.; Svendsen, S. Improving the Dimensioning of Piping Networks and Network Layouts in Low-Energy District Heating Systems Connected to Low-Energy Buildings: A Case Study in Roskilde, Denmark. Energy 2012, 38, 276–290. [Google Scholar] [CrossRef]
- Tol, H.İ.; Svendsen, S. Design of Low-Energy District Heating System for a Settlement with Low-Energy Buildings. In Proceedings of the 3rd International Symposium on Environmental Management, Zagreb, Croatia, October 2011; pp. 166–171.
- Tol, H.İ.; Svendsen, S. Determination of Optimum Network Layout for Low-Energy District Heating Systems with Different Substation Types. In Proceedings of the 3rd International Renewable Energy Congress, Hammamet, Tunisia, December 2008; pp. 179–184.
- Phetteplace, G. Optimal Design of Piping Systems for District Heating; U.S. Army Corps of Engineers: Hanover, NH, USA, August 1995. [Google Scholar]
- Overgaard, J.; Knudsen, S. District Heating Networks—Choosing the Right Pipe Dimensions. DBDH 2006, 1, 1–2. [Google Scholar]
- General Piping Design. In Liquid Process Piping; Genetti, A.J. (Ed.) U.S. Army Corps of Engineers: Hanover, NH, USA, 1999; pp. 3-1–3-32.
- Hodge, B.K.; Taylor, R.P. Piping-System Solutions using Mathcad. Comput. Appl. Eng. Educ. 2002, 10, 59–78. [Google Scholar] [CrossRef]
- Brand, M.; Dalla Rosa, A.; Svendsen, S. Performance of Low Temperature District Heating Systems for Low Energy Houses. In Proceedings of the Annex 49 Low Exergy Systems for High-Performance Building and Communities, Munich, Germany, October 2010; pp. 174–183.
- Brand, M.; Thorsen, J.E.; Svendsen, S.; Christiansen, C.H. A Direct Heat Exchanger Unit used for Domestic Hot Water Supply in a Single-Family House Supplied by Low Energy District Heating. In Proceedings of the 12th International Symposium on District Heating and Cooling, Talinn, Estonia, September 2010; pp. 60–68.
- Tol, H.İ.; Svendsen, S. Optimal Dimensioning of Low-Energy District Heating Networks with Operational Planning—Case Study for Existing Buildings. In Proceedings of the 11th International Conference on Sustainable Energy Technologies, Vancouver, Canada, September 2012; pp. 113–122.
- Olsen, P.K. Low-Temperature District Heating. Presented at the Heat Network on Study Trip to Denmark and Sweden, Helsingør, Denmark, 14 September, 2011. The WARMTENETWERK Web site. Available online: http://www.koudeenwarmte.nl/files/1317483122Low-temp%20DH%20-%20Dutch%20delegation%2014-09-2011.pdf (accessed on 5 December 2011).
- Danfoss, 8 Steps-Control of Heating System. Available online: http://www.heating.danfoss.com/Content/61078BB5-1E17-4CA2-AC498A7CAC2BA687_MNU17424997_SIT54.html (accessed on 10 November 2011).
- Logstor Calculator, version 2.1. Available online: http://calc.logstor.com/ (accessed on 15 April 2012).
- Dincer, I.; Rosen, M.A. EXERGY: Energy, Environment and Sustainable Development, 1st ed; Elsevier: Burlington, VT, USA, 2007. [Google Scholar]
- Nieuwlaar, E.; Dijk, D. Exergy Evaluation of Space-Heating Options. Energy 1993, 18, 779–790. [Google Scholar] [CrossRef]
- Elmegaard, B. Exergy Analysis. In Presented at the Master Course of “Energy Systems—Analysis, Design, and Optimization”, Lyngby, Denmark, May 2010; pp. 1–84.
- Danmarks Energifremskrivning, 2012 (In Danish). Energi Styrelsen Web site. Available online: http://www.ens.dk/Documents/Netboghandel%20-%20publikationer/2012/Danmarks_energifrem skrivning_2012.pdf (accessed on 19 September 2012).
- Long-Term Interest Rate Statistics for EU Member States, 2012. European Central Bank Web site. Available online: http://www.ecb.int/stats/money/long/html/index.en.html (accessed on 13 November 2012).
- Nielsen, A.G. Grundfos Holding A/S, Bjerringbro, Denmark. Personal communication. 2011.
- Chinneck, J.W. Sensitivity Analysis. In Practical Optimization: A Gentle Introduction; Chinneck, J.W., Ed.; Carleton University: Ottawa, Ontario, Canada, 2006; pp. 1–8. [Google Scholar]
- Miljødeklaration 2011 for Fjernvarme i Hovedstadsområdet; (In Danish). CTR, Københavns E, and VEKS: Copenhagen, Denmark, April 2012.
© 2013 by the authors; licensee MDPI, Basel, Switzerland. This article is an open-access article distributed under the terms and conditions of the Creative Commons Attribution license (http://creativecommons.org/licenses/by/3.0/).


 refers to the overall heat loss from the DH network (W), calculated with the multiplication of the length L [m] and of the heat loss coefficient uL (W/m) for a pipe segment pi-1,i.