1. Introduction
The struggle against international terrorism has become a crucial task for the safety of citizens. An important aspect of this task is the development of sensitive, low-cost and compact technologies able to reveal ultra-low quantities of explosives (pictograms or less), which nowadays is still a difficult challenge. Among the available detection technologies, Raman spectroscopy [
1] has recently gained increasing interest in forensic science [
2] and it has been already applied for the analysis of illicit drugs or medications [
3,
4,
5] as well as for the characterization of different types of excipients (i.e., adulterants or cutting agents) [
6,
7] and for the detection of explosives [
8,
9,
10]. Because the Raman band frequencies relate to the chemical bonding in the compound to be identified, the technique offers the distinct advantage of chemical specificity and benefits from the ability to generate valid reference Raman spectra under laboratory conditions, comparable with spectra obtained in the field. However, the major drawback of Raman spectroscopy is the low cross-section [
1] of the spontaneous Raman scattering, which affects the detection of substances at the trace level.
In 1974 it was discovered that the magnitude of the Raman signal can be greatly enhanced when the scatterer is placed on a roughened noble-metal substrate [
11], a process that is nowadays known as surface-enhanced Raman spectroscopy (SERS) [
12,
13].
At present, the SERS mechanism appears to derive from two separate contributions: (1) a mechanism of electromagnetic enhancement and (2) a mechanism of chemical enhancement [
14]. The first comes through the electromagnetic interaction of light with metals, which produces large amplifications of the laser field through excitations generally known as plasmon resonances [
15,
16,
17,
18]; the second corresponds to any modification of the Raman polarizability tensor upon adsorption of the molecule onto the metal surface [
19,
20,
21].
Very recently, the sensitivity of the SERS technique was also tested in detecting traces of explosives and other hazardous chemicals by using handheld Raman spectrometers [
22,
23,
24,
25,
26,
27].
In this work, we report the results of SERS measurements on some common military explosives (ethylene glycol dinitrate (EGDN), pentaerythritol tetranitrate (PETN), trinitrotoluene (TNT) and 1,3,5-trinitroperhydro-1,3,5-triazine (RDX)), acquired with a table-top micro-Raman system integrated with a Serstech R785 miniaturized spectrometer.
This set of substances was chosen because they are representative of nitro-based explosives that currently are among the greatest threats to security [
21]. Three major classes of nitro (NO
2)-containing explosives can be identified: those based on aliphatic nitrate ester (R-O-NO
2), nitro-aromatic (Ar-NO
2), and cycloaliphatic nitramine (>N-NO
2) groups. Among them, EGDN and PETN are representative of the first class (nitrate ester), TNT is representative of the second class (nitro-aromatic) and RDX is representative of the third (nitramine).
The novelty of this hybrid system is to verify a possible upgrade of the available handheld Raman devices, equipping them with an optical microscope, for punctual investigation at very high spatial resolution.
2. Materials and Methods
2.1. Samples Preparation
Samples of explosives were prepared depositing 0.1 μL drops of 1 mg/mL solutions onto klarite
® SERS substrates by a piston-driven air displacement pipette. The following commercially available solutions were used: EGDN and PETN in methanol, TNT and RDX in acetonitrile. Due to their volatility, the solvents selectively evaporate, leaving dried molecules of explosive on the SERS substrate. The solvents evaporate in less than one minute, then it is possible to carry out the Raman measurements. Although no more available on the market, klarite
® substrates were previously chosen because of their homogeneity on relatively large scale (mm
2) [
28,
29]. They are composed of arrays of inverted pyramidal pits coated with a sputtered gold layer (300 nm thickness) on a silicon substrate. This ordered nanostructure was produced by electron beam lithography. Four different active SERS patterns were present on each substrate, each of one differing from another for the lateral size the inverted pyramids (470, 500, 577, 644 nm, respectively), while the total pitch length remained unchanged (700 nm).
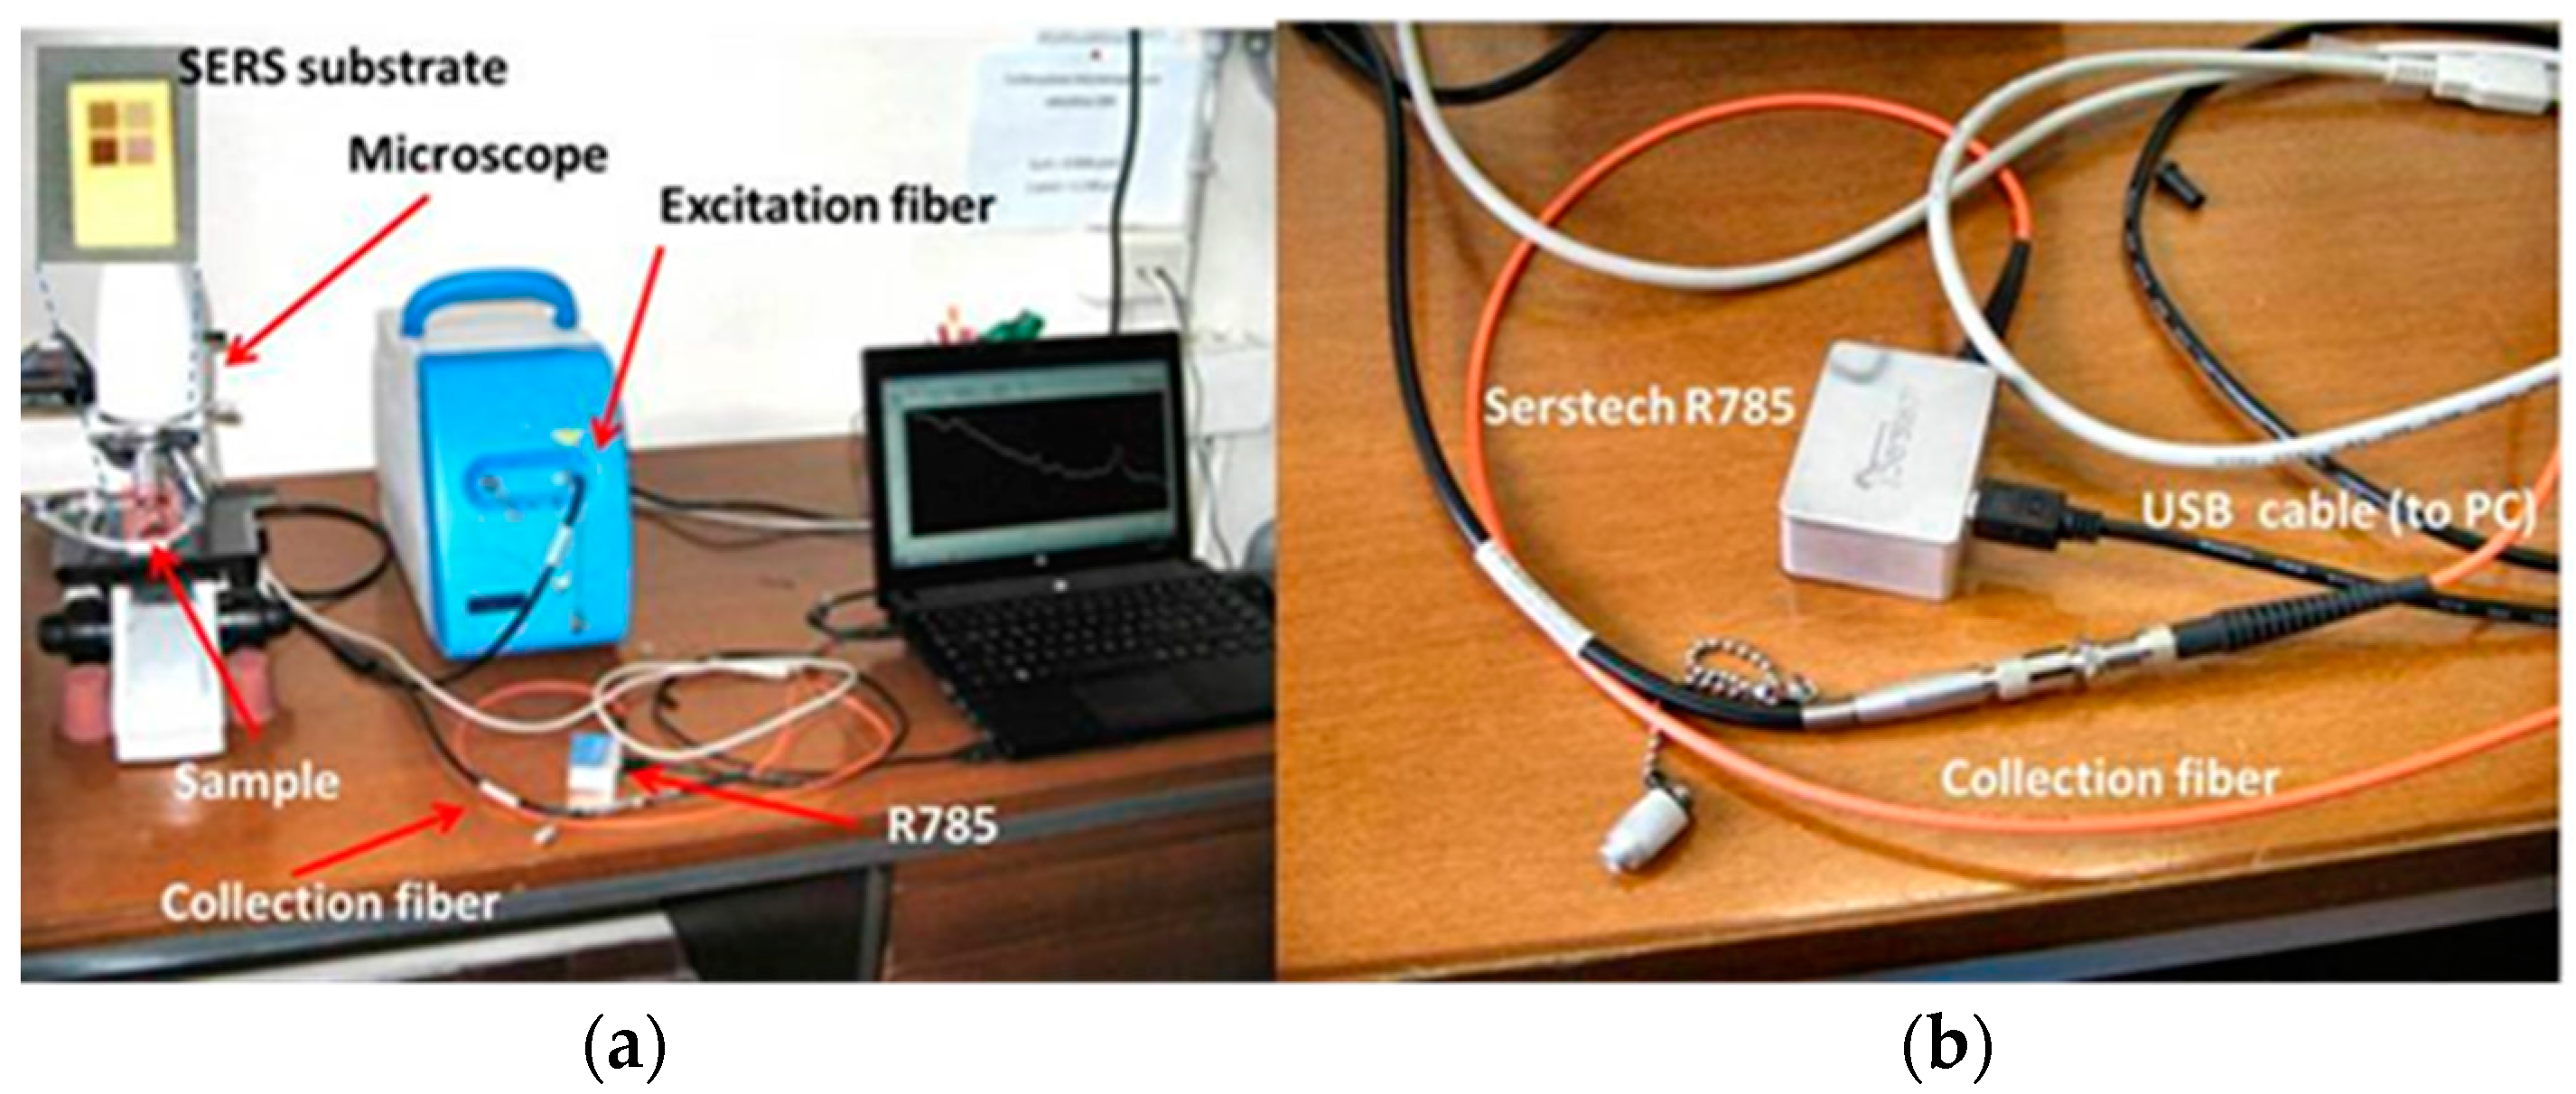
2.2. Spectroscopic Instrumentation
Samples were excited with a solid state laser emitting at 785 nm, with adjustable power in the range 3–300 mW through an optical microscope, focusing the laser beam by 20× magnification, 0.4 numerical aperture microscope objective. The excitation-collection geometry is confocal, the laser spot size is 90 μm diameter, resulting in a scanned area of 0.0064 mm2. The signal is collected through an optical fiber and sent to the R785 minispectrometer after being cut from the Rayleigh (elastic) contribution by using a notch filter (OD6). The R785 is, in this version, a stand-alone, USB-powered device, whereas it is currently used in the portable spectrometer Serstech INDICATOR™, which represents one of the most updated Raman handheld device. A dedicated software, developed under labview™ (National Instruments, Austin, TX, USA) displays the data and the acquisition parameters. R785 characteristics are: size 45 × 35 × 20 mm, weight 50 g, resolution < 1 nm (~10 cm−1, 6 pixel/nm), spectral range 790–990 nm (81–2637 cm−1), dynamic range 16 bit. Integrated detector is an un-cooled CCD. R785 is suitable for Raman measurements with excitation source in the 780–830 nm range, since the background fluorescence often masks the weaker Raman bands in the VIS raneg and laser sources in the NIR or IR regions are the preferred choice for handheld devices.
In
Figure 1a,b, a picture of the whole set-up and a detailed picture of the R785 are shown.
3. Results and Discussion
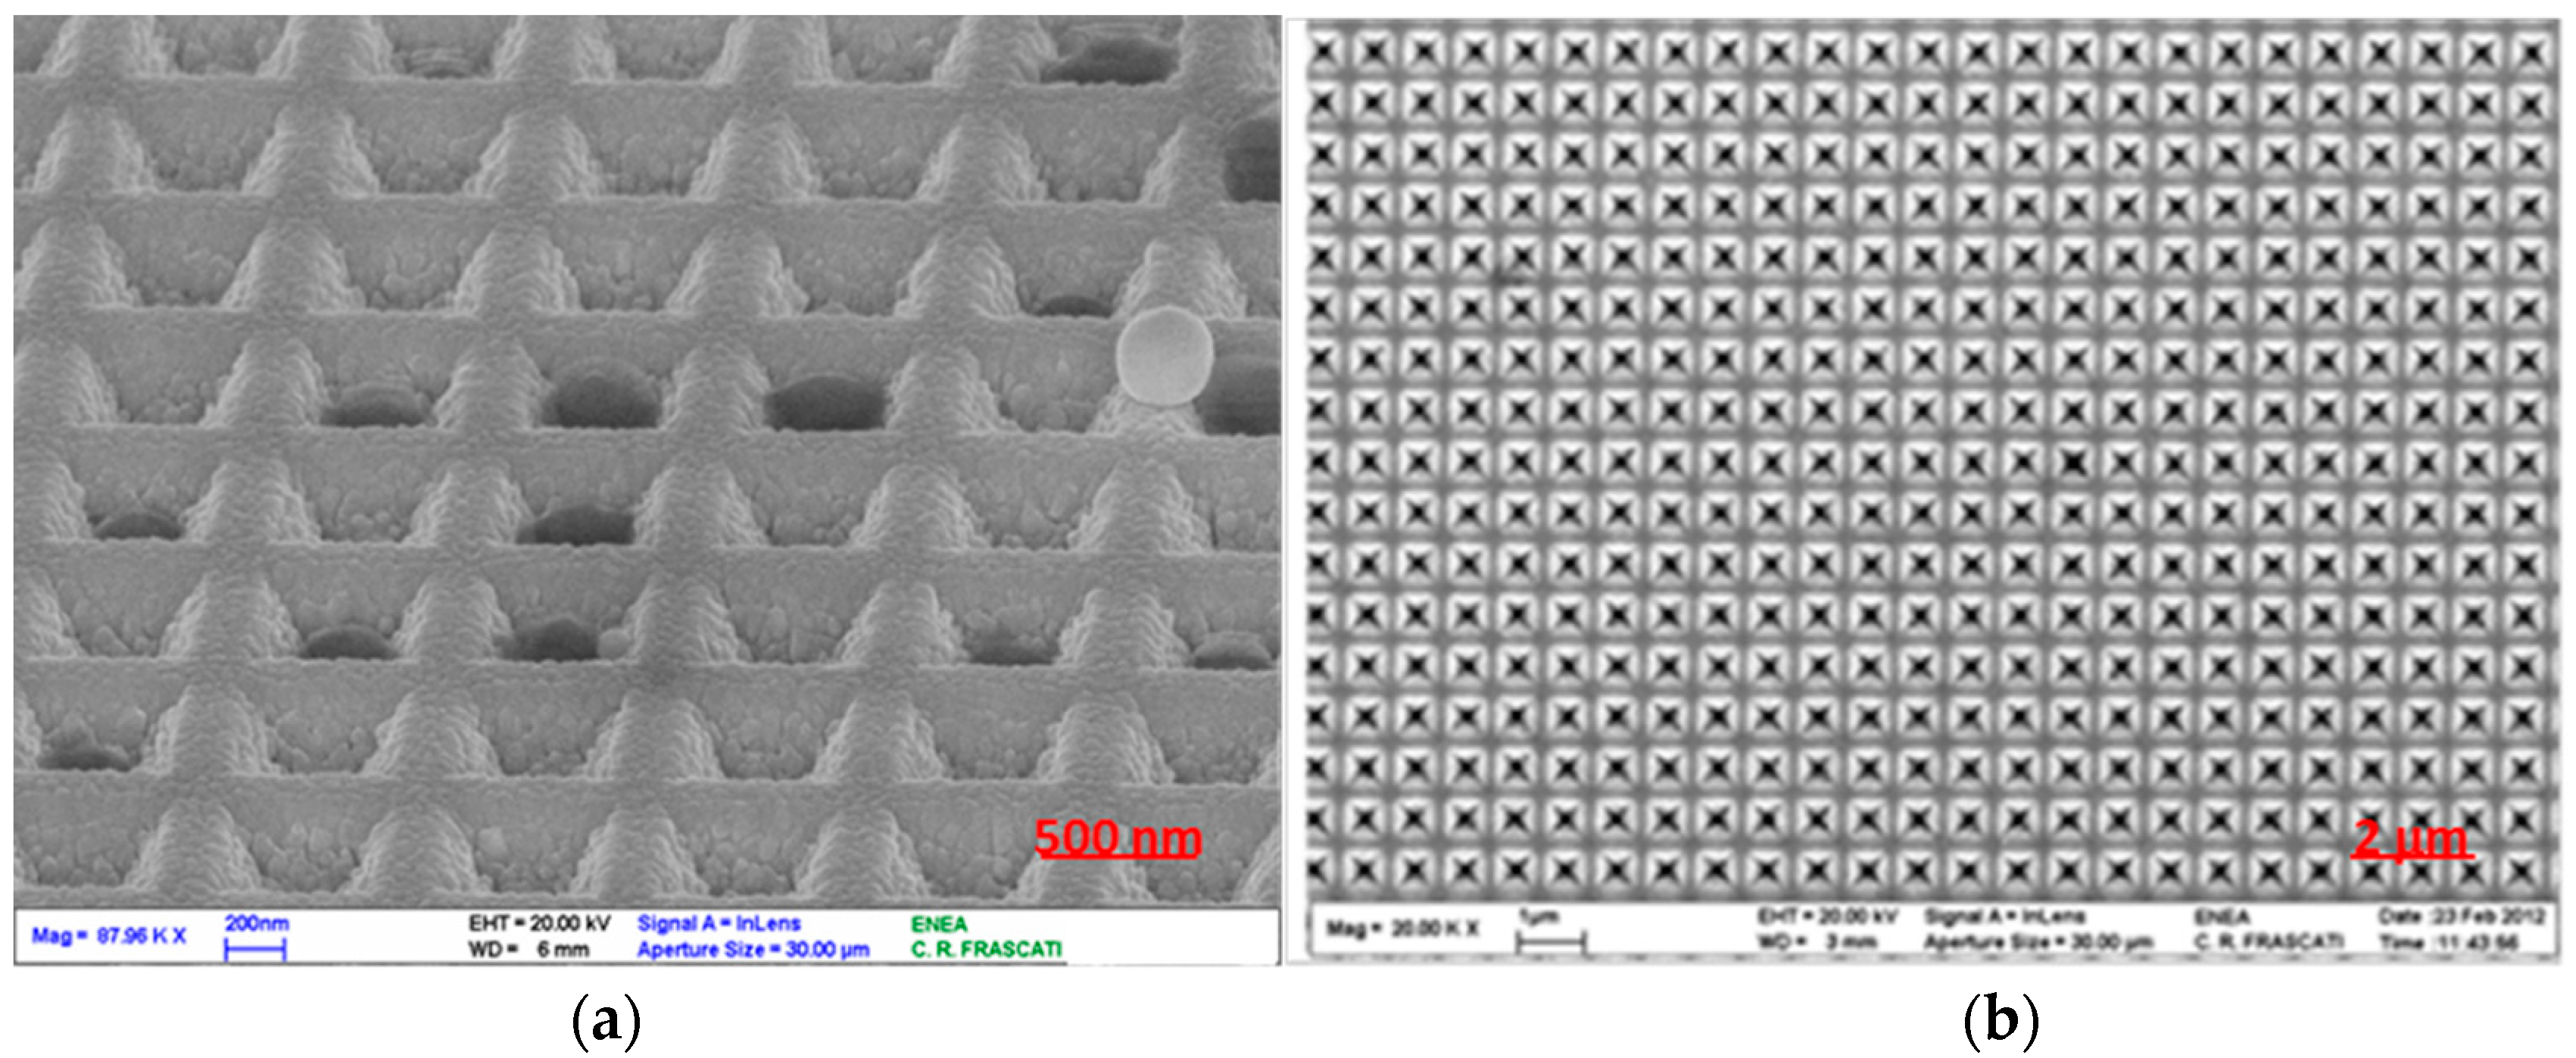
3.1. SEM Investigation
A more careful observation of the explosive samples by an electron microscope (SEM “Leo 1525”, hot cathode field emission microscope, maximum resolution of 1.5 nm at 20 kV) has shown that these tend to occupy some individual pits, not covering the surface in a homogeneous way, but rather randomly occupying single sites. In
Figure 2, the SEM images compare two regions of the SERS substrate (
Figure 2a), acquired in the area covered by the deposited solution, which show traces of the explosive residues (in this case RDX) filling some pyramidal pits (
Figure 2b), acquired in an area outside the drop of the solution, showing empty pits.
This distribution is likely due to the original state of the sample, a solution in which the rapid evaporation of the solvent favors the crystallization of the solute in several independent sites. In particular, solvents such as methanol or acetonitrile, with low values of surface tension, favor the distribution of the droplet on a wide region of the substrate, while their rapid evaporation can promote rapid crystallization of the solute in preferential sites on a low scale, while being homogeneously distributed on a large scale.
The sampled quantity
Qexp was estimated trough the following relation:
where %
fp is the percentage of the filled pits with respect to the total number of pits under the laser spot,
Al is the laser spot area,
Ap is the single pit area,
Vp is the volume of each single pit and
ρexp is the substance density (
ρexp = 1.82 g/cm
3 for RDX, 1.77 g/cm
3 for PETN, 1.65 g/cm
3 for TNT, 1.49 g/cm
3 for EGDN). The percentage of the filled pits (
% fp) was evaluated through the analysis of
Figure 2a by using the image processing and analysis software “ImageJ” [
30], resulting in 22.1%. With this procedure
Qexp was estimated to be about 150–200 pg for each of the considered explosives.
3.2. Identification of SERS Peaks
For the present measures the laser power was set at 150 mW while the integration time was 10 s with an energy flux density of about 23.4 × 10³ J/cm2. These parameters were chosen in order to optimize the signal-to-noise ratio (S/N), minimizing photodegradation effects. Only one accumulation was performed on each point of the SERS substrate.
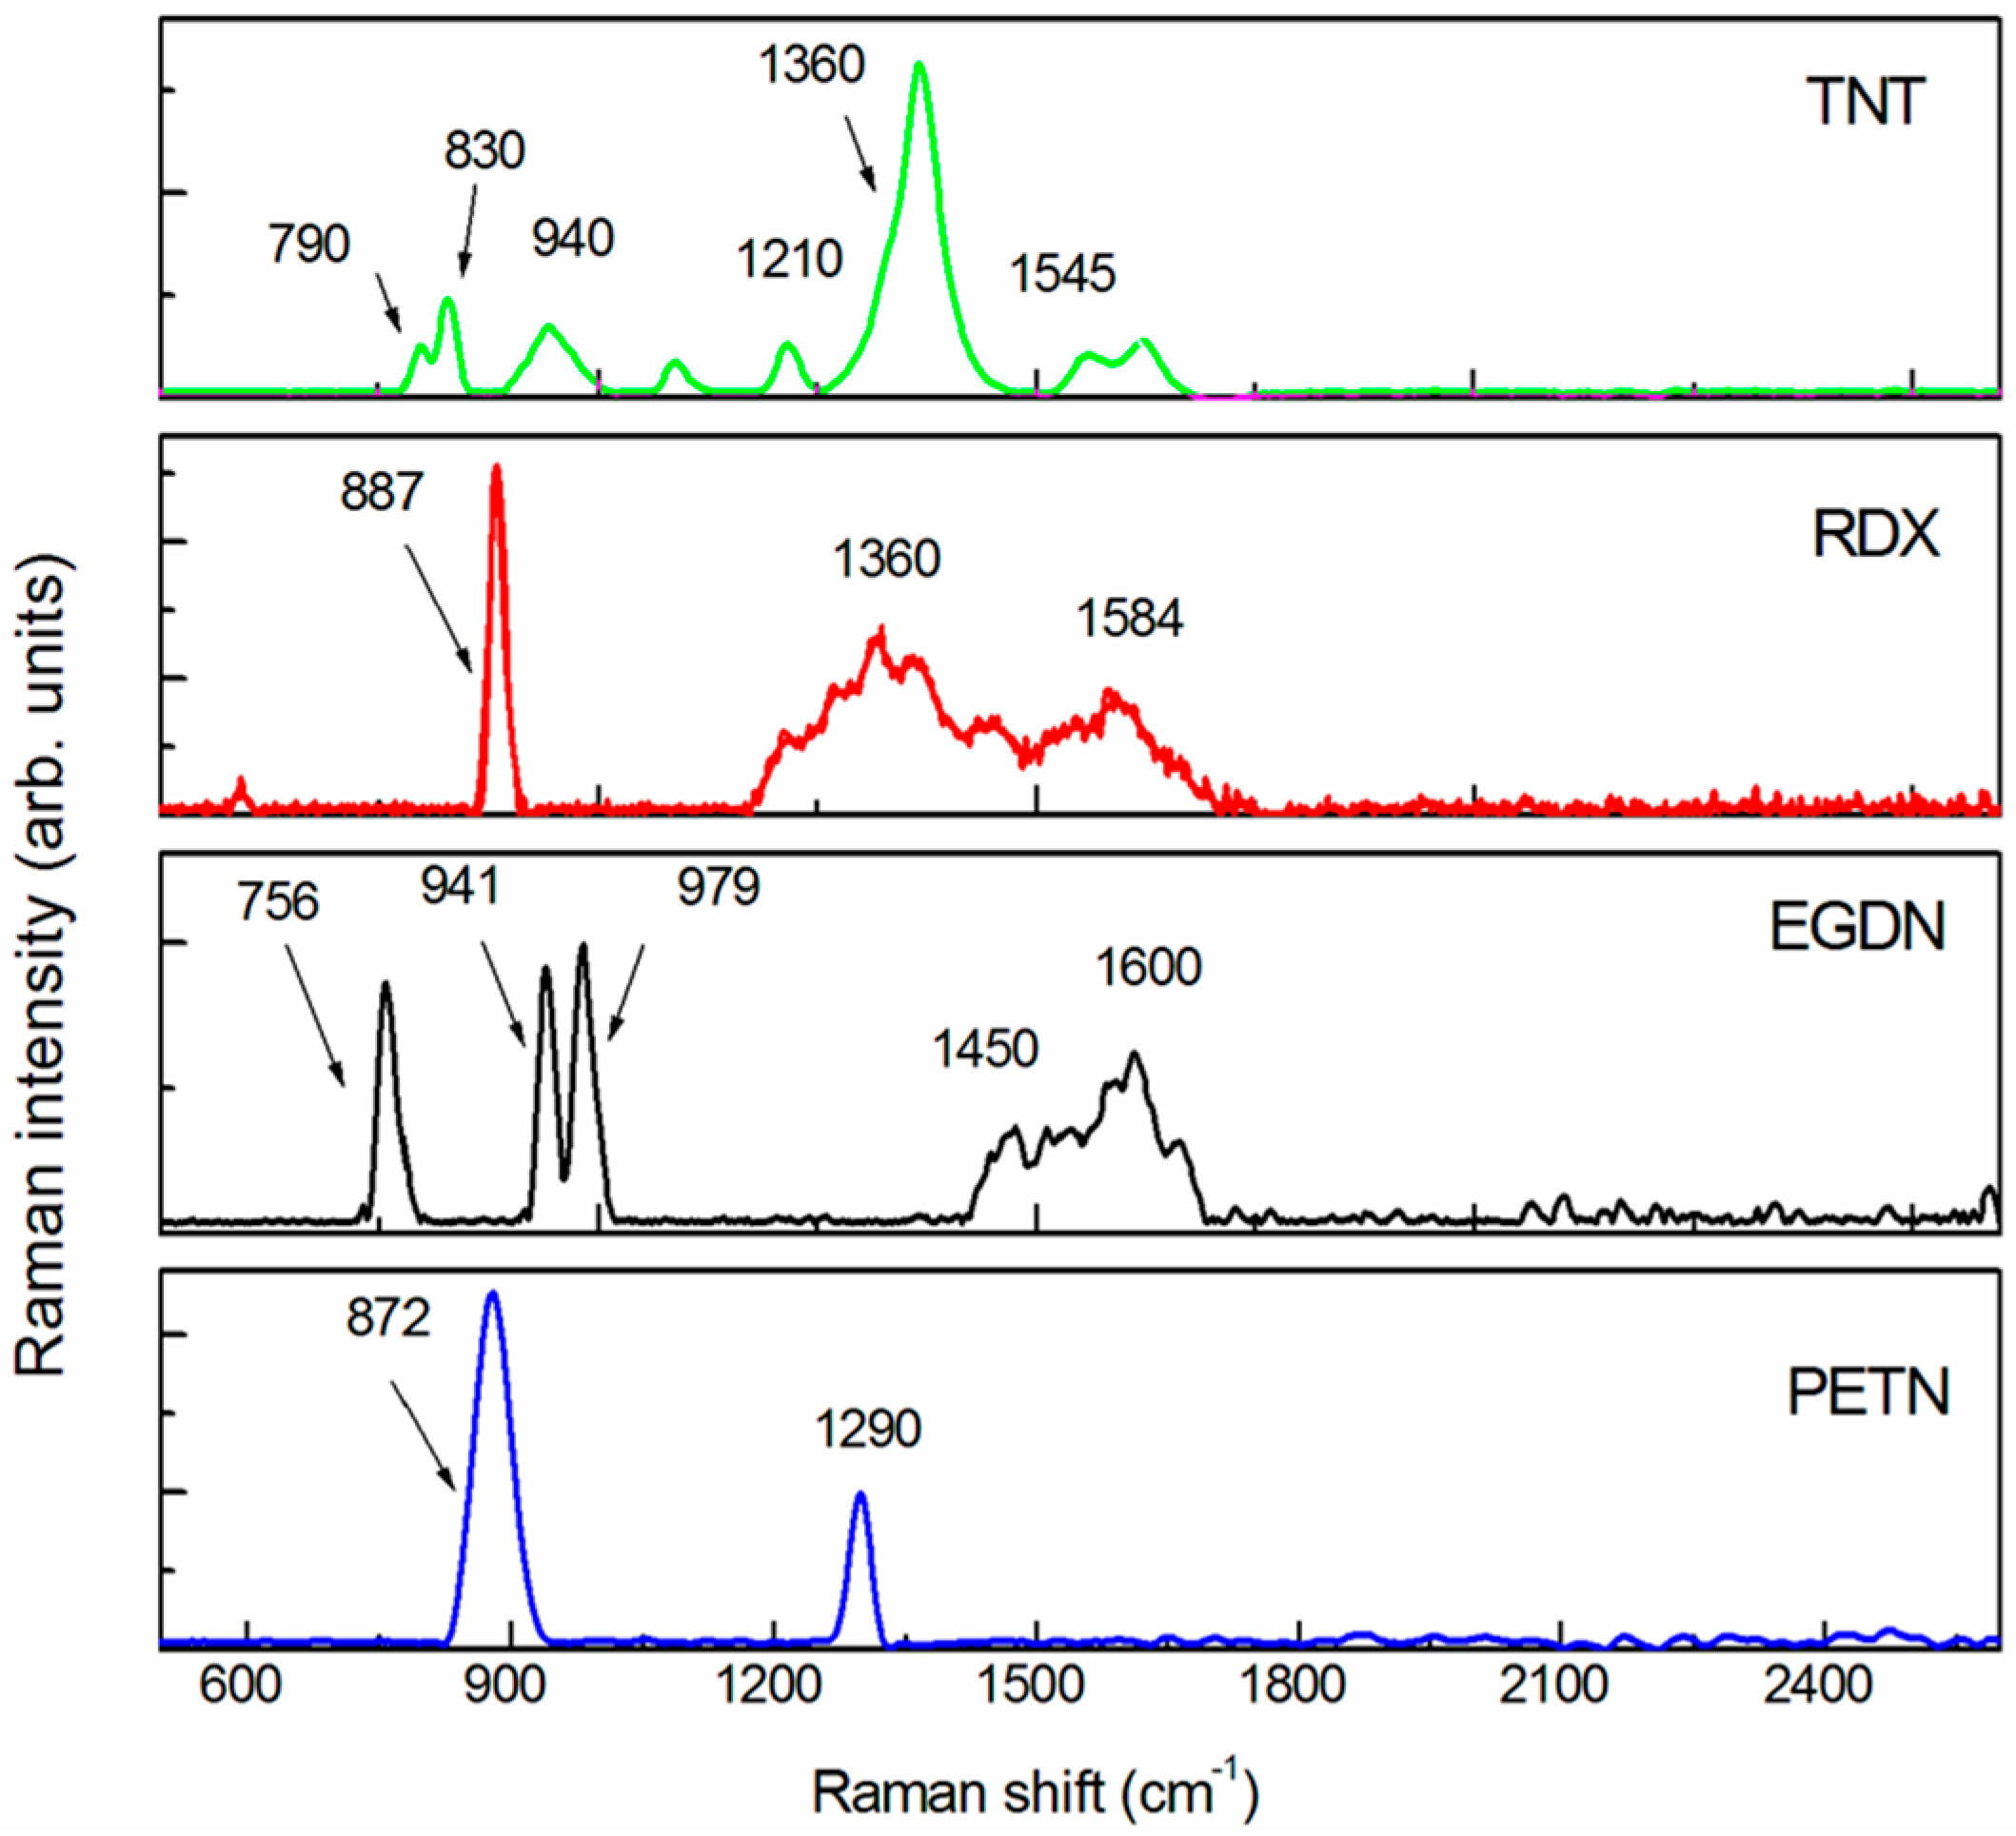
The obtained SERS spectra of TNT, RDX, EGDN and PETN are shown in
Figure 3 after fluorescence background subtraction. The comparison of the experimental spectra with the literature [
21,
31,
32,
33] shows that these substances could be easily identified and differentiated by their strong sharp peaks throughout the spectral region between 500 and 2550 cm
−1, also in such a low quantity.
In the TNT (C
7H
5N
2O
8, nitro-aromatic), both the NO
2 symmetric and antisymmetric stretching bands (1360 and 1545 cm
−1) [
32,
33] have been identified. Other peaks can be assigned to the NO
2 scissoring modes (790, 820 cm
−1), to the CH ring bending modes (830–940 cm
−1) and to the CH ring breathing mode (1210 cm
−1) [
32,
33]. The RDX spectrum (C
3H
6N
6O
6, nitramine) shows the strongest band at 887 cm
−1 which can be ascribed to the C-N-C ring breathing mode [
26,
32,
33] while the symmetric and antisymmetric vibrations of the nitro group are located at 1361 and 1584 cm
−1, respectively [
21].
In the EGDN (C
2H
4(ONO
2)
2, nitrate-ester) spectrum, the antisymmetric stretching band is clearly visible around 1600 cm
−1 while no spectral features ascribable to the NO
2 symmetric stretching band (between 1270 and 1300 cm
−1) are observed. Sharp peaks at lower Raman shifts have been observed and identified as the ONO
2 umbrella (756 cm
−1) vibration mode, the CH
2 (941 cm
−1) vibration modes and the C-O stretching (979 cm
−1) mode [
32,
33].
In the PETN (C(CH
2ONO
2)
4, nitrate ester) spectrum, the peak at 872 cm
−1 can be assigned to the symmetric stretching of O-N while the peak at 1290 cm
−1 can be assigned to the symmetric stretching of the NO
2 nitro group [
21,
28]. No remarkable spectral features ascribable to NO
2 antisymmetric stretching were observed, which, for the nitrate ester explosives, can be located between 1600 and 1660 cm
−1 [
31].
It is also observed that some spectral features (e.g., antisymmetric stretching bands of TNT, RDX, EGDN) appear broadened and not well resolved in the spectra. This could be a consequence of the SERS enhancement, which is not uniform all over the spectrum and may depend on a series of factors such as a wavelength-dependent plasmon resonance for which different parts of the spectrum can be amplified by different amounts, the particular orientation of the molecules in contact with the surface for which specific Raman modes could selectively be enhanced, or the formation of surface complexes which intimately change the molecule structure as a consequence of adsorption [
14].
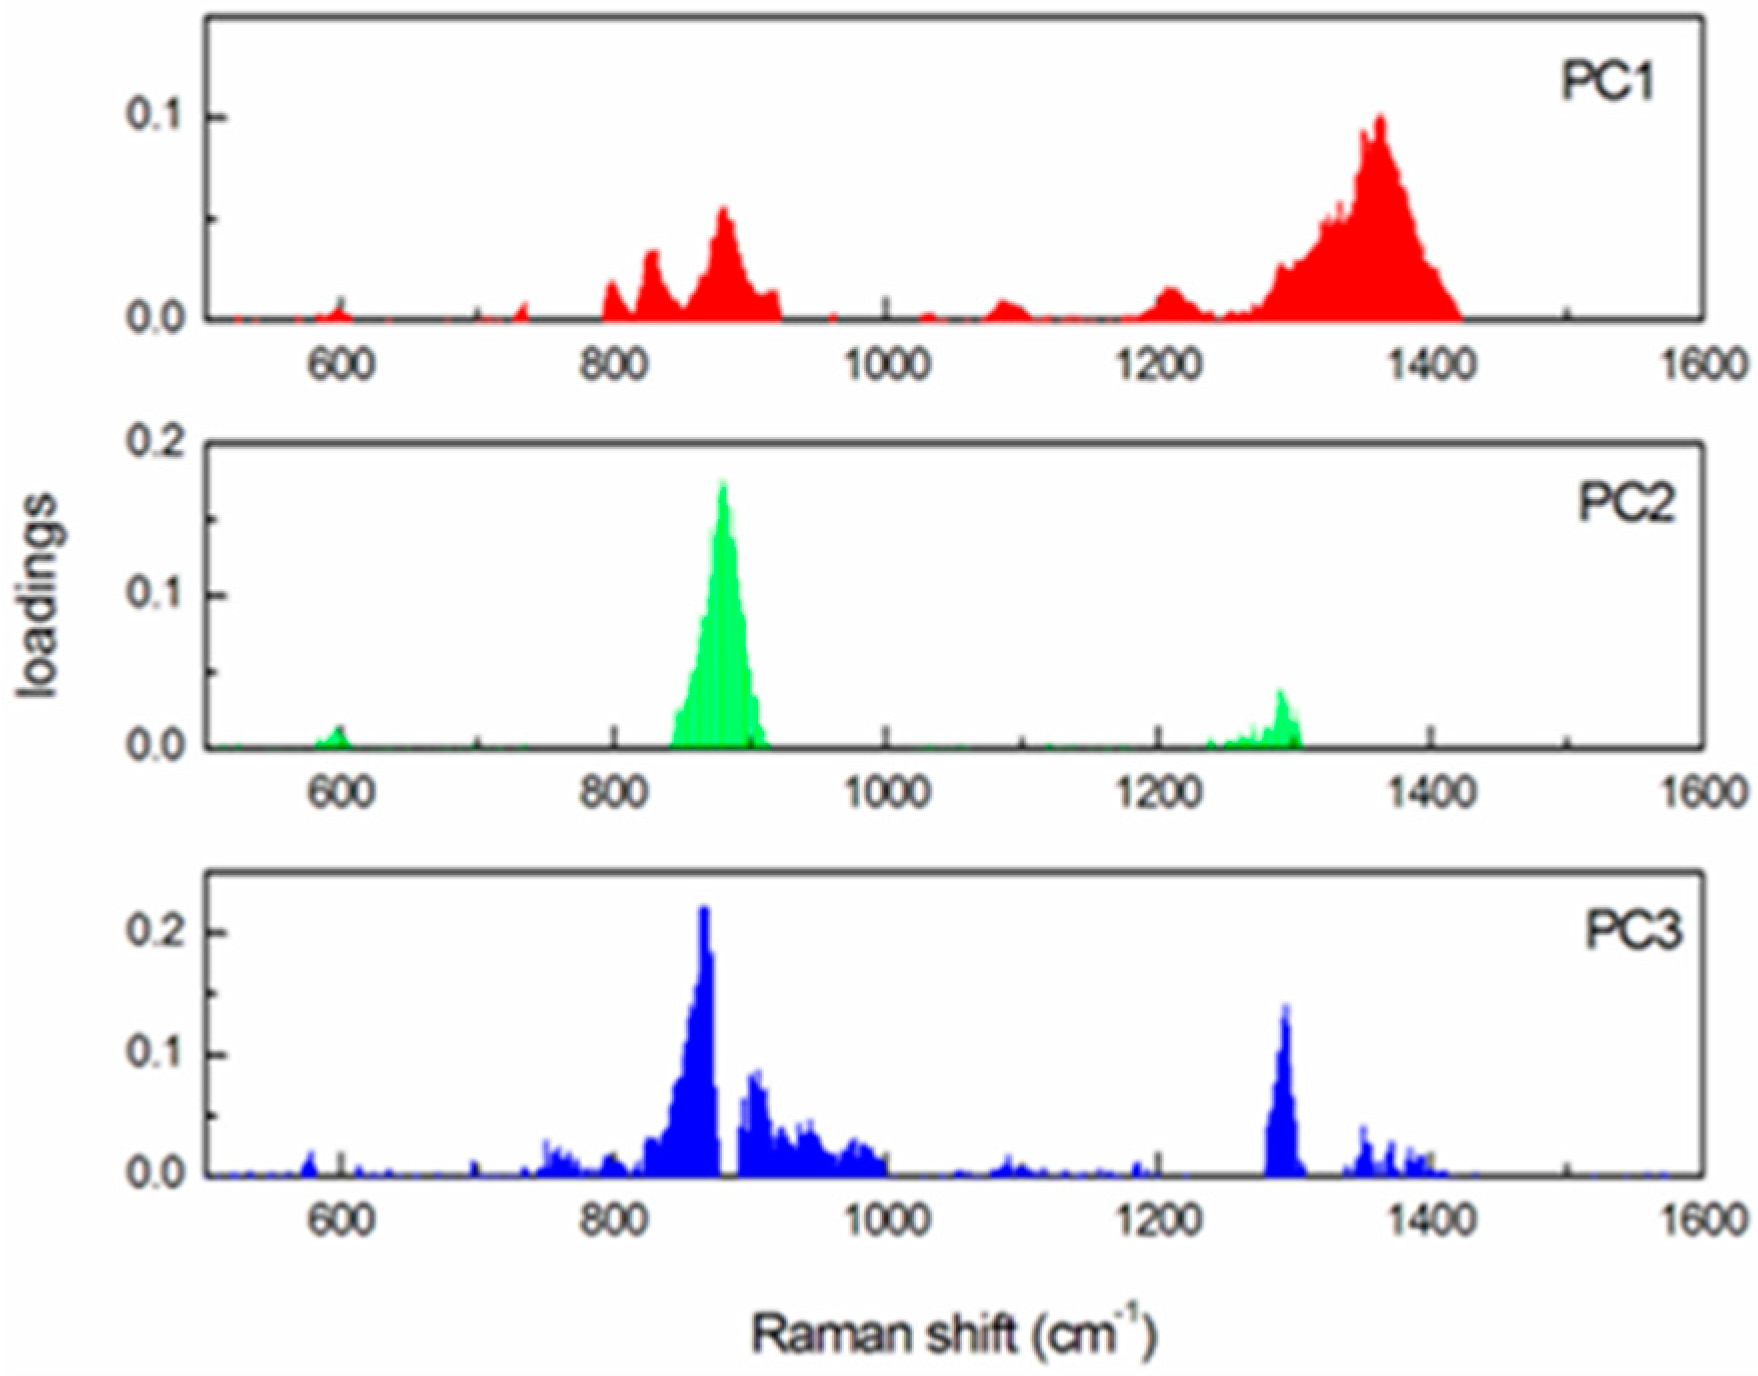
3.3. Principal Component Analysis
Principal component analysis (PCA) [
34] was employed to classify the data and obtain information about the factors which produce changes in Raman spectra across the samples.
Spectra were normalized in advance to their maximum value and analyzed in the 300–1600 cm−1 region, which contains all the relevant vibrational features. In this way, a data matrix of 168 samples and 818 data points was built to be submitted to the PCA algorithm, developed in a MatLab environment.
PCA showed that 67% of all the spectral variation could be accounted for by the first three principal components (PC1, PC2, PC3), the loading plots of which are reported in
Figure 4.
The first principal component, PC1, indicates that the NO2 symmetric stretching (1360 cm−1), the NO2 scissoring modes (790–820 cm−1) and the C-N-C ring breathing mode (887 cm−1) contribute 36.3% to the total variance of the spectral data. The PC2 component, explaining 27.3% of the spectral variance, matches the vibrational modes of the C-N-C ring (887 cm−1). The loading plot for PC3, which explains only 3.4% of the spectral variance, shows, apart from strong features already explained by PC1 and PC2, a band corresponding to the NO2 symmetric stretching vibration (1290 cm−1) relevant in nitrate ester compounds.
The analysis of the PC1/PC2 score plot (
Figure 5) clearly shows the differentiation of the samples.
In this plot, each sample is represented by a point and four groups, each corresponding to an explosive compound. Only two components, PC1 and PC2, which explain 63.6% of the spectral variance between samples, could be sufficient to describe the data set, as evidenced in
Figure 5. In
Figure 6, the three-dimensional (3D) plot of PC1, PC2 and PC3 (67% of the total variance) shows that the application of PCA to the SERS spectra allows us to clearly discriminate the compounds and reduce the 818 different wavelengths of each spectrum output to only three components which correctly classify the samples.
In spite of the small number of chemical species in the dataset, these results represent an important step in demonstrating that the rapid identification of explosive compounds in traces by applying PCA to SERS spectra is feasible.
4. Conclusions
In this study we have verified the functionality of the Serstech R785 mini-spectrometer as the main component of a standalone Raman apparatus for the in situ detection and identification of explosives in trace amounts.
Our measurements have shown that it is possible to identify explosive compounds in quantities as low as 200 pg using this miniaturized Raman platform combined with the SERS technique.
Moreover, the use of a microscopic optic to identify and investigate the sample suggests a possible upgrade to the current handheld Raman devices.
PETN, EGDN, TNT, and RDX, belonging to the three major classes of nitro-based explosives, were clearly distinguished on the basis of their SERS spectra, showing sharp and well-resolved peaks easily attributed to the vibrational modes of some functional groups, in agreement with the literature. Observation of the SERS substrates by SEM showed that only a fraction of the SERS-active sites are occupied by the substances, while others appeared completely empty. PCA was applied as a chemometric method to clearly distinguish and classify the spectra of each compound. The results clearly show the differentiation of samples in the PCs’ space, explaining more than 60% of the spectral variance with only the first two or three principal components, demonstrating the potentialities of this technique for classifying larger training sets, even at such low quantities.
The reported results suggest that handheld devices are nowadays fully compliant for the in situ investigation of trace amounts of explosives or other illegal chemical compounds, such as, for example, drugs or counterfeit medicines, especially in conjunction with SERS spectroscopy. Although at a prototypal state, we have shown the potentialities of a highly miniaturized spectrometer-detector joined with a portable microscope. The advantage and novelty of this setup is to carefully select the point to be investigated, and therefore avoid possible overlaps of the Raman signals from simultaneously excited substances, especially on composite samples.
Author Contributions
Antonio Palucci, Sabina Botti and Salvatore Almaviva conceived the experiments. Salvatore Almaviva, Sabina Botti and Antonio Puiu performed the experiments and did the Raman measurements. Sabina Botti and Salvatore Almaviva interpreted the results according to literature data. Alessandro Rufoloni performed the SEM images of the samples. Adriana Puiu did the PCA chemometrics of the data. Salvatore Almaviva wrote the article.
Conflicts of Interest
The authors declare no conflict of interest.
References
- Gardiner, D.J.; Graves, P.R. Practical Raman Spectroscopy; Springer-Verlag: Berlin, Germany, 1989. [Google Scholar]
- Izake, E.L. Forensic and homeland security applications of modern portable Raman Spectroscopy. J. Forensic Sci. 2010, 202, 1–8. [Google Scholar] [CrossRef] [PubMed]
- Bass, V.C. Identification of benzodiazepins by Raman spectroscopy. J. Forensic Sci. 1978, 23, 311–318. [Google Scholar] [CrossRef]
- Ryder, A.G.; O’Connor, G.M.; Glynn, T.J. Identifications and quantitative measurements of narcotics in solid mixtures using near-IR Raman spectroscopy and multivariate analysis. J. Forensic Sci. 1999, 44, 1013–1019. [Google Scholar] [CrossRef]
- Ryder, A.G.; O’Connor, G.M.; Glynn, T.J. Quantitative analysis of cocaine in solid mixtures using Raman spectroscopy and chemometric methods. J. Raman Spectrosc. 2000, 31, 221–227. [Google Scholar] [CrossRef]
- Carter, C.J.; Brewer, W.E.; Angel, M.S. Raman spectroscopy for the in situ identification of cocaine and selected adulterants. Appl. Spectrosc. 2000, 54, 1876–1881. [Google Scholar] [CrossRef]
- De Veij, M.; Vandenabeele, P.; De Beer, T.; Remonc, J.P.; Moens, L. Reference database of Raman spectra of pharmaceutical excipients. J. Raman Spectrosc. 2009, 40, 297–307. [Google Scholar] [CrossRef]
- López-López, M.; García-Ruiz, C. Infrared and Raman spectroscopy techniques applied to identification of explosives. Trends Anal. Chem. 2014, 54, 36–44. [Google Scholar] [CrossRef]
- Christesen, S.D.; Fountain, A.W., III; Emmons, E.D.; Guicheteau, J.A. Raman Detection of Explosives. In Laser-Based Optical Detection of Explosives; Pellegrino, P.M., Holthoff, E.L., Farrell, M.E., Eds.; CRC Press: Boca Raton, FL, USA, 2015; pp. 99–122. [Google Scholar]
- Moore, D.S.; Scharff, R.J. Portable Raman explosives detection. Anal. Bioanal. Chem. 2009, 393, 1571–1578. [Google Scholar] [CrossRef] [PubMed]
- Fleischmann, M.; Hendra, P.J.; McQuillan, A.J. Raman spectra of pyridine adsorbed at a silver electrode. Chem. Phys. Lett. 1974, 26, 163–166. [Google Scholar] [CrossRef]
- Jeanmarie, D.L.; Van Duyne, R.P. Surface Raman electrochemistry. Part 1. Heterocyclic, aromatic and aliphatic amines adsorbed on the anodised silver electrode. J. Electroanal. Chem. 1977, 84, 1–20. [Google Scholar]
- Otto, A. Surface-enhanced Raman scattering: “Classical” and “Chemical” origins. In The Ligth Scattering in Solids IV, Electronic Scattering, Spin Effects, SERS, and Morphic Effects; Cardona, M., Güntherodt, G., Eds.; Springer: Berlin, Germany, 1984; pp. 289–418. [Google Scholar]
- Le Ru, E.C.; Etchegoin, P. Principles of Surface Enhanced Raman Spectroscopy and Related Plasmonic Effects, 1st ed.; Elsevier: Amsterdam, The Netherlands, 2009. [Google Scholar]
- Le Ru, E.C.; Blackie, E.; Meyer, M.; Etchegoin, P.G. SERS enhancement factors: A comprehensive study. J. Phys. Chem. C 2007, 111, 13794–13803. [Google Scholar] [CrossRef]
- Efrima, S.; Metiu, H. Classical theory of light Sacttering by an adsorbed molecule. J. Chem. Phys. 1979, 70, 1602–1613. [Google Scholar] [CrossRef]
- Gersten, J.; Nitzan, A. Electromagnetic theory of Enhanced Raman-scattering by molecules adsorbed on rough surfaces. J. Chem. Phys. 1980, 73, 3023–3037. [Google Scholar] [CrossRef]
- Campion, A.; Ivanecky, J.E.; Child, C.M.; Foster, M. On the mechanism of chemical enhancement in surface-enhanced Raman scattering. J. Am. Chem. Soc. 1995, 117, 11807–11808. [Google Scholar] [CrossRef]
- Koo, T.W.; Chan, S.; Sun, L.; Su, X.; Zhang, J.; Berlin, A.A. Specific chemical effects on surface enhanced Raman spectroscopy for ultra-sensitive detection of biological molecules. Appl. Spectrosc. 2004, 58, 1401–1407. [Google Scholar] [CrossRef] [PubMed]
- Doering, W.E.; Nie, S.N. Single-molecule and single nanoparticle SERS: Examining the roles of surface active sites and chemical enhancement. J. Phys. Chem. B 2002, 106, 311–317. [Google Scholar] [CrossRef]
- Lewis, I.R.; Daniel, N.W.; Griffiths, P.P. Interpretation of Raman spectra of nitro-containing explosives materials. Part I: Group frequency and structural class membership. Appl. Spectrosc. 1997, 51, 1854–1867. [Google Scholar] [CrossRef]
- Botti, S.; Almaviva, S.; Cantarini, L.; Palucci, A.; Puiu, A.; Rufoloni, A. Trace level detection and identification of nitro-based explosives by surface-enhanced Raman spectroscopy. J. Raman Spectrosc. 2013, 44, 463–468. [Google Scholar] [CrossRef]
- Botti, S.; Almaviva, S.; Cantarini, L.; Fantoni, R.; Lecci, S.; Palucci, A.; Puiu, A.; Rufoloni, A. Ultrasensitive RDX detection with commercial SERS substrates. J. Raman Spectrosc. 2014, 45, 41–46. [Google Scholar]
- Hakonen, A.; Andersson, P.A.; Stenbæk Schmidt, M.; Rindzevicius, T.; Käll, M. Explosive and chemical threat detection by surface-enhanced Raman scattering: A review. Anal. Chim. Acta 2015, 893, 1–13. [Google Scholar] [CrossRef] [PubMed]
- Hakonen, A.; Rindzevicius, T.; Stenbæk Schmidt, M.S.; Andersson, P.O.; Juhlin, L.; Svedendahl, M.; Boisen, A.; Käll, M. Detection of nerve gases using surface-enhanced Raman scattering substrates with high droplet adhesion. Nanoscale 2016, 8, 1305–1308. [Google Scholar] [CrossRef] [PubMed] [Green Version]
- Hatab, N.A.; Eres, G.; Hatzingerc, P.B.; Gua, B. Detection and analysis of cyclotrimethylenetrinitramine (RDX) in environmental samples by surface-enhanced Raman spectroscopy. J. Raman Spectrosc. 2010, 41, 1131–1136. [Google Scholar] [CrossRef]
- Farrell, M.E.; Holthoff, E.L.; Pellegrino, P.M. Next generation Surface Enhanced Raman Scattering (SERS) substrates for Hazard Detection. In Proceedings of the Chemical, Biological, Radiological, Nuclear, and Explosives (CBRNE) Sensing XIII, Baltimore, MD, USA, 24–27 April 2012; Volume 835816, pp. 1–11.
- Perney, N.M.B.; García de Abajo, F.J.; Baumberg, J.J.; Tang, A.; Netti, M.C.; Charlton, M.D.B.; Zoorob, M.E. Tuning localized plasmon cavities for optimized surface-enhanced Raman scattering. Phys. Rev. B 2007, 76, 035426. [Google Scholar] [CrossRef] [Green Version]
- Kelf, T.A.; Sugawara, Y.; Baumberg, J.J.; Abdelsalam, M.; Bartlett, N. Plasmonic bandgaps and trapped plasmons on nanostructured metal surfaces. Phys. Rev. Lett. 2005, 95, 116802. [Google Scholar] [CrossRef] [PubMed]
- ImageJ. Available online: https://imagej.nih.gov/ij/ (accessed on 7 July 2016).
- Gruzdkov, Y.A.; Gupta, Y.M. Vibrational properties and structure of pentaerythritol tetranitrate. J. Phys. Chem. A 2001, 105, 6197–6202. [Google Scholar] [CrossRef]
- Gong, X.D.; Xiao, H.M. Studies on the molecular structure, vibrational spectra and thermodynamic properties of organic nitrate using density functional theory and ab initio methods. J. Mol. Struct. (Theochem.) 2001, 572, 213–221. [Google Scholar] [CrossRef]
- Lin-Vien, D.; Colthup, N.B.; Fateley, W.G.; Grasselli, J.G. The Handbook of Infrared and Raman Characteristic Frequencies of Organic Compound; Academic Press Inc.: Boston, MA, USA, 1991. [Google Scholar]
- Abdi, H.; Williams, L.J. Principal component analysis. Comput. Stat. 2010, 2, 433–459. [Google Scholar] [CrossRef]
© 2016 by the authors; licensee MDPI, Basel, Switzerland. This article is an open access article distributed under the terms and conditions of the Creative Commons Attribution (CC-BY) license (http://creativecommons.org/licenses/by/4.0/).


 ,
, 