1. Introduction
Crime scene investigators (CSI) often play an awkward role in protecting areas involved in crimes, preserving and collecting physical evidence to be submitted to laboratories for scientific examinations. In fact, evidence addresses investigations and can lead to a resolution of criminal cases if they are accurately selected and collected, and kept to maintain their legal value and scientific significance [
1]. The CSI role is even more delicate in cases of post-blast scenes, for example, when a terroristic attack has taken place, where evidence is spread randomly over large areas. Moreover, defining a sole improvised explosive device (IED) type is not possible: terroristic acts based on the use of IEDs can have several different purposes and characteristics. In fact, both places and targets can differ substantially: IED incidents can usually take place on open ground, on different means of transportation, or in various kinds of public buildings, depending on the objectives of the attack that can be achieved for wounding of authorities or citizenry. Moreover, the consequences of a blast are strictly dependent on the geometry of the bombing site. In addition to clear difficulties in individuating and collecting the most significant evidence in a post-blast scene, often such analysis is made more complex by the risk of the presence of other unexploded bombs at the scene and by the necessity to restore order, safety, and practicability as soon as possible. These factors affect the choice of the most suitable methods for evidence collection: a hard and time consuming process for security forces that strongly require new systems for a fast, remote, and safe individuation of relevant evidence [
2,
3].
The Forlab (Forensic Laboratory for in-situ evidence analysis in a post blast scenario) project has, as a main goal, to develop a network of sensors that could provide a new methodology to optimize evidence collection. In particular, it is devoted to realizing a real-time self-adaptable feedback loop between the data collection process and the control center to help security forces in reducing the number of samples to collect and in hastening and improving the screening phase. In this frame, the detection and characterization of plastics (i.e., commercial synthetic polymers generally used for packaging and electronics, such as PE (polyethylene), PP (polypropylene), PET (polyethylene terephthalate), polyester, etc.) are of particular interest for the reconstruction of the device used to produce the explosion, often a sort of fingerprint of the terroristic group responsible for the attack. Moreover, while several efforts have been conducted, so far, to develop fast and reliable techniques for in situ detection and recognition of different explosives [
4,
5], only a few papers deal with the study of other types of debris in post-blast scenes [
6].
In the frame of the Forlab project, one of the techniques selected for the post-blast scene analysis is laser induced fluorescence (LIF) [
7], for the rapid detection of plastic materials that could constitute the IED boxes or components. In fact, the LIF technique allows obtaining chemical information on the surface composition of the exposed target [
8,
9]. To satisfy the end user’s requirements, ENEA (Italian National Agency for new technologies, energy and sustainable economic development) developed a transportable standoff scanning LiDAR fluorosensor prototype, based on LIF, characterized by high spatial resolution, but a large field of view, by short operation times both in indoor and outdoor scenarios also under hostile conditions, and online answer capabilities. This is a multispectral system allowing for the rapid collection of large images on several different spectral channels.
In the following sections details about the design of the developed system will be presented.
2. Materials and Methods
LIF Technique
The LIF technique is a molecular spectroscopy method for analyses of surfaces, based on the study of the effects of the interaction of ultraviolet (UV) laser radiation with matter [
10]. The emission of radiation by luminescent materials is observed whenever absorption of energy is sufficient to activate the occurrence of allowed electronic transitions. Laser-induced fluorescence (LIF) has found widespread application in different fields for materials study and characterization thanks to its unique properties to be a non-destructive and non-invasive, remote (i.e., able to work at a distance of several meters from the target), with no sampling requirements, based on transportable or portable instruments that can provide prompt results in real-time [
11].
In a typical LiDAR fluorosensor, a laser beam at UV wavelengths irradiates a sample and an optical system measures the fluorescence spectrum. The analysis of received optical signals gives information on the spectral properties of the compounds constituting the target surface [
12]. The use of lasers, instead of other sources, is motivated by the easiness to build compact systems that produce highly-focused, low-divergence beams with extremely high brightness and monochromatic excitation.
The main components of the setup are a laser excitation source and a spectrum analyzer: although continuous-wave lasers are sometimes used to record fluorescence spectra, more typical is the use of a pulsed laser operating in the UV. The laser beam is directed to the sample surface by the use of mirrors or prisms or by using an optical fiber. The emitted light is collected with optical systems (usually constituted by optical fibers and/or lenses and objectives) to direct the fluorescence emission to the entrance port of the spectrum analyzer.
For spectral analysis coupling of the monochromator and photomultiplier or spectrograph, an intensified charged coupled device (ICCD) camera can be used. The advantage of the latter is that the whole spectrum can be acquired in only one laser pulse, whereas the former requires one pulse per wavelength. In advanced fluorescence systems emission lifetime can be also measured, providing additional discriminating capability.
For the present work an innovative LIF scanning prototype for fluorescence imaging of large areas has been designed and developed to fulfill the end user’s requirements. Details are presented in the next sections.
3. Prototype Design
The general idea of the system is based on the use of motorized delivering optics to scan the laser spot across the entire area to be investigated, and a fixed collecting subsystem connected to an ICCD with large field of view (FOV). Its use, in front of the ICCD conveniently triggered by the laser pulse, of a selection of narrow band pass filters allows for the elimination of dispersion elements.
Fast data processing, due to the system’s capability to obtain information at spectral regions of interest by means of preselected filters, coupled with an efficient overlap of resulting LIF images to pictures from a regular camera and 3D images from other acquisition systems, have been crucial points for the design of the prototype, taking into account the main requirements of fast screening of post-blast evidence and a reduced amount of evidence to be sent to the reference forensic laboratory.
Moreover, the LIF scanning system can be utilized, with the laser switched off, to collect reflectance images as spatial references for evidence locations upon the availability of an intense standard light source.
3.1. Source Selection
To select the most suitable excitation source, the main end user’s requirements have been taken into account: target-scan system distance of some meters, operability on large areas (about 100 m
2), and spatial resolution on the order of centimeters. After a first screening, two possible alternatives for lasers have been studied:
The main parameters considered here have been the maximum pulse repetition rate (PRR) and the maximum energy delivered per pulse. The laser energy per shot can be up to approximately 16 mJ for the excimer and up to 50 mJ for the Nd:YAG. The PRR can be up to 500 Hz for the excimer laser and up to 30 Hz for the solid state one. In order to choose the laser, the minimum laser fluence impinging the target to have a sufficient signal to noise ratio had to be evaluated. In fact, the lower this value, the more convenient the excimer laser is, since a method to lower the acquisition time is to increase the laser PRR. In general, the higher PRR of the excimer laser is advantageous only if the speed of the optics movement for the scan and the CCD acquisition time fit the laser frequency value.
Thanks to laboratory tests, it has been verified that the fluence delivered by the KrF (on the native spot and on spots expanded up to 10 times) allows for S/N ratio higher than 10 in all studied samples. Moreover, in the laboratory, several damage tests have been performed to verify the effect of UV-LIF on the materials under consideration. The absence of color changes has been verified using colorimetry and reflectance measurements during successive UV laser irradiations. Additionally, any mechanical damages have been excluded by direct inspection with a Leica MZ 75 stereomicroscope (Leica Microsystems GmbH, Wetzlar, Germany) [
13].
Based on these considerations, the KrF laser has been selected and coupled with electronics and motors with suitable speeds. Its main characteristics are reported in
Table 1.
3.2. Sending, Collection, and Detection Subsystems
The sending, collection, and detection subsystems of the sensor are comprehensive of an optical system and a detector. The definition of the scheme and the characteristics of the optical system were a complex task because of the several trade-offs to be considered. In particular, spectral resolution and time needed to complete the image acquisition, scanned area size and spatial resolution, and the limit of detection (depending also on the total laser energy) had to be carefully considered since they are crucial parameters for the sensor performance.
3.2.1. Detector
According to the sensor design, the detector has to be used as an imaging sensor. The necessity to increase, as much as possible, the signal to noise ratio led to a preference for an intensified CCD (ICCD) sensor over a classic CCD. The requirements of the target-scan system distance determined by the scenario definition (up to 20 m) and on the spatial resolution indicated by the end users (cm) have been achieved by using an ICCD with the effective active area of 13.3 × 13.3 mm and 1024 × 1024 active pixels.
3.2.2. Optics
The optical system consists of two different subsystems: the first one drives the radiation to the target surface and the second one collects the fluorescence signal and sends it to the detection unit. The collecting optics are an objective with a focal length of 27 mm, equipped with an interferential filter for the removal of elastic back-scattering and a motorized filter wheel for band selection. The objective is characterized by achromaticity in the spectral range 280–720 nm and a motorized actuator for the back focal length adjustment. Due to the ICCD sensor dimensions, considering the focal length of the optics, the acquiring system has an effective FOV of no more than 45° on the diagonal.
The delivering optics are made up of a 45° mirror, a beam expander, and a motorized steering mirror sending the laser beam (with corrected divergence) to the target surface. Mirrors have specific antireflective coating for 248 nm radiation and surface hardening treatment to withstand the energy density produced by the laser source. Selection of the beam expander and motors has been a sensitive subject. For the latter the main criterion has been the maximum scan velocities that had to fit with the laser pulse repetition rate (PRR) and the speed of the detector electronics. Starting from these considerations, rotation stages characterized by high angular resolution and equipped with ultra-precise, ultra-low-friction motor drives (with the feature of a directly-coupled motor/encoder) have been selected. In particular, the velocities of the chosen motors are 90 degrees/s for the horizontal movement and 2 degrees/s for the vertical movement. These values, together with the PRR value of 400 Hz, have been used to calculate the beam expansion needed. In fact, taking into account the angular range to be covered of 45° (i.e., 785 mrad, approximately the FOV of the detector) the scan time is 0.5 s and, then, 200 laser shots are necessary to fill every line of the scan. Since the horizontal divergence of the beam at the exit is 0.5 mrad, a further spread of 8× is necessary for a complete sampling of the line. Even if a slight oversampling is likely, this does not constitute a problem for the retrieval.
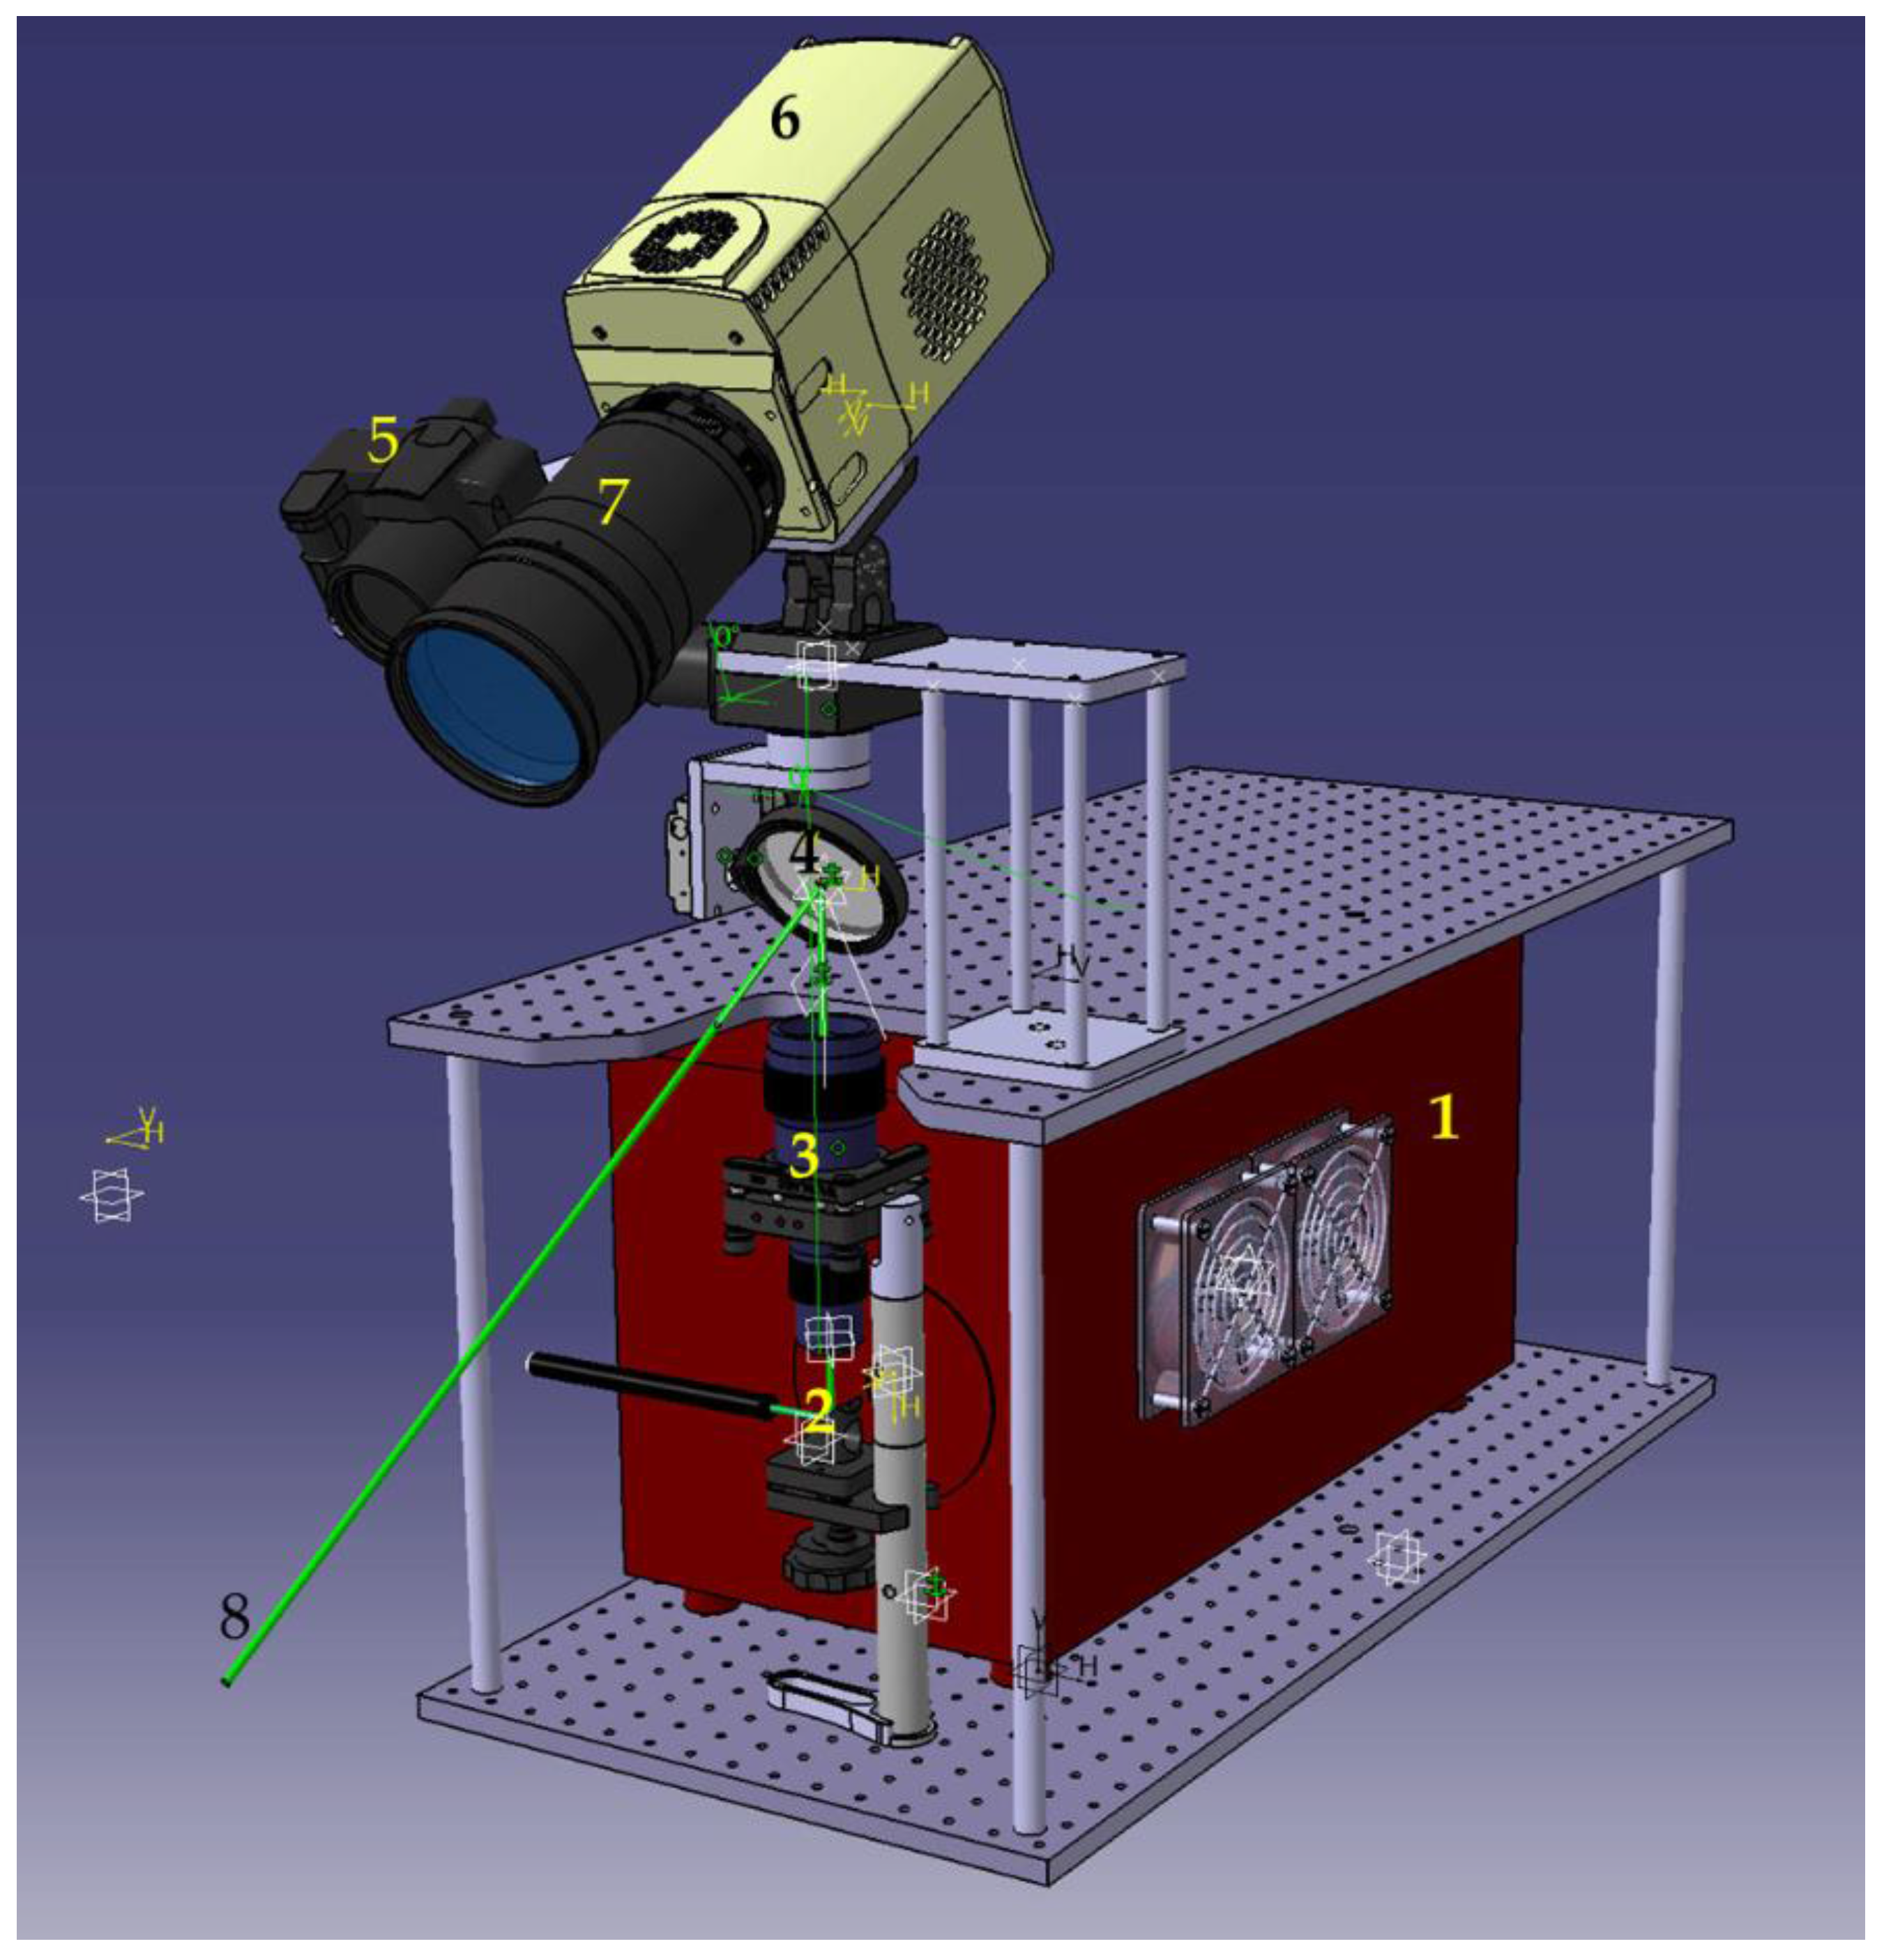
A CAD drawing of the system design if shown in
Figure 1, where the different components of the sending, collection, and detection subsystems are numbered.
3.2.3. Filters
Bandpass filters have been positioned at the entrance of the detector in order to acquire only interesting spectral ranges, since the sensor had to be set to quickly individuate only a specific class of materials: plastics. To obtain such result, a first preparatory phase for the identification of spectral characteristics suitable for fast screening and targeting of plastic debris has been necessary. The recognition of relevant bands and then of filter wavelengths is especially important to produce, in real-time fluorescence and false color images, results that are easily legible by users and that can be easily superimposed to pictures and 3D images of the post-blast scene under study. In the study of filter bands to be used in the LIF system, two different approaches have been considered:
To look for bands that maximize the ability of the LIF images to distinguish among different materials that can compose IEDs, such as plastic materials from containers, electronic boards, wires, etc.
To look for bands that maximize the ability of the LIF images to distinguish between materials that could be part of IEDs and any other interfering materials that can be found in the scene, such as sand, building fragments, woods, plants, etc.
Thanks to this method (described in detail elsewhere [
14] and briefly recalled in
Section 3.4) the most meaningful fluorescence bands have been identified and the necessary interferential filters selected (Please note that data about wavelengths selected for filters are undisclosed for classification reasons).
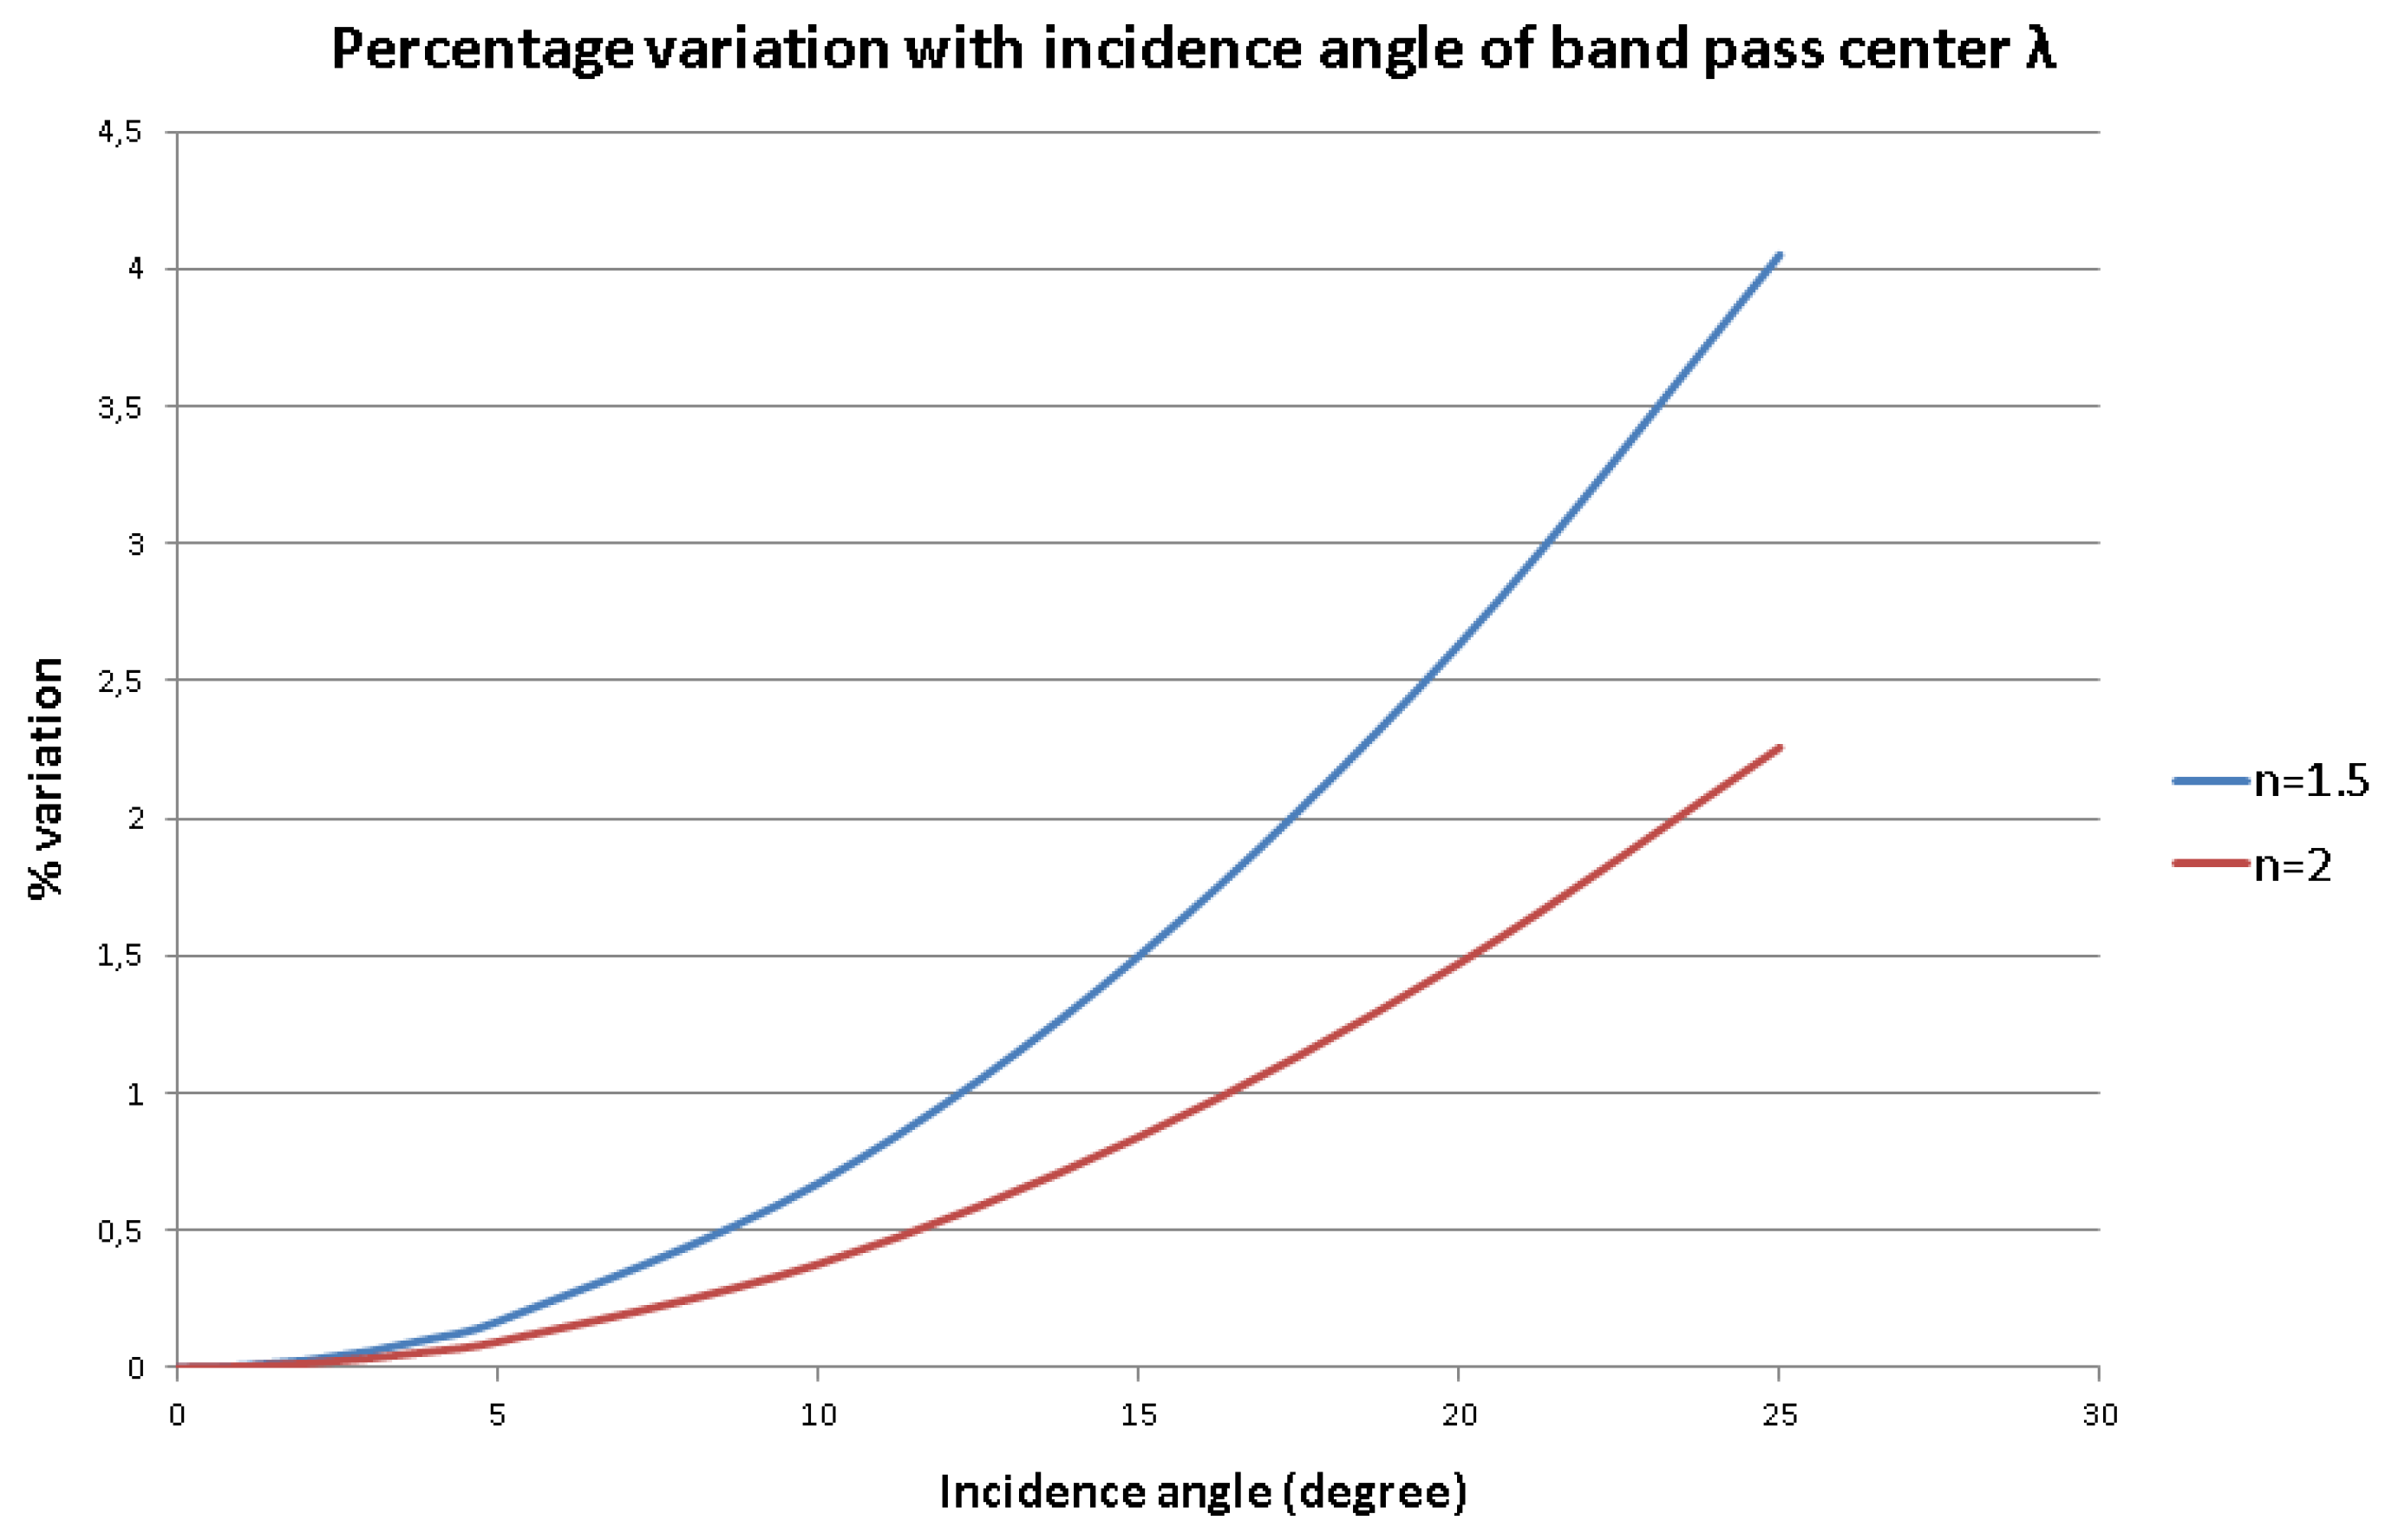
Since, as already mentioned, the acquiring system has a FOV of about 45°, fluorescence signals reach the filter with different tilt angles, depending on the angle of view in respect to the optical axis of the system. Consequently, a wavelength shift of the bandpass center of the filter has to be considered, according to the formula:
where λ
c is the bandpass center wavelength at θ, the angle of incidence in respect to the normal, and λ
0 is the wavelength of the bandpass center at a normal incidence. Moreover, the transmittance decreases with an increment of θ; this effect is lower than the one related to the wavelength shift of the bandpass, but it must be considered to compare spectra relative to different ICCD pixels.
With filters with a refraction index in the range 1.5–2, the percentage variation of the bandpass center wavelength with the incidence angle, with respect to the normal, will have the behavior shown in
Figure 2 for wavelengths in the range 300–650 nm.
Instead, given the apparatus characteristics and the expected applications, the dependence of the filter characteristics (transmission and bandpass center wavelength) with the temperature can be considered negligible [
15].
3.3. System Management and Data Acquisition Software
Thanks to the acquisition software it is possible to envisage every single step, listed below, that has to be accomplished to guarantee the quality of the results during the scene analysis:
Scene definition: Definition of the physical limits of the area to be studied. Positioning of system motors. Use of the standard camera for scene monitoring.
Receiver optimization: Focusing of the objective on the scene. Setting of the ICCD and laser parameters by software.
ICCD setting and calibration: System calibration with set parameters. Background acquisition. ICCD parameters setting.
Data acquisition: Selection between fluorescence or reflectance acquisition mode. Acquisition of the scene.
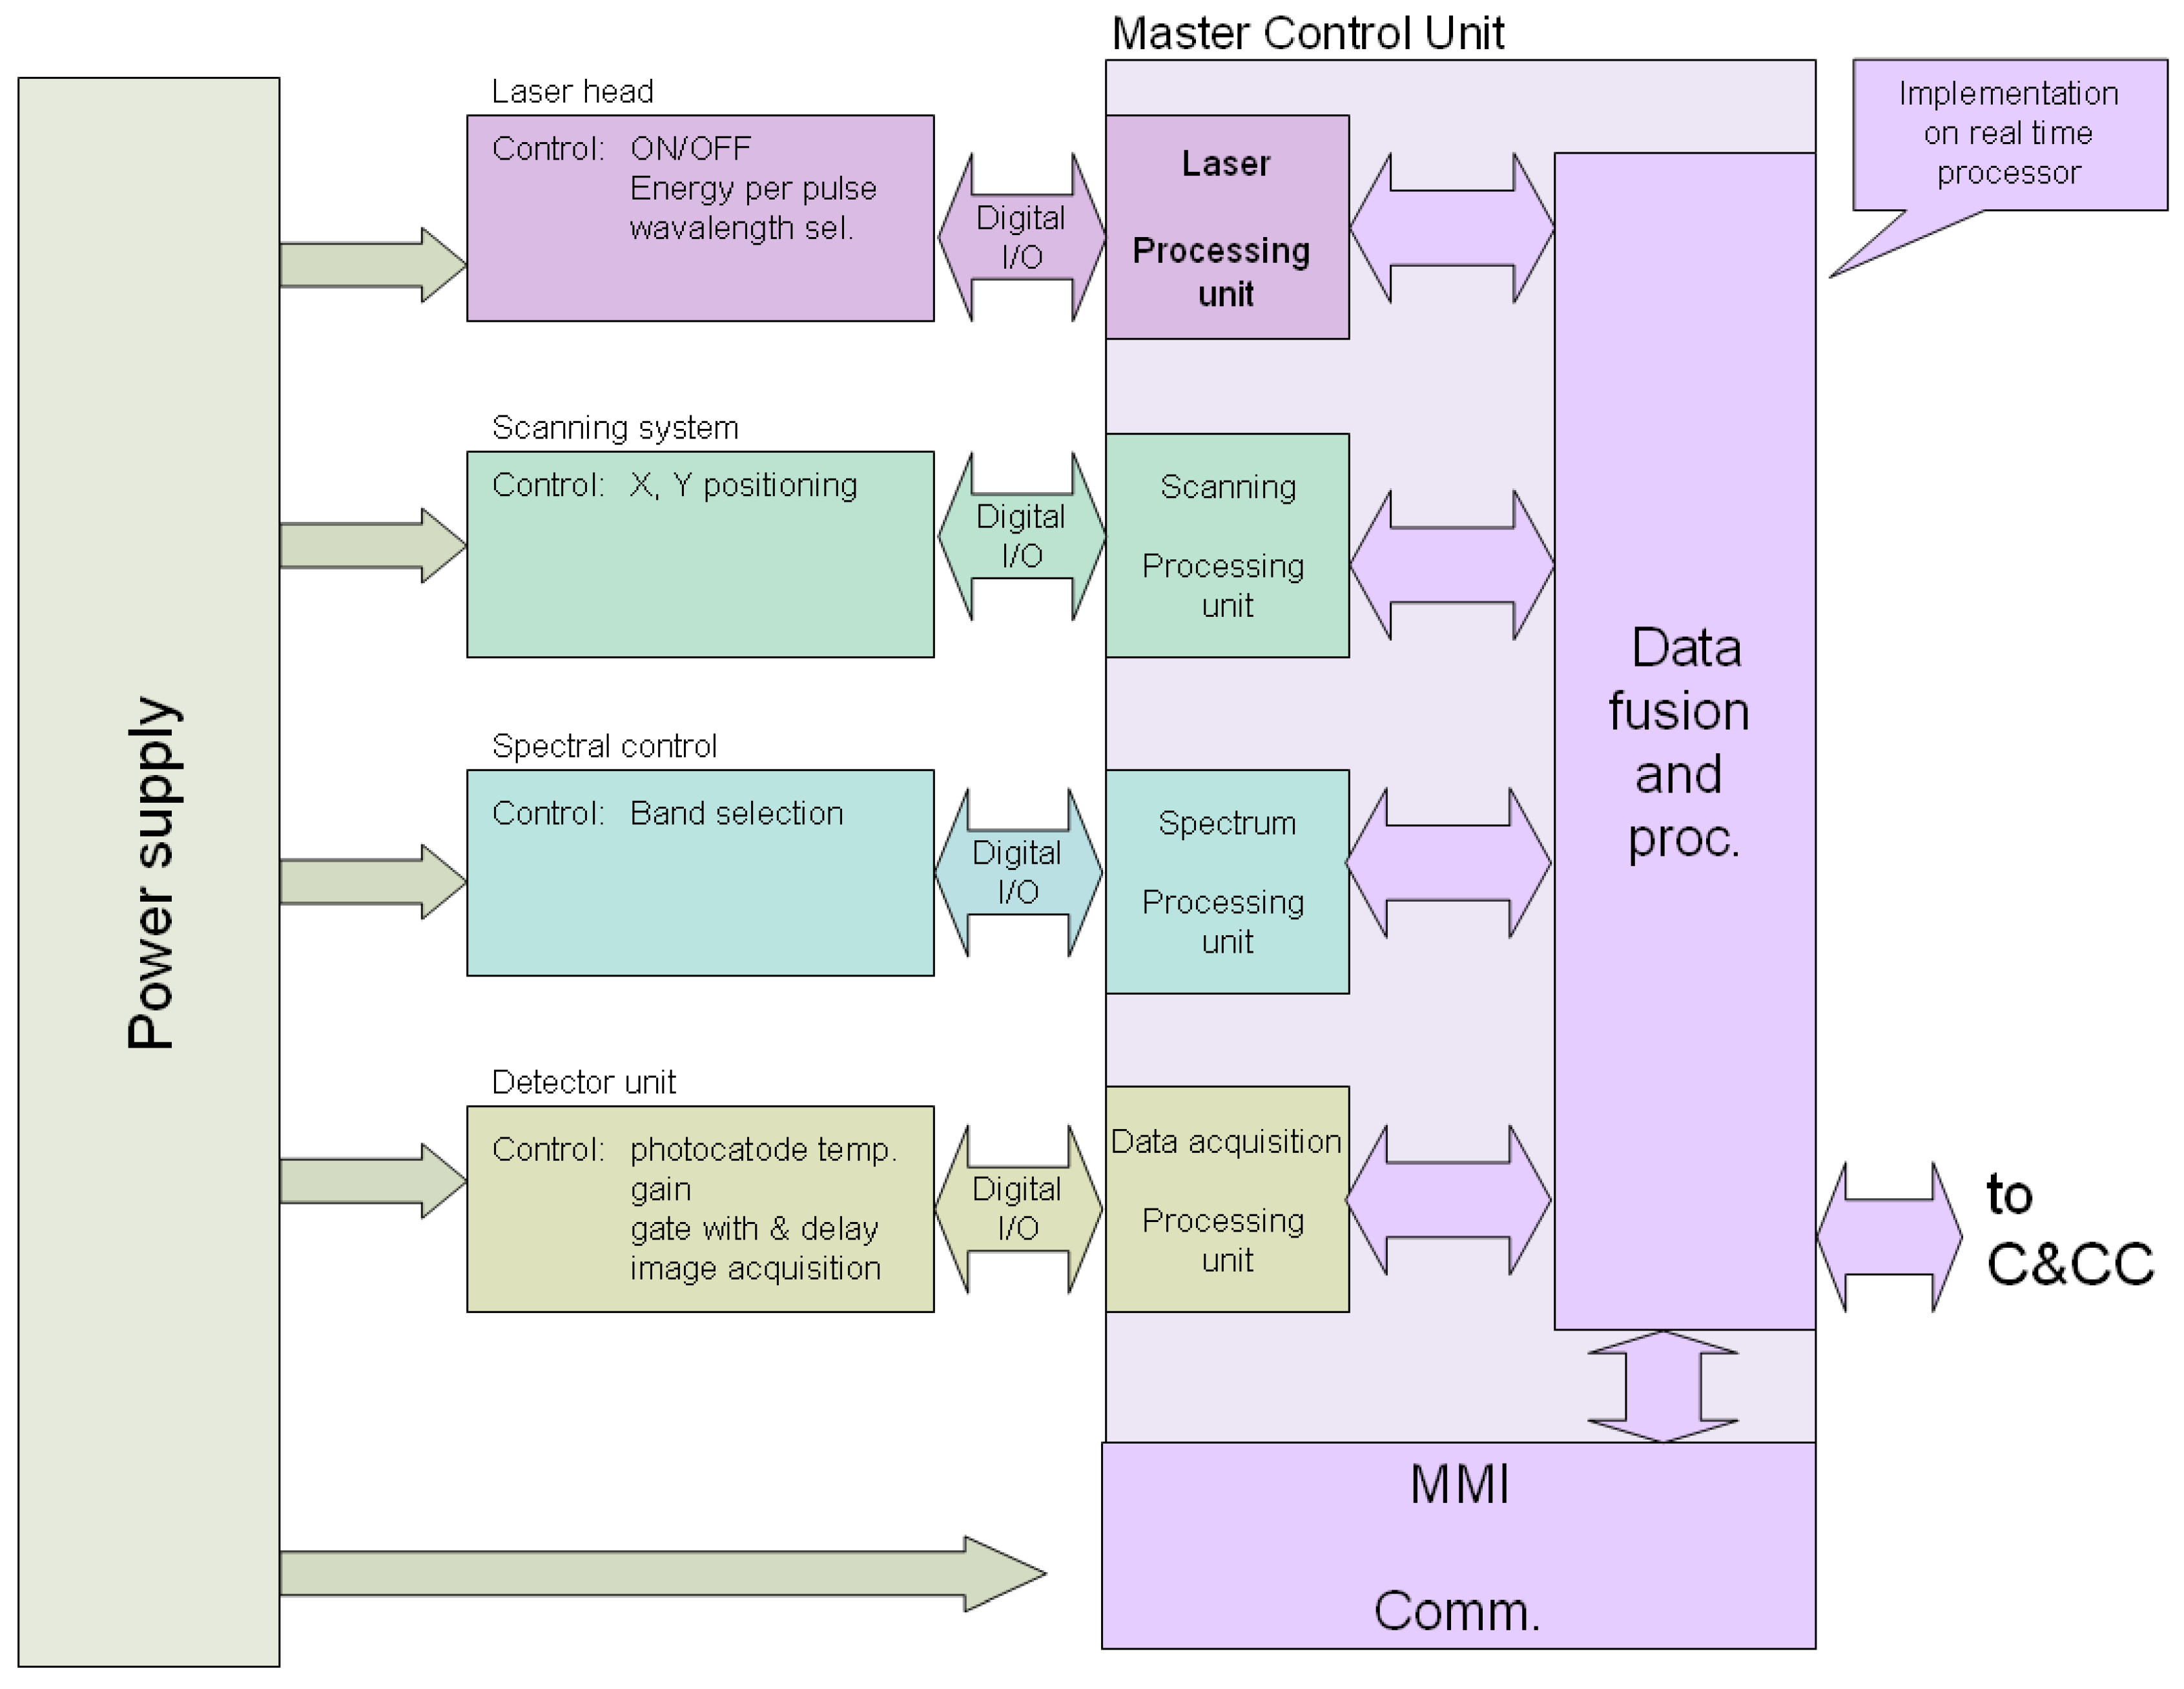
As described above, the LIF system can be schematically divided into sub-components that must be interconnected and controlled by a main controller unit (MCU) providing the following services: scene delimitation, laser firing, spectral band selection, image acquisition, data pre-processing, and local and remote communications. The general system architecture is shown in
Figure 3.
3.4. Data Analysis Software
To develop data analysis software suitable for on line retrieving of material information, a preparatory work has been carried out in the laboratory to study and to characterize possible substances of interest. In particular, as described in detail elsewhere [
14], the most meaningful spectral features to discriminate between different plastic materials and between plastics and contaminant materials in a post-blast scene (as paper, wood, textiles, building materials, etc.) have been put in evidence also thanks to advanced statistical methods, such as principal component analysis (PCA) and clustering algorithms. Intensities at significant wavelengths have been used to produce ratios and algorithms functional to the discrimination. From hyperspectral images on known samples, threshold values for such ratios and algorithms have been individuated for an automatic recognition of plastics (Please note that data about wavelengths selected for filters are undisclosed for classification reasons). The developed approach has the characteristic of a very low computational cost, allowing a rapid first screen, coupled with a remarkable reduction of sensitivity.
Just to give the main characteristics of the developed method, some points will be briefly recalled here. Experimental fluorescence spectra induced by a laser operating at 266 nm for a large number of polymeric materials have been collected and deeply analyzed. For every type of plastic, spectra were collected from at least four different points of the surface in order to check and take into account the eventual heterogeneity of the sample. A large diversification among fluorescence profiles is present. Main characteristics bands were attributed according to the literature: sharp emissions about 350 nm can be assigned to the presence of carbonyl groups, typical of materials, such as vinylic glue, and present in polymers based on chains of methylene groups (such as polyethylene and polypropylene) because of the oxidation that naturally occurs in air. A weak band at 440 nm present in the fluorescence spectrum of some of the studied materials can be considered due to a charge-transfer complex of the polymer chain with oxygen. Furthermore, the large amount of bands present makes difficult a direct recognition of the material classes, as well as identifying the most significant bands, with the highest variance; thus, PCA has been used. Since many materials that can be found in post-blast scenes (as building materials, woods, etc.) present fluorescence bands close to, or overlapping, those of polymeric materials, it is clear that just the evaluation of the presence of a specific band or of its intensity is not sufficient for a reliable discrimination. Thus, specific ratios and algorithms were individuated on the basis of chemical considerations and used for material discrimination. To test the functionality of such ratios in separating plastics from other complex organic materials that can contaminate a scene, several LIF measurements were carried out on interfering materials in the same experimental conditions used for plastic analysis. After that, for a deeper investigation, fluorescence data on a selected set of the samples were used as the basis for clustering algorithm tests based on the K-means algorithm. Such study pointed out that, while a simple fluorescence intensity image (filtered at a selected band) is not able to provide any evaluable material discrimination, the cluster analysis performed, starting from identified ratios, discriminates well among different plastics and between plastics and contaminant materials. From the study of the behavior of the individuated ratios, and of the clusters obtained for several different materials, individual thresholds and ranges for every used ratio and algorithm were identified. Values over the threshold and/or in the range are supposed to be indicative of the presence of plastic.
4. Damage Tests on DNA Samples
On post-blast scenes and, in general, in crime scenes, often debris are mixed with precious DNA traces that must be preserved, with their legal value, for laboratory analysis. Thus, every technique used in the field before DNA sample collection must assure its total non-invasiveness. Additionally, for the presented instrument damage and invasiveness tests have been required to assure its ability to work in real environments without causing any trace loss. An evaluation of the effects of the use of a LIF scanning prototype on biological samples has been performed to verify that no changes or damages are induced on eventual body fluid evidence present in the scanned area.
Some samples of DNA (i.e., saliva) and latent fingerprints deposed on PET (polyethylene terephthalate) substrates provided by RaCIS (Forensic science laboratories of Carabinieri Force, Messina, Italy) have been irradiated as in real in situ conditions. Three different tests have been carried out. In the first case, three DNA samples were put in the scene in random positions. The area was scanned with the parameters usually used in real cases, as far as the pixel density (pixels with a side measurement of approximately 1.5 cm) and the laser energy (E = 16 mJ) are concerned. In the second case, two samples were irradiated with the same experimental parameters previously used (energy and matrix density), but staying perpendicular to the laser beam. In the third experiment, conditions were made more severe: one sample was arranged perpendicularly to the laser beam and the matrix density was approximately doubled. In this way the energy for the unit of area delivered to the surface was doubled. All irradiated samples were prepared at the same time and can be considered comparable. The DNA analysis carried out by RaCIS laboratory after irradiation confirmed that no sensitive effects have been induced on samples tested up to the current sensitivity limit. Additionally on latent prints no effects of the radiation have been detected. Such results give further evidence of the absolute noninvasiveness of the technique on biological fluids or remains even in experimental conditions much more severe than the ones used in the field.
5. Discussion
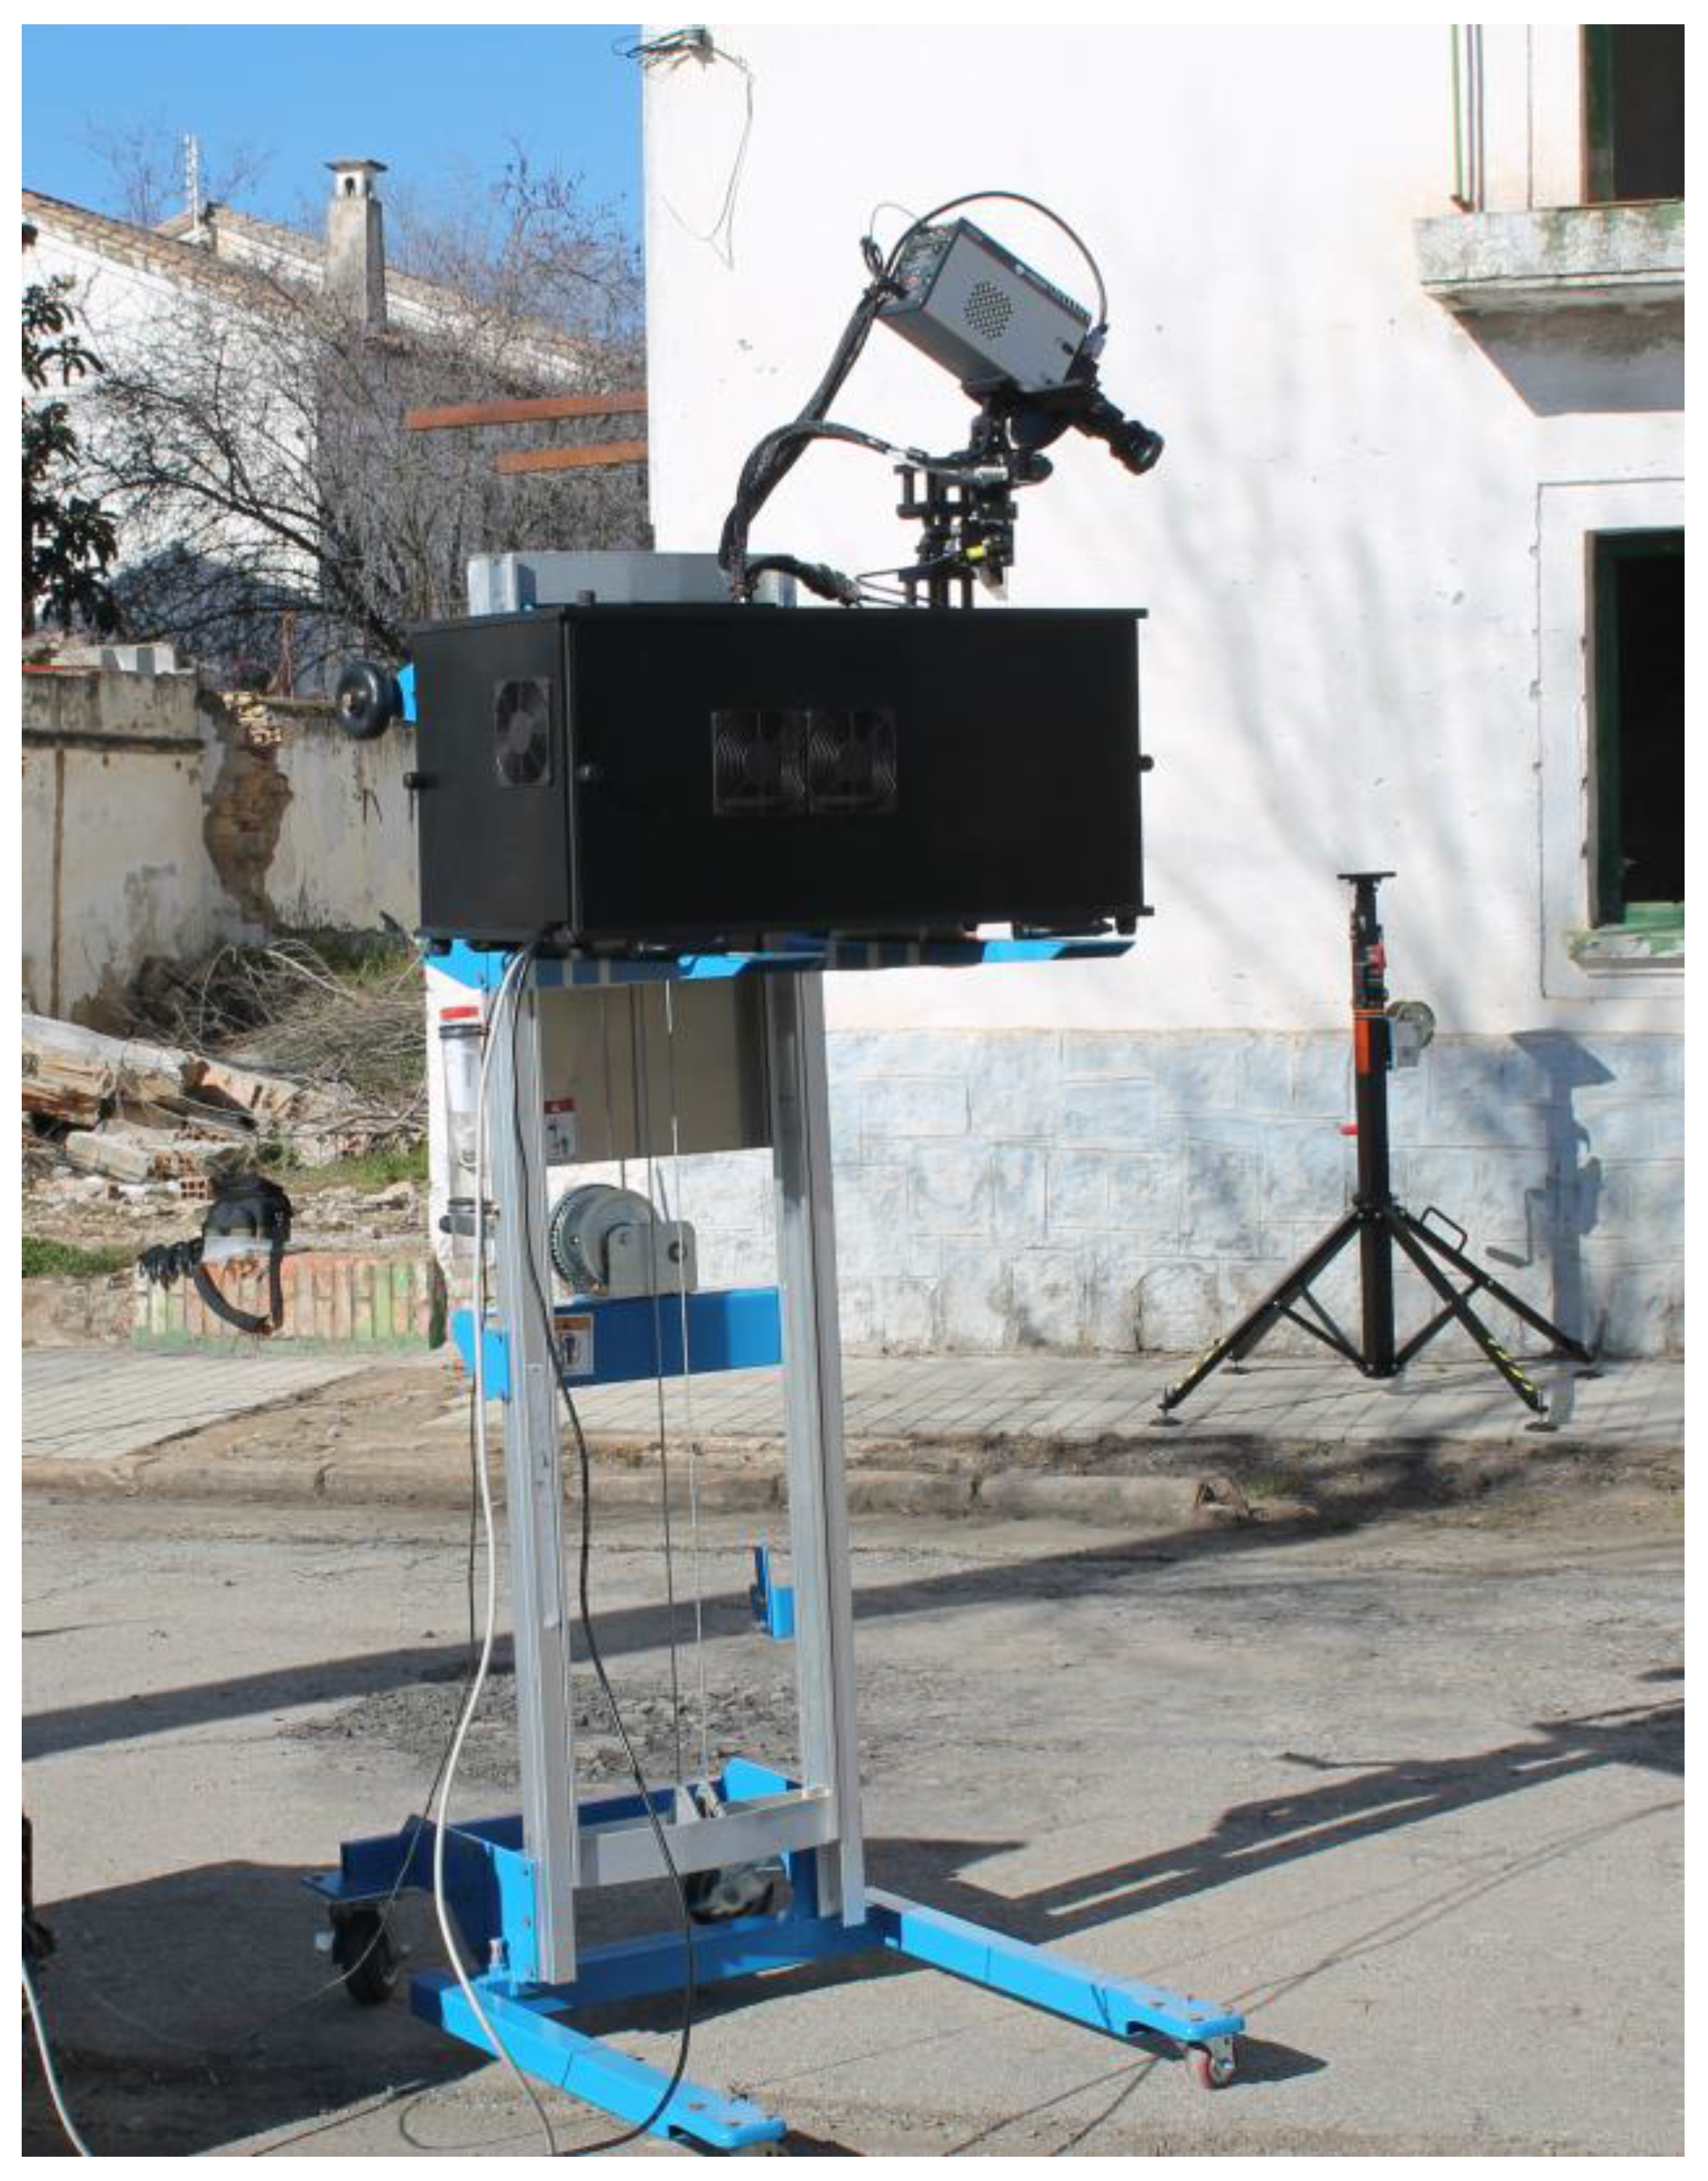
An innovative sensor based on laser induced fluorescence (LIF) has been designed and developed. It permits the detection of plastic debris coming from IED components, helping in gathering the evidence directly involved with the packing, handling, and construction of exploding devices. The system is compact and allows for an easy operation both in indoor and outdoor scenarios, and also under hostile conditions (
Figure 4). An excimer laser operating at 248 nm has been selected for the fluorescence excitation; this choice provides the highest possible combination of repetition rate and pulse energy, thus allowing for the shortest time to scan large areas. The detector selected for this application has the maximal sensitive area and integrated gating capability; the objective used for optical signal collection is achromatic, with a useful spectral range from 280–720 nm and a focus length of 27 mm. Efforts have been devoted to speed up the data processing, thanks to the use of preselected filters providing information in defined spectral regions of interest. Thanks to the characteristics of the laser source and optical and mechanical subsystems, for a crime scene of 7 m × 7 m, a total acquisition time of six minutes has been required, with the system at a distance of five meters from the closest point of the scanned area. Characteristics of the final system are reported in
Table 2.
The detection in the examined scene of plastic samples and their identification are the result of a numerical analysis applied to the measured spectral signals with reference to the spectral signature of known materials. The superposition of LIF analysis with the reflectance image taken on the very same scene allows for immediate localization; found plastic materials are evidenced by marking the corresponding pixels.
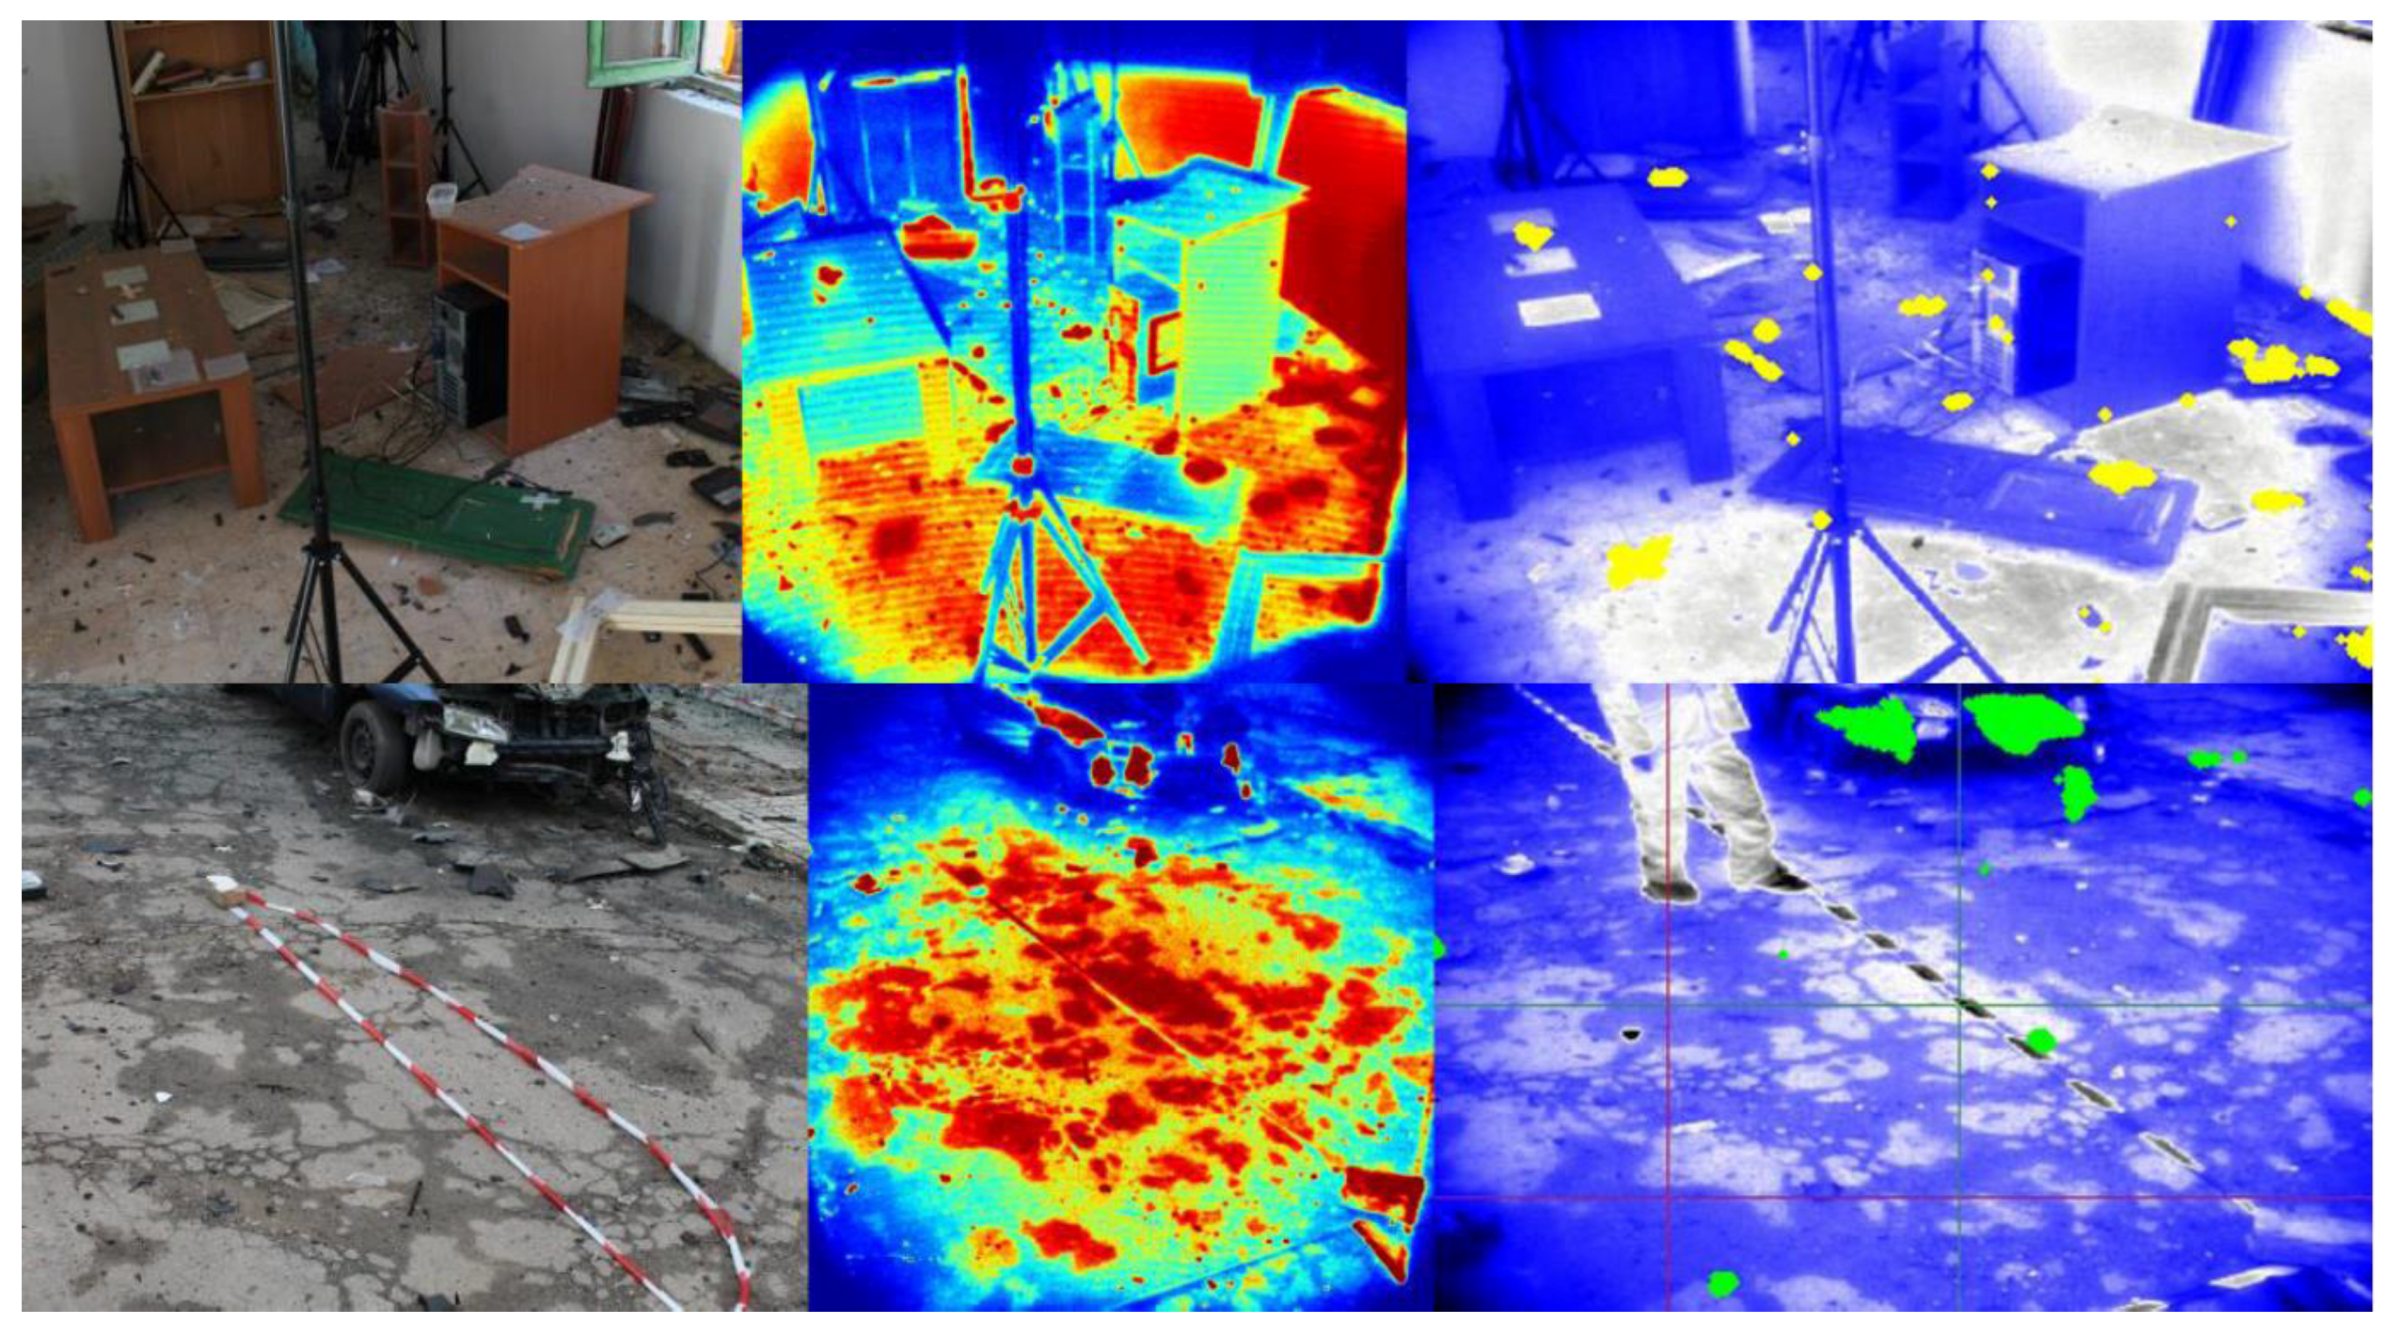
The tests conducted both in a laboratory and in an open field successfully demonstrated the ability of the sensor to be used as a fast and reliable measuring unit for material identification. Results in two different scenarios and environments are presented as examples in
Figure 5. In the figure, pictures of the scenes are compared to fluorescence images at 340 nm and to final processed results (i.e., reflectance images of the areas with location of polypropylene, polyethylene, and polyester debris). In the first case the explosion happened in an office. The second is a car bomb scene. In both cases colored dots locate debris of polypropylene, polyethylene, and polyester. Checks of the results have been carried out in the field sooner after the experimental sessions. Debris highlighted in the images have been located, individuated, and collected to verify the correct identification. All of the collected samples matched the material classes declared by the software. Moreover, the instrument and data processing demonstrated to be able to correctly discard signals coming from all fluorescent interfering materials, for example, as can be easily seen in
Figure 5, from paper, wood, plaster, and varnishes.
A few points are worth mentioning: first, the complete noninvasiveness of the technique; secondly, the capability to operate remotely without any direct contact with subject of the analysis; thirdly, the capability of helping CSI in two different modalities: selecting a material from an internal reference collection of spectra and searching for that material in the scene currently under investigation, or by selecting a specific specimen from the scene of the crime and searching for similar materials in the full imaged area. These features, in addition to the design and hardware, make the prototype very suitable for in situ applications in different light and environment conditions, even if the characteristic of not being eye-safe makes it necessary to use the sensor in restricted areas. A deployment time of around 15 minutes has been confirmed in field tests.
The lack, on the market, of similar products and the variety of possible interested stakeholders (law enforcement agencies involved in forensic investigations, laboratories interested in portable equipment, institutions interested in the fluorescence technology) make the sensor interesting for the specialized market, despite the cost (about 120,000 €) and the necessity of skilled staff for the use of the system. Moreover, the sensor and the developed analysis methodology can be applied to a larger range of chemical substances paving the way to other different types of applications.
6. Conclusions
In the frame of the project FORLAB (Forensic Laboratory for in-situ evidence analysis in a post blast scenario), a new sensor based on laser induced fluorescence has been developed for standoff individuation and localization of plastic debris in post-blast scenarios. The system can scan large areas in short times providing real-time images of the scene where material discrimination is highlighted. The tests conducted both in laboratory and in real conditions successfully demonstrated the ability of the sensor to be used as a fast and reliable measuring unit for material identification.
Acknowledgments
The project FORLAB received funding from the European Union’s Seventh Framework Program for research, technological development and demonstration under grant agreement NO. FP7-285052. The Authors would like to thank Major Aldo Mattei from Forensic science laboratories of Carabinieri Force (RaCIS) for providing DNA samples and for their analyses.
Author Contributions
Luisa Caneve, Francesco Colao and Valeria Spizzichino conceived and designed the instrument and the experiments; Valeria Spizzichino wrote the paper.
Conflicts of Interest
The authors declare no conflict of interest. The founding sponsors had no role in the design of the prototype; in the collection, analyses, in the writing of the manuscript, and in the decision to publish the results.
References
- Shelton, D.E. Forensic Science in Court: Challenges in the Twenty-First Century; Rowman & Little Field Publ., Inc.: Plymouth, UK, 2011. [Google Scholar]
- U.S. Department of Justice, Office of Justice Programs, National Institute of Justice. A Guide for Explosion and Bombing Scene Investigation 2000. Available online: http://www.ojp.usdoj.gov/nij/pubs-sum/181869.htm (accessed on 2 December 2016).
- Beveridge, A. Forensic Investigation of Explosions, 2nd ed.; CRC Press: London, UK, 2011. [Google Scholar]
- Hakonen, A.; Andersson, P.O.; Stenbæk, S.M.; Rindzevicius, T.; Käll, M. Explosive and chemical threat detection by surface-enhanced Raman scattering: A review. Anal. Chim. Acta 2015, 893, 1–13. [Google Scholar] [CrossRef] [PubMed]
- Johnson, J.B.; Allen, S.D.; Merten, J.; Johnson, L.; Pinkham, D.; Reeve, S.W. Standoff methods for the detection of threat agents: A review of several promising laser-based techniques. J. Spectrosc. 2014. [Google Scholar] [CrossRef]
- Dietz, M.E.; Stern, L.A.; Mehltretter, A.H.; Parish, A.; McLasky, V.; Aranda, R. Forensic utility of carbon isotope ratio variations in PVC tape backings. Sci. Justice 2012, 52, 25–32. [Google Scholar] [CrossRef] [PubMed]
- Kinsey, J.L. Laser induced fluorescence. Annual Rev. Phys. Chem. 1977, 28, 349–372. [Google Scholar] [CrossRef]
- Oujja, M.; Vazquez-Calvo, C.; Sanz, M.; Alvarez de Buergo, M.; Fort, R.; Castillejo, M. Laser-induced fluorescence and FT-Raman spectroscopy for characterizing patinas on stone substrates. Anal. Bioanal. Chem. 2012, 402, 1433–1441. [Google Scholar] [CrossRef] [PubMed]
- Piruska, A.; Nikcevic, I.; Lee, S.H.; Ahn, C.; Heineman, W.R.; Limbacha, P.A.; Seliskar, C.J. The autofluorescence of plastic materials and chips measured under laser irradiation. Lab. Chip. 2005, 5, 1348–1354. [Google Scholar] [CrossRef] [PubMed]
- Demtröder, W. Laser Spectroscopy; Springer: New York, NY, USA, 1982; pp. 417–423. [Google Scholar]
- Caneve, L.; Colao, F.; Fantoni, R.; Fiorani, L. Scanning LIDAR fluorosensor for remote diagnostic of surfaces. Nucl. Instrum. Meth. A 2013, 720, 164–167. [Google Scholar] [CrossRef]
- Weibring, P.; Johansson, T.; Edner, H.; Svanberg, S.; Sundnèr, B.; Raimondi, V.; Cecchi, G.; Pantani, L. Fluorescence LIDAR imaging of historical monuments. Appl. Opt. 2001, 40, 6111. [Google Scholar] [CrossRef] [PubMed]
- Spizzichino, V.; Angelini, F.; Caneve, L.; Colao, F.; Corrias, R.; Ruggiero, L. In situ study of modern synthetic-materials and pigments in contemporary paintings by laser-induced fluorescence scanning. Stud. Conserv. 2015, 60, 178–184. [Google Scholar] [CrossRef]
- Spizzichino, V.; Caneve, L.; Colao, F.; Ruggiero, L. Characterization and discrimination of plastic materials using laser-induced fluorescence. Appl. Spectrosc. 2016, 70, 1001–1008. [Google Scholar] [CrossRef] [PubMed]
- Centrone, M.; Giorgi, F. Profili di trasmissione dei filtri interferenziali del telescopio PSPT. OAR-INAF Technical note, 2003. Available online: http://www.oa-roma.inaf.it/solare/RELAZIONE%20FINALE%20FILTRI.pdf (accessed on 2 December 2016).
© 2016 by the authors; licensee MDPI, Basel, Switzerland. This article is an open access article distributed under the terms and conditions of the Creative Commons Attribution (CC-BY) license (http://creativecommons.org/licenses/by/4.0/).


