
About the Purification Route of Ionic Liquid Precursors


ENEA, Italian National Agency for New Technologies, Energy and Sustainable Economic Development, SSPT-PROMAS-MATPRO and DTE-STT-SCIS Laboratories, Via Anguillarese 301, Rome 00123, Italy
*
Author to whom correspondence should be addressed.
Challenges 2017, 8(1), 11; https://doi.org/10.3390/challe8010011
Submission received: 26 December 2016
/
Revised: 7 March 2017
/
Accepted: 22 March 2017
/
Published: 27 March 2017
(This article belongs to the Special Issue Selected papers from Thematic Meeting “Materials for Energy”)
Abstract
:In this work a purification route of precursors for ionic liquids tailored to electrochemical energy storage systems is reported and described. The study was carried out on the N-butyl-N-methylpyrrolidinium bromide (PYR14Br) precursor, which represents the intermediate product of the synthesis process of the N-butyl-N-methylpyrrolidinium bis(trifluoromethanesulfonyl)imide (PYR14TFSI) hydrophobic ionic liquid. The target is to develop an easy and cost-effective approach for efficiently purifying several kinds of ionic liquid precursors and determining their purity content. The PYR14Br precursor was synthesized through an eco-friendly preparation procedure, which requires water as the only processing solvent, and purified through sorbent materials, such as activated charcoal and alumina. The effect of the treatment/nature/content of sorbents and processing temperature/time was investigated. The impurity content was detected by UV-VIS spectrophotometry measurements. Additionally, a correlation between the measured absorbance and the content of impurities within the precursor was obtained. The purity level of the precursor was seen to play a key role in the electrochemical performance of the ionic liquids.
1. Introduction
Room temperature ionic liquids (RTILs) represent a particular class of fluids showing ambient or sub-ambient melting temperature, good ionic conductivity, wide thermal/chemical/electrochemical stability, low heat capacity, ability to dissolve inorganic, organic, and polymeric materials and, in some cases, hydrophobicity [1,2,3]. These unique chemical properties, responsible of strongly growing interest towards ionic liquids in the last fifteen years, have addressed RTILs to a very wide variety of applications, in particular as “green” solvents for chemical reactions, bi-phasic catalysis, chemical synthesis, separation and extraction processes, advanced high-temperature lubricants, transfer fluids in solar thermal energy systems [4,5,6,7,8,9,10,11,12,13,14,15,16], and as electrolytes (or electrolyte components) for electrochemical devices including batteries, fuel cells, double-layer capacitors, hybrid super-capacitors, photo-electrochemical cells, and electroplating of electropositive metals [3,17,18,19,20,21,22,23,24,25,26,27].
Among the electrochemical energy storage systems, rechargeable lithium batteries are very good candidates for the next generation power sources because of their high gravimetric and volumetric energy densities [28]. However, commercial lithium batteries are affected by safety issues, especially when up-scaled, due to the volatile and flammable organic electrolyte solvents (mainly alkyl carbonates) [29,30,31,32], this preventing so far their large diffusion in automotive and stationary applications. In the last years, RTILs have been widely investigated as safe electrolyte components to replace the hazardous alkyl carbonates [25,26]. Particularly, RTILs based on N-alkyl-N-methylpyrrolidinium cations, (PYR1A)+ (where the subscripts indicate the number of carbon atoms in the pyrrolidinium alkyl side chains), and bis(trifluoromethanesulfonyl)imide (TFSI)− or bis(fluorosulfonyl)imide (FSI)− anions have been favorably proposed [25].
One of the most stringent, if not the most stringent, requirements in designing the synthesis route of ionic liquids is the solvent restriction. In recent years, our laboratory has devoted significant effort to replace the toxic and volatile organic compounds (i.e., dichloromethane, acetonitrile, acetone) commonly used in RTIL synthesis processes, with more and more eco-friendly processing solvents [33,34]. For instance, these organics are generally not preferred in the chemical industry and need to be fully recycled to avoid their emission into the environment.
High purity level RTILs are required, especially for electrochemical applications and, therefore, the purification procedure is crucial in the frame of the overall synthesis process. Ionic liquids are generally purified through sorbent materials, i.e., mainly activated charcoal, alumina (Al2O3), and silica (SiO2), which were found able to efficiently remove impurities [14,15,33,34,35,36,37]. However, detailed purification routes, as well as the investigation on the effect of the process operating conditions, are not frequently reported in the literature.
Recently [38], we have reported a properly-designed procedure, requiring only water as the processing solvent, which represents a considerable breakthrough in the synthesis process of hydrophobic RTILs. In addition, the commonly used iodine-containing reagents were replaced by the cheaper, more chemically stable, and less toxic bromine-containing aliphatic compounds. Briefly, the ionic liquid was synthesized by two-step process carried out in deionized water:
- (i)
- Preparation of an intermediate product (hereafter, precursor) using amine and alkyl bromide as the reagents;
- (ii)
- The precursor is reacted with proper lithium or sodium salt (metathesis reaction) to obtain the ionic liquid.
The purification route was performed at precursor and RTIL level through sorbent materials (carbon and alumina) and water, respectively, demonstrating also the possibility of recycling the sorbents to minimize the waste production [38]. However, as most of the impurities derive from the amine and alkyl bromide reagents instead from the lithium (sodium) salt [34], the purification route should be particularly relevant especially at precursor levels for achieving targets required by electrochemical energy storage devices. Additionally, it should be noted that the precursor can be more easily and cheaply purified than ionic liquids [33,34,38].
Aiming to reduce the process overall cost (i.e., in terms of chemicals, energy, process time, and waste production) and to extend the feasibility of the process to different kinds of precursor, we have upgraded the purification route previously reported [38] also in view of possible industrial applications and/or upscaling. In this paper, we report a semi-quantitative study on the purification route carried out, through activated charcoal and alumina as the sorbent materials and water as the only processing solvent, on ionic liquid precursor. The purpose of the present article is to show an approach for efficiently purifying and determining (by UV-VIS spectrophotometry) the purity level of several kinds of RTIL precursors through an easy and cheap way, which may be of interest for researchers involved in electrochemical applications.
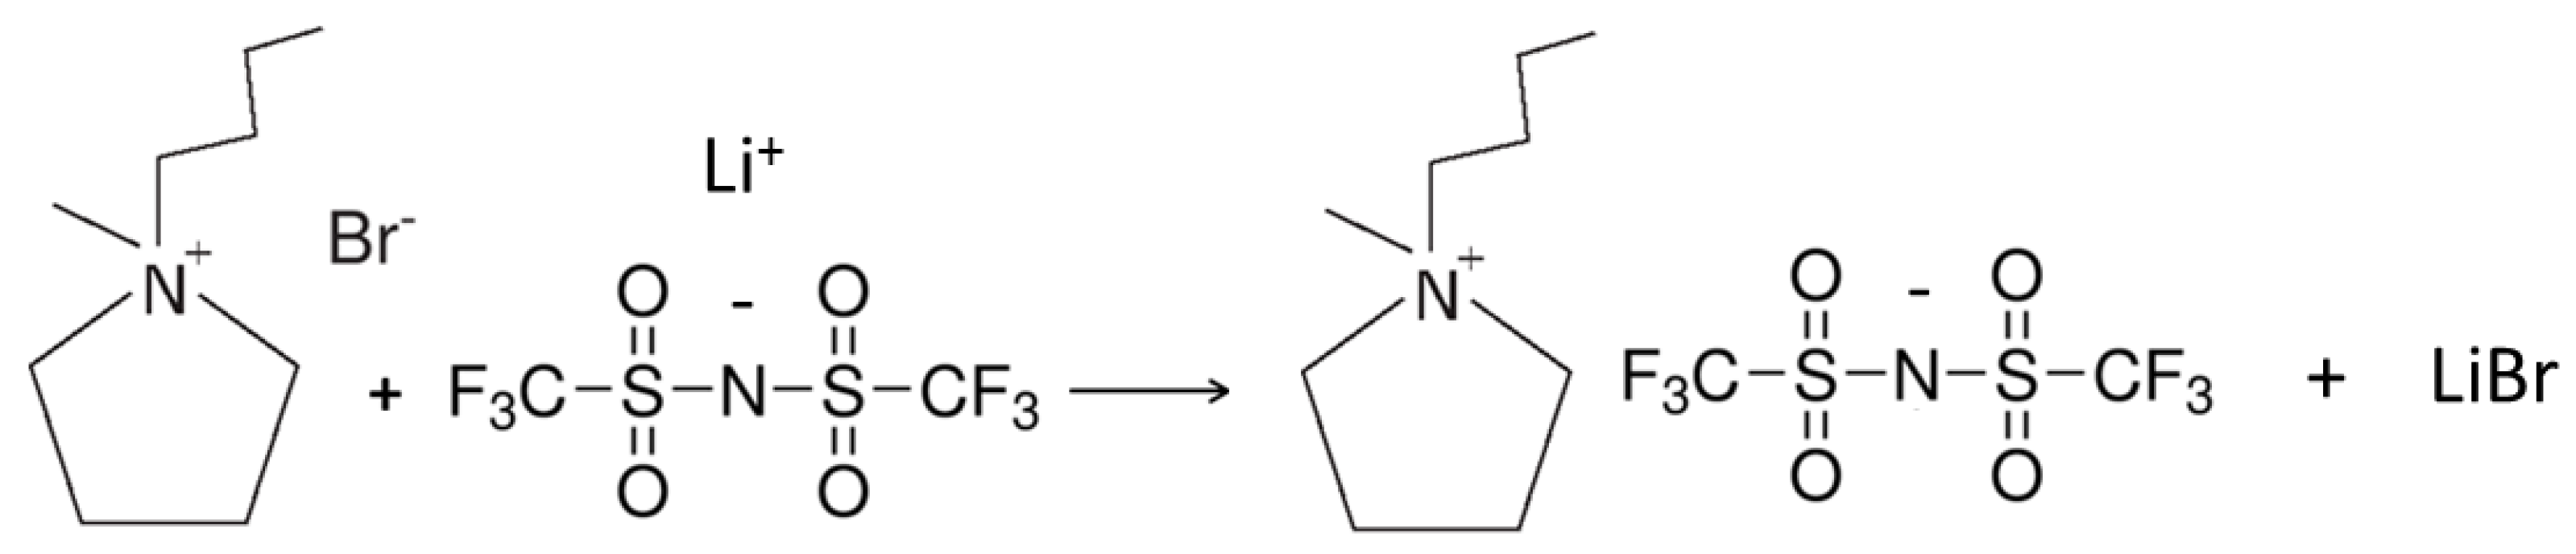
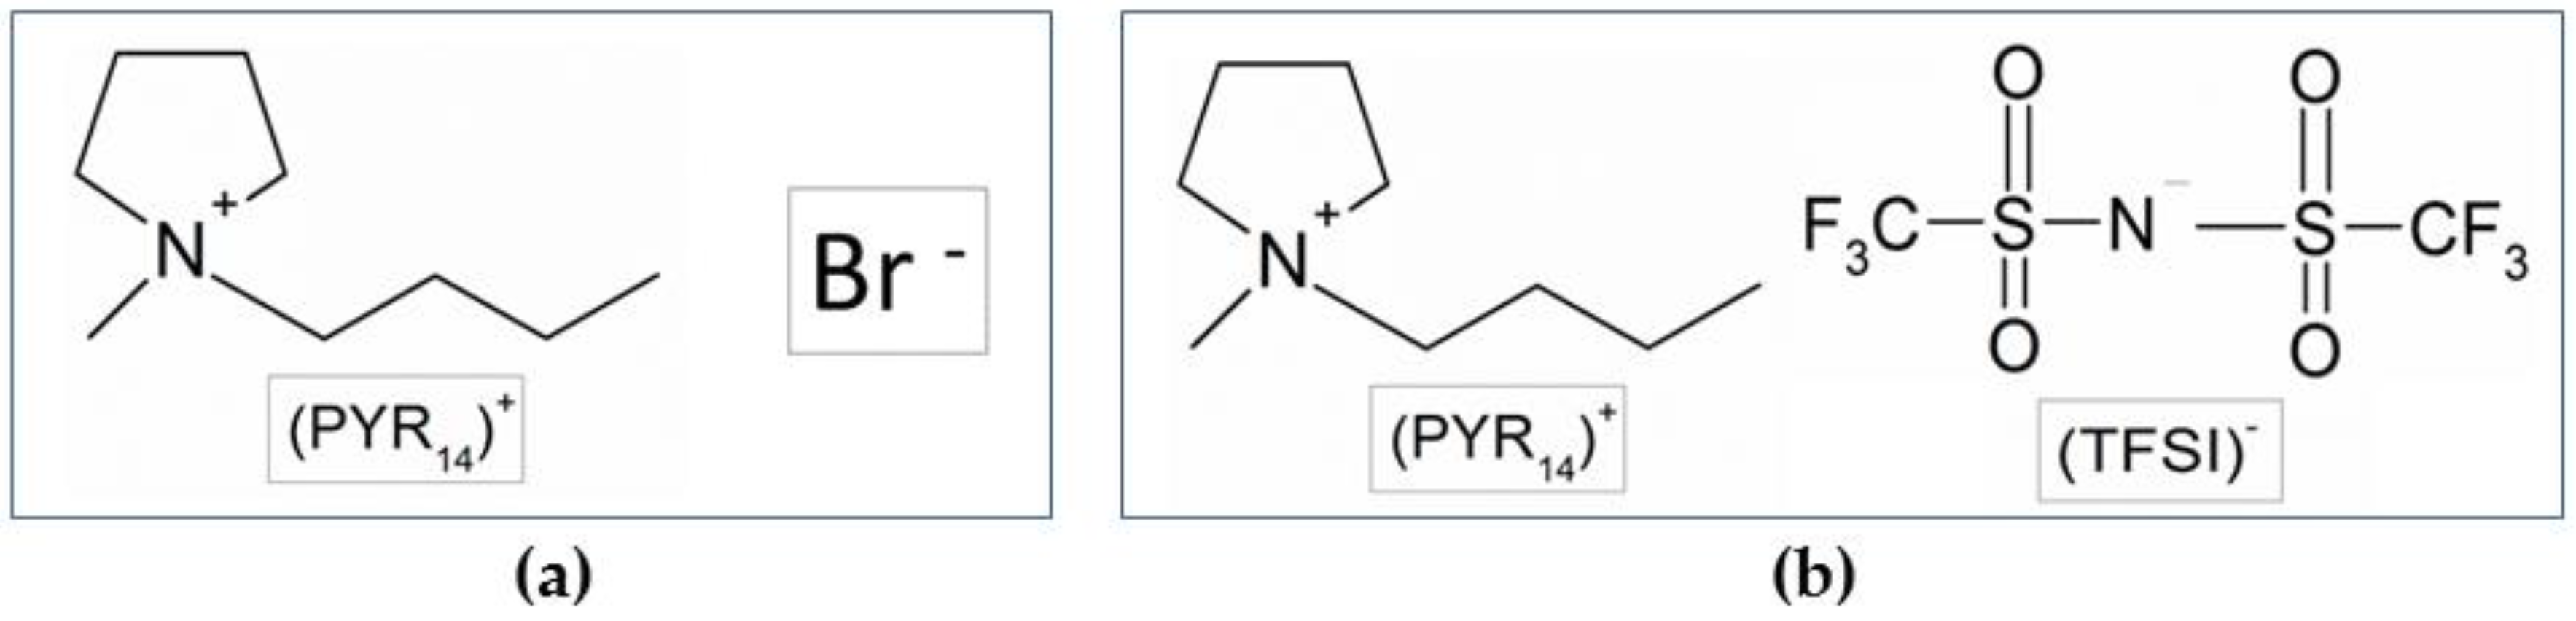
The study was performed on N-butyl-N-methylpyrrolidinium bromide (PYR14Br) as the precursor (Scheme 1a), which is the intermediate product of the synthesis process of the N-butyl-N-methylpyrrolidinium bis(trifluoromethanesulfonyl)imide (PYR14TFSI) ionic liquid (Scheme 1b). This built-up purification route was designed to be applicable to different kinds of halide-based precursors (pyrrolidinium, piperidinium, imidazolium, tetraalkylammonium) and sorbent materials.
2. Results and Discussion
1H NMR measurements (Figure S3 in Supplementary Materials), performed on PYR14TFSI, clearly indicate that the (PYR14)+ cation was correctly synthesized. The features observed at 2.5 and 3.0 ppm are ascribable, respectively, to deuterated dimethylsulfuroxide, DMSO, (used as the solvent) and moisture absorbed from external during the NMR measurements (performed in uncontrolled environment).
2.1. Preliminary Treatment of Sorbents
Despite activated carbon and alumina are widely used as the sorbent materials in the purification route of RTILs, contamination (especially from carbon) could occur in ionic liquids, as reported by McFarlane and co-workers [36]. Therefore, we have developed a method for previously cleaning the sorbents. In order to fully activate the pores (not optimally wetted by the aqueous PYR14Br phase to be purified), the charcoal has been previously boiling for 1 h in deionized water (water: carbon weight ratio equal to 20:1). Then, the carbon was separated by vacuum filtration (to be addressed to the purification route). This procedure allowed better exploitation of the sorbent material surface. However, UV-VIS measurements revealed some unidentified compounds in the aqueous phase obtained from charcoal vacuum filtration, likely extracted (from carbon) during boiling. This is clearly evidenced in Figure S2a (red trace), especially if compared with pure water (black trace). It should be noted that the raw filter membrane (blue trace), i.e., subjected to rinsing with deionized water, also releases impurities, even if in very small amounts. Therefore, the carbon was consecutively rinsed (water: carbon weight ratio equal to 20:1 for each step) before boiling. The aqueous phases, separated from charcoal by vacuum filtration and separately collected, were subjected to UV-VIS measurements (Figure S2b), which showed progressive reduction of absorbance up to five consecutive rinsing steps. This indicates how carbon needs previous cleaning before being used as sorbent material.
2.2. Effect of Processing Conditions
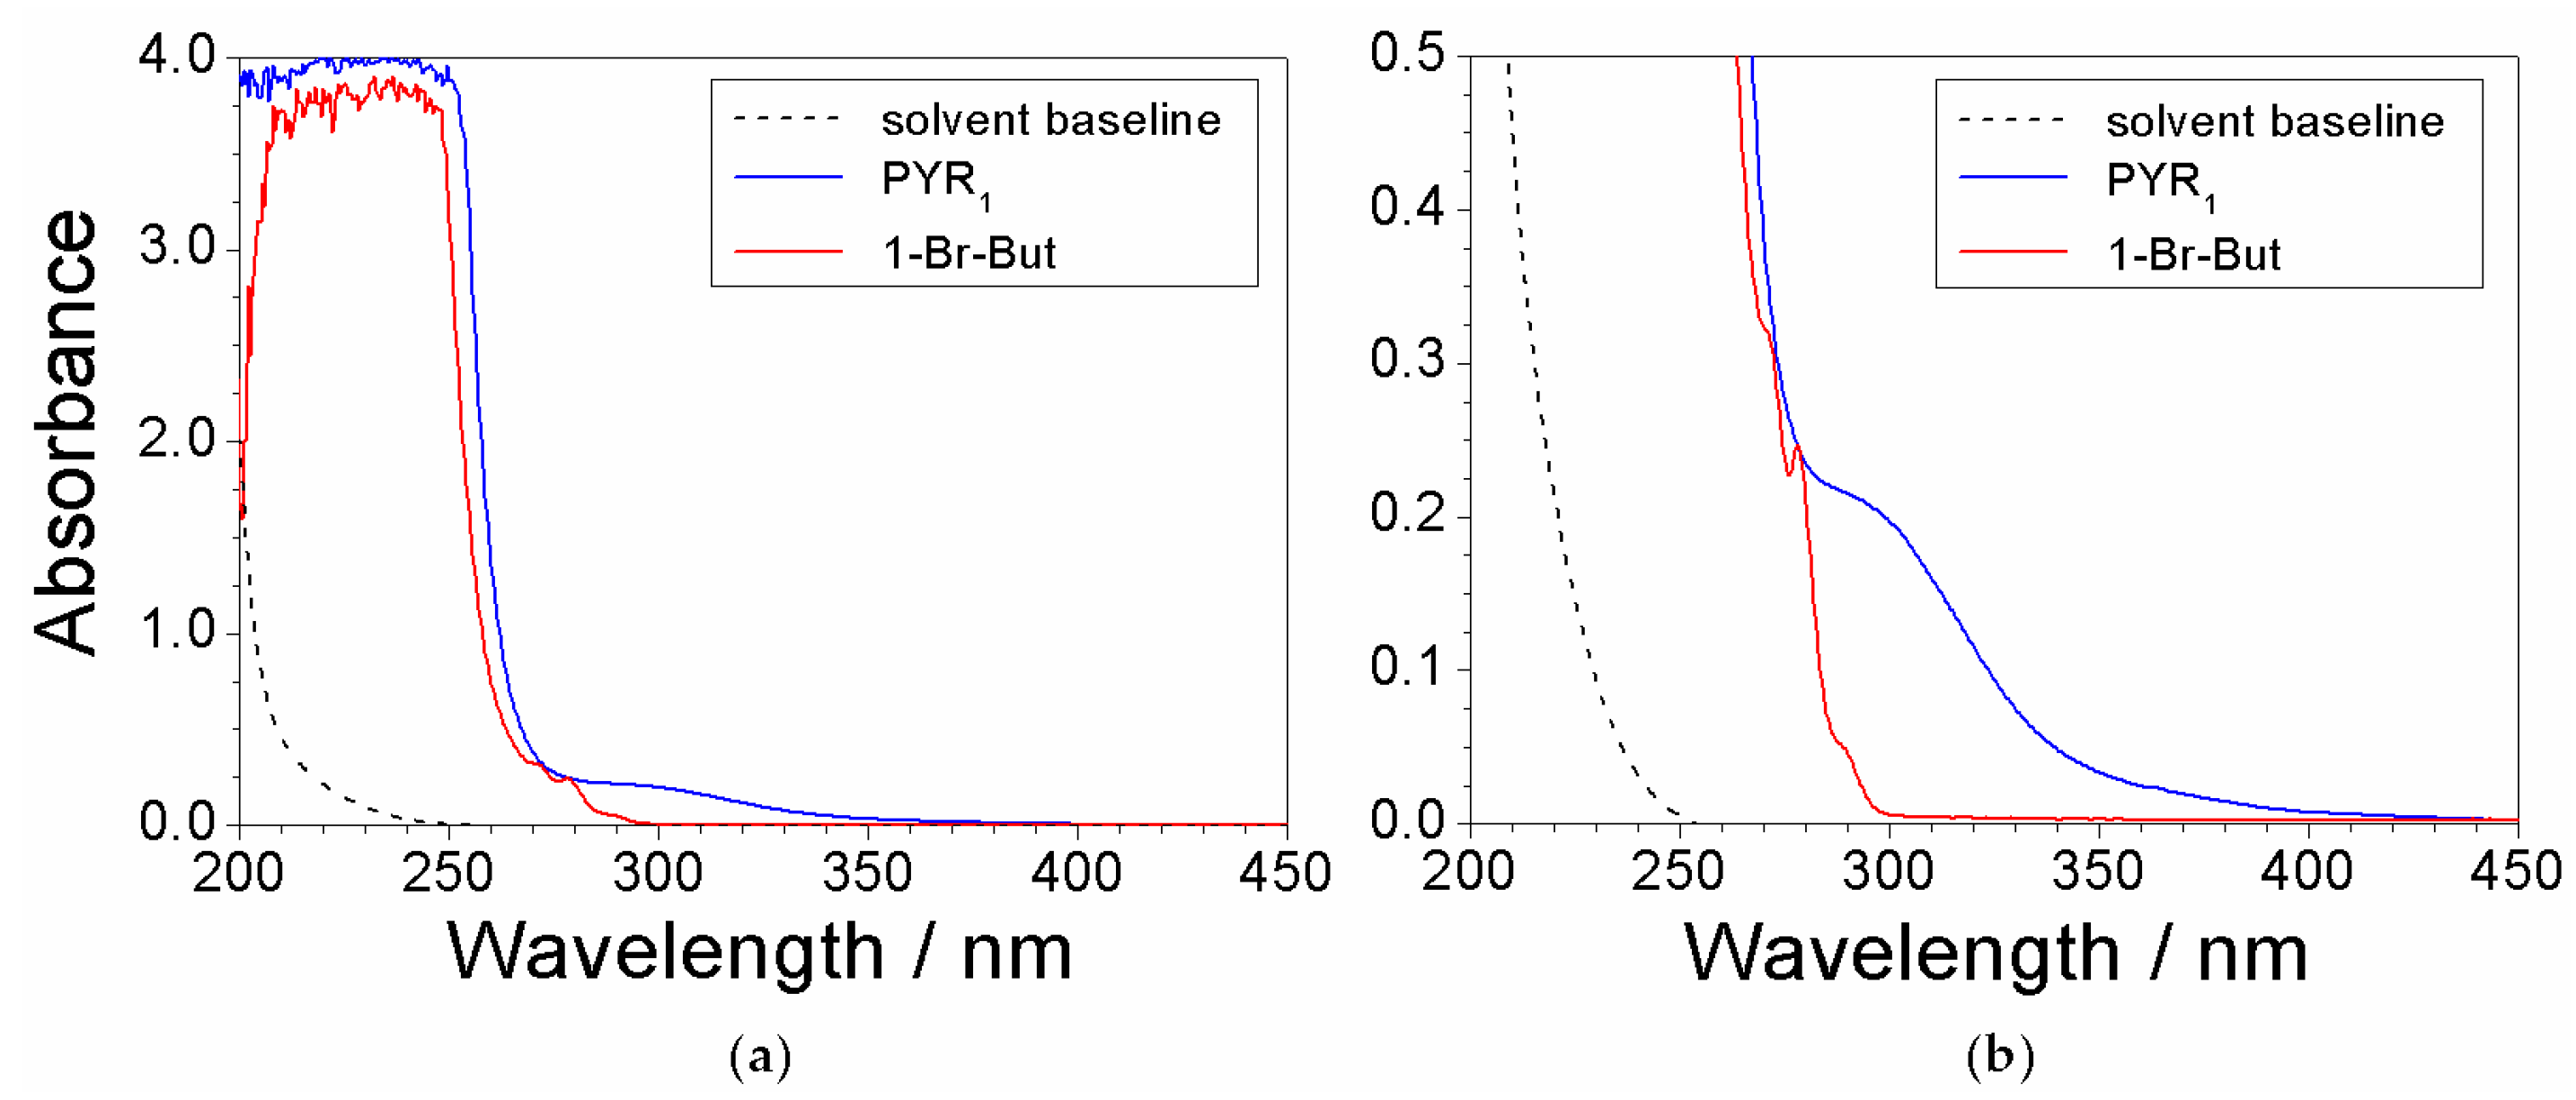
Preliminary UV-VIS measurements were run on the reagents, i.e., N-methylpyrrolidine (PYR1) and 1-bromobutane (1-Br-But), used for the preparation of the precursor to reveal the features due to impurities. As stated above, such impurities (contained within the chemicals) represent the major contaminants for the precursor. Both chemicals were previously dissolved in ethanol (at volume ratios equal to 3:1 and 10:1 for PYR1 and 1-Br-But, respectively) to attenuate the spectrophotometric signal. The absorbance vs. wavelength dependence, reported in Figure 1, shows a main feature (much larger with respect to the other ones) below 250 nm for both chemicals, clearly due to PYR1 (blue trace) and 1-Br-But (red trace), respectively. Much less pronounced, but still well defined, features (better evidenced in the magnification reported in panel b) are displayed for both PYR1 (290 nm) and 1-Br-But (270, 278, and 290 nm). These peaks can be attributed to the impurities within the reagents. Therefore, the features falling in the wavelength range from 270 to 600 nm of the absorbance response were assigned to impurities. The ethanol solvent (dotted trace) is seen to not interfere in the UV-VIS measurements.
The effect of the processing conditions (namely, temperature and time), as well as the amount of the sorbents on the (PYR14Br) precursor purity level was investigated by UV-VIS spectrophotometry measurements. Briefly, aqueous precursor samples were subjected to the purification route described below and, then, vacuum dried (in a rotary evaporator) to remove the water. Successively, the solid PYR14Br was dissolved in ethanol to obtain solutions with analogous concentration (in PYR14Br) with respect to the (initial) aqueous samples.
The sorbent materials (carbon and alumina in a weight ratio equal to 2:3) [38] were intimately mixed with the pristine (not purified) aqueous precursor. After vacuum filtration (to separately collect the purified PYR14Br aqueous phase), the sorbents were rinsed with deionized water (sorbents: H2O weight ratio fixed to 2:1) [38] to recover the trapped precursor (through the sorbents). Different mixing temperatures and times were investigated whereas the (C + Al2O3): precursor weight ratio ranged from 0.75:1 to 2.25:1. Solutions of the pristine precursor (in ethanol) were investigated for comparison purposes.
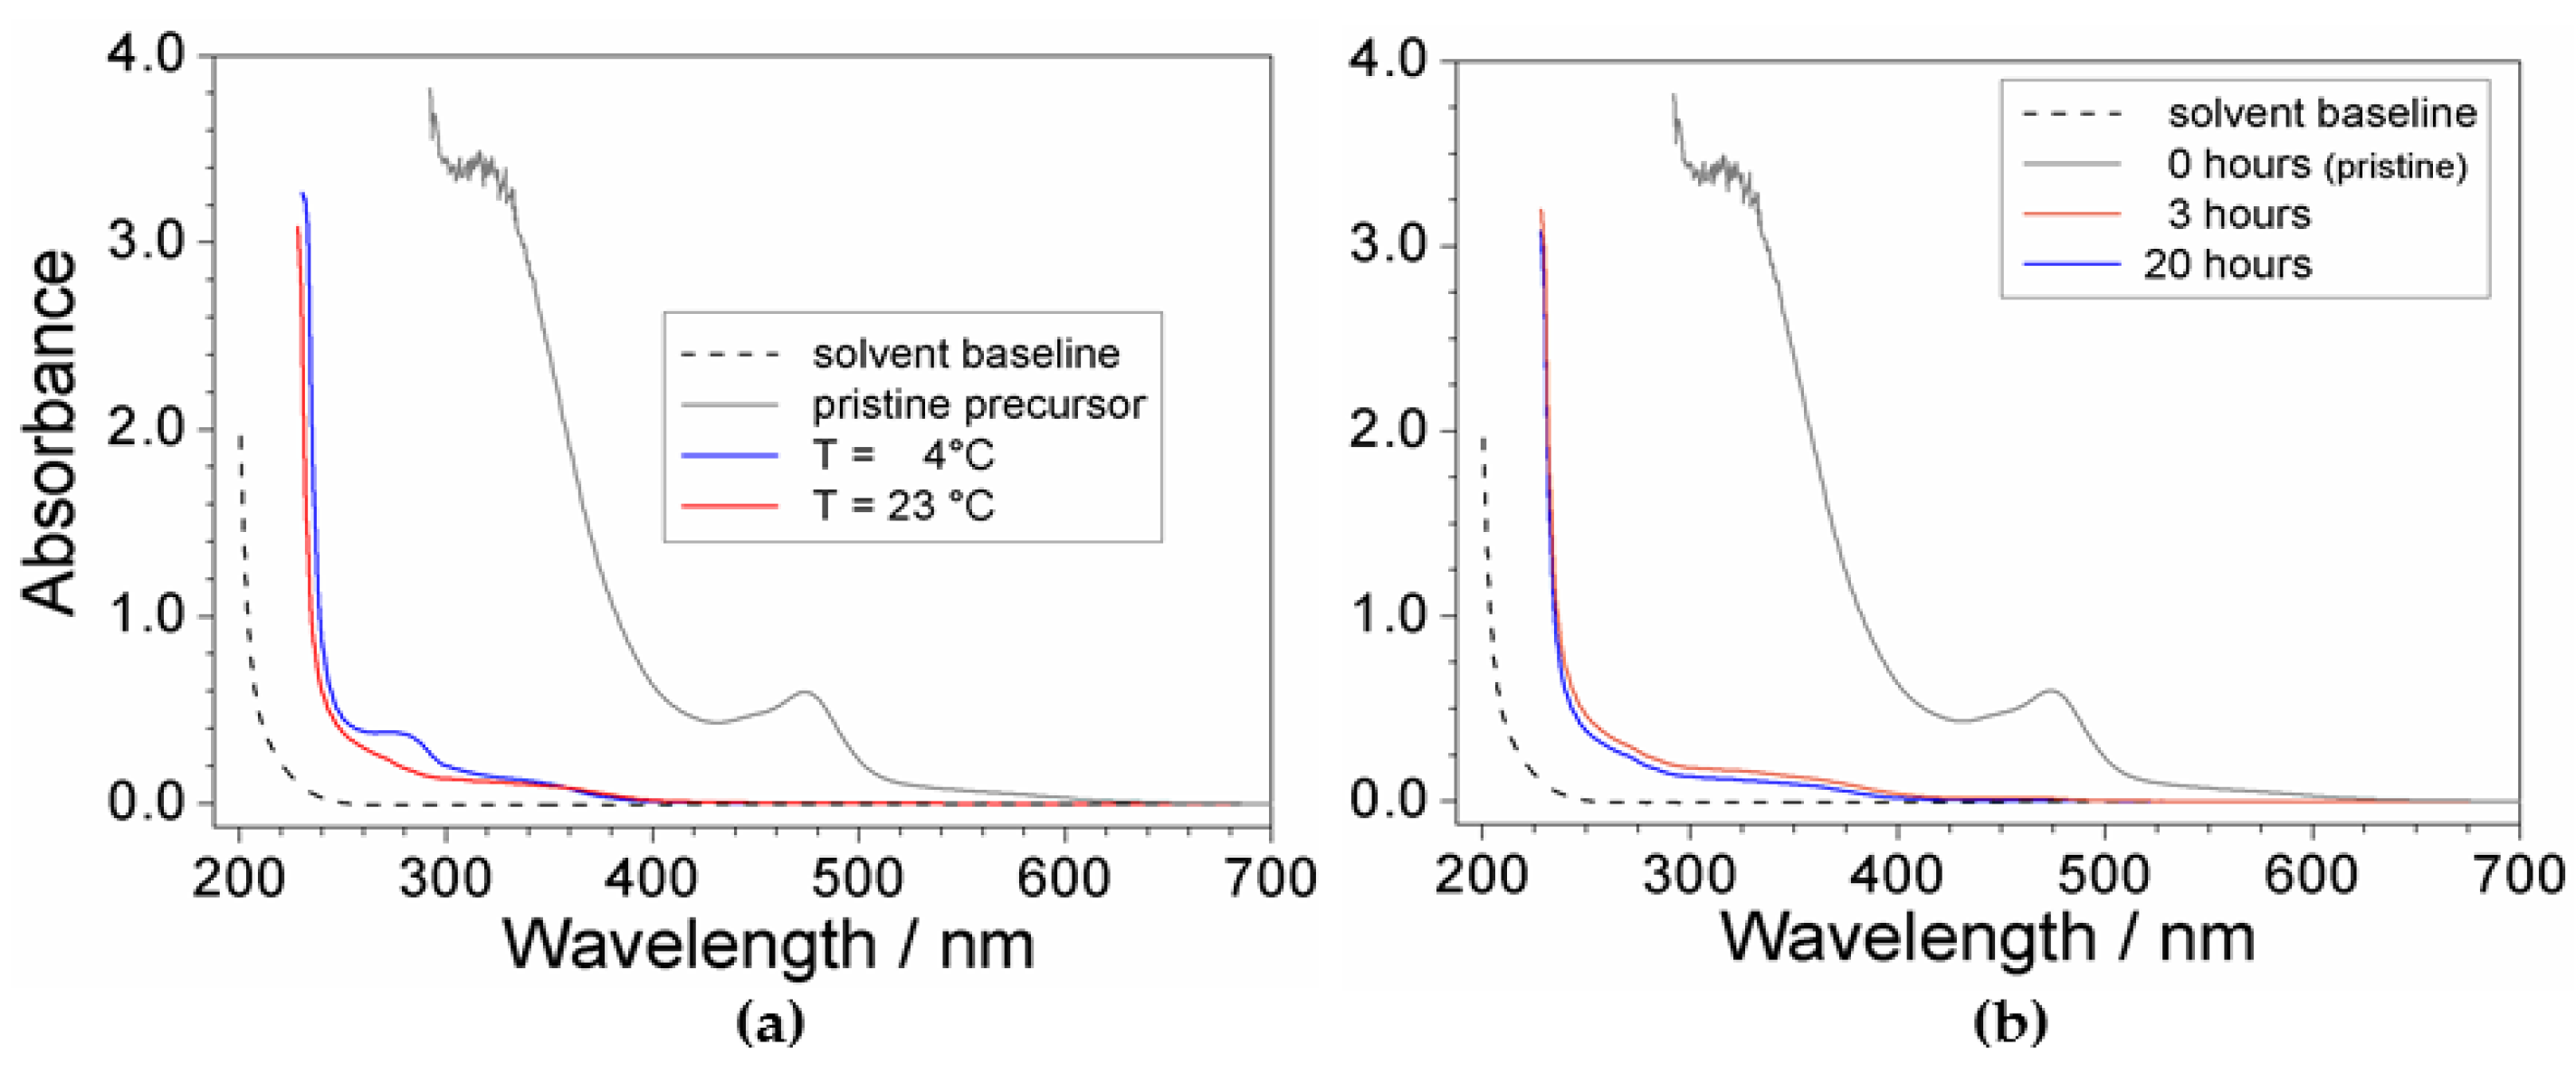
The effect of the temperature and time is reported in Figure 2. It is worth noting the impressive difference with respect to the response given by the pristine precursor (grey trace), highlighting for high efficiency of the purification route. The absorbance vs. wavelength trace obtained for the PYR14Br sample purified at 23 °C (panel a) shows modest, but significant, enhancement of the purity level with respect to that processed at 4 °C which evidenced a more pronounced feature around 280 nm. Conversely, no practical improvement of the precursor quality is observed if the mixing time is increased from 3 to 20 h (panel b). On the basis of these results, the purification routes were carried out above 20 °C, whereas the mixing time was limited to 3 h.
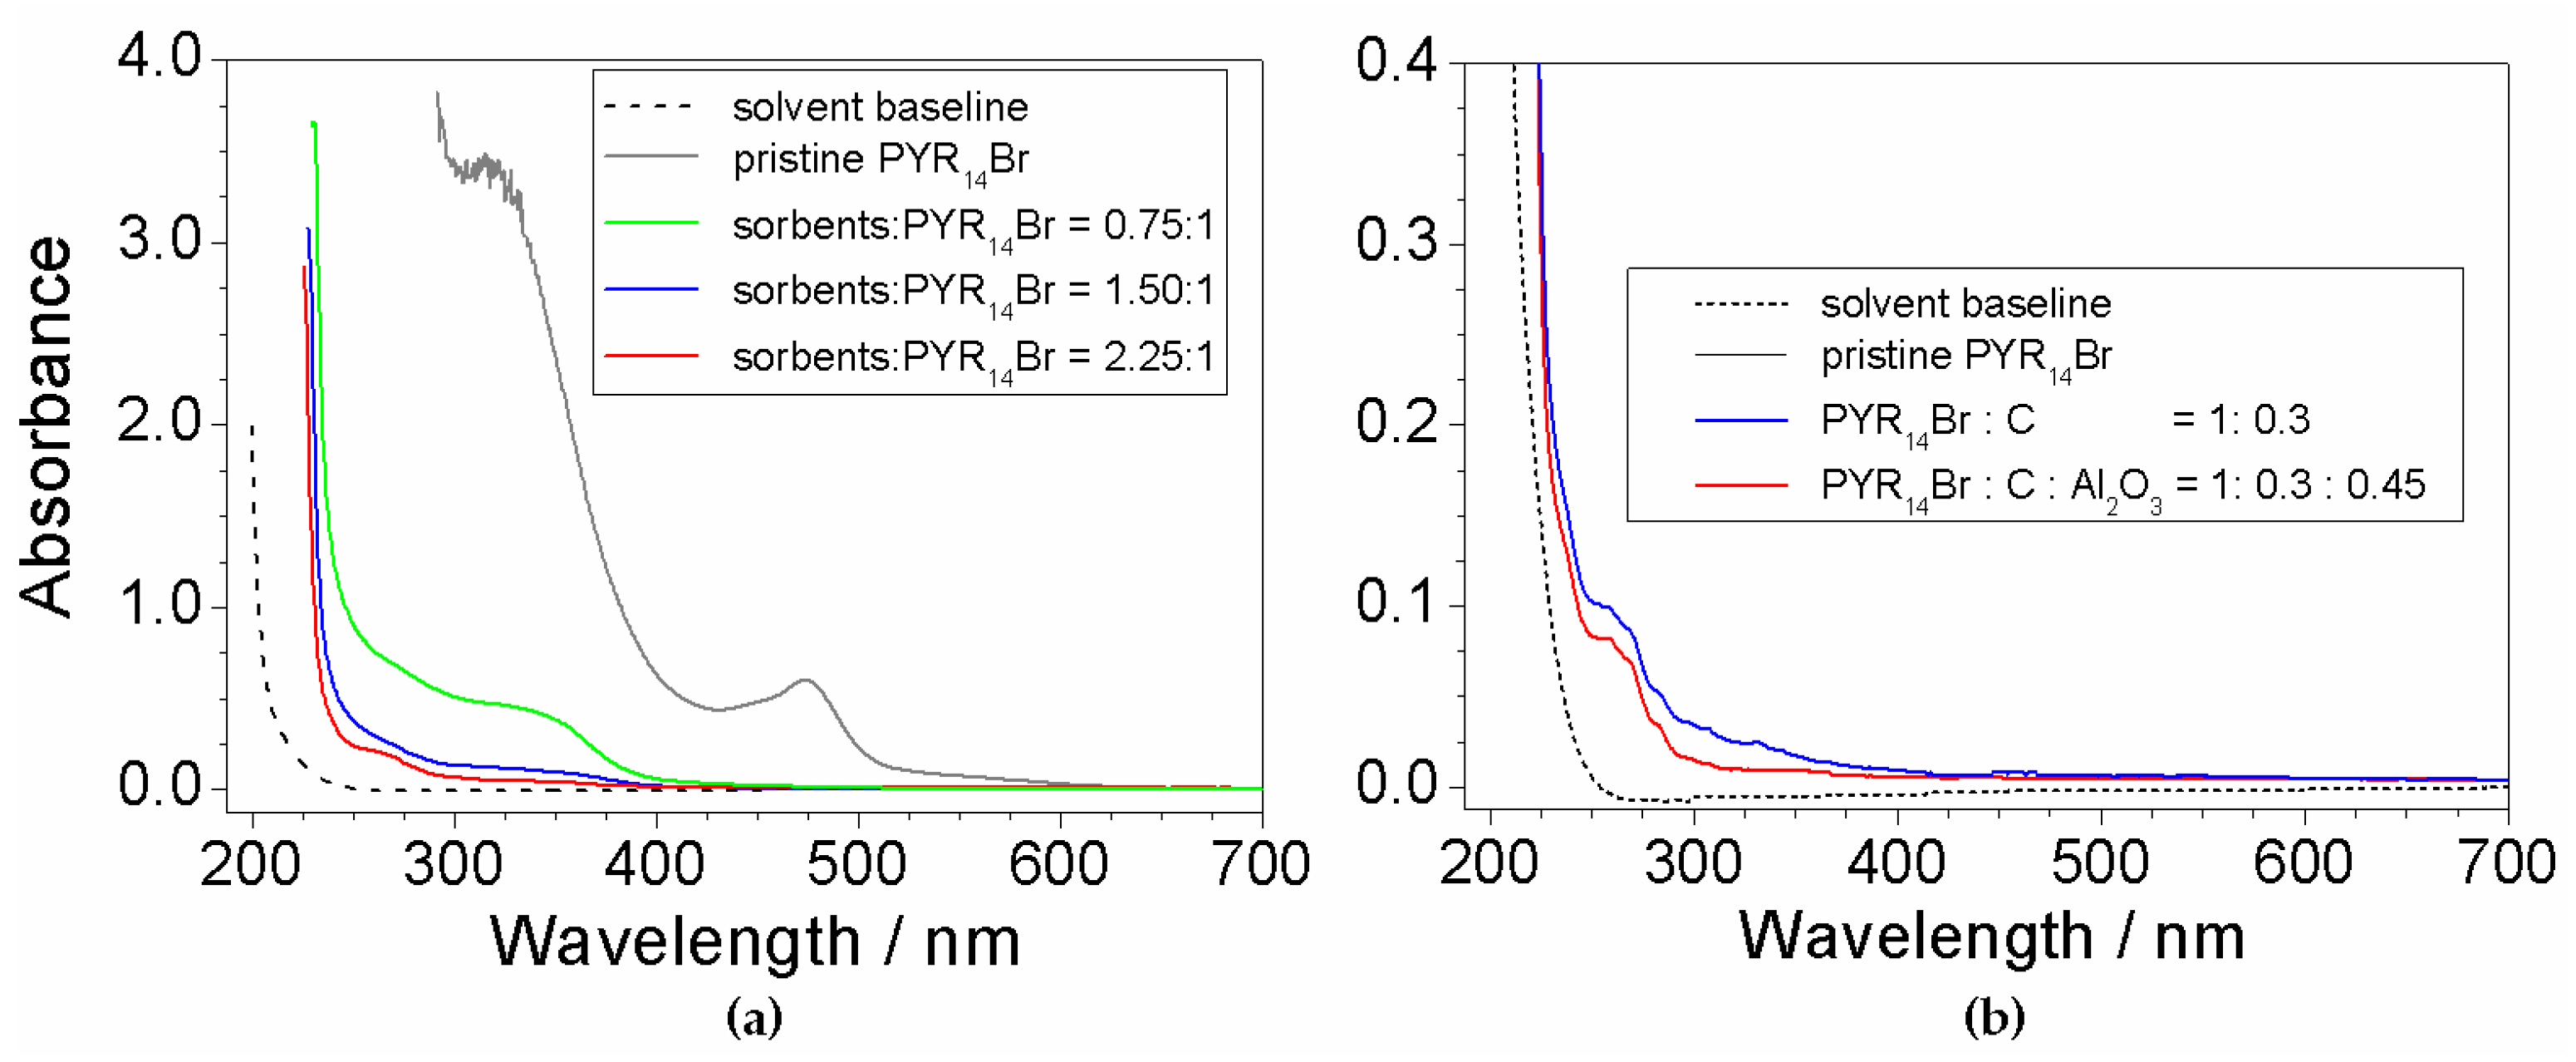
Figure 3 depicts the results of the UV-Vis measurements performed on aqueous PYR14Br samples subjected to purification routes run at different (C + Al2O3): precursor weight ratios. The pristine PYR14Br is reported for comparison purposes. All absorbance vs. wavelength traces are characterized by a main feature around 220 nm (i.e., much more relevant with respect to the other ones), likely ascribable to the precursor, and much weaker profiles, due to impurities (i.e., in agreement with the results of Figure 1), detected in the 250–600 nm range.
The effect of the sorbents (Figure 3a) is highlighted, in the profile of the purified precursor samples, by the disappearance of the feature around 470 nm observed in pristine PYR14Br and dramatic reduction (with respect to pristine PYR14Br) of the peaks recorded from 250 to 400 nm. It should be noted that the pristine PYR14Br solution was previously diluted (in water) in a volume ratio of 5:1 (before to be subjected to UV-VIS measurements) to reduce the absorbance signal. This clearly indicates a drastic decrease of the impurity content in the aqueous precursor. The 470 nm feature falls within the visible wavelength range, thus explaining the yellow coloration of the pristine PYR14Br sample (i.e., the purified precursor solutions are uncolored). A still relevant reduction in impurity content is evidenced in passing from a (C + Al2O3): precursor weight ratio of 0.75:1 to 1.5:1 whereas a moderate decrease is found for a further increase (up to a (C + Al2O3): precursor ratio equal to 2.25:1) of the sorbent amount.
The results reported in Figure 3b show a beneficial, even if moderate, effect due to Al2O3 as evidenced from the comparison (blue vs. red trace) with the precursor purified without alumina. This is in agreement with results reported in literature [34], which show a synergic effect of Al2O3 with activated carbon. Once more, the solvent gives no interference.
2.3. Absorbance Dependence on the Impurity Content
The demand to obtain precursors with high purity level has pushed towards suitable analytical methodologies able to reveal even low impurity contents. The UV-VIS spectrophotometry was selected for its reliability, easy management (also in preparing samples) and low cost. The purpose of this investigation is to find a correlation between the absorbance of the precursor samples and their impurity content.
The aqueous phase as obtained from the synthetic route (containing the pristine precursor and called hereafter “mother solution”) shows concentration values, referred to PYR14Br and overall impurities (coming from the PYR1 and 1-Br-But reagents) equal to 780 ± 4 and 12.490 ± 0.070 g L−1 (corresponding to an impurity content, referred to pure PYR14Br, equal to 16,020 ± 80 ppm), respectively. These values were calculated taking into account: (i) the stoichiometry (Scheme 2) and the yield (100%) [38] of the reaction for obtaining the PYR14Br precursor; (ii) the proper mass (included a PYR1 excess equal to 0.5% in weight with respect to the stoichiometric amount) of the reagents and solvent (deionized water) used in the synthesis route; (iii) the impurity content (i.e., 2 wt% and 1 wt% for PYR1 and 1-Br-But, respectively) of the reagents (used as received); (iv) the density (1.175 ± 0.001 g mL−1) of the mother solution. Therefore, it was possible to calculate the mass of the PYR14Br precursor, obtained from the synthesis process (Scheme 2), and the overall impurity amount (i.e., allowing to determine the overall impurity content in the pristine precursor before to be purified). The precursor and overall impurity concentrations in the mother solution were determined through its overall mass (reagents + water) and density values.
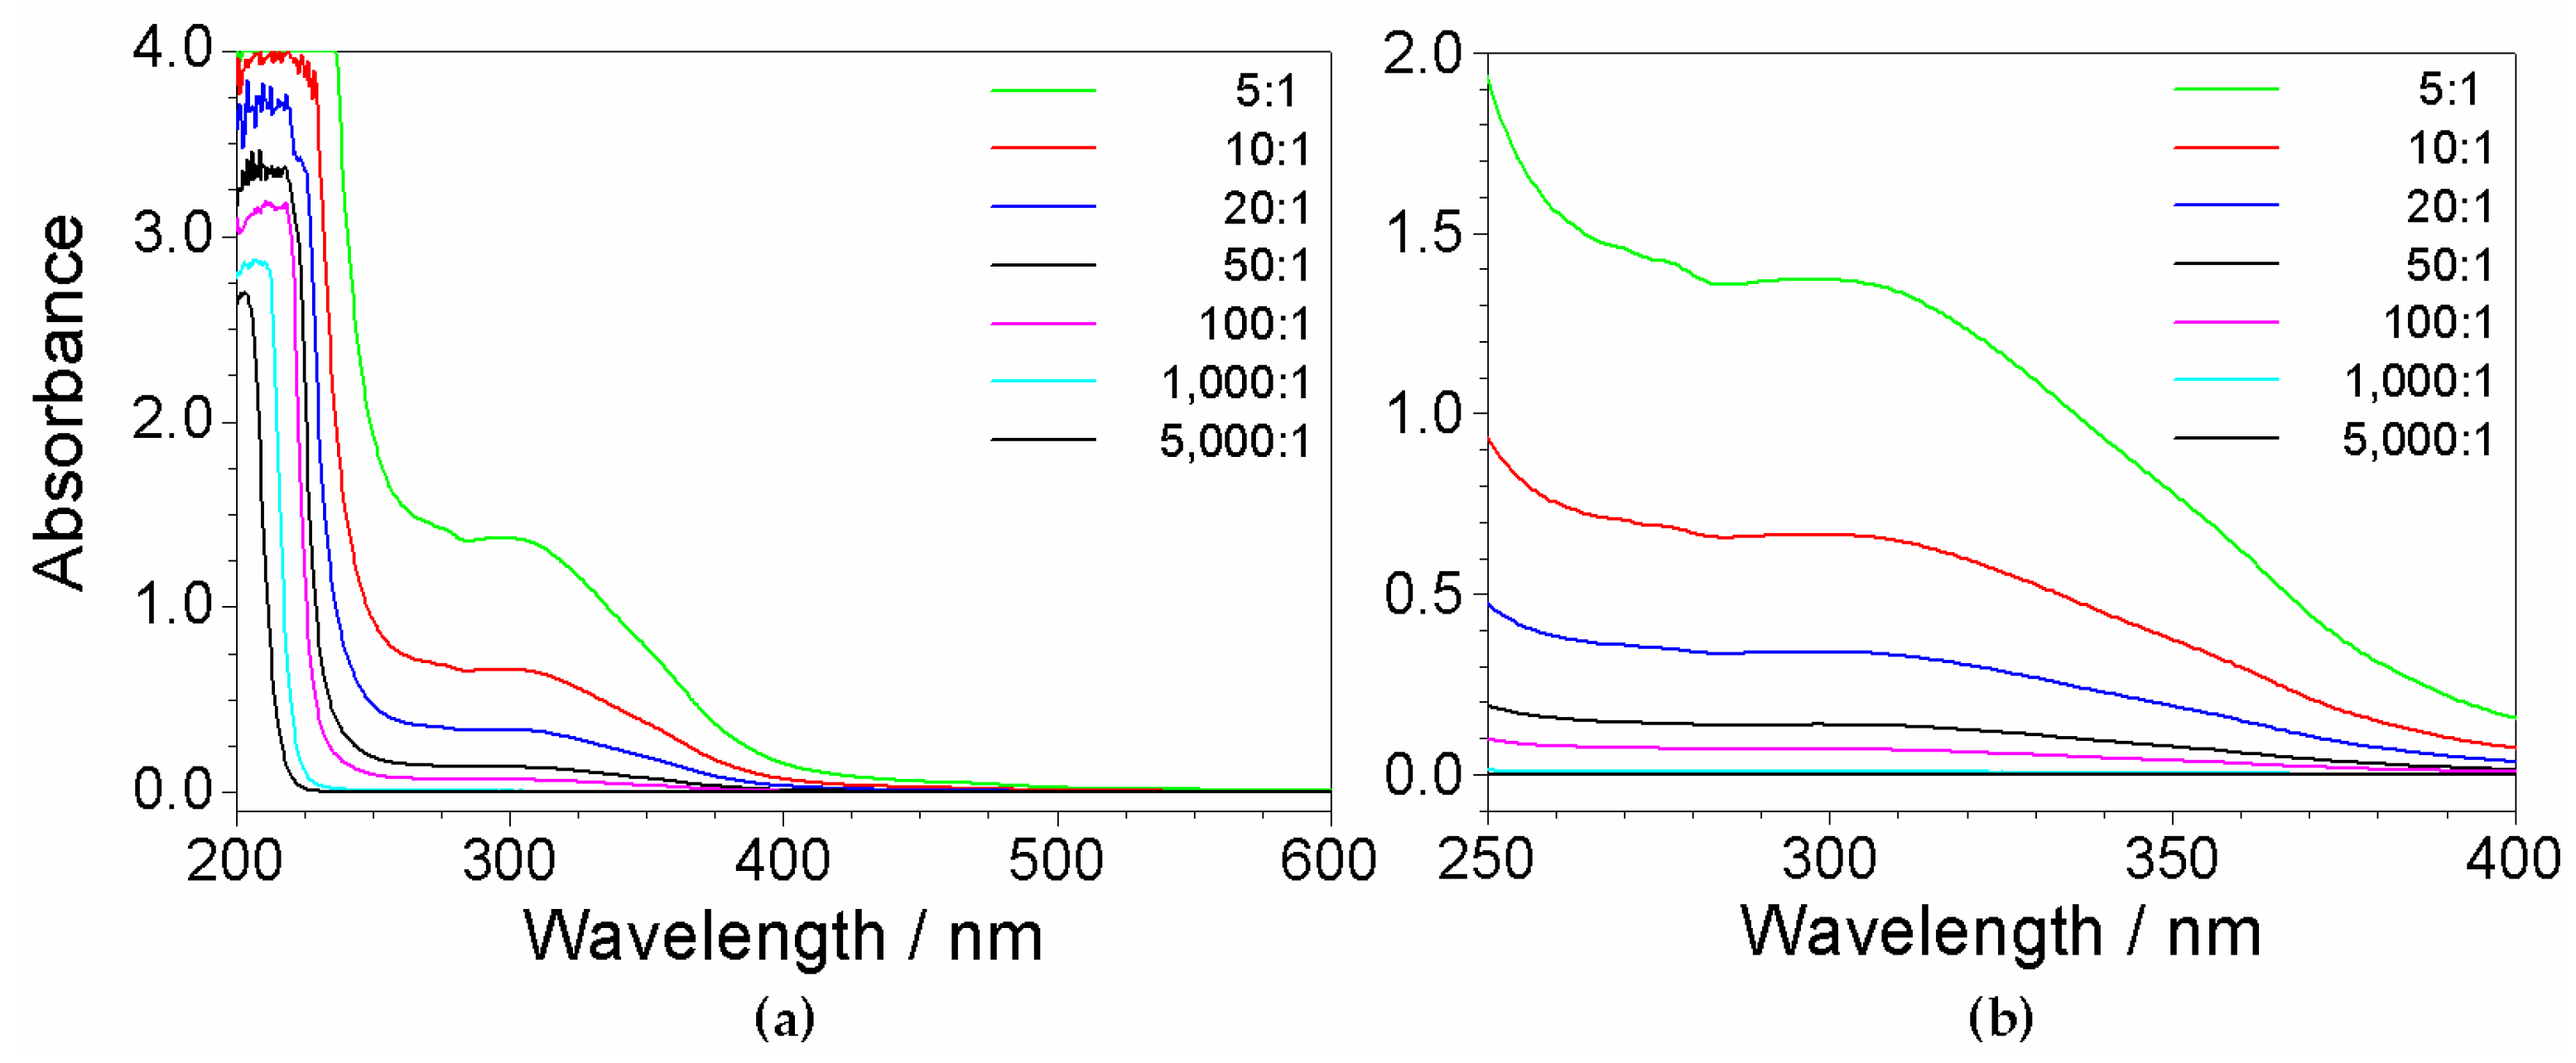
Various fractions of the mother solution were diluted (in deionized water) according to volume ratios from 5:1 to 5000:1 in order to prepare aqueous PYR14Br samples at different impurity concentrations (mg L−1, i.e., calculated considering the impurity concentration of the mother solution and dilution volume ratios) as reported in Table 1. The overall impurity content (i.e., calculated by the dilution volume ratios) with respect to the pure precursor mass is also reported.
UV-VIS measurements were performed (at room temperature) on the precursor solutions listed in Table 1. The results (reported in Figure 4) reveal, apart the features around 200 nm due to PYR14Br and the PYR1 excess, significant profiles within the 260–450 nm wavelength range, which became progressively weaker with the increase of the dilution ratio. These features, as observed in Figure 1 for the UV-VIS measurements run on reagents, are to be assigned to impurities. In addition, as better evidenced in the magnification of the 250–400 nm range depicted in panel (b), evident spectrophotometric signals are observed even at high dilution ratios (i.e., very low content of impurities). Therefore, the absorbance due to the impurities in the precursor aqueous phase is seen (as expected) to depend on their concentration and, consequently, on the precursor purity level.
2.4. Determination of Precursor Content in Aqueous Phase
The “aqueous” synthesis process allows of obtaining a precursor dissolved in water phase. In order to determinate both the yield of the process (after preparation and purification) and the purity level of the (precursor) sample, the concentration (and the overall amount) of the precursor in the aqueous phase has to be determined.
As PYR14Br and Br− have identical molarity, the precursor concentration was determined by checking the bromide content in the aqueous phase. Water solutions of highly pure KBr (Carlo Erba, ≥99.4 wt%) at different molarities (KBr and Br− have identical molar concentrations) were prepared and subjected to X-ray fluorescence analysis (performed at room temperature). The Br− concentration (mmol L−1) of the KBr solution samples was plotted as a function of the count number recorded during the measurements to obtain a calibration curve as reported in Figure 5, which shows a linear trend. The results are well represented by Equation (1) (regression coefficient = 0.999) where y and x (error bar equal to 0.005) represent the Br− concentration and the count number, respectively:
y = 0.613x
Therefore, the molar concentration of PYR14Br can be determined, through the Equation (1), by X-ray fluorescence measurements carried out on the precursor aqueous phases (previously diluted in water). The overall amount of PYR14Br can be easily calculated by the volume of the aqueous phase (e.g., obtained by mass and density measurements run on the aqueous phase).
The UV-VIS measurements allowed to reveal the absorbance vs. wavelength range due to impurities (Figure 1) and to define the processing conditions (Figure 2) and (C + Al2O3): precursor weight ratio (Figure 3) for the purification route. In addition, a linear relationship between the precursor concentration and count number, recorded by X-ray fluorescence analysis, was found (Figure 4). Therefore, it was possible to determine the efficiency of the precursor recovery process, carried out by rinsing of the sorbent materials after purification route, and the impurity content in the purified precursor.
2.5. Efficiency of the Precursor Recover Process
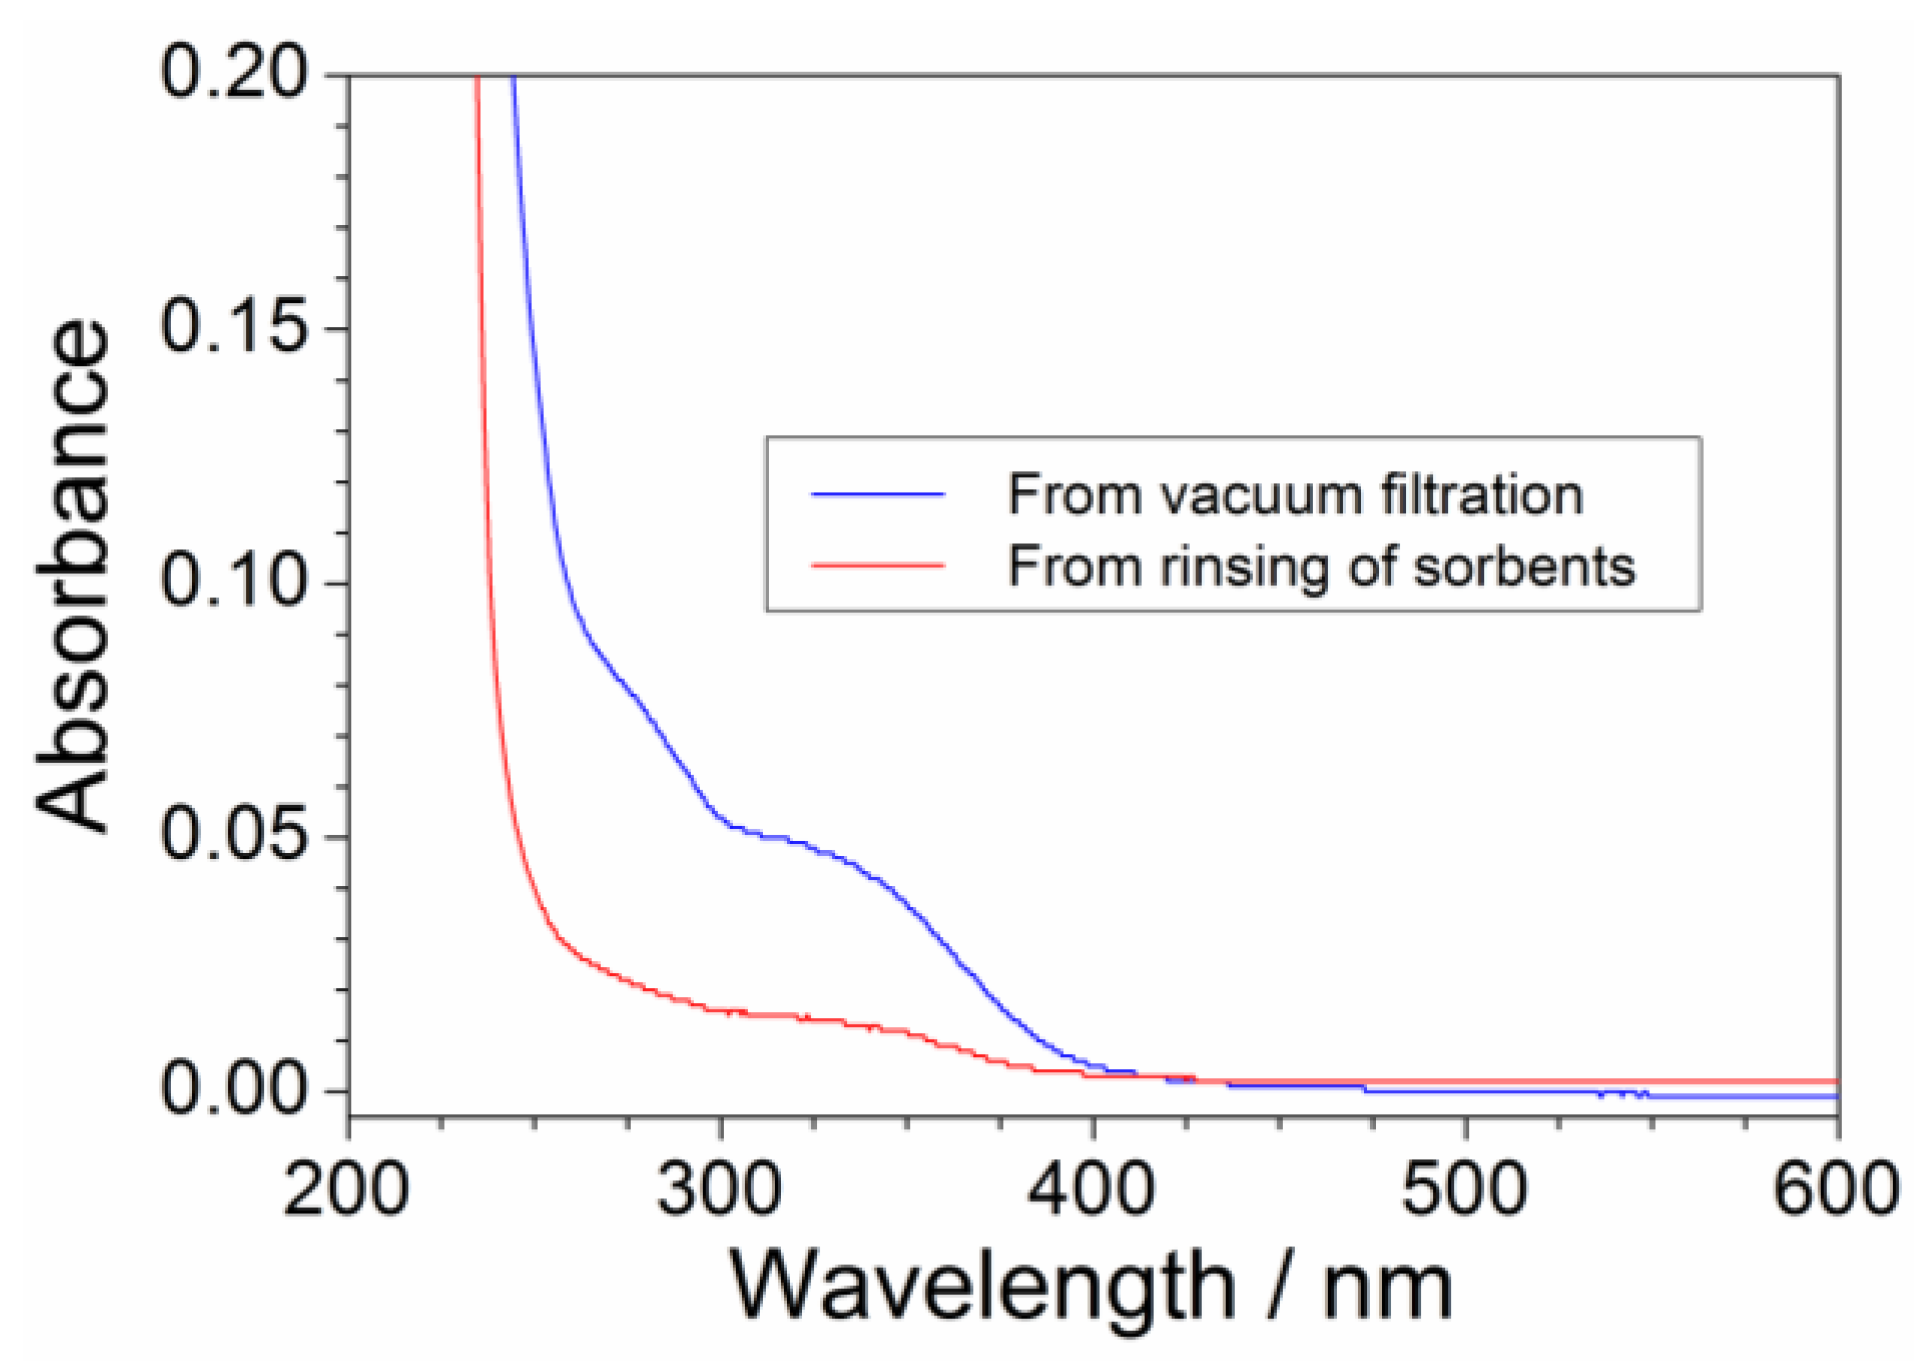
The pristine precursor, obtained from the aqueous synthesis process, has to be addressed to the purification route carried out through sorbent materials (i.e., successively, the purified precursor is addressed to the anion exchange process to obtain the ionic liquid). Despite vacuum filtration, a precursor fraction is trapped through sorbents (activated charcoal and alumina), which (upon separation from the aqueous precursor phase) has to be rinsed with deionized water (in weight ratio equal to 2:1 with respect to the sorbent mass) to recover the retained PYR14Br. However, release of impurities (previously retained by sorbents) should be avoided and/or minimized. This issue was investigated by UV-VIS measurements run on the purified aqueous PYR14Br both directly obtained through vacuum filtration and collected after rinsing of sorbents. The (C + Al2O3): PYR14Br and C: Al2O3 weight ratios were fixed equal to 1.5:1 and 2:3, respectively. The results, reported in Figure 6 as absorbance vs. wavelength traces, evidence a much lower impurity content in the aqueous phase obtained by sorbent rinsing (blue curve) with respect to that directly obtained from vacuum filtration (red curve), e.g., revealed by the much smaller features in the 250–400 nm range (conversely, the precursor is revealed by the main feature around 220 nm). Therefore, no relevant impurity release (from sorbent materials) occurs during the rinsing step for a water: (C + Al2O3) weight ratio equal to 2:1.
For determining the efficiency of the recovery process of precursor (during the purification route), the aqueous pristine PYR14Br samples were purified through different (C + Al2O3): PYR14Br weight ratios, i.e., from 0.75:1 to 3:1, whereas the C: Al2O3 weight ratio was fixed equal to 2:3. The water: (C + Al2O3) weight ratio was kept to 2:1 during the rinsing steps. X-ray fluorescence measurements were performed on the purified precursor samples; the aqueous phases collected after both (direct) vacuum filtration (of the slurry containing aqueous PYR14Br and sorbents) and the rinsing step (of sorbents) were analyzed. The pristine PYR14Br samples were tested for comparison purpose. All samples were diluted with deionized water according to a volume ratio from 20:1 to 100:1, i.e., depending on the precursor concentration, in order to avoid that signal intensity falls out of the instrumental full scale. The PYR14Br concentration of each sample was determined, on the basis of the count number recorded during the X-ray fluorescence measurements, using the Equation (1). Finally, the PYR14Br amount (for each sample) was calculated by the dilution ratio and by determining the volume of the sample. The results, summarized in Table 2, show a decrease of the PYR14Br fraction obtained by direct filtration from 91 to 69 wt% in passing from a PYR14Br:C:Al2O3 weight ratio from 1:0.30:0.45 to 1:1.20:1.80, e.g., indicating how the fraction of retained precursor raises with increasing the sorbent amount (due to the increase of the overall volume and surface area of sorbents with respect to the precursor amount). However, the rinsing step can recover almost the whole precursor fraction retained by sorbents, allowing to minimize the loss of PYR14Br (during the purification route) and, therefore, to increase the yield of the purification route up to 100%.
2.6. Determination of the Impurity Content in Purified Precursor
The absorbance vs. wavelength response, obtained from UV-Vis measurements carried out on aqueous precursor solutions (Figure 4), is characterized by various features, which are ascribable to the different impurities within the PYR14Br samples (Figure 2 and Figure 3). Particularly, the area value (error bar equal to 5%) comprised between each UV-VIS plot, recorded in the 260–600 nm range of Figure 4, and the X axis (i.e., reporting the wavelength number) is directly proportional to the overall amount of impurities contained in the volume of precursor sample subjected to spectrophotometric measurements. As identical volumes of each precursor sample were analyzed, we can assume direct proportionality between the overall content and the concentration of impurity. The latter, referred to the aqueous PYR14Br solutions reported in Table 1, was plotted as a function of the area delimited by the absorbance curves of Figure 4 towards the X axis in the 260–600 nm range. The results, reported in Figure 7, show an almost linear concentration vs. area relationship up to an impurity content of 60 mg L−1 in agreement with the Equation (2) (regression coefficient = 0.997):
where y and x represent the impurity concentration and calculated area value, respectively. The intercept value exhibits an error bar of ± 20. Equation (2) allows to determinate the impurity concentration of aqueous precursor solutions by UV-VIS measurements. Analogously, the precursor concentration of the same solution sample can be obtained by Equation (1) through X-ray fluorescence measurements. Therefore, the proper combination of these analytical methods enables the determination of the purity level of precursor (e.g., obtained from purification route) to be addressed to the ionic liquid synthesis route.
y = 330x
2.7. Investigation on Sorbents:Precursor Ratio
On the basis of the results reported in Figure 5 and Figure 7, we have tried to optimize the amount of sorbent materials to be used in the purification route. Different PYR14Br batches were prepared and purified, according to the route described in Materials and Methods, through different (C + Al2O3): precursor weight ratios as reported in Table 3. Upon vacuum filtering of the aqueous PYR14Br phase (and sorbent separation), the sorbents were rinsed with a deionized water amount twice with respect to the overall amount of C and Al2O3 (e.g., in weight ratio equal to 2:3). The processing temperature and time were fixed to 23 °C and 3 h, respectively.
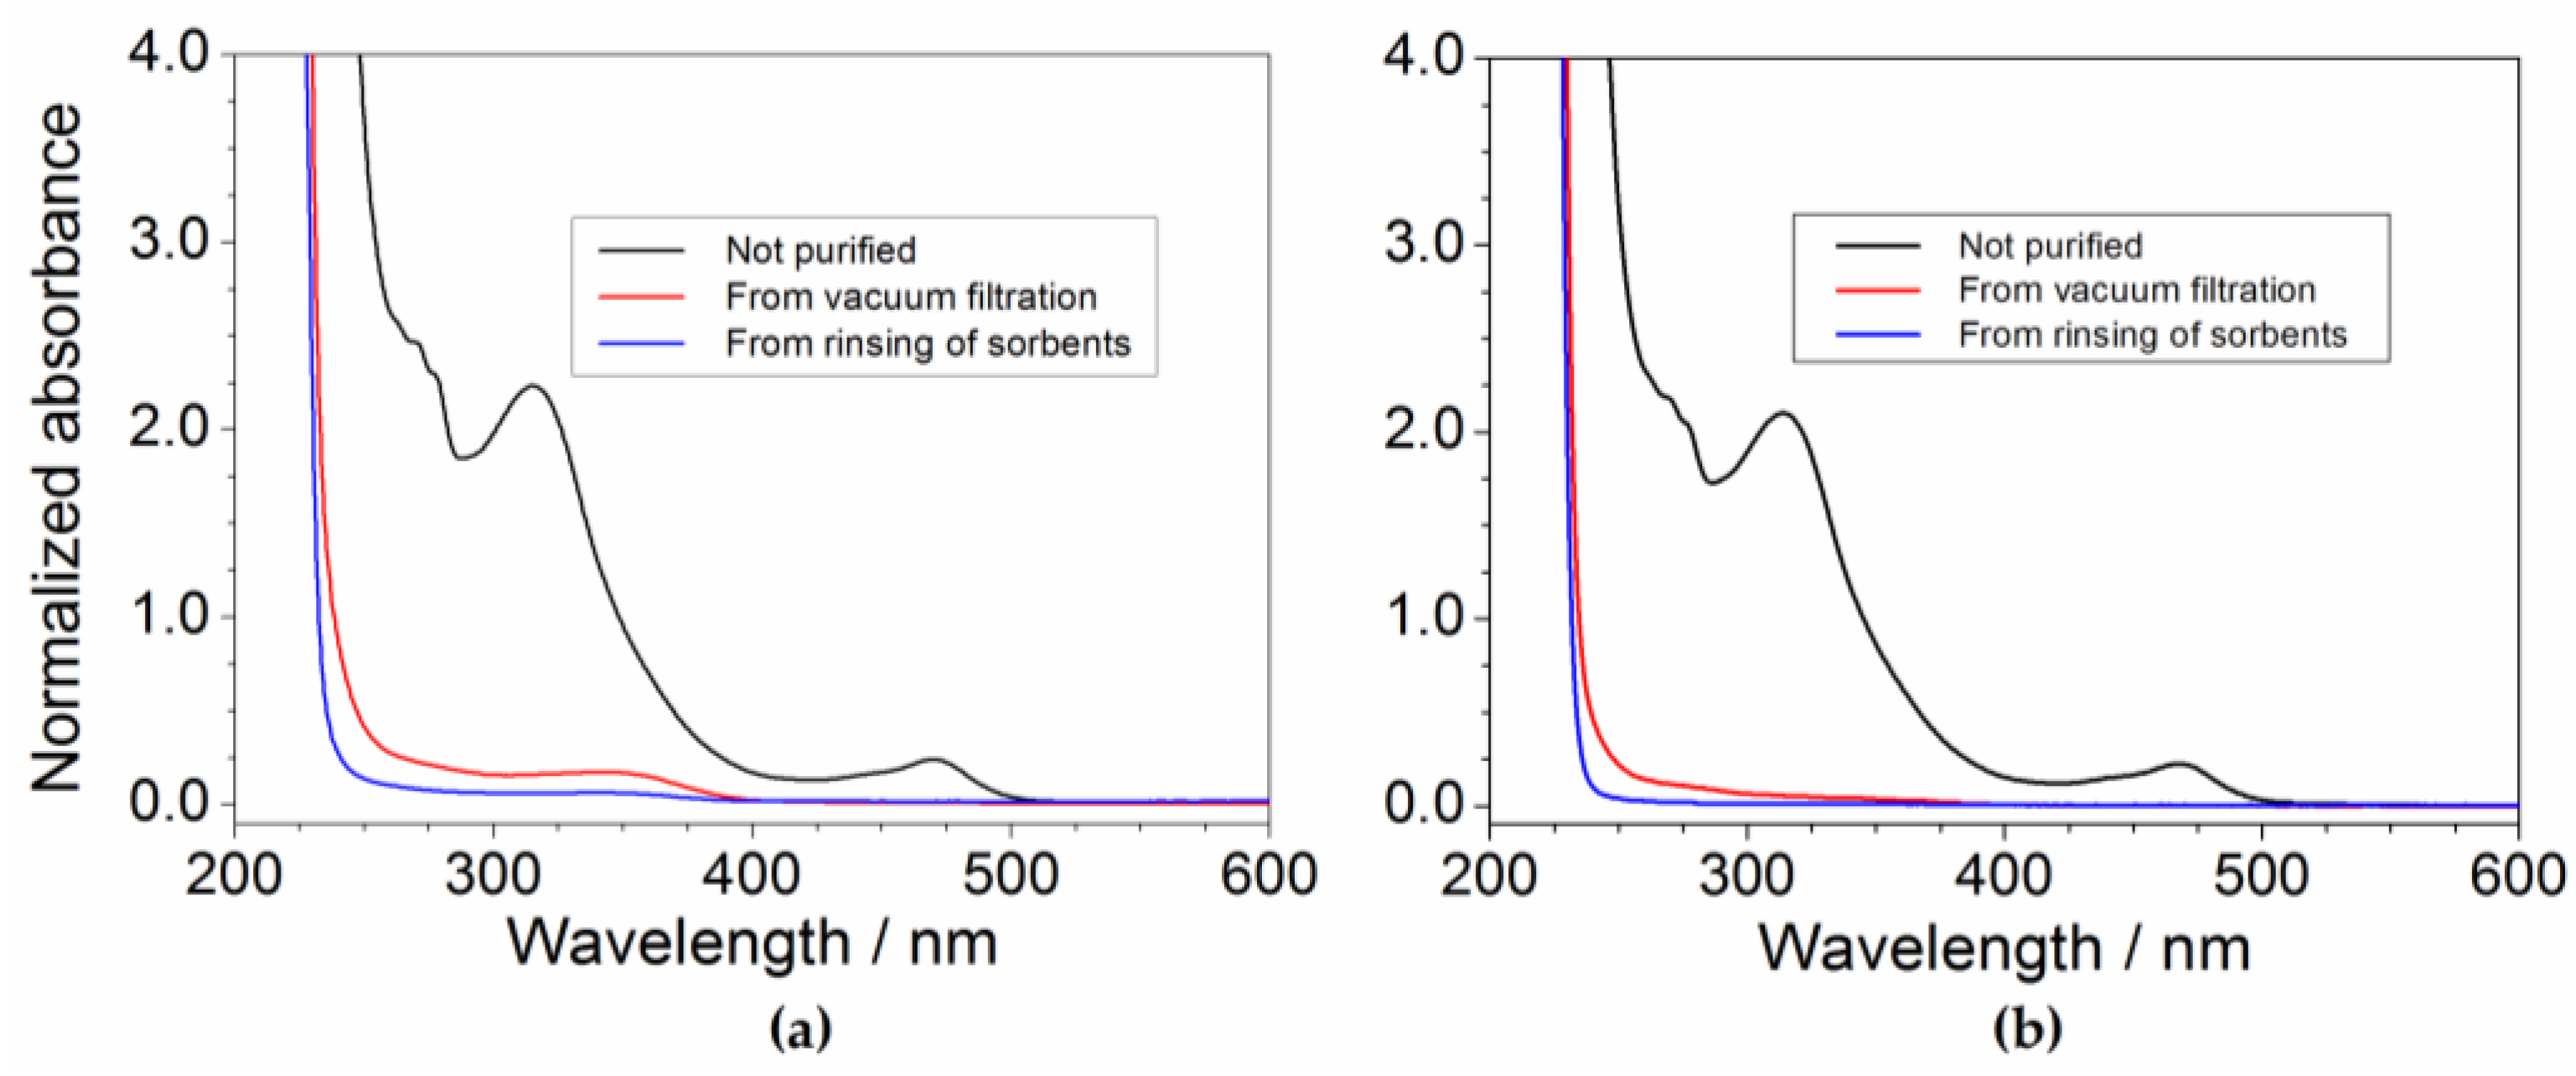
The purified (aqueous) PYR14Br samples, obtained by vacuum filtration and sorbent rinsing steps, were investigated by UV-VIS spectrophotometry. Additionally, pristine samples were examined for comparison purpose. It should be noted that the precursor samples obtained from the purification route are more diluted (in PYR14Br) than the pristine ones (i.e., water is properly added either to pristine aqueous PYR14Br before to be treated with sorbents or to the sorbents for recovering the trapped precursor). In addition, the dilution increases from batch I trough IV because progressively higher amounts of sorbents and, consequently, of water were added. Therefore, the pristine precursor solutions were previously diluted in water (before to be subjected to UV-VIS measurements) in order to match the molar concentration of the purified PYR14Br samples. The dilution volume ratio ranged from 1.57:1 (batch I) to 3.29:1 (batch IV).
Figure 8 illustrates the absorbance vs. wavelength dependence of the pristine and purified PYR14Br solution samples of batches I (panel a) and IV (panel b). The absorbance traces were normalized with respect to the same dilution volume ratio used for the pristine samples. The feasibility of the purification route is clearly observed at lower (C + Al2O3): precursor ratios (batch I) as highlighted by the comparison among the pristine (black trace) and purified (red and blue traces) precursor profiles reported in panel a. In good agreement with the results shown in Figure 6, lower impurity concentration is detected in the samples collected after sorbent rinsing step (blue trace) with respect to those obtained by “direct” vacuum filtration (red trace), once more indicating the feasibility to fully recover the precursor fraction trapped through sorbents without further contaminating the PYR14Br samples. The comparison among the results shown in panels (a) and (b) indicate higher purity levels in the samples coming from batch IV with respect to batch I due to the larger sorbent amount used for precursor mass unit, e.g., in agreement with the data reported in Figure 3. Therefore, the value of area, delimited by the absorbance profiles (falling in the 260–600 nm range) of the (pristine and purified) samples of the batches I to IV towards the X axis, was calculated. Conversely, the area value lying below the absorbance curves of the purified samples coming from sorbent rinsing step (blues trace) is too small to be estimated, indicating that the residual impurities (upon purification route) are practically located only in the (aqueous) precursor fraction obtained by “direct” vacuum filtration. The impurity content in the pristine and purified precursor samples of the batches I to IV (differing for the (C + Al2O3): precursor weight ratio) was determined, on the basis of the area values, through Equation (2). It should be noted that all pristine samples exhibit the same impurity content, this allowing the evaluation of the purity level of the PYR14Br precursor after treatment with different amounts of sorbents.
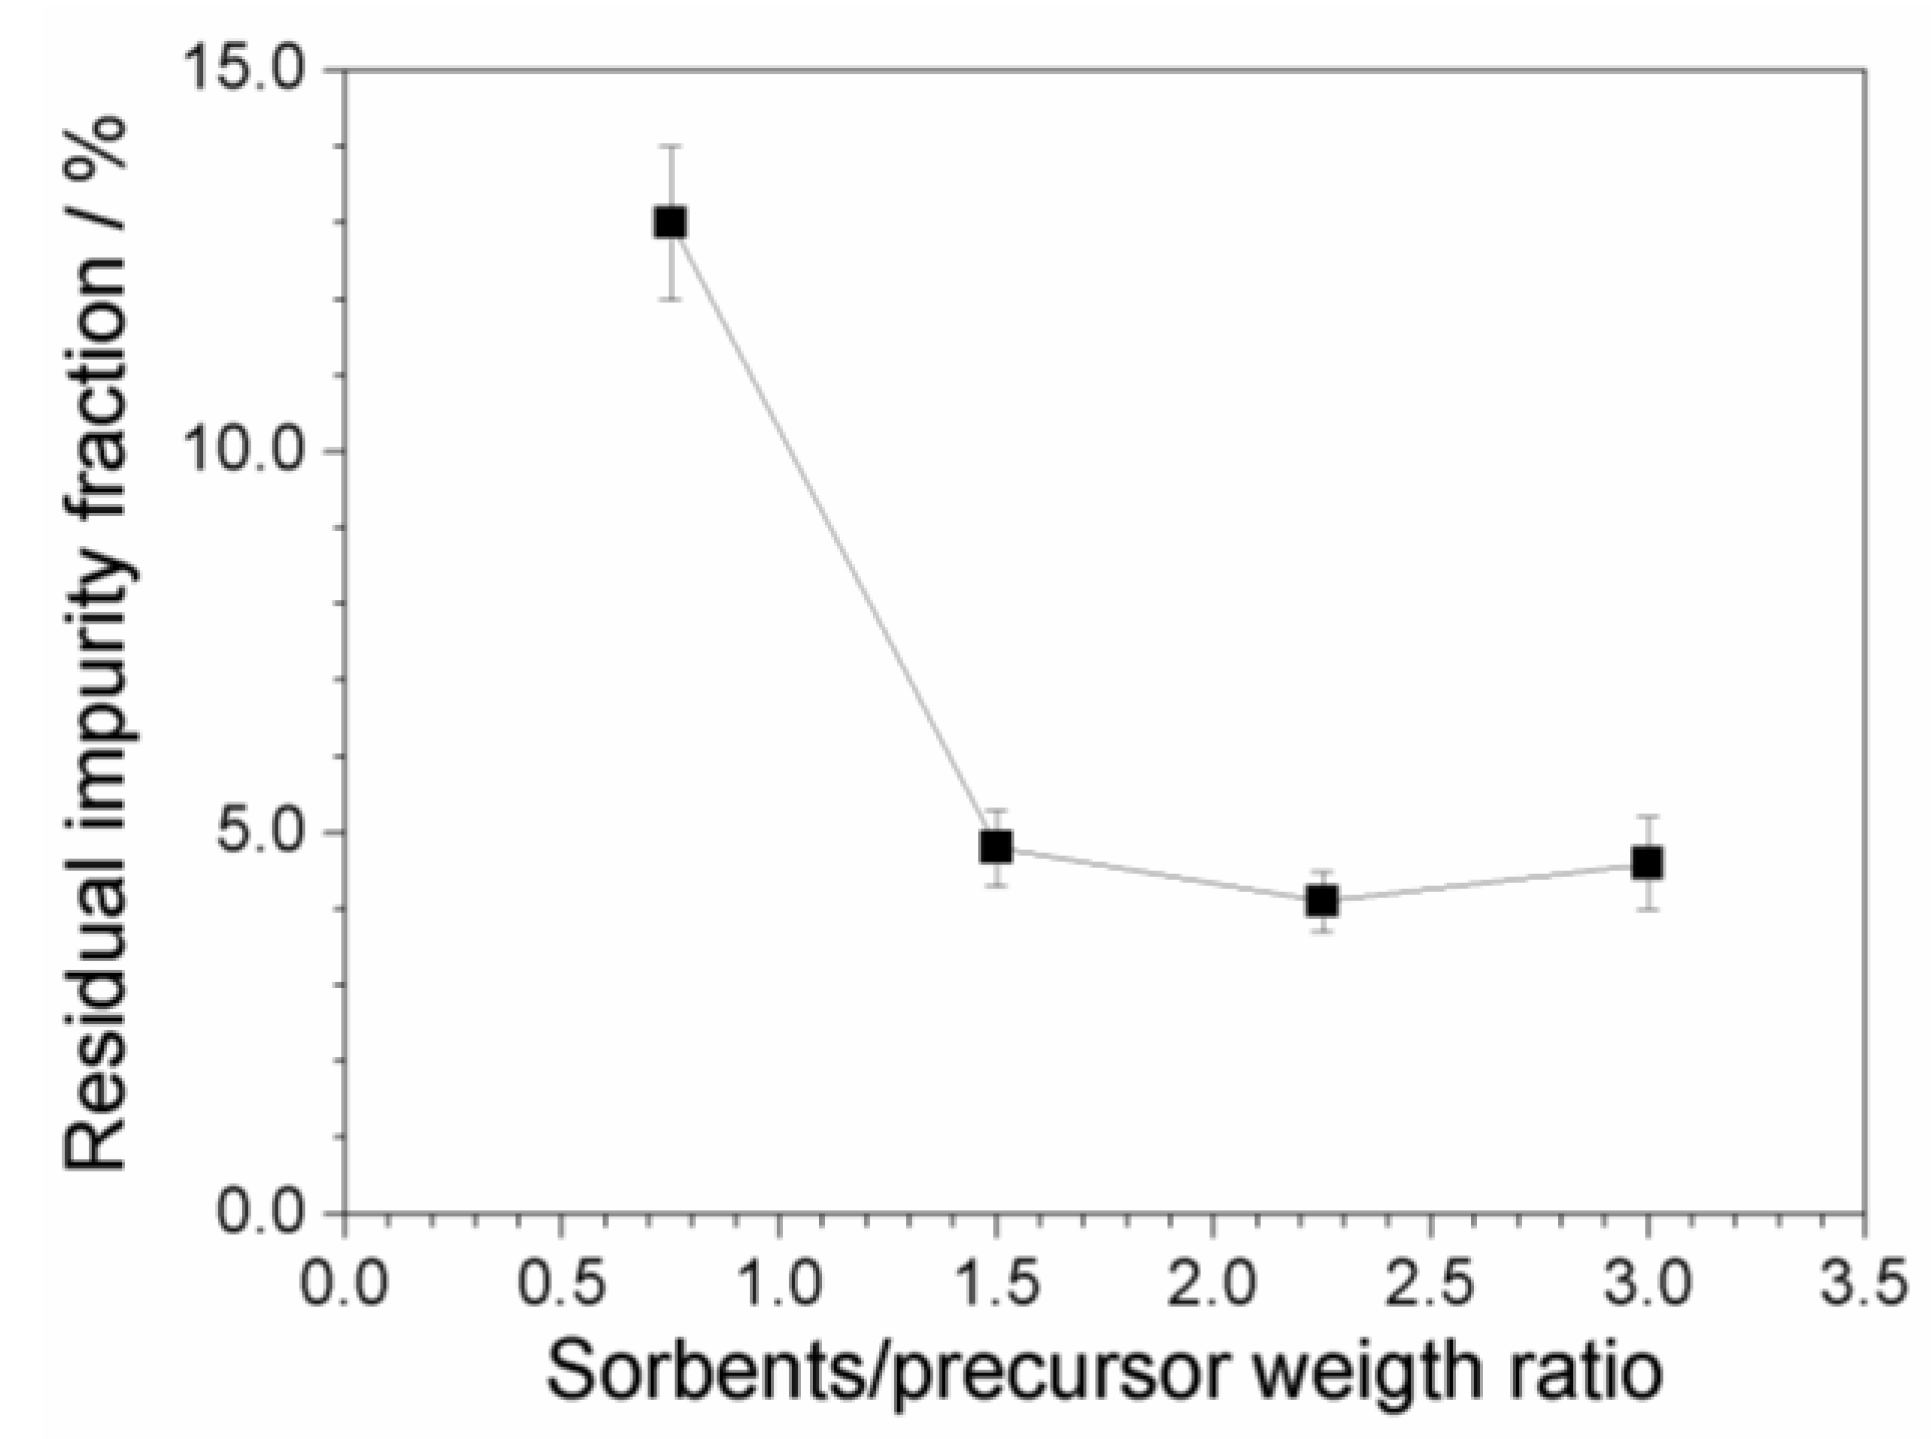
Figure 9 plots the residual fraction of the impurities, normalized with respect to the initial content, as a function of the (C + Al2O3): PYR14Br weight ratio. A relevant and progressive reduction of the impurity level with the increase of the sorbent amount is seen, i.e., from about 13 (above 2000 ppm) to less than 5% (below 800 ppm) with respect to the initial concentration of impurities is detected moving from a (C + Al2O3): PYR14Br weight ratio of 0.75:1 to 1.5:1. A further increase of the sorbent amount does not lead to any practical improvement in terms of the purity level of the precursor. We can likely hypothesize that, when the impurity content is very low, the precursor is preferentially adsorbed onto the sorbent surface (with respect to impurity), this hindering the adsorption of further impurities even in the presence of larger sorbent amounts. It should be noted that the possibility to use lower amounts of sorbents leads to reduction of the time/cost of the purification route and softer rinsing/recycling steps.
To summarize, a proper purification procedure (carried out at room temperature and for a processing time of 3 h), which suitably combines activated carbon and alumina as the sorbent materials and uses water as the only processing solvent, can remove more than 95% of the overall impurity content in pristine precursors as obtained from synthesis routes. The residual impurity content (below 5%) is expected to be removed through cleaning steps performed at the ionic liquid level. Work is in progress in our laboratory aiming to investigate this issue.
The effect of the treatment through sorbents on the purity level of ionic liquids is shown in Figure S1a (Supplementary Materials), which compares the results obtained from UV-VIS measurements carried out at room temperature on pristine (not purified) PYR14TFSI (black trace) and on the same RTIL batch (red trace) after purification route performed at the precursor level according to the procedure followed for batch I. The samples were previously diluted in ethanol before running the UV-VIS measurements. The much weaker features, observed in the absorbance vs. wavelength trace of purified PYR14TFSI with respect to those of the pristine RTIL, clearly indicate a remarkable reduction of the impurity content during the purification route through the sorbents. This is also confirmed by sharp coloration turning from the pristine (yellowish, A) to purified PYR14TFSI (uncolored, B), as reported in the picture of Figure S1b.
Finally, the effect of the precursor impurity level on the electrochemical performance, e.g., in terms of ionic conductivity and cathodic stability, of the PYR14TFSI ionic liquid was investigated. The tested RTIL samples were synthesized after having subjected the PYR14Br precursor to different purification routes, e.g., according to the procedure described for batches I (e.g., the precursor was purified using a (C + Al2O3): PYR14Br weight ratio equal to 0.75:1) and IV (PYR14Br:sorbents weight ratio equal to 3:1), respectively, as reported in Table 3. Therefore, the PYR14TFSI ionic liquid samples were prepared from PYR14Br precursors at different impurity contents (Figure 9). The results are depicted in Figure S4 as Supplementary Materials. The PYR14TFSI sample (Figure S4a) obtained from unpurified PYR14Br (open black squares), i.e., exhibiting an impurity content > 16,000 ppm, shows slightly different conductivity values with respect to that coming from precursor (i.e., purified through the procedure followed for the batch IV) containing less than 800 ppm (red full squares). No variation of the melting point, evidenced by a conduction jump of more than four orders of magnitude around −7 °C [39], is observed. Therefore, the impurity content does not relevantly affect the ion transport properties of the ionic liquids both in the solid and molten state. Figure S4b compares the cathodic voltammetry trace of two PYR14TFSI samples obtained from PYR14Br precursor having an impurity level above 2000 ppm (black dotted trace) and below 800 ppm (red solid trace). The less pure RTIL shows well-pronounced, large features, likely ascribable to the reduction of impurities, around −1.5 V, −2.5 V, and −3.3 V vs. Ag°/Ag+, respectively, prior to the massive reduction of PYR14TFSI [39] which takes place around 3.8 V. Additionally, impurity traces may catalyze the RTIL reduction, which is detrimental in electrochemical systems as it reduces the operating voltage range and, consequently, the performance of the device. Conversely, a practically flat voltammetry curve is seen for the purer PYR14TFSI, which also exhibits superior cathodic break-down potential. Therefore, the purity level of the precursor plays a key role in the electrochemical stability of RTILs, especially in view of application in practical devices.
3. Materials and Methods
3.1. Preparation of the PYR14Br Precursor
The PYR14Br precursor was synthesized through a procedure reported in detail elsewhere [38]. The reagents N-methylpyrrolidine (Aldrich, Saint Louis, Missouri, USA, 98 wt%) and 1-bromobutane (Aldrich, 99 wt%) were used as received. Activated carbon (Darco-G60) and alumina (Aldrich, acidic, Brockmann I) were utilized as the sorbent materials. Water (process solvent) was deionized by a EDM Millipore (Billerica, Massachusetts, USA) ion resin exchange deionizer (water resistivity > 18 MΩ cm). Briefly, the precursor was obtained by reacting N-methylpyrrolidine (0.5 wt% excess with respect to the stoichiometric amount), previously dissolved in water, accordingly, to a 1:1 volume ratio, with 1-bromobutane. The latter chemical is immiscible with water, resulting in liquid phase separation, e.g., denser 1-bromobutane (lower phase) and N-methylpyrrolidine/water mixture (upper phase). The two phases (loaded in a sealed glass reactor) were stirred at 70 °C using an oil bath for the temperature control. The progressive disappearance of the lower phase (and the simultaneous increase of the upper one) suggests the ongoing formation of PYR14Br (which is highly soluble in water). Upon 30 min stirring, a single yellowish aqueous phase was observed, indicating that the reaction was driven up to a yield of 100%. The synthesis reaction of the PYR14Br precursor is represented in Scheme 2.
3.2. Cleaning of Sorbent Materials
The sorbents (namely, activated carbon and alumina), before being used in the purification route, were subjected to consecutive rinsing steps with deionized water, then boiled for 1 h. Successively, the solid phase (sorbents) was vacuum filtered using a Millipore system with hydrophilic polyamide filter membranes having a pore size less than 0.2 µm. An oil-free pump (<1 mTorr) was used to generate vacuum. The aqueous phase (containing impurities removed from sorbents) was separately collected to be analyzed, whereas the solid one was addressed to the following rinsing steps.
3.3. Purification of Precursor
The purification of the precursor was performed through activated carbon and alumina. The suitable amount of sorbents was added to the aqueous PYR14Br solution (obtained from the synthesis reaction reported in Scheme 2) previously diluted with deionized water (H2O:PYR14Braq volume ratio = 2:1) to reduce the viscosity of the resulting slurry. After continuous stirring at the proper temperature and for the proper amount of time, the sorbents were separated from the liquid fraction by vacuum filtration (performed using polyamide filter membranes with a pore size < 0.2 µm). The liquid fraction (constituted by a clear and colorless aqueous solution of PYR14Br) was separately collected for the analysis, whereas the solid fraction (still loaded in the filtering system) was properly rinsed in situ with the appropriate amount of deionized water in order to remove PYR14Br trapped through sorbent materials without extracting impurities. The liquid fraction from the rinsing step (constituted by a clear and colorless diluted aqueous solution of PYR14Br) was collected for the analysis.
3.4. Preparation of the PYR14TFSI Ionic Liquid
The PYR14TFSI ionic liquid was obtained by reacting the aqueous solution of purified PYR14Br precursor (Scheme 2) and the LiTFSI lithium salt (highly soluble in water) in the appropriate amounts (2–3 wt% LiTFSI excess with respect to the stoichiometric amount) [38]. The reaction (anion exchange or metathesis), represented in Scheme 3, led to fast formation of hydrophobic PYR14TFSI and hydrophilic LiBr. After one hour stirring, the mixing was interrupted and phase separation was allowed for few minutes. The upper phase was mostly composed of water, LiBr and excess LiTFSI whereas the lower one (having higher density) was constituted of PYR14TFSI ionic liquid with traces of water and lithium salts (i.e., LiBr and LiTFSI). After removal of the aqueous phase, the PYR14TFSI ionic liquid was rinsed several times with deionized water to remove water soluble salts and (water-soluble) impurities. The ionic liquid was then placed in a vacuum rotary evaporator at 90 °C to remove most of the water and, finally, dried (within a controlled environment dry room with moisture content below 10 ppm) under high vacuum (10−5 mmHg by a turbo-molecular pump) at 20 °C for two hours, followed by two hours at 60 °C and eighteen hours at 120 °C. This procedure allowed the reduction in moisture content in the ionic liquid below 2 ppm [38].
3.5. Analytical Methods
The chemical structure of the precursor cation was checked by NMR measurements using an Avance III Bruker (Billerica, Massachusetts, USA) spectrometer working at 200.13 MHz on a 1H . The spectra were recorded with a broadband probe BBFO (Bruker,). Deuterated DMSO, D6 (>99%, Aldrich), was used as the solvent. The peak assignment was made on the basis of the chemical shifts (expressed in parts per million, ppm) and peak integrals with the DMSO (1H-NMR δ = 2.49 ppm) signal as the reference.
The purity content of the PYR14Br precursor samples, e.g., in aqueous or (absolute) ethanol (>99.5%, Carlo Erba, Cornaredo, Milan, Italysolutions, was investigated by UV-VIS spectrophotometry in the 190–1100 nm (resolution of 0.5 nm) wavelength range at room temperature. The measurements were performed by a UV-1800 Shimadzu (Kyoto, Japan) spectrophotometer using quartz-made cuvettes with a 10 mm optical path.
X-ray fluorescence spectrometry was used to determinate the precursor concentration, revealed as bromide anions, within the aqueous solutions. The measurements were carried out (at room temperature) by a Shimadzu energy-dispersion EDX-720 spectrometer. A rhodium foil was used as the X-ray source, operating with energy level of 15 (for elements from sodium to titanium) or 50 (titanium to uranium) kV. The (liquid) sample under test was housed in a polypropylene cuvette with a 6-μm thick circular (10 mm diameter) Mylar window.
Density measurements on the precursor solutions were performed (at room temperature) using a Mettler Toledo (Columbus, Ohio, USA) DE40 density-meter.
3.6. Electrochemical Measurements
The ionic conductivity of the PYR14TFSI ionic liquid was determined by an AMEL 160 conductivity meter. The RTIL was housed (in the dry-room) in a sealed, glass conductivity cell (mod. 192/K1, AMEL, Milan, Italy) equipped with two porous platinum electrodes (cell constant equal to 1.00 ± 0.01 cm). The conductivity tests were run in the temperature range from −40 to 100 °C using a MK53 climatic test chamber (Binder GmbH, Crailsheim, Germany). To fully crystallize the RTIL sample, the cell was immersed in liquid nitrogen for a few seconds and, then, transferred in the climatic chamber at −40 °C. After a few minutes of storage at this temperature, the solid sample again turned liquid. This route was repeated until the ionic liquid sample remained solid at −40 °C [40]. After a storage period at −40 °C for at least eighteen hours, the conductivity of PYR14TFSI was measured by running a heating scan at 1 °C h−1.
The cathodic stability of the PYR14TFSI ionic liquid was evaluated by linear sweep voltammetries (LSVs) at 5 mV s−1. A sealed, three-electrode, glass cell (loaded with about 0.5 ml of the RTIL sample under test) described in detail elsewhere [41], was used for the LSV tests. A glass-sealed, platinum working electrode (active area equal to 0.78 mm2) and a platinum foil counter electrode (about 0.5 cm2) were used. The reference electrode [41] was a silver wire immersed in a 0.01 M solution of AgCF3SO3 in PYR14TFSI, separated from the cell compartment by a fine glass frit. High purity argon (3 ppmv water and 2 ppmv oxygen) was flowed over the ionic liquid under investigation for 30 min before the start and during the experiment. The measurements were conducted by scanning the cell potential from the open circuit potential (OCP) towards the more negative (cathodic limit) potential. Clean electrodes and fresh samples were used for each test. To confirm the results obtained, the LSV tests were performed at least twice on different fresh samples. The measurements were performed at 20 °C using a Schlumberger Analytical (Farnborough, Hampshire, UK) Electrochemical Interface (mod. 1287).
4. Conclusions
A detailed investigation on the purification route of precursors for hydrophobic ionic liquids to be addressed to electrochemical energy storage devices was carried out through sorbent materials (activated carbon and alumina) and water. N-butyl-N-methylpyrrolidinium bromide (PYR14Br) was chosen as the precursor for preparing the N-butyl-N-methylpyrrolidinium bis(trifluoromethanesulfonyl) imide (PYR14TFSI) ionic liquid. However, this purification route can be applied to whatever kind of ionic liquid precursor and, also, be performed using different sorbent material types.
An eco-friendly procedure, which requires water as the only processing solvent, was followed to synthesize the PYR14Br precursor. The impurity content of the aqueous precursor phases, obtained from the purification route, was detected by UV-VIS spectrophotometry measurements.
The results have shown a less efficient purification below room temperature, whereas an increase of the processing time above 3 h does not lead to any practical improvement of the precursor purity level. The precursor concentration in aqueous phase was revealed by X-ray fluorescence analysis, which has demonstrated no practical loss of precursor during the purification route. UV-VIS measurements combined with X-ray fluorescence analysis allowed to determine the impurity content of precursors obtained from the purification route. Finally, more than 95% of the initial impurity content (in pristine precursor) can be removed using a sorbent:precursor weight ratio equal to 1.5:1. No practical reduction of the impurity content was observed with a further increase of the sorbent amount. The purity level of the precursor is seen to affect the electrochemical performance of the ionic liquids.
Supplementary Materials
The followings are available online at www.mdpi.com/2078-1547/8/1/11/S1, Figure S1: (a) Absorbance vs. wavelength dependence obtained from UV-VIS spectrometry measurements performed on ethanol solutions of pristine and purified PYR14TFSI ionic liquid. (b) Picture of pristine (A) and purified (B) PYR14TFSI ionic liquids; Figure S2: Absorbance vs. wavelength dependence for the aqueous phase collected (a) after activated carbon boiling and rinsing of the fresh filter membrane, respectively, and (b) after consecutive rinsing steps run on activated carbon. The pure deionized water baseline is reported for comparison purpose. Figure S3: 1H NMR pattern of the PYR14TFSI ionic liquid. Figure S4: (a) Ionic conductivity vs. temperature dependence and (b) cathodic sweep voltammetry (5 mV s−1 and 20 °C) of PYR14TFSI ionic liquids at different impurity contents.
Acknowledgments
The authors wish to acknowledge the EU for funding within the MARS-EV Project (FP7-Contract no. 609201).
Author Contributions
Massimo De Francesco designed and performed the UV-VIS and X-ray fluorescence measurements; Elisabetta Simonetti synthesized/purified the precursor samples and analyzed the data; Gianremo Giorgi contributed to the experimental tools; Giovanni Battista Appetecchi conceived the experiments and wrote the paper.
Conflicts of Interest
The authors declare no conflict of interest.
References
- Rogers, J.R.D.; Seddon, K.R. Ionic Liquids: Industrial Application to Green Chemistry; ACS Symposium Series 818; American Chemical Society: Washington, DC, USA, 2002. [Google Scholar]
- Chiappe, C.; Pieraccini, D. Ionic liquids: Solvent properties and organic reactivity. J. Phys. Org. Chem. 2005, 18, 275–297. [Google Scholar] [CrossRef]
- Ohno, H. (Ed.) Electrochemical Aspects of Ionic Liquids; John Wiley & Sons Inc.: Hoboken, NJ, USA, 2005. [Google Scholar]
- Wasserscheid, P.; Keim, W. Ionic liquids—New “solutions” for transition metal catalysis. Angew. Chem. Int. Ed. 2000, 39, 3772–3789. [Google Scholar] [CrossRef]
- Earle, M.J.; Seddon, K.R. Ionic liquids. Green solvents for the future. Pure Appl. Chem. 2000, 72, 1391–1398. [Google Scholar] [CrossRef]
- Anderson, J.L.; Ding, J.; Welton, T.; Armstrong, D.W. Characterizing ionic liquids on the basis of multiple solvation interactions. J. Am. Chem. Soc. 2002, 124, 14247–14254. [Google Scholar] [CrossRef] [PubMed]
- Dupont, J.; de Souza, R.F.; Suarez, P.A.Z. Ionic liquid (molten salt) phase organometallic catalysis. Chem. Rev. 2002, 102, 3667–3692. [Google Scholar] [CrossRef] [PubMed]
- Pereiro, A.B.; Rodríguez, A. An ionic liquid proposed as solvent in aromatic hydrocarbon separation by liquid extraction. AIChE J. 2010, 56, 381–386. [Google Scholar] [CrossRef]
- Westerholt, A.; Liebert, V.; Gmehling, J. Influence of ionic liquids on the separation factor of three standard separation problems. Fluid Phase Equilibria 2009, 280, 56–60. [Google Scholar] [CrossRef]
- Domańska, U.; Redhi, G.G.; Marciniak, A. Activity coefficients at infinite dilution measurements for organic solutes and water in the ionic liquid 1-butyl-1-methylpyrrolidinium trifluoromethanesulfonate using GLC. Fluid Phase Equilibria 2009, 278, 97–102. [Google Scholar] [CrossRef]
- Marciniak, A.; Karczemna, E. Influence of cation structure on binary liquid–liquid equilibria for systems containing ionic liquids based on trifluoromethanesulfonate anion with hydrocarbons. J. Phys. Chem. B 2010, 114, 5470–5474. [Google Scholar] [CrossRef] [PubMed]
- Domańska, U.; Królikowski, M.; Ślesińska, K. Phase equilibria study of the binary systems (ionic liquid + thiophene): Desulphurization process. J. Chem. Thermodyn. 2009, 41, 1303–1311. [Google Scholar] [CrossRef]
- Lombardo, M.; Easwar, S.; Pasi, F.; Trombini, C.; Dhavale, D.D. Protonated arginine and lysine as catalysts for the direct asymmetric aldol reaction in ionic liquids. Tetrahedron 2008, 64, 9203–9207. [Google Scholar] [CrossRef]
- Huang, J.-F.; Baker, G.A.; Luo, H.; Hong, K.; Li, Q.F.; Bjerrum, N.J.; Dai, S. Brønsted acidic room temperature ionic liquids derived from N,N-dimethylformamide and similar protophilic amides. Green Chem. 2006, 8, 599–602. [Google Scholar] [CrossRef]
- Dzyuba, S.V.; Kollar, K.D.; Sabnis, S.S. Synthesis of imidazolium room-temperature ionic liquids. Exploring green chemistry and click chemistry paradigms in undergraduate organic chemistry laboratory. J. Chem. Educ. 2009, 86, 856–858. [Google Scholar] [CrossRef]
- Shen, X.-D.; Shi, L.-L.; Long, Z.; Zhou, X.-B.; Liang, D.-Q. Experimental study on the kinetic effect of N-butyl-N-methylpyrrolidinium bromide on CO2 hydrate. J. Mol. Liq. 2016, 223, 672–677. [Google Scholar] [CrossRef]
- Bhatt, A.I.; May, I.; Volkovich, V.A.; Hetherington, M.E.; Lewin, B.; Thied, R.C.; Ertok, N. Group 15 quaternary alkyl bistriflimides: Ionic liquids with potential application in electropositive metal deposition and as supporting electrolytes. J. Chem. Soc. Dalton Trans. 2002, 4532–4534. [Google Scholar] [CrossRef]
- Panozzo, S.; Armand, M.; Stephan, O. Light-emitting electrochemical cells using a molten delocalized salt. Appl. Phys. Lett. 2002, 80, 679–681. [Google Scholar] [CrossRef]
- Wang, P.; Zakeeruddin, S.M.; Exnar, I.; Gratzel, M. High efficiency dye-sensitized nanocrystalline solar cells based on ionic liquid polymer gel electrolyte. Chem. Commun. 2002, 2972–2973. [Google Scholar] [CrossRef]
- Fuller, J.; Breda, A.C.; Carlin, R.T. Ionic liquid-polymer gel electrolytes from hydrophilic and hydrophobic ionic liquids. J. Electroanal. Chem. 1998, 459, 29–34. [Google Scholar] [CrossRef]
- Nakagawa, H.; Izuchi, S.; Kunawa, K.; Nukuda, T.; Aihara, Y. Liquid and polymer gel electrolytes for lithium batteries composed of room-temperature molten salt doped by lithium salt. J. Electrochem. Soc. 2003, 150, A695–A700. [Google Scholar] [CrossRef]
- Noda, A.; Susan, M.A.B.H.; Kudo, K.; Mitsushima, S.; Hayamizu, K.; Watanabe, M. Brønsted acid-base ionic liquids as proton-conducting non aqueous electrolytes. J. Phys. Chem. B 2003, 107, 4024–4033. [Google Scholar] [CrossRef]
- Biso, M.; Mastragostino, M.; Montanino, M.; Passerini, S.; Soavi, F. Electropolymerization of poly(3-methylthiophene) in pyrrolidinium-based ionic liquids for hybrid supercapacitors. Electrochim. Acta 2008, 53, 7967–7971. [Google Scholar] [CrossRef]
- Bielawski, C.W.; Ruoff, R.S.; Agnihotri, D.K.; Dreryer, D.R.; Stoller, M.D.; Zhu, Y. Ionic Liquids for Use in Ultracapacitor and Graphene-Based Ultracapacitor. U.S. Patent, US 2011/0080689 A1, 7 April 2011. [Google Scholar]
- Appetecchi, G.B.; Montanino, M.; Passerini, S. Ionic liquid-based electrolytes for high-energy lithium batteries. In Ionic Liquids Science and Applications; ACS Symposium Series 1117; Visser, A.E., Bridges, N.J., Rogers, R.D., Eds.; Oxford University Press, Inc.: New York, NY, USA; American Chemical Society: Washington, DC, USA, 2013. [Google Scholar]
- Passerini, S.; Montanino, M.; Appetecchi, G.B. Lithium polymer batteries based on ionic liquids. In Polymers for Energy Storage and Conversion; Mittal, V., Ed.; John Wiley: Hoboken, NJ, USA; Scriverner Publishing: Salem, MA, USA, 2013. [Google Scholar]
- Li, L.; Wang, J.; Yang, P.; Guo, S.; Wang, H.; Yang, X.; Ma, X.; Yang, S.; Wu, B. Preparation and characterization of gel polymer electrolytes containing N-butyl-N-methylpyrrolidinium bis(trifluoromethanesulfonyl)imide ionic liquid for lithium ion batteries. Electrochim. Acta 2013, 88, 147–156. [Google Scholar] [CrossRef]
- Scrosati, B.; Garche, J. Lithium batteries: Status, prospects and future. J. Power Sources 2010, 195, 2419–2430. [Google Scholar] [CrossRef]
- Spotnitz, R.; Franklin, J. Abuse behavior of high-power, lithium-ion cells. J. Power Sources 2003, 113, 81–100. [Google Scholar] [CrossRef]
- Yang, H.; Amiruddin, S.; Bang, H.J.; Sun, Y.K.; Prakash, J. A review of li-ion cell chemistries and their potential use as hybrid electric vehicles. J. Ind. Eng. Chem. 2006, 12, 12–38. [Google Scholar]
- Abraham, D.P.; Roth, E.P.; Kostecky, R.; McCarthy, K.; MacLaren, S.; Doughty, D.H. Diagnostic examination of thermally abused high-power lithium-ion cells. J. Power Sources 2006, 161, 648–657. [Google Scholar] [CrossRef]
- Bandhauer, T.M.; Garimella, S.; Fuller, T.F. A critical review of thermal issues in lithium-ion batteries. J. Electrochem. Soc. 2011, 158, R1–R25. [Google Scholar] [CrossRef]
- Appetecchi, G.B.; Scaccia, S.; Tizzani, C.; Alessandrini, F.; Passerini, S. Synthesis of hydrophobic ionic liquids for electrochemical applications. J. Electrochem. Soc. 2006, 153, A1685–A1691. [Google Scholar] [CrossRef]
- Passerini, S.; Appetecchi, G.B. Toward more environmentally friendly routes to high purity ionic liquids. MRS Bull. 2013, 38, 540–547. [Google Scholar] [CrossRef]
- Earle, M.J.; Gordon, C.M.; Plechkova, N.V.; Seddon, K.R.; Welton, W. Decolorization of ionic liquids for Spectroscopy. Anal. Chem. 2007, 79, 758–764. [Google Scholar] [CrossRef] [PubMed]
- Clare, B.R.; Bayley, P.M.; Best, A.S.; Forsyth, M.; MacFarlane, D.R. Purification or contamination? The effect of sorbents on ionic liquids. Chem. Commun. 2008, 2689–2691. [Google Scholar] [CrossRef] [PubMed]
- Smith, N.W.; Gourisankar, S.P.; Montchamp, J.-L.; Dzyuba, S.V. Silver-free synthesis of nitrate-containing room-temperature ionic liquids. New J. Chem. 2011, 35, 909–914. [Google Scholar] [CrossRef]
- Montanino, M.; Alessandrini, F.; Passerini, S.; Appetecchi, G.B. Water-based synthesis of hydrophobic ionic liquids for high-energy electrochemical devices. Electrochim. Acta 2013, 96, 124–133. [Google Scholar] [CrossRef]
- Henderson, W.A.; Passerini, S. Phase Behavior of Ionic Liquid− LiX Mixtures: Pyrrolidinium Cations and TFSI-Anions. Chem. Mater. 2004, 16, 2881–2885. [Google Scholar] [CrossRef]
- Randström, S.; Appetecchi, G.B.; Lagergren, C.; Moreno, A.; Passerini, S. The influence of air and its components on the cathodic stability of N-butyl-N-methylpyrrolidinium bis(trifluoromethansulfonyl) imide. Electrochim. Acta 2007, 53, 1837–1842. [Google Scholar] [CrossRef]
- Appetecchi, G.B.; Montanino, M.; Carewska, M.; Moreno, M.; Alessandrini, F.; Passerini, S. Chemical-physical properties of bis(perfluoroalkylsulfonyl)imide anion-based ionic liquids. Electrochim. Acta 2011, 56, 1300–1307. [Google Scholar] [CrossRef]
Scheme 1.
Chemical structure of the PYR14Br precursor (a) and PYR14TFSI ionic liquid (b).

Figure 1.
(a) Absorbance vs. wavelength dependence referred to (as received) PYR1 and 1-Br-But previously dissolved in ethanol. (b) Magnification of the 0–0.5 absorbance range of panel (a). The solvent baseline is reported for comparison purpose.
Figure 1.
(a) Absorbance vs. wavelength dependence referred to (as received) PYR1 and 1-Br-But previously dissolved in ethanol. (b) Magnification of the 0–0.5 absorbance range of panel (a). The solvent baseline is reported for comparison purpose.

Figure 2.
Absorbance vs. wavelength dependence referred to PYR14Br samples (in ethanol) obtained through purification routes carried out at (a) different processing temperatures and (b) mixing times. The (C + Al2O3): PYR14Br and C: Al2O3 weight ratios are fixed equal to 1.5:1 and 2:3, respectively. The trace referred to pristine PYR14Br and solvent baseline is reported for comparison.

Figure 3.
Absorbance vs. wavelength dependence of PYR14Br samples (in ethanol) obtained through purification routes carried out at different (a) (C + Al2O3): PYR14Br weight ratios and (b) Al2O3 contents. The C: Al2O3 weight ratio is fixed equal to 2:3. The trace referred to pristine PYR14Br and solvent baseline is reported for comparison purposes.

Scheme 2.
Synthesis reaction of the PYR14Br precursor from N-methylpyrrolidine and 1-bromobutane.
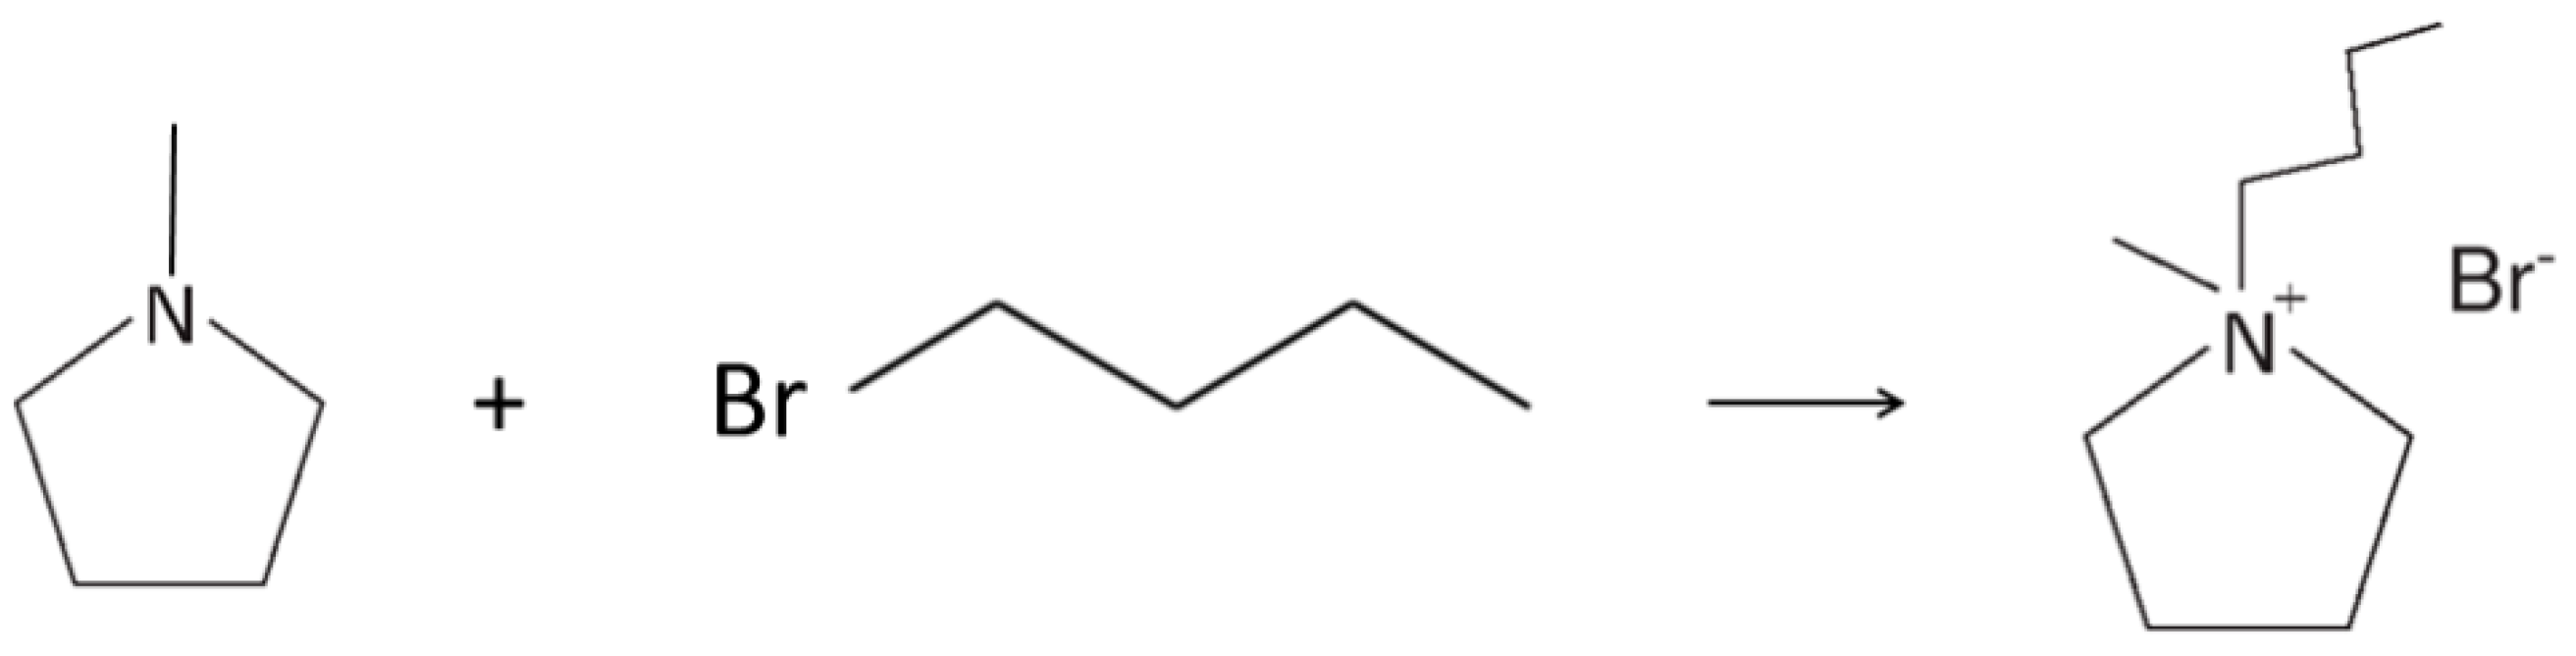
Figure 4.
(a) Absorbance vs. wavelength dependence of the aqueous PYR14Br samples (prepared at different dilution ratios) listed in Table 1. (b) Magnification of the 250–400 nm wavelength range.
Figure 4.
(a) Absorbance vs. wavelength dependence of the aqueous PYR14Br samples (prepared at different dilution ratios) listed in Table 1. (b) Magnification of the 250–400 nm wavelength range.

Figure 5.
Br− concentration vs. count number dependence obtained from KBr solutions by X-ray fluorescence measurements at room temperature. The error bars fall within the data markers.
Figure 5.
Br− concentration vs. count number dependence obtained from KBr solutions by X-ray fluorescence measurements at room temperature. The error bars fall within the data markers.
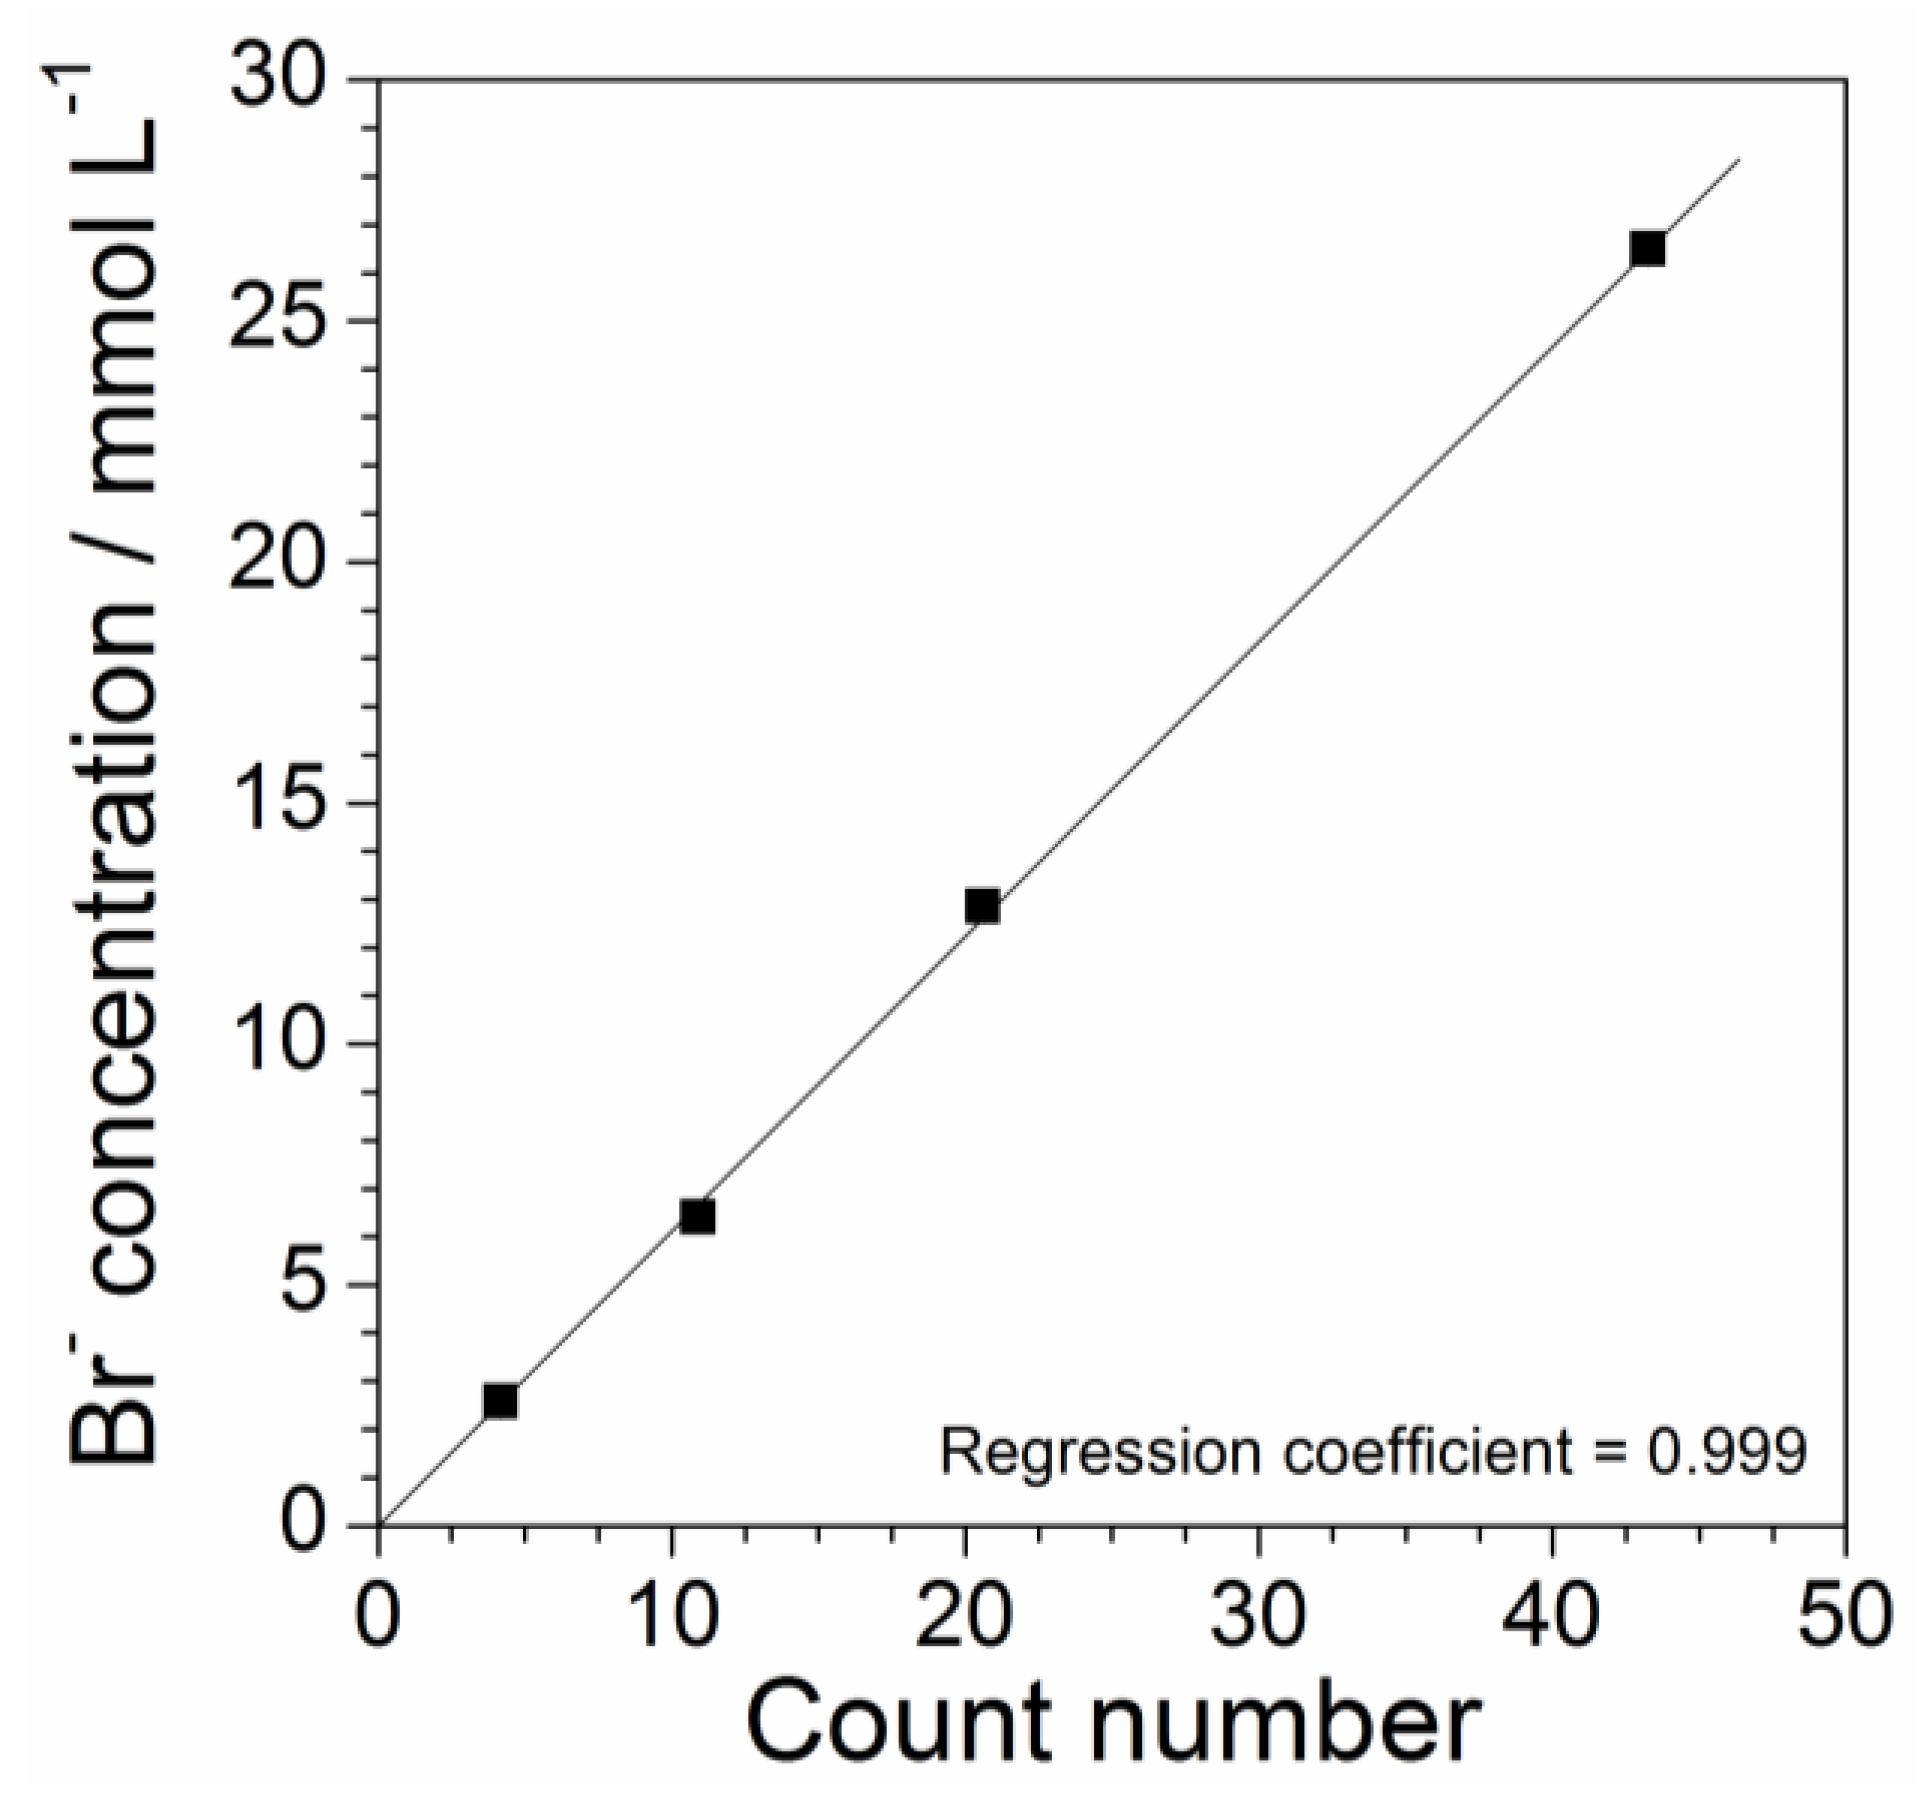
Figure 6.
Absorbance vs. wavelength dependence for the aqueous PYR14Br phase collected, respectively, after vacuum filtration and rinsing step of sorbents (C: Al2O3 weight ratio = 2:3; (C + Al2O3): PYR14Br weight ratio = 1.5:1).
Figure 6.
Absorbance vs. wavelength dependence for the aqueous PYR14Br phase collected, respectively, after vacuum filtration and rinsing step of sorbents (C: Al2O3 weight ratio = 2:3; (C + Al2O3): PYR14Br weight ratio = 1.5:1).

Figure 7.
Impurity concentration vs. area value, comprised between the UV-VIS absorbance profiles of Figure 4 and the X axis in the 260–600 nm range, dependence for the aqueous PYR14Br solutions listed in Table 1. The error bars, when not reported, fall within the data markers.
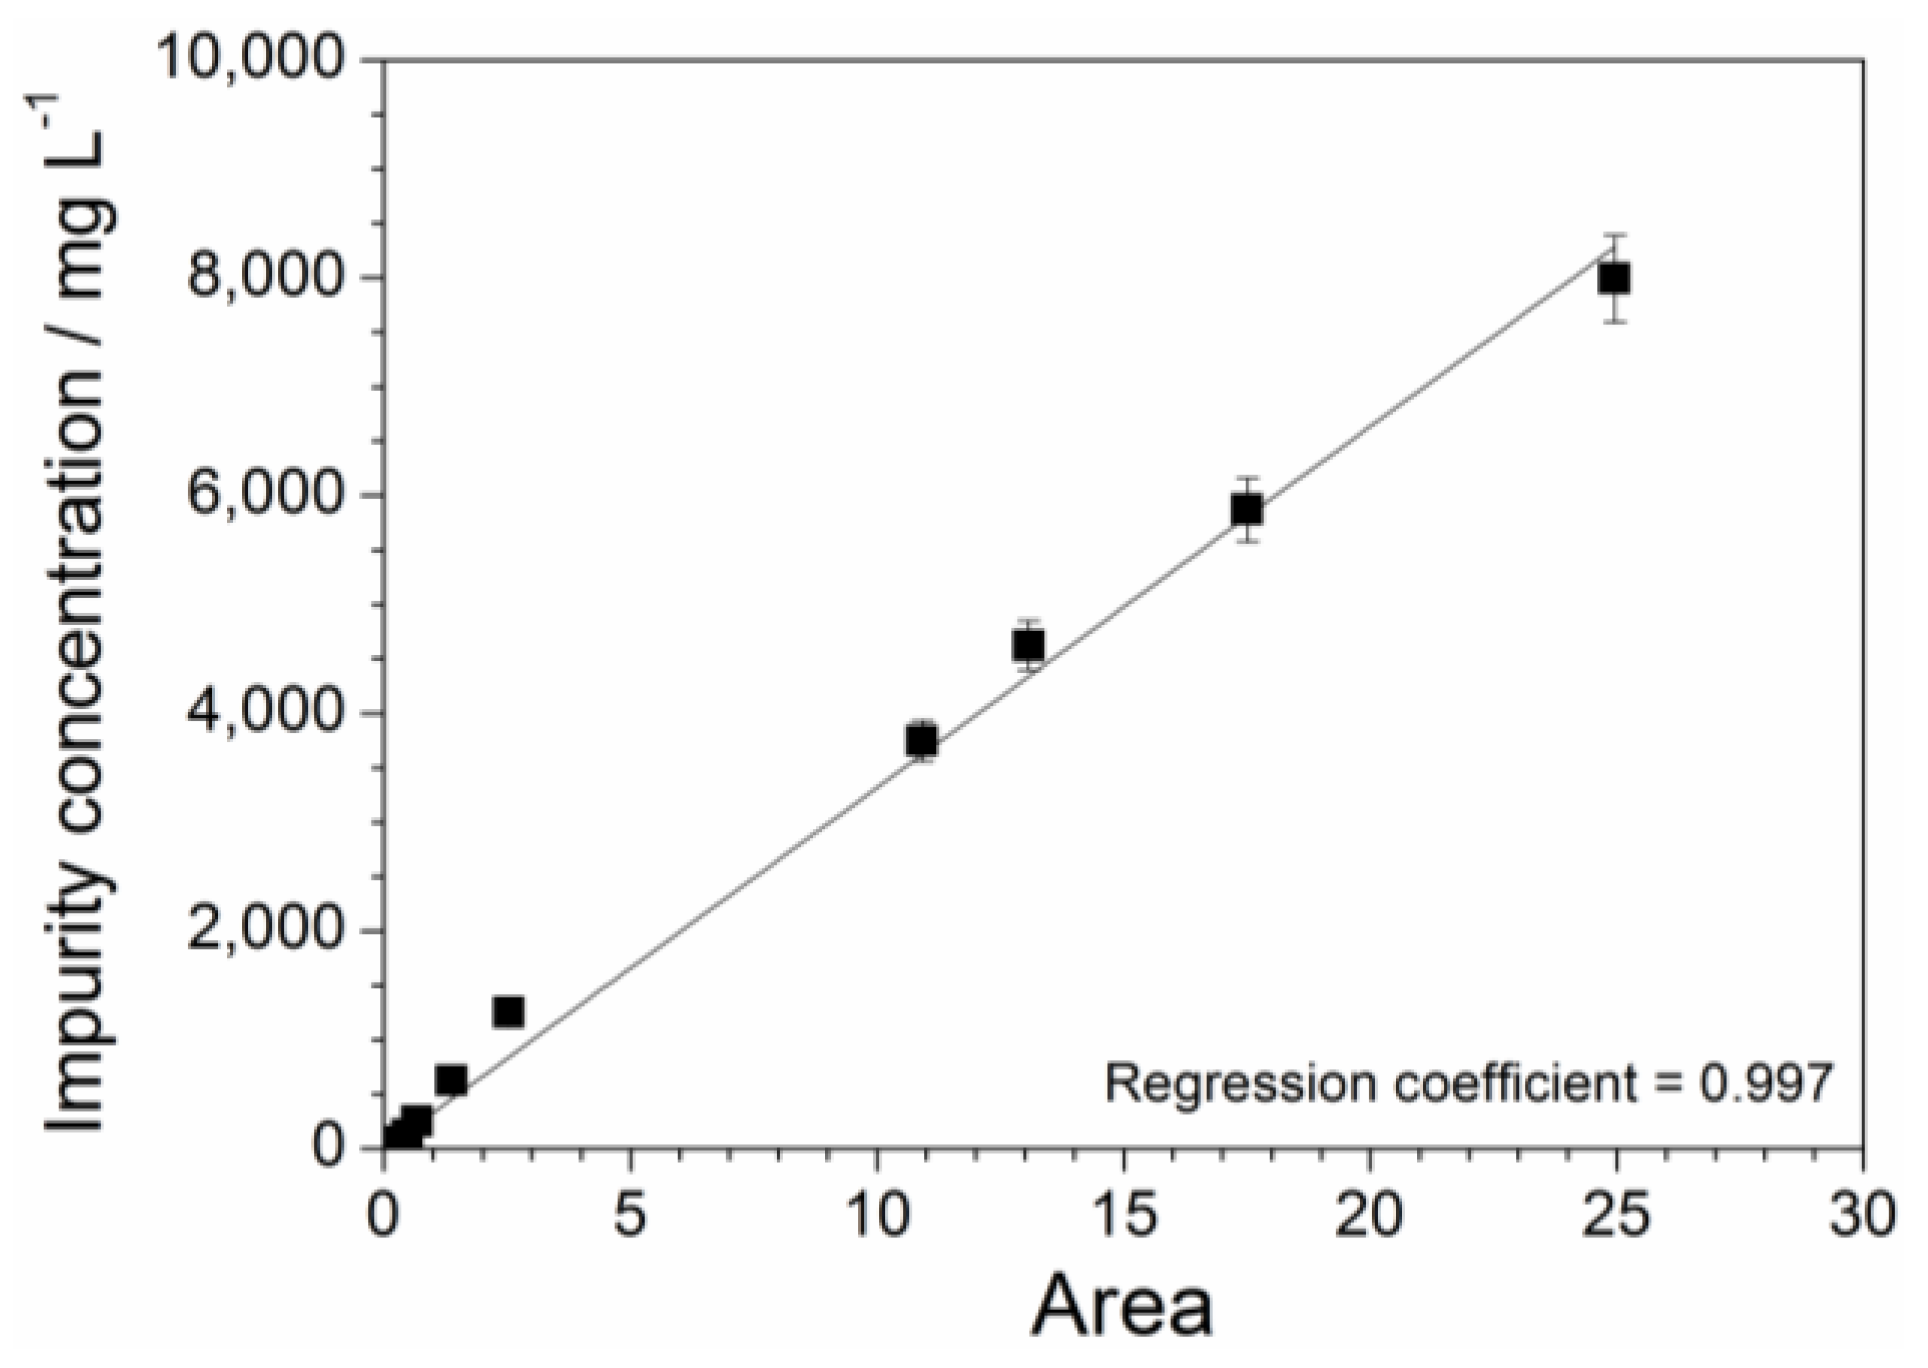
Figure 8.
Absorbance vs. wavelength dependence of the aqueous PYR14Br solutions obtained from batches I (a) and IV (b). The absorbance values were normalized with respect to the dilution volume ratio used for the pristine samples.
Figure 8.
Absorbance vs. wavelength dependence of the aqueous PYR14Br solutions obtained from batches I (a) and IV (b). The absorbance values were normalized with respect to the dilution volume ratio used for the pristine samples.

Figure 9.
Residual fraction of impurities, within the PYR14Br precursor, after purification route carried out at different (C + Al2O3): precursor weight ratios.
Figure 9.
Residual fraction of impurities, within the PYR14Br precursor, after purification route carried out at different (C + Al2O3): precursor weight ratios.
Scheme 3.
Synthesis reaction (metathesis) of the PYR14TFSI ionic liquid from the PYR14Br precursor and the LiTFSI lithium salt.
Scheme 3.
Synthesis reaction (metathesis) of the PYR14TFSI ionic liquid from the PYR14Br precursor and the LiTFSI lithium salt.

Table 1.
Overall impurity content of the aqueous PYR14Br samples obtained from the mother solution at different dilution ratios.
Table 1.
Overall impurity content of the aqueous PYR14Br samples obtained from the mother solution at different dilution ratios.
| Dilution Ratio of the Aqueous Phase | Impurity Concentration of the Aqueous Phase (mg L−1) | Impurity Content with Respect to the Precursor Mass (ppm) |
|---|---|---|
| 0:1 * | 12,490 ± 70 | 16,020 ± 80 |
| 5:1 | 2500 ± 20 | 3200 ± 20 |
| 10:1 | 1249 ± 6 | 1602 ± 8 |
| 20:1 | 625 ± 3 | 801 ± 4 |
| 50:1 | 250 ± 2 | 320 ± 2 |
| 100:1 | 125 ± 1 | 160 ± 1 |
| 200:1 | 63 ± 1 | 80 ± 1 |
| 500:1 | 25 ± 1 | 32 ± 1 |
| 1000:1 | 13 ± 1 | 16 ± 1 |
| 5000:1 | 3 ± 1 | 3 ± 1 |
* mother solution.
Table 2.
Fraction of PYR14Br recovered during the purification step at different PYR14Br:C:Al2O3 weight ratio.
Table 2.
Fraction of PYR14Br recovered during the purification step at different PYR14Br:C:Al2O3 weight ratio.
| PYR14Br:C:Al2O3 Weight Ratio | Recovered Fraction of PYR14Br (wt%) | |
|---|---|---|
| From Vacuum Filtration | From Sorbent Rinsing | |
| 1:0.30:0.45 | 91 ± 2 | 9 ± 2 |
| 1:0.60:0.90 | 83 ± 2 | 17 ± 2 |
| 1:0.90:1.35 | 77 ± 2 | 23 ± 2 |
| 1:1.20:1.80 | 69 ± 2 | 31 ± 2 |
Table 3.
Precursor:C:Al2O3 weight ratio used in the purification route of different PYR14Br batches.
Table 3.
Precursor:C:Al2O3 weight ratio used in the purification route of different PYR14Br batches.
| Batch | PYR14Br | C | Al2O3 |
|---|---|---|---|
| I | 1 | 0.30 | 0.45 |
| II | 1 | 0.60 | 0.90 |
| III | 1 | 0.90 | 1.35 |
| IV | 1 | 1.20 | 1.80 |
© 2017 by the authors. Licensee MDPI, Basel, Switzerland. This article is an open access article distributed under the terms and conditions of the Creative Commons Attribution (CC BY) license (http://creativecommons.org/licenses/by/4.0/).
Share and Cite
MDPI and ACS Style
De Francesco, M.; Simonetti, E.; Gorgi, G.; Appetecchi, G.B. About the Purification Route of Ionic Liquid Precursors. Challenges 2017, 8, 11. https://doi.org/10.3390/challe8010011
AMA Style
De Francesco M, Simonetti E, Gorgi G, Appetecchi GB. About the Purification Route of Ionic Liquid Precursors. Challenges. 2017; 8(1):11. https://doi.org/10.3390/challe8010011
Chicago/Turabian StyleDe Francesco, Massimo, Elisabetta Simonetti, Gianremo Gorgi, and Giovanni Battista Appetecchi. 2017. "About the Purification Route of Ionic Liquid Precursors" Challenges 8, no. 1: 11. https://doi.org/10.3390/challe8010011
Note that from the first issue of 2016, this journal uses article numbers instead of page numbers. See further details here.