1. Introduction
Perovskite oxides find applications or are studied in many fields related to energy production, accumulation and saving. Examples are the oxygen and proton conductors as solid electrolytes for fuel cells (SOFCs) [
1], and the ferroelectric (FE) and antiferroelectric (AFE) compositions, which may find application in high energy capacitors for energy storage [
2,
3], efficient electrocaloric cooling [
4], and electromechanical energy harvesting [
5].
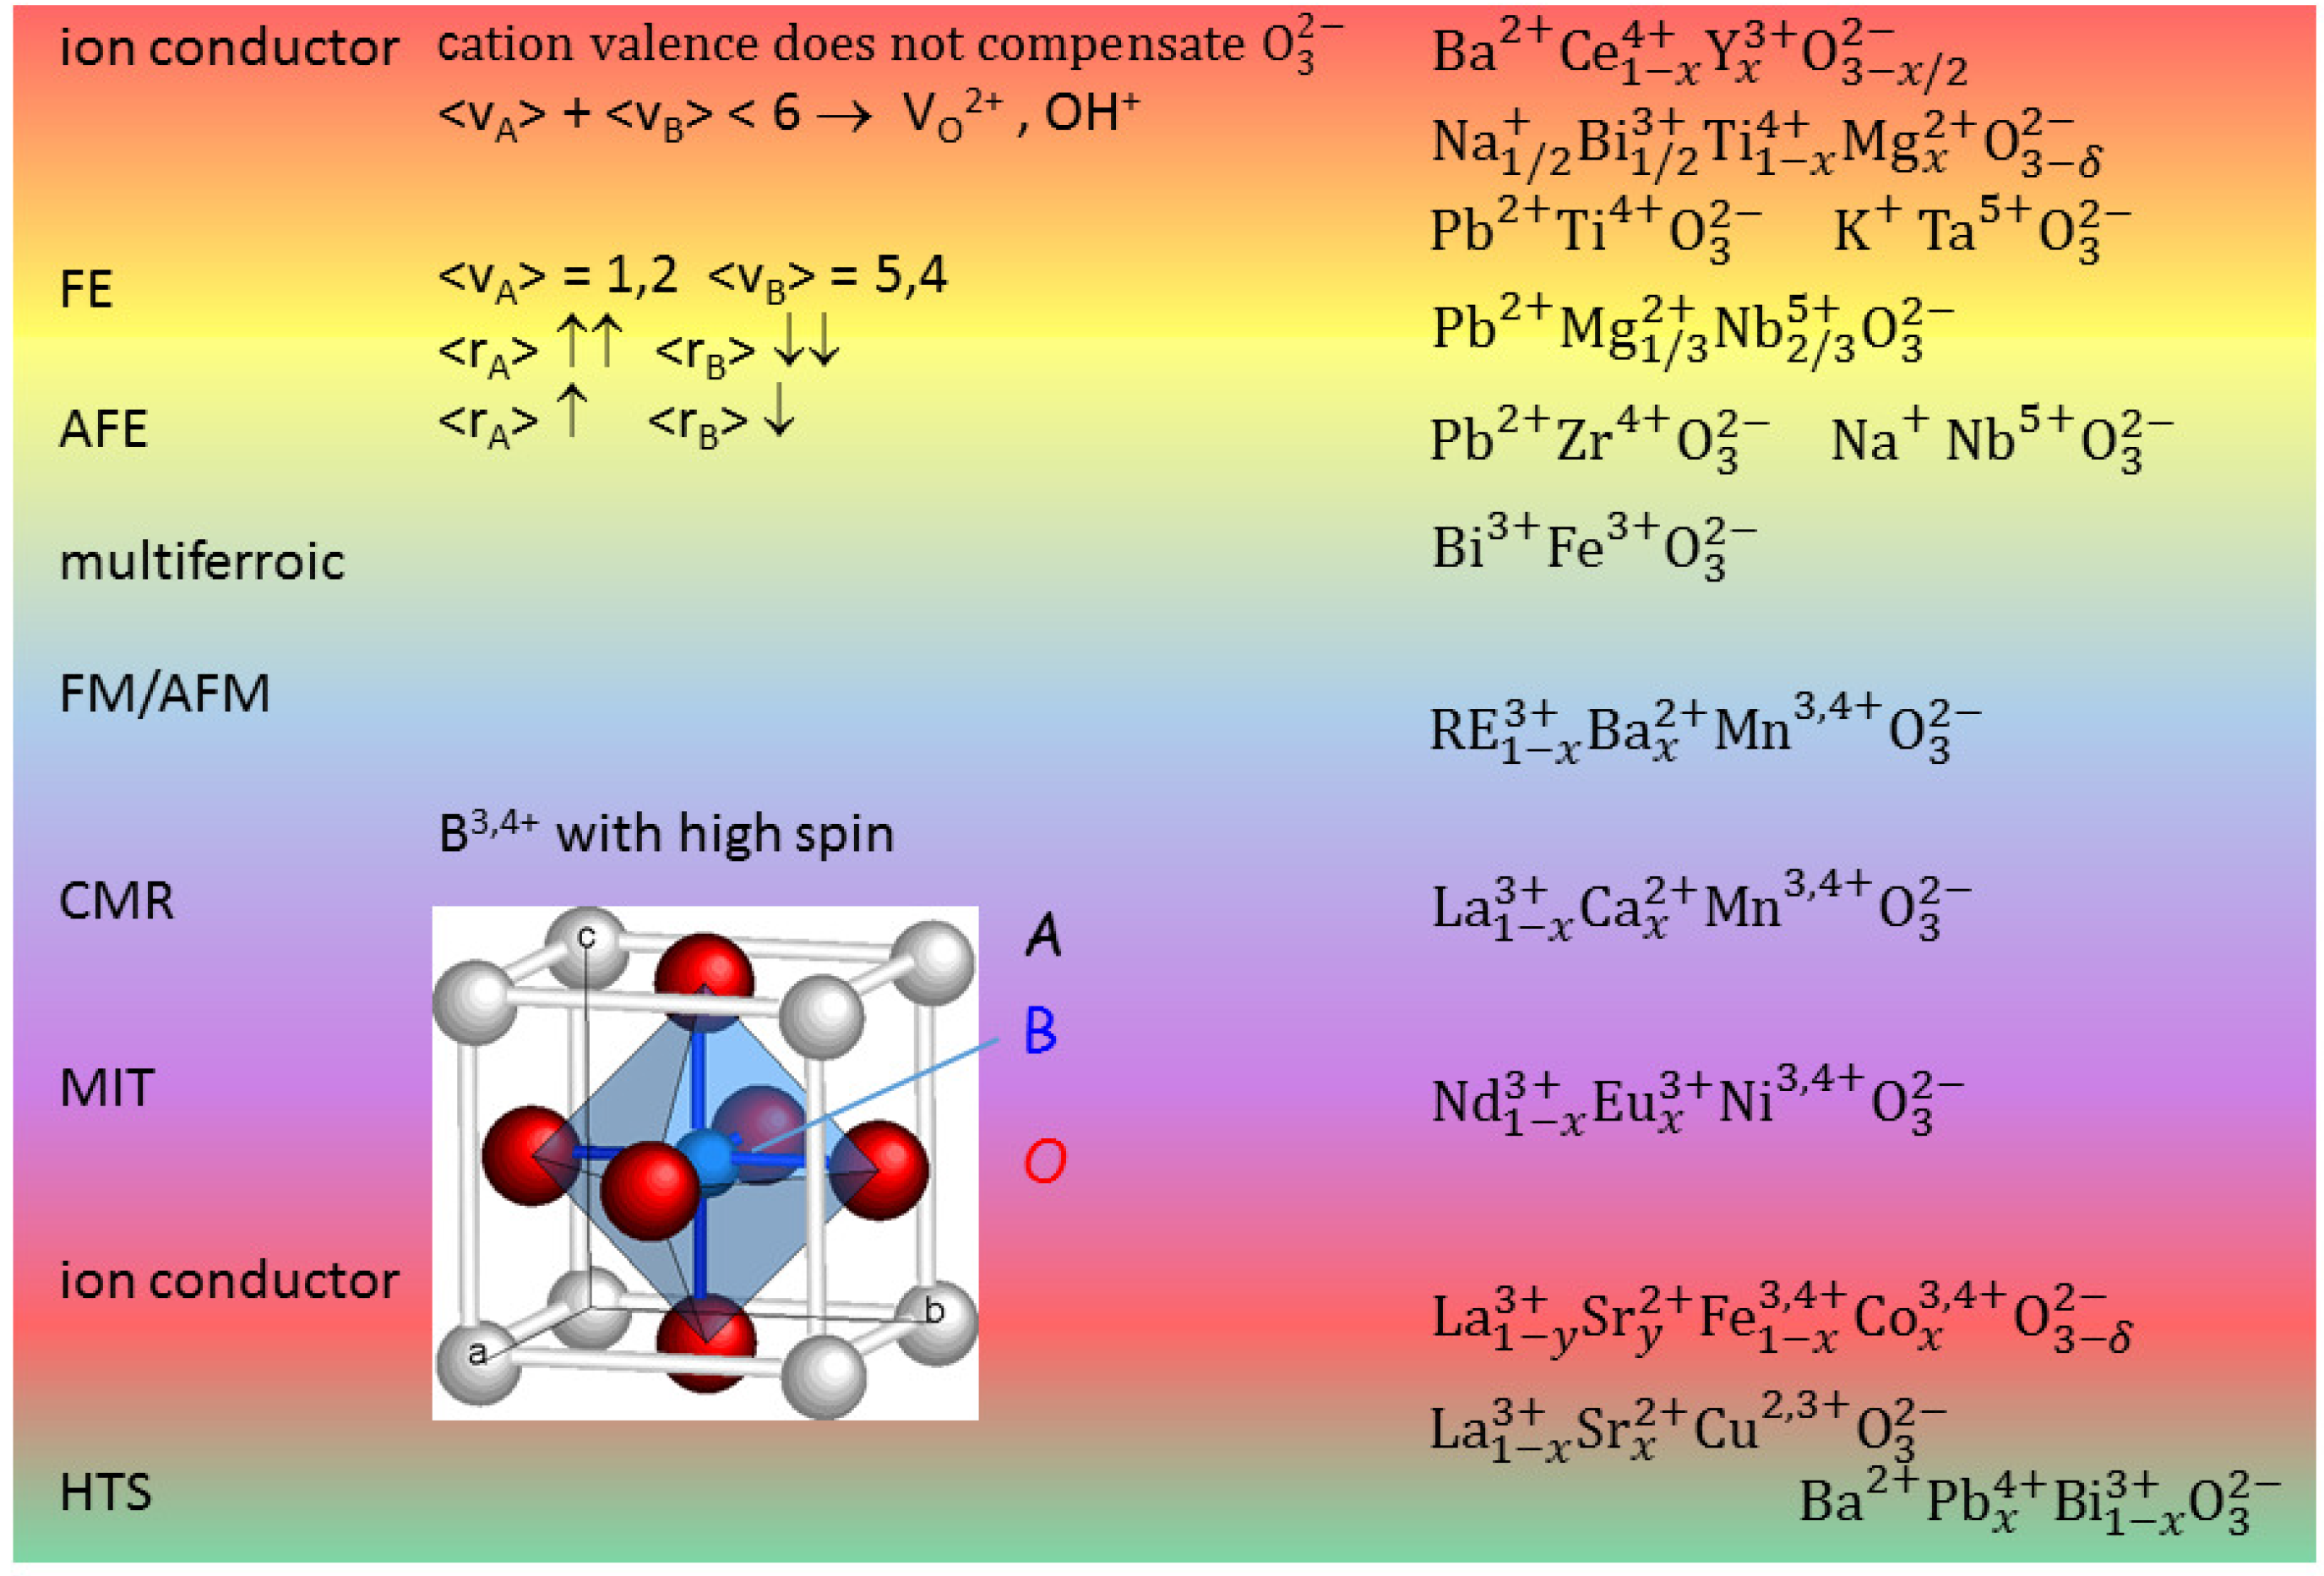
Figure 1 presents the cell of a cubic perovskite ABO
and ranges of different properties depending on the choice of the A and B cations. When the
charge of the ideally three O
atoms per unit cell is not fully compensated by the cation valence
+
, then V
are created and this can be exploited for creating a fast ion conductor. In fact O is the most mobile atomic species in a perovskite, but cannot occupy interstitial positions, due to the compactness of the perovskite structure; in addition, by exposure to humid atmosphere at moderately high temperature it is possible to fill a V
with an
hydroxide ion obtaining a proton conductor. A typical superionic conductor is BaCe
Y
O
, but recently it has been found that also FE perovskites like Na
Bi
TiO
(NBT) can be made superionic conductors by doping, for example, with Mg [
6].
Figure 1 shows that FE phases can be obtained when the A cations have large size and low valence and B small size and large valence. A simple explanation for this fact is that the small B ion may go off-centre in the large O
octahedron and produce an electric dipole with its large positive charge, though additional mechanisms are also important [
7,
8]. By decreasing the size mismatch between A and B, it is possible to stabilize also AFE phases, as in Zr-rich PZT. It has been discussed how the main source of magnetism, namely partially filled
d or
f orbitals, is in contrast with the common source of FE, a small B cation with empty
d and
f shells [
9]; nonetheless, there are various mechanisms leading to FE, and hence various types of perovskites exhibiting both FE and magnetism, the so-called multiferroics [
9]. Perovskites with B = Mn, Ni, which cause Jahn-Teller distortions of the BO
octahedra, exhibit other phenomena like charge and orbital ordering, metal/insulator transitions and colossal magnetoresistance [
7], and turning back the focus on the materials for energy applications, good ionic conductors are found with B = Fe, Co [
10].
In SOFCs, the fast diffusion of O vacancies (V), protons and other mobile ionic species are exploited in order to produce an electronic current in the external circuit at the expense of the chemical energy in the fuel, while the structural phase transitions should be avoided or tuned in such a manner to minimize their negative effects on the ionic mobilities and as sources of mechanical failure. On the other hand, in the applications based on the FE/AFE states, the FE properties and the FE/AFE transitions have to be optimized and tuned in order to maximize the stored electric energy, and electrocaloric and piezoelectric coefficients, while the V and other mobile ionic species constitute unwanted defects that reduce the performance and life-time of the device.
It is therefore clear that in all these cases it is important, though for different reasons, to understand and control the phase transformations and ions mobilities, ordering or clustering. All these phenomena can be studied by anelastic (or mechanical) spectroscopy, the measurement of the complex compliance as a function of temperature and frequency. It is the mechanical analogue of the dielectric susceptibility, and probes the elastic response and dipoles instead of the dielectric response and electric dipoles. The two techniques are complementary, and can provide a comprehensive picture of the materials properties. Examples are shown of the study the mobility and clustering of V in SrTiO, a model perovskite with a simple cubic structure, then of structural transitions and hopping and tunneling of V and H in the ion conductor BaCeYO, and finally of the aging and fatigue effects found in PbZrTiO (PZT) at compositions where the FE and AFE states coexist.
2. Materials and Methods
The ceramic SrTiO
samples were prepared by solid state reaction for 6 h at 1100
C, followed by sintering in air at 1450
C, as described in Ref. [
11]. The ingots had a relative density of 97% and were cut as thin bars
mm
for the anelastic experiments. The SrTiO
single crystal was cut from a wafer from M.T.I. Corporation as a bar of
mm
, with the edges parallel to the
directions. The reduction and reoxygenation treatments were made either in static H
or O
atmosphere in a quartz tube connected to a UHV system and heated by a tubolar furnace to 1000–1150
C, or in a flux of 0.1CO + 0.9Ar or O
gas within a quartz tube with water cooled jacket and heated by induction by an external coil. In the latter case, the sample was contained in a Pt enclosure that could be heated by induction. The amount of O absorbed or lost was checked by the mass change before and after the treatment.
The electrolytes for fuel cells were BaCe
Y
O
with
0.15 prepared from powders obtained by auto-combustion synthesis, crystallized in air at 1000
C for 5 as described in Ref. [
12]. No impurity phases were detected by X-ray diffraction (XRD). The powders were uniaxially pressed at 50 MPa and then isostatically pressed at 200 MPa into
mm
ingots, which were sintered at 1500
C for 10 h and cut as thin bars about 1 mm thick and ∼40 mm long, optimal for the anelastic experiments. In order to hydrate the samples, they were kept for 1–2 h at 793 K in a static atmosphere of 50–100 mbar H
O or D
O, while outgassing was obtained in a vacuum of <
mbar up to 730
C or during the anelastic experiments. The resulting variations of the gaseous contents were monitored from the change of weight.
The PZT samples were prepared by solid state reaction with calcination at 700
C for 4 h, pressing into bars, sintering at 1250
C for 2 h together with PbZrO
+ 5 wt % excess ZrO
powder to prevent PbO loss to obtain ingots with 95% of the theoretical density and large grains, 5–20
m, as described in Ref. [
13].
In all cases it was checked by XRD that no impurity phases were present after calcination and sintering. All the samples were finally cut as thin (0.5–1 mm) bars with lengths between 25 and 45 mm for the anelastic experiments. When also dielectric measurements were done, to both major faces were applied electrodes with Ag paint, otherwise only to one face or its center and edge, in order to assist the electrostatic excitation and for shorting the thermocouple wires.
The elastic compliance
, the reciprocal of Young’s modulus
E, was measured by electrostatically exciting the flexural modes of the bars suspended in vacuum on thin thermocouple wires in correspondence with the nodal lines; technique and apparatus are described in Ref. [
14], and for a general treatment of anelasticity see Ref. [
15]. In these conditions, during the same run it is possible to measure the 1st, 3rd and 5th modes, whose frequencies are in the ratios 1:5.4:13.3, and the fundamental frequencies are in the range
1–5 kHz, depending on the sample shape and state. The data are presented as real part
of the elastic compliance
, referred to its extrapolation
to 0 K or in the paraelectric phase, and elastic energy loss
. The first is proportional to the square of the sample resonance frequency,
, and presents peaks or steps at the structural phase transformations; the latter is measured from the decay of the free oscillations or from the width of the resonance peak, and presents peaks due to the relaxational motion of point and extended defects [
15], as described by Equation (
2) later on.
The dielectric permittivity
of small discs with 11 mm of diameter and ∼1 mm thick was measured with a HP 4284A impedance bridge with a four wire probe between 100 Hz and 100 kHz in a modified Linkam HFS600E-PB4 stage. For the dielectric measurements down to liquid He temperatures the same samples and cryostat for the anelastic measurements were used. After depositing the Ag electrodes, an intense dielectric relaxation process, identified with the motion of charge carriers within a Schottky barrier at the electrode interface, completely masked the true bulk relaxation. The effect was suppressed by applying 40 V up to ∼500 K, switching the direction of the dc current in order to avoid electromigration of O vacancies or protons [
12].
3. Oxygen Vacancy and Proton Mobilities and Aggregations in Ionic Conductors
The ionic transport in solids is often characterized in terms of an overall diffusion coefficient, for example, by means of chemical or tracer diffusion experiments, useful for example in the choice of a solid electrolyte for fuel cells. Yet, such a description is far from complete when the diffusion process is composed of several steps with very different characteristic times. For example, the fastest ion present in any oxide is O, which in perovskites cannot find space in interstitial position, and therefore diffuses via an O vacancy (V
). Oxygen vacancies may be trapped by acceptor defects or can form stable pairs or larger complexes; therefore, the long range migration consists of a sequence of dissociation of the V
from a defect complex, fast diffusion and retrapping at another defect complex. The individual steps of the ionic migration are experimentally accessible through the dielectric, anelastic and NMR spectroscopies, since they produce peaks at their distinct characteristic frequencies in the respective susceptibilities [
16]. Therefore, a particular hopping, reorientation or association/dissociation process occurring with characteristic time
τ between two states with relative populations
and
will produce a Debye peak in the imaginary part of the dielectric susceptibility
elastic compliance
or Nuclear Quadrupolar Relaxation (NQR) rate
where
ω is the measuring angular frequency,
c the molar concentration of defects,
the molecular volume,
and
denote the changes in electric and elastic dipoles during the elementary process. Since the hopping/reorientation time
τ usually follows the Arrhenius law
where
E is the potential barrier or activation energy, the imaginary susceptibilities versus
T exhibit maxima at the temperatures
where the condition
are verified for a particular elementary process. The above formulas are valid for noninteracting point defects and, depending whether they possess an elastic and/or dielectric dipole that can reorient or change or a nuclear quadrupolar moment that feels a varying crystalline field, one can observe one or more of the above relaxations. The relaxation times
τ of the three types of relaxations may differ of factors of order 2, due to the different numbers of non equivalent elastic/dielectric dipole configurations (see e.g., [
15] p. 306). At high concentrations, the point defects interact with each other, causing important deviations from the above picture, which can be taken into account in various manners: for example, introducing various types of distributions of relaxation times [
15], by introducing interactions of local type in the partition function of the defects [
17], in the mean field approximation deriving divergences of the relaxation time and strength of the Curie-Weiss type [
18] or in the Bragg-Williams scheme [
19,
20].
The NQR experiments require rather substantial an equipment and analysis and are seldom used for similar purposes [
16,
21], while anelastic relaxation experiments are more usual and dielectric susceptibility or impedance spectroscopy are commonly used. A combination of the latter is very useful, since the dielectric susceptibility probes the reorientation of electric dipoles and long range charge diffusion, including the charge carriers, while the elastic compliance only probes ionic and polaronic motions producing changes in strain; therefore is insensitive to the motion of free carriers and gives a clean picture of the ionic motions, also in the presence of electronic conductivity.
3.1. Mobility and Clustering of V in the Simplest Case: Cubic SrTiO
An ideal starting point for the study of V
in perovskites is SrTiO
, which has been continuously studied in the O deficient state since the 1960’s in various contexts, from superconductivity to ion conduction, and is one of the few perovskites that remains cubic down to low temperature. The commonplace has been for a long time that in SrTiO
, and hence in perovskite titanates, the V
are uniformly distributed up to concentrations of several molar percent and diffuse with an activation energy whose value varies much among different studies [
22], but the consensus was for a barrier of 1–1.2 eV (see e.g., [
23,
24]). When faster diffusion was estimated, it was attributed to the presence of dislocations acting as channels for easy diffusion [
23]. An NMR experiment convincingly showing that the barrier for V
hopping is
eV in Fe-doped SrTiO
[
21] passed unobserved, but recently attention started to be paid to V
clustering, especially in the near surface regions [
25].
The bias for 1 eV as the typical barrier for O diffusion in perovskite titanates induced also us to initially wrongly interpret the anelastic spectrum of reduced SrTiO
[
11].
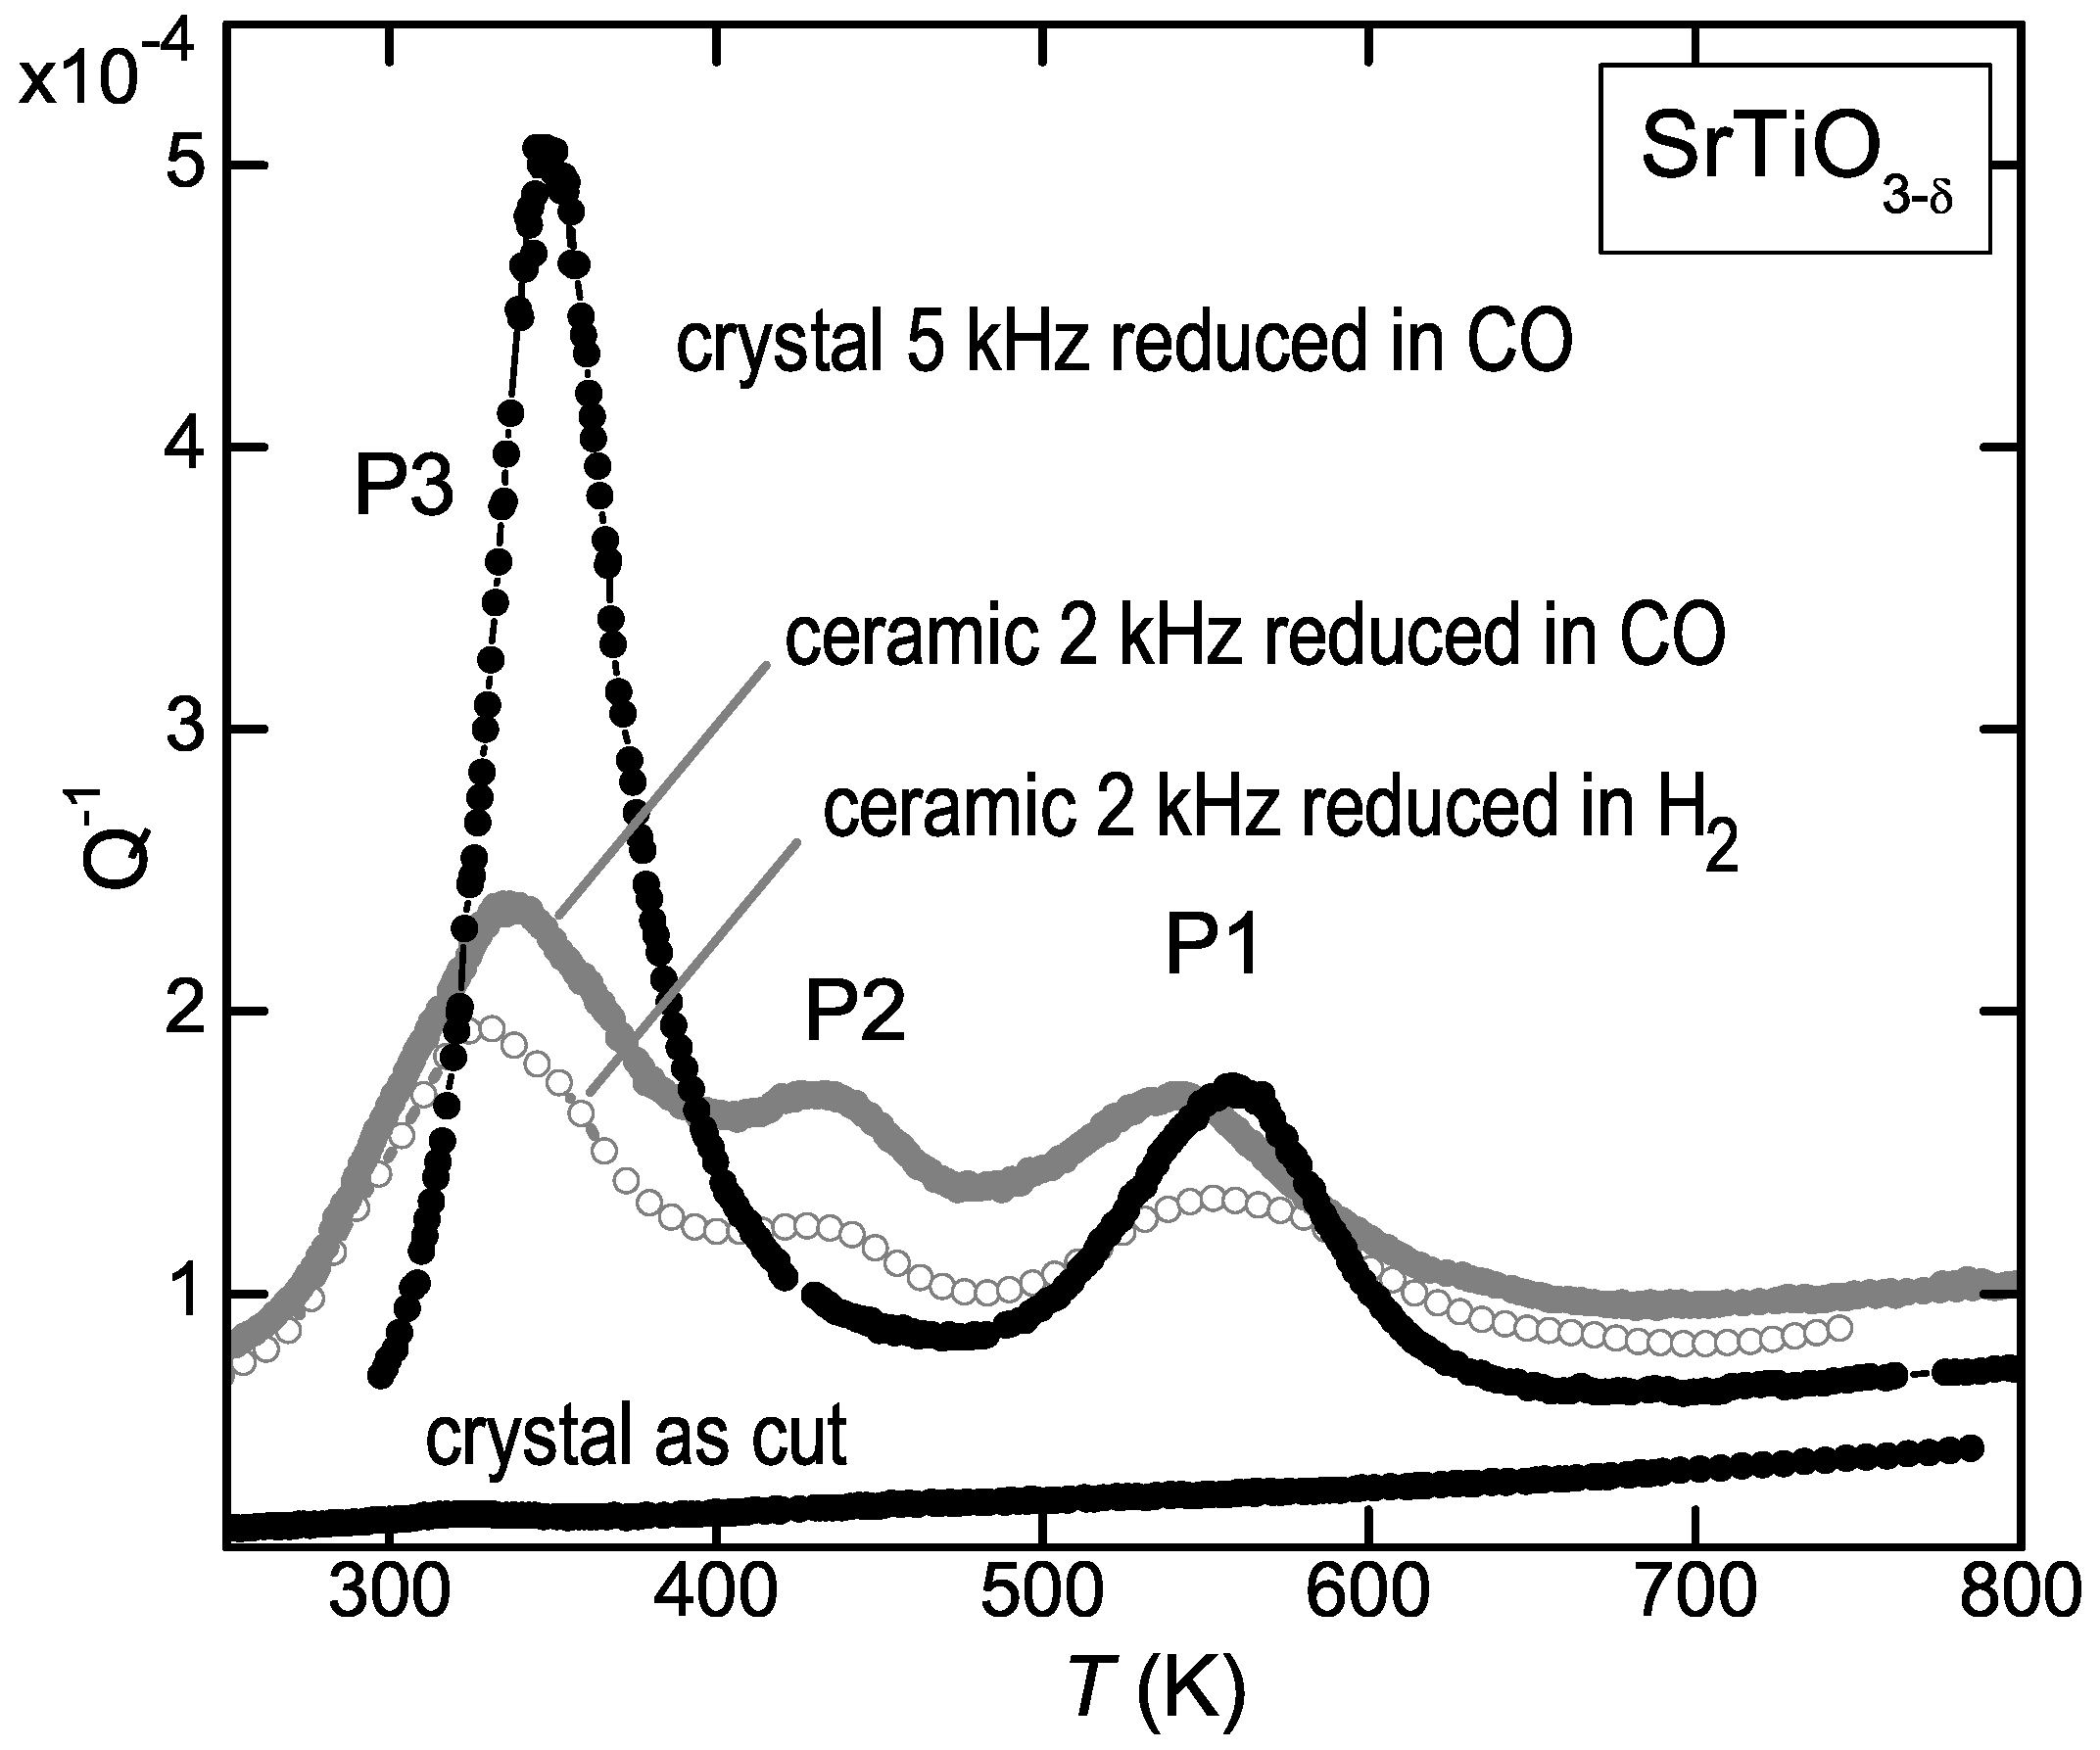
Figure 2 shows that the elastic energy loss measured at kHz on ceramic SrTiO
reduced at 1100
C in H
atmosphere presents three peaks above room temperature, labelled P1 to P3 starting from high temperature. From the temperature shifts observed during the same run at higher frequency, it was deduced that the activation energies are 1 eV for P1 and 0.6 eV for P3 (see Equations (
4) and (
5)); therefore P1 was assigned to the jumps of the V
, in accordance with the prevalent opinion, and P3 to H introduced during the treatment in H
atmosphere [
11]. We then repeated the experiments using CO as reducing agent, in order to avoid the possible introduction of unwanted H, and the surprising result was that the anelastic spectrum was identical. This is shown in
Figure 2 for a similar ceramic sample reduced for 3 h at 1100
C in a flux of 0.9Ar + 0.1CO (empty symbols). The same figure shows also the anelastic spectra of a single crystal in the virgin state and after reduction in CO flux, with
, as deduced from the mass variation after reduction and subsequent reoxygenation and from the shift of the temperature of the structural transition at 105 K [
26]. The shift to higher temperature of the peaks in the crystal is due to the higher frequency of measurement (5 kHz, see the condition (
5) for the peak maxima), while the difference in their relative intensities, especially the reduction of P2, is due to the fact that in the ceramic samples all the components of the elastic compliance are probed, while in the crystal only
was probed.
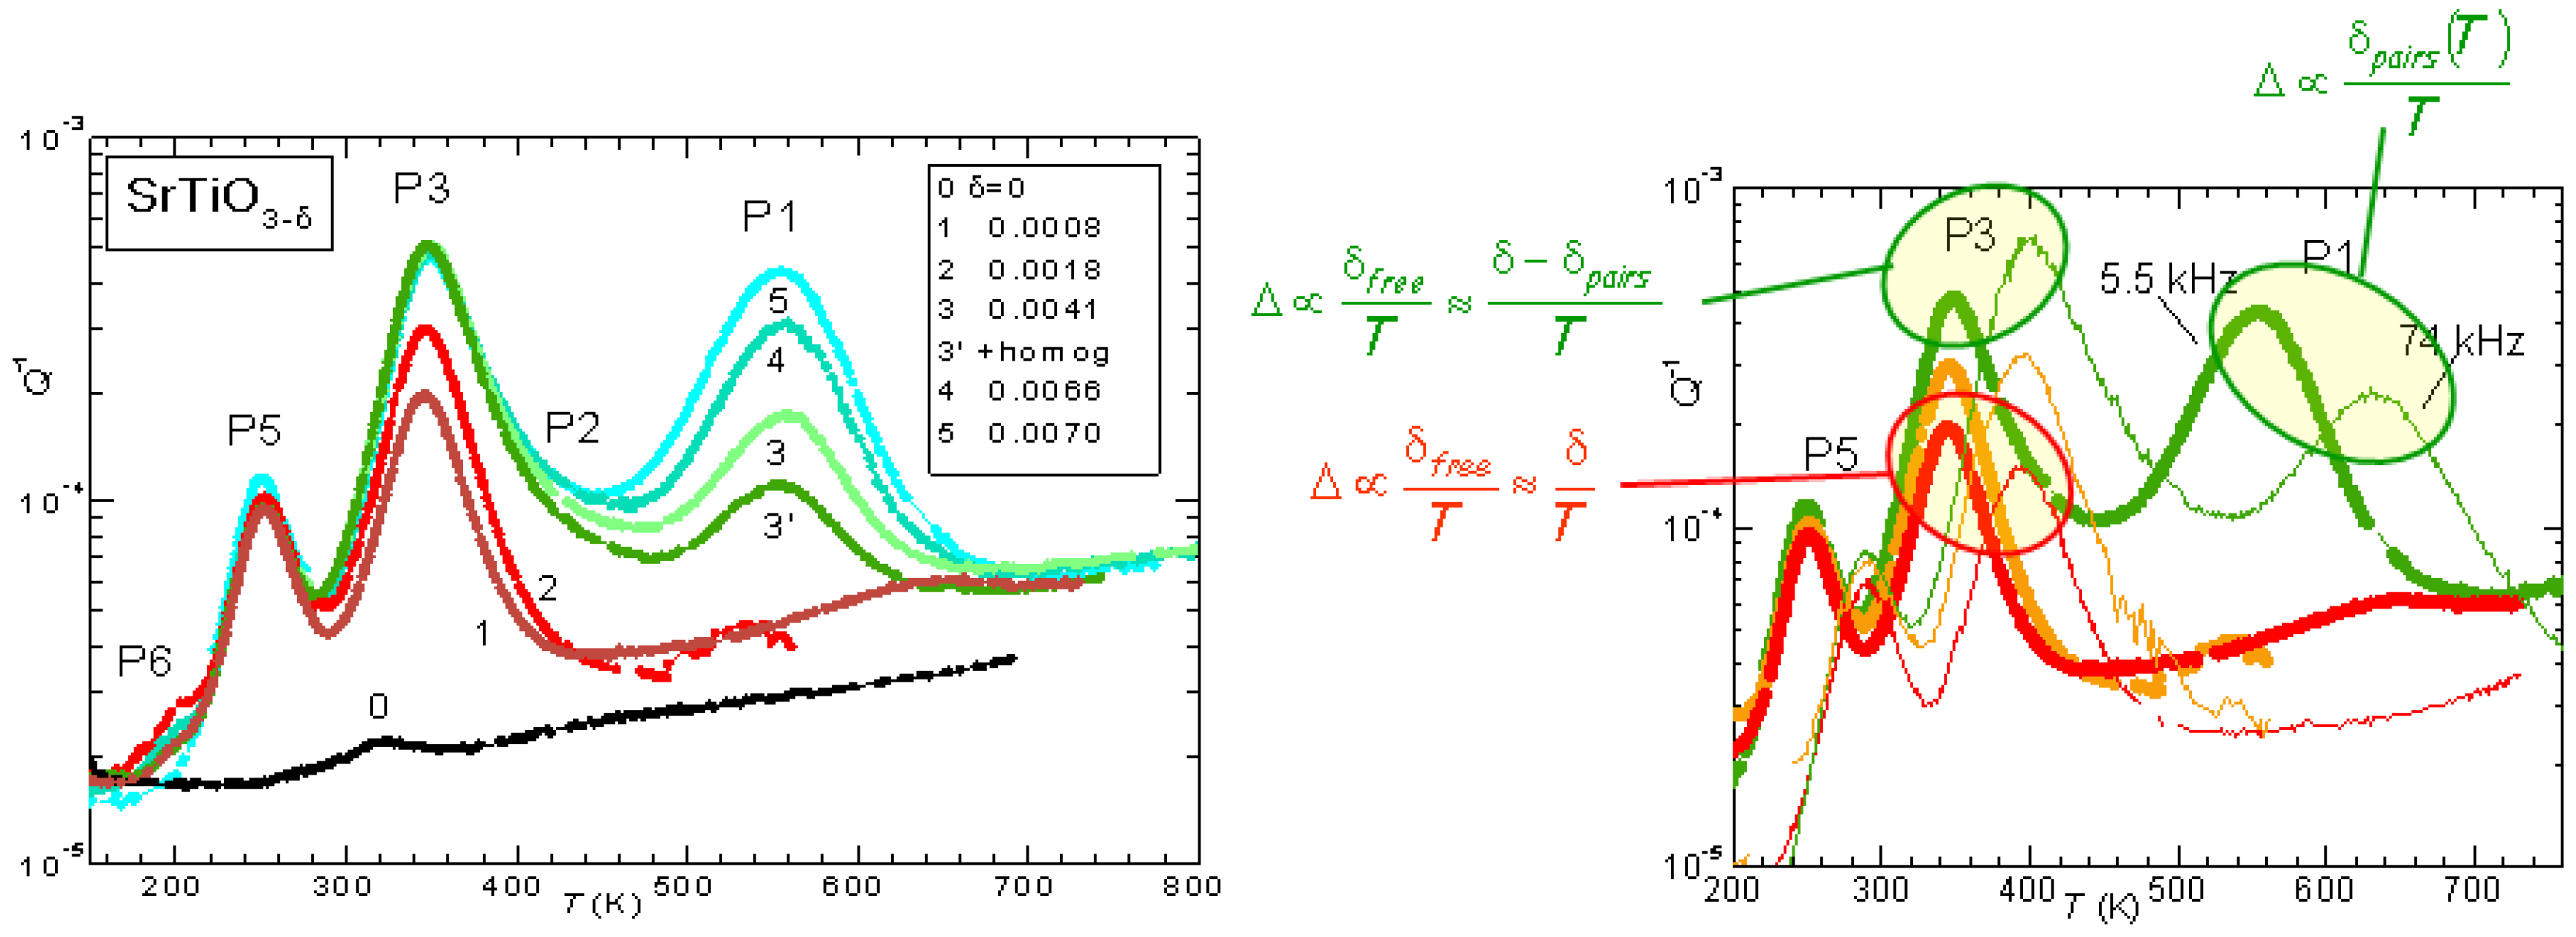
The evolution of the anelastic spectrum with increasing
is shown in
Figure 3: initially only P3 is observed, but its height saturates soon after the appearance of P1, which then becomes dominant. Also the additional peaks P5 and P6 appear at lower temperatures, and are probably due to hopping of polarons. Instead, the set of P1, P2 and P3 peaks can be perfectly fitted assuming that P3 is due to isolated V
, while P1 is due to the full process of reorientation of V
pairs, and P2 is due to the intermediate dissociation step necessary for the pair reorientation [
26]. The right hand side of
Figure 3 also shows the dependence on temperature of the peak intensities, deduced from the spectrum shifted at higher temperature when measured at higher frequency. The intensity of P3 is
at low
, as expected from all V
being isolated and hopping between equivalent states (Equation (
2) with
const and
), but increases with
T at higher
, consistent with the fact that at higher
there is a fraction of V
that are paired or aggregated and become isolated with increasing
T. Accordingly, the intensity of P1 decreases faster than
.
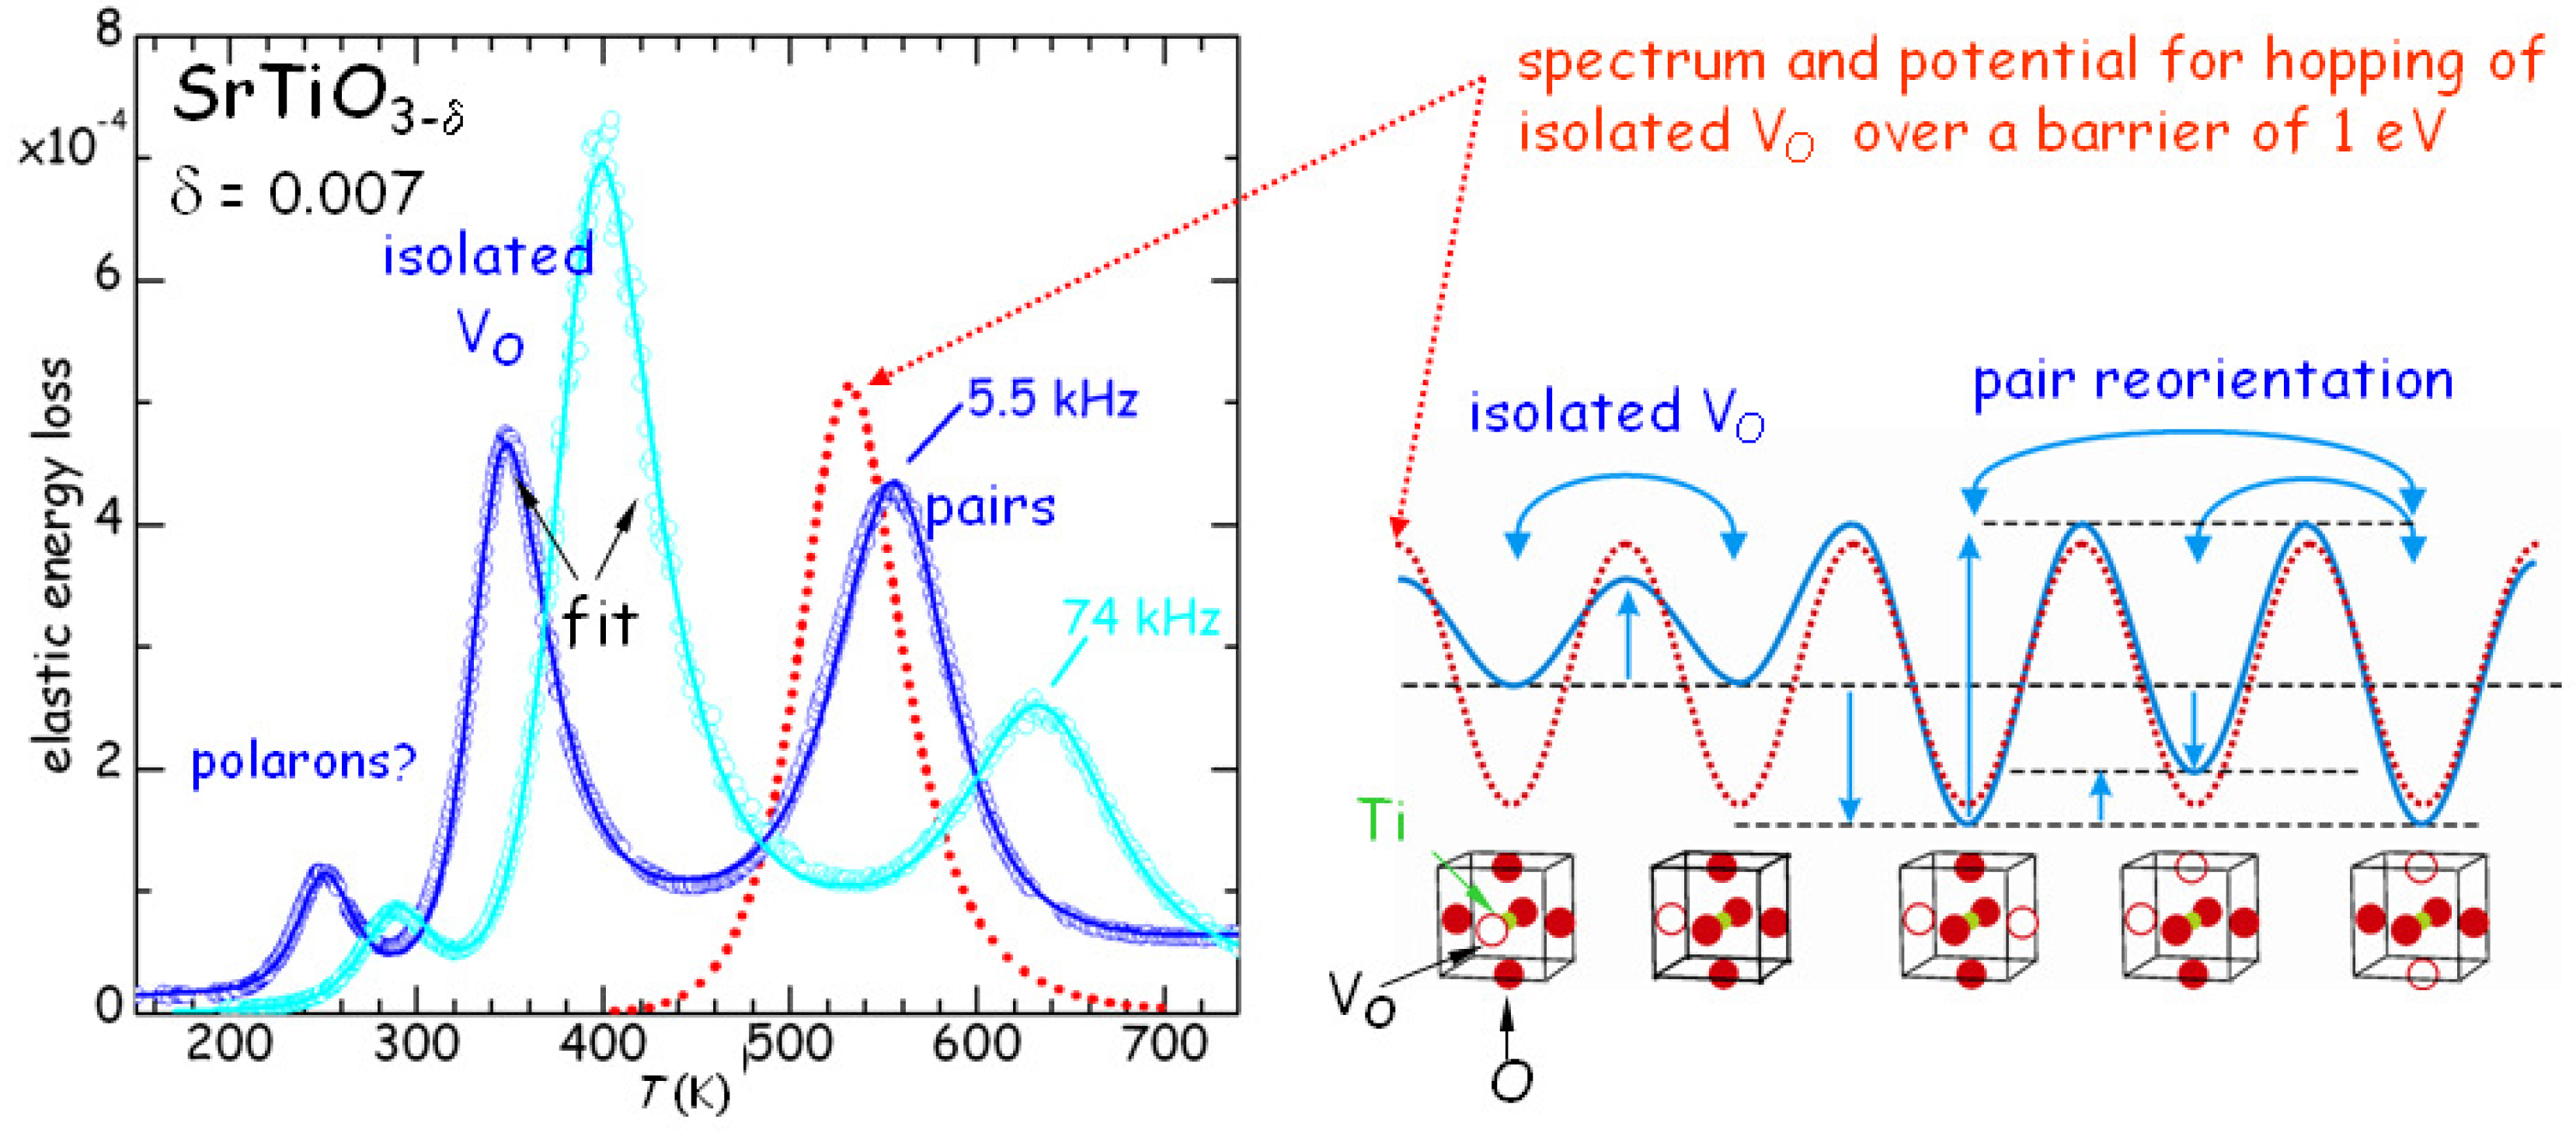
All this has been quantitatively verified by fitting with the same set of parameters many different
curves at various frequencies and values of
, though with approximate expressions for the pairs and clusters populations [
26]. An example is presented in
Figure 4. The jump rate of the isolated V
(peak P3) follows Equation (
4) with
s,
eV, while the pair reorientation rate (peak P1) has
s,
eV. The binding energies are estimated as
0.18 eV for V
pairs or ends of longer chains, and
0.26 eV for the chains. The intensity of P2 is smaller than that of P1 and P3 because it is due to a relaxation mode between bound and unbound states, which differ in energy of
; since
K, the population of the unbound state is much smaller than that of the bound state, i.e.,
in Equation (
2) and therefore
, whereas in the other cases
.
From the fact that
it follows that the saddle points between dissociated and paired or clustered configurations of V
are higher than for isolated V
, and this may be a consequence of the electrostatic repulsion between V
. A similar observation had been done for the mobile non-stoichiometric O atoms in the CuO
planes of YBa
Cu
O
[
27], and has the consequence that the time for reaching equilibrium is longer than expected from the fast diffusion of isolated V
or O atoms: they approach to each other at a fast rate, but have to win the electrostatic repulsion in order to form the bound state.
These anelastic experiments show that, even at high dilution, well below 1%, the V
behave in quite a non trivial manner also in the bulk of undoped cubic SrTiO
. Therefore, the interpretation of experiments probing an overall mobility in terms of an activation enthalpy for diffusion of isolated V
is wrong; what is probed is, in fact, the rate limiting step of the association/dissociation processes, peak P1 in the above anelastic spectra, which in fact has the same activation energy of 1 eV generally assumed for V
diffusion. The other experimental technique from which information on the detailed microscopic mechanisms of V
mobility and clustering can be obtained is NQR relaxation [
16,
21], while dielectric experiments are of limited utility in the case of isolated V
, which do not possess an electric dipole.
3.2. Mobility and Clustering of V and H in BaCeYO
Some results are described now of combined anelastic and dielectric studies of BaCe
Y
O
H
(BCY
) used as solid state electrode in SOFCs. Hydration is obtained by exposing the as prepared material, which has
for compensating the unbalanced charge of
x Ce
substituted by Y
with
V
, where the two dots indicate that an V
has charge
with respect to a regular O
. The V
can be filled with
hydroxide ions by exposure to humid atmosphere at high temperature, rendering the material a proton conductor, and the whole range of hydration levels, from complete with
and
to outgassed with
, is in principle accessible by varying the H
O partial pressure.
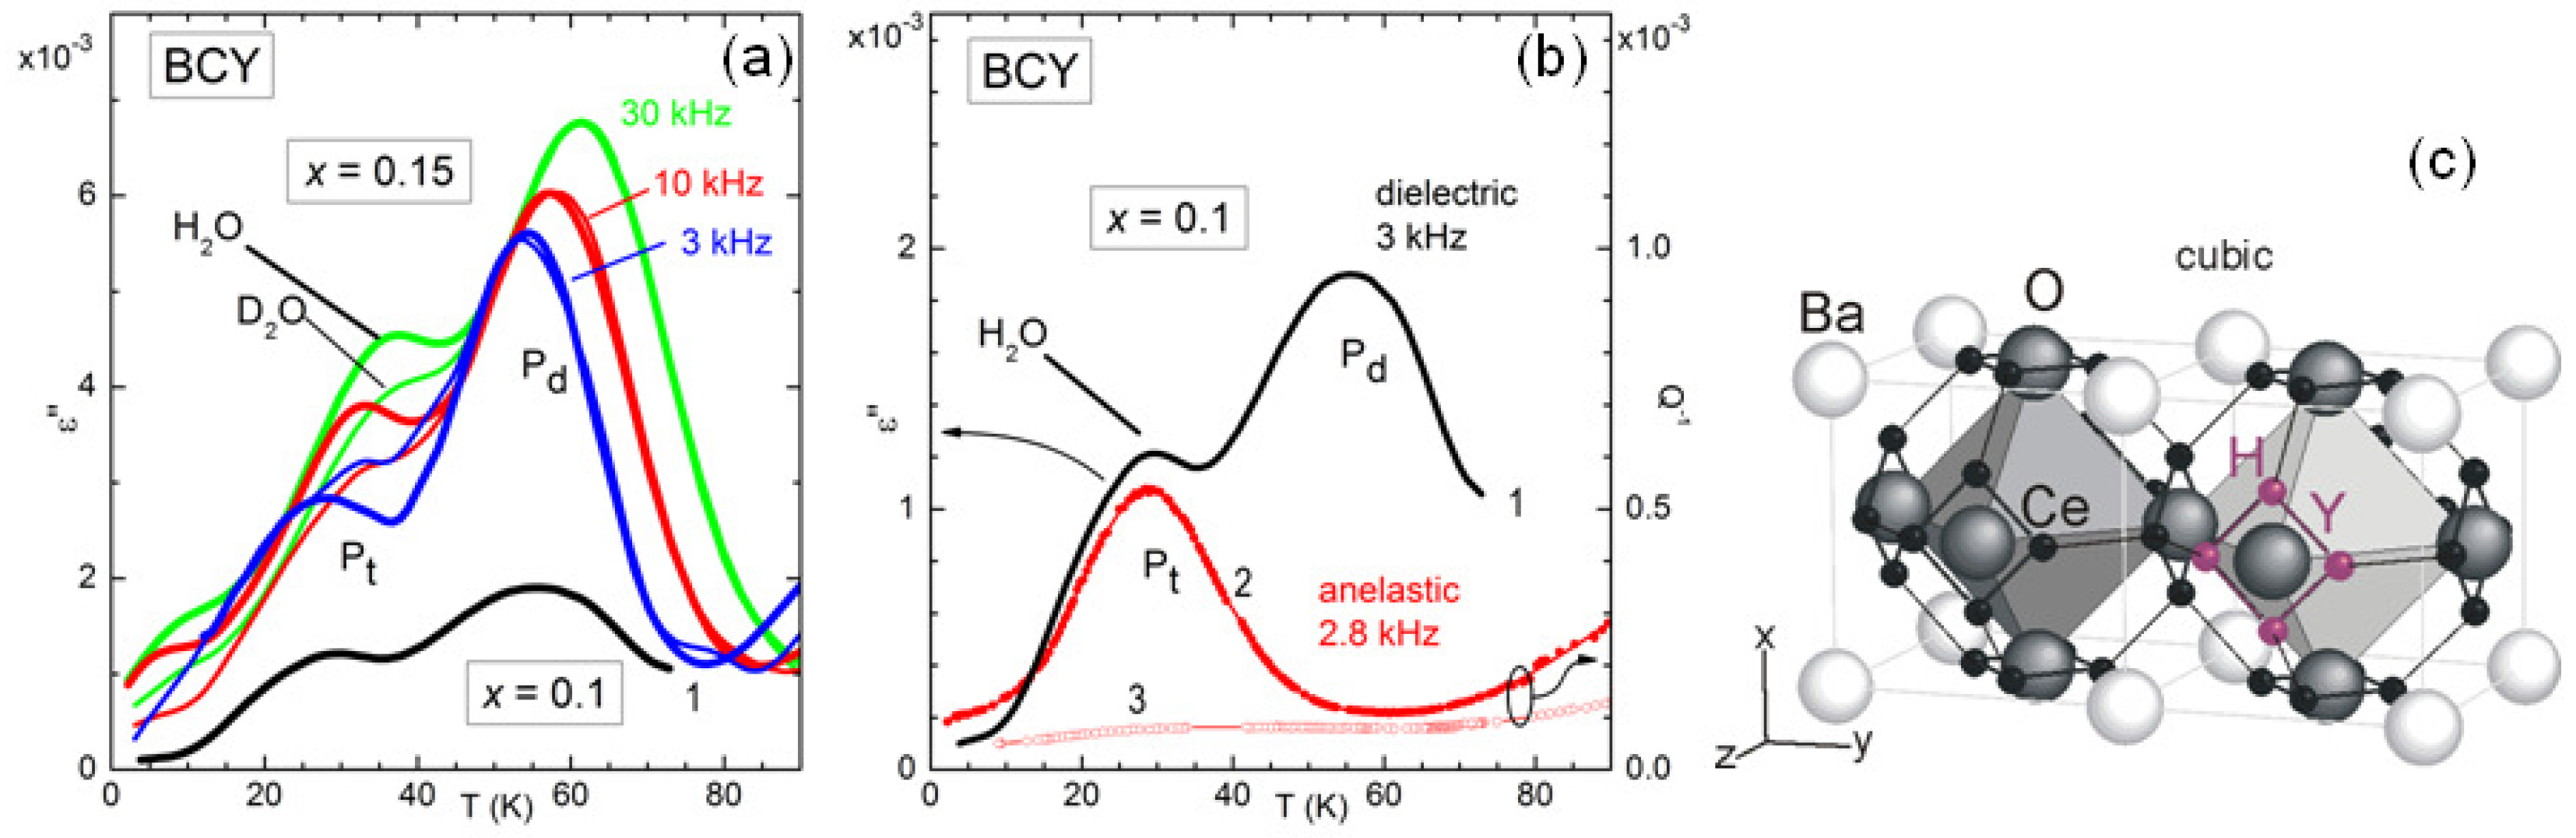
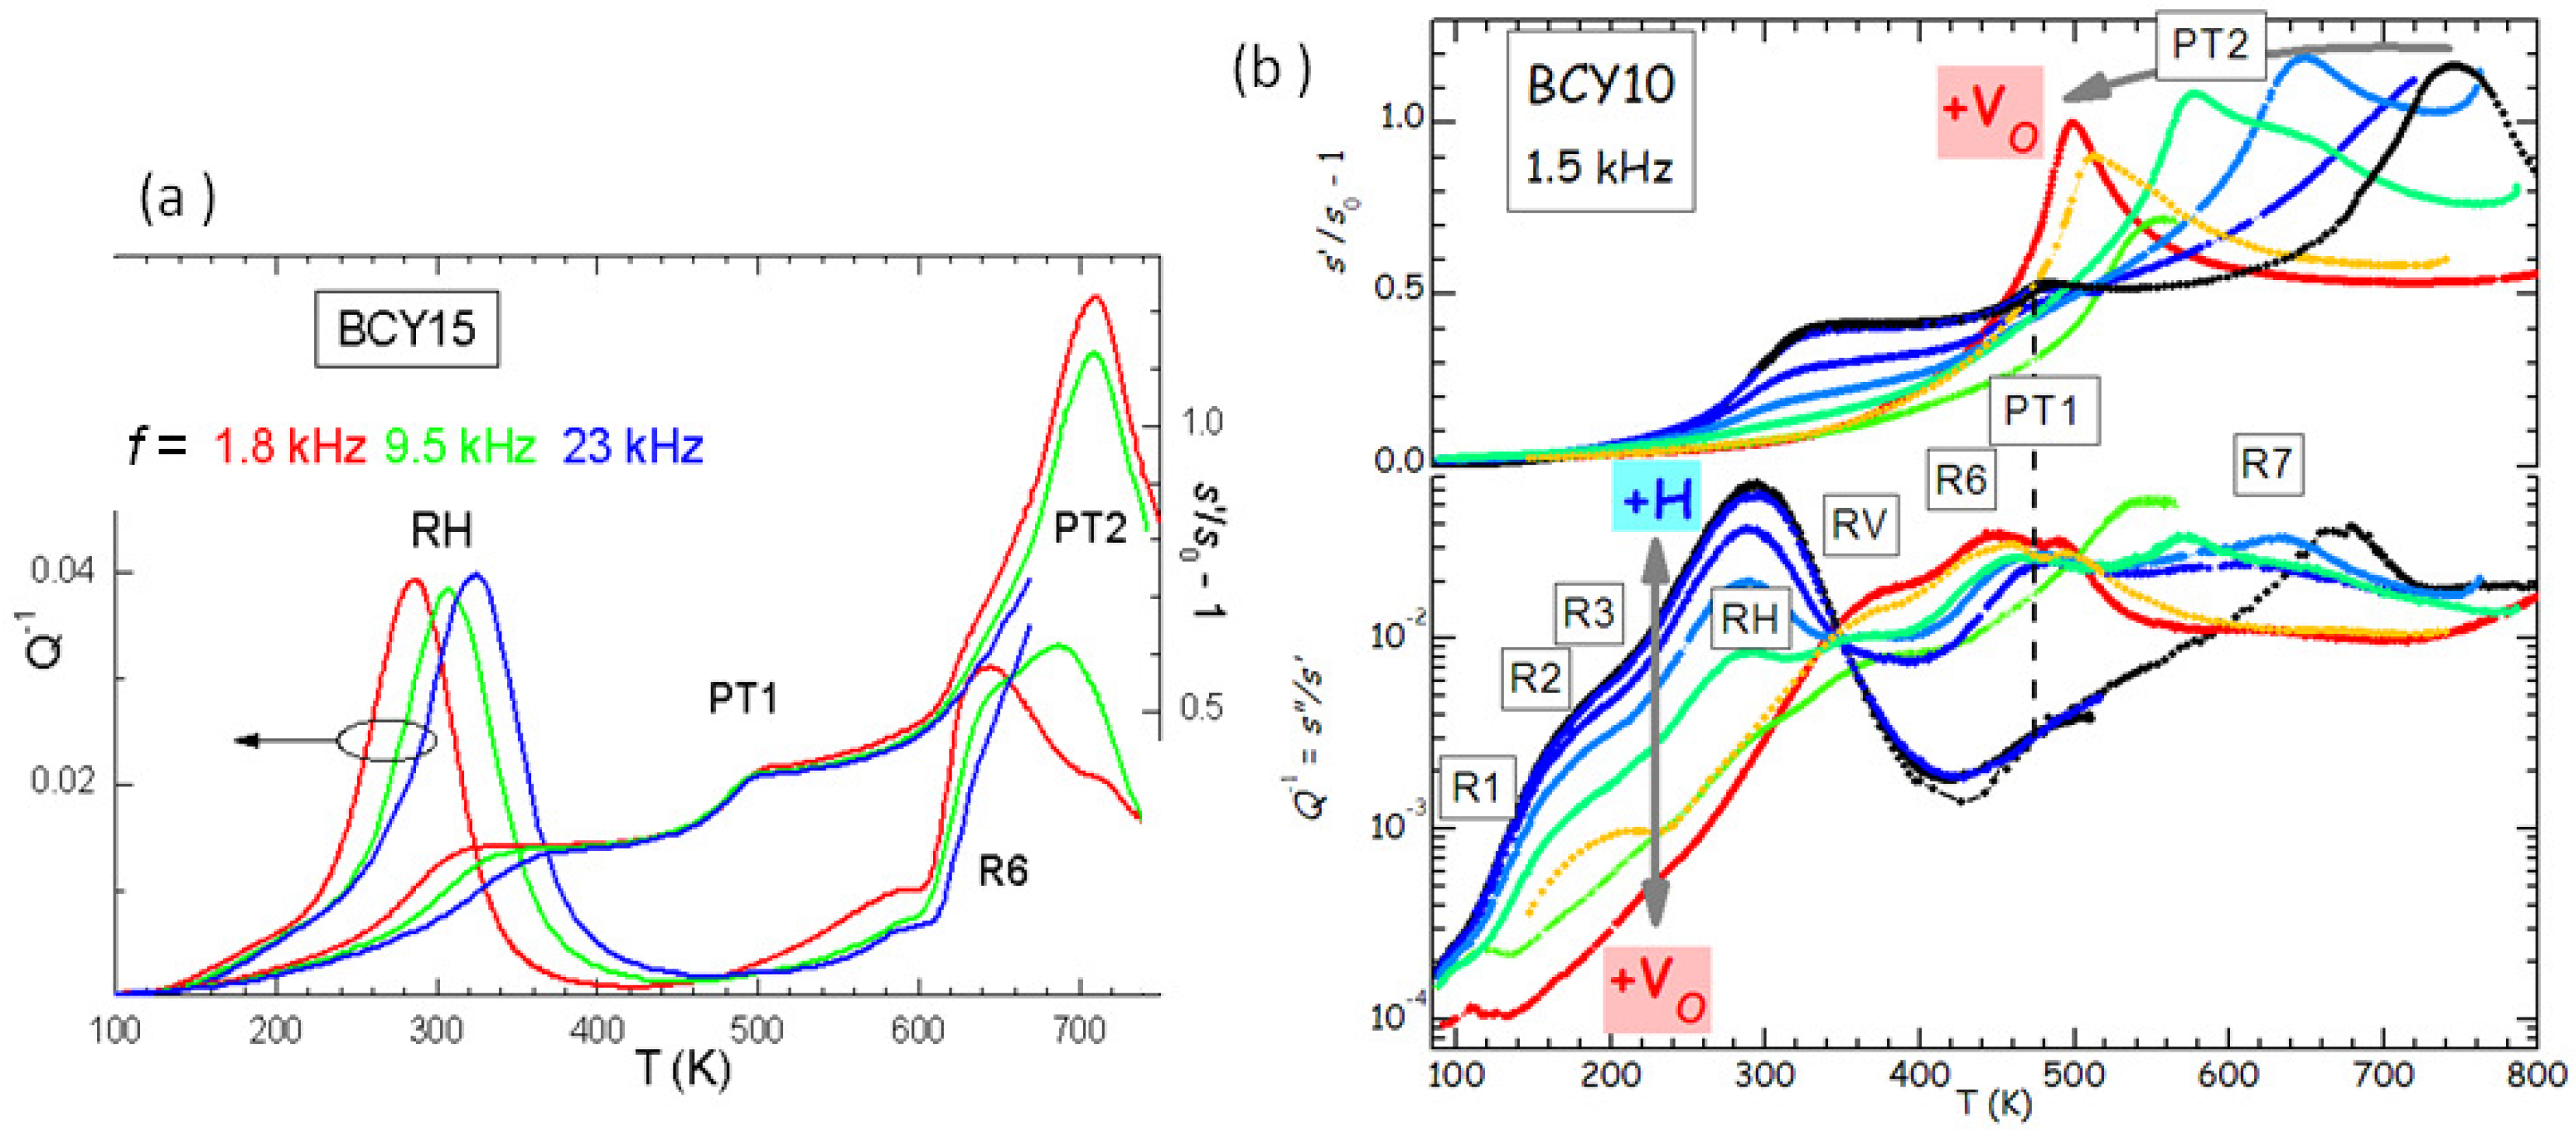
Figure 5a presents the anelastic spectrum of BCY15 in the hydrated state.
It is easy to distinguish the thermally activated processes of ionic hopping (RH and R6), which shift to higher
T when measured at higher
f, from the structural transformations, which appear as steps or maxima in the compliance at temperatures independent of
f (PT1 and PT2). Indications on the nature of the various microscopic processes can be obtained from the evolution of the anelastic spectrum when passing from the outgassed to the hydrated state, as shown in
Figure 5b.
In this manner it also appears that there are several thermally activated peaks from low to room temperature, labelled R1, R2, R3 and RH. All of them have an intensity that increases with the level of hydration, and therefore are to be attributed directly to the motion of protons or to small polarons associated with H. On the other hand, peaks RV and R6 are absent in the hydrated state and fully developed in the outgassed state, and therefore are clearly due to V
. A full analysis of the complex anelastic spectra has not been attempted yet, but it is reasonable to assume that RH and R3 are due to proton hopping among different O atoms near a trapping Y
acceptor and far from it, while R6 and RV are due to hopping of V
in the trapped and free state [
12,
28]. That V
and H are trapped by acceptor impurities is understandable from simple considerations of electrostatic attraction, and confirmed both experimentally [
29] and by first principle calculations [
30].
The phenomenon of trapping is generally unwanted in a superionic conductor, because it reduces the ionic mobility, but it is also unavoidable, since, as we have seen with SrTiO
in the previous section, in the absence of acceptor dopants there is need of an extremely reducing environment in order to introduce a sizeable amount of V
, and H is hardly absorbed. Yet, the complicated phenomena occurring in the presence of high concentrations of both V
and H may also suggest strategies for improving the ionic mobilities. For example, the reciprocal repulsion of V
and H
prevents H trapping at dopants already associated with an V
, which should increase the proton mobility [
31].
The diffusion of H in a perovskite ABO
is actually more complicated than simple hopping between O atoms, because it includes a fast tunnel assisted motion around the B-O-B bond [
32].
Figure 6 demonstrates that also this fast local motion appears in the anelastic and dielectric spectra at sufficiently low temperature [
12]. In fact, around 30 K there is a peak, labelled P
, in the dielectric and elastic losses measured at frequencies of kHz, whose temperature sensibly increases when D
O is used for hydration instead of H
O. If the relaxation rate
associated with this peak were of the overbarrier Arrhenius type, a change of the mass of the hopping ion by a factor of 2 would produce a decrease of
of
, with a less significant shift in temperature. The peak P
at higher temperature is insensitive to the H mass and is visible in the dielectric but not in the anelastic spectrum, and therefore must be associated with a defect having electric dipole but almost null strain anisotropy, most likely a polaron.
The complexity of the microscopic processes involved in the ionic mobility and aggregation of perovskites that are highly doped and with tilted octahedra is manifest from the complex anelastic and dielectric spectra, with many features still to be explained, but even those features that seem to have an explanation have in fact unclear points. For example, the intensity of the dielectric relaxation peak due to H/D tunneling is only 3% of the value estimated from the content of H/D and the geometric model in
Figure 6 [
12], and something similar had been observed in BaCe
Nd
O
[
33]. A possible explanation may be found in the tilting of the octahedra in the low temperature
phase, not shown in
Figure 6c, which makes the four positions around the same O atom highly inequivalent, inhibiting tunneling. Then tunneling would occur only in symmetric situations such as within the twin walls between tilted domains, which occupy only a small fraction of the bulk [
12].
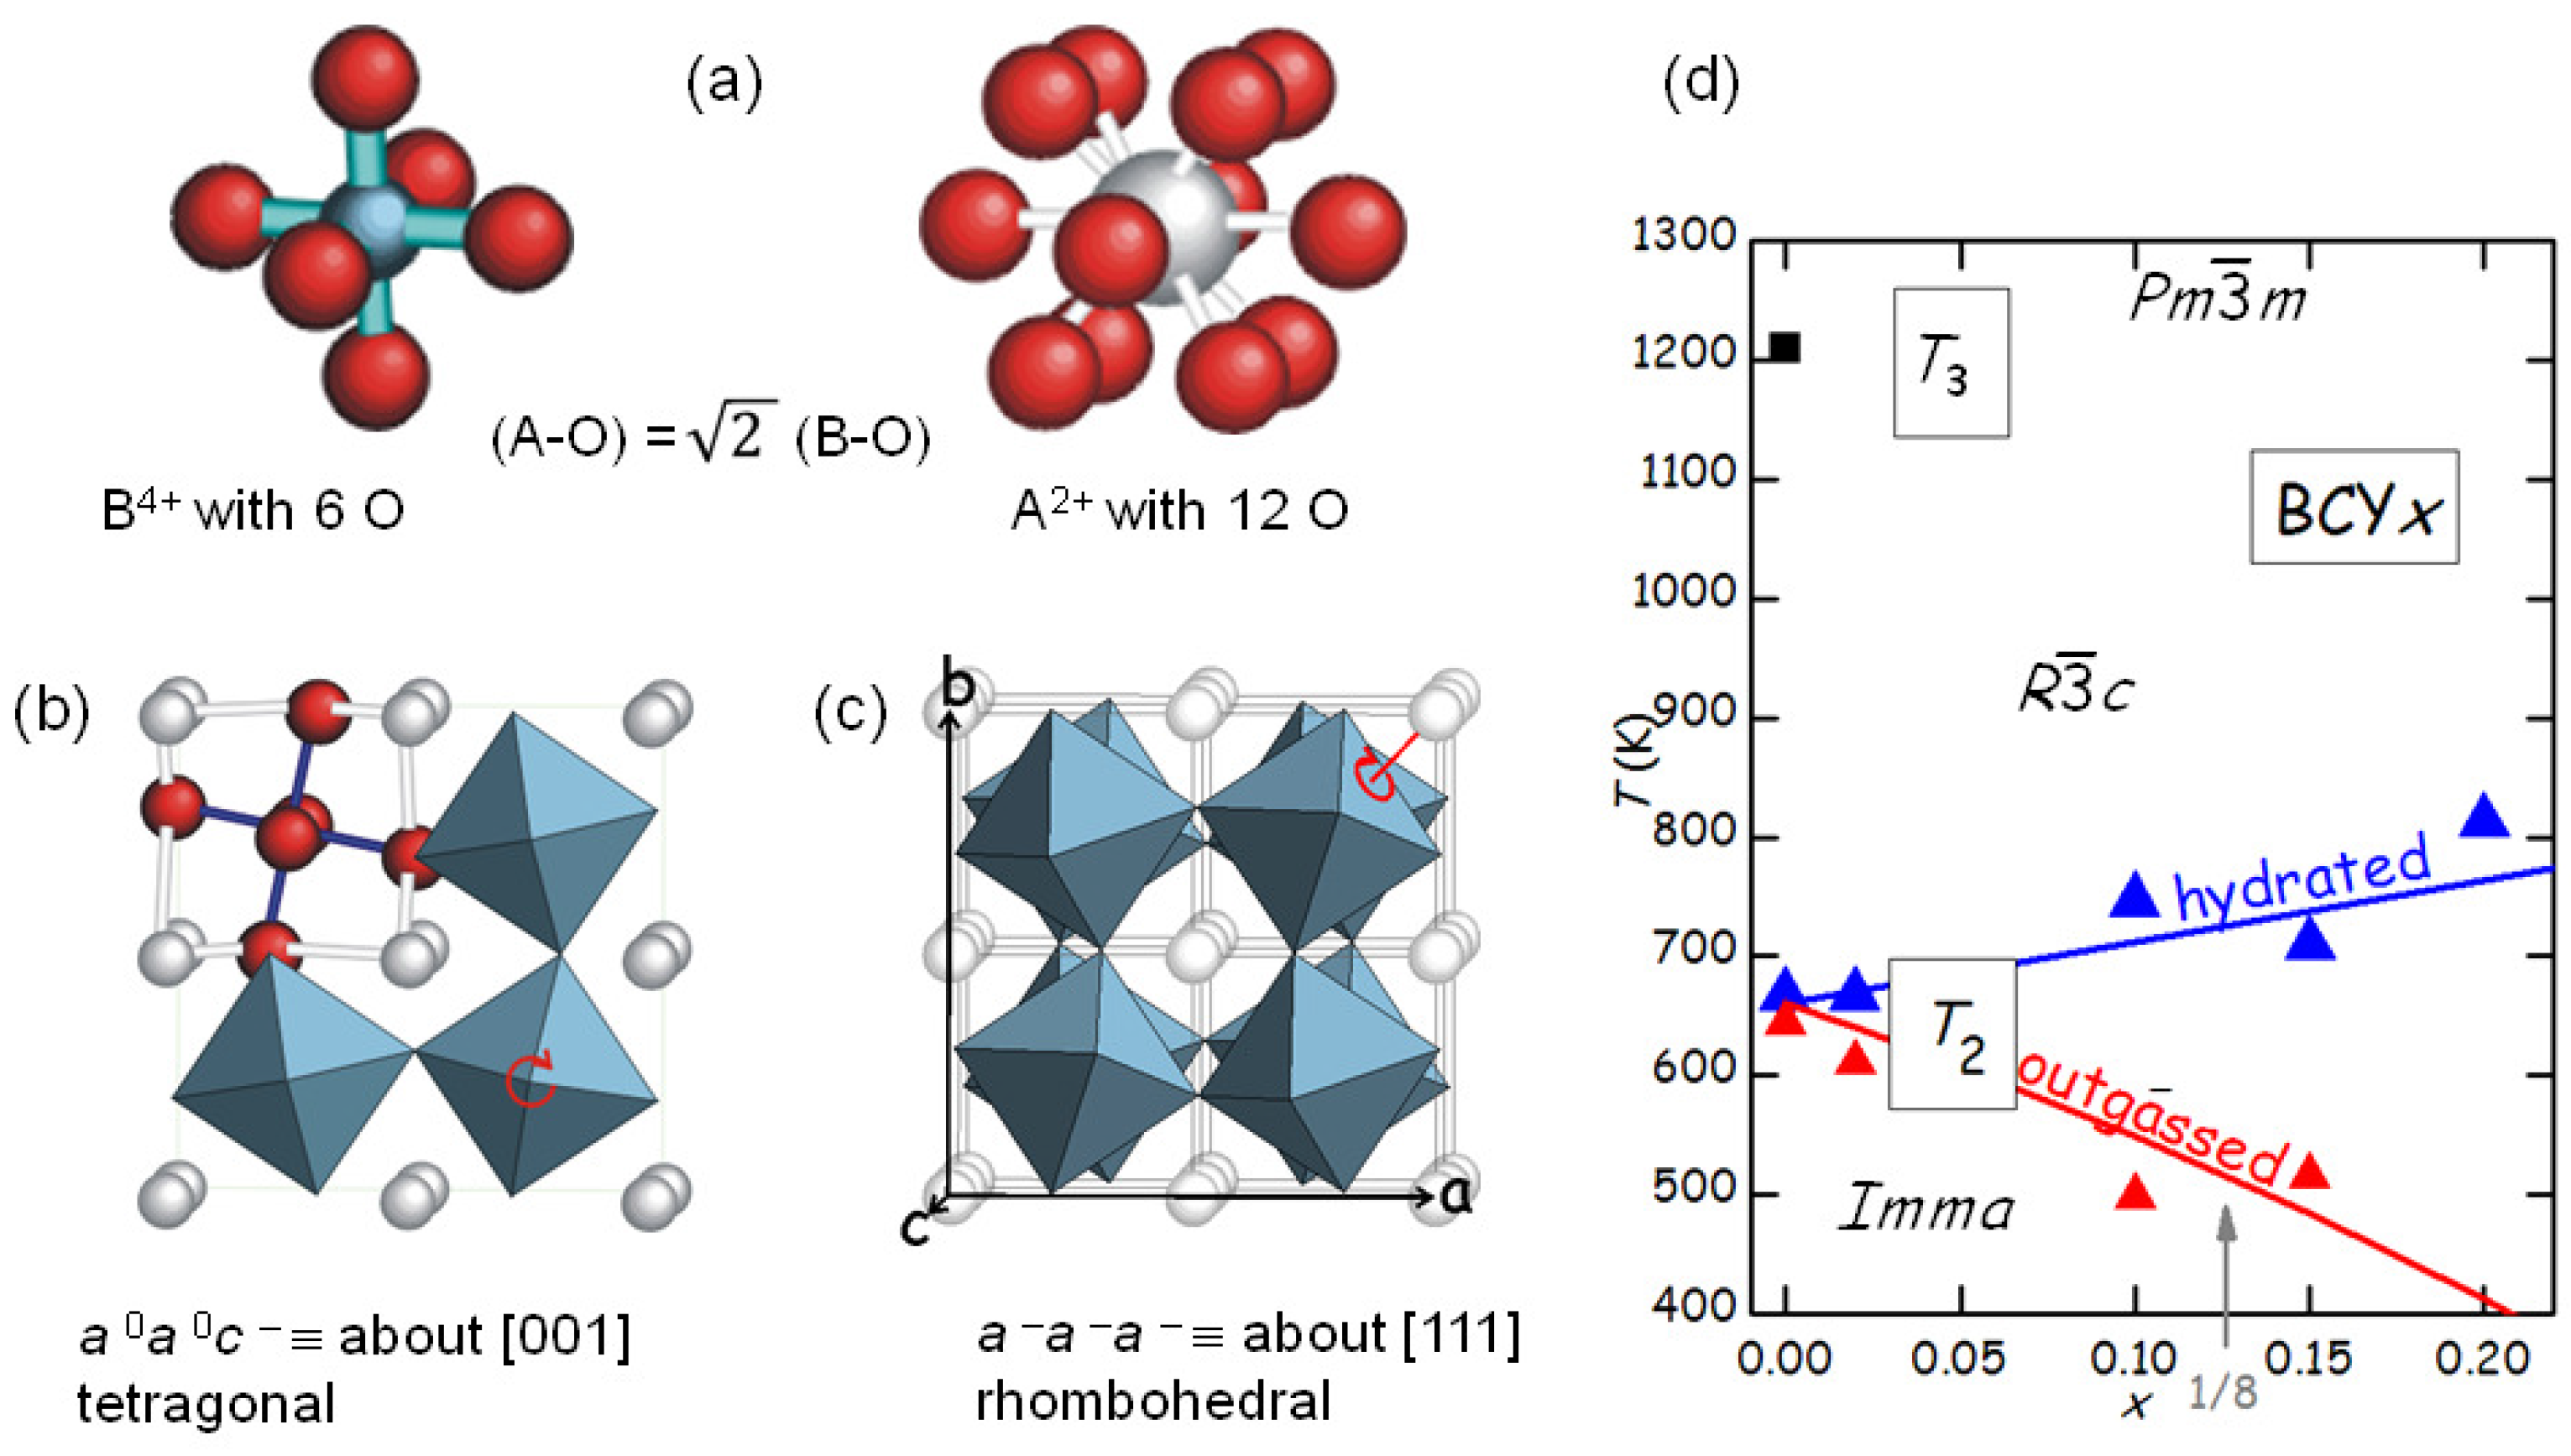
4. Structural Transformations: Octahedral Tilting in Ionic Conductors
The fact that SrTiO
remains cubic down to 105 K and few other perovskites like BaZrO
remain cubic even down to the lowest attainable temperatures is the exception rather than the rule. In fact, practically all perovskites of the A
B
O
type undergo one or several octahedral tilting transitions during cooling. The reason is that the B-O bonds are shorter and share more charge than the A-O bonds, which therefore are weaker and more anharmonic. As a consequence, during cooling the A-O bonds shorten more than the B-O and at a certain point will create a pressure on the more rigid and incompressible BO
octahedra, which therefore tilt (
Figure 7).
The tilt patterns are generally indicated in Glazer’s notation [
34]; for example, the pattern in the low-temperature
orthorhombic phase of BaCeO
is
, meaning that there is a rotation about the
a axis with all the octahedra in phase along the axis, and a rotation by a different angle about the
b and
c axes, with the angles alternately positive and negative along these axes. The series of tilt transition occurring in BaCeO
during cooling has been determined from neutron diffraction [
35], and it is likely that the same sequence occurs in doped BaCeO
, so that the two transitions in
Figure 5 are identified as follows:
(
)
(
)
(
)
(
), where PT3 is at 1200 K for BaCeO
[
28,
35].
The occurrence of structural phase transitions in materials for fuel cells or other applications like gas purification membranes is generally unwanted, because it negatively affects the ionic mobility by reducing and making anisotropic the diffusion coefficients and cause fatigue and cracking of the material under repeated thermal cycles. It is therefore important to study the effect of dopants on the structural transitions, in order to suppress or shift them to safer temperatures, or reduce the magnitudes of the structural changes and therefore the impact on the mechanical stability.
Figure 5b shows that the level of O deficiency changes the temperature of PT2 of as much as 250 K on the same sample. It is found that the temperature
of the transition between rhombohedral and orthorhombic structures, occurring with a loss of a tilt axis but increase of the tilt angle about the other two axes [
35], increases with the Y substitution
x in the hydrated state, but decreases more in the outgassed state. The increase of
with
x in the hydrated state is understandable in terms of the larger ionic radius of Y
with respect to Ce
, so that the larger YO
octahedra have a stronger tendency to tilt and the tilting transition temperature is enhanced. A quantitative measure of the tendency to tilt is the so-called tolerance factor [
7]
where
is the ideal radius of the ion X, tabulated by Shannon [
36], so that
is the ideal Ba-O bond length and
the ideal B-O bond length averaged over the composition Ce/Y; with this definition, it is
when the ideal bond lengths match exactly those in the cubic cell, while
implies a tendency to tilting. Then the temperature of the
th tilt transition in the hydrated state can be phenomenologically expressed as [
28]
, where
is calculated with the Shannon radii and is little affected by the fact that the radius of the
ion is larger than that of O
, since it appears in the numerator and denominator;
is the critical value of
t below which the
n-th transition takes place, and
is the proportionality factor for the transition temperature. The line passing through the
points in
Figure 7d has
K and
.
The explanation of the reduction of
after outgassing is based on the fact that the V
interrupt and, hence, weaken the B-O and A-O networks, so that the above expression of
is reduced by a factor that in a first approximation is assumed to be linear in
:
The line passing through the
points of the outgassed state has
[
28].
The interplay between V
and structural transitions is not limited to shifts, however important, in the temperatures of tilt or other types of transitions pre-existing the O loss, but may give rise to ordering transitions of the V
. These phenomena are usually observed in cobaltites and ferrites, where the mixed valence states of Co and Fe support high levels of O deficiency without further doping, and ordering in the brownmillerite structure occurs at the stoichiometry ABO
[
37], though more complicated orderings are also found [
38]. Since the brownmillerite structure is derived from the perovskite by ordering of the V
into parallel chains in alternate planes, it is likely that a first stage of V
ordering consists of chains also in other perovskites [
26,
39], though its direct observation is very difficult, due to the low cross section of O in TEM and XRD. Other types of V
ordering may be expected at other commensurate stoichiometries; in
Figure 7d a possible anomaly in the behaviour of
is marked by an arrow at
, though measurements at additional compositions would be necessary to confirm this.
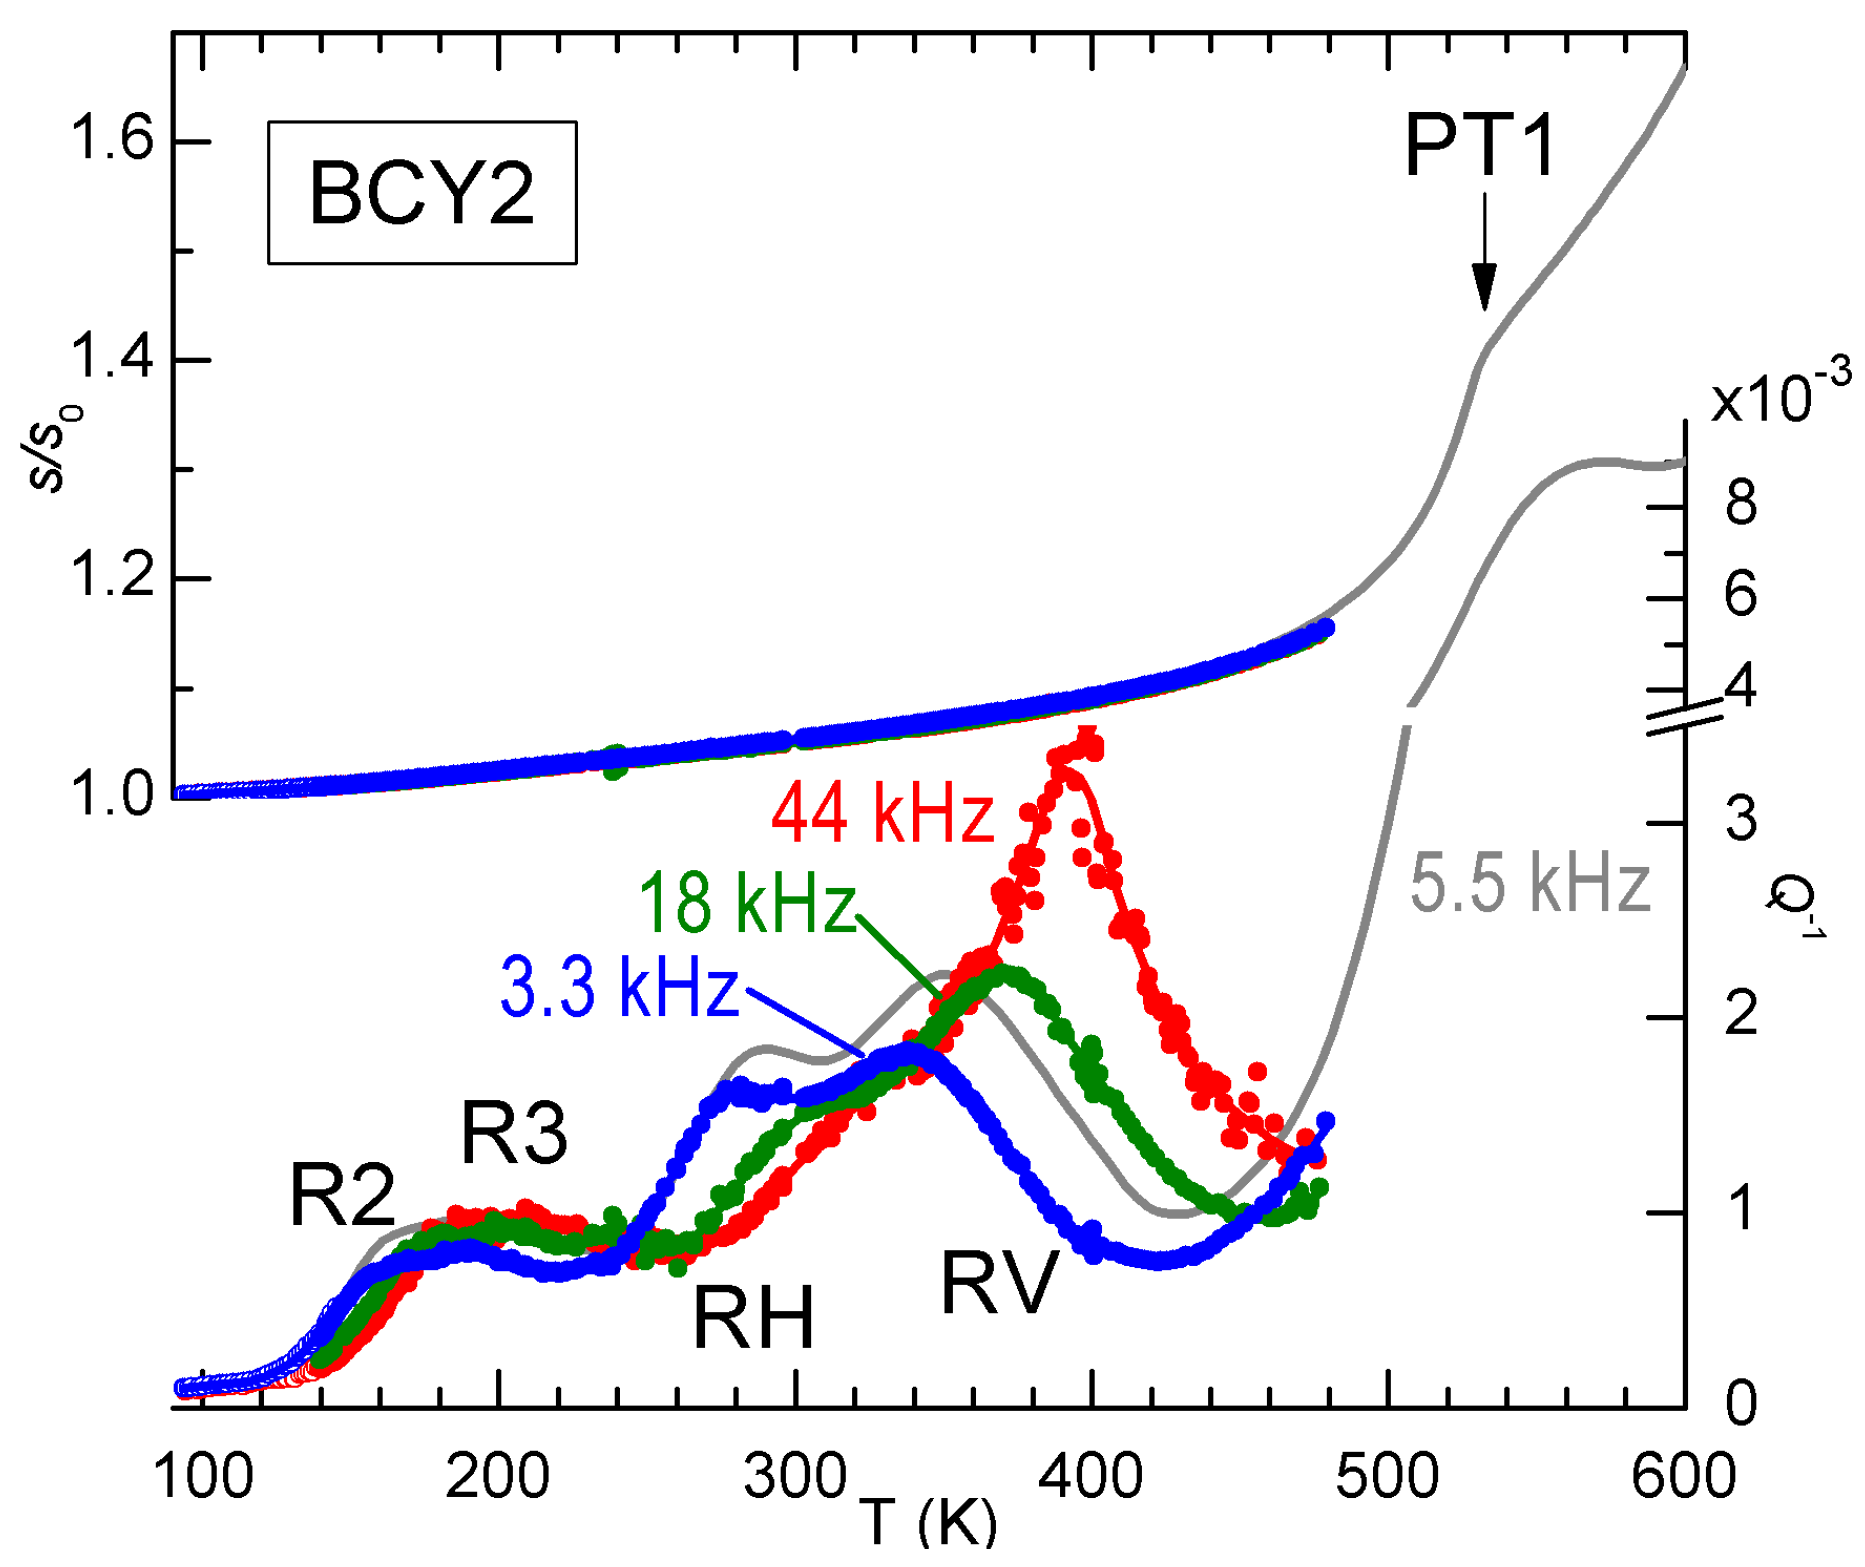
Signs of V
ordering are found also in the anelastic spectra, as demonstrated in
Figure 8 by the anomalous increase of the intensity of peak RV with temperature. The three frequencies have been measured during the same run and generally the spectra of BCY are reproducible, without any sign of change of the hydration state, up to 500 K, so that the increase of the height of RV with temperature is significant and in contrast with the usual
behaviour. The grey line had been previously measured on the same sample during cooling, and the frequency is higher because the sample had been thinned between the two measurements, but it is closely comparable to the two curves at 3.3 and 18 kHz measured afterwards, and it shows the transition PT1 at 530 K. A possible origin of the anomalous increase of the intensity of RV on approaching PT1 is that some V
ordering occurs below PT1. We mention that also the other relaxation R6 (see
Figure 5), most likely involving V
, exhibits a similar anomalous behavior, but its close proximity to PT1 makes it likely that also the domain wall motion takes an important role [
28].
5. Aging and Recovery of PZT Undergoing FE/AFE Transitions
Ferroelectric (FE) and antiferroelectric (AFE) materials play various roles as materials for energy: through the piezoelectric effect they can be used for mechanical energy harvesting [
5], through the electrocaloric effect they can be used for efficient cooling [
40], while the peculiar shape of the loop of polarization versus applied electric field exhibited by certain AFE can be exploited for electric energy accumulation with high power density during release [
41]. Many of these applications involve repeated FE/AFE transitions, which may be dramatic events on the microscopic scale and cause fatigue and aging. The dielectric spectroscopy is a standard tool for studying FE materials, while the anelastic one is much less, though it can provide a fresh look.
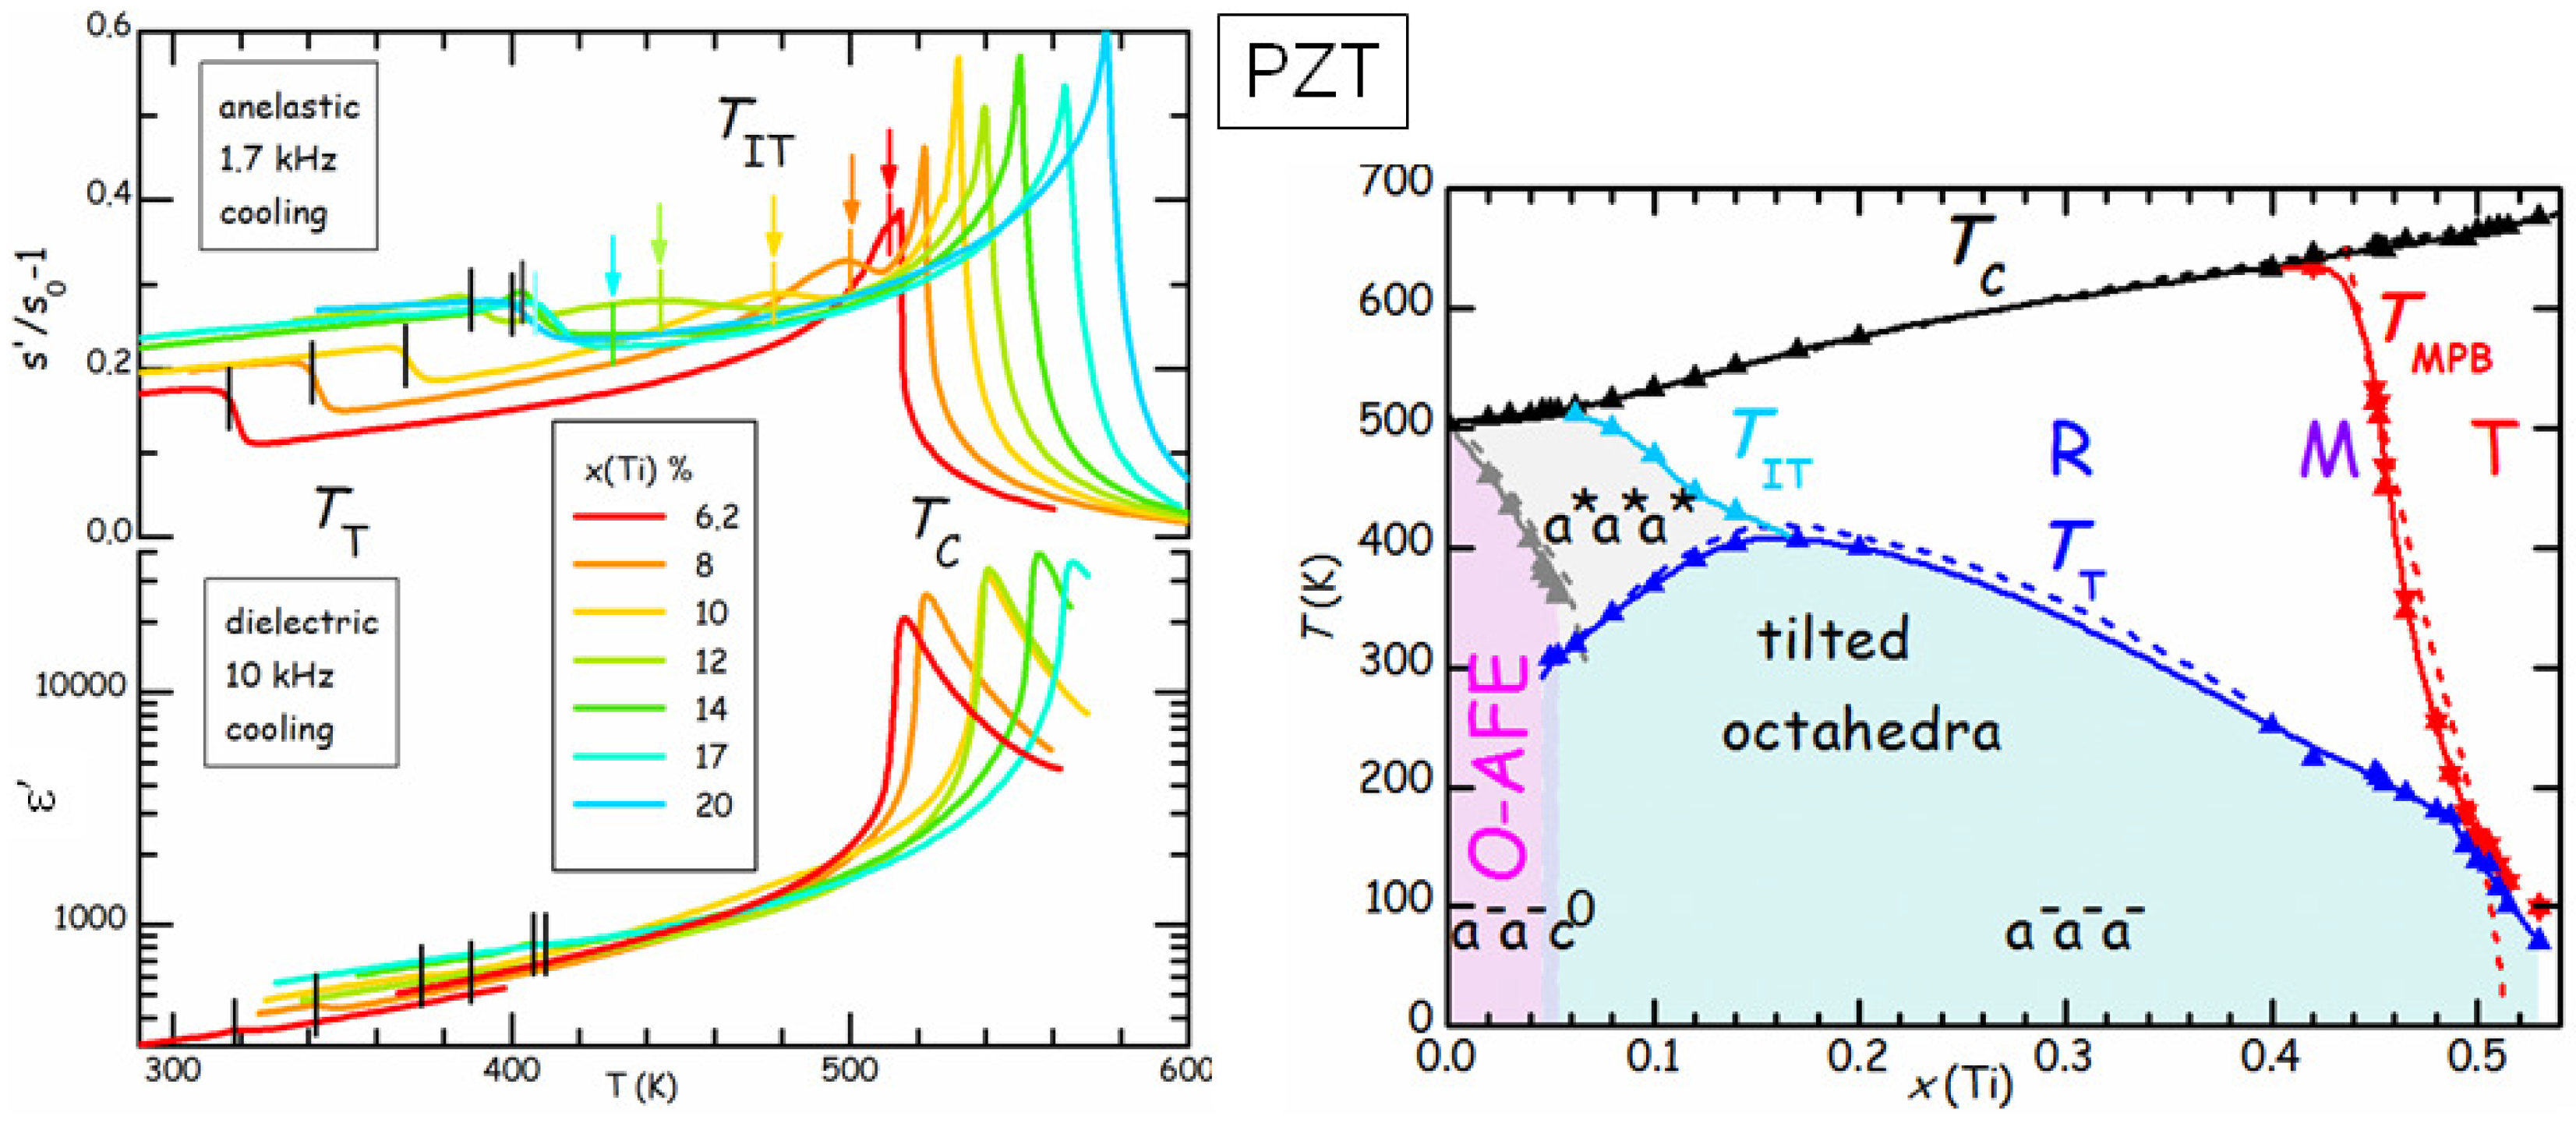
Figure 9 compares the real parts of the elastic compliance
s and dielectric constant
ε of a series of PbZr
Ti
O
(PZT
) samples at various compositions
x [
42]. The dielectric susceptibility is dominated by the Curie-Weiss peak at
, and presents a minor step at
, below which tilting of the octahedra with the
pattern (see
Figure 7) occurs. On the other hand,
s presents a step accompanied by a peak at
and a step below
, which is much less attenuated than in
ε. This is due to the fact that
ε probes directly the polarization
, which is the order parameter of the FE transition, while
s probes the strain, which is not directly involved in the FE or tilt transition, but, for symmetry reasons, is only coupled to the square of
and of the octahedral rotation angles [
43]. As a consequence, these transitions produce effects on
s that are less dramatic and of comparable strength. The advantage is that it is possible to see also additional effects, such as a new transition at
, which had escaped observation for decades, and is interpreted as an initial stage of tilting without long range order [
42]. In this manner the tilted region of the phase diagram corresponds to that of low
T and low tolerance factor
t (see Equation (
6), the ionic radius of Zr is larger than that of Ti), without the anomalous depression at
. In what follows we concentrate on the region of the phase diagram with
, where the AFE ground state is preceded at higher temperature by the rhombohedral FE phase with disordered tilting. These compositions are of interest for the applications exploiting the AFE/FE transition, such as high energy capacitors and electrocaloric cooling, and we studied the effects of such transition and of aging by means of anelastic spectroscopy.
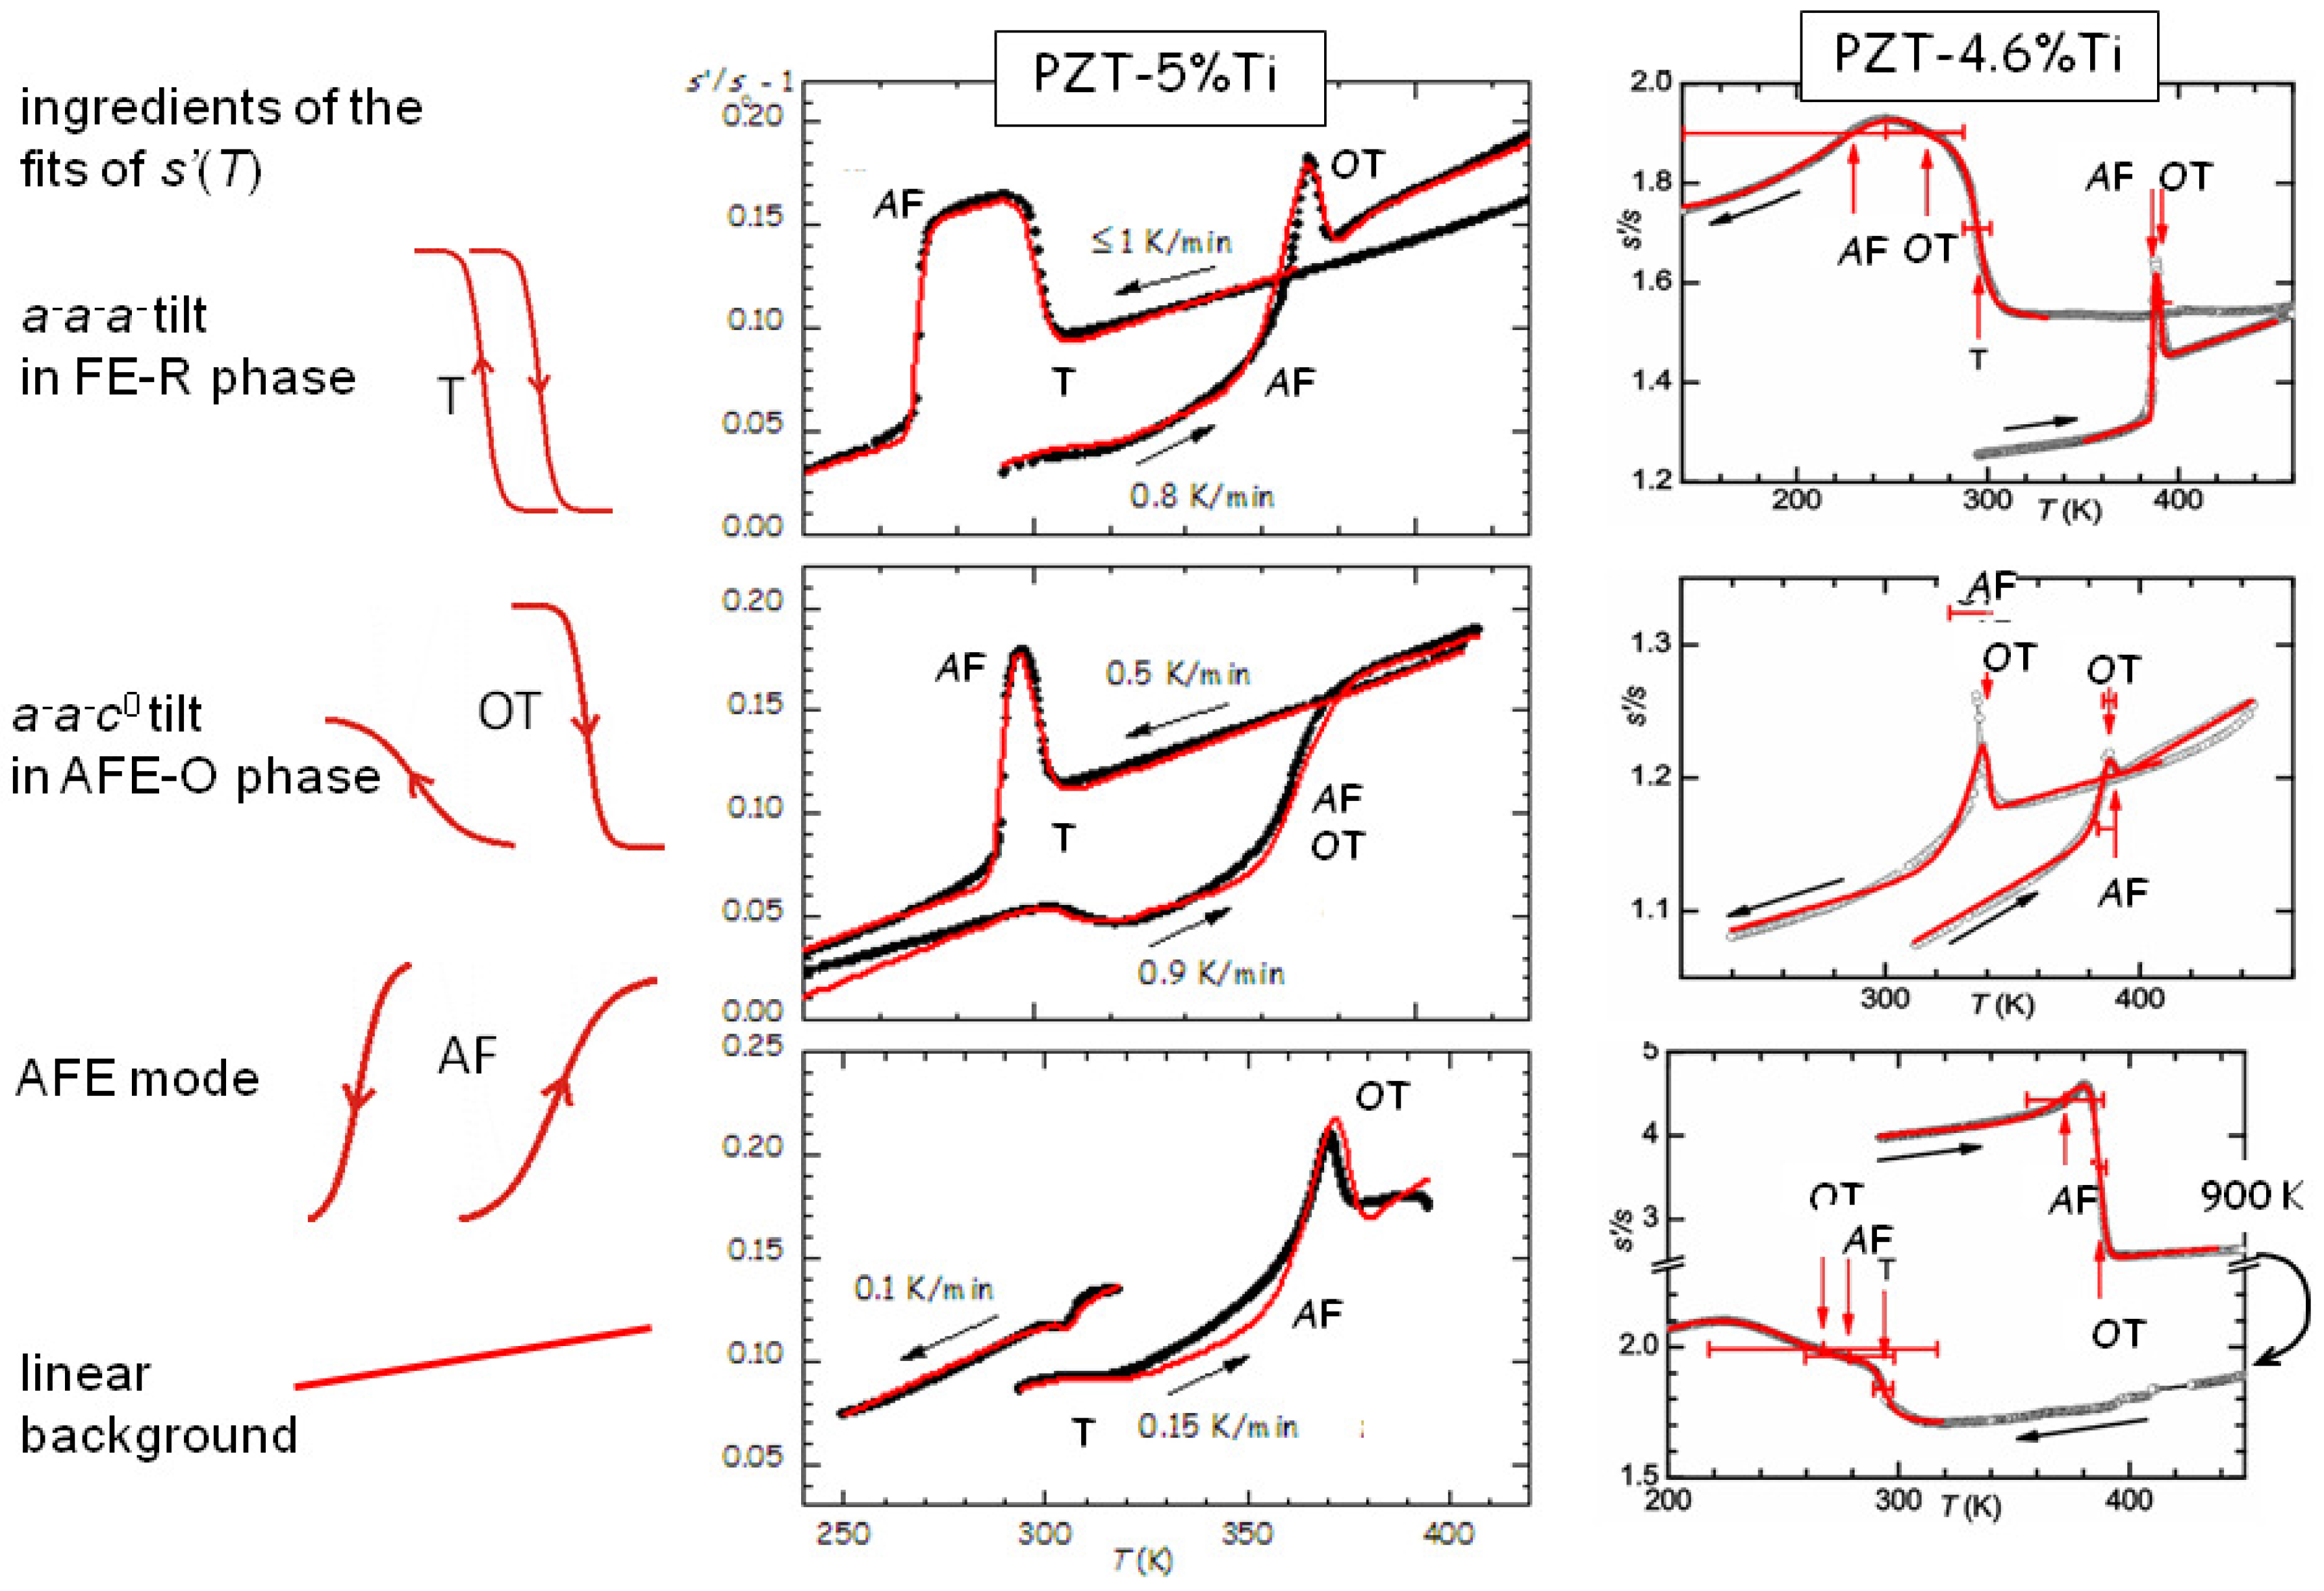
We first show in
Figure 10 that the elastic anomaly observed at the AFE/FE transition of PZT is far from a simple step, possibly accompanied by a peak, but displays a variety of shapes that change with the heating/cooling rate and state and history of the sample [
44,
45]. Yet, all the anomalies can be fitted remarkably well with the crude hypothesis that they are the superpositions of steps corresponding to the two tilt modes involved in the transitions around that temperature, namely the
mode (labelled T) of the fraction that remains in the rhombohedral (R) FE phase, and the
mode of the orthorhombic (O) AFE phase, plus the polar AFE mode. The two anomalies at the tilt transitions consist of steplike softenings on cooling, and hence stiffenings during heating, as observed in
Figure 7. Instead, the step of opposite sign, which is clearly visible during all heatings and many coolings, is identified with the polar AFE mode, based on the fact that in the FE phase there is a piezoelectric softening [
13], which disappears together with the piezoelectric constants in the AFE phase. Initially we exchanged the assignments of the steps from the OT and AF modes [
44,
45], because we had not yet recognized the importance of the piezoelectric softening, but those fits are valid with minimal changes in the parameters and exchanging the assignments OT and AF. The curves measured during heating are relatively well reproducible and require limited adjustments in the temperatures and widths of the steps, while those during cooling present much larger variations. From the fits of the PZT5 sample in
Figure 10 it appears that an increase of the cooling rate pushes the onset of the AFE transition to lower
T, namely increases the thermal hysteresis, whereas tilting in the R-FE phase occurs always promptly at the same temperature and with little thermal hysteresis. In addition, from the variety of the shapes of the
curves during cooling it appears that the OT tilt and polar AFE modes can be almost independent of each other and occur with slow kinetics over extended temperature ranges in samples subjected to many cycles and aging.
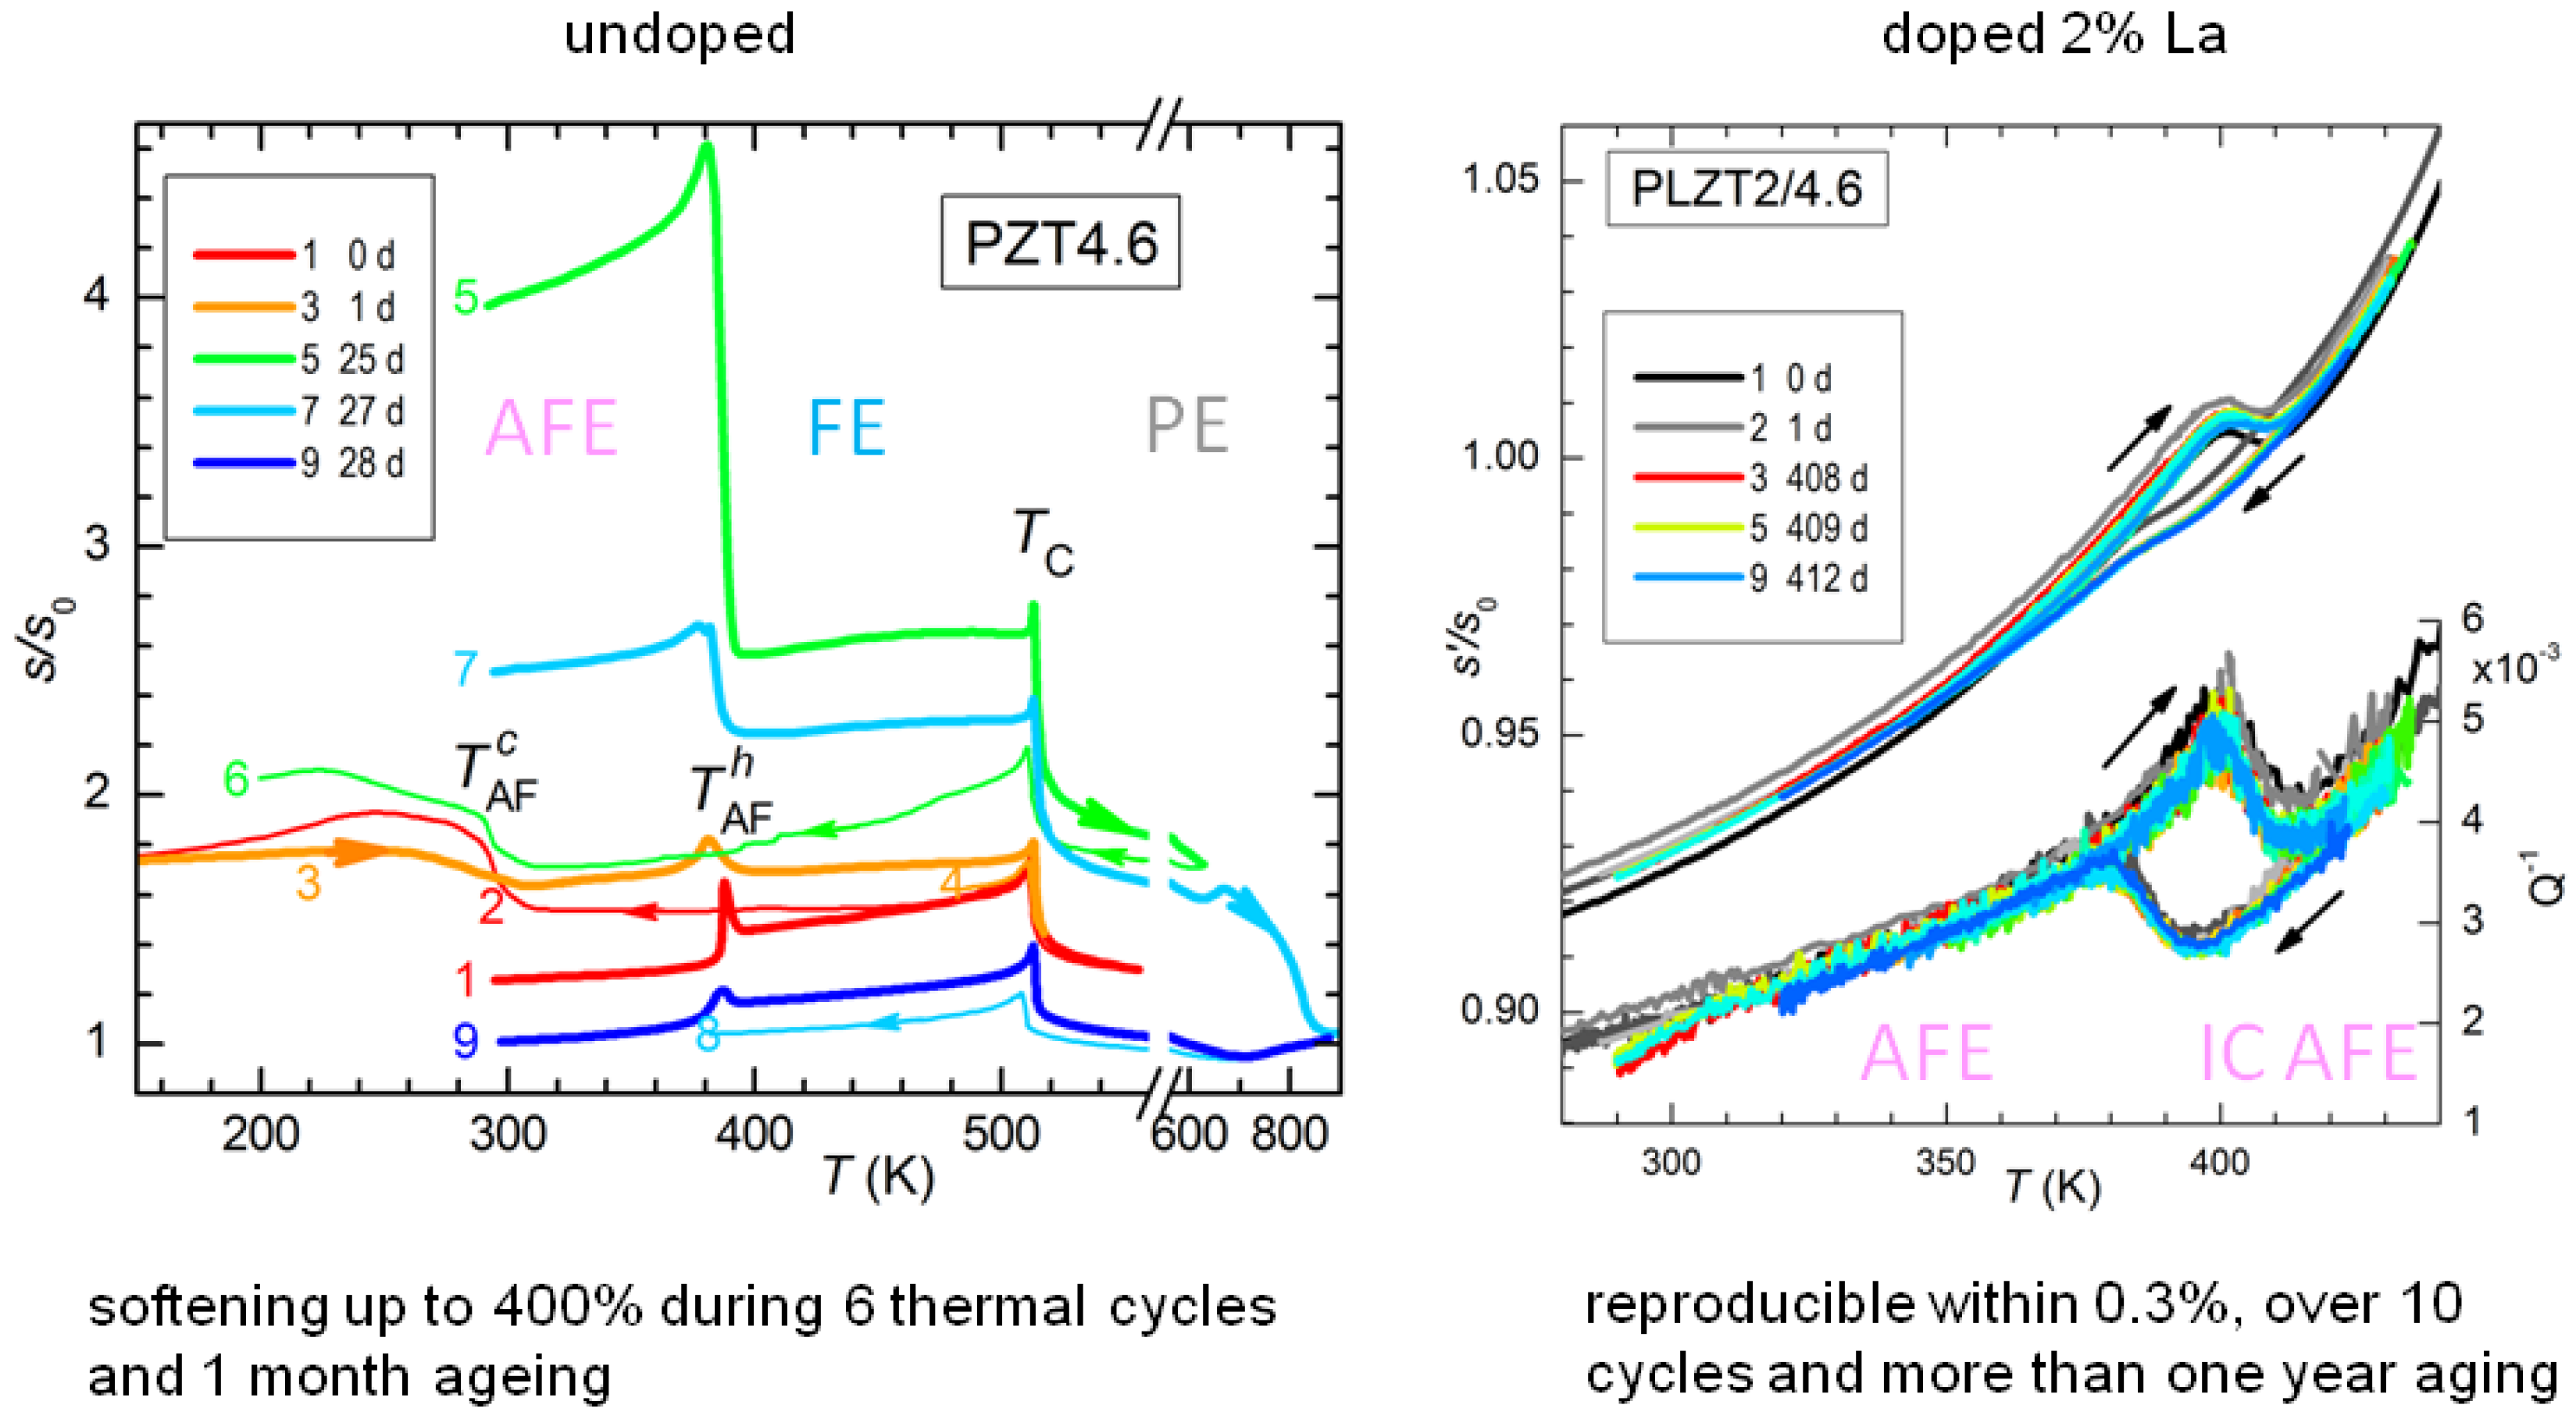
The effect of thermal cycling and aging on PZT4.6 is shown in
Figure 11, where in the legend are specified the days passed since the first cycle. As already demonstrated in
Figure 10, the temperature
of the AFE/FE transition during heating is stable, though the amplitude of the step is not, while the transition during cooling is much broader and with a large thermal hysteresis. The remarkable fact, however, is the progressive softening of the sample with cycling and aging: it starts from
at room temperature and after 25 days it is at
, an extraordinaryly large softening for a ceramic material whose other properties, e.g.,
, remain nearly constant. The stiffness can be from partially to more than completely recovered by fast annealing above 600 K. From
Figure 11 it appears that extending the measurement to 600 K recovers most of the stiffness, while after reaching 900 K the sample is even stiffer than during the first heating. Though not apparent from
Figure 11, after annealing, the transition to the AFE state becomes more prompt, with smaller hysteresis and a narrower shape. These annealing temperatures are rather moderate for this type of ceramic, well below the sintering temperature at which the lattice reconstruction occurs.
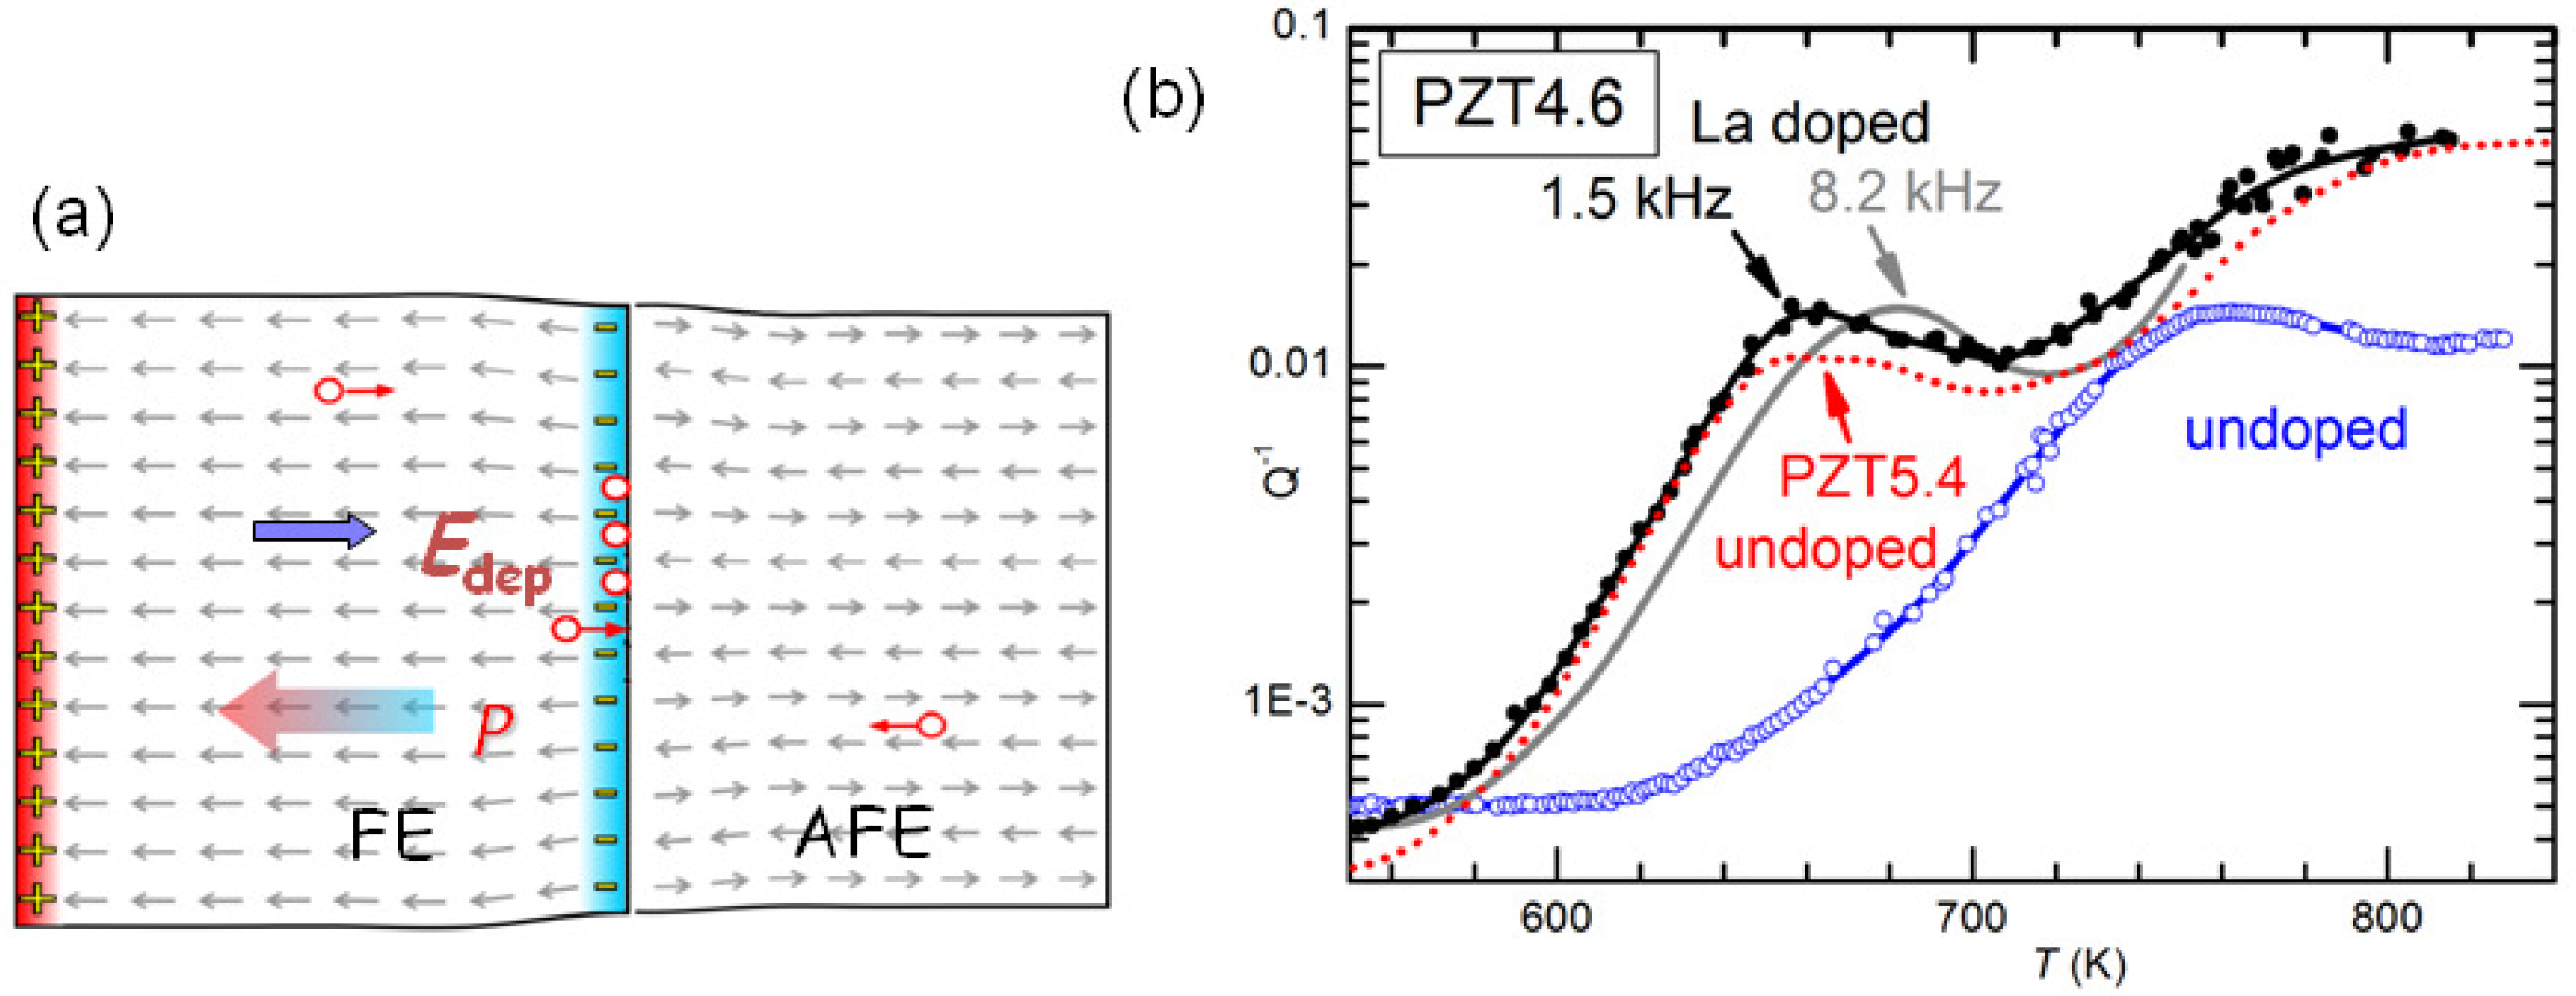
It has yet to be clarified the type of damage created by cycling through the AFE/FE transition and aging and responsible for the huge softenings. The most obvious would be cracking, which is known to cause fatigue in these materials, and would be due to the fact that the volume of the AFE cell is markedly smaller than that in the FE phase [
47]. Notice however that the measurements are made in vacuum and the rate is 4–8 K/min above 600 K, in order to minimize the O loss. It seems impossible that so mild and fast annealings could heal cracks. Neither can these annealings reoxygenate the material, since the opposite occurs, at least in the surface. We think that the only possibility is that the damage consists mainly of clustering of the V
created by the PbO loss during sintering. Such a clustering would occur at the charged and stressed walls between AFE and FE domains during the coexistence of the phases at room temperature and during the transitions, as schematically shown in
Figure 12a. Then the annealings would dissolve the clusters of V
and disperse them in the lattice as in the virgin state. It remains to explain how is it possible that concentrations certainly well below 1% of V
can produce through clustering softenings of as much as 4 times, as shown in
Figure 11.
In order to verify that the coexistence of AFE and FE phases is responsible for the elastic aging, we tested a sample with the same Ti composition but doped with 2% La on the Pb site. The effect of La is of stabilizing the AFE phase and at the level of 2% even transforms the FE phase into incommensurate (IC) AFE [
48], so that the transition is now between two different AFE phases. Therefore, in the La doped sample all the domains have similar volumes and no polarization charge can develop, and indeed the compliance of the doped sample is remarkably stable, within 0.3%, in sharp contrast with the span of over 400% at room temperature in the undoped AFE/FE case (
Figure 11).
It is also possible to exclude that the effect of La doping is of neutralizing the V
. In fact, at high temperature there are various thermally activated anelastic relaxation processes, which also have dielectric counterparts, and most likely are due to the motion of V
.
Figure 12b shows the anelastic spectra of undoped and 2% La-doped PZT4.6 at high temperature, with at least two peaks that are shifted at higher temperature in the spectrum measured at higher frequency. These peaks are relatively stable and appear in practically all the PZT samples we measure. They have the characteristics typical of the motion of highly correlated defects: they are broader than single Debye peaks, Equation (
2), have high apparent activation energies (∼5 eV) with unphysically large relaxation rate extrapolated to infinite
T:
s
, which are indicative of relaxation rates that depart from the Arrhenius law, Equation (
4) and vanish at finite ordering or freezing temperatures. Since the condition
holds at the maxima, we think unlikely that the cations can make
jumps per second around and below 700 K, and the most likely defects involved are V
. A coherent picture, however, has yet to be found because, if the observation of highly correlated motions seems in accordance with the occurrence of V
clustering, we have not found clear signs of the dissolution of such hypothetical clusters at high temperature in these relaxation peaks.
6. Conclusions
We presented a survey of the information that is possible to obtain by anelastic spectroscopy, possibly combined with the dielectric one, on perovskites used as materials for energy conversion and storage. From the anelastic and dielectric spectra measured versus temperature at different frequencies it is possible to analytically study the single steps involved in the ionic migration and clustering, thanks to the fact that each process has a characteristic frequency that, at the temperature at which it matches the measuring angular frequency, produces a peak in the anelastic and dielectric loss. In this manner it is shown that even the diffusion of O vacancies at high dilution, %, in the simple cubic SrTiO is far from the diffusion of dispersed isolated vacancies, but involves pairing and formation of larger complexes, possibly longer chains.
It is clear that a knowledge of this type is necessary for improving the properties of ionic conductors, but the realistic cases of solid electrolytes for fuel cells, highly doped with acceptors in order to be made oxide or proton conductors, are predictably much more complicated than SrTiO. From the large amount of information contained in the anelastic and dielectric spectra of such materials only a part can be interpreted in relatively direct manner, and much remains to be done. In any case, the anelastic spectroscopy proves very useful because it provides a cleaner picture than the dielectric spectroscopy of the ionic motions, without the contribution of the electronic conductivity.
In addition to diffusive processes, the anelastic and dielectric spectra, especially the real parts, contain information on phase transitions. The structural phase transitions also have to be studied, since they mechanically damage the material under repeated thermal cycles and can adversely affect the ionic mobilities. The case of BaCeYO is discussed, where several tiltings of the O octahedra occur during cooling from the cubic phase existing at >1200 K. These structural transitions are also connected to the hydration/outgassing level of the material; for example the transition between the rhombohedral and orthorhombic phases can shift by more than 250 K passing from the hydrated to the outgassed state, and a heuristic interpretation of this fact is provided.
Finally, the effect of repeated transitions between the ferroelectric and antiferroelectric states and aging during their coexistence are studied in PZT. Exceptionally large softenings are observed under cycling and aging, which however are fully recoverable after mild annealings. Here also there seems to be a connection with the mobility and clustering of O vacancies at the walls between AFE and FE phases, which are proposed to be at the origin of the observed phenomena.

