1. Introduction
Out-of-stock (OOS) events occur when a product is unavailable on shelf for customer purchase. This incident has potentially negative implications for retailers and manufacturers. In fact, when a shopper is faced with an OOS situation, he chooses an alternative action since he cannot purchase the product he desires. In an OOS situation, the consumer generally decides to either purchase a product of another brand, change stores, delay the purchase, or cancel the purchase [
1]. These choices are strictly related to the product loyalty and/or the brand loyalty causing loss of sales for both the retailer and the manufacturer. For this phenomenon, an industry body, Efficient Consumer Response (ECR) establishes the industry has a loss of Euro 4 billion each year [
2]. Therefore, the risk of the manufacturers is greater than the retailers since the majority of customers are willing to substitute a different brand or stocking keeping unit (SKU) when faced with an OOS situation. Certainly, it is important for brands that their product is available on the shelf whenever the store is open, since it is very difficult to know when the product is purchased.
For about 50 years, a lot of works in academia and industry have dealt with the OOS problem [
3,
4]. OOS has been studied considering three different approaches: the extent [
2,
5], the consumer responses [
1,
6] and the logistical issue [
7]. In this work, we focus the attention on OOS extent that measures average OOS levels.
The traditional definition of OOS had a limitation since it did not consider the measurement of time related variables. The OOS has been defined as percentage of SKU in a category not available on shelf for consumer purchase [
2,
5]. Recently, the wireless technology has allowed overcoming time limitations, letting us know the exact moment the product is OOS, its duration and the exact moment when the product was replenished on shelf. Therefore, the introduction of time variable introduces a new definition of OOS related to time: OOS is the percentage of store opening time per day in which consumers would encounter an OOS in a category. Because establishing OOS events in moments of the day, days of the week and the number of facings is a very important aspect for the industry, this paper aims to explore OOS for day of the week, time of the day and number of facings.
The variable OOS by day of the week was analyzed in some studies [
2,
5,
8]. According Andersen and Gruen
et al., Monday and Sunday had high value of OOS; in particular, Monday had the highest OOS level. Instead, according to ECR Europe, the highest value of OOS occurs on Friday, followed by Saturday and Tuesday. These differences depend on the retail stores opening in a different country. For all studies, the days with the greatest value of OOS are near weekends. Moreover, some studies [
5,
8] have examined OOS by time of day, so the variation of OOS during the day. They all suggest that the peak of OOS occurs in the afternoon; the peak increases as day progresses. The number of product facing refers to the number of items, per SKU, seen on shelf from a perspective of consumers [
9]. The space available on the shelf represents a fundamental aspect in the distribution of the product, so the number of facings must be considered because it directly affects the likelihood that a product will become OOS. This happens since by increasing the number of facings, the probability of an OOS occurring decreases because more items must be sold. The number of facings influences the purchase of a particular brand and the product having a high impact on consumer attention. Typically, big brands have a larger number of facings than small brands, because the big brands replenish retail stores more frequently, reducing OOS events.
2. OOS Extent
As said, previous studies had not considered time variables to conceptualize OOS events. This was strictly related to measurement systems not able to produce continuously real-time measurement of OOS. Looking at the methods that identify OOS events, note that they have limitations by providing only a snapshot of OOS events and introducing human inaccuracy. In the present research, we introduce a measurement system that takes into account time variable, knowing in real-time OOS events and then promptly operate to solve the problem. The new system allows calculating the OOS taking into account the time variable, by applying a new metric for the OOS detection systems.
Physical audits have been widely used both in industry [
5,
8] and academia [
7], as benchmarks to evaluate the availability of products on shelves. During the physical audit, a group of auditors execute programmed visits in the store and registers which products are not on shelves. During the physical audit, a group of auditors executes pre-planned visits in the store and registers that products are not on shelves. Just a sample of products is chosen for audit, this choice depends on the representativeness of products and the policy of store: all this affects the results and their generalization. This method has some limitations since the observations are recorded only at a specific moment of a particular day, providing a snapshot of the OOS events and not a real-time measurement [
5]. The number of audits and the frequency at which they occur vary significantly between studies, thus impacting on the precision of the measure. Clearly, increasing number and frequency, the OOS measure becomes more careful and more representative of the real situation; however drastically increasing the costs. Although the increased frequency of audits determines a full picture of the OOS situation, it is not able to provide a continuous measure of OOS, since it is not known whether a product is still in stock, has been replenished and/or has become OOS.
Another OOS measure is to obtain information from customers, interviewing them directly about their experiences of availability of products. Generally, interviews and surveys occur on the store asking customers if they found all the products that they desired to purchase and so if they were available on shelf. This approach lacks objectivity, since the consumer refers to his favourite item, not providing information about other items in the category. So, it depends on the perception of consumer and his availability. Consumers will have to report to the interviewer their approach to the purchase, remembering
a-posteriori their behaviour. Nenycz-Thiel
et al. have demonstrated the inaccuracy of data obtained during the interviews and the surveys [
10]. The values of OOS produced from research that use consumer interviews or surveys are the percentage of consumers who declared that their favoured product is not on shelf, rather than the percentage of SKUs not available on shelf at the time of purchase.
Some techniques for consumer interviews include also asking store staff and managers questions about OOS levels. Since these surveys can be effective at measuring staff attitudes to OOS situations, they are flawed in that they rely on human knowledge and recall. For instance, a survey asking staff to estimate OOS levels assumes that team members know enough about inventory and ordering processes and that they remember this information and can synthesize it into a single OOS measure.
This paper wants to overcome limitations described in the previous methods by considering a continuous and in real-time measure of OOS events. In fact, the system proposed is automatic and wireless reducing the limitations deriving from physical audits, consumer and staff interviews. So, the system can measure the exact moment the product is no longer available on shelf, the exact moment the product is back on shelf and the duration in minutes of OOS. The main goal of this measure is to give back to the retailer or producers an exact measure of shelf-out-of-stock to consider, with real data coming from a real store, how many hours products are not available for shoppers.
The system described is the automatic Shelf Detector system designed in cooperation between Università Politecnica delle Marche and Grottini Lab that overcomes all the discussed issues providing real data in real time, automatically grabbing data from shelves. The system is installed and functioning in six countries, in 50 stores and detects OOS of 4000 products performing a continuous monitoring. Preliminary studies in intelligent retail environments allowed to test the system [
12,
13,
14], considering also other aspects and applications of this approach in different situations.
3. The Shelf Detector System
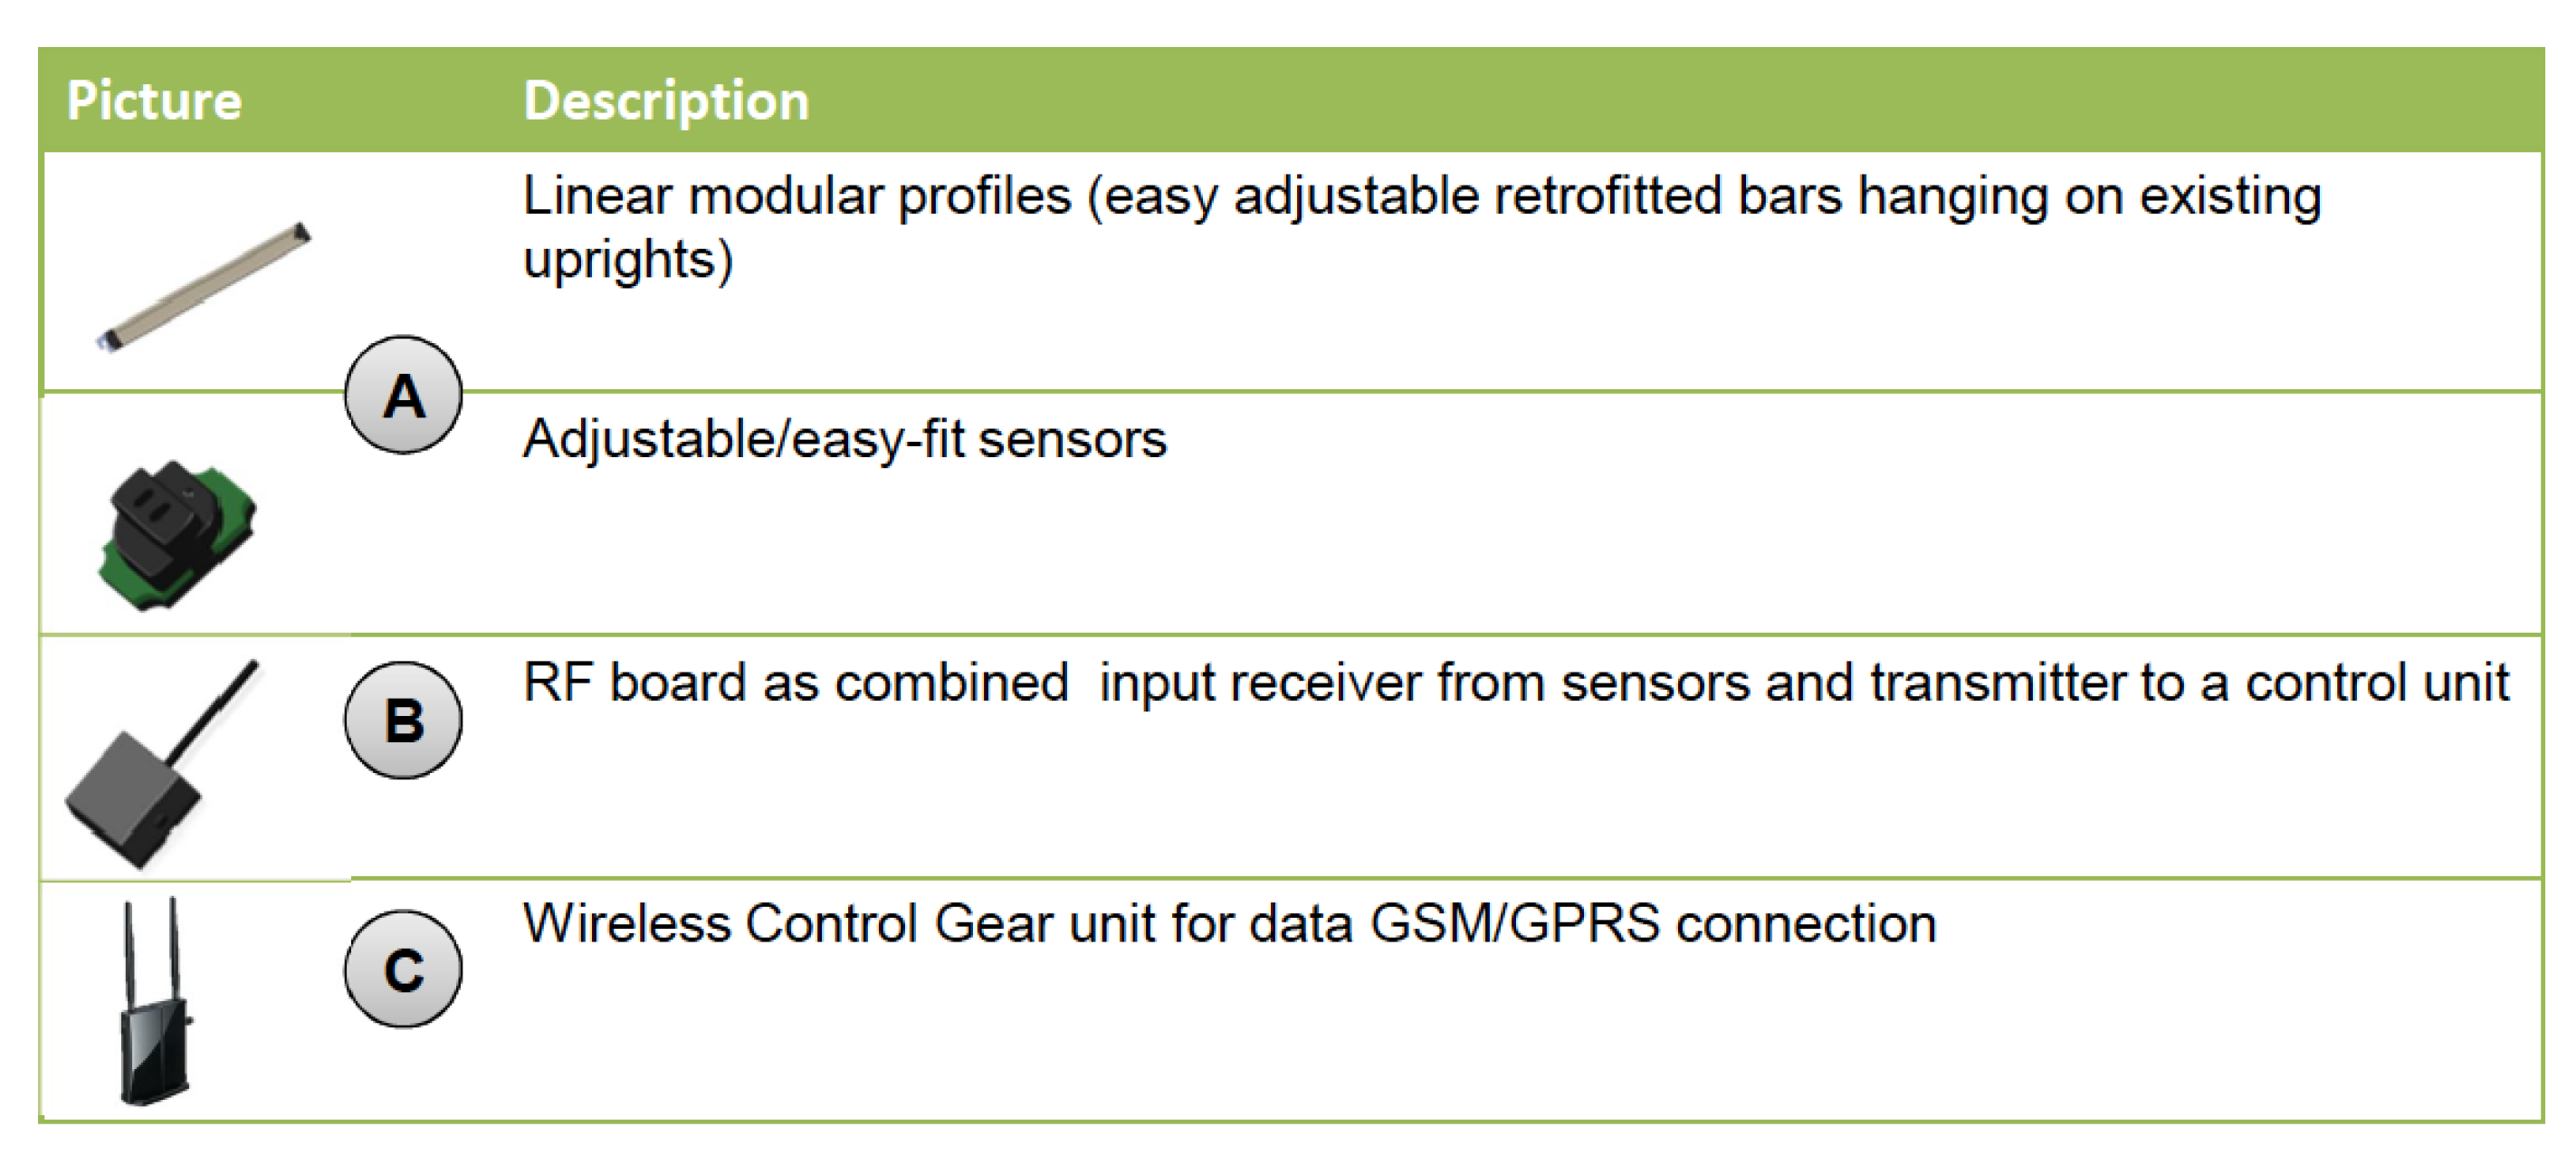
The major barrier to improvement has been the lack of robust, inarguable measures that could provide indisputable evidence and actionable data at a low cost. Shelf Detector (SD) goes on that direction and provides real data on real time using a small battery based sensors on a Wireless Sensors Network to measure on shelf availability in real time. The system provides also insights on all causes described before, so the next section will provide detail on that.
3.2. Shelf Detector Software
Shelf Detector software is the heart of the shelves management system and is totally web based, accessible from anywhere and hosted on a cloud.
It provides a comprehensive set of statistics that will be described below. The system is also tablet compliant (Android, RIM and iOS) allowing the use of the system directly in front of the shelf.
The software provides to the users, according to their level, an amount of different features shortly described below and not only directly joined with the OOS problem, but also devoted to store management.
Admin users can:
access cumulative indicators of the macro performance of stores with OOS;
know the total amount of OOS hours and the performance of every PoS, every shelf and every category;
define store names and features (opening time, number and type of shelves, etc.);
manage a list of mail and mobile numbers for OOS real time notifications;
edit a product database by brand and product category;
manage product dimensions for restocking purposes (even with a box restocking logic);
define a planogram with evidence of monitored products and upgrade it any time;
edit any OOS to correct or fix them in case of false refilling;
download raw data about OOS and cumulated data;
check facings never consumed (to start planning an improved planogram).
Store managers or other users can:
access cumulative indicators of the macro performance of their store;
know the total amount of OOS hours in the store and the performance of every shelf and product category;
access the complete list of OOS and filter by time and category;
access easy to read weekly statistics to adapt refill time in the store and in the back store;
produce Out-Of-Stock Checklist available for single store;
access full information about OOS (time, number of facing, refill time, etc.);
access the list of out of facings for multi facings products;
manage planogram changing every facing and every product to adapt the planogram;
edit a product database by brand and product category.
Cloud computing is the use of computing resources (hardware and software) that are delivered as a service (typically the Internet). End users access cloud-based applications through a web browser or a lightweight desktop or mobile application, while the business software and user’s data are stored on servers at a remote location. Cloud computing relies on sharing of resources to achieve coherence and economies of scale similar to a utility (like the electricity grid) over a network. The cloud-based implementation is the better way to store data and analyse them. Also, the web based solution is a quicker way to obtain statistic reports and share them.
4. Temporal Metrics and Statistics
The shelf detector system provides useful data to identify continuously in real time OOS events. According to these data, we introduced new measures that take into account time variables. The metrics provided by the European OOS Index [
11] differ from our metrics in the following, since they did not take into account time variables. New parameters extracted from data obtained in real time are:
- (1)
Shelf-out-of-stock rate [%] is the number of hours shelf/facings empty for a SKU, divided by the total number of hours of store opening (expressed as a percentage):
i index indicates a specific SKU.
- (2)
Shelf-out-of-stock by SKU [%] is the number of hours shelf/facings empty for a SKU divided by the total number of hours of shelf-out-of-stock for all SKUs (expressed as a percentage):
n index is the total number of SKU.
- (3)
Shelf-out-of-stock by week day is number of shelf-out-of-stock by week day:
- (4)
Shelf-out-of-stock by hours is the number of shelf-out-of-stock by hours:
- (5)
Refilling performance is refill performance by days and hours;
- (6)
Product availability is a comparison between product availability by day;
- (7)
Number of hours from empty to full is number of hours of empty facings:
- (8)
Average number of hours from empty to full for all incidents:
where index A is the number of accidents.
- (9)
Full Stock Index is the number of hours shelf completely full divided by total store opening time as rate of full stock (all SKUs).
4.1. General Statistics
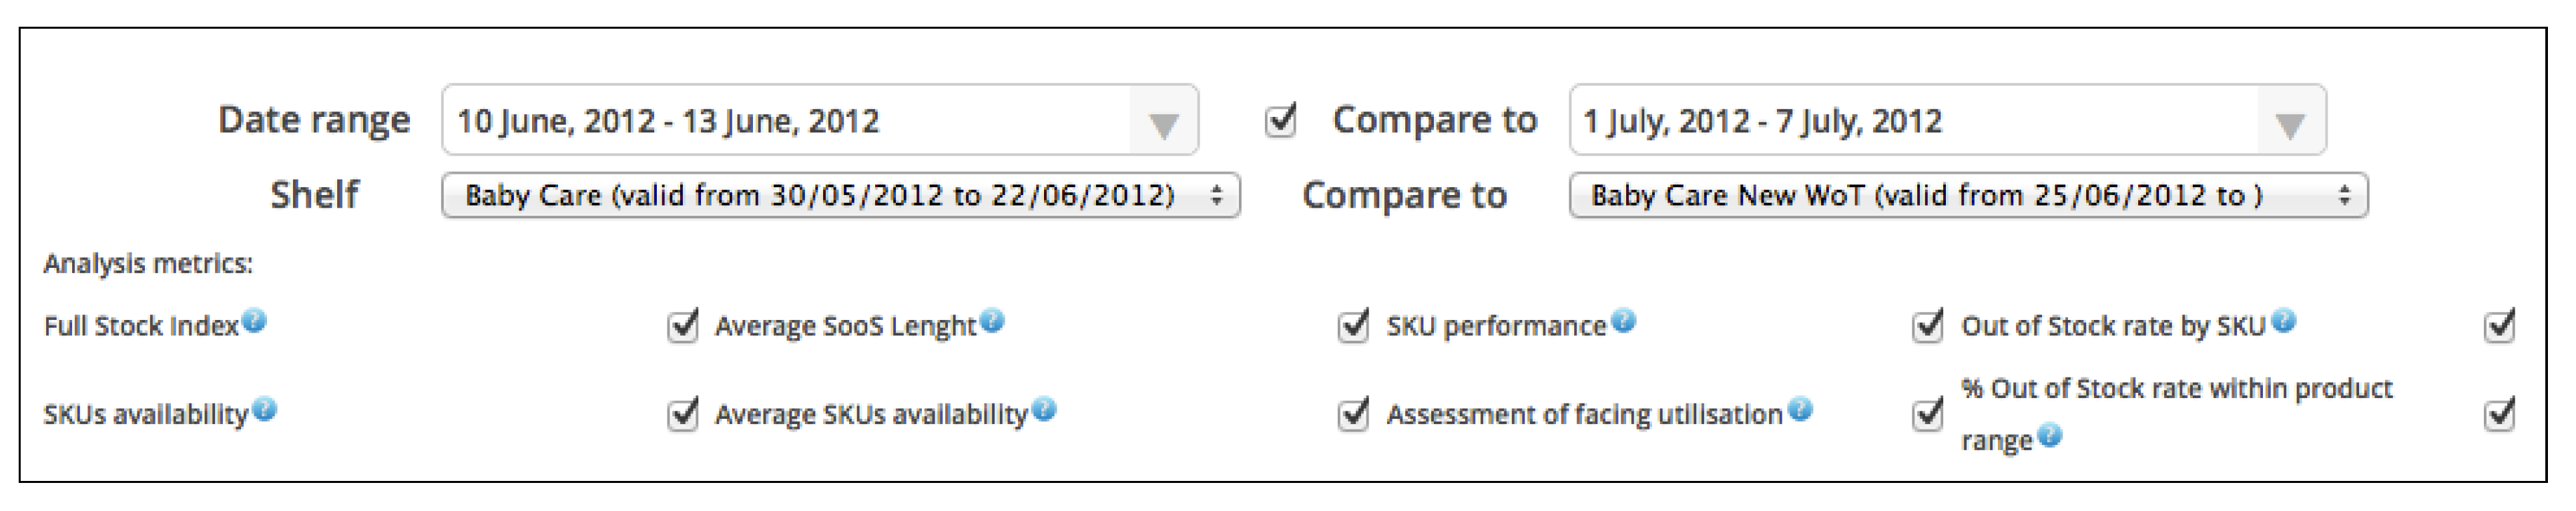
Every report can be configured selecting (
Figure 3) date range, shelf (representing the category) and several analysis metrics (such as for example: full stock index, SKU performance, SKU availability, etc.).
Figure 3.
Example of report with a product of interest.
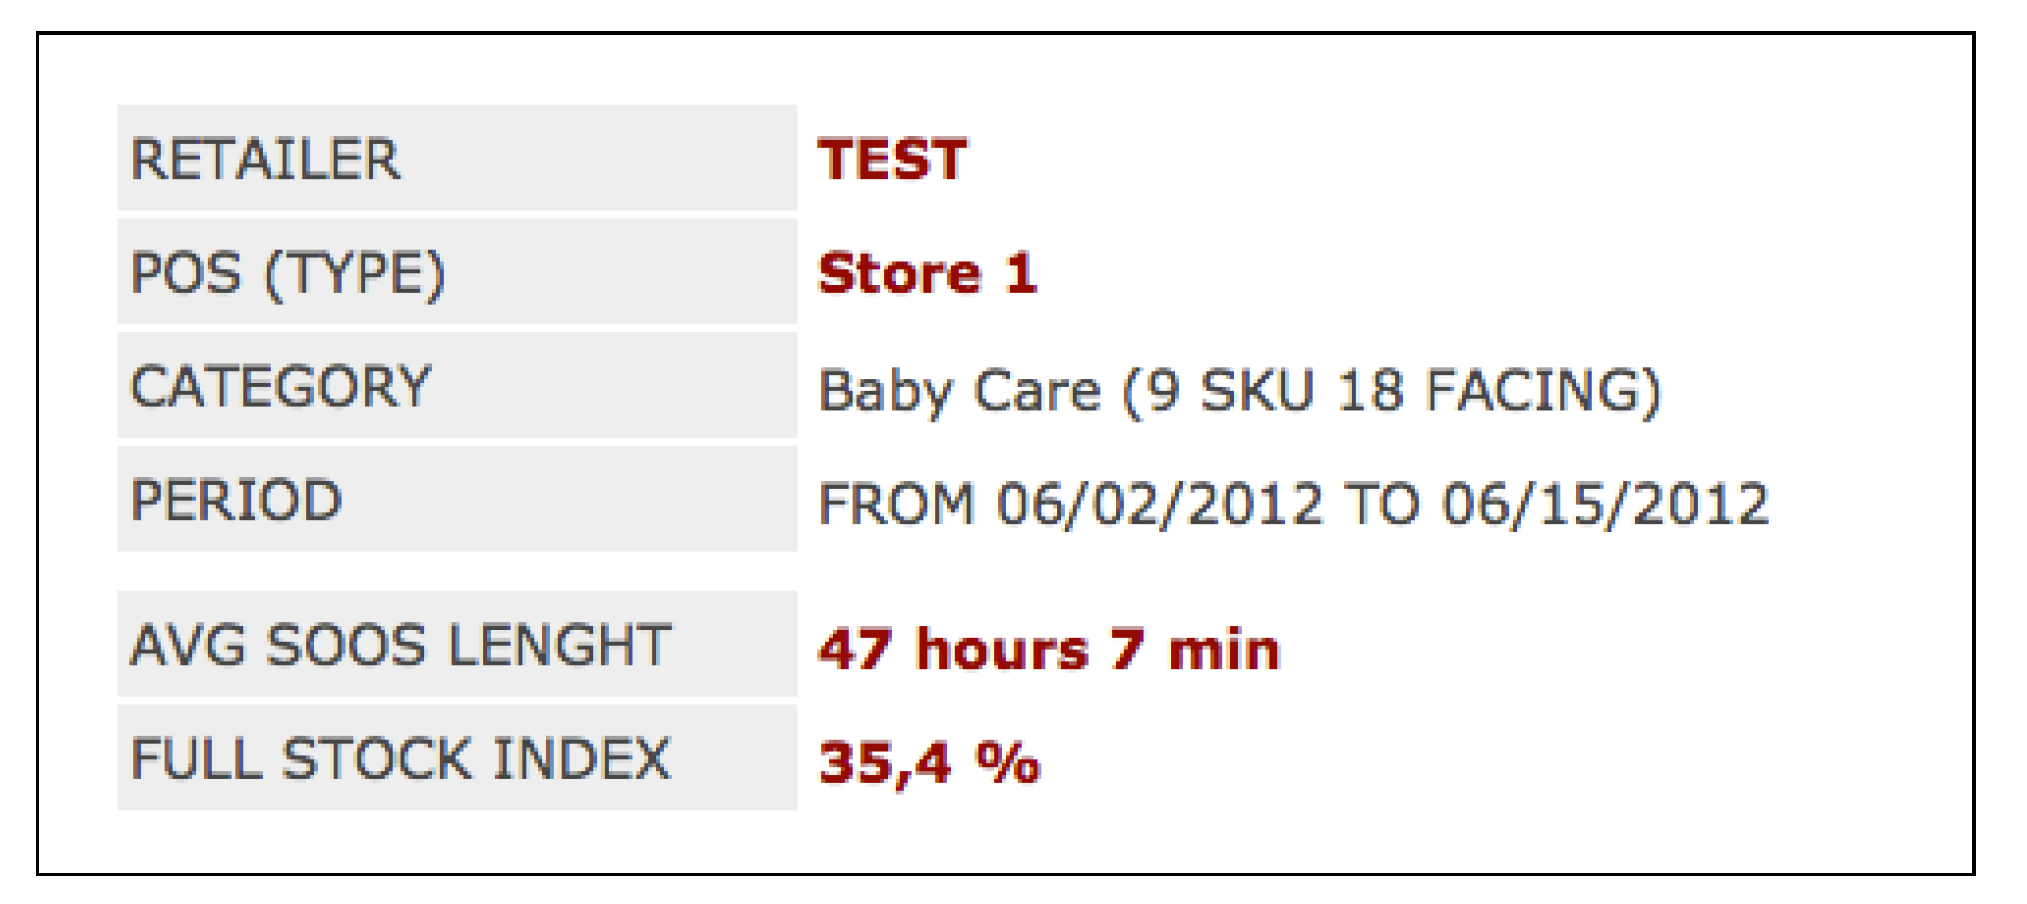
On the basis of the generated report, the following
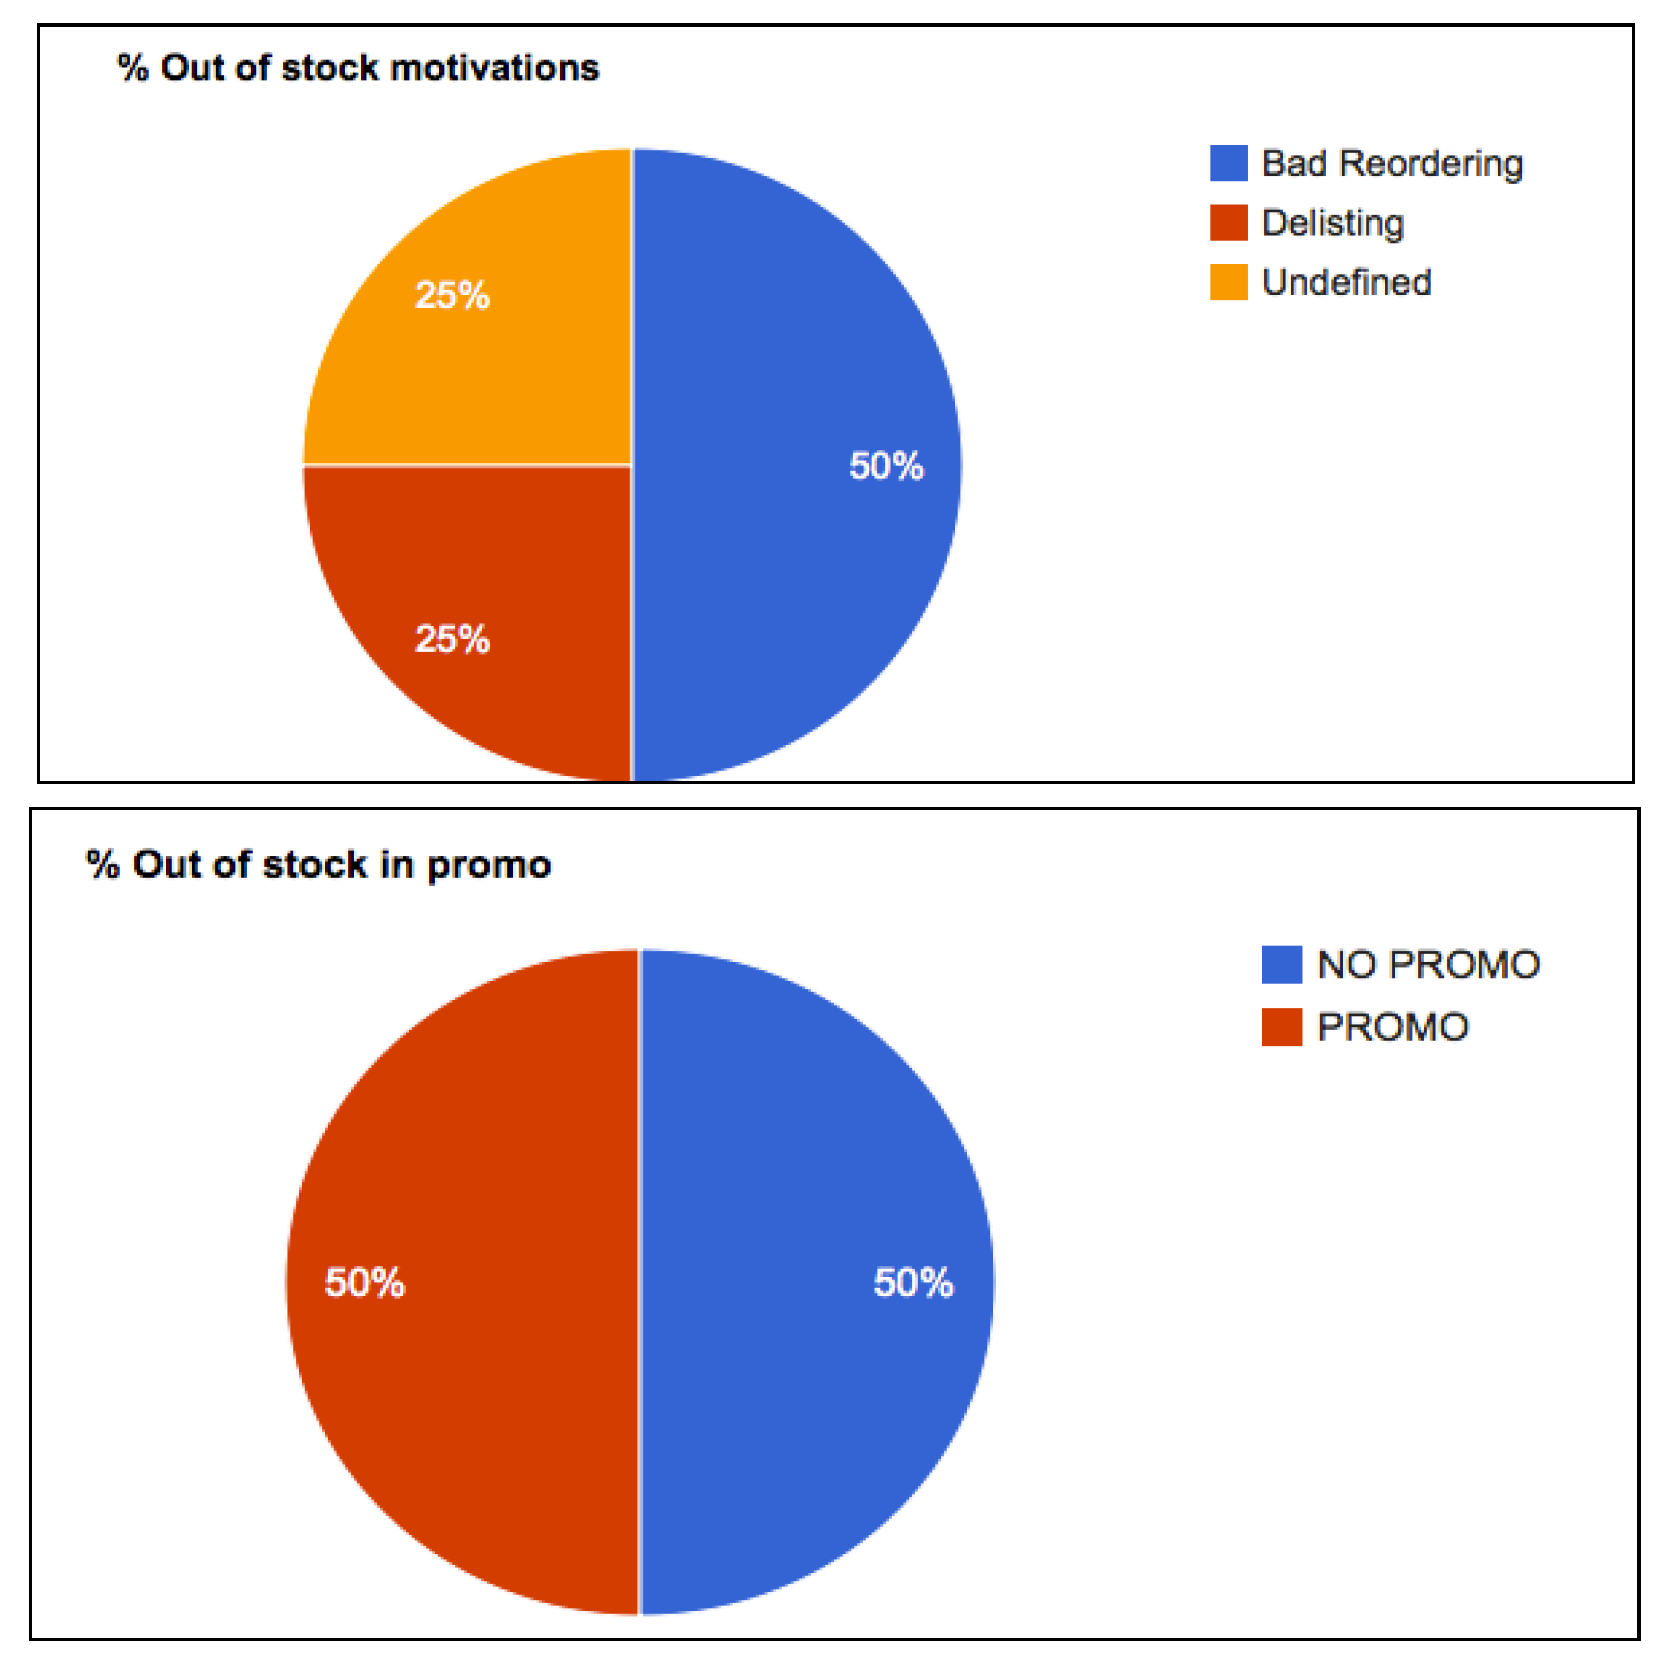
Figure 4 shows the first part of the report and presents some data about the selected product (retailer, store, category and period) and a significant amount of interesting data.
Figure 4.
Particular of the report produced.
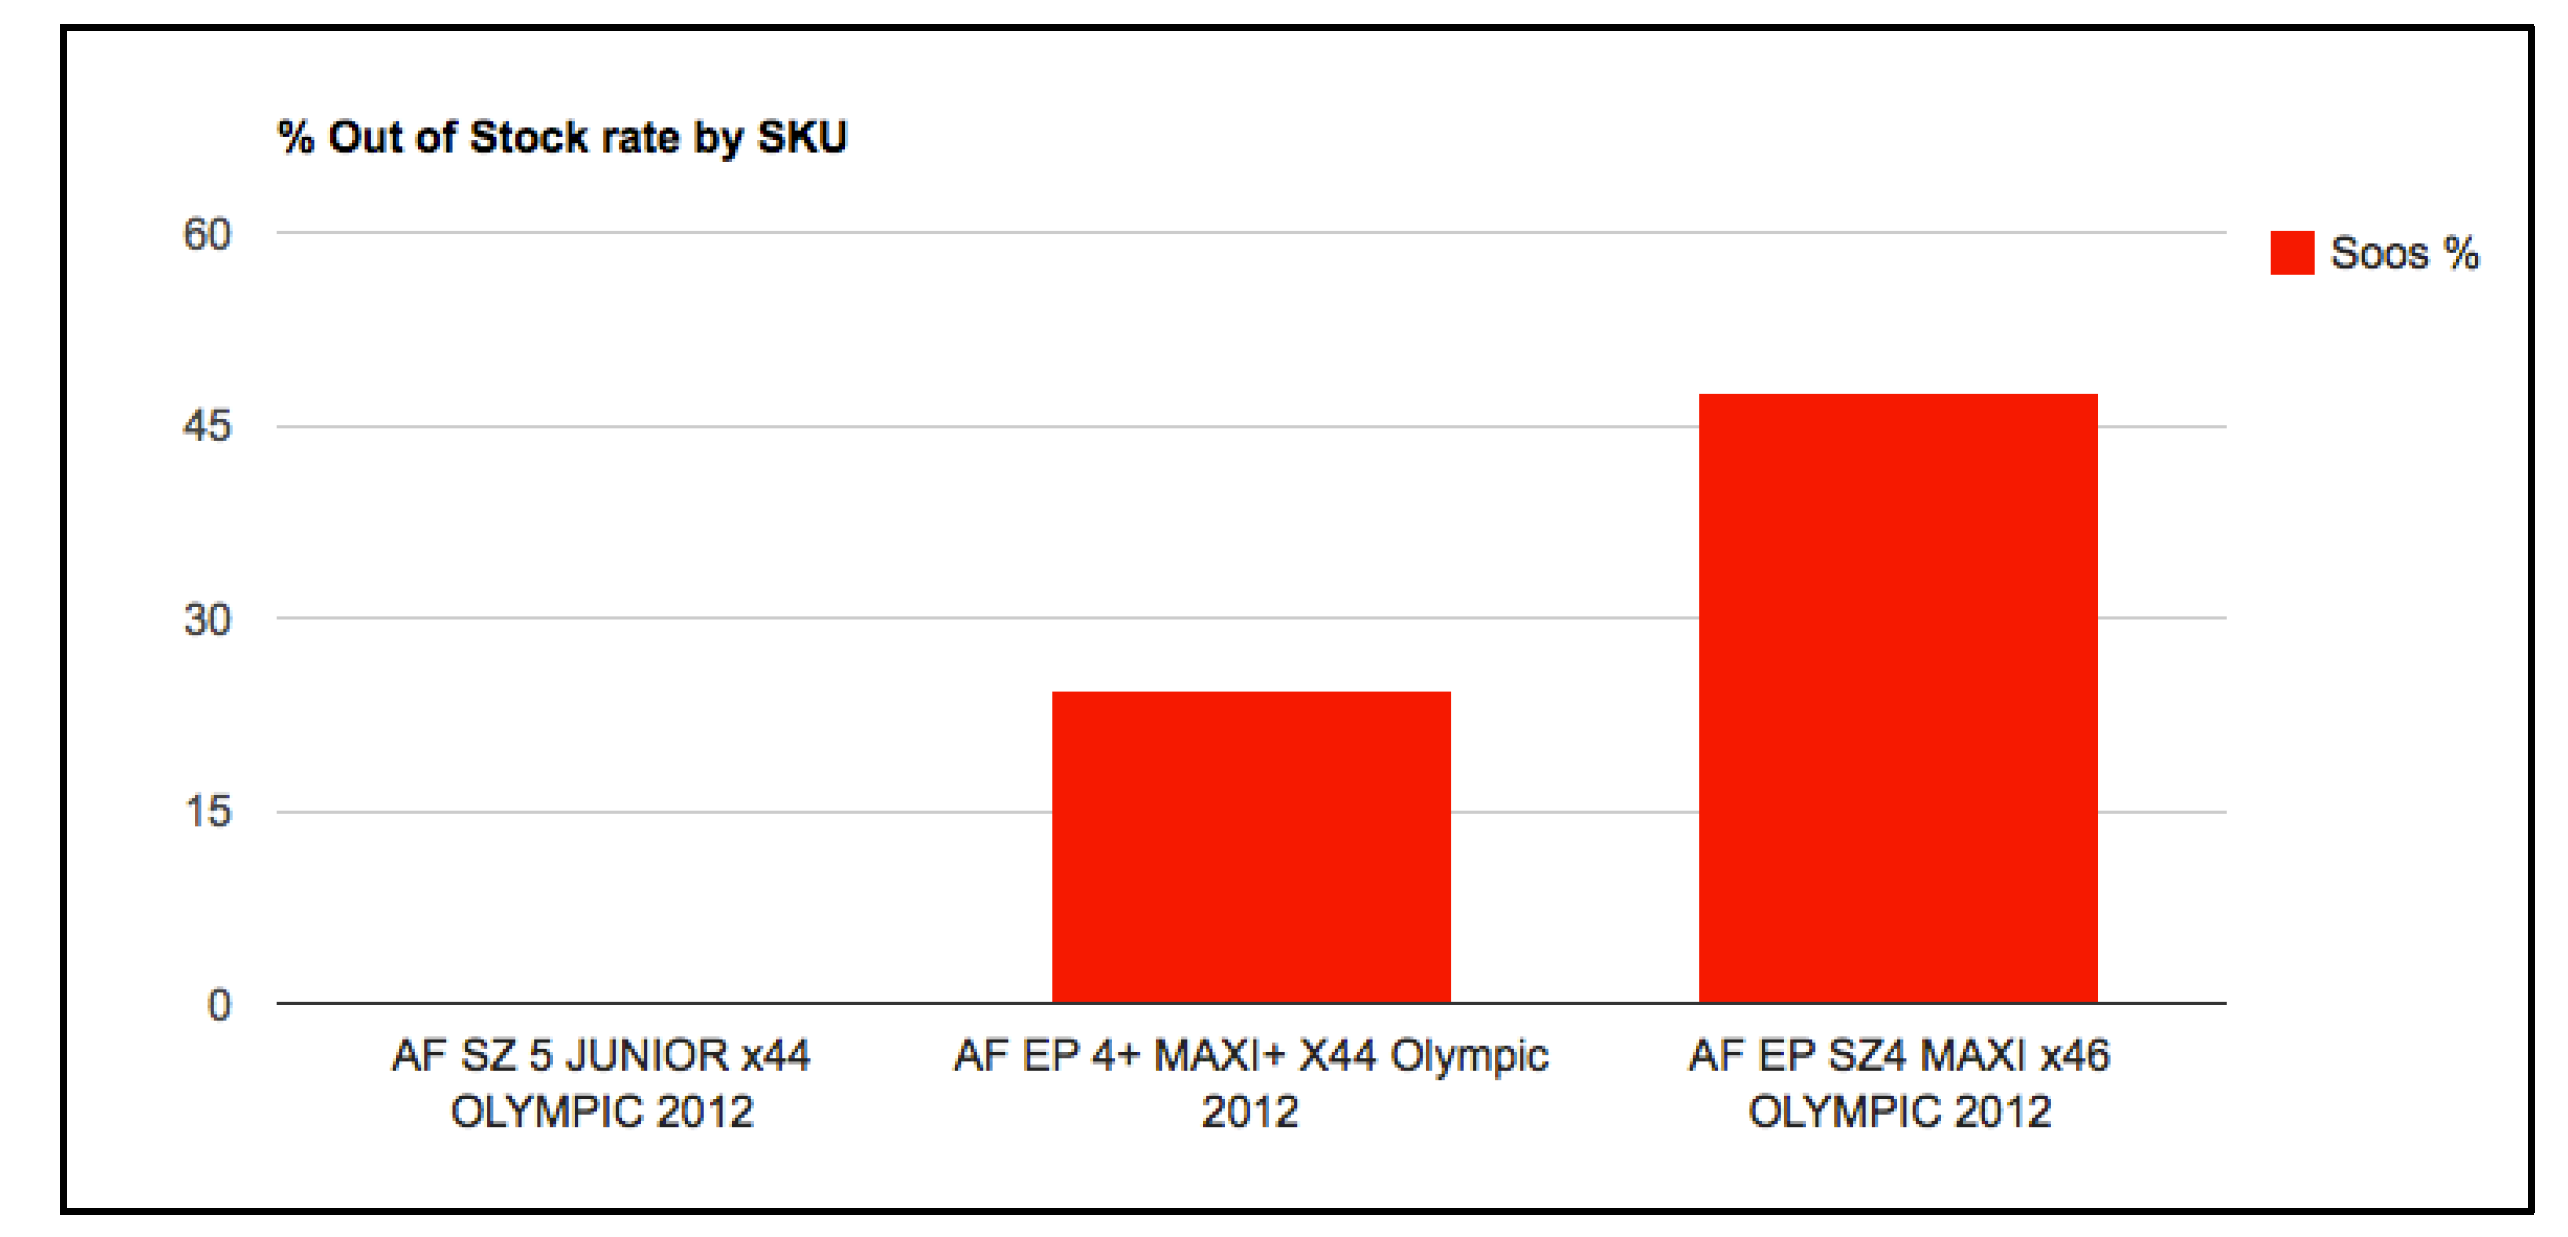
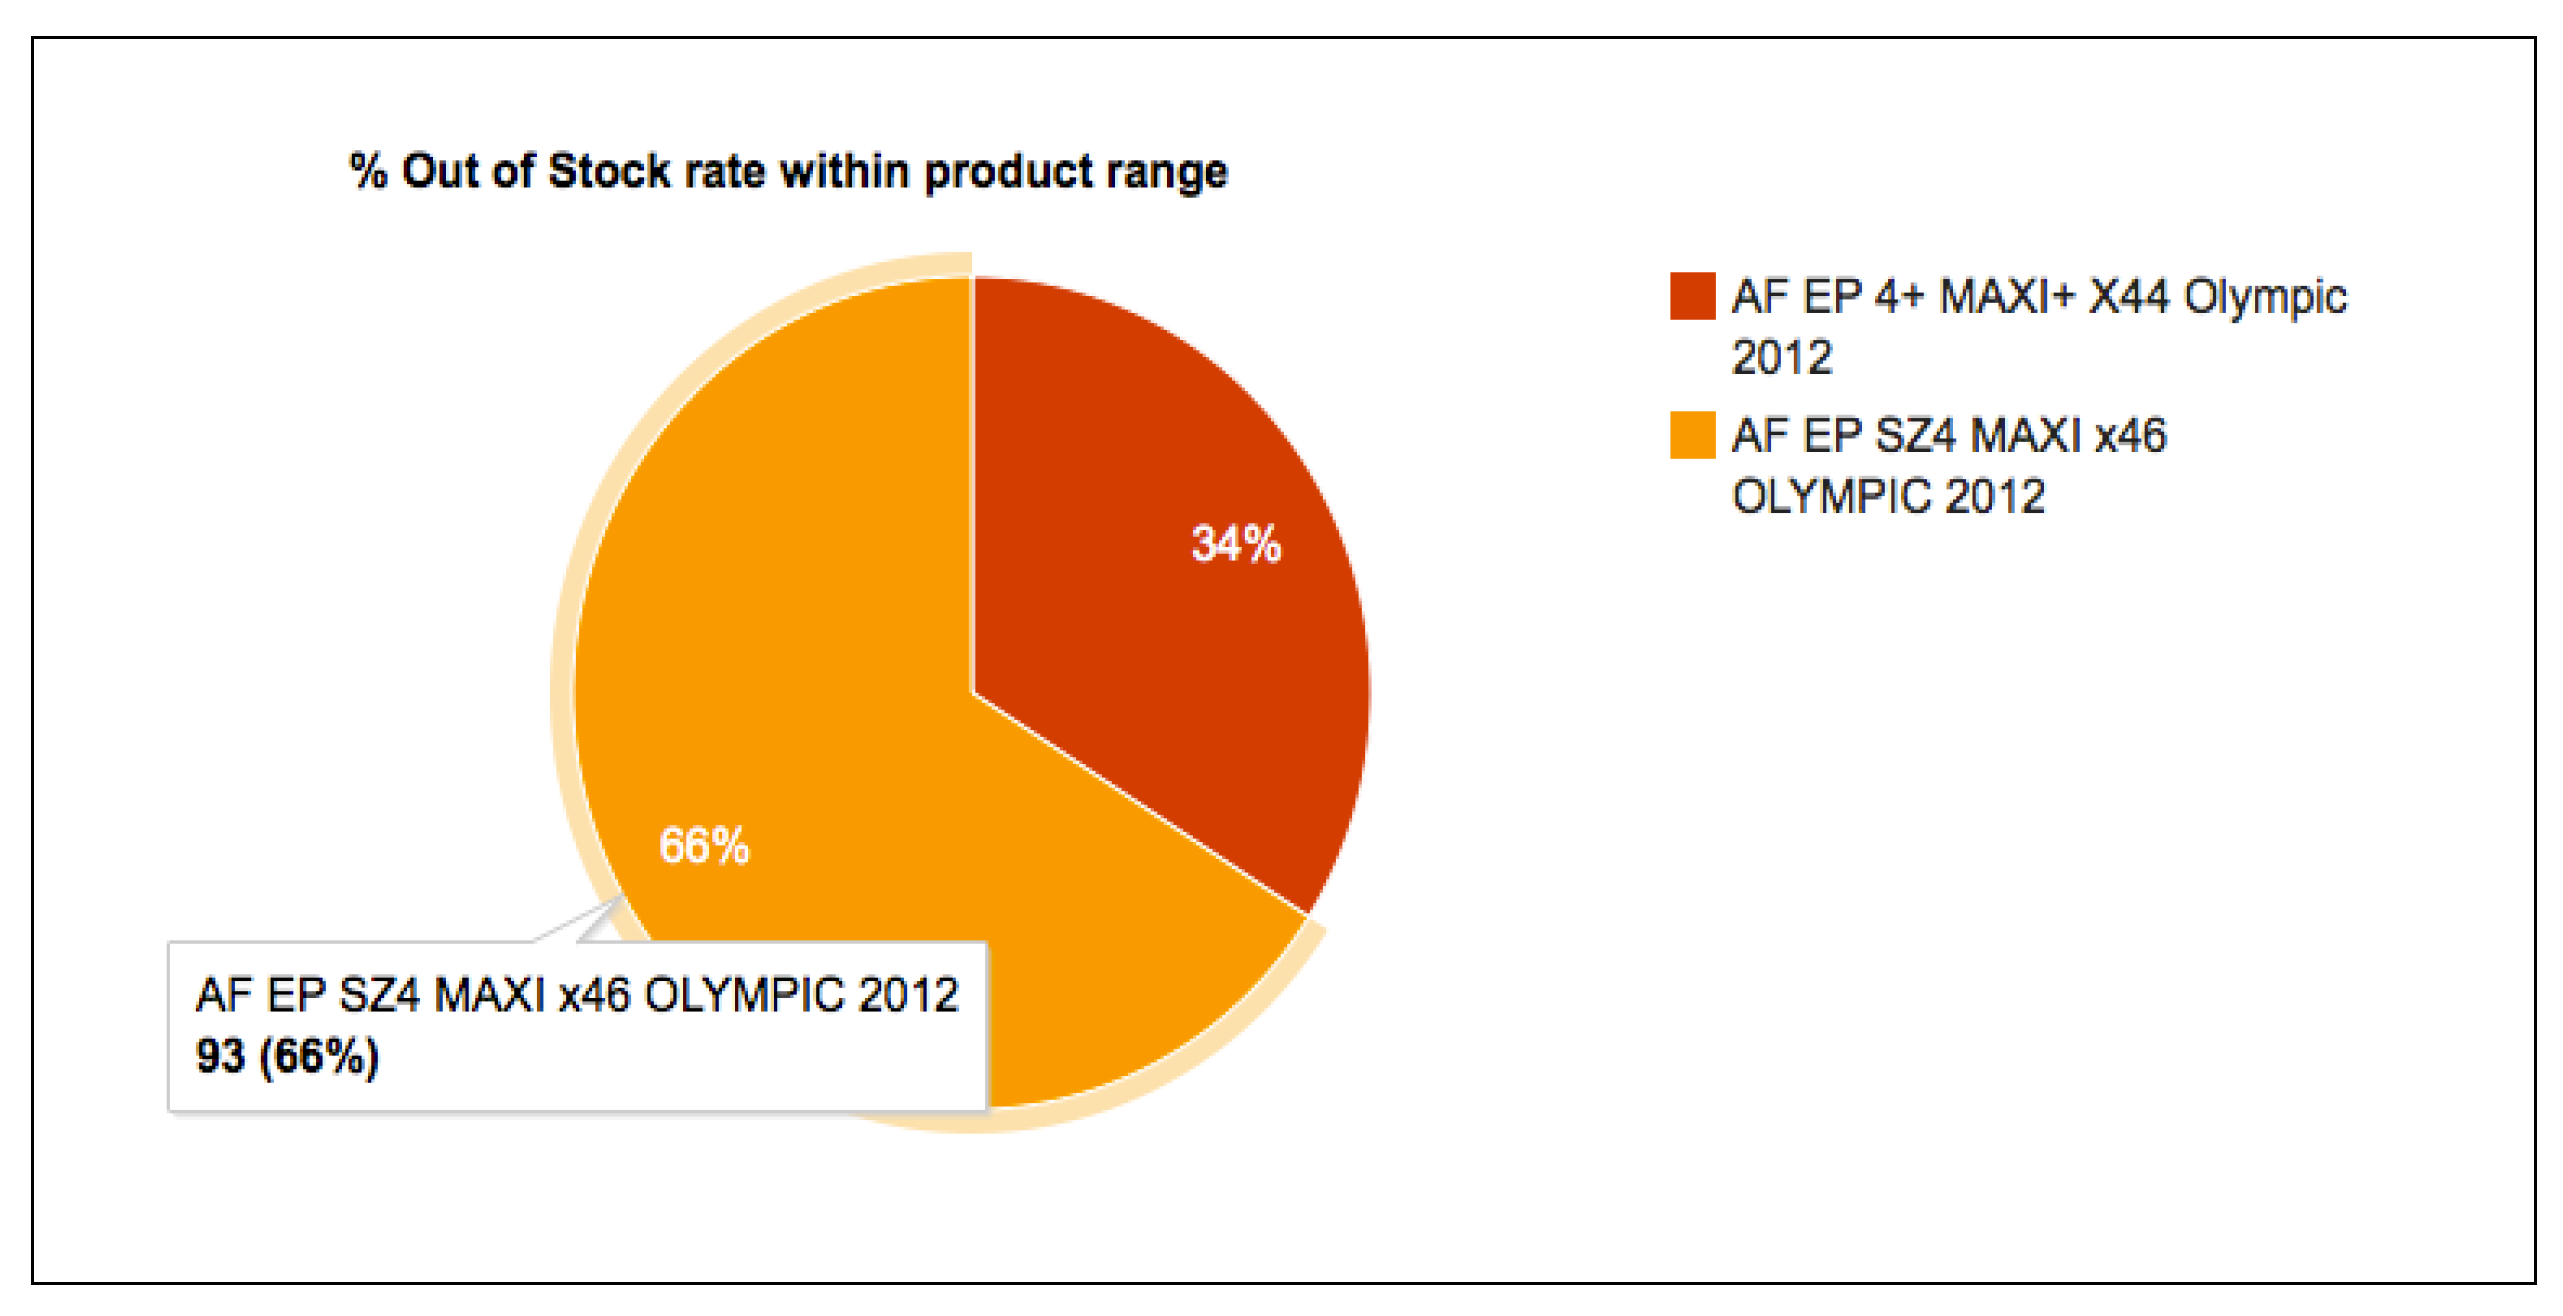
In order to demonstrate the functionality of the SD system, some values of metrics are represented in the figure, as described earlier, referring to a particular product. These (and other) values can be used to evaluate the efficiency of a store in dealing with the out-of-shelf problem.
4.3. Product Availability
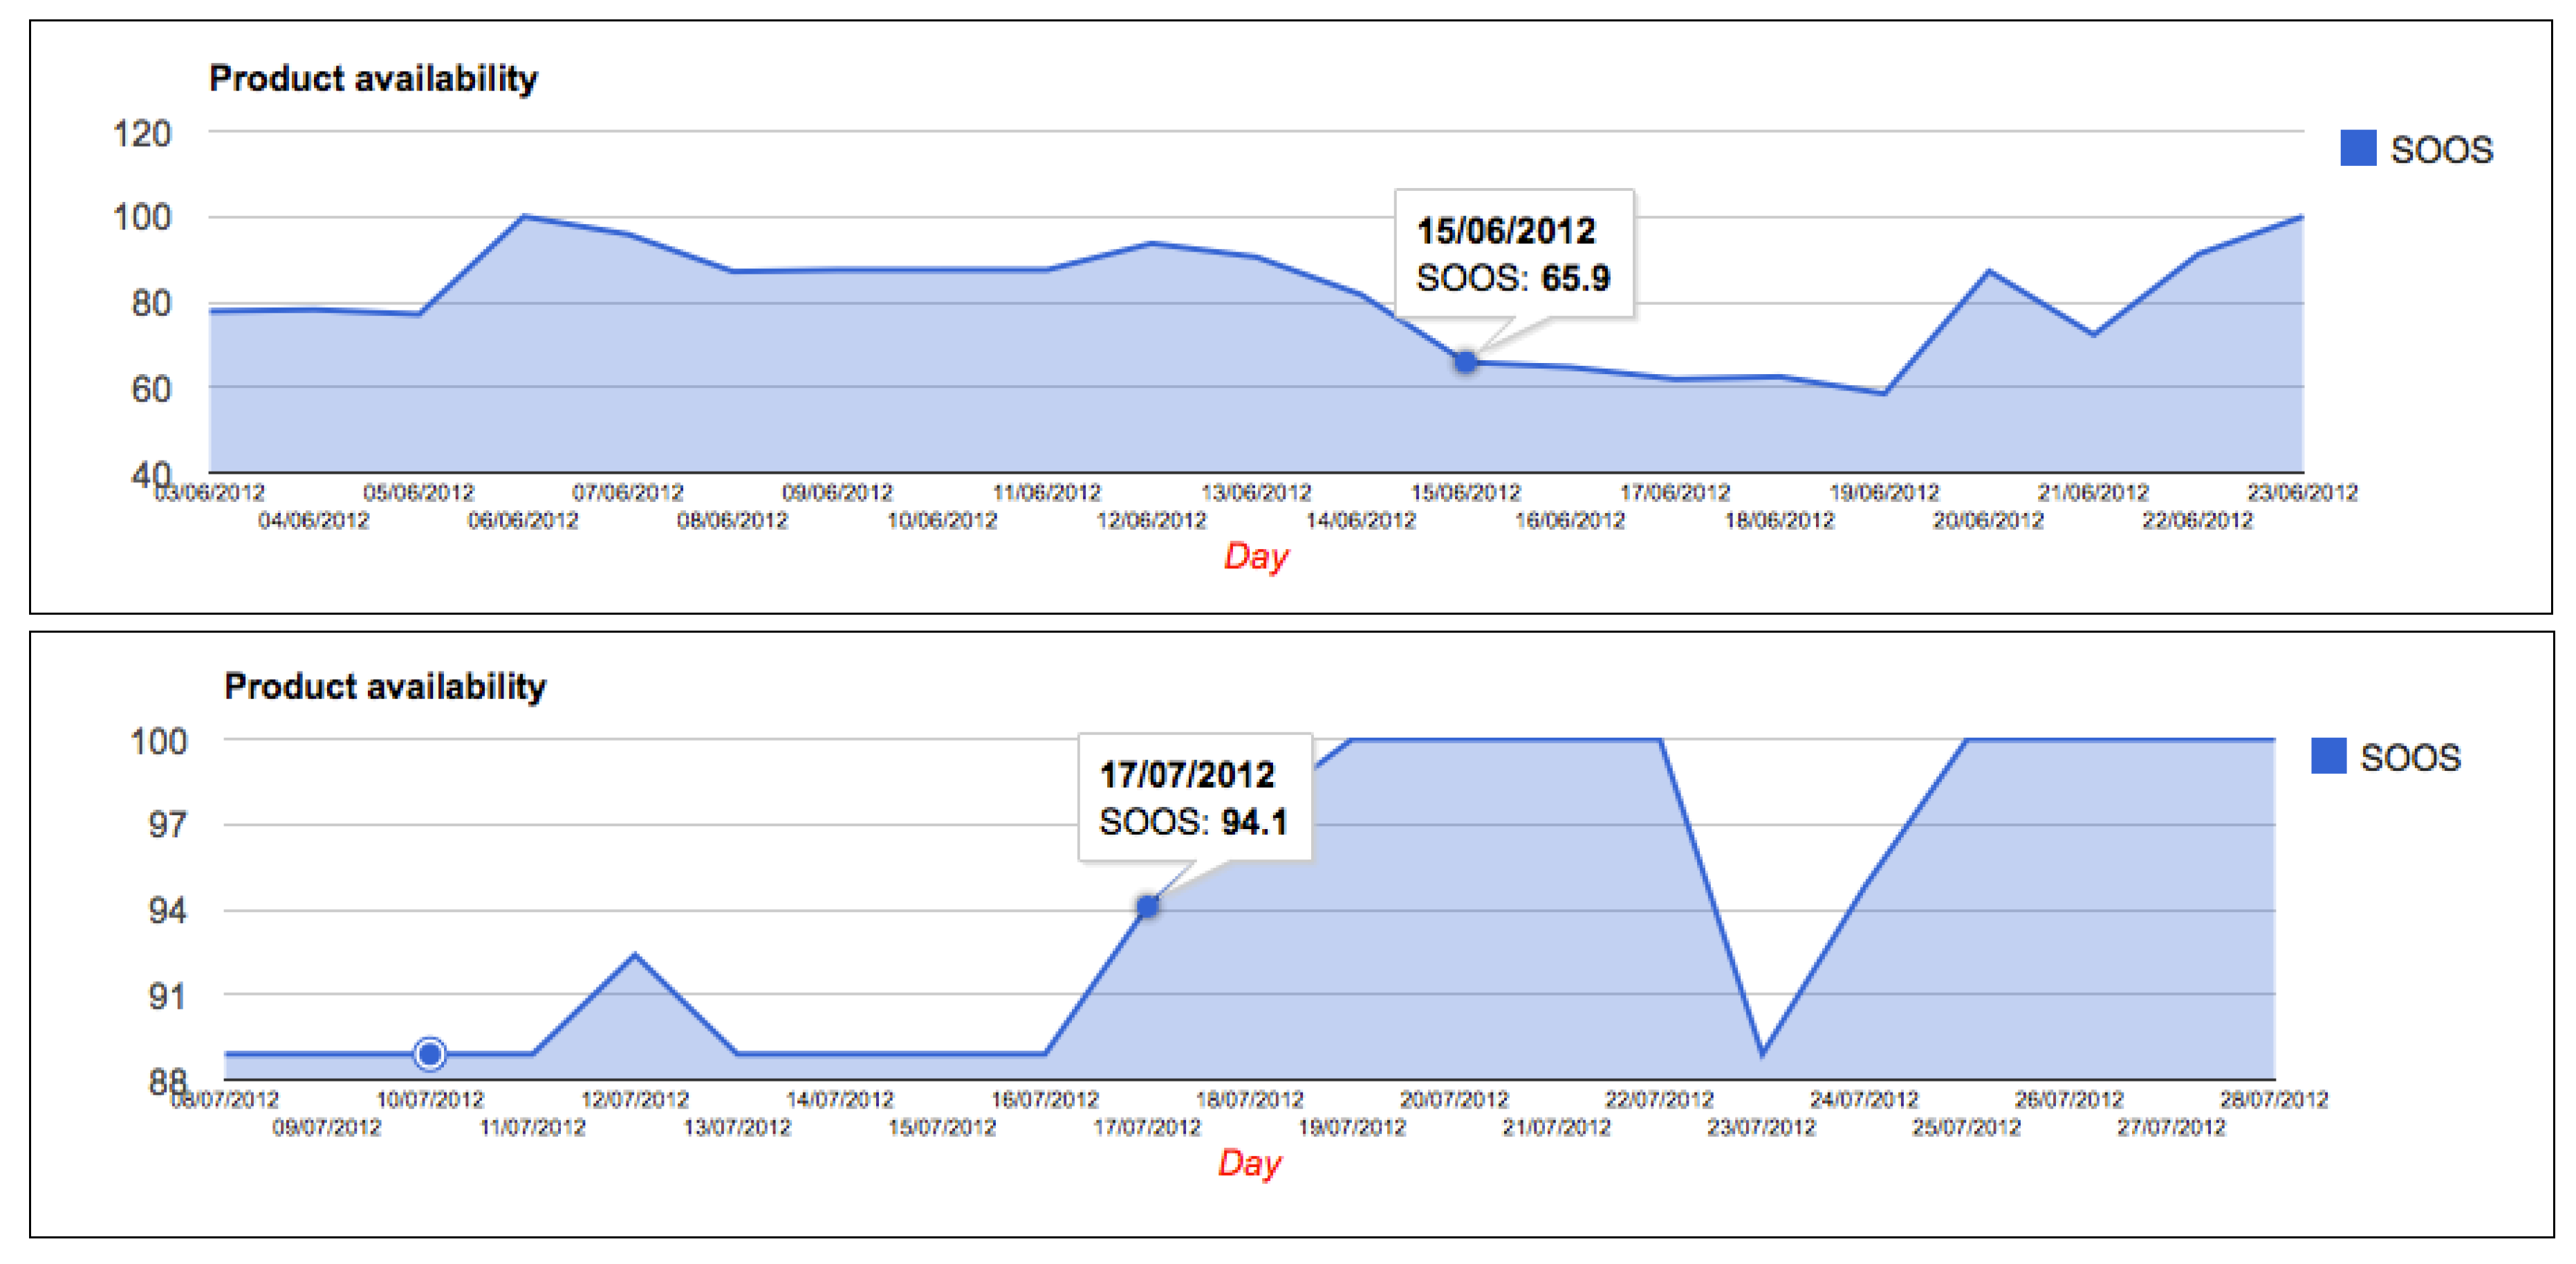
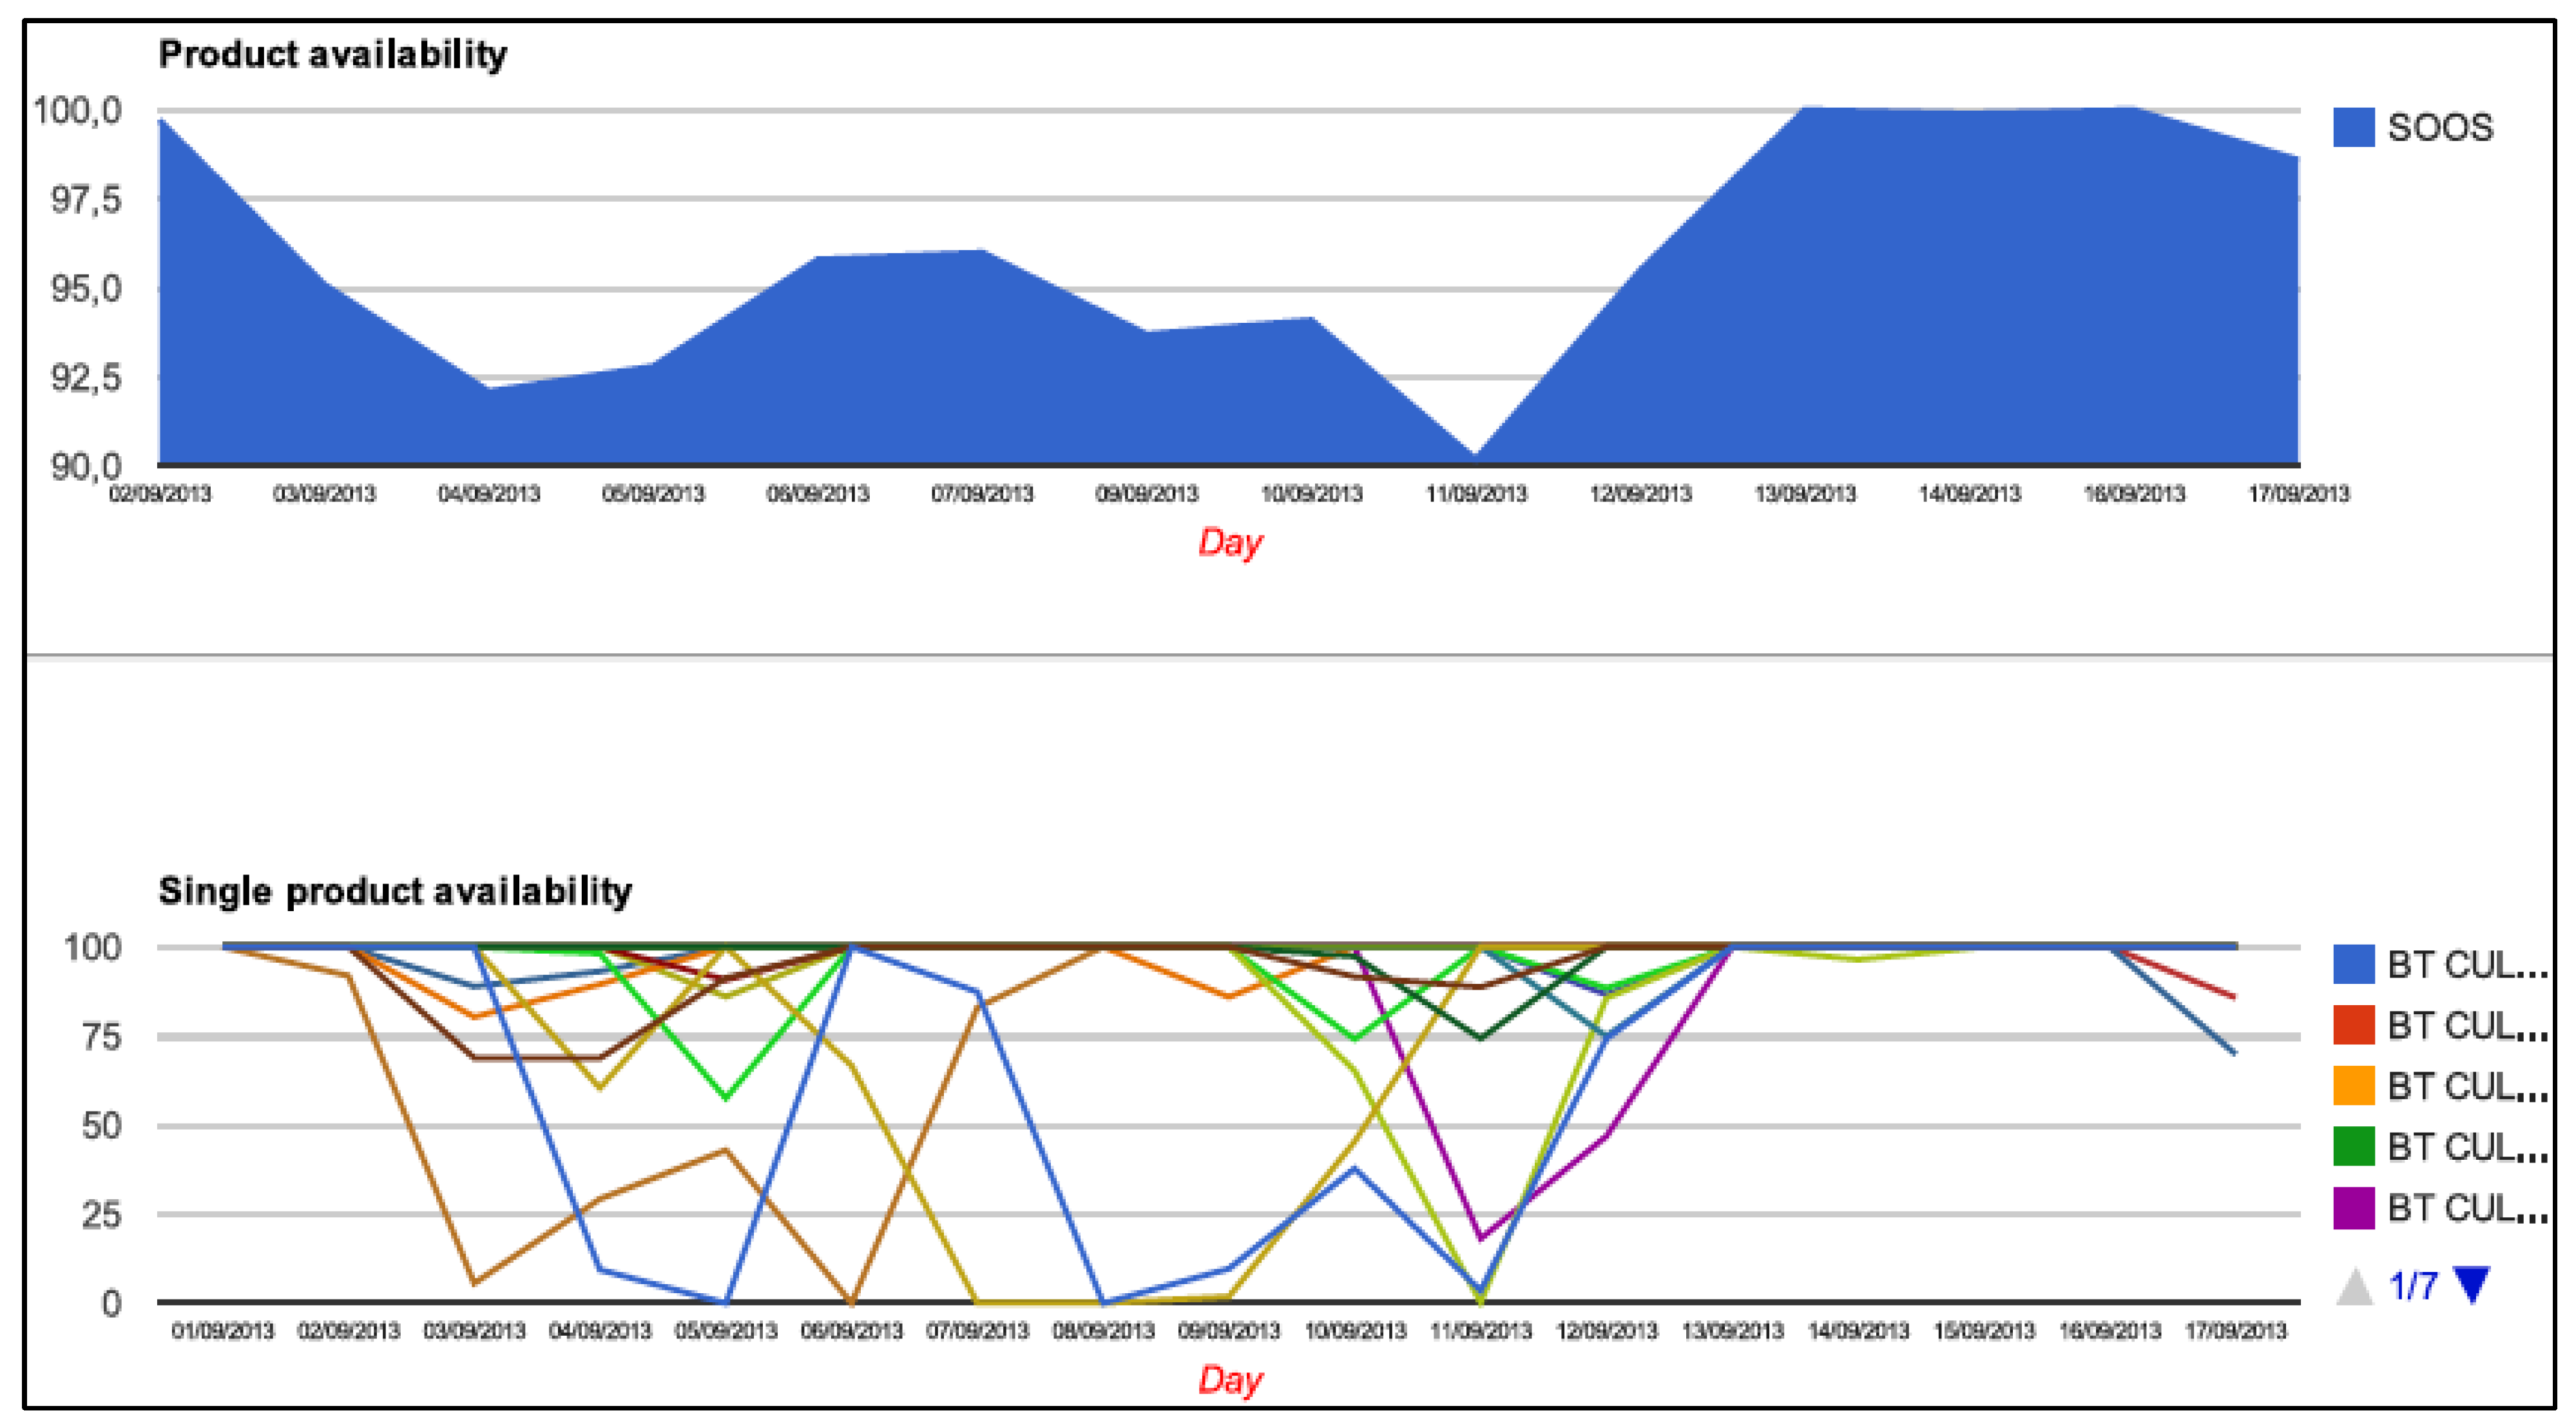
Figure 8 represents a graph that provides an insight to day by day availability over quite a long period (week or month). The graph, as always, is interactive and you can move the mouse on the line to read values. Thanks to this graph, it is possible to know the amount of product available daily and therefore understand why there may be a drop in product levels on special days. Furthermore, it also provides insights as to when replenishment of a product on the shelf occurs.
Figure 8.
Daily availability of a product.
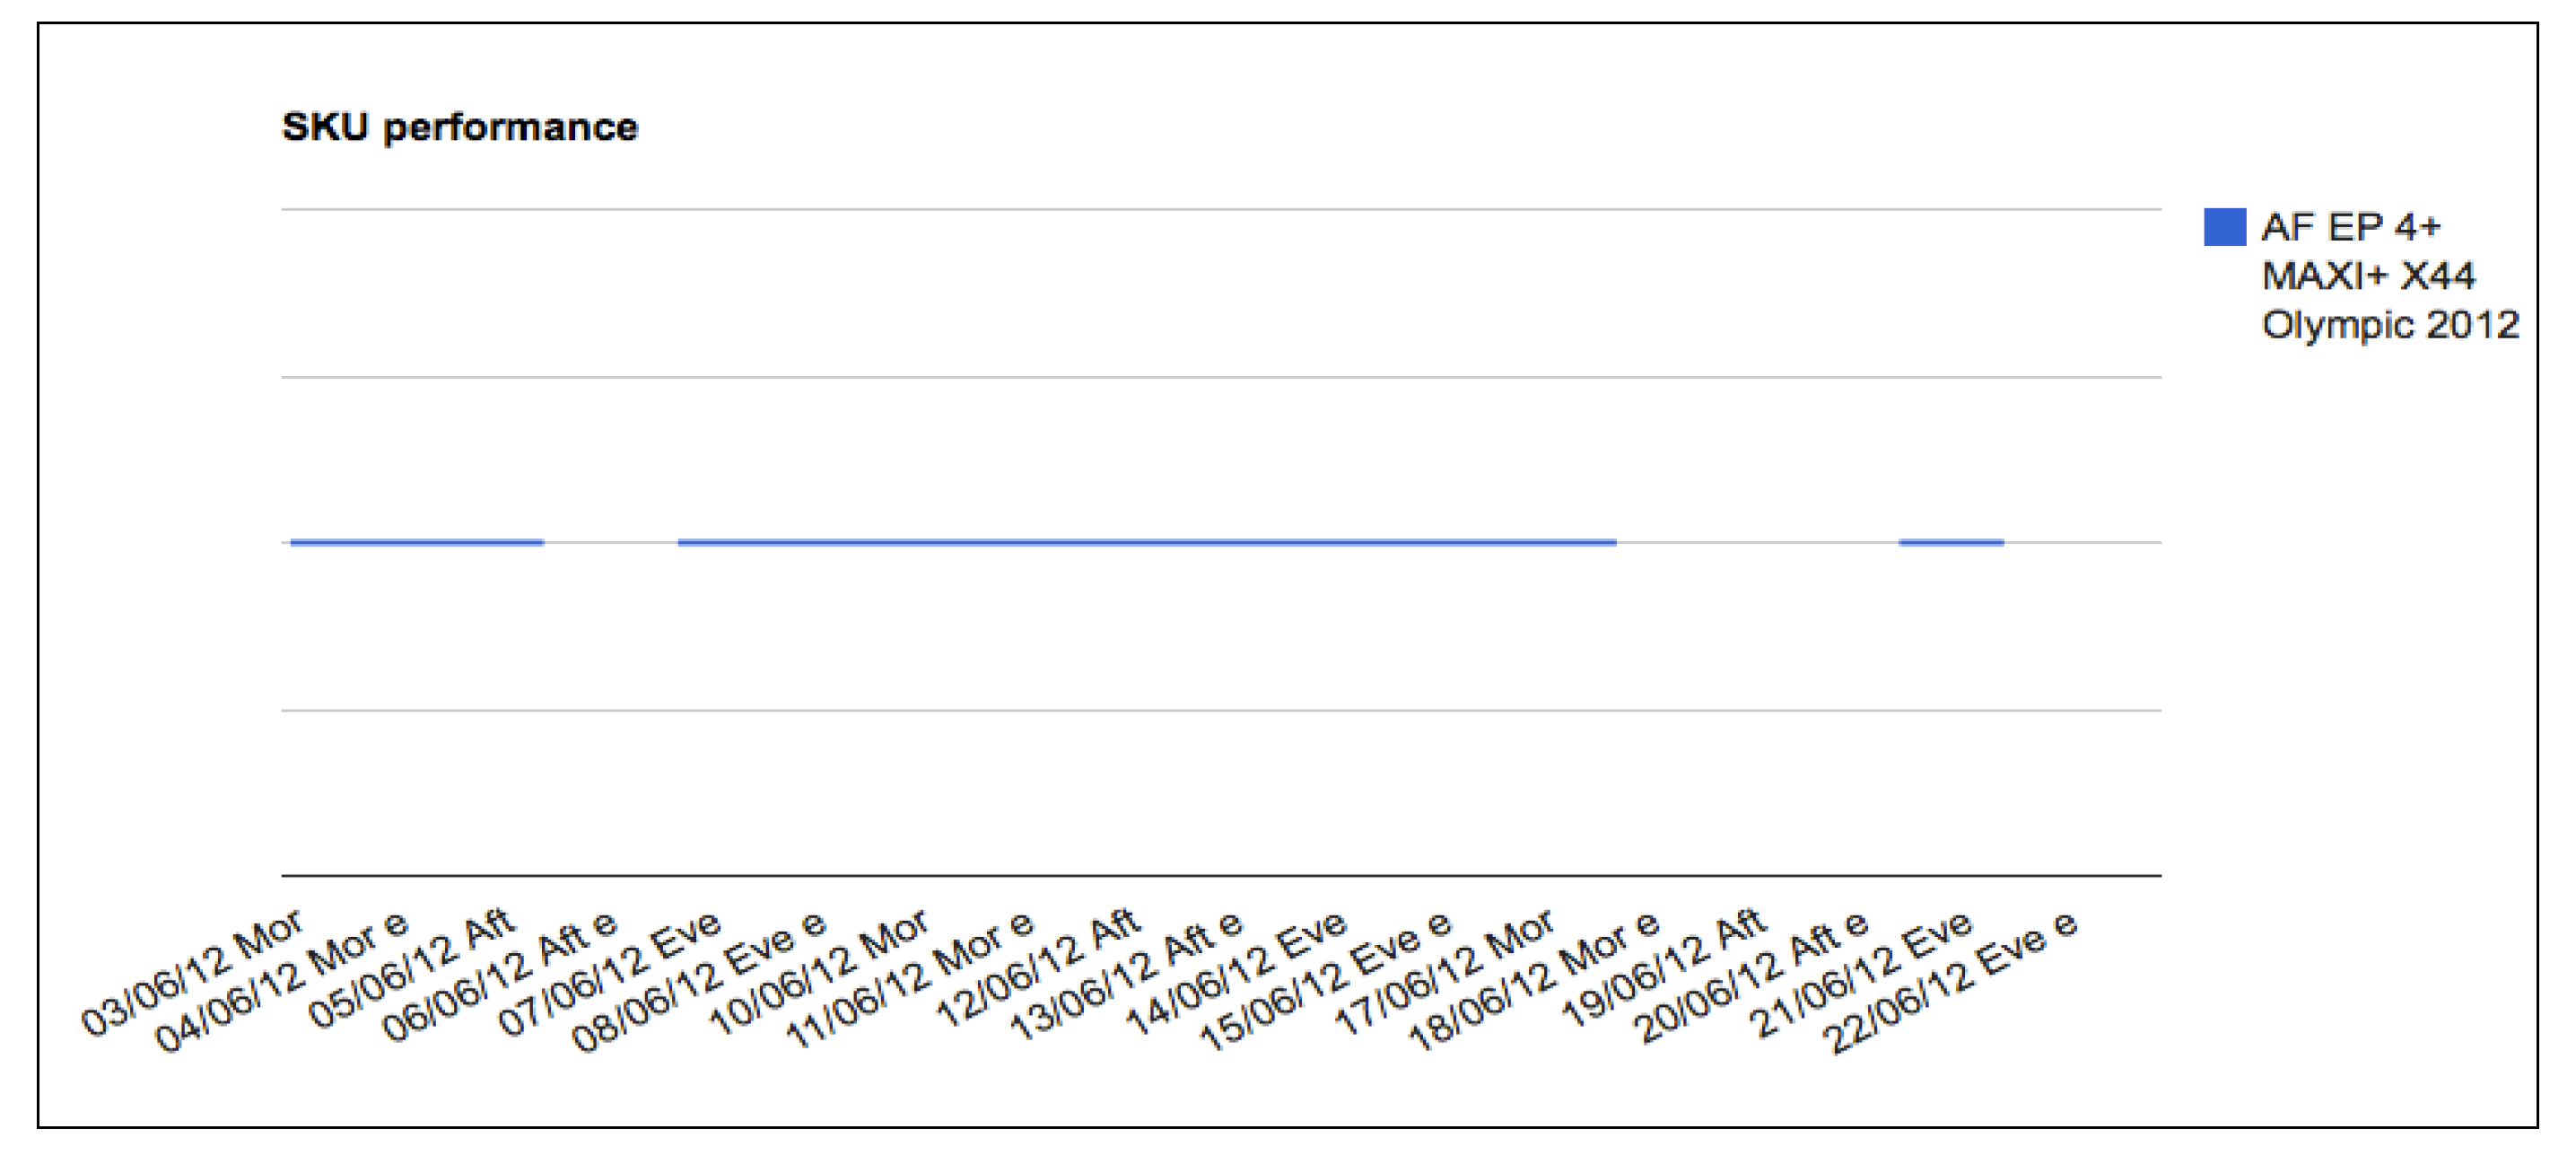
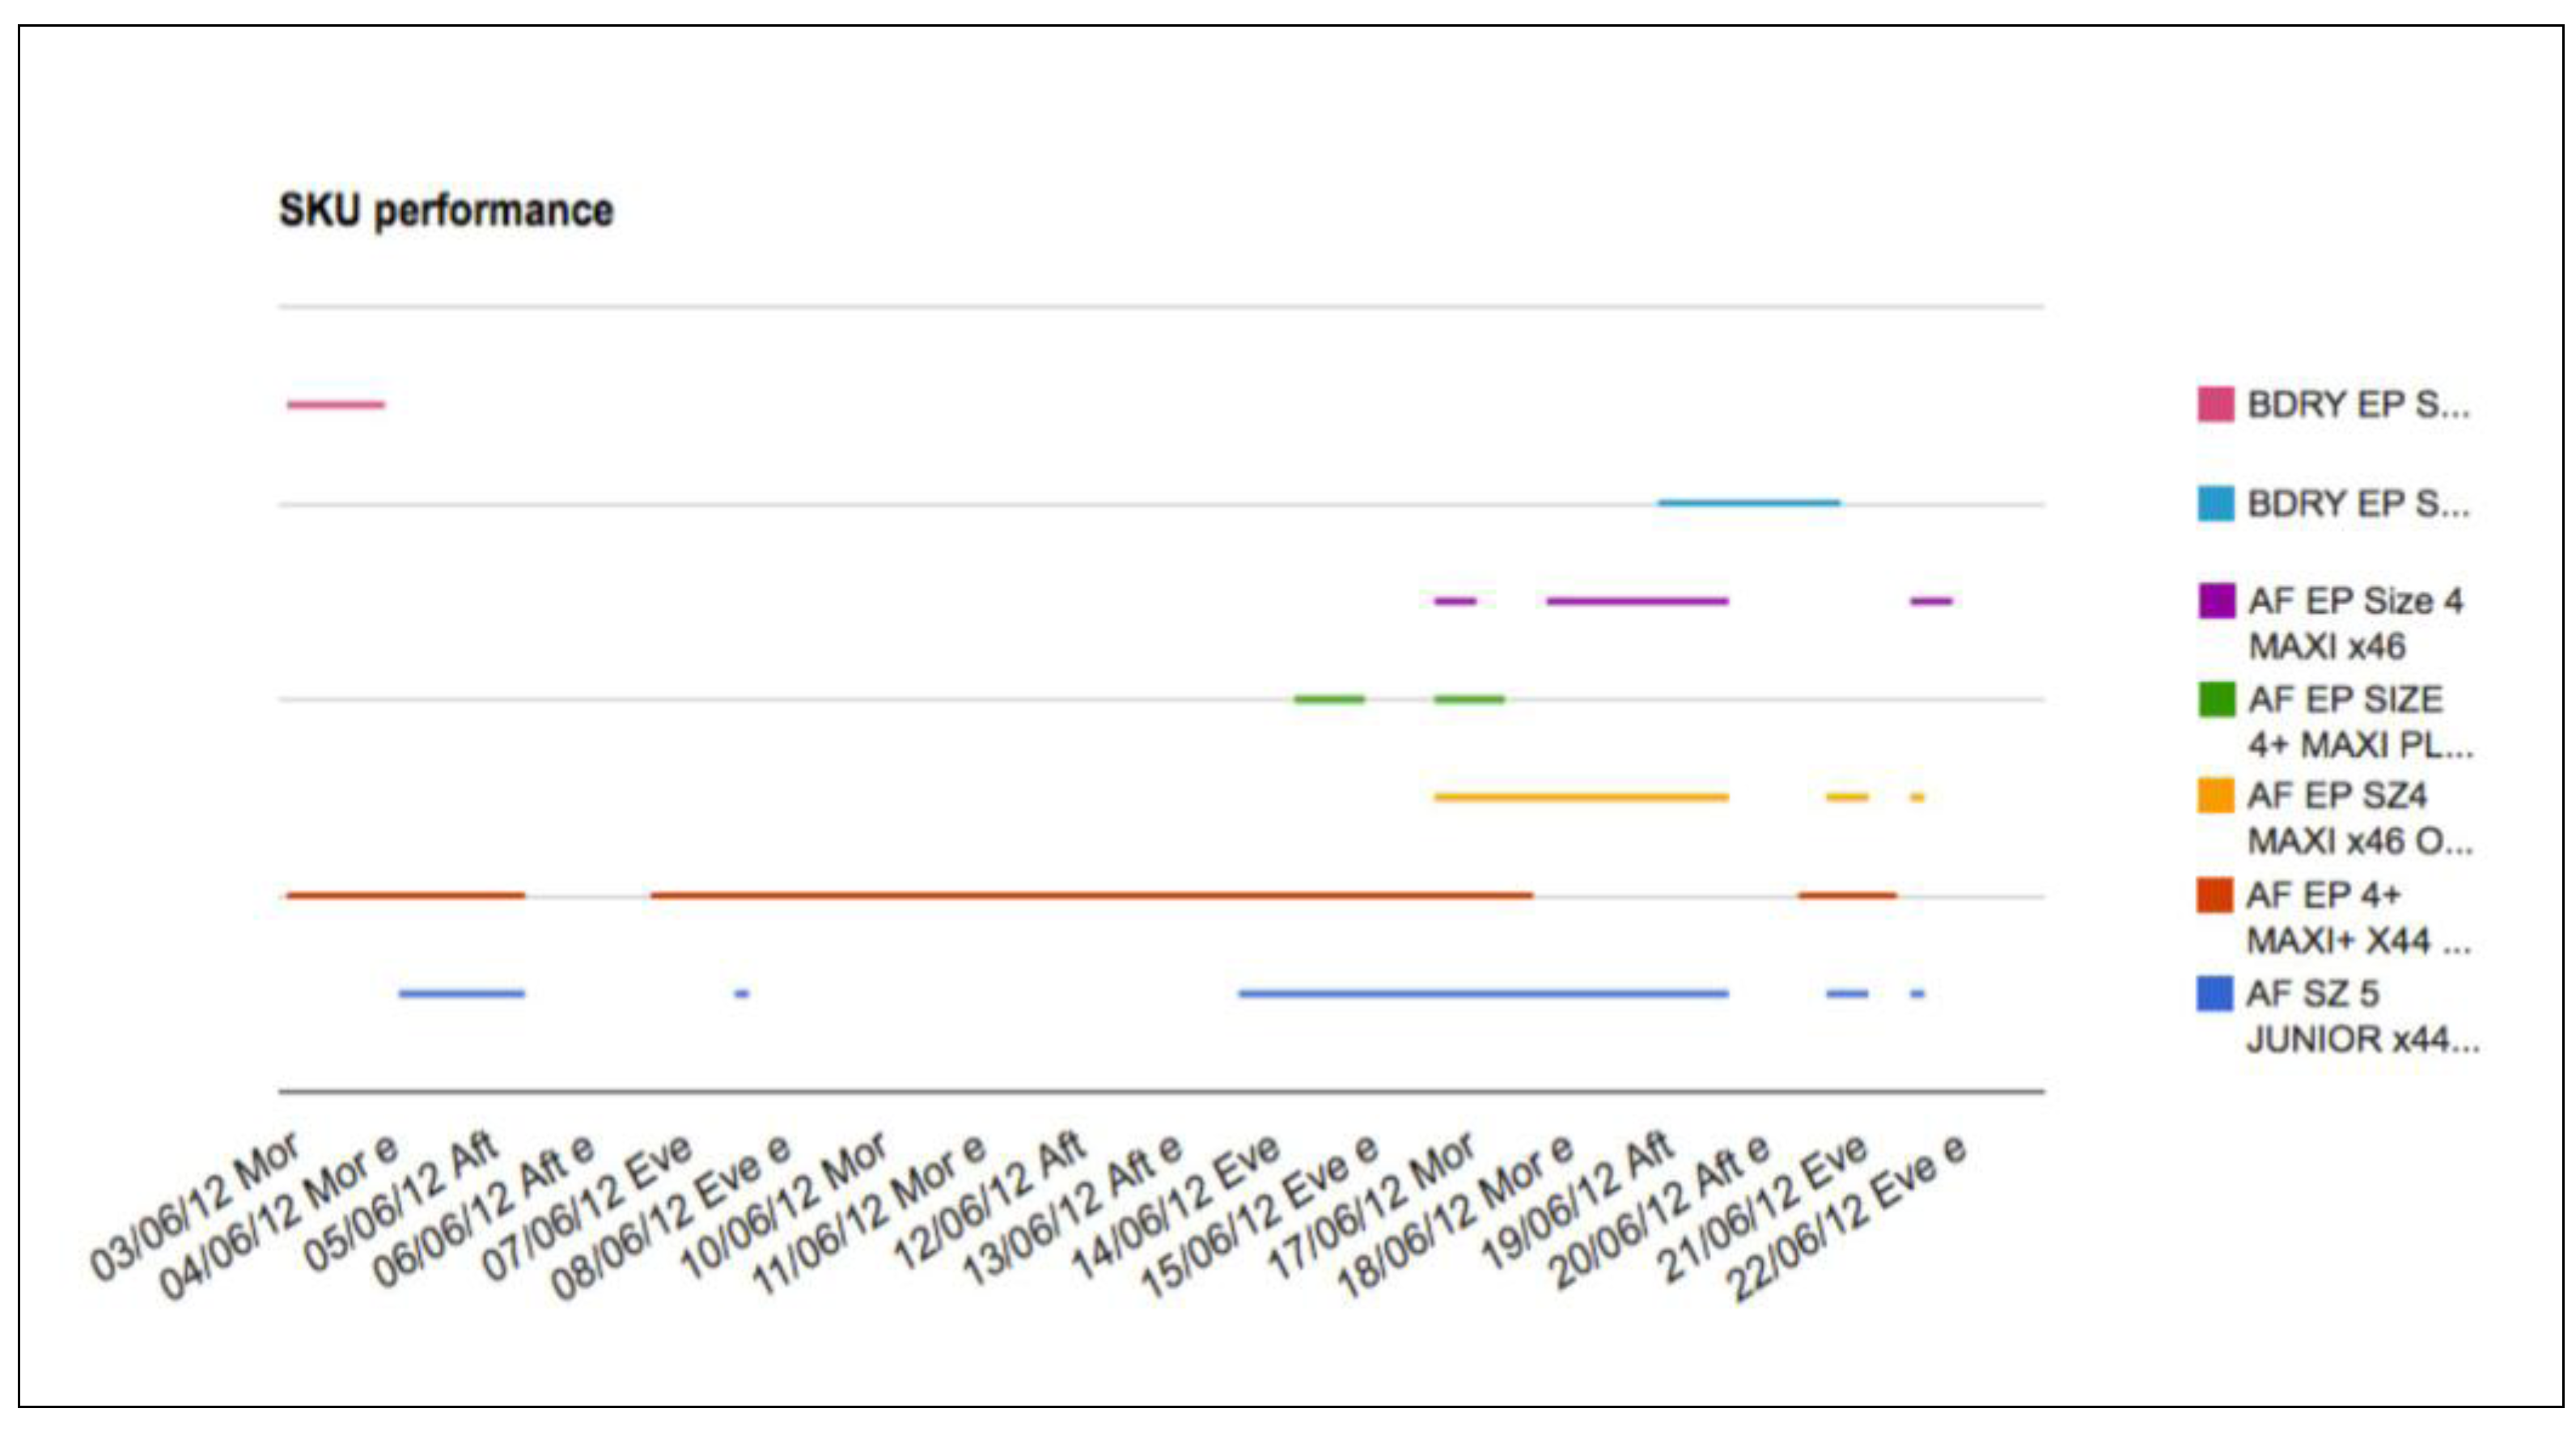
Figure 9 is a lines-based graph where each line is a SKU (defined by a colour joined with a name) that gives an idea of the detail of the SOOS by measuring every SOOS event and refill activity, respectively, and start and end points of each segment. Every day is divided by Morning (Mor), Afternoon (Aft) and Evening (Eve).
This report gives detailed information about a period with respect to the most relevant SOOS accumulated in some days (in the example, the worst period is between the evening of 15th and the afternoon of the 19th).
Figure 9.
The broken line in the graph shows the OOS period for different SKU within the product range.
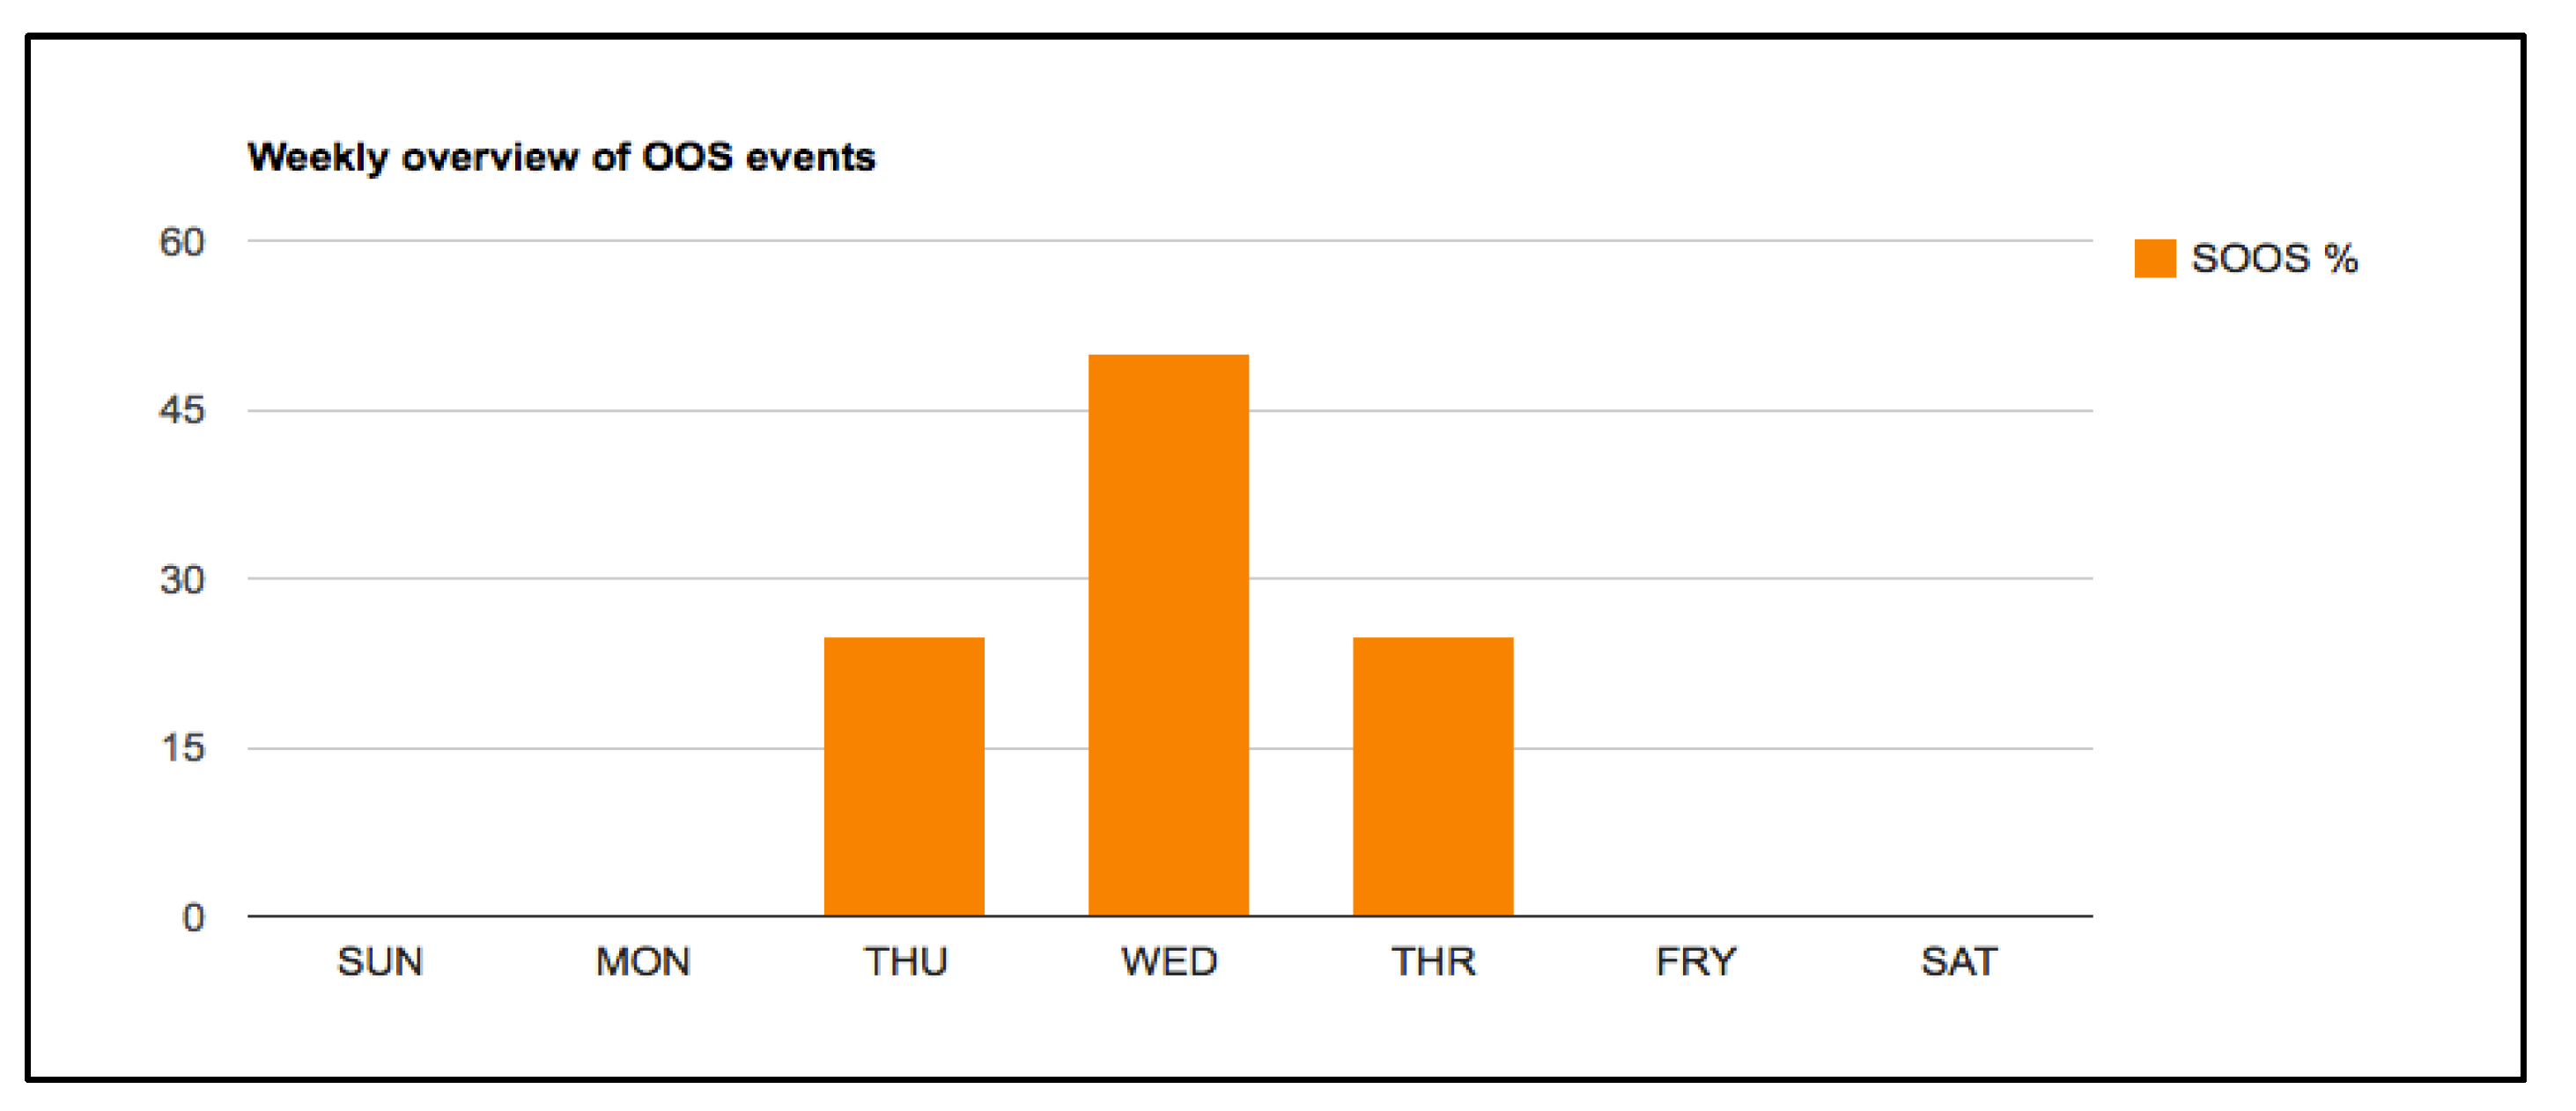
4.4. Store Team and Shoppers’ Behaviors
Consumers need to find the product they are looking for in store when they need it. If this does not happen, they must then decide what to do—they can buy another brand or try to find the product in another store. In order to monitor and then to avoid this kind of situation, the system produces a report to show exactly when the events happen on a daily and hourly basis. This should be useful in creating different refill strategies based on the specific circumstances of the point of sale or based on the specific behaviour of the shopper of a particular store in a specific time of a specific day, thereby finding tailor made solutions to fix SOOS.
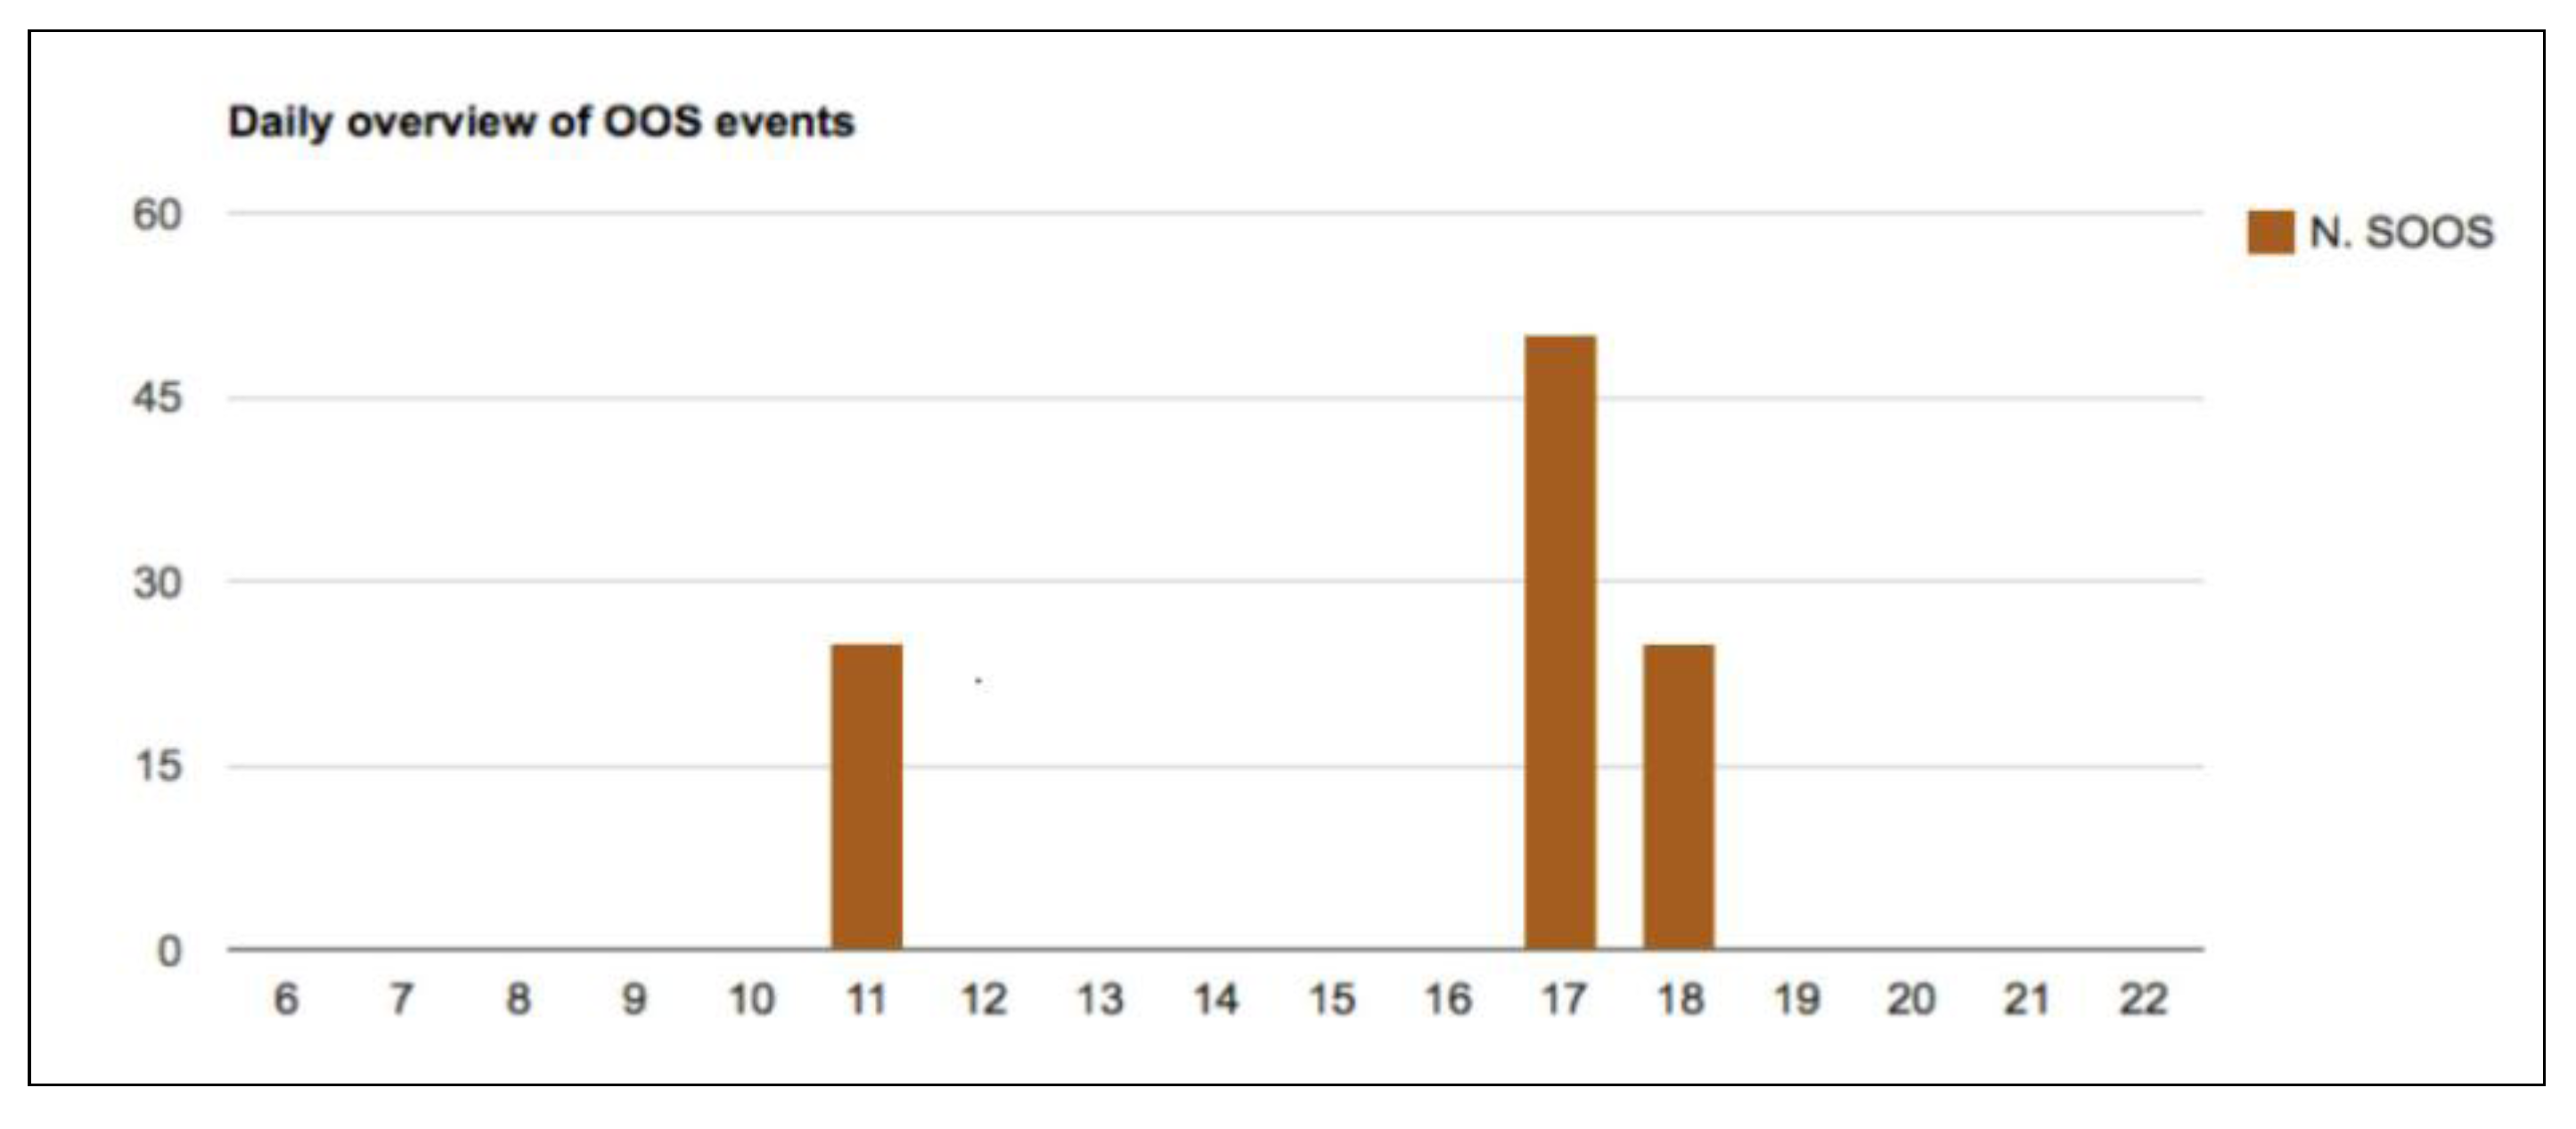
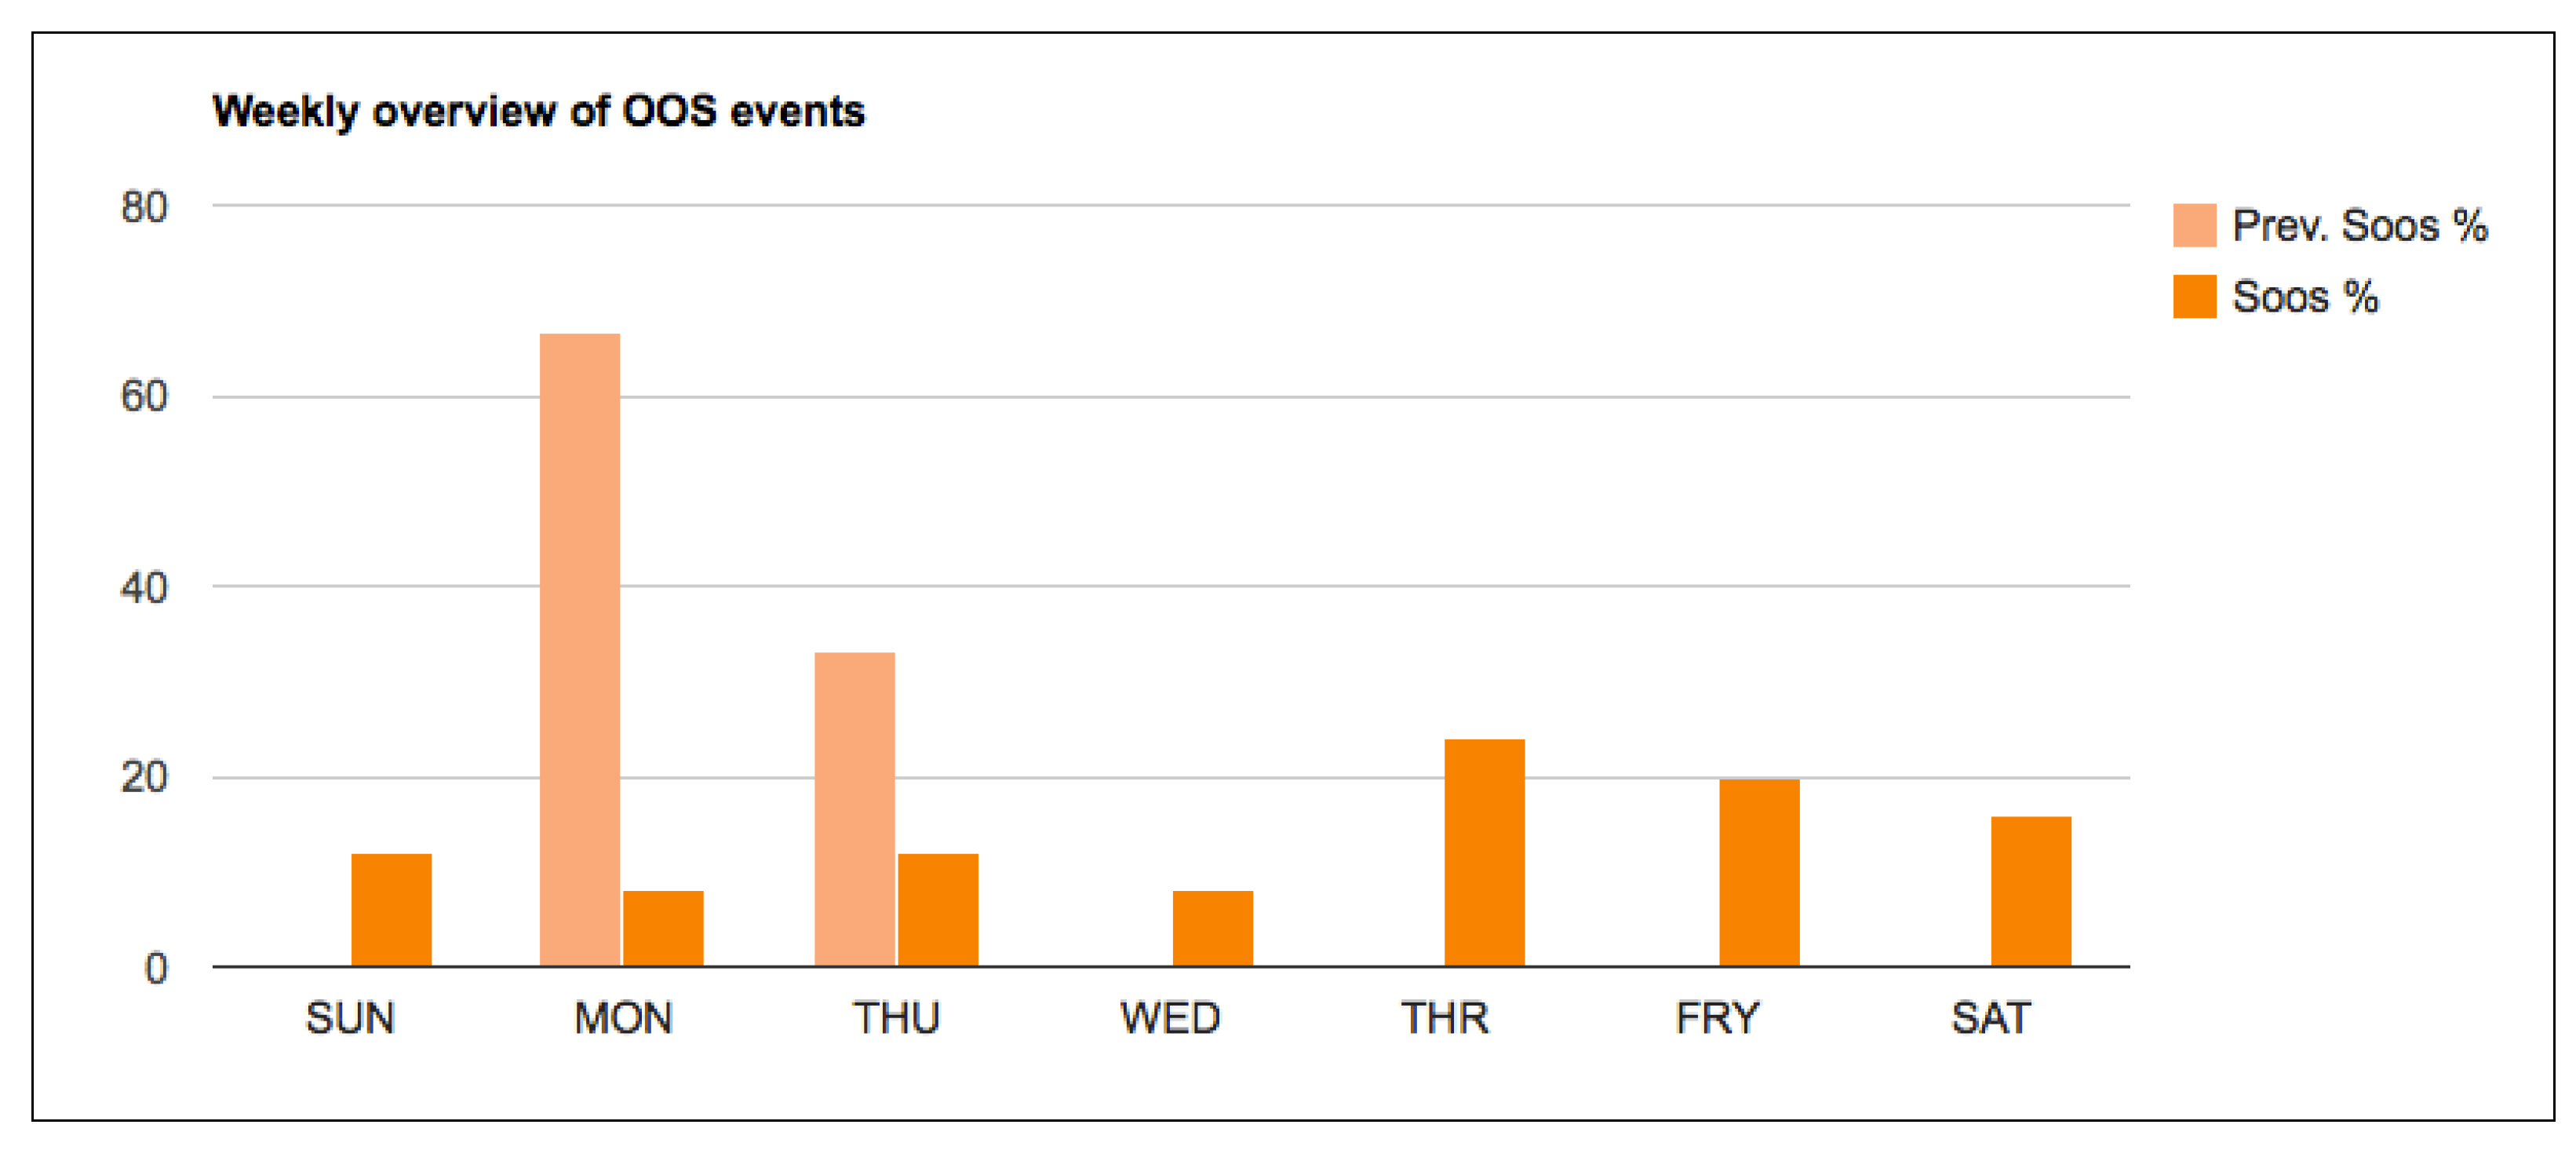
Figure 10 shows the day of the week and
Figure 11 the hour of the day (for a specific store) when the events happen based on the number of SOOS events.
Figure 10.
Rate of SOOS related to a week.
Figure 11.
Rate of SOOS related to a day.
All these reports should be tailor made based on a time period or specific store.
4.6. Comparisons between Time Periods
The system is very useful as a diagnostic tool and it makes easier to decide the best strategy to make products available for shoppers. One of the most relevant aspects of the system is the opportunity to compare different periods, as well as measure the success of the in-store strategies deployed (
Figure 14 and
Figure 15).
Figure 14.
Comparison between time periods considering two categories of product.
Figure 15.
Weekly comparison in rate of SOOS and estimate of SOOS.
5. Results
The purpose of this paper is to propose an innovative idea of a system able to identify, in real time, OOS events. The Shelf Detector system intends to overcome limitations of previous methods introducing a real-time measure of OOS events that were installed in real retail environments to prove the overall feasibility and scalability. Proposed metrics also provided a good indication of the day by day use by store people. In this section, we describe two significant tests that are representative of the 50 installations of the systems all over the world.
The experimental results were obtained considering that each SKU is provided only in one place of the store and each product maintains its position in accordance to an “approved” planogram. This situation is not far from reality because planogram maintenance is one of the main topics of discussion between retailers and brands. Also, brands pay money to maintain a certain planogram position. For these reasons, the assumption of a quite stable planogram can be considered a real assumption for tests.
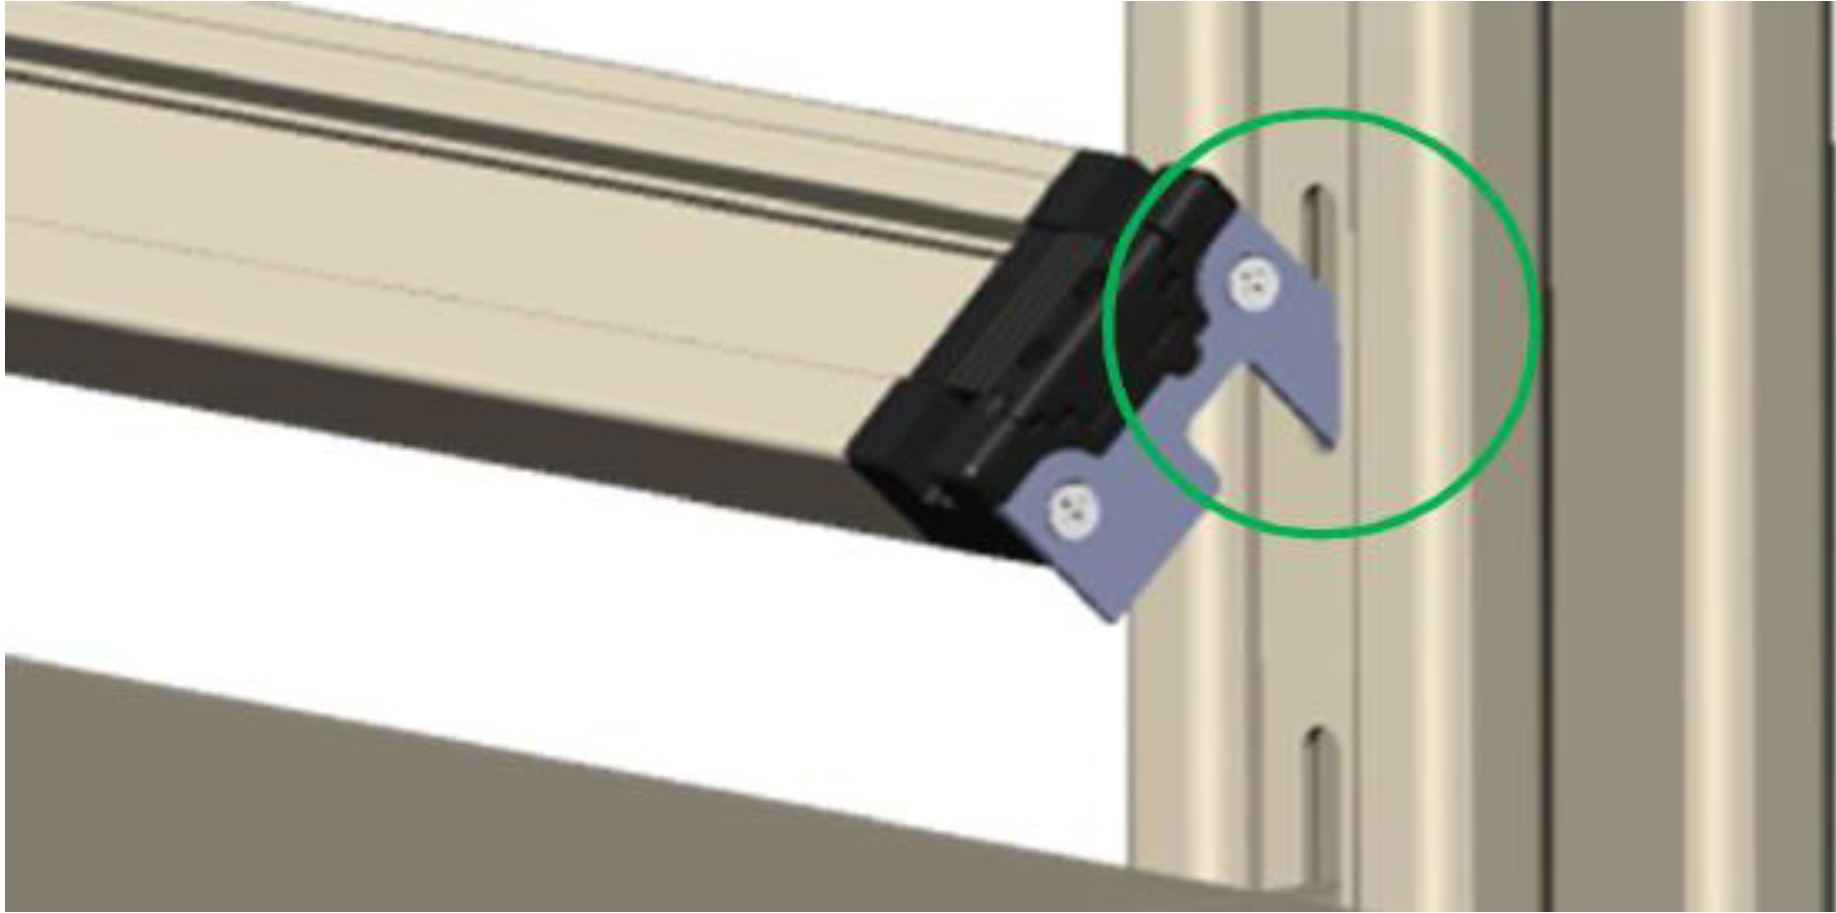
The Shelf Detector system was tested in our laboratories and then installed in several real stores, as mentioned above, and it showed a great versatility of installation on the shelf from the mechanical point of view. Also, data connections and data transmission were stressed in 18 months of real time data acquisition and transmission. Finally, we were also able to test the battery life in a real retail environment finding a battery lifetime of 12 months, for an average installation of 200 sensors connected with a battery powered RF (see
Section 3.1 for details). This result is acceptable also from the scalability point of view and requires of retailers a very low maintenance effort.
Here, we report two significant tests that were performed in two different real stores to prove respectively the feasibility of the proposed system and its scalability.
The first test was performed on 64 facing and 27 SKU using 64 sensors, a single RF transmitter and a Control Gear. During this test, data grabbed from Shelf Detector was compared with ground truth manually inspected in store and backed up with a photo of every out of facing and out of stock measured. Results of this first test demonstrated a high feasibility of the system with no false positive and a complete coherence with the ground truth. An example of a photo of this test where it is possible also to see sensors installed behind products is reported in
Figure 16.
Figure 16.
An example of OOS and a real image of sensors installed on the diapers shelf.
The second test was done to have a clear view on the scalability of the system and for that reason 678 sensors were used to measure the Shelf Detector System for 18 months. Five RF transmitters where used to collect data from sensors installed in five different categories and shelves inside the store. The control gear was responsible for collecting raw data and uploading changes of product status together with a time stamp to the cloud-based information collection and presentation system.
The systems behaved well and batteries lasted for the entire period. There were no significant problems in the second test and about 2500 out of facing and refill events were collected in the system. More than 3400 SOOS hours were analysed and reported in real time. The big amount of data allowed a complete scalability test both from the hardware and software point of view with interesting results from long time analysis. Some example of synthetic data and reports of this second test are shown in
Figure 17.
Figure 17.
An example of OOS report with respect to average product availability (on shelf) and single SKU availability during the scalability test.
6. Conclusions
The purpose of this paper is to propose the innovative idea of a system able to identify, in real time, OOS events. The system named Shelf Detector intends to overcome limitations of previous methods introducing a continuous and real-time measure of OOS that has not been conceptualised until now. This study explores OOS values using time-variable definition, considering OOS events by day of the week, time of day and number facings. The metrics extracted by shelf detector system demonstrate how the system can introduce time-variable in the identification of unavailability of products on the shelf. So, we have introduced new metrics and displayed graphical representations of data extracted from the system. The system is also interesting for its industrial benefits and for the ability to send signals (SMS or similar) to the store team trying to interact with users to solve more effectively the SOOS problem and make products available for shoppers. The field of SOOS data is making much progress, with the insights here presented, and further results coupling geographical data (stores in different areas) and different categories can also increase knowledge on the problem. In this research, our aim has been to introduce new metrics that take into account the time variable, and to report more significant results that are testament to the ability of the system.
Moreover, results from extensive tests will be presented to demonstrate the possible applications of the system in the field of information mining for SOOS and decision support systems applied to real stores. Future work in this field will be focussed on data classifications to better understand abnormal behaviours, learning from data series in order to have a powerful decision support system for shelf operations.


