Article

A Metric for Secrecy-Energy Efficiency Tradeoff Evaluation in 3GPP Cellular Networks

1
Department of Information Engineering, University of Florence, Via di Santa Marta 3, 50139 Firenze, Italy
2
Consorzio Nazionale Interuniversitario per le Telecomunicazioni (CNIT), University of Florence, Via di Santa Marta 3, 50139 Firenze, Italy
*
Author to whom correspondence should be addressed.
Information 2016, 7(4), 60; https://doi.org/10.3390/info7040060
Submission received: 27 June 2016 / Revised: 30 September 2016 / Accepted: 17 October 2016 / Published: 27 October 2016
(This article belongs to the Special Issue Physical Layer Security in Wireless Networks)

Abstract

:
Physical-layer security is now being considered for information protection in future wireless communications. However, a better understanding of the inherent secrecy of wireless systems under more realistic conditions, with a specific attention to the relative energy consumption costs, has to be pursued. This paper aims at proposing new analysis tools and investigating the relation between secrecy capacity and energy consumption in a 3rd Generation Partnership Project (3GPP) cellular network , by focusing on secure and energy efficient communications. New metrics that bind together the secure area in the Base Station (BS) sectors, the afforded date-rate and the power spent by the BS to obtain it, are proposed that permit evaluation of the tradeoff between these aspects. The results show that these metrics are useful in identifying the optimum transmit power level for the BS, so that the maximum secure area can be obtained while minimizing the energy consumption.

1. Introduction

Wireless media are inherently prone to security threats due to their open access nature. Traditional security mechanisms are based on the use of cryptographic techniques. Cryptography secrecy strength depends on the computational complexity that is required in order to solve complex numerical problems. In order to not rely only on the trivial assumption that the attacker has limited computational power, physical-layer information-theoretical security can be used instead. This approach was first led by Shannon and then Wyner, who introduced the concept of wire-tap channels and analyzed its inherent achievable secrecy rate [1]. Generalization to additive white Gaussian noise (AWGN) channels was then made in [2]. The concept under these works is that any wireless channel has an intrinsic secrecy capacity, i.e., potentially there exists a specific rate so that the information is reliable for the legitimate receiver but not to the eavesdropper. The secrecy capacity is bonded to the signal-to- interference-and-noise ratio (SINR) at a legitimate destination compared to the eavesdropper’s one. Recently, this concept of physical-layer security has also been investigated in fading channels [3], and proposals of implementation of physical-layer security have been done in [4,5,6].
However, a better understanding of the inherent secrecy of the wireless systems under more realistic conditions turns out to be fundamental: particularly, a clear focus on the relative energy consumption and its related costs has to be considered.
As a matter of fact, the global information and communications technology (ICT) industry is an important and quickly growing contributor to CO2 emissions and energy consumption. According to the SMART 2020 study [7], it accounted for 830 Megatons each year that is approximately equal to 2% of global human carbon dioxide emissions and almost equivalent to those of the global aviation industry [8]. Hence, in the last few years, growing attention has been shown by both the Regulatory entities and the Telcos on the impact of the energy saving strategies on the economics [9] and the environment [10]; in the framework of ICT systems, mobile communications networks are the main contributors in terms of energy consumption: their contribution is expected to grow up to 178 Megatons of CO2 in 2020, while in 2002, it was 64 Megatons. Therefore, in order to reduce the power consumption of cellular networks, several energy efficiency strategies have been proposed that are based on power control and power amplifier sleep mode [11,12,13,14].
Moreover, in order to quantify and compare the energy consumption performance of different components and systems, several Energy Efficient metrics have been defined for component, equipment and system levels: two different BS types have been taken into account for the energy consumption model, as described in [15], the Remote Radio Head (RRH) and the Macro BS. Since telecommunication equipment normally operates at different loads and energy consumption, the introduction of a suitable metric becomes a crucial aspect of the network optimization. In literature, there exist papers evaluating the energy costs of cryptographic algorithms [16], as well as the joint optimization of secrecy rate and energy consumption in cooperative ad hoc networks [17]. To the best of our knowledge, no paper is currently published in international journals dealing with the evaluation of the energy costs of physical-layer security when it is applied to 3rd Generation Partnership Project (3GPP) cellular networks.
To this end, this paper aims at investigating the tradeoff between secrecy capacity and energy consumption in a 3GPP cellular network. We focused on secure and energy efficient communications for cellular systems, which are motivated by the fact that most confidential transactions are expected to be conducted over such networks in the very near future. Specifically, we first derived the secrecy capacity of a BS surrounded by another six BSs. Then, we proposed two new metrics which bind the secure area in the BS’s sector, the afforded date-rate and the power spent by the BS to obtain it and that allow evaluation of the tradeoff between them. The secure area defines the set of locations in the cell where the eavesdropper cannot leak information to the legitimate user. The results show that these metrics are useful in identifying the optimum transmit power level for the BS, so that the maximum secure area can be obtained with the minimum energy consumption: particularly, the metrics are useful during the network planning phase since they permit the cell planner to define the power that allows the user to receive the data with a required quality of service (QoS). Given the distance of the legitimate receiver and the secrecy rate to be served to the user, the planner can define the minimum transmit power that maximizes the secure area.

2. System Model

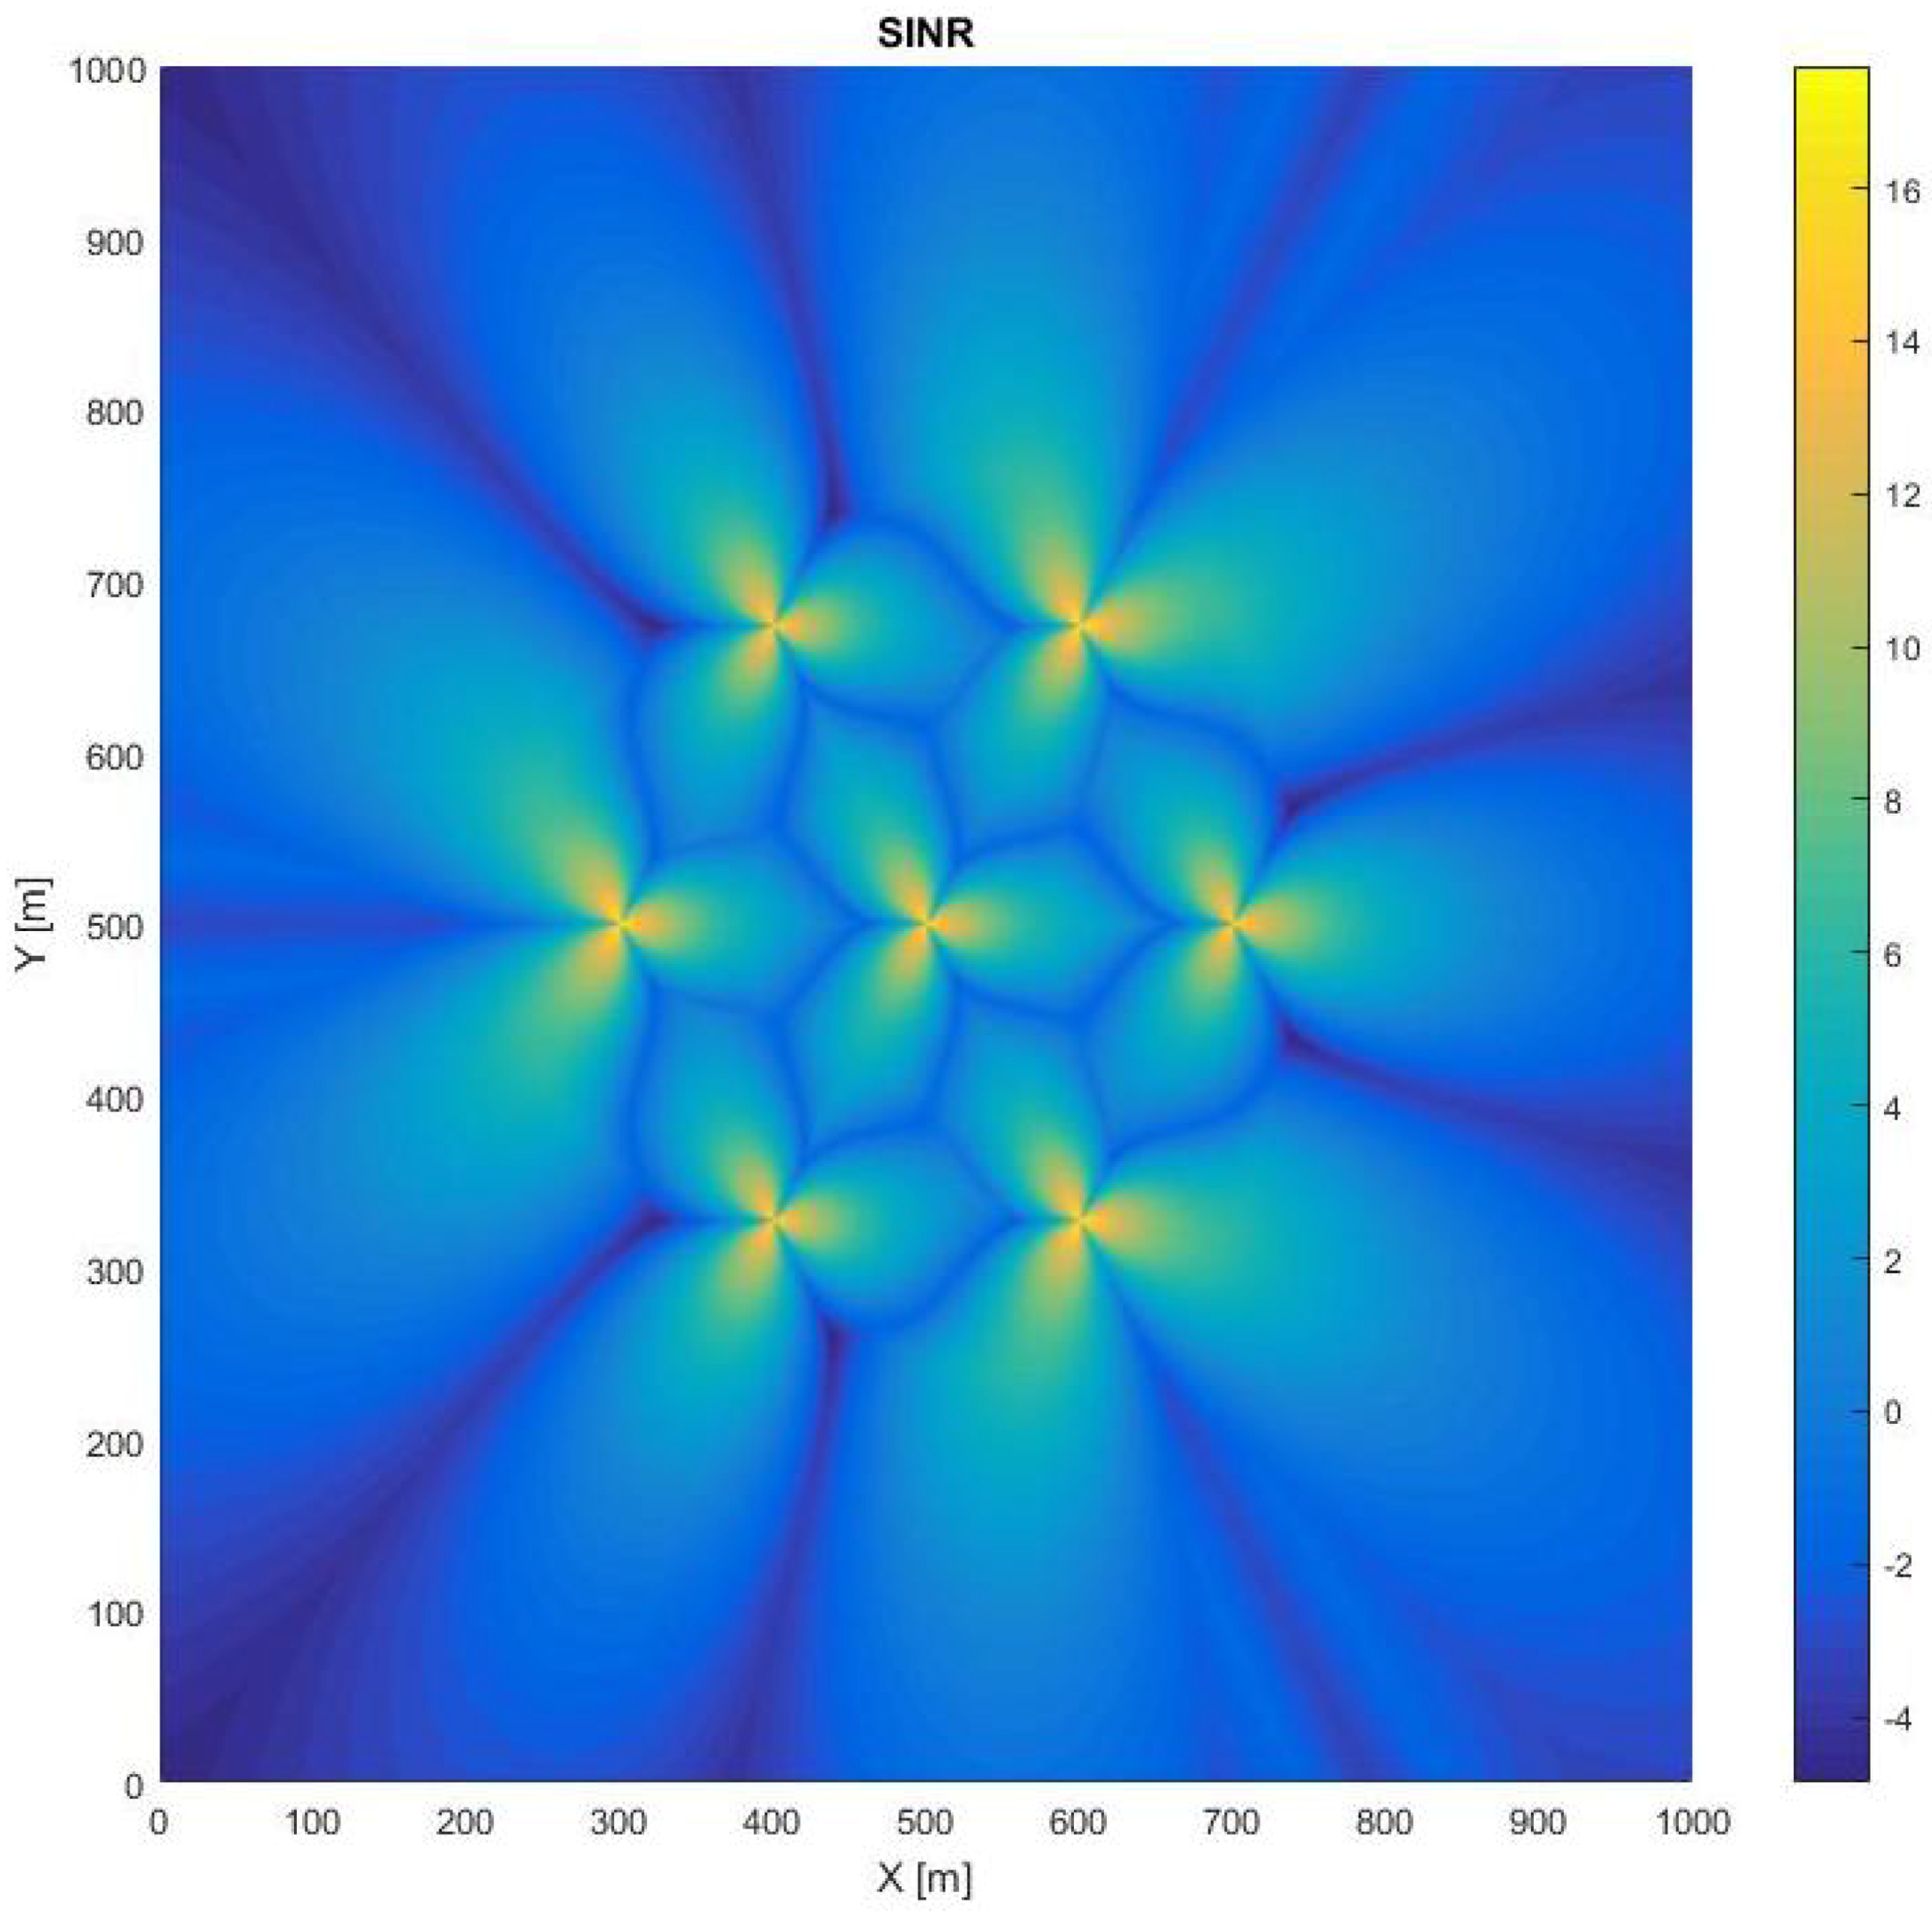
2.1. Cellular Network Model

The cellular network model that is considered in this paper is compliant with the Evolved UMTS Terrestrial Radio Access (E-UTRA) Radio Frequency System Scenarios as defined in [18]; therefore, it resorts to the same frequency bands specified for UTRA: particularly, the simulation frequencies are assumed to be at 2000 MHz. Moreover, the macro cell propagation model in urban area is taken into account, i.e., the BS antenna gain (including feeder loss) and the BS antenna height are assumed, respectively, equal to 15 dBi and 30 m, whereas the propagation loss L is equal to L = 128 + 37 . 6 l o g ( R ) , where R is the distance between the BS and the User Equipment (UE).
A single operator layout is assumed. Base stations with three sectors per site are placed on a hexagonal grid with distance of 3 · R , where R is the cell radius. The sector antennas and the transmit power are assumed to be equal. The number of sites is equal to seven.
The BS antenna radiation pattern to be used for each sector in three-sector cell sites is also identical to those defined in [18]:
A ( θ ) = m i n 12 θ θ 3 d B 2 , A m ,
where 180 θ 180 , θ 3 d B is the 3 dB beam width which corresponds to 65 degrees and A m = 20 dB is the maximum attenuation.
The BS power consumption model is the same proposed in [15]: particularly, the power consumption at maximum load has been defined as
P i n = N T R X · P η P A · 1 σ f e e d + P R F + P B B 1 σ D C 1 σ M S 1 σ c o o l ,
where N T R X indicates the number of transceiver chains per site, P is the power level which is radiated by the Antenna of each sector, P R F and P B B are the power consumption of the power amplifier and of the baseband block, η P A is the amplifier efficiency and the terms σ f e e d , σ D C , σ M S and σ c o o l account for the loss of the feeder, the converter, the main supply and the cooling, respectively.

2.2. SINR and Capacity Determination

The cellular system that has been described in the previous paragraph has been implemented in MATLAB (version R2016a, academic use, The MathWorks, Inc., Natick, MA, USA) simulation environment, providing the SINR values in the square playground which is depicted in Figure 1. The SINR values permit achieving the capacity in all of the playground areas.

2.3. Physical-Layer Secrecy

By adopting the common security terminology, the source of information, which is identified as Alice, is the serving sector of the cell under examination. The legitimate receiver Bob is the mobile user within the cell range. An undesired eavesdropper, Eve, can move around within the cell boundaries trying to capture the information from Alice to Bob. To restrict the analysis, Bob’s location is chosen on the direction of maximum radiation of his serving antenna, so that Bob’s position can be simply described reporting his absolute distance in meters from Alice. The results presented in the following sections are derived for Eve in the same cell as Bob, tuned to Alice-to-Bob wireless frequency. All other surrounding sectors are considered as interferers for both Bob and Eve, with signals as described in the previous section.
In order to evaluate the achievable level of secrecy that the system can grant to a mobile user in the depicted cellular system, we adopt the concept of Secrecy Capacity derived from Shannon’s notion of perfect secrecy [19], Wyner’s wiretap channel [1] and Barros work [20]. As in [20], Bob’s theoretical capacity per unit bandwidth is expressed as
C B = log 1 + | h B | 2 P N B ,
where
hB 
is a coefficient inclusive of both the transmit and the receive antenna gains and of path-loss of the Alice-to-Bob channel, being Bob served by Alice;
P 
is the power level of the sector that is serving Alice;
NB 
is the power of the equivalent Gaussian noise component perceived by Bob; it includes both thermal noise and interference from the surrounding sectors.
A similar expression describes Eve’s capacity, while the Secrecy Capacity of Bob can be expressed as
C s = log ( 1 + γ B ) log ( 1 + γ E ) , if γ B > γ E , 0 , if γ B γ E ,
where we called γ B and γ E the SINR that is experienced by Bob and Eve, respectively, (i.e., γ B = | h B | 2 P N B and γ E = | h E | 2 P N E ).

3. Metrics for the Evaluation of the Effective Secrecy–Energy Efficiency Tradeoff

In this section, we propose two new metrics for the evaluation of the tradeoff between the width of the surface of the cell where a target secrecy rate can be delivered and the power spent to obtain it.

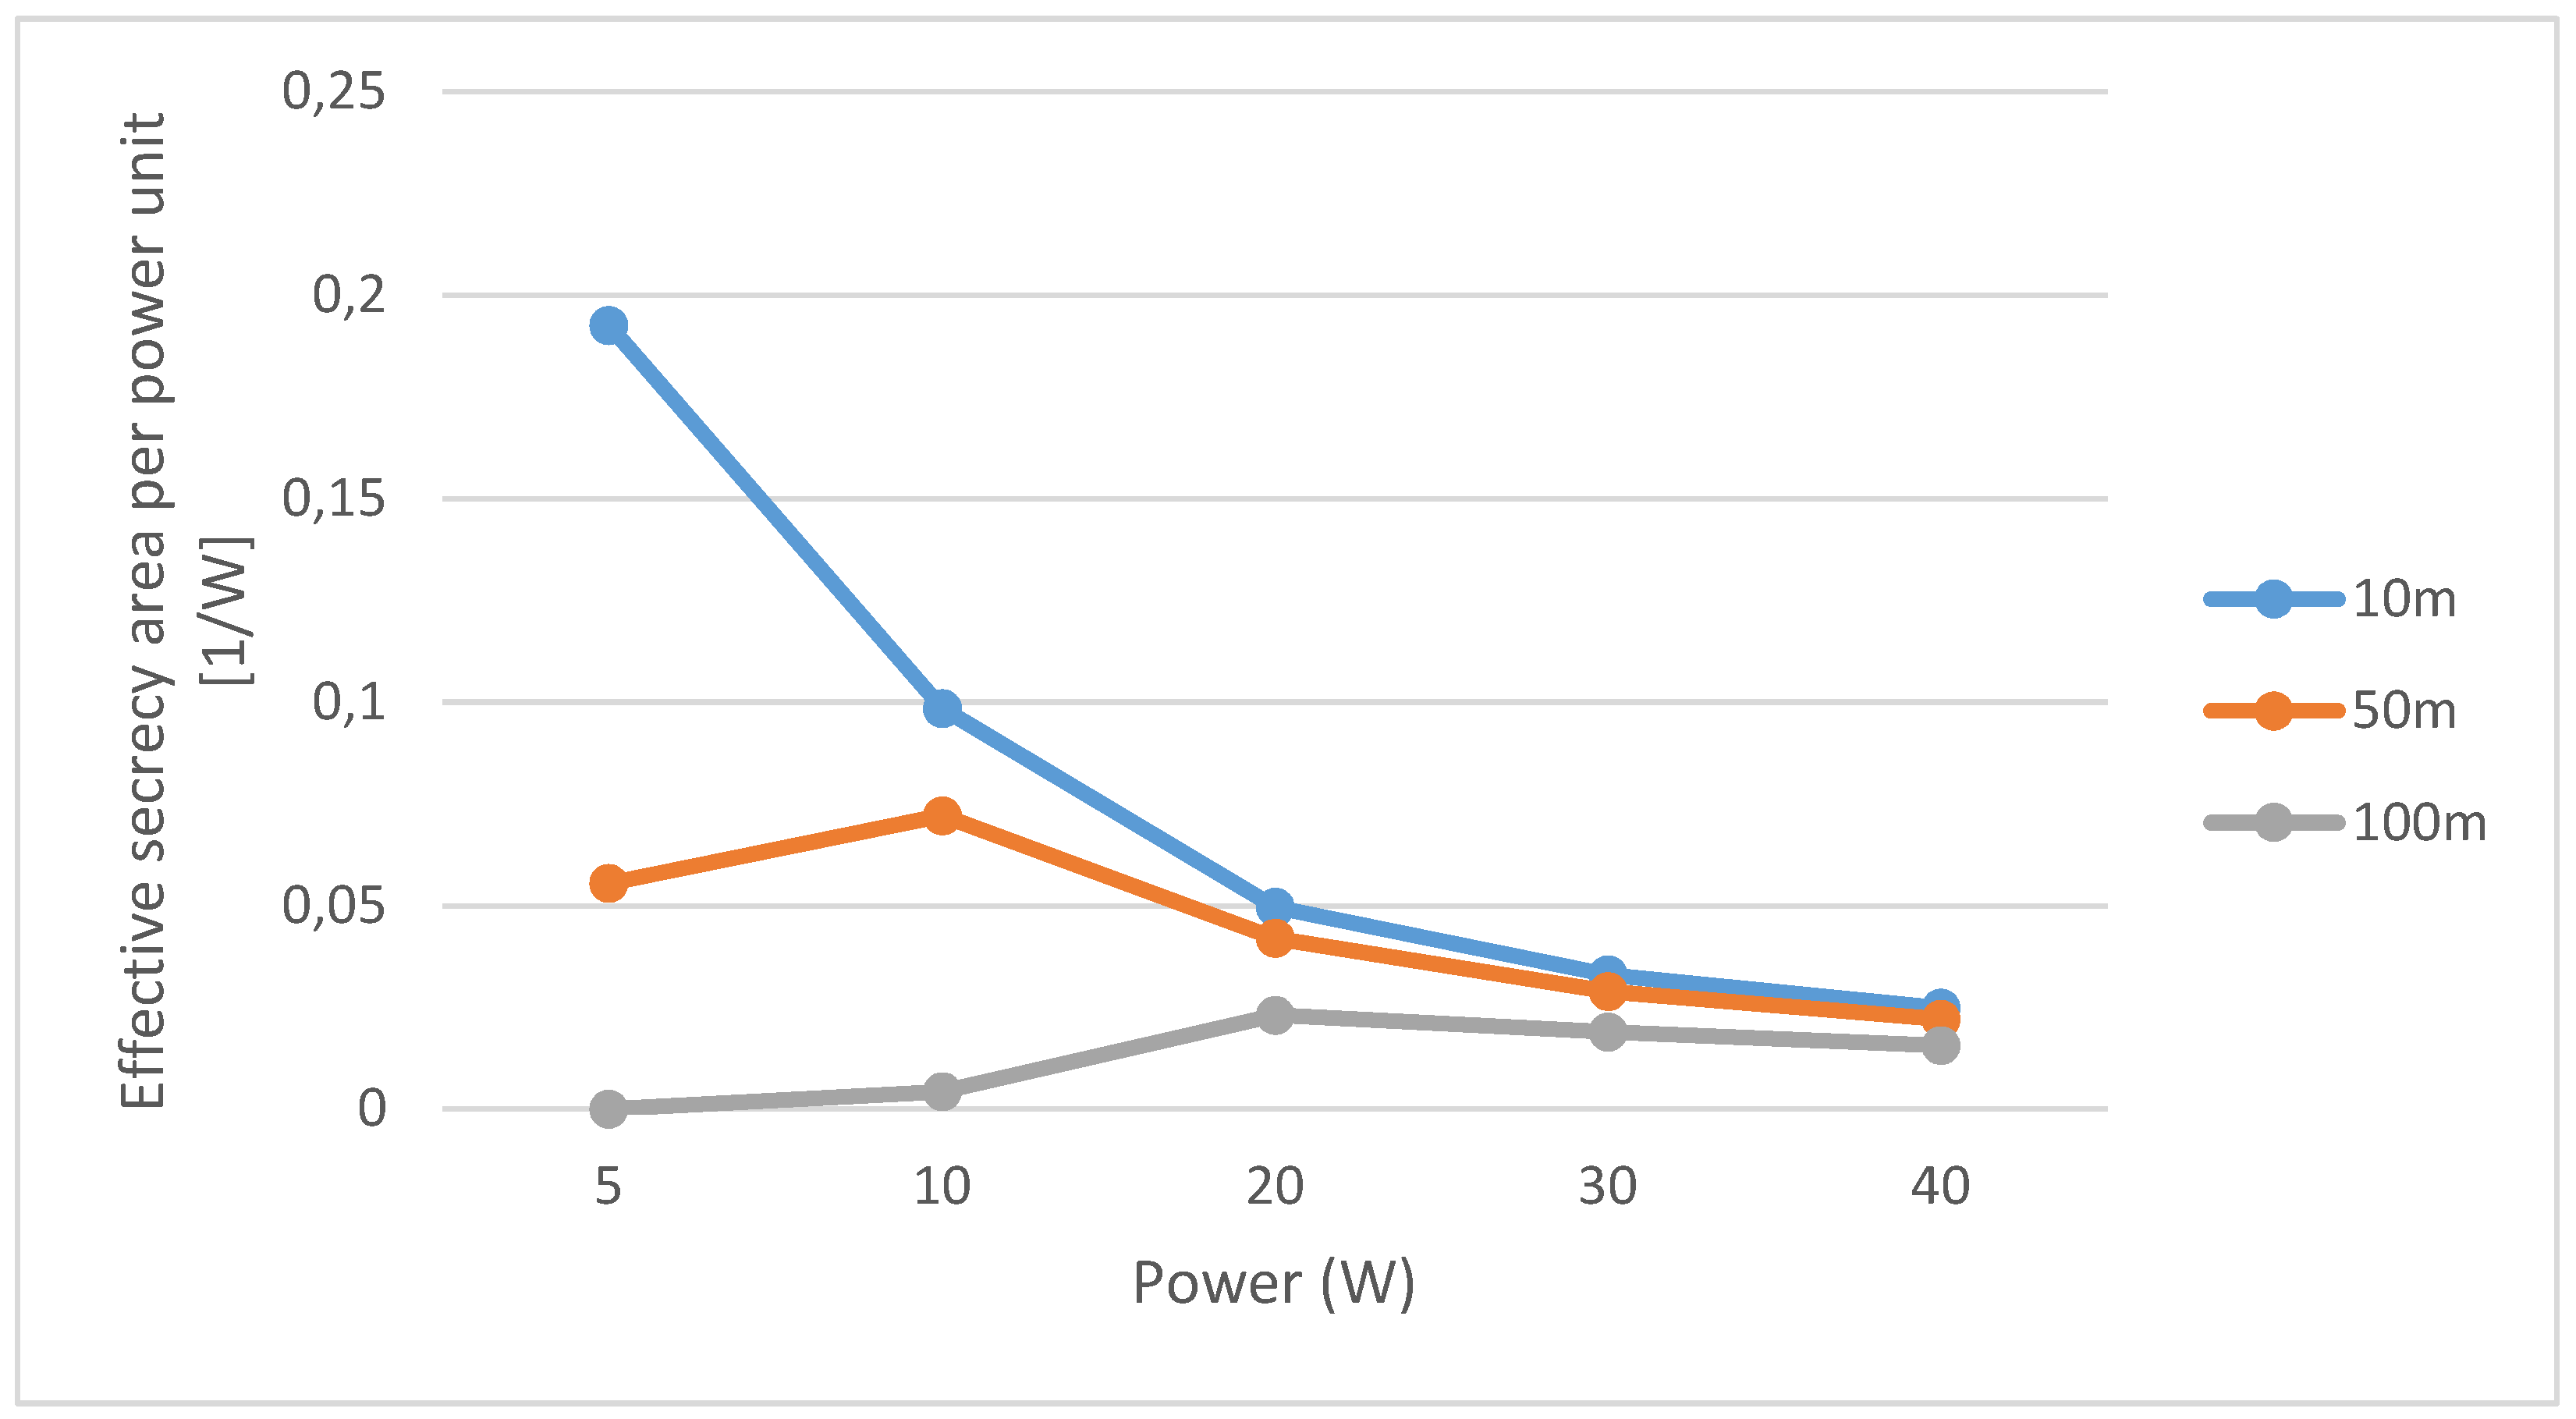
3.1. Effective Secret Area

Suppose that the BS (Alice) has to serve a user (Bob) in the cell and that the requested service has to be provided by means of a secure connection (QoSS—Quality of Service with Security). The BS sets a target secrecy rate R ¯ s depending on the QoSS of the user. Given the position of the user (Bob), a specific metric is required that can help Alice determine the minimum transmit power that maximizes the secure area of the cell, i.e., the region where Eve can stay without affecting the secrecy capacity C s of the legitimate link under the target secrecy rate, i.e., C s R ¯ s . In our analysis, we set a dynamic target secrecy rate, equal to 10 % of the capacity of the legitimate link (Alice–Bob), i.e., we initially set R ¯ s = 0 . 1 C B . Nonetheless, in the following, results with different target secrecy rates are also shown.
Before introducing the metrics, let us show the distribution of the secrecy capacity C s in the cell that is covered by the central BS (Alice) by assuming a variable distance of the user (Bob) and increasing the transmit power.
Figure 2 shows the geographical distribution of C s over the playground of the cellular network. In particular, we focus on the sector of the cell managed by the central BS (Alice) where the user (Bob) is present. The map shows the secrecy capacity of each point of the cell calculated, as Eve was in that specific point. While the transmit power of Alice is fixed (20 W), the distance of Bob in the maximum radiation pattern direction is varying from 10 to 100 m. The area where the secrecy capacity is less than the target secrecy rate R ¯ s (Unsecure Area) is represented with darker blue and increases as the distance of Bob increases.
These results are summarized in Table 1.
Figure 3 shows the geographical distribution of C s over the playground of the cellular network when the transmit power of Alice is varying from 5 to 40 W while the distance of Bob is fixed (50 m): the area where the secrecy capacity is less than the target secrecy rate R ¯ s remains the same, but the overall area of the cell increases. It is important to stress that in this graph the transmit power of all the sectors of other BSs and of the other two sectors which are co-sited with Alice are kept equal to 20 W (In this case, the possibility to change the transmit power of the antenna sector is realized to emulate the behavior of a basic Transmit Power Control (TPC)).
These results are summarized in the Table 2.

3.2. New Metrics

Let us introduce an auxiliary parameter that is defined as effective secrecy area ratio and is equal to:
A s [ eff ] = A s A ,
where A is the area of the cell sector that is managed by the BS (Alice) and A s is the secure area, i.e., the set of points of the total cell sector surface where the attacker (Eve) can stay without decreasing the secrecy rate of the legitimate link under the target rate; therefore, the parameter A s [ eff ] defines the percentage of area (related to the overall area of the cell) where the attacker (Eve) can stay without decreasing the secrecy rate of the legitimate link under the target rate.
The effective secrecy area ratio is computed by supposing that the eavesdropper could be located in any point ( x , y ) of the area managed by the base station. The position of the legitimate receiver (Bob) in the cell is supposed to be fixed as well as the transmit power. Results are shown with different transmit powers and distances Alice–Bob, while Eve could be located in any point of the cell of the BS. The extension of the cell depends on the transmit power. All of this information gives us a new parameter for evaluating how the area is extended where the legitimate link has a minimum target secrecy rate. The algorithm for the BS could be the following:
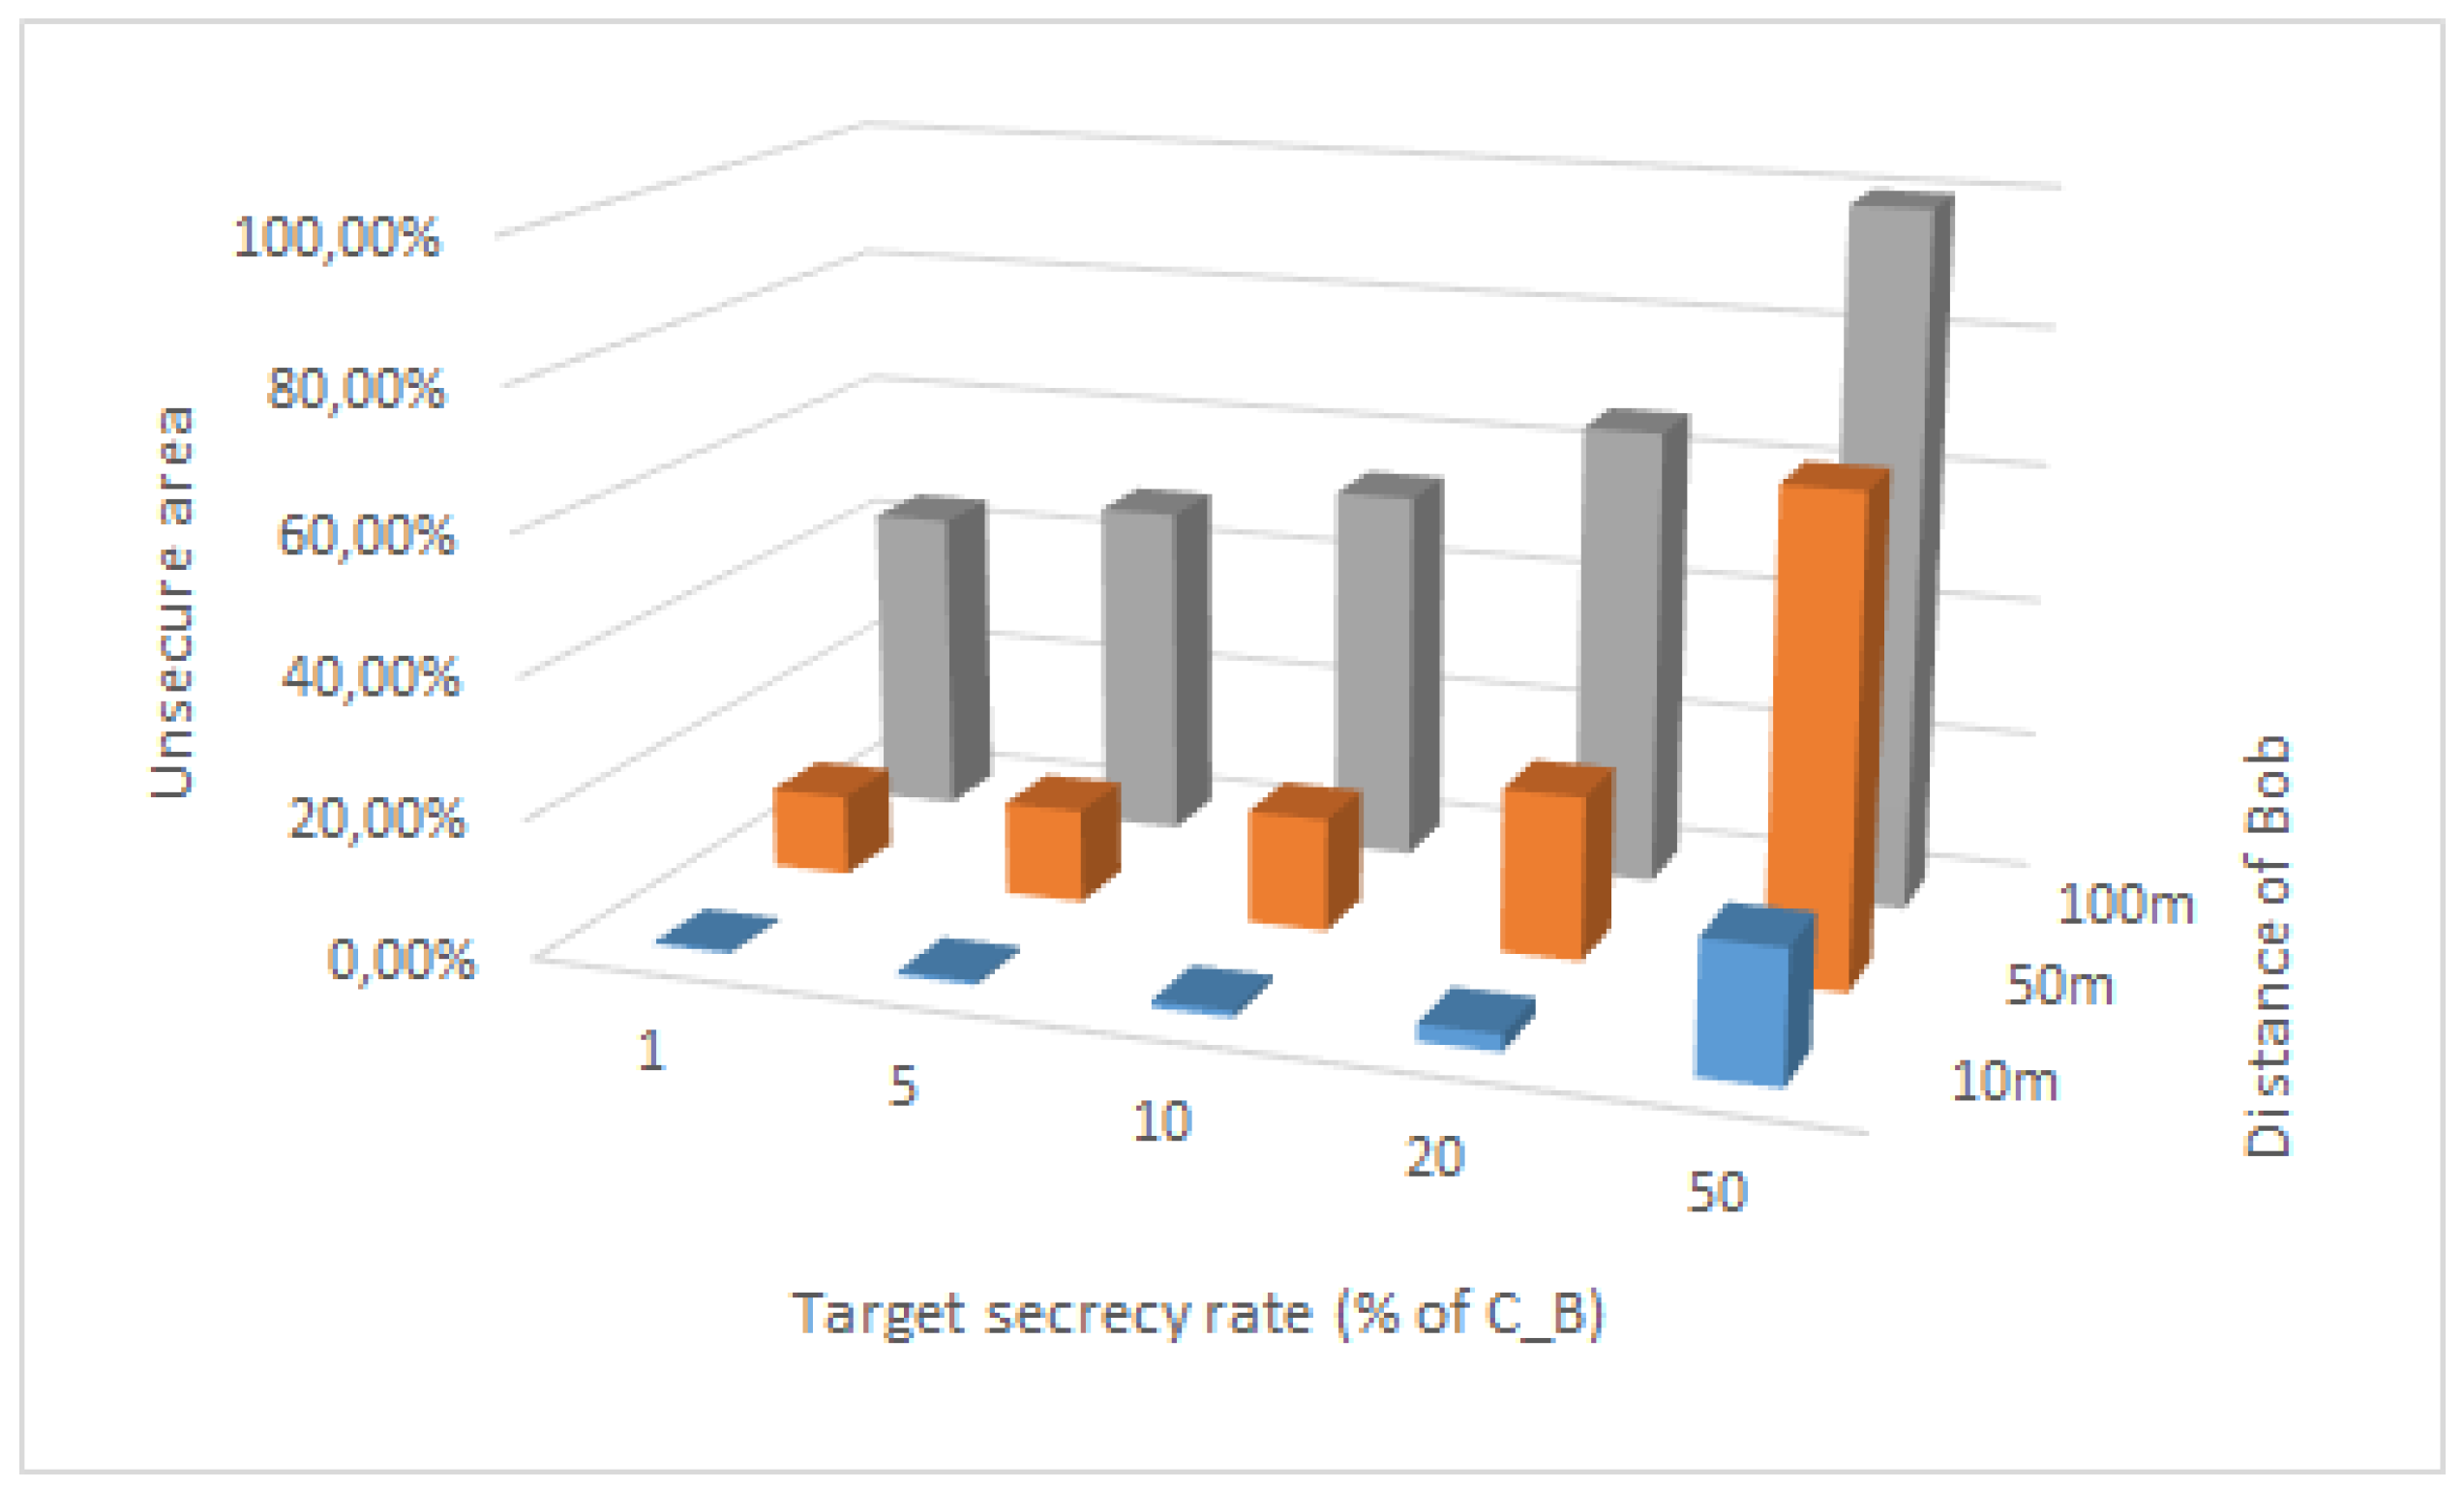
  • Decide a target secrecy rate that Alice wants to keep with Bob;
  • Given the position of Bob and the transmit power of Alice, the extension of the cell is known;
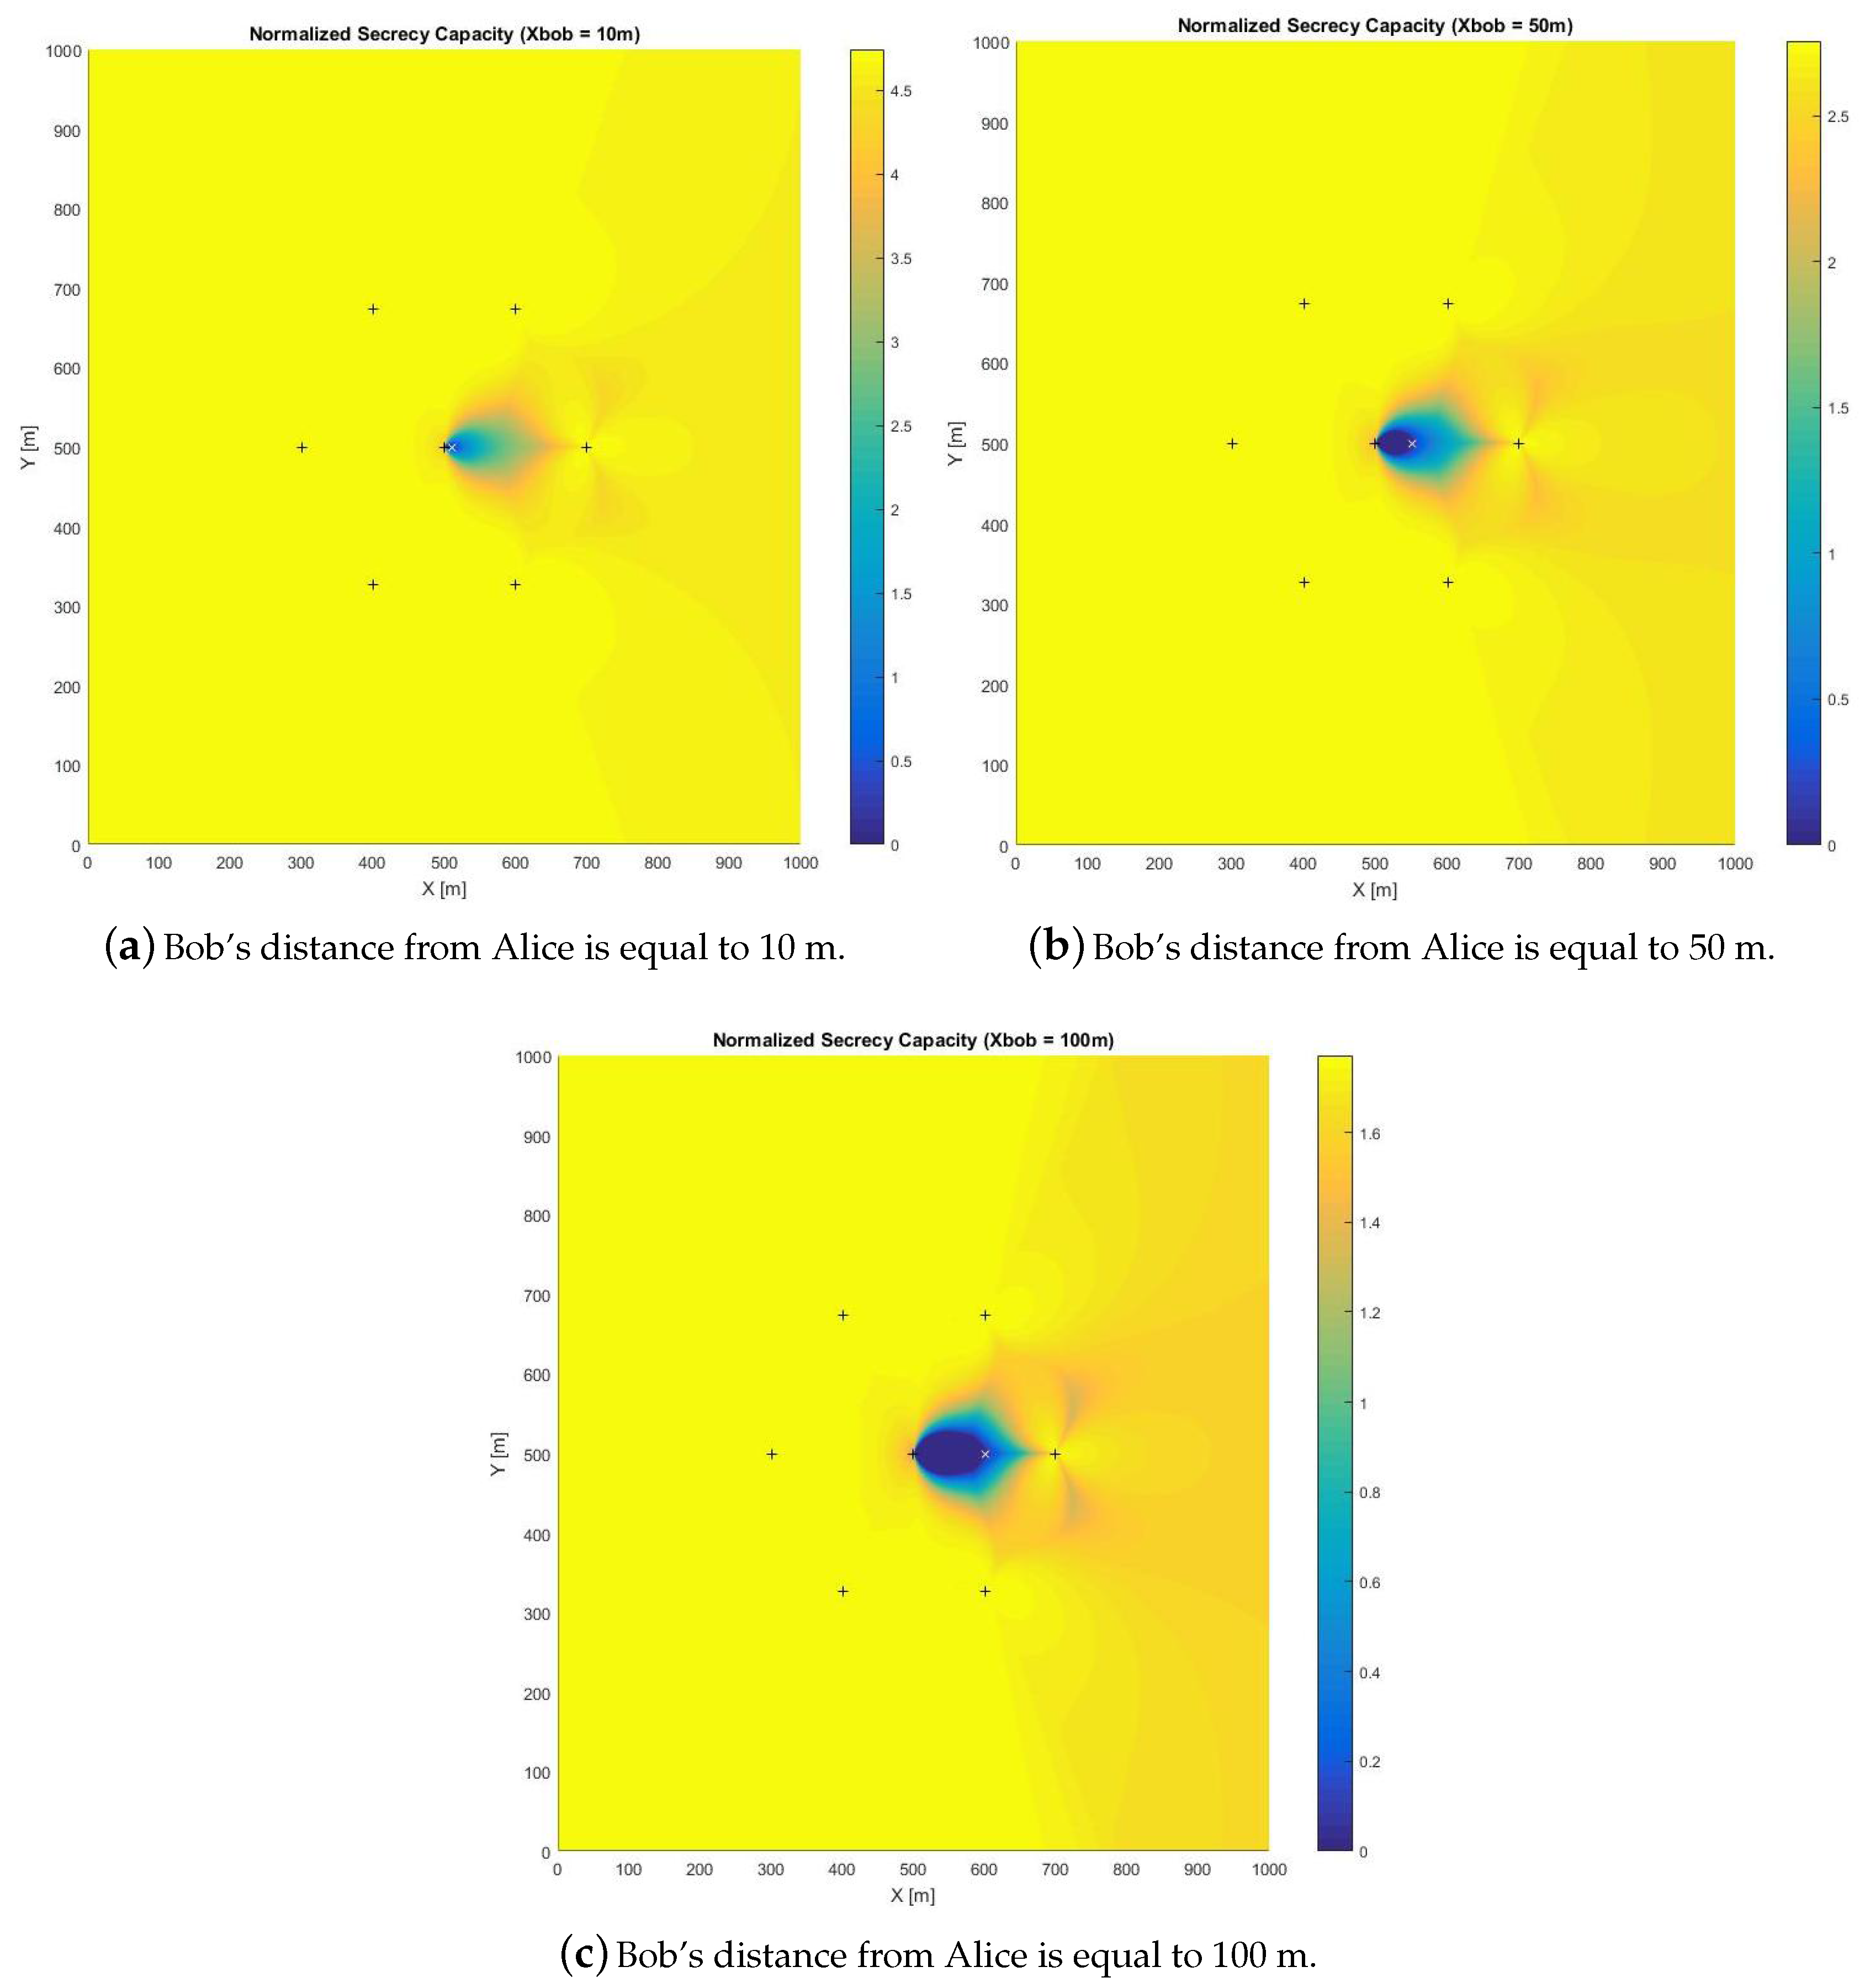
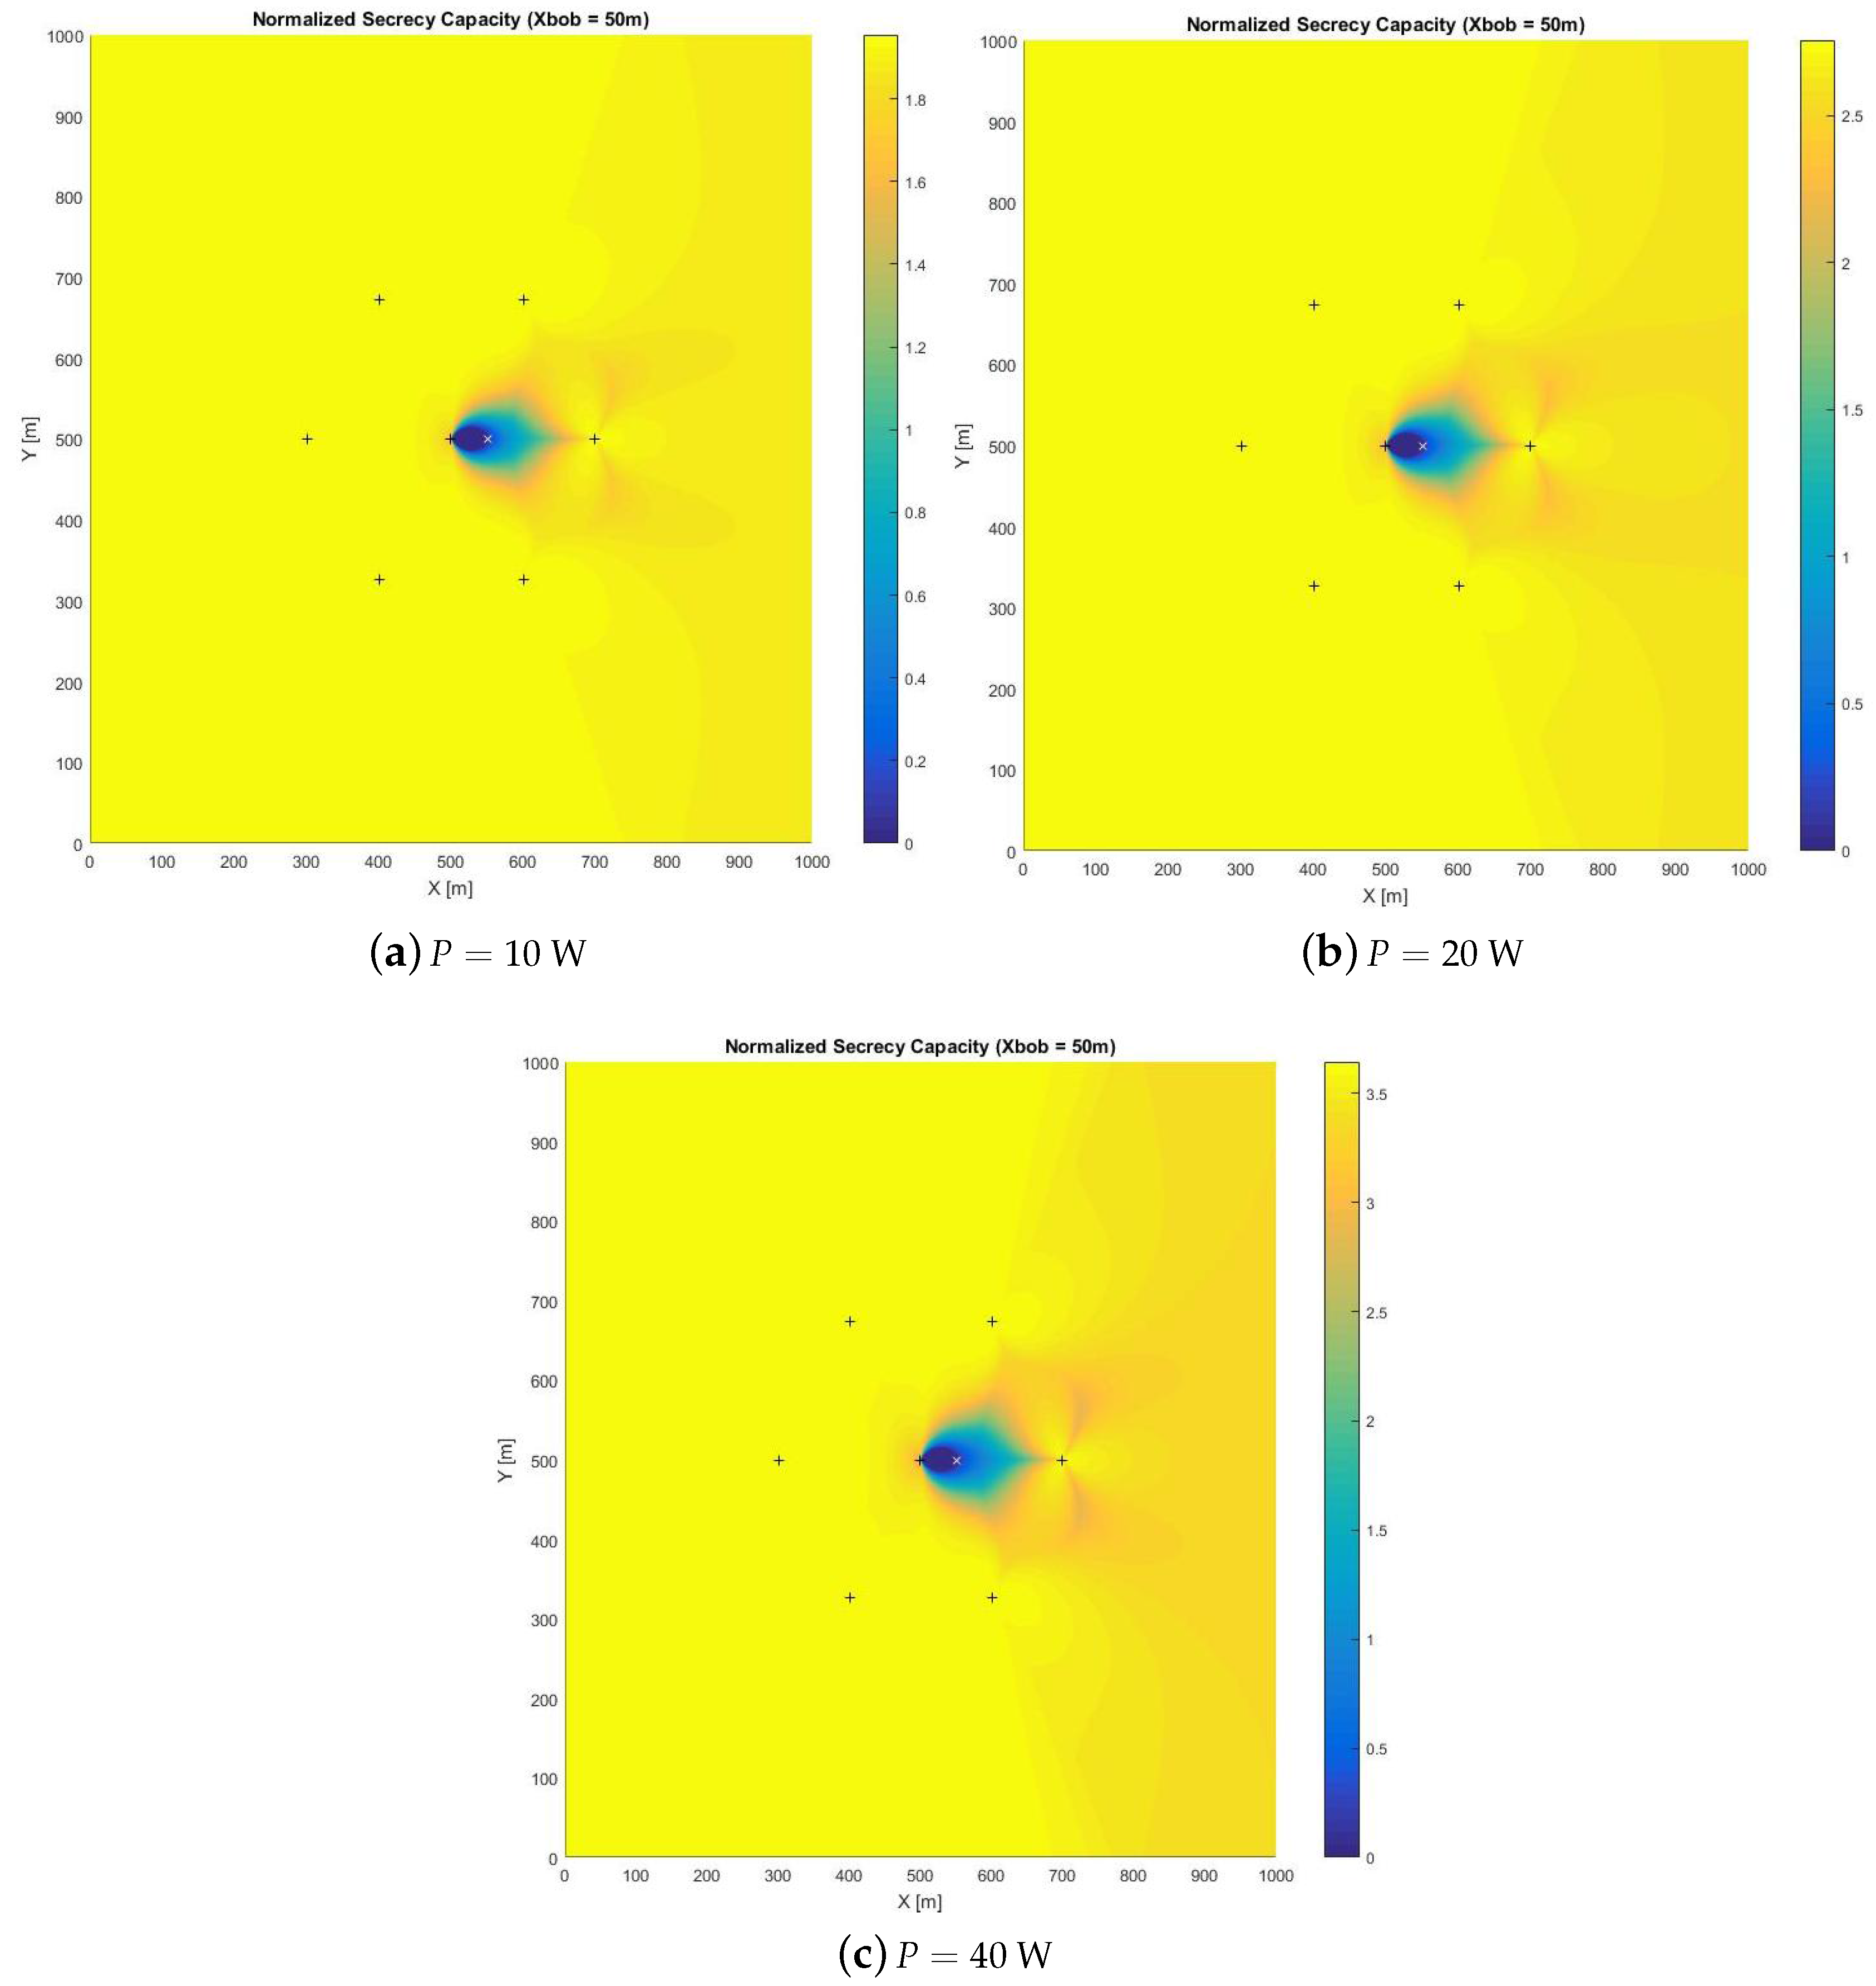
  • Compute the secrecy capacity ( C B C E ) of each point ( x , y ) of the cell area, as Eve was located at that point; in other words, the surface managed by the BS is divided into infinitesimal squares whose surface is equal to d x · d y and the eavesdropper is supposed to be there for the computing of the secrecy capacity;
  • Count each point of the cell area that gives a secrecy capacity equal to or greater than the target rate;
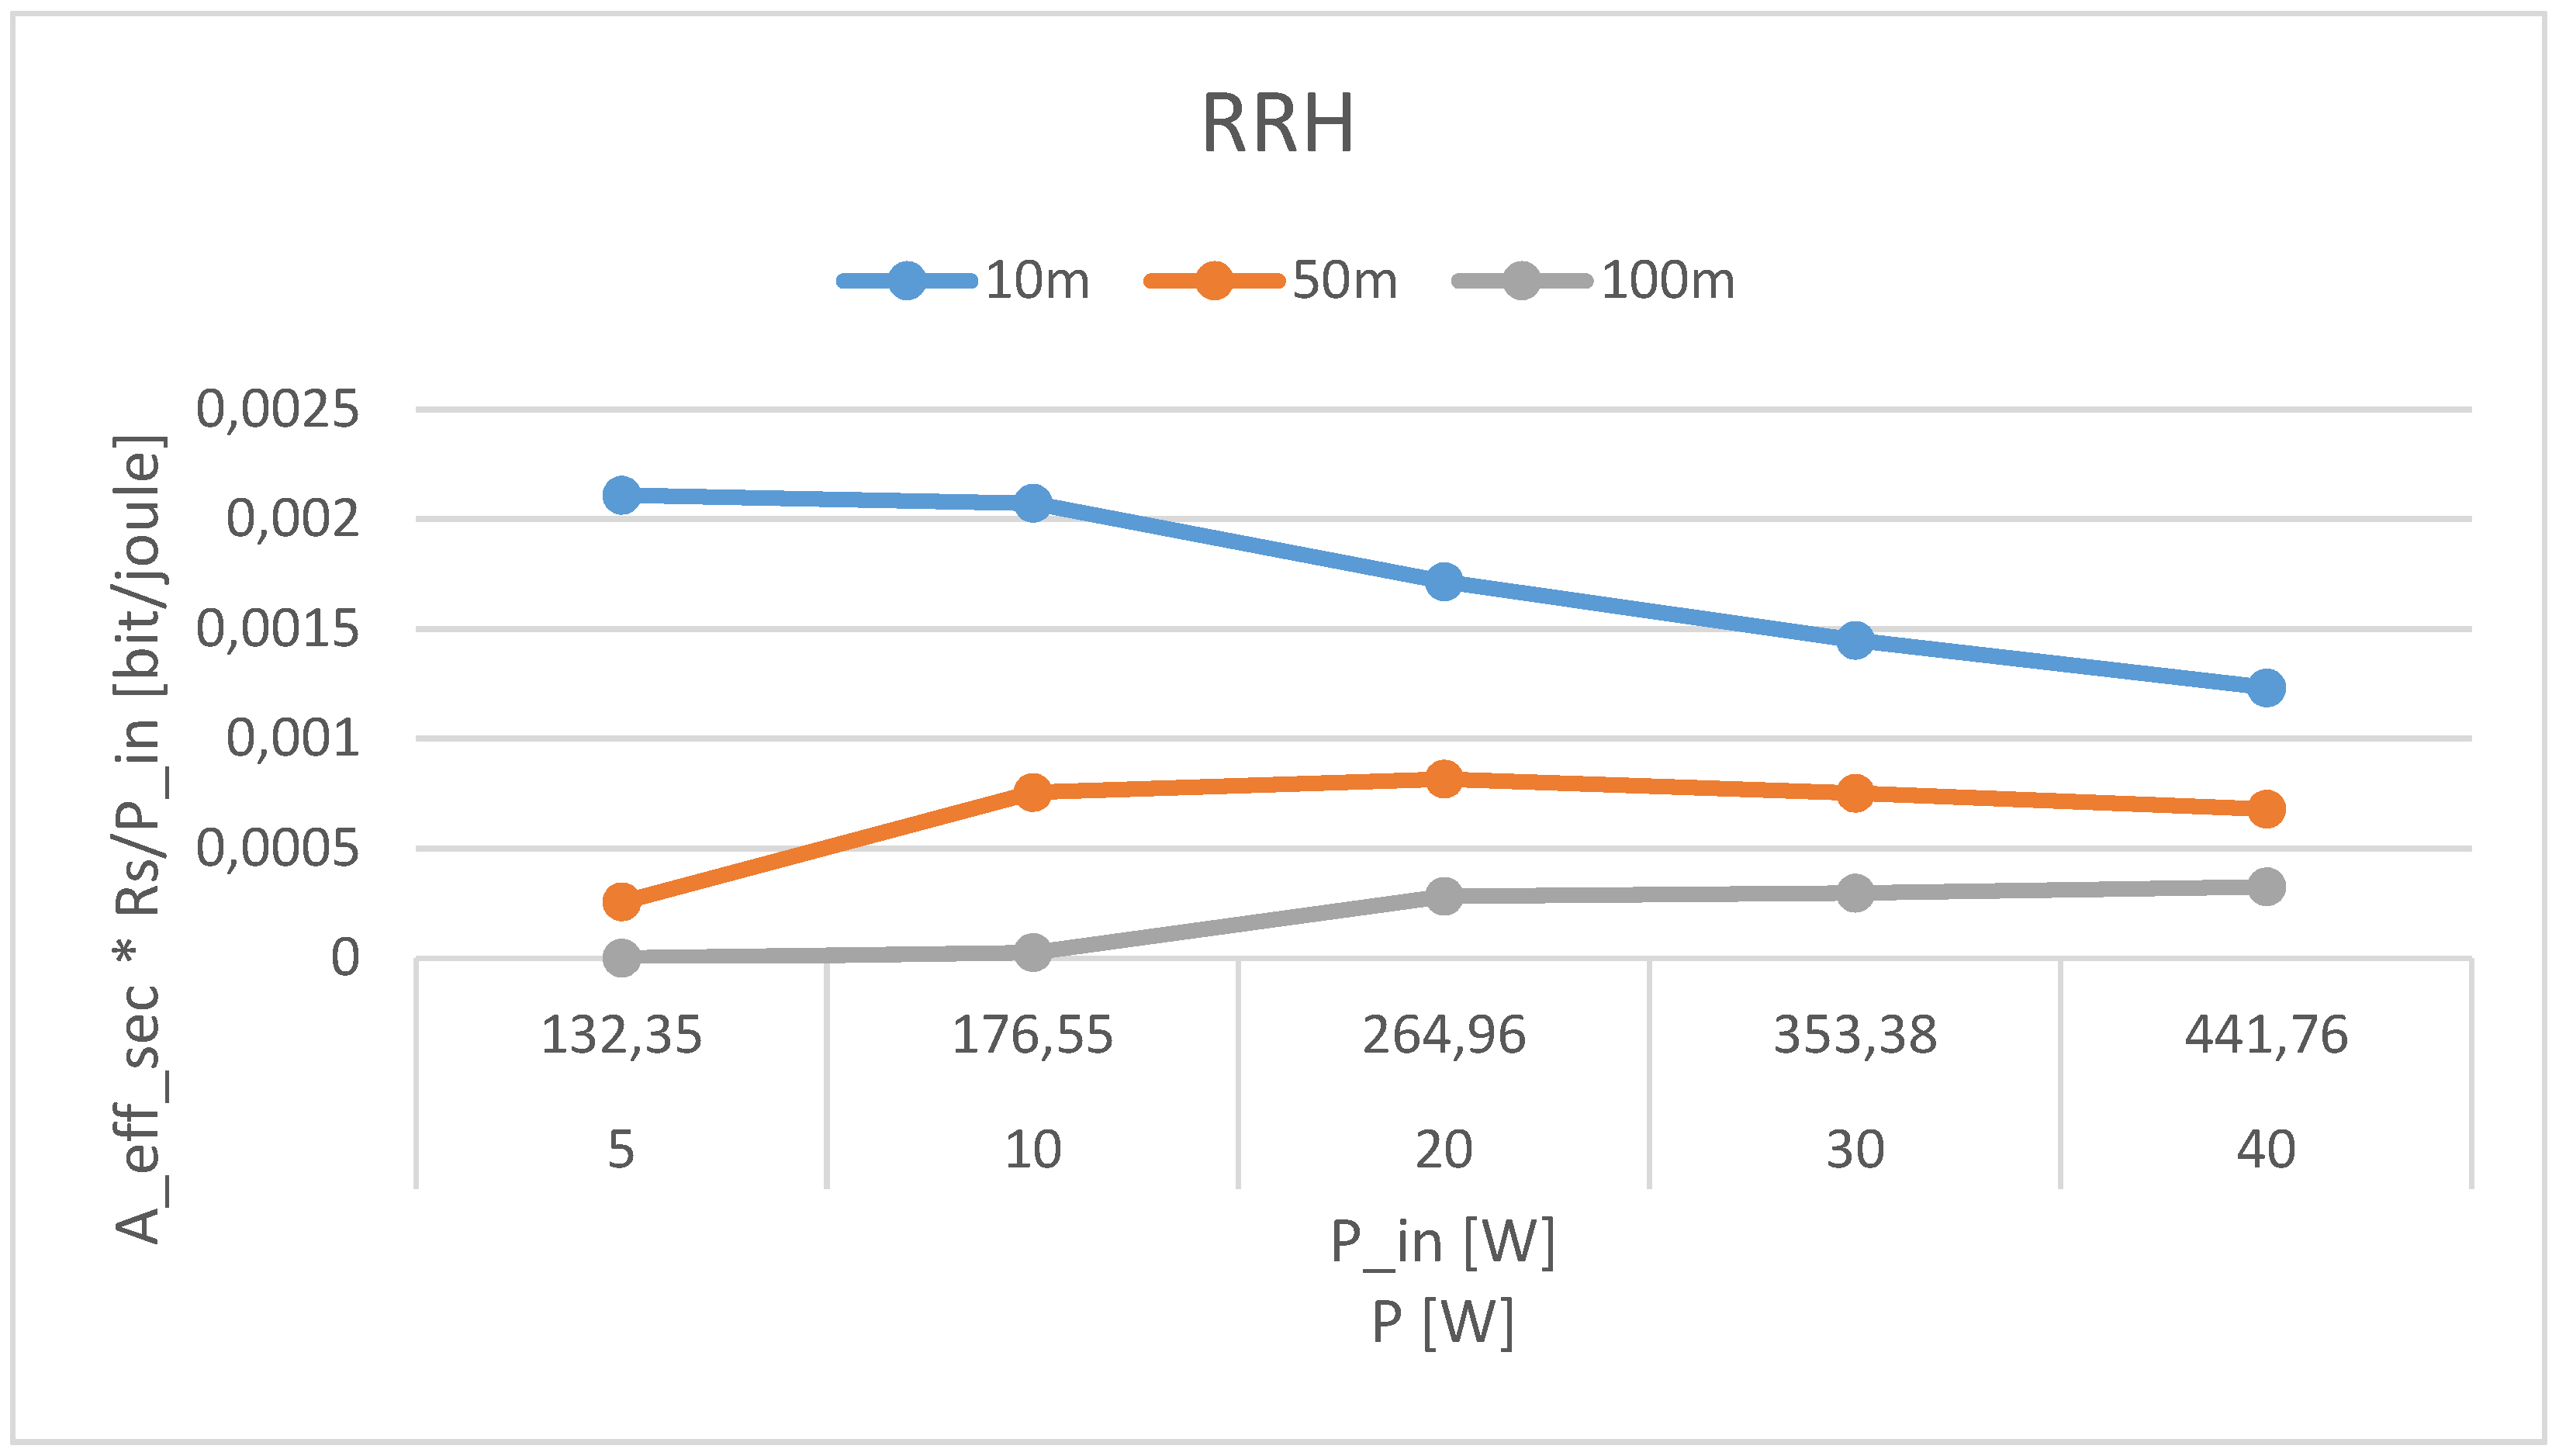
  • Compute the effective secrecy area as the ratio between the set of points that give a secrecy capacity equal to or greater than the target rate and the transmit power.
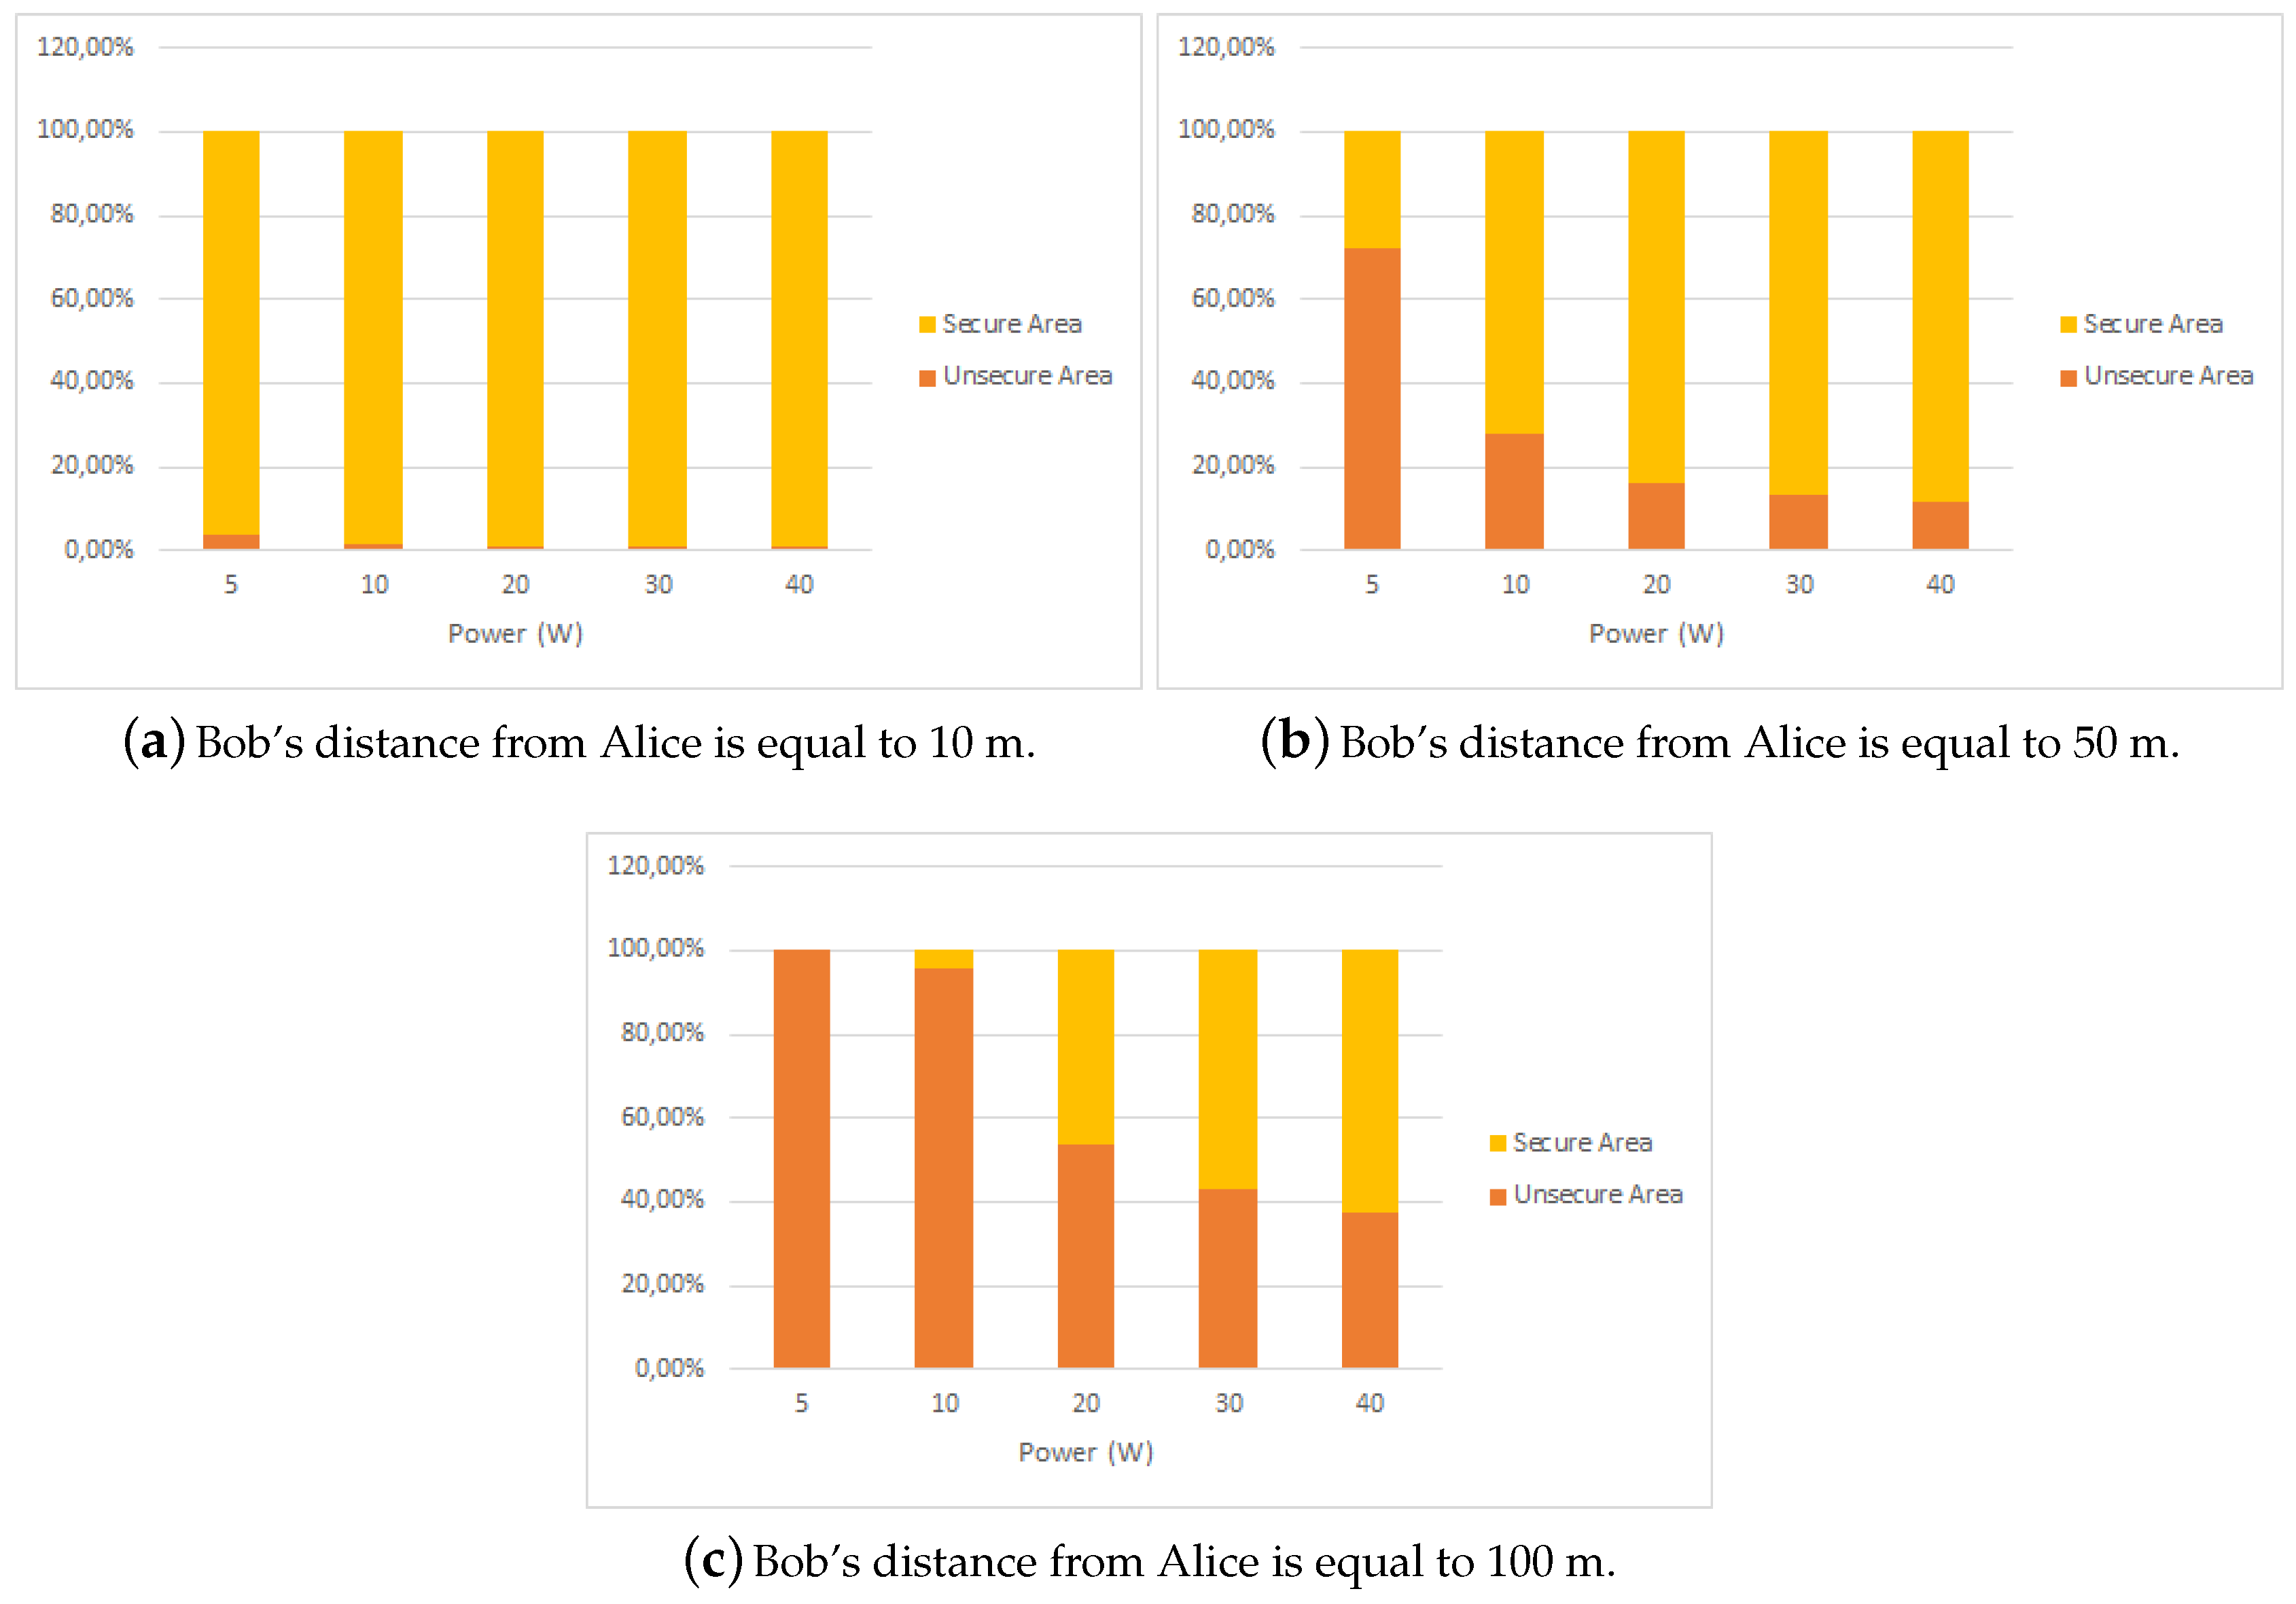
We propose a first metric that is called effective secrecy area per power unit [ W 1 ] and defined as:
ρ 1 = A s [ eff ] P ,
where P is the power transmitted by the BS (Alice). Given the distance of the user (Bob), this metric can identify the transmit power to be used by the BS (Alice) in order to maximize the secure area in the sector. Thus, the metric allows the BS to maximize the area of security while minimizing the transmit power, i.e., saving energy at the same time.
Since the main goal of this paper is the maximization of the effective secrecy area for the affordable target date rate with the BS minimum power consumption, we propose another metric that is called Effective Secrecy-Energy Efficiency [Bit/Joule] and is defined as:
ρ 2 = A s [ eff ] · R ¯ S P i n ,
where P i n is the BS power consumption as defined in Equation (2) and R ¯ s is the target secrecy rate. Given the distance of the user (Bob), this metric helps to identify the power to be used by BS (Alice) to maximize the secure area as well as the cost in terms of energy requested to send a secret bit stream to the legitimate receiver. Hence, this metric is a toll that helps to maximize the area of security, and, at the same time, minimize the BS power consumption. It is important to note that the secrecy area is intended as the area where the eavesdropper can stay without driving the secrecy capacity of the legitimate link under the target secrecy rate. Note that the power consumption of the BS (Alice) has been calculated by using a complete model (2), which takes into account any source of energy consumption in the BS equipment, even if the width of the area coverage is determined only by the transmit power P. The results are shown in the following section.

4. Results

In this section, the results that have been obtained by numerically computing the values of Equations (5)–(7) are discussed. Figure 4 shows the percentage of the secure area A s [ eff ] and of the complementary unsecure region ( 1 A s [ eff ] ), referred to as the overall area of the cell sector. The transmit power of Alice ranges from 5 to 40 W, while the distance of Bob varies from 10 to 100 m.
Some conclusions about secure and unsecure areas can be drawn:
  • If Bob is close to Alice (10 m), a power increase does not imply a proportional enlargement in the secure area;
  • When Bob is in the middle of the cell (50 m), a power increase is beneficial from the security point of view: the unsecure area becomes smaller; anyway, continuing to increase the power over and over does not imply a remarkably larger secure area; a sort of saturation in the extension of the secure area can be observed when the power increases over 10 W;
  • When Bob is in the boundary of the cell (100 m), a higher power is needed to obtain a secure area of about 50 % of the cell sector extension; moreover, a higher than 20 W transmit power gives tiny enlargements of the secure area.
Figure 5 shows the values of the metric ρ 1 (6) as a function of Bob’s distance and Alice’s transmit power. As it can be seen, there is always an optimum transmit power for Alice for every distance of Bob, i.e., the minimum power maximizing the effective secrecy area. Increasing the power over the optimum does not give benefits, i.e., the secure area does not increase considerably, while the power consumption gets higher.
Figure 6 and Figure 7 show the values of the metric ρ 2 (7) as a function of the Bob’s distance and power consumption P i n for two different BS types that are described in in [15], the Remote Radio Head (RRH) (According to the EARTH Deliverable D2.3 the maximum RRH transmit power is equal to 20 W: nonetheless, in the computation of the Effective Secrecy-Energy Efficiency metric, we have considered higher power values in order to allow a more complete system evaluation). and the Macro BS, respectively. The target secrecy rate is fixed and set to R ¯ s = 0 . 1 C B . As it can be seen, for every distance of Bob, there is always an optimum power consumption, i.e., the minimum power that maximizes the effective secrecy area. As in the previous case, if the power is increased over this value, negligible additional benefits are achieved.
The Effective Secrecy-Energy Efficiency vs. BS power consumption curves are not monotone: particularly, the maximum of the proposed metric is achieved for different power consumption values that depend on Bob’s position; this result confirms that the optimization of the tradeoff between the security area, the afforded date-rate and the power spent by the BS is not a trivial task: particularly, the simple control of the radiated power is not efficient when a target secrecy rate has to be guaranteed to an end-user.
This conclusion is enforced by the results that are shown in Figure 8, which presents the percentage of unsecure area (over the total coverage) as a function of the distance of Bob and the target secrecy rate R ¯ s to be supported. The target secrecy rate is calculated as the percentage of the capacity of the legitimate link, i.e., R ¯ s = { 1 % , 5 % , 10 % , 20 % , 50 % } of C B . The BS power consumption P i n is fixed and, for Macro BSand assuming P = 20 and N T R X = 3 , i.e., one carrier per sector, is set to 291 . 22 W (This value is obtained by following the recommendations of the EARTH (Energy Aware Radio neTwork tecHnololgies) project). As it can be seen, the higher the target secrecy rate, the wider the unsecure area. In particular, with a distance of Bob of 50 m and a target secrecy rate of 20% of the capacity of the legitimate link, 1 / 3 of the BS area is unsecure.

5. Conclusions

In this paper, two original metrics are proposed to evaluate the optimum tradeoff between the secure area, the transmitted data and the BS power consumption. The context is the 3GPP cellular network environment. The base station has to guarantee the minimum secrecy rate to the end user in the largest area together with the optimization of the power consumption. The metrics that have been proposed here can be optimized, obtaining the minimum power for which the secure area in the cell is maximized. Numerical results show how the behaviour of the secrecy capacity in the cell as a function of the transmit power and distance of the end user.
We believe that this preliminary study can be useful in the very near future of cellular networks to implement the mandatory energy saving strategies while providing secure services to the end users.

Author Contributions

Luca Simone Ronga conceived the system model, Lorenzo Mucchi contributed about the Secrecy Capacity, Simone Morosi contributed about the metrics and Fabio Ciabini performed the simulation. All authors have read and approved the final manuscript.

Conflicts of Interest

The authors declare no conflict of interest.

References

  1. Wyner, A.D. The wire-tap channel. Bell Syst. Tech. J. 1975, 54, 1355–1387. [Google Scholar] [CrossRef]
  2. Cheong, L.Y.; Hellman, M. The Gaussian wire-tap channel. IEEE Trans. Inf. Theory 1978, IT-24, 451–456. [Google Scholar] [CrossRef]
  3. Gopala, P.K.; Lai, L.; El-Gamal, H. On the secrecy capacity of fading channels. IEEE Trans. Inf. Theory 2008, 54, 4687–4698. [Google Scholar] [CrossRef]
  4. Mucchi, L.; Ronga, L.S.; del Re, E. A novel approach for physical layer cryptography in wireless networks. Wirel. Pers. Commun. 2010, 53, 329–347. [Google Scholar] [CrossRef]
  5. Mucchi, L.; Ronga, L.S.; del Re, E. Physical layer cryptography and cognitive networks. Wirel. Pers. Commun. 2011, 58, 95–109. [Google Scholar] [CrossRef]
  6. Mucchi, L.; Ronga, L.; Chisci, G. Noise-loop multiple access. IEEE Trans. Veh. Technol. 2015, 65, 8255–8266. [Google Scholar] [CrossRef]
  7. The Climate Group, GeSI. SMART 2020: Enabling the Low Carbon Economy in the Information Age. Available online: http://www.gesi.org/files/Reports/Smart%202020%20report%20in%20English.pdf (accessed on 26 October 2016).
  8. Gartner Study. 2007. Available online: http://www.gartner.com/newsroom/id/503867 (accessed on 26 October 2016).
  9. Bianco, C.; Cucchietti, F.; Griffa, G. Energy consumption trends in the next generation access network, a telco perspective. In Proceedings of the 2007 29th International Telecommunications Energy Conference (INTELEC), Rome, Italy, 30 September–4 October 2007; pp. 737–742.
  10. Prakash, S.; Baron, Y.; Liua, R.; Proske, M.; Schlsser, A. Study on the Practical Application of the New Framework Methodology for Measuring the Environmental Impact of ICT Cost/Benefit Analysis; European Commission: Brussels, Belgium, 2014. [Google Scholar]
  11. Morosi, S.; Piunti, P.; del Re, E. Improving cellular network energy efficiency by joint management of sleep mode and transmission power. In Proceedings of the 2013 24th Tyrrhenian International Workshop on Digital Communications—Green ICT (TIWDC), Genoa, Italy, 23–25 September 2013; pp. 1–6.
  12. Chen, T.; Yang, Y.; Zhang, H.; Kim, H.; Horneman, K. Network energy saving technologies for green wireless access networks. IEEE Wirel. Commun. 2011, 18, 30–38. [Google Scholar] [CrossRef]
  13. Feng, D.; Jiang, C.; Lim, G.; Cimini, L.J.; Feng, G.; Li, G.Y. A survey of energy-efficient wireless communications. IEEE Commun. Surv. Tutor. 2013, 15, 167–178. [Google Scholar] [CrossRef]
  14. Piunti, P.; Cavdar, C.; Morosi, S.; Teka, K.E.; del Re, E.; Zender, J. Energy efficient adaptive cellular network configuration with qos guarantee. In Proceedings of the IEEE International Conference on Communications (ICC), London, UK, 8–12 June 2015; pp. 68–73.
  15. Auer, G.; Blume, O.; Giannini, V.; Godor, I.; Imran, M.; Jading, Y.; Katranaras, E.; Olsson, M.; Sabella, D.; Skillermark, P.; et al. Deliverable D2.3: Energy efficiency analysis of the reference systems, areas of improvements and target breakdown. Energy Aware Radio Netw. Technol. (EARTH) European Project 2012. Available online: http://cordis.europa.eu/docs/projects/cnect/3/247733/080/deliverables/001-EARTHWP2D23v2.pdf (accessed on 26 October 2016). [Google Scholar]
  16. De Meulenaer, G.; Gosset, F.; Standaert, F.X.; Pereira, O. On the energy cost of communication and cryptography in wireless sensor networks. In Proceedings of the 2008 IEEE International Conference on Wireless and Mobile Computing, Networking and Communications, Avignon, France, 12–14 October 2008; pp. 580–585.
  17. Wang, L.; Zhang, X.; Ma, X.; Song, M. Joint optimization for energy consumption and secrecy capacity in wireless cooperative networks. In Proceedings of the 2013 IEEE Wireless Communications and Networking Conference (WCNC), Shanghai, China, 7–10 April 2013; pp. 941–946.
  18. LTE Evolved Universal Terrestrial Radio Access—Radio Frequency (RF) System Scenarios (3GPP TR 36.942 version 13.0.0 Release 13). ETSI TR 136 942 V13.0.0. Available online: http://www.etsi.org/deliver/etsi_tr/136900_136999/136942/09.00.01_60/tr_136942v090001p.pdf (accessed on 26 October 2016).
  19. Shannon, C.E. Communication theory of secrecy systems. Bell Syst. Tech. J. 1949, 29, 656–715. [Google Scholar] [CrossRef]
  20. Barros, J.; Rodrigues, M.R.D. Secrecy capacity of wireless channels. In Proceedings of the 2006 IEEE International Symposium on Information Theory, Seattle, WA, USA, 9–14 July 2006; pp. 356–360.
Figure 1. SINR geographical distribution for P = 20 W.
Information 07 00060 g001
Figure 2. Secrecy capacity geographical distribution for P = 20 W.
Information 07 00060 g002
Figure 3. Secrecy capacity geographical distribution when Bob’s distance from Alice is 50 m.
Information 07 00060 g003
Figure 4. Secure and unsecure areas when Bob’s distance is { 10 , 50 , 100 } m and P = { 5 , 10 , 20 , 30 , 40 } W.
Information 07 00060 g004
Figure 5. Effective secrecy area versus transmit power as a function of Bob’s distance and transmit power.
Information 07 00060 g005
Figure 6. Effective Secrecy-Energy Efficiency as a function of the power consumption P i n for different distances of the legitimate receiver { 10 , 50 , 100 } m. The corresponding radiated power P is reported in the x-axis under the P i n value. The power consumption is referred to a Remote Radio Head (RRH).
Information 07 00060 g006
Figure 7. Effective Secrecy-Energy Efficiency as a function of the power consumption P i n for different distances of the legitimate receiver { 10 , 50 , 100 } m. The corresponding radiated power P is reported in the x-axis under the P i n value. The power consumption is referred to a Macro BS.
Information 07 00060 g007
Figure 8. Percentage of unsecure area (over the total coverage) as a function of the distance of Bob and the target secrecy rate to be supported. The transmit power is P = 20 W, which corresponds to a consumed power P i n = 291 . 22 W.
Information 07 00060 g008
Table 1. Secrecy capacity values when Bob’s distance from Alice is equal to { 10 , 50 , 100 } m and P = 20 W. The total area covered by the BS is 9336 m 2 .
Bob’s Distance10 m50 m100 m
Unsecure Area 0 . 97 % 16 . 20 % 53 . 79 %
Secure Area 99 . 03 % 83 . 80 % 46 . 21 %
Table 2. Secrecy capacity values when Bob’s distance from Alice is 50 m and P = { 10 , 20 , 40 } W.
Alice’s Power10 W20 W40 W
Unsecure Area 27 . 87 % 16 . 20 % 11 . 56 %
Secure Area 72 . 13 % 83 . 80 % 88 . 44 %

