
An Energy-Efficient Routing Algorithm in Three-Dimensional Underwater Sensor Networks Based on Compressed Sensing

1
School of Information and Electrical Engineering, Harbin Institute of Technology (Weihai), Weihai 264209, China
2
Automatic Test and Control Institute, Harbin Institute of Technology, Harbin 150001, China
*
Author to whom correspondence should be addressed.
Information 2017, 8(2), 66; https://doi.org/10.3390/info8020066
Submission received: 8 May 2017
/
Revised: 12 June 2017
/
Accepted: 14 June 2017
/
Published: 16 June 2017
(This article belongs to the Section Information and Communications Technology)
Abstract
:Compressed sensing (CS) has become a powerful tool to process data that is correlated in underwater sensor networks (USNs). Based on CS, certain signals can be recovered from a relatively small number of random linear projections. Since the battery-driven sensor nodes work in adverse environments, energy-efficient routing well-matched with CS is needed to realize data gathering in USNs. In this paper, a clustering, uneven-layered, and multi-hop routing based on CS (CS-CULM) is proposed. The inter-cluster transmission and fusion are fulfilled by an improved LEACH protocol, then the uneven-layered, multi-hop routing is adopted to forward the packets fused to sink node for data reconstruction. Simulation results show that CS-CULM can achieve better performances in energy saving and data reconstruction.
1. Introduction
Underwater sensor networks (USNs) are significant facilities to help people explore the oceans. Since the energy-limited nodes work in adverse environments, the design of energy-efficient routing for three-dimensional USNs to achieve data collection is important [1]. Clustering algorithms [2] which are available for small-scale networks can balance energy consumption. As a tree-based routing, 3DIAIR [3] can preclude loops and dead ends effectively in three-dimensional networks. However, the current routing protocols are mainly aimed at the design of data transmission, and energy-efficient data fusion measures are needed urgently.
Compressed sensing (CS) was proposed by Candès and Terres Tao [4], and brought a revolutionary breakthrough to signal acquisition technology. It opens a new approach to the extraction, transmission, and distribution of information together in USNs. In current research, routing protocols based on CS for USNs have caused serious concern. Ref. [5] firstly takes CS into application in wireless sensor networks (WSNs), but it did not consider data processing and multi-hop communication with sink node. A novel data gathering algorithm based on CS for heterogeneous WSNs is proposed in [6], but it is only available for two-dimensional WSNs.
When we put three-dimensional USNs into an underwater environment, information must be taken by acoustic wave signal. This leads to some problems: (1) low bandwidth—the effective bandwidth is about 30 KHz when the transmitting distance is about 100 m; (2) long time delay—the acoustic wave transmits at a speed of 1500 m/s and will lead to a delay of 0.64 s/km, which will reduce the underwater acoustic channels’ capacity; (3) serious attenuation—the attenuation is mainly depending on distance, but with a different calculating formula compared with other wireless media; (4) noise and interference—the large background noise and interference will cause low receiving signal-to-noise ratio and increasing error probability. These problems jointly decide that we should transmit information as few as possible in USNs. As a result, we can adopt CS for data compression at the transmitting node and data reconstruction with less data at the receiving node. In addition, another fact we cannot ignore is that all nodes in USNs are driven by batteries. Battery energy is limited and the battery replacement is also with low operability. Then, we need to design a high energy efficiency transmitting method when attempting to make efficient data acquisition and transmission.
In order to achieve efficient data gathering in three-dimensional USNs, we specifically combine CS, clustering, and multi-hop routing together and design an energy-efficient data gathering scheme based on CS (CS-clustering uneven-layered and multi-hop routing, CS-CULM) to reduce the amount of data required to reconstruct the original network map.
The paper is organized as follows: in Section 2, we make an introduction to CS. The system model is described briefly in Section 3. Section 4 gives the packet format and energy consumption model used in this paper. The CS-CULM algorithm is proposed in Section 5, followed by numerical simulations and discussions in Section 6. Finally, we provide concluding remarks in Section 7.
2. Background on Compressed Sensing
Compressed sensing is a thriving theory which is capable of achieving sampling and compressing together, and can effectively reduce the amount of data transmitted in USNs when an appropriate routing protocol is integrated.
Consider a discrete signal , which can be expanded in an orthogonal basis:
where , . If the coefficient vector have only K () non-zero elements, the original signal x is compressible and called K-sparse. CS concentrates on acquiring x by measuring M () projections. The useful information in the compressible signal x can be captured by the observation process
where y is an column vector, is the sensing matrix, which satisfies the rule of restricted isometry property (RIP) [4].
The original signal x can be reconstructed accurately when the number of random measurements M is larger than (C is a constant irrelevant to N and K). There are plenty of reconstruction algorithms, such as the basis pursuit (BP) algorithm. The greedy search approach is designed to further reduce the computational complexity of BP; an example is the orthogonal matching pursuit (OMP) algorithm [7].
3. System Models
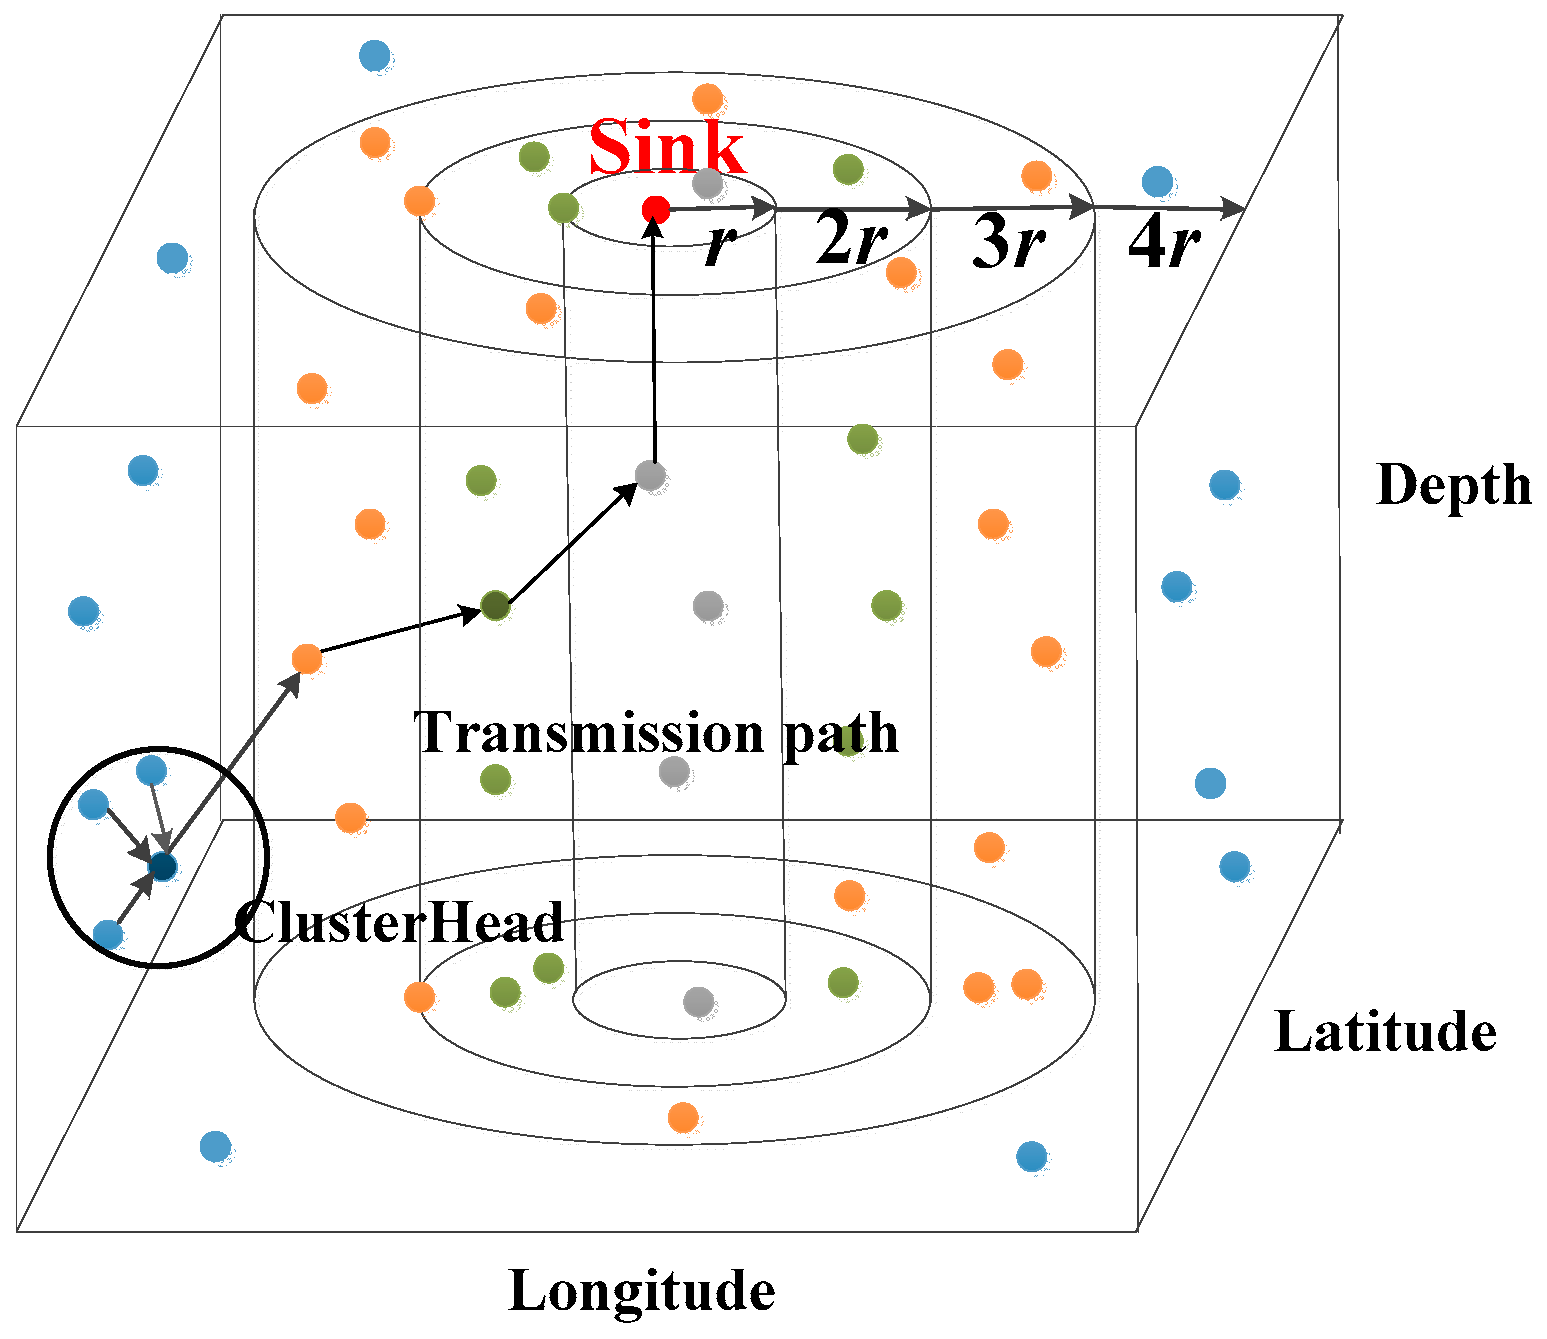
Considering a static USN with n sensor nodes which are randomly deployed at different depths and used for environmental monitoring (as shown in Figure 1), each sensor node has a non-identical communication radius based on their degree. Assume that two nodes can communicate with each other if their Euclidian distance d is smaller than . Additionally, each node has a unique node ID and knows the location information within its broadcast radius .
Let denote the original signal, is the reading of the node. Since the sensed data x are often spatially and/or temporally correlated, it is compressible in an orthogonal basis (e.g., fast Fourier transform (FFT) basis). Take as an example the original temperature on 3 September 2012 GMT, in the Southern California coast (data from http://ourocean.jpl.nasa.gov). The original signal x and its FFT transformation are shown in Figure 2.
Figure 2 shows that the original signal x is sparse in FFT basis. Based on CS, a small quantity of random measurements y can be used to reconstruct the original signal x. Then, the signal model of the CS-CULM scheme can be expressed as .
4. Packet Format and Energy Consumption Model
4.1. Packet Format
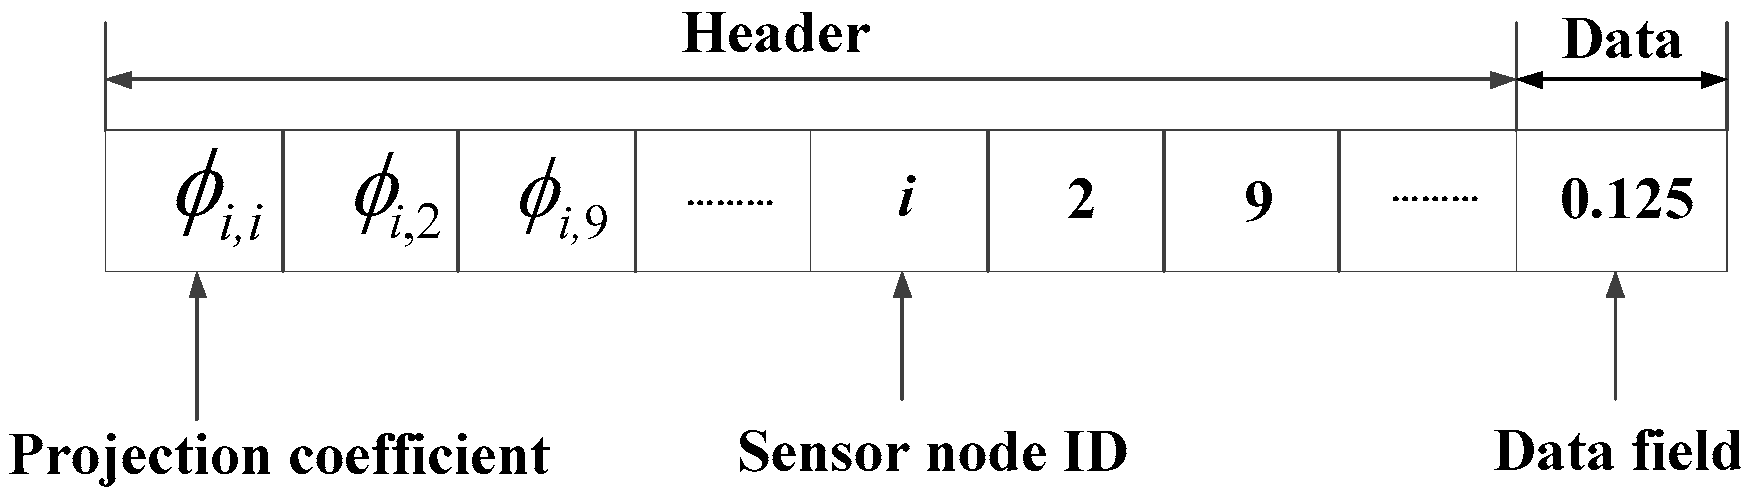
The independent and identically distributed (i.i.d.) Bernoulli vectors provide a universal observation matrix, which is in coherence with FFT basis [8]. Hence, we select Bernoulli coefficients to encode the data gathered into one packet. The selection of random projection coefficient is given by
The packet design is illustrated in Figure 3; the header field has two sections, a 1-bit slot for projection coefficient , and -bit slots for node ID. The data field is constructed by 64-bit slots, which stores the random projection values. There, two packets can be merged into one packet if they do not share any node ID and the length of header does not exceed its maximum length.
4.2. Energy Consumption Model
In this paper, a single-hop energy consumption model based on WHOI Micro-Modem is adopted. The attenuation factor [9] of the underwater acoustic channel for distance l and frequency f is expressed as
where k is the energy spreading factor (1 for cylindrical, 1.5 for practical, and 2 for spherical spreading). In the simulation, we set .
The WHOI energy consumption model [10] depends on these factors: receiving power , electroacoustic conversion power , and single hop transmission delay . The energy consumption is expressed as
where L is packet length, , is
where α is bandwidth utilization and B(L) is bandwidth. In Formula (5), is calculated as
where η is the electronic circuit conversion efficiency and is underwater node transmit power, which is calculated as
where is the optimal transmit frequency, and are the noise and attenuation factor under , and is the required signal-to-noise ratio for receiving data correctly. In addition, it needs to be emphasized that in Formula (5) is not limited by underwater transmission distance, and can be seen as a constant. is only relative to the receiving technology adopted within the underwater sensor nodes. Then, we can take Formula (6)–(8) into (5) and get the energy consumption model.
The values of the parameters used in this paper are shown in Table 1.
5. CS-CULM
At the beginning of the CS-CULM algorithm, each randomly-deployed sensor node i should multiply its reading by a random projection coefficient to form a packet.
5.1. Clustering Algorithm
The location information in the threshold setting of NEW-LEACH [11] results that sensor nodes away from the sink node have a lower probability of becoming cluster heads. The lacking information will be unfavorable for data reconstruction in CS. Therefore, we remove the location information to make the distribution of cluster heads as homogeneous as possible. The cluster heads can be chosen stochastically based on the algorithms, as follows.
where , , are the rest energy, the initial energy, and the energy consumed by the former round, respectively. q is the probability of becoming a cluster head. and are the weight of rest energy and energy consumption rate, and the relationship between them is
When the selection of cluster heads is finished, cluster heads will broadcast cluster information with broadcast radius r. Then common nodes inter-cluster will forward their packets to cluster heads randomly for data fusion. This is completed by a Bernoulli random generator. If a node participates in inter-cluster transmission with probability p, the quantity of nodes n1 will obey a binomial distribution , in which is the number of nodes in one cluster head.
5.2. Uneven-Layered, Multi-Hop Routing
It is well-known that the data volume forwarded by nodes close to sink is huge; thus, hot issues appear, which result in the imbalance of energy consumption. To solve this problem, an uneven-layered, multi-hop routing is proposed.
In real ocean monitoring sensor networks, a fact we cannot ignore is that the sensor distribution span in a horizontal direction is always much larger than that in depth. As a result, rather than layering based on 3-D distance (include depth), we adopt a layering mechanism based on the horizontal distance between the sensor node and sink node. According to the geographical location, sensor nodes initialize their degree. The degree of one node is ni, if
where D is the horizontal distance of a sensor node to sink, and and are the actual length and width coordinates. In this way, the degree space is r, 2r, and so on, as shown in Figure 1. Though the nodes close to sink burden higher network load, the shortest single-hop distance can reduce the energy consumption.
The multi-hop routing algorithm is shown as follows:
- Step 1:
- If the degree of the current cluster head is 1, forward its packet to sink directly;
- Step 2:
- Otherwise, find lower depth nodes in the next degree within broadcast radius ;
- Step 3:
- If the number of nodes in Step 2 , select the node with maximum as the next-hop node;
- Step 4:
- The next-hop node merges its received packet with itself if it meets the fused conditions in Section 4.1. Otherwise, forward the received packet simply;
- Step 5:
- If the number of nodes in Step 2 , the node will look for lower depth and lower D nodes in the same degree and repeat Step 3.
Repeat the steps above until all the cluster headers forward their fused packets to sink node layer-by-layer.
5.3. Data Reconstruction
In this phase, the sink node will extract node IDs, projection coefficients, and fused data in its received packets to form measurement matrix . The number of packets sink received determines the number of measurements M and the non-zero coefficients in each row of , which correspond to the projection coefficients, whose positions are based on the node IDs in the packet header. If the node ID is included in the packet header, ; else, it is equal to 0.
Eventually, the sink node uses the OMP algorithm to reconstruct original data x. If is the reconstructed vector, the data reconstruction error can be calculated by
6. Simulations and Discussion
Monte Carlo simulations are performed with MATLAB to evaluate the performance of the CS-CULM scheme. Besides, we take the temperature on 3 September 2012 GMT, in the Southern California coast (data from http://ourocean.jpl.nasa.gov) as the data to be processed. The main simulation parameters are given in Table 2.
To verify the efficiency of CS-CULM, we compare it with the other three routing algorithms. HLEACH is the clustering algorithm proposed in Section 5.1. 3DIAIR is a three-dimensional angle cycle routing algorithm [3]. CS-CLM is the even-layered scheme. Their data fusion measures are all the same as CS-CULM. In the simulation, the access probability p = 0.7, the probability of becoming a cluster head q = 0.15, and . If a dead node occurs, the network will be out of work.
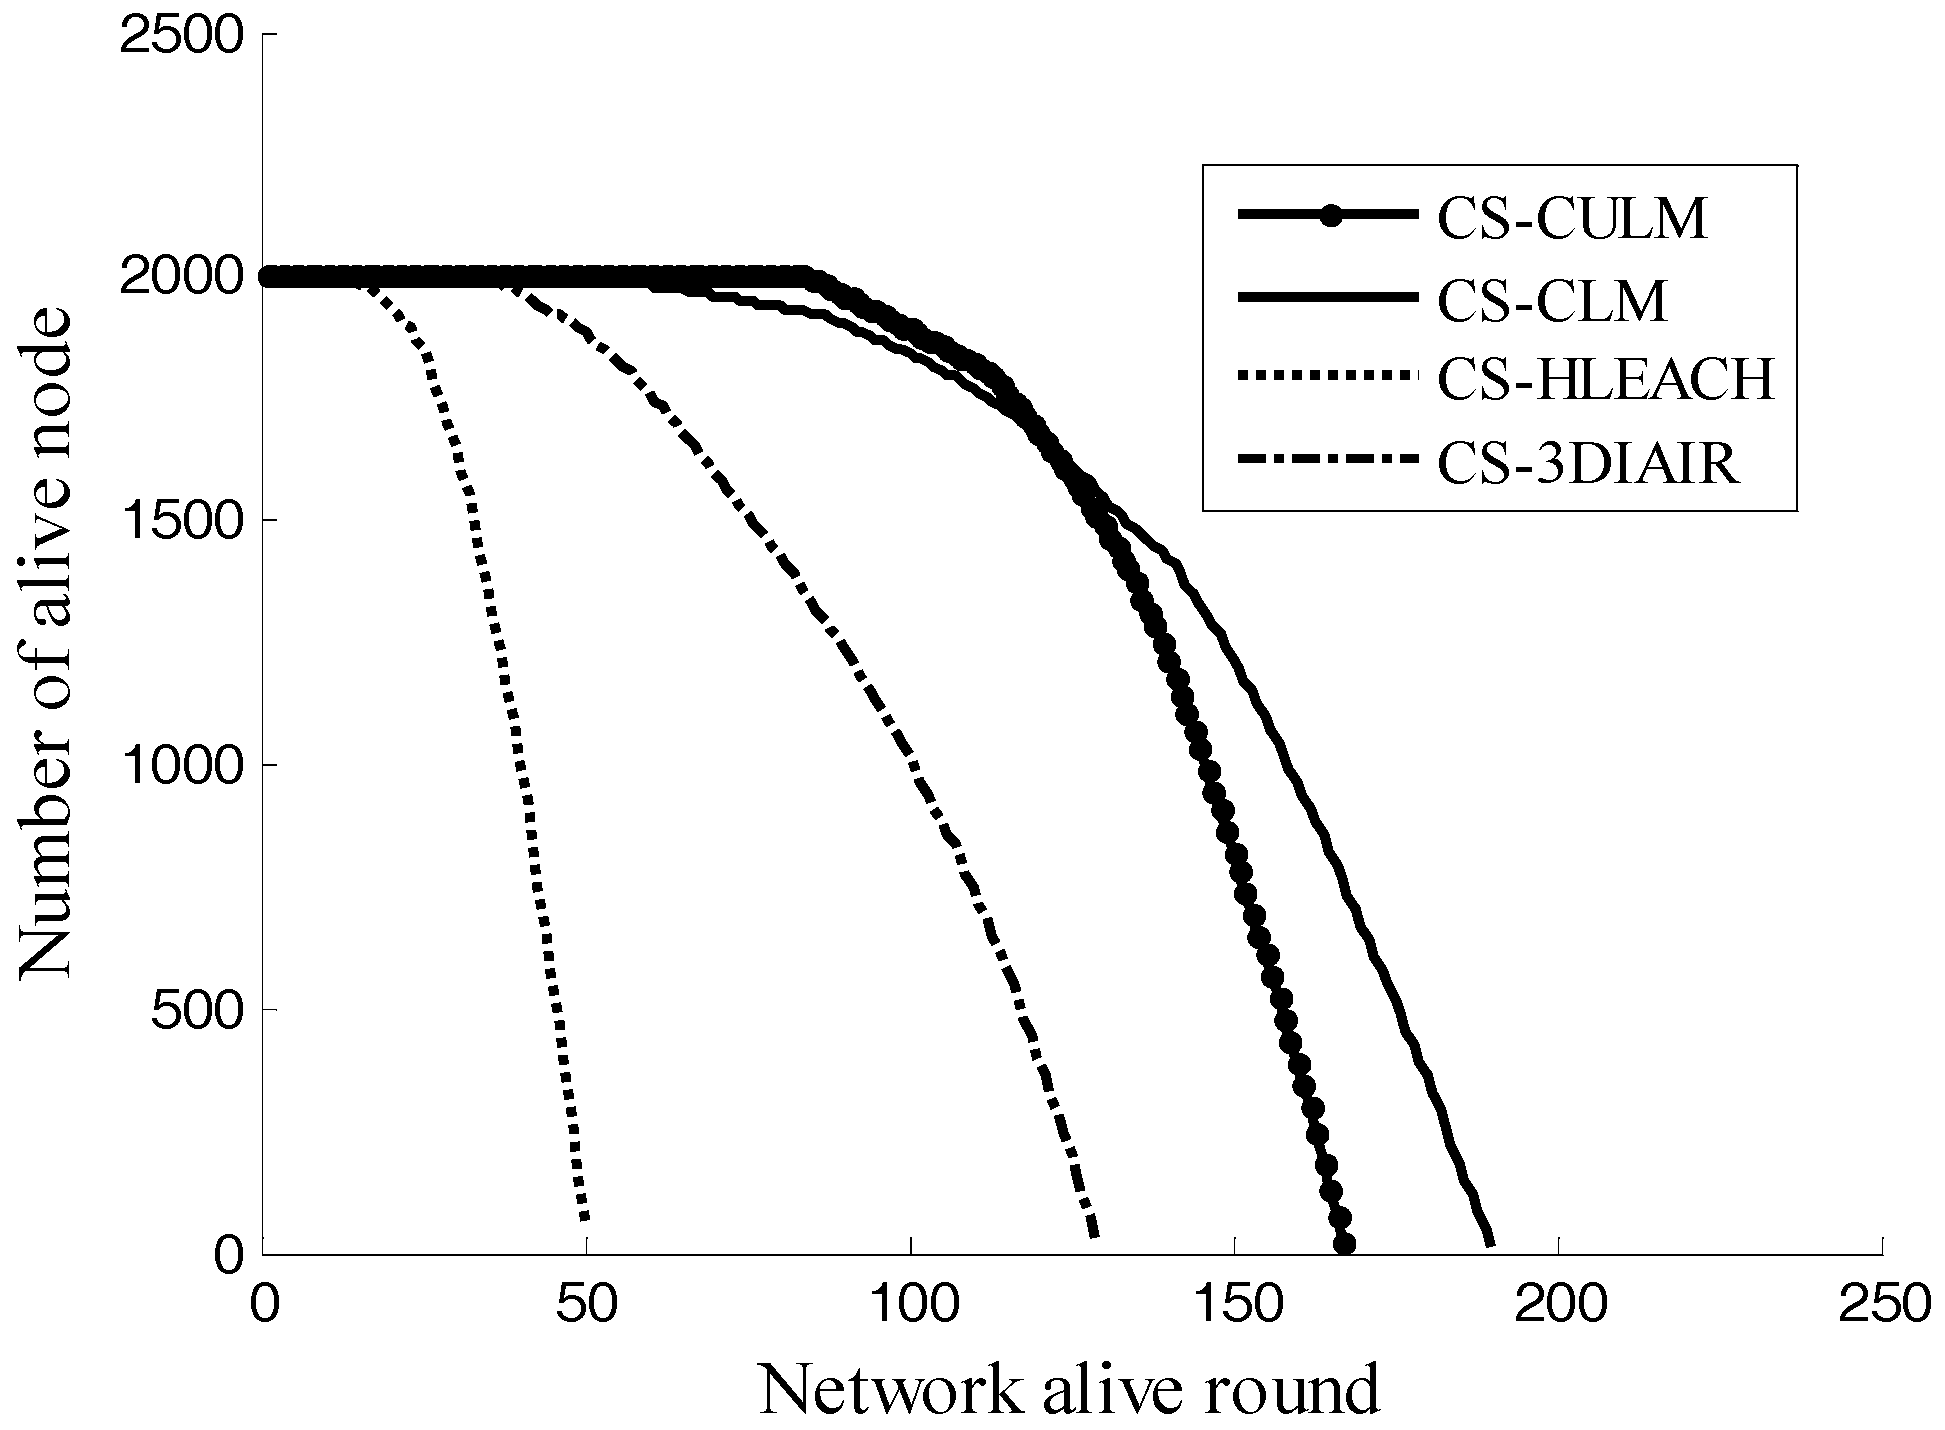
When the basic transmission length r is 3.5 km, the number of alive nodes in USNs—as a function of network alive rounds—is presented in Figure 4.
Because energy is saved by the CS-CULM scheme, the dead nodes occur at last. As for CS-CLM, with the CS-3DIAIR scheme, though the dead node appears before CS-CULM, they have slower dead rate. Additionally, the single-hop mechanism of CS-HLEACH makes it the first to go dead and the dead rate is fast.
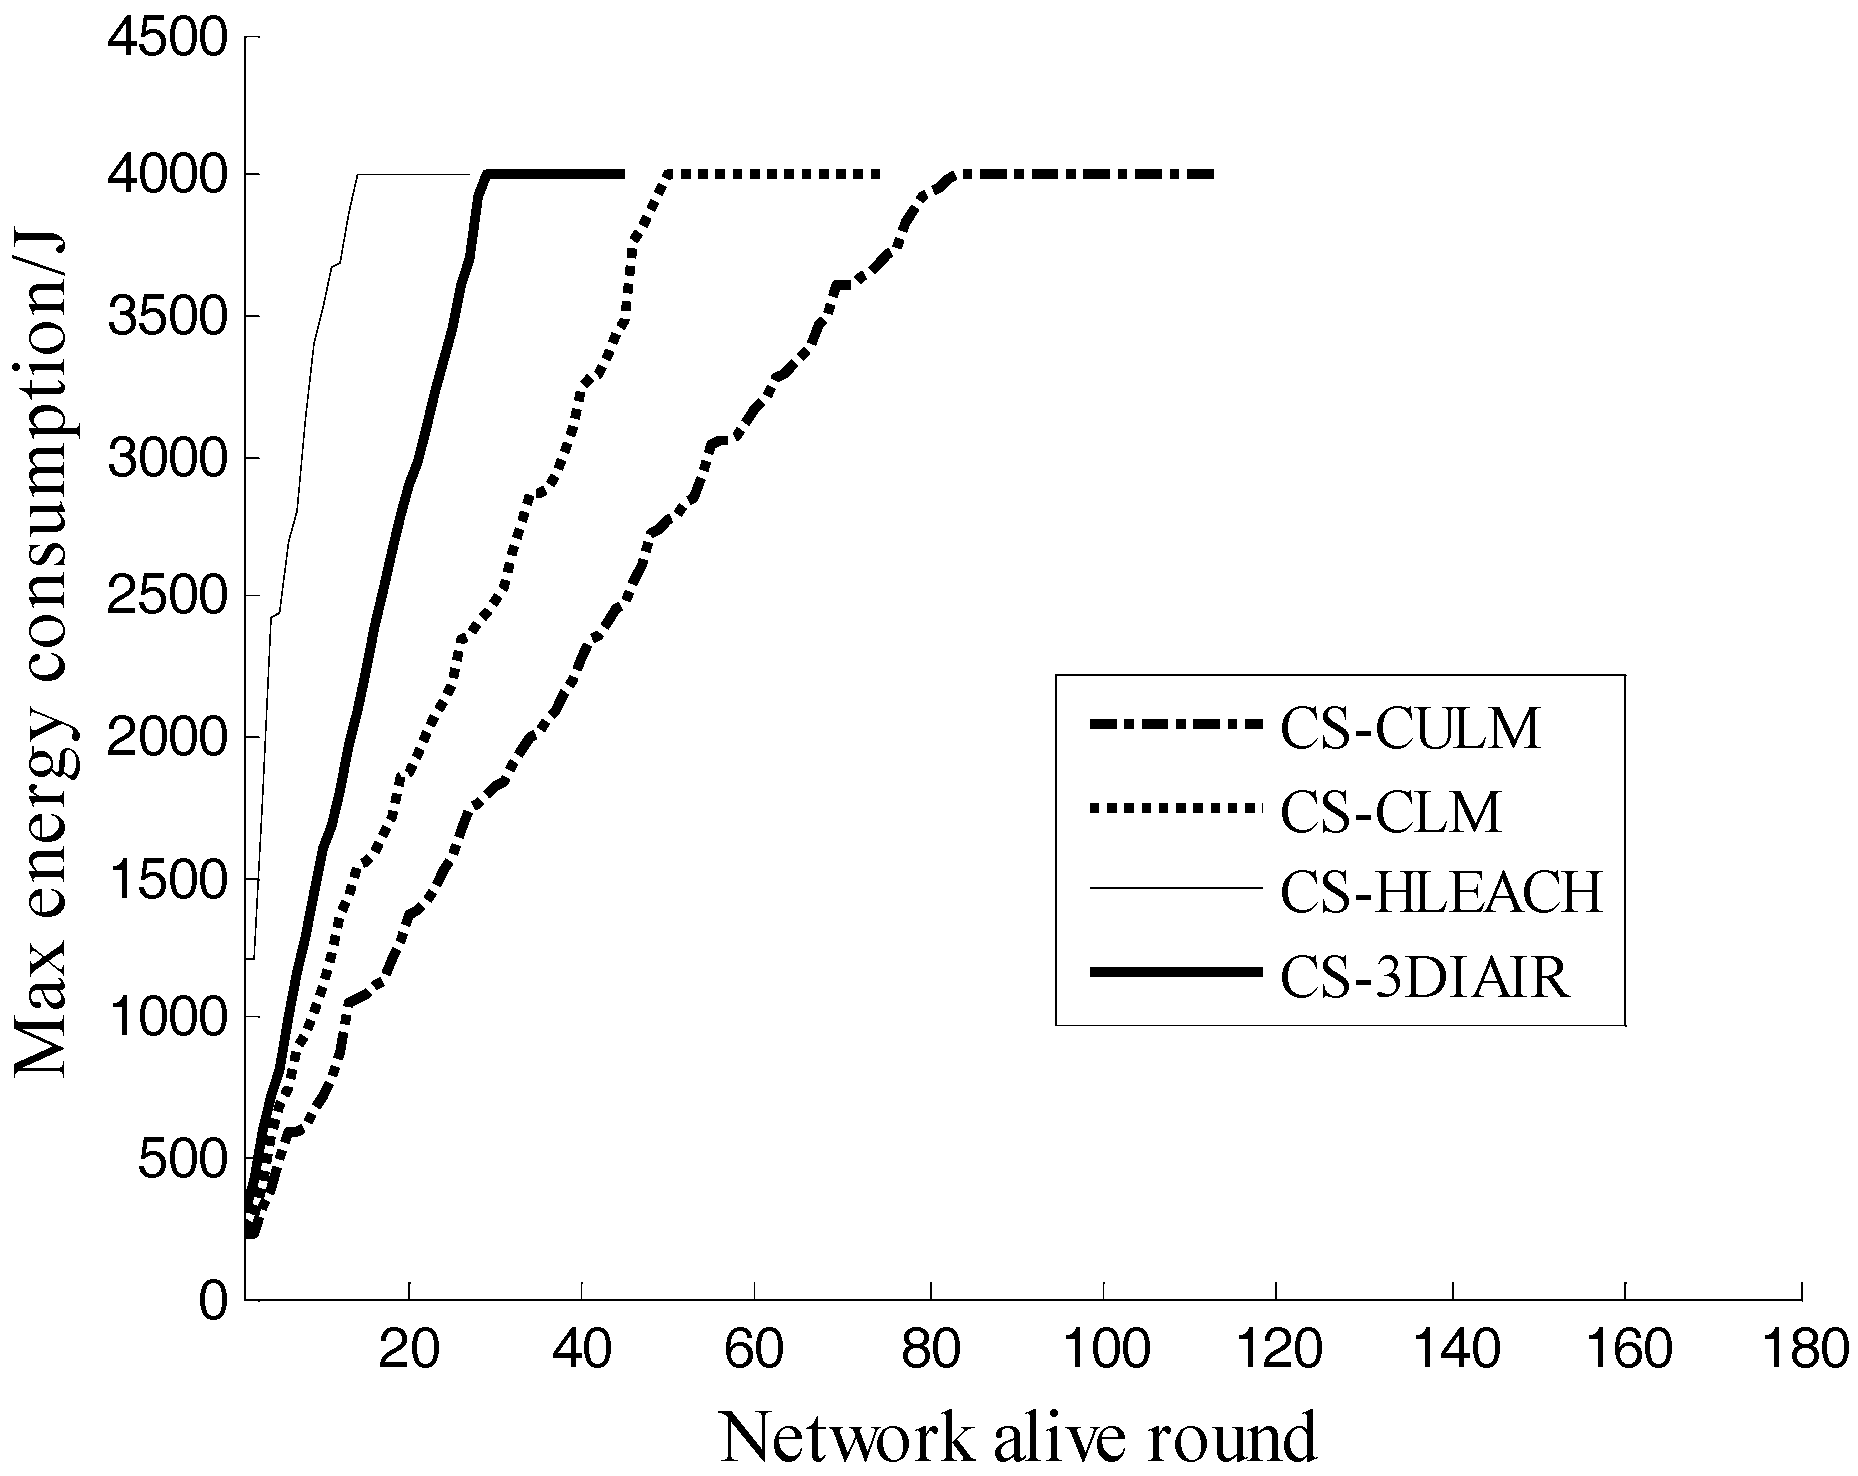
Figure 5 shows the max energy consumption of randomly-deployed sensor nodes over the network alive rounds. In the simulation, if one dead node appears, the max energy consumption of nodes will not increase, and values 4000 J. As we can see, at the same value of network alive rounds, the max energy consumption of CS-CULM is lower than the others; thus, its lifetime achieves the maximum.
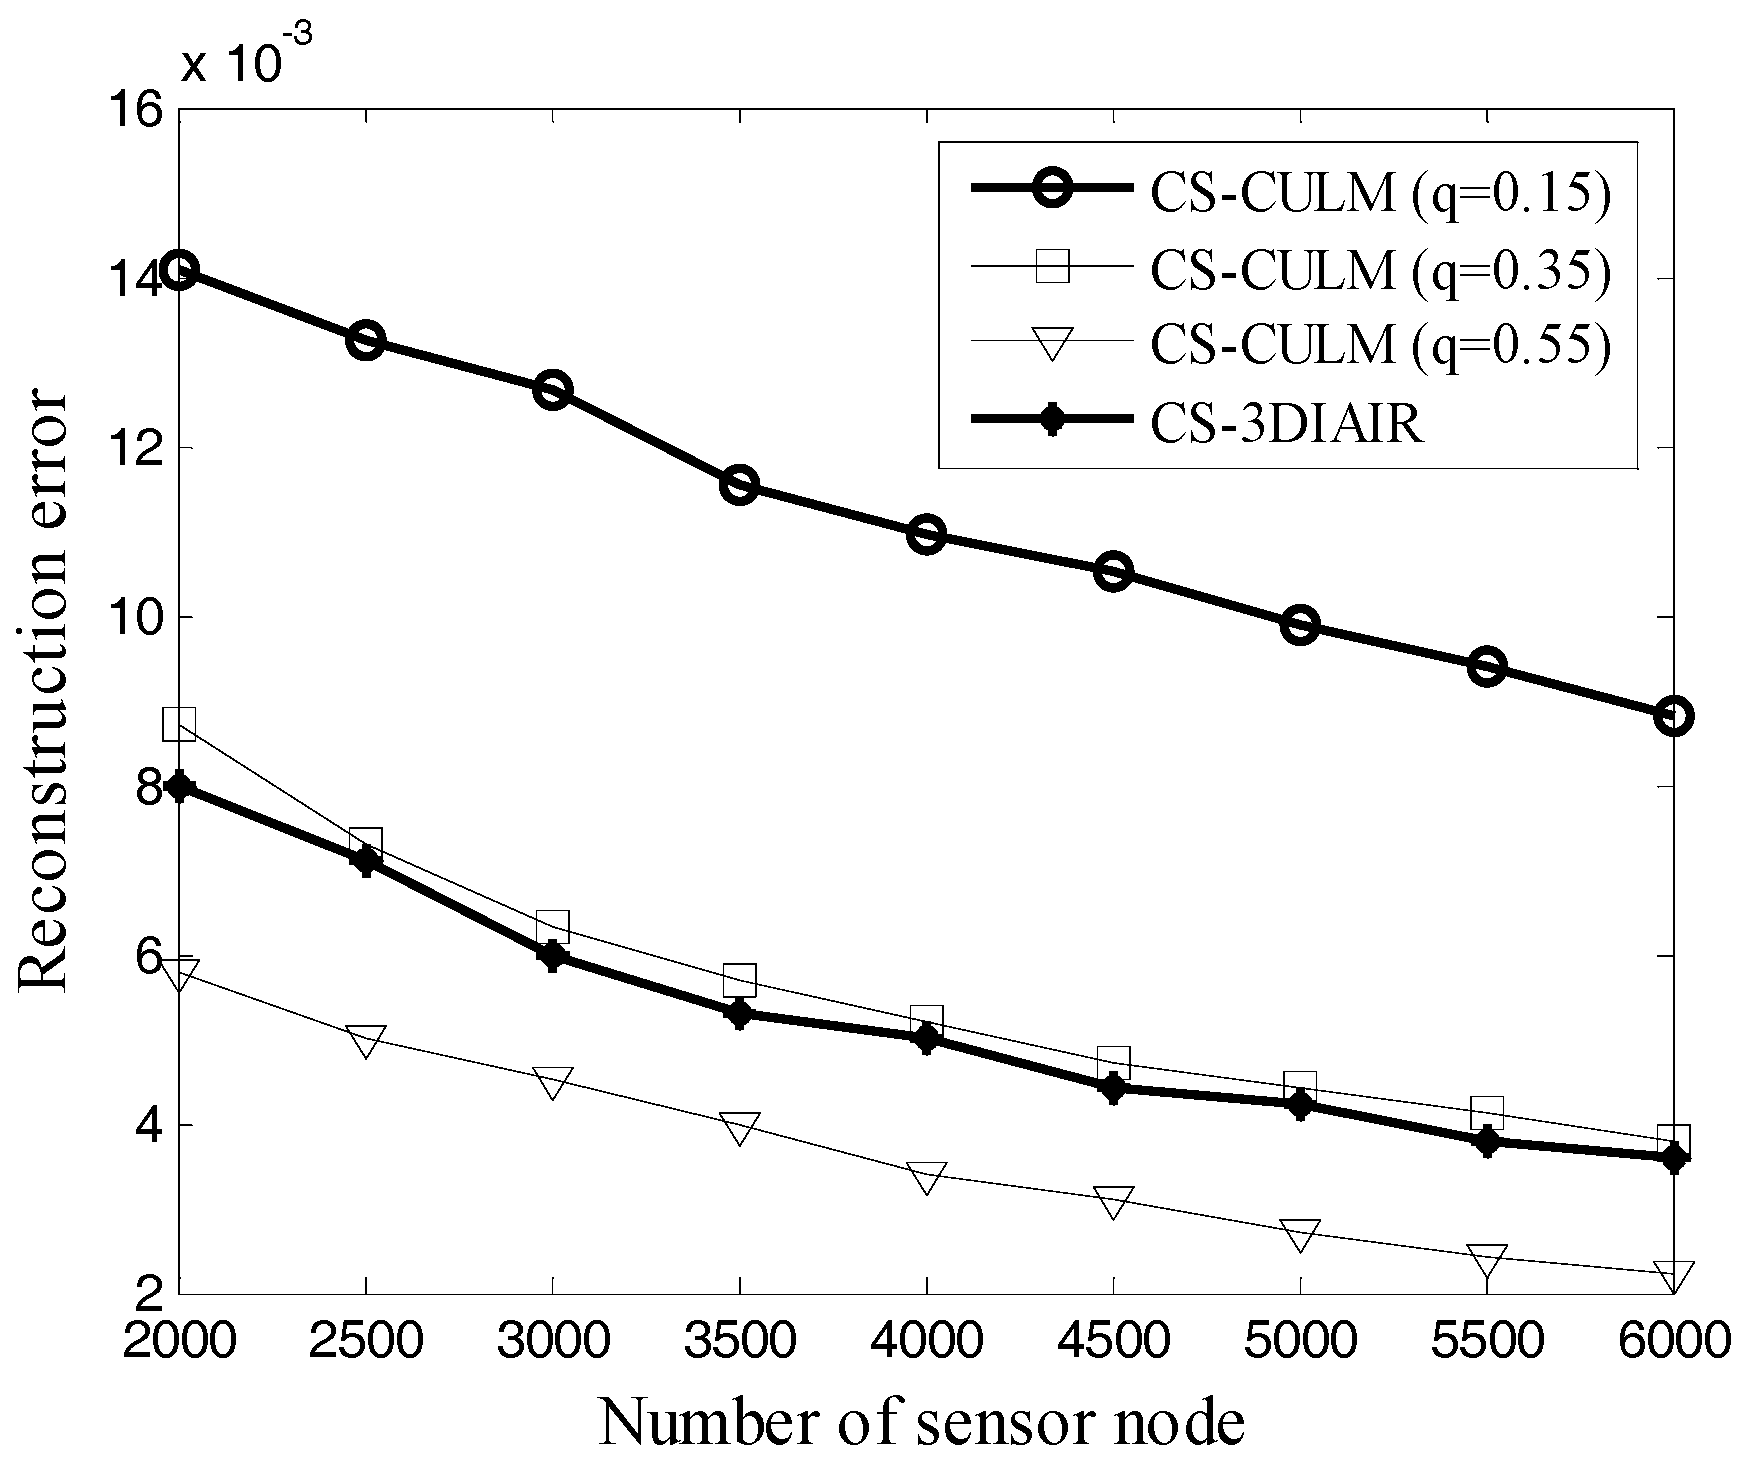
The same clustering algorithm in CS-CULM, CS-CLM, and CS-HLEACH causes the measurements M received by the sink to be almost equal. So, their reconstruction error is almost the same, and we select the proposed CS-CULM as the representative to analyze reconstruction error. When the basic transmission length r is 3.5 km, the probability of becoming a cluster head q = 0.15, and access probability p = 0.7, the reconstruction error is shown in Figure 6.
In Figure 6, the randomly deployed nodes n are used to recover 8000 original data x. Measurements received by the sink node increase with the increasing number of sensor nodes, so the reconstruction error of CS-CULM and CS-3DIAIR shows a downward tendency. The clustering algorithm unutilized in CS-3DIAIR results in a waste of energy, but its measurements M are more than CS-CULM (q = 0.15), which contributes to the precision of reconstructed data. While in CS-CULM, the rising probability q also causes the increase of measurements M; therefore, at the same number of nodes, the reconstruction error decreases. When the number of sensor nodes n = 2000, the probability of becoming a cluster head q = 0.15, and the reconstruction error of CS-CULM is .
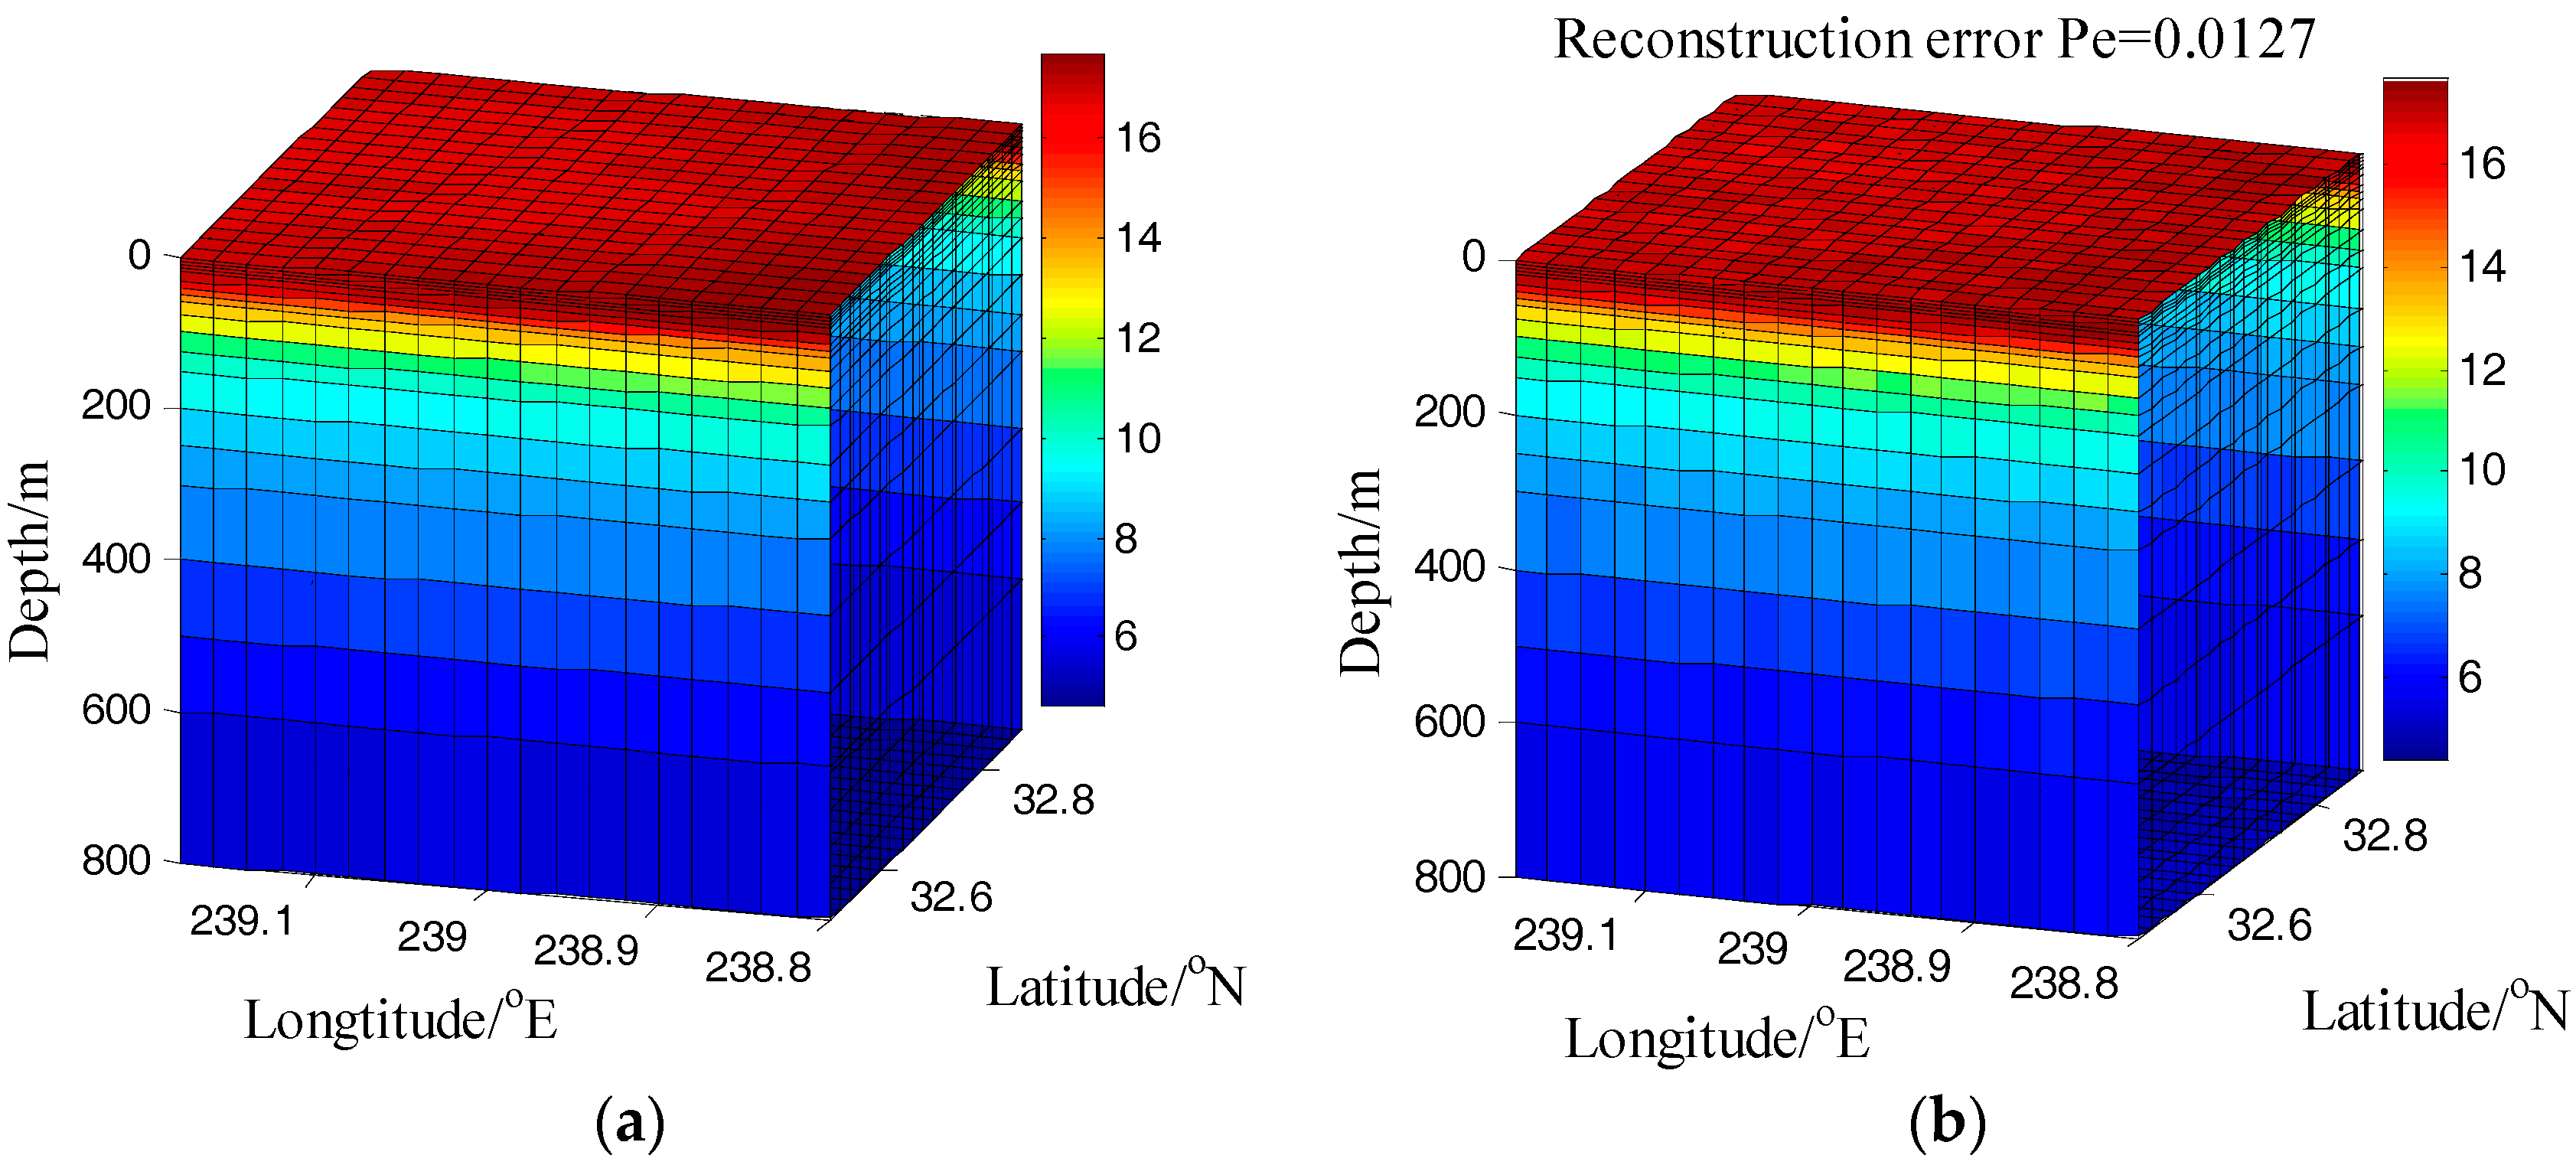
When basic transmission length r = 3.5 km, the probability of becoming a cluster head q = 0.15 and access probability p = 0.7. The randomly-deployed nodes n = 3000 are used to recover 8000 original data x in USNs. As shown in Figure 7, the reconstruction error .
7. Conclusions
In this paper, we take the advantages of CS and combine it with an appropriate routing algorithm in three-dimensional USNs; an energy-efficient algorithm (CS-CULM) based on CS is proposed, aiming at effectively extending the lifetime of USNs, while ensuring the accuracy of data reconstruction. The simulation results show that in USNs, when basic transmission length r is 3.5 km, CS-CULM can prolong the network lifetime by up to 66% compared with CS-CLM while achieving effective data reconstruction.
Acknowledgments
This work is partly supported by the National Natural Science Foundation of China (No. 61401118, No. 61371100 and No. 61671184), Natural Science Foundation of Shandong Province (No. ZR2014FP016 and BS2012DX001), the Fundamental Research Funds for the Central Universities (No. HIT.NSRIF.2016100 and 201720) and the Scientific Research Foundation of Harbin Institute of Technology at Weihai (No. HIT(WH)201409 and No. HIT(WH)201410).
Author Contributions
Bo Li and Gongliang Liu conceived and designed the experiments; Hongjuan Yang performed the experiments; Xiyuan Peng contributed simulation tools; Bo Li wrote the paper. All authors have read and approved the final manuscript.
Conflicts of Interest
The authors declare no conflict of interest.
References
- Cai, K.; Yin, Z.; Jiang, H. Onion map: A scalable geometric addressing and routing scheme for 3D sensor networks. IEEE Trans. Wirel. Commun. 2015, 14, 57–68. [Google Scholar] [CrossRef]
- Heinzelman, W.B.; Chandrakasan, A.P.; Balakrishnan, H. An application-specific protocol architecture for wireless microsensor networks. IEEE Trans. Wirel. Commun. 2002, 1, 660–670. [Google Scholar] [CrossRef]
- Duan, J.; Li, D.; Chen, W. Geometric routing precluding loops and dead ends in 3-D wireless sensor networks. In Proceedings of the 2010 IEEE Global Telecommunications Conference (GLOBECOM), Miami, FL, USA, 6–10 December 2010; Volume 1, pp. 1–5. [Google Scholar]
- Candès, E.J.; Tao, T. Near optimal signal recovery from random projections: Universal encoding strategies? IEEE Trans. Inform. Theory 2006, 52, 5406–5425. [Google Scholar] [CrossRef]
- Bajwa, W.U.; Haupt, J.D.; Sayeed, A.M.; Nowak, R.D. Joint source–channel communication for distributed estimation in sensor networks. IEEE Trans. Inf. Theory 2007, 53, 3629–3653. [Google Scholar] [CrossRef]
- Chen, H.; Wu, X.; Huang, C. A novel data gathering algorithm based on compressed sensing for heterogeneous wireless sensor networks. In Proceedings of the 33rd Chinese Control Conference, Nanjing, China, 28–30 July 2014; Volume 1, pp. 451–455. [Google Scholar]
- Needell, D.; Vershynin, R. Uniform uncertainty principle and signal recovery via regularized orthogonal matching pursuit. Found. Comp. Math. 2009, 9, 317–334. [Google Scholar] [CrossRef]
- Bassi, F.; Liu, C.; Iwaza, L. Compressive linear network coding for efficient data collection in wireless sensor networks. In Proceedings of the 20th European Signal Processing Conference, Bucharest, Romania, 27–31 August 2012; Volume 1, pp. 714–718. [Google Scholar]
- Robert, J.U. Principles of Underwater Sound; McGraw-Hill: New York, NY, USA, 1983; pp. 158–162. [Google Scholar]
- Zorzi, M.; Casari, P.; Baldo, N. Energy-efficient routing schemes for underwater acoustic networks. IEEE J. Sel. Areas Commun. 2008, 26, 1754–1766. [Google Scholar] [CrossRef]
- Xie, L.; Zhang, X. 3D clustering-based camera wireless sensor networks for maximizing lifespan with minimum coverage rate constraint. In Proceedings of the 2013 Global Communications Conference (GLOBECOM), Atlanta, GA, USA, 9–13 December 2013; Volume 1, pp. 298–303. [Google Scholar]
Figure 1.
System model of 3-D underwater sensor networks.

Figure 2.
Original temperature data and its fast Fourier transform (FFT) transformation. (a) The original signal; (b) The FFT transformation of original signal.
Figure 2.
Original temperature data and its fast Fourier transform (FFT) transformation. (a) The original signal; (b) The FFT transformation of original signal.
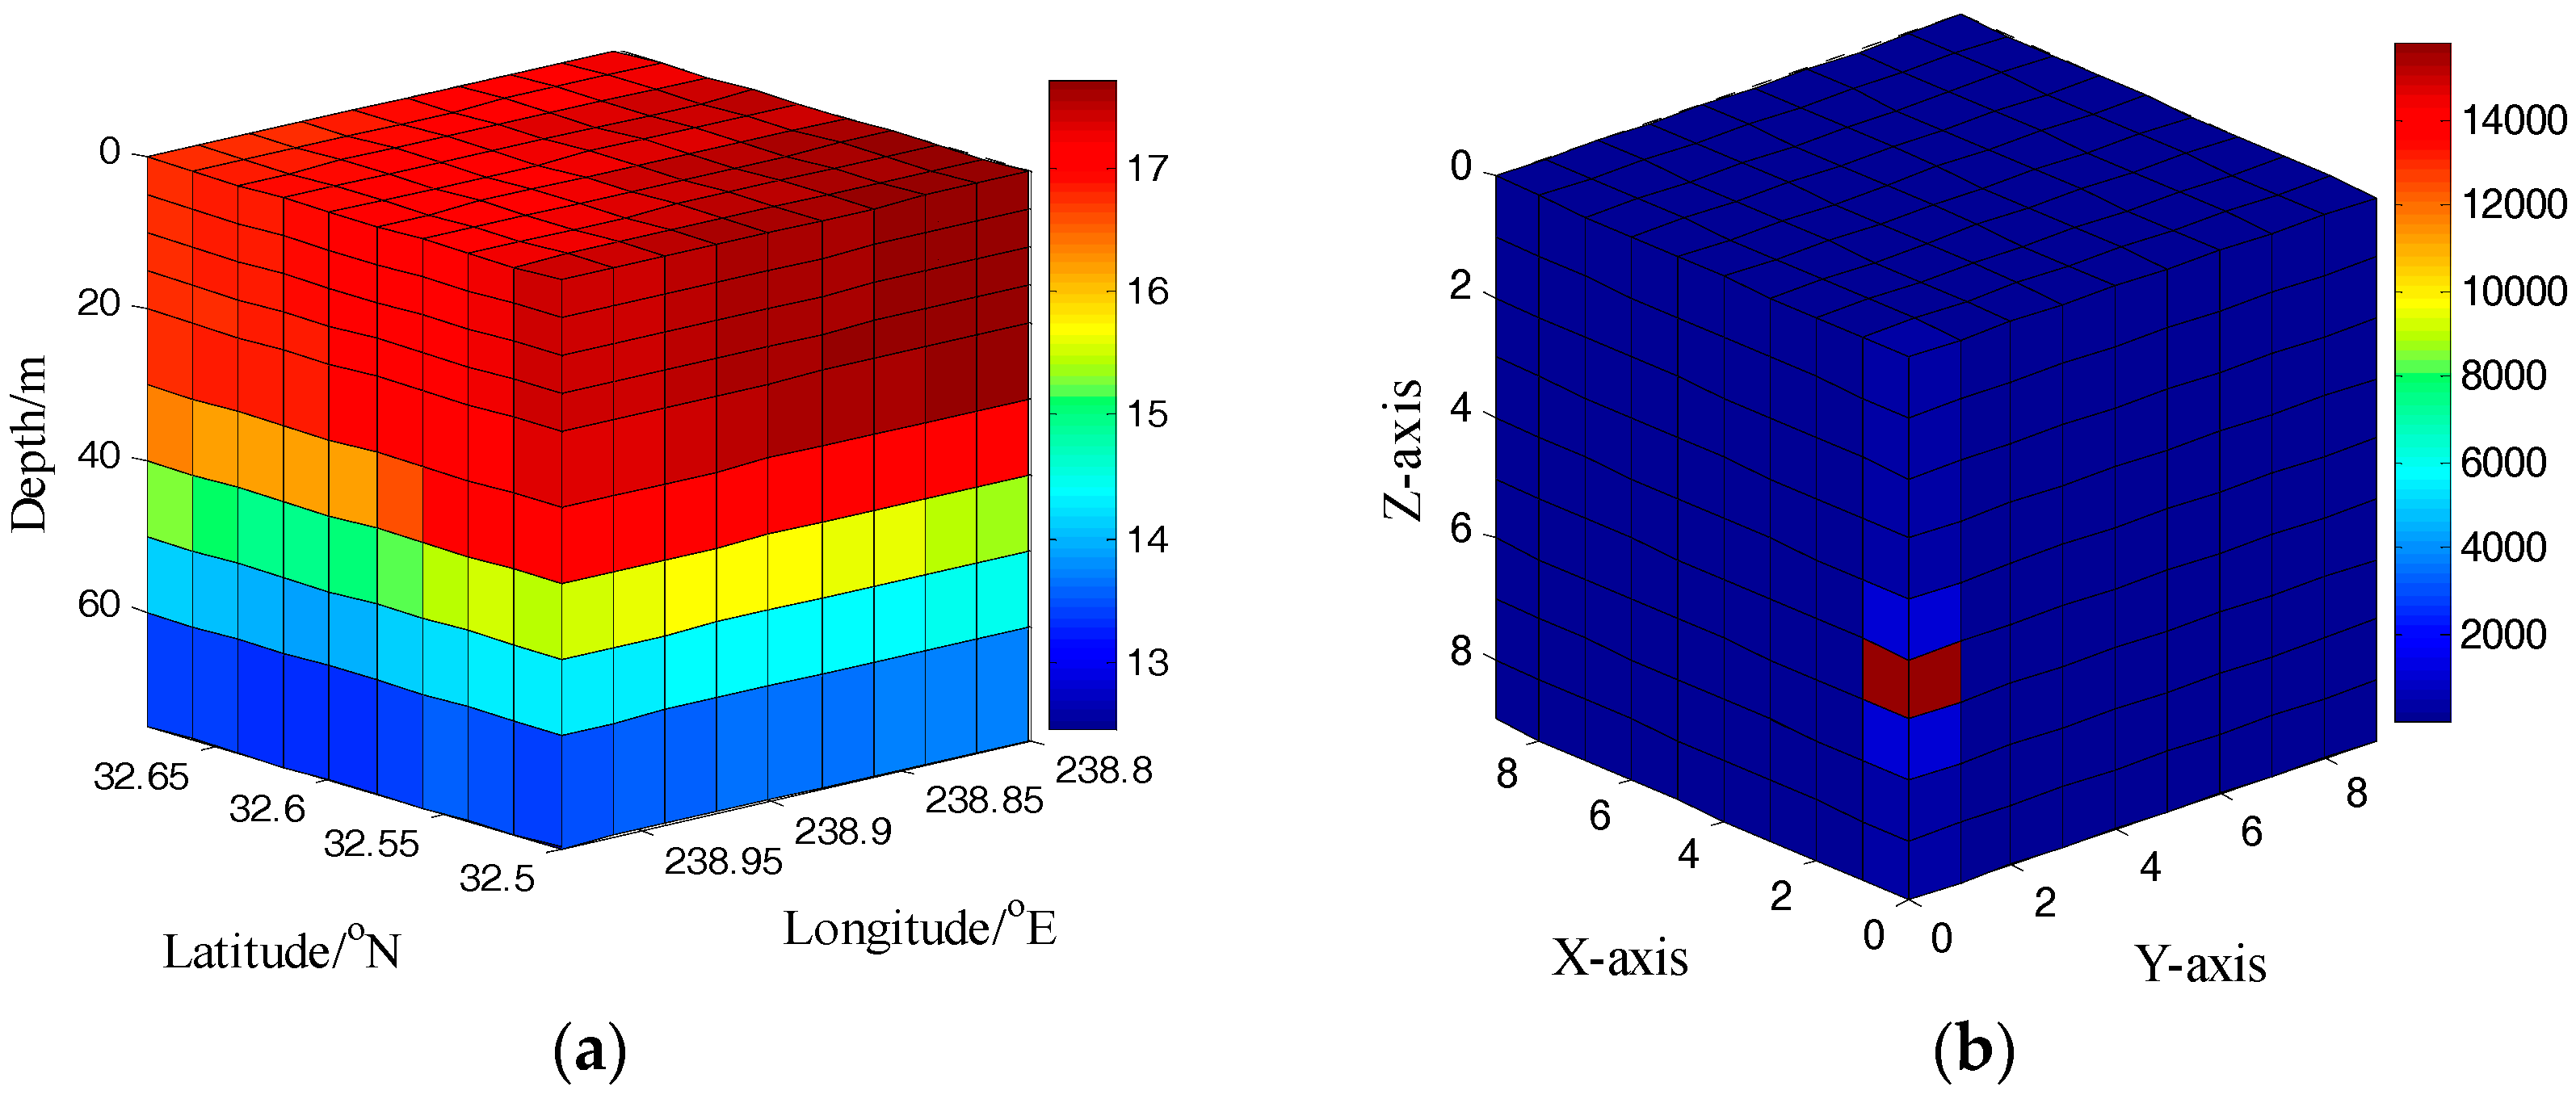
Figure 3.
Packet format of the node in compressed sensing clustering uneven-layered and multi-hop routing (CS-CULM).
Figure 3.
Packet format of the node in compressed sensing clustering uneven-layered and multi-hop routing (CS-CULM).

Figure 4.
The number of alive nodes vs. network alive rounds.

Figure 5.
Max energy consumption of nodes vs. network alive rounds.

Figure 6.
Reconstruction error vs. number of sensor nodes: comparison among CS-3DIAIR and different probabilities of becoming a cluster head: q = 0.15, 0.35, 0.55 in CS-CULM.
Figure 6.
Reconstruction error vs. number of sensor nodes: comparison among CS-3DIAIR and different probabilities of becoming a cluster head: q = 0.15, 0.35, 0.55 in CS-CULM.

Figure 7.
The original temperature and reconstruction data in three-dimensional underwater sensor networks (USNs). (a) The original data; (b) The reconstruction data.
Figure 7.
The original temperature and reconstruction data in three-dimensional underwater sensor networks (USNs). (a) The original data; (b) The reconstruction data.


Table 1.
Energy consumption parameters. SNR: signal-to-noise ratio.
| Energy Parameters | (bps/Hz) | (dB) | (W) | (kHz) | |
|---|---|---|---|---|---|
| Value | 0.5 | 0.5 | 8 | 0.5 | 9 |
Table 2.
Simulation Parameters.
| Type | Parameter | Value |
|---|---|---|
| Network | Grid size | 20 × 20 × 20 |
| Actual scale (km) | 37.4 × 44.4 × 0.8 | |
| Initial energy (J) | 4000 | |
| Number of sensor nodes | 2000 | |
| Packet | Data packet size (byte) | 1282 |
| Broadcast packet size (byte) | 5 |
© 2017 by the authors. Licensee MDPI, Basel, Switzerland. This article is an open access article distributed under the terms and conditions of the Creative Commons Attribution (CC BY) license (http://creativecommons.org/licenses/by/4.0/).
Share and Cite
MDPI and ACS Style
Li, B.; Yang, H.; Liu, G.; Peng, X. An Energy-Efficient Routing Algorithm in Three-Dimensional Underwater Sensor Networks Based on Compressed Sensing. Information 2017, 8, 66. https://doi.org/10.3390/info8020066
AMA Style
Li B, Yang H, Liu G, Peng X. An Energy-Efficient Routing Algorithm in Three-Dimensional Underwater Sensor Networks Based on Compressed Sensing. Information. 2017; 8(2):66. https://doi.org/10.3390/info8020066
Chicago/Turabian StyleLi, Bo, Hongjuan Yang, Gongliang Liu, and Xiyuan Peng. 2017. "An Energy-Efficient Routing Algorithm in Three-Dimensional Underwater Sensor Networks Based on Compressed Sensing" Information 8, no. 2: 66. https://doi.org/10.3390/info8020066
Note that from the first issue of 2016, this journal uses article numbers instead of page numbers. See further details here.