Volume Shocks around Announcements in the Chinese Stock Market: An Ex-Post Earnings-Information-Based Study of Speculative Behavior

1
School of Economics and Management, Beihang University, Beijing 100083, China
2
Institute of Computing Technology Chinese Academy of Sciences, Beijing 100190, China
3
School of International Trade and Economics, University of International Business and Economics, Beijing 100029, China
*
Author to whom correspondence should be addressed.
Information 2017, 8(3), 112; https://doi.org/10.3390/info8030112
Submission received: 7 July 2017
/
Revised: 3 September 2017
/
Accepted: 8 September 2017
/
Published: 14 September 2017
Abstract
:The Second Board Market is typical stock market for high tech companies in China. This paper discusses the relationship between trading volume and price changes in the case of high-tech listed companies in the Chinese Second-Board Stock Market. By using the basic concepts proposed by Kim and Verrecchia, and Kandel and Pearson, and contrasting them with ex-post information from earnings releases, the paper provides findings on the speculative behavior of informed traders with a volume shock premium. The paper suggests that these methods may be further applied to investigating investors’ behavior in speculation, especially for the high-tech-company-based Second-Board Stock Market during announcement periods.
1. Introduction
Beaver initiated the so-called trading volume study, suggesting that the trading volume could be used as an important indicator for explaining differences of consensus among investors under given information released [1]. However, price changes reflect changes in the aggregate market’s average beliefs, while in contrast, trading volume is the sum of all individual investors’ trade, or actions [2,3,4], which means that trading volume would generally preserve different beliefs among individual investors. However, those differences in price would be “cancelled out” in terms of averaging (also called “off-setting”) processes.
One of the most important features of trading volume study is the pattern of the relationship between volume and price changes [5,6,7]. A positive relationship between trading volume and stock price fluctuations is reported by a number of empirical studies using different methods. Studies on this relationship dominate the early- and mid-1990s, typically by Schwert [7], Gallant, Rossi, and Tauchen [8], Foster-Viswanathan [9], and Andersen [10]. Goodman uses random samples traded on the New York and the American Stock Exchanges between 1993 and 1994. His findings confirmed that the absolute value of the price change is positively correlated with the trading volume, and showed that a strong volume is associated with extreme price movements, both positive and negative [11].
On the other hand, significant inharmonic relations between volume movements and price changes exist, especially during earnings announcement periods. Barron and Karpoff report that the correlation between price-change per se and trading volume are statistically insignificant for futures markets, but that it is positive and statistically significant for equity markets [12]. Xu make their conclusion that there is an increase in the number of transactions, but weaker evidence of an increase in the volume of shares, and absence of any sizable price response during annual report dates [13]. Hu uses the Tokyo Stock Exchange as a sample for studying the relationship between stock returns and trading volume [14], and finds some negative correlations. On the other hand, Rouwenhorst uses standard factors to test returns on assets for emerging markets and finds a much stronger relationship between stock return and trading volume, as well as a relationship between overall trading volume and emerging market return premium [15]. In general, a large trading volume with a small or even the absence of price change around an event period has been investigated frequently by international researchers, and attracts much attention from various studies [16,17]. This may be because of significant speculations during those event periods. Major explanation for these phenomena is that there are differential perceptions about the information for informed traders as well as for liquidate traders [18,19,20].
The interesting implication behind trading volume and trading study is a strong connection between trading volume movements and investors’ differential behavior, especially the convergence and divergence of informed traders’ behavior, reflected in trading volume distributions. For example, Kim and Verrecchia suggest that the magnitude of trading volume relative to price reaction is an increasing function of pre-disclosure information asymmetry [4]. Atiase and Bamber argue that divergence in analysts’ forecasts may reflect an unobservable pre-disclosure information asymmetry [21].
The divergence of traders’ investing behavior is to some extent contradictory to conventional findings that pre-disclosure information generally reduces the surprises transmitted to the market through the earnings announcements [22], which in turn decreases the magnitude of both price and volume reactions. Reasons for this divergence may lie in investors’ heterogeneous pre-disclosure expectations and/or heterogeneous interpretations of the earnings announcements, which would lead those investors to trade and to increase trading volume [18].
Chahine and Chen conduct an empirical study on Chinese stock market to investigate market responses to earnings announcements [23], and specially tested whether price changes were influenced by a variation of investors’ aggregated beliefs while trading volume reflected the divergence of individual investors’ beliefs, although the results was less significant. The sentence means: announcement period, especially the date of announcement, the information is clear, then market participants will probably do the same either to buy or to sell, except those who use their own private information well before the announcement date, they may operate in an opposite direction. Here information precision means market response to increase convergence around the price (price becomes concentrated to reflect announced news either good or bad). However, in Chinese market, it seems not the case, i.e., the study concluded that public announcements in the Chinese market did not improve information precision held by investors and might increase the likelihood function of differences among investors. Gençay and Gradojevic study the risk of informed trading in an electronic foreign exchange market and test whether informed trading is driven by market wide private information, and uncover geographic intraday arrival patterns of informed traders [24]. Gençay et al. investigate the possibility that private information offering systematic profit opportunities exists in the spot foreign exchange market [25]. Gradojevic et al. investigates a trading strategy that relies on private information in an electronic spot foreign exchange market [26].
The Second Board Stock Market, also known as Growth Enterprise Market (hereafter GEM), is different type market from main-board market, especially in China, it may attract strong attention from both venture capitalists in terms of financing those high tech SMEs (small and medium-sized enterprises) and speculative investors in the stock market. GEM has been a booming area where Chinese small and medium-sized high tech enterprises made their fortune, and at the same time, related growth and technological innovations may provide news or positive (as well as negative) information for market investors. Since threshold into GEM is relatively lower if compared with the case of Main-Board Market, together with weaker corporate governance structure, information disclosure of listed the companies during their annual reports in GEM may negatively affecting credibility of those listed companies and may influence further development of GEM as well, therefore, announcement as important event in such market can be a better case to be studied for speculative movement in Chinese financial market.
Thus, the authors suggest to apply related models and to investigate the most likely speculative market: The Second-Board Stock Market. In China, it was mainly initiated for high-tech companies. Since high-tech companies are usually small in size, and show fluctuating performances, earnings announcements may provide an opportunity to investigating investors’ behavior in this typical Chinese stock market.
Primarily, this paper aims at addressing the following questions:
How is trading volume and price change interrelated in the Chinese Second-Board Stock Market around earnings announcements?
The question of whether or not there is a large trading volume but a minor price change around public announcement in the Chinese Second-Board Stock Market shall be answered, which would imply possible speculations from insiders or informed traders and whether this dispersion is closely related to trading volume.
Does a larger trading volume indicate a corresponding speculative earnings release by testing ex-post earning information, in terms of an ex-ante information leakage? In other words, are larger-volume traders accessing earnings information in advance in the Chinese Second-Board stock market?
The rest of the paper is arranged as follows:
After the introduction, Section 2 of the paper will review briefly the international literature on trading volumes and the difference between volume moves and price changes. A research framework will be given in Section 3. The Section 4 will outline the empirical study conducted by the authors. A detailed analysis of the Chinese Second-Board stock market will be provided in Section 5, and the conclusion will be given in the Section 6.
2. Literature Review
Regarding to trading behavior and speculative operations in various kinds of financial market, there are numbers of important issues, which are important reference for this paper:
(1) A larger trading volume may be an important parameter for related price changes:
As Easley, Kiefer, and O’Hara indicate, information during the trading process should be examined in more detail, especially larger or smaller trade size, which may have different information content, and larger buys/larger sell should be examined for detecting informed and non-informed traders. Various theoretical studies suggest that the trading volume changes (either from small to large-volume trading, or vice versa) when investors revise their different beliefs [27]. They also find that the trade process is a stochastic process of transactions interspersed with periods of inactivity. In addition, this process is a source of information for market participants that cause prices to move when they affect the market maker's beliefs about the stock value [28]. Jiang et al. identify jumps in U.S. Treasury-bond prices and investigate what causes such unexpected large price changes. They find that preannouncement liquidity shocks have significant predictive power for jumps, which occur mostly at prescheduled macroeconomic announcement times, announcement surprises have limited power in explaining bond price jumps [29].
Bamber and Cheon’s study on differences between trading volume moves and price changes shows that only 11–18% of samples have similar magnitudes of trading volume and price change, others display independent characteristic regarding the relationship between price change reactions and trading volume reactions to earnings announcement, with 20–24% extremely different [17]. Their research shows that the impacts of earnings announcements on trading volume and price reaction are related to the following factors: (1) More diversified forecast in financial analysts in advance before earnings announcements; (2) A larger analyst following; (3) The higher level of random-walk based unexpected earnings than analysts based unexpected earnings; (4) The price increases. These results show the general common tendency that when an announcement generates a higher level of revision (meaning larger forecast errors) among investors, the trading volume can be expected to be higher than the price change around the announcement period [17].
(2) Larger volume may matter but trading strategies might be more important especially for highly skilled traders:
Besides research on the relationship between trading volume and price change, trading size and trading sequence are additional major focus points, under the hypothesis that informed traders tends to trade in larger size. However, interaction with market maker’s strategies [30], for example, informed traders in the stock option market tend to fragment their larger trade into numbers of low sized trades [31], based on so called Stealth-Trading hypothesis, initiated by Barclay and Warner [32]. Similarly, numbers of study also indicate that medium sized trades may associated with price change in stock market, such as in NYSE firms’ case [33], based on Stealth-Trading hypothesis. In the foreign exchange market, trades with larger price impacts are also found to be often medium sized orders with larger volume (Stealth Trading) and usually conducted in financial centers and in early trade session [34], which apparently reflect high skilled operations. Also, related research reveals that necessary data is needed for such trade strategy based studies, for example, both trade and non-trade intervals via high frequency (intra-day) data analysis should be used to detect market maker beliefs in stock market [27,30]. Related studies also found that an earnings announcement effect can be used to detect the relationship between trading volume and price change in more detail. For example, so called Probability of information-based trade (PIN) can be applied to forecast market liquidity through analyzing bid-ask spreads and price impact of orders, especially, PINs tend to rise before earnings announcement days and decline afterwards [35].
Based on these studies, it can be understood that well-advanced international financial markets, such as the stock option market, the T-bond market and the foreign exchange market, trading strategies are observed with more in depth examinations, reflecting highly sophisticated trading techniques by institutional investors (especially in typical financial centers) in those markets. There are two possible layers of operations, in terms of the relationship between trading volume and price change, namely, (1). Larger trading volume does correlate with price changes during a sensitive event period; and (2). Larger trading volumes might not be so significantly correlated with price change, due to investors’ trading strategies, while medium sized trades, together with imbalanced bid-ask spread, or other special characters observed, may explain fundamental price change, in various financial market. We tend to believe that these two layers of operation represent the actual difference in financial market between well-developed countries and emerging countries, such as China.
On the other hand, international studies also reveal that the significance of sized trades and number of trades, in the volatility-volume relation, is different in high-tech listed companies if compared with other common listed firms, for example, NYSE vs. Nasdaq, and there might be special-sized trades that matter in Nasdaq [36]. This shows that there might be more speculative opportunities in high-tech listed market, and thus high-tech listed markets may be more fruitful if we study speculative behavior.
Our research, however, is aimed at revealing two kinds of hidden phenomena in the high-tech listed firm market in China by examining investors’ responses to earnings announcements of those sample listed companies:
- (1)
- Trading behavior. Here, only buys are concerned, as there is no-short-sell mechanism in the Chinese stock market, or in related option markets. Only buying is possible if relevant investors expect a positive change in the market or have specific information beforehand to see if there are larger volume trading based price changes in such markets. Furthermore, we will not study trading strategies in more detail, as trading in such a newly-established market like the GEM in China should be examined first on the effects of larger trading volumes, which generally relates only to decisions based on positive or negative information within a very short time limit during earnings release (i.e., the announcement). Skillful trading strategies may be the next step, if the trading volume has no or less explanatory value in such a newly-established market;
- (2)
- Earnings information leakage serves to see if those companies’ annual earnings are transferred before the announcement date (both legally, for informed traders, based on their capability of company assessment; and illegally for insiders’ capability to access the respective information), by examining volatility/price change around the announcement (before and after) date.
We especially focus on the second phenomenon, known as speculative behavior. Given the fact that the value of high-tech companies is usually not easy to determine, the second board market or high-tech companies may be highly volatile.
Of the major international studies, the models proposed by Kim and Verrecchia [3], and Kandel and Pearson appear relevant to our empirical studies [37].
Kim and Verrecchia provide a basic K-V model to show that the expected trading volume stands in linear relation to absolute price changes, with a zero intercept. Kandel and Pearson, on the other hand, provide a different model and thereby explain that empirically, the volume can rise without any price changes, or with merely small price changes. This research is inconsistent with conventional models of trade that assume homogeneous interpretations. Further research conducted by Bamber et al. supports K-P measures, and at the same time summarizes that there are two possible reasons for a revision of differentiated expectations around public announcement, namely, (1) the difference explanation of news; (2) investors get the accuracy of the pre-disclosure information is different [17].
Kim and Verrecchia propose a more complete model in describing possible differences between volume moves and price changes. They believe that private information can be generally classified into two types of anticipations of a public announcement, namely, pre-accessed information (which can be defined as pre-announcement information) and information in conjunction with a public announcement (defined as event period information). Here pre-announcement information is usually considered as not being fully released through earnings announcements, therefore it can be further exploited after the announcement. These two kinds of anticipation often act together, and thus the new K-V rational model incorporates both types to reflect the “real market”. In fact, six kinds of information are suggested to act differentially to influence investors during the pre-announcement stage and during the event period [38]. The newly proposed K-V model can be expressed as follows by Kim and Verrecchia [3],
: individual demand for risk asset (firm i/stock i) during event period.
: individual demand for risk asset (firm i/stock i) during pre-announcement period.
Therefore, this formula indicates that trading volume reflects average demand differential before and during the financial announcement event, and further, it can be simplified as follows under certain polar cases, such as when there is no private information during event period:
which means that trading volume is positively proportional to the absolute price change (difference between price in event period, , and price in pre-announcement period, ) and differential interpretation of earnings release during pre-announcement.
In recent years, K-V or K-P models have also been used to reveal MNEs’ announcement effects [39]. By investigating their announcement and locations (accounting behavior related), Cho and Kwon even use the K-V model to study the disagreement among investors on the company announcement [40]. These kinds of research thus provide important proofs that these models can be applied to wider range of investment behavior studies. The following Table 1 summarizes different forms of K-V models as well as Kandel and Pearson’s model, and relevant research during recent years [37].
Based on previous studies and considering the behavior of investors in China’s stock market, the authors of this paper would argue that speculation is the primary force to make the market more differential, especially during public announcements. Bamber et al. point out that differential interpretations are an important stimulus for speculative trading, and that informed traders and related speculation activities can happen when there is a much larger trading volume, as informed traders would generally prefer to trade larger amounts at any given price in order to exploit their information asymmetry advantage [41]. Easley and O’Hara show how this would result in market prices differing with trade size, especially with large trades occurring at “worse” prices. This can be more clearly investigated for more technical content stocks with smaller size, which is exactly the case of the stock market for high-tech companies [30]. In China, the Second-Board Stock Market is designed to support high-tech firms with a public investment fund. Since the technology contents can be driven either by a real emerging market demand on high-tech products or by speculative investors in the relevant stock market, this market is an appropriate target for speculation research.
3. Data
The Second-Board Stock Market was initiated between the 1970s and the 1990s, where the market volume was highly limited. For example, the total trading volume at NSDAQ in New York City accounted for only two thirds of the New York Stock Exchange. The Second-Board Stock Market increased fast from the mid-1990s, when high-tech sectors become popular and venture capital was developed as a real business. A number of such market as NASDAQ in the US emerged from other countries and regions, such as GEM (1995) in Hong Kong, OTC (1994) in Taiwan, AIM in London (1995), LNA (1996) in France, and NM (1996) in Germany.
The Second-Board Stock Market in Mainland China was opened on 23 October 2009 in Shenzhen. This market’s growth was significant during the year 2013, when the market value rose beyond one trillion RMB, more precisely from 873.2 billion to 1.5 trillion, with a growth rate of 72.75%. According to the Market Value Research Center of China’s Listed Companies, up to the year-end of 2013, the total market value in the main board market (a share market) reached 23.76 trillion RMB, with a 3.98% growth rate. Behind this growth rate, primary supporting companies were from the media and culture sector (94.74% growth), the information technology sector (62.13% growth), and electronic industries in the manufacturing sector (46.08% growth). Growth rates in all remaining 19 sectors were lower. However, if compared with the Second-Board Stock Market, and markets of smaller scale, the figures would look rather different. Within five years, between 2009 and 2013, there occurred 836.9% growth in the Second-Board Stock Market, and a 120.2% increase for the smaller scale business sectors (with 3.71 trillion RMB as market value in 2013).
Up to April 2015, in total, there were 446 companies listed in the Second-Board Stock Market in China, with a total market value of 4.3 trillion RMB. In this paper, we select our sample companies in the Chinese Second-Board Stock Market, for an investigation window between February and May 2014, comparing the announcements in the respective periods in 2013. See Table 2. Since there were only about 400 listed companies in 2014, we choose 283 listed companies with their company announcements, among them 271 companies were earning a positive profit, accounting for 95.76%, while there were only 12 companies running deficits. Considering the top sectors of positive earnings companies, 44 companies were from the computer sector, 43 from the mechanical equipment sector and 37 biopharmaceutical companies.
4. Methodology
Based on theories on trading volume effects captured by the K-V model, which emphasizes that the reaction relationship between earnings announcements and trading volume is an increasing function of the divergence in analysts’ forecasts, this paper applies the theories to speculation study on the Second-Board Stock Market in China, particularly around the announcement event period.
Generally speaking, there are two kinds of significant trading volume changes around announcements: The first one refers to buying actions with privately-owned information on good news or positive earnings, the other one is related to selling actions with privately-owned information on “bad news”, if the investors have certain such shares in hand, considering there is no short speculation mechanism for the Second-Board Stock Market. Moreover, for the positive news exploiters, there are also two kinds of investors, one for speculation which requires buying and selling in rather short cycles, the other for longer term speculative ownership in order to hold the share over a comparatively longer term with an appreciation expectation. There is an important difference between these two kinds of investors. The short term speculation needs a complete cycle of buying (or selling) a particular share in pre-disclosure period and selling (buying) that share during the earnings announcement process. Especially, well-informed traders in the pre-disclosure period would exploit their information advantage through aggressive trading (extremely large trading), start their trade well before the announcement and complete their speculation cycle right around the event period. We consider that speculation trading can create differential trade either through opposite direction trading or through different trading magnitudes. Generally speaking, earnings announcements should reduce information asymmetries, and be followed by tighter spreads, a lower impact of tractions on prices and a larger trading volume; on the other hand, earnings announcements can also increase information asymmetries due to technical responses. However, in the Chinese stock market’s case, there are some differences. One of the important features is that there is no short-selling mechanism in China’s Second-Board Stock Market. Therefore, informed traders, when they receive “bad news” during the pre-disclosure period, they cannot exploit asymmetric information advantages over other non-informed traders, unless they are already holding the related shares before the information comes in. On the other hand, longer term appreciation-expectation-based operations can hardly be called speculation, but it appears that there is no buying—selling cycle.
The following Table 3 summarizes possible situations in speculation movements exercised by informed traders in case of “good news”, and a non-speculation movement in case of “bad news”. T1, T2, T3, and T4 are designed to show that informed traders would continue to trade until prices have adjusted to the new equilibrium value [42].
It should be noted that non-informed traders, or liquidate traders, not only create noise trading but also provide necessary conditions for well-informed traders to fulfill their speculation process [43]. Clearly, if informed traders all trade large quantities, the most important influencing factor on price is the volume of large trades, rather than the overall trading volumes. Thus, the volume shock, rather than the overall trading volume, is important. This paper defines a reference period to compare a volume shock relative to the normal amount of trading, accompanied by the level of excess return (relative to an average level during a reference period).
We borrow concepts from the model derived by Kim and Verrecchia (1991, 1997) and from the model defined by Kandel and Pearson to include our analysis into the following equation [4,37]:
We use 15 moving windows across our investigation period (from −7 to +7) to reflect those two stages, presuming that every window includes a sub-“pre-announcement” section and a sub-“event” section. Thus, informed traders can be more clearly identified, as fewer noise-traders would trade in non-event periods and would trade more aggressively during event periods.
Relative moves of trading volume and price changes to their respective normal levels (calculated based on values of the reference period) are more emphasized. Larger relative moves of the trading volume, accompanied by small relative moves of price changes through this adjustment, can be more clearly reflected.
We use daily returns to substitute the price change in order to emphasize the price-adjusted difference among shares of different value.
We further divide the sample into two categories in order to show whether the proposition is empirically significant. One group includes samples of negative returns, or “bad news”, meaning that samples in this group are characterized by major decreases in price and negative returns during the pre-announcement period. The other group is composed of samples of non-negative returns without comparable decreases in price.
5. Results
This paper provides an empirical investigation covering 244 samples operating in the 2013-fiscal year based on China Security Week database. The announcements are primarily scattered in first season of 2014. Among these 244 sample companies, 238 show positive earnings while 6 companies run deficits. However, it should be noted that the overall economic development in China in 2013 was in decline. Although these companies showed positive earnings, their growth rates decreased. In total, 142 companies showed positive growth, while 102 companies experienced negative growth, despite still positive earnings. The following Figure 1 shows the sampling period.
5.1. Analysis of the Impact of Trading Volume on Price Changes
The total testing period for all samples is divided into three sections: pre-announcement section, public announcement period (or event period), and post-event period. We determine trading volume move and price change move by comparing the volume and price change in the investigation window to the ones in the reference periods. The normal volume is calculated as the mean volume over a 15-day duration (defined as the reference period) prior to the investigation window. The major investigation window is defined from 7 days before the announcement until 7 days after the announcement, including a news release date 0, thus totally 15 days.
Table 4 provides an overall pattern of the relationship between trading volume and price change over the investigation window for all 244 samples. Especially two groups of trading volume and price change are contrasted, between negative return group and all groups (mostly positive return groups). A connection between trading volume and price change can be seen in either group. There are larger deviations among price changes than among volume changes in both groups. Important trends are that volume changes are generally larger before the announcement than after in both groups, and price changes are generally larger after than before the announcement, especially for the positive earnings group (reflected by all groups in which positive earnings account for 95%).
From these descriptive statistics, it is clear that the trading volume (the mean value) moves along with price changes. However, the following characteristics need to be pointed out:
Firstly, in both positive and negative groups, volume changes are larger than price changes, especially during the pre-announcement stage, which indicates that there are larger differentiated perceptions during larger trading movements, and that there are possibly speculation movements behind this.
Secondly, the divergence in price change improves, compared with the volume change, after the announcement (event period). This indicates that announcements decrease the level of information asymmetry, and the volume–price-change relationship is more convergent.
Furthermore, the trading volume change for different sample shares is less diversified if compared with the price change among the same stocks. This is the case in both the positive and the negative group, which indicates that traders or investors involved behave similarly during this time frame. It needs to be noted that the 2014-Second-Board Stock Market was comparatively quiet: Although not necessarily a bear market in nature, it looked rather un-popular. For this situation, it seems that only institutional investors or insiders were major operators in the market. This is also the reason the authors picked their samples during this time in order to avoid possibly complicated operating behavior.
Finally, it can be seen that trading volume does become more differentiated, notably just before day −2, while the price change usually becomes significantly large right at the announcement date. This indicates that trading activity well before the earnings release does play an important role in influencing the price change at the event date and after. These findings are consistent with Chahine and Chen [23].
Then we apply model (1) to two sets of data: the first set of data is based on the comparison of the positive earnings group and the negative earnings group, from ex-post information; the second set of data is based on the comparison of another two groups, namely positive growth vs. negative growth, also from ex-post information in earnings release. The first set is composed of 244 stocks as a total sample against only 6 with negative returns. The second set is composed of a positive growth rate group (102 companies), and a negative growth rate group (142 companies).
Table 5 provides the results of the regression on the first data set. The coefficients (Dt. and Kt.) of the non-negative return group are significant at the 1% level, while the coefficients (Dt. and Kt.) of the non-negative return group are not significant, because there are only 6 samples in this group. The results of this study imply that trading volume generally corresponds to price change. However, the earnings release improves only slightly the market convergence in terms of the relationship between trading volume and price change. Generally speaking, one unit of volume change can only account for one third or even one fourth of price change, which reveals that although trading volume correlates with price change, the responsiveness is weaker, or price dispersion exists. This is to say that speculation movements may be an underlying motive.
On the other hand, Table 6 provides results of the regression on the second set of data. The coefficients (Dt. and Kt.) of non-negative growth group and negative growth group are significant at the 1% level besides Kt. of non-negative growth group at 1day is significant at 15% level. It needs to note that during this work on the model, we choose accumulated return as the dependent variable, rather than daily returns as price change, shown in Table 5. Therefore, the case in Table 6 may be more representative for examination over speculative operations, since the accumulative return may reflect market expectations. The model results imply that there are also correlations between trading volume and cumulative return on the respective days; however, the volume impact upon dependent variables becomes smaller, especially in the non-negative group. There are another two interesting facts, for both the non-negative and negative growth groups: higher sensitive relationships do exist during certain days, e.g., −4 day in non-negative growth group and −3 day in negative growth group; while on other days, especially after the announcement, lower sensitive relationships also exist, e.g., in the announcement date. This also implies that there are larger speculative trading activities during announcement, with less sensitive parameters on accumulative returns.
5.2. Analysis of a Larger Trading Volume
A larger trading volume with smaller price changes at the same date may mean that there are investors who trade intentionally. Dispersion indicates different beliefs from other traders, or these investors have more clear motives to trade along a certain direction, while other traders may trade randomly: then price would not change too much, since larger quantities of traders have not followed this trend yet and the price will not change on that very date. However, throughout the consecutive announcement dates, there must be larger price changes, since the respective news have been published already, and previous investors should operate correspondingly just before the announcement date by either selling (previously buying for good news), or buying (less possible) for previously selling for bad news.
For the volume shock study, as previously discussed, if the trading volume is large, which is usually driven by informed speculators, there should be a large degree of dispersion (if measured by K-V models), especially when the price change is smaller. On the other hand, to find out if this larger volume trading is really speculative, we can check with the corresponding ex-post announcement releases in the market. If the corresponding pre-announcement trade brings larger premiums (usually a buying effect by informed traders with good news, for positive earnings), or the trading volume relates to larger negative price change (usually a selling effect by informed traders with bad news), such trading can be considered speculative by insiders. This is also a significant difference of this study from other purely ex-ante information-based studies.
By focusing on the larger trading volume group, we select the group or portfolio of shares with an extremely large trading volume in time T period (an extremely high trading volume shall be defined as two times higher than the average volume in the reference period; T can be defined as from−7 days to −1 day of the pre-announcement period). If the average accumulative return in the relevant group is positively related to the trading volume move in the time period T, then there should be clearly positive buying actions. On the other hand, if the average cumulative return in the relevant group is negatively related to the trading volume, then the operations behind the trading volume must be selling actions. In both cases, speculative-behavior-based movements with private and ex-ante information were reflected. However, these were “coincidental” with the matched results according to ex-post released information.
We finally select 60 companies (shares) with larger trading volume, during each day in the investigation window before the announcement (defined between days −7 and −1).
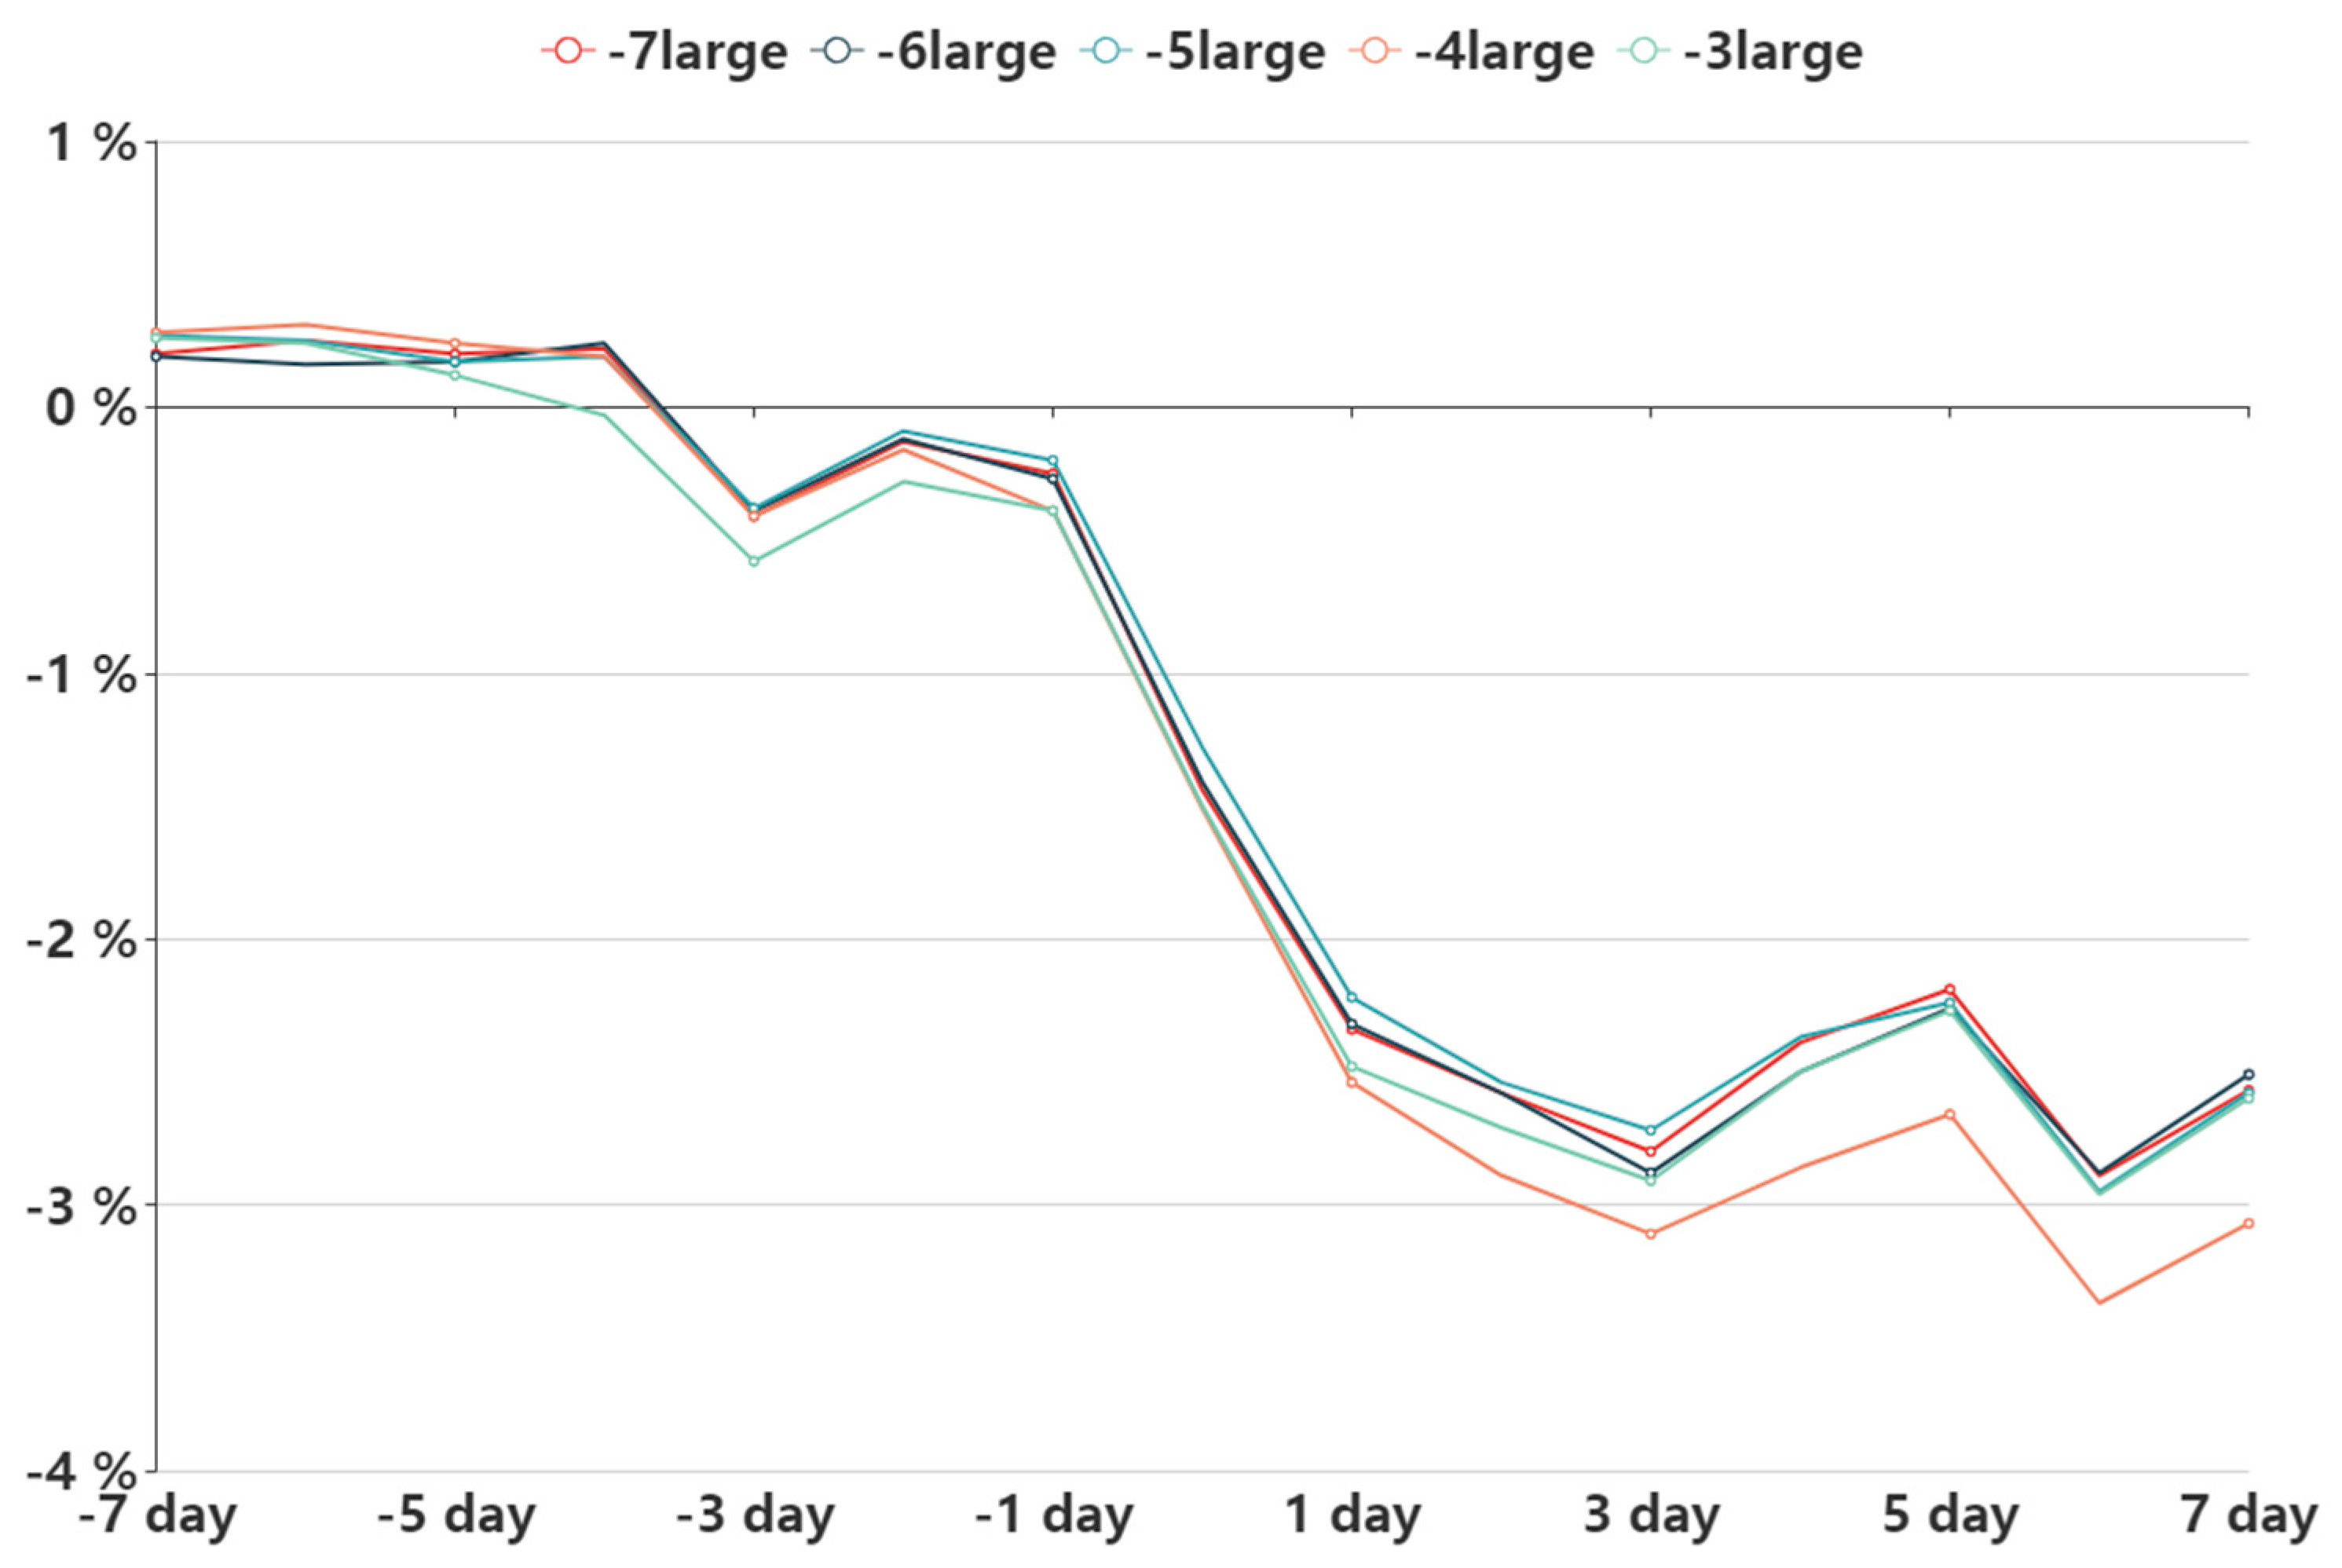
Table 6 provides a list of company numbers on each day in the corresponding window, together with the actual average profit revealed from those companies’ annual report (contents of the announcement). It is obvious that during trading day −4, there were 7 companies in a group which enjoyed the highest premium (profit) among all groups: this is clearly the group operating for positive return. While other larger volume trading groups on other days, especially the group on day −3, are rather operating in order to avoid negative returns, or for selling. This chart on behaviors of larger trading volume groups shows that the trading movement here is conducted by informed traders or even insiders, since they seem to have access to accurate information on the nature of those companies’ earnings. See Figure 2. At the same time, for those non-large trading volume cases, shown in Table 7, the cumulative returns of the operations are quite low after the announcement, if compared with modest returns before the announcement. This also shows that the rest of the smaller investors do not access enough information for their operations. See Figure 3. In this case, it might be concluded that the Second-Board Stock Market is rather dominated by insiders and informed traders, driven by their own private information.
6. Conclusions
By using the proposed model of section three, we come to the following conclusions.
The K-V- and the K-P-model and related concepts prove useful in explaining informed traders’ movements or their speculative behavior in the stock market, especially under the concept of the high-tech company-based Second-Board Market, since such companies or stocks in this kind of market are generally smaller in size and easy to be mixed with fluctuation of companies’ performance. Therefore, speculation occurs more frequently.
There is a clear and close relationship between trading volume and price change in the Chinese Second-Board Market. However, the price change is less sensitive compared with the volume change, which indicates that there are information dispersions and there are possible speculations in the market.
Ex-post information from announcement releases can be used to check quality and nature of speculation during the pre-announcement period. The volume-price change relationship difference between two kinds of portfolios classified by earnings release information, or ex-post information (namely, positive vs. negative annual profit as the first kind of portfolio and positive vs. negative annual profit growth rate in terms of cumulative returns as the second kind of portfolio) looks minor, however, the second type of difference appears to be slightly less affected by trading volume than the first kind. This suggests that the annual profit growth rate might be a better parameter for speculative behavior studies.
Only well-informed traders can obtain extra cumulative returns in trading, which can be revealed by examining extra-large trading volumes, and especially with the contrast of earnings release information. Especially during the analysis of extra-large trading volume groups, there are clear the respective pre-announcement-information-access-based speculative operations observable. In terms of buying and selling actions, this may prove highly profitable indeed. Compared with international research findings, our study may have special characteristics in the following two parts:
- ■
- This study on the high-tech listed market in China provides reference for similar economies, in terms of characteristics in speculations via early informed trading (before an announcement date), particularly in terms of early positive earnings release, in the high-tech listed market (Second Board Listed Market), however, there are other special characteristics of the Chinese economy: (1) fast-growing firms can be observed in such markets; (2) a highly fluctuating market, with diversified performance among those listed small and medium sized companies; and (3) the increase of profits in specific companies can be highly significant, therefore, either accessing internal information or being capable of quality assessments on certain listed companies is important; these facts indicate that such a stock market harboring high-tech companies may be the ideal market to observe speculative operations;
- ■
- The research framework through this observation window may provide useful reference to other related studies in the following ways:
- (1)
- Classification of groups in terms of positive and negative returns, which contrast possible speculative operations by separating positive return groups from negative return groups;
- (2)
- The time-based grouping window for observing return effects of those larger trading volume teams may show clearer contrasts for ex-post investigation. The larger trading volume before the announcement date reveals those positive return groups, which may indicate the special nature of speculative operations in such markets in China.
- (3)
- The field of earnings release event study proves to be an important platform for investigating speculative operations in the Chinese market.
However, there are some shortcomings in the study. The main problem in event study analysis is how to attribute the movements in stock prices (or volumes) to specified events. It is accomplished through controlling for the movements in the general stock markets and looking for the excess returns during the pre-announcement and post-announcement periods. However, we have to acknowledge that there might also be other idiosyncratic events for particular companies that are not directly related to earnings and may bias the results. Such as, the general stock market moved during the period of investigation on those announcement days. In fact, we refer to sampling period of the Shanghai Stock Exchange Composite Index, which can reflect the general situation of China’s stock market. We find that the stock composite index exhibits zigzag fluctuations during the window period and its neighborhood between February and April 2014. Intuitively, it does not show any correlation with the market studied in this paper. Theoretically, the announcement day effect can be studied in a more refined market scope. However, due to the limitation of space and the research topic, we only focus on the listed companies in the GEM.
Author Contributions
Xiangdong Chen and Fei Wang conceived the paper and designed the modeling framework; Fei Wang and Wei Wang developed the model and analyzed the data; Valerie Hunstock reviewed the manuscript; all authors contributed to the development of the manuscript.
Conflicts of Interest
The authors declare no conflicts of interest.
References
- Beaver, W.H. The information content of annual earnings announcements. J. Account. Res. 1968, 6, 67–92. [Google Scholar] [CrossRef]
- Bamber, L.S. Unexpected earnings, firm size, and trading volume around quarterly earnings announcements. Account. Rev. 1987, 62, 510–532. [Google Scholar]
- Kim, O.; Verrecchia, R.E. Trading volume and price reactions to public announcements. J. Account. Res. 1991, 29, 302–321. [Google Scholar] [CrossRef]
- Kim, O.; Verrecchia, R.E. Market reaction to anticipated announcements. J. Financ. Econ. 1991, 30, 273–309. [Google Scholar] [CrossRef]
- Chen, S.-S. Revisiting the empirical linkages between stock returns and trading volume. J. Bank. Financ. 2012, 36, 1781–1788. [Google Scholar] [CrossRef] [Green Version]
- Abdeldayem, M.M.; Mahmoud, M.R. An examination into the impact of trading motives on the dynamic relationship between stock returns and trading volume: Evidence from egypt. Glob. J. Manag. Bus. Res. 2013, 2, 2315–5086. [Google Scholar]
- Schwert, G.W. Why does stock market volatility change over time? J. Financ. 1989, 44, 1115–1153. [Google Scholar] [CrossRef]
- Gallant, A.R.; Rossi, P.E.; Tauchen, G. Stock prices and volume. Rev. Financ. Stud. 1992, 5, 199–242. [Google Scholar] [CrossRef]
- Foster, F.D.; Viswanathan, S. Can speculative trading explain the volume–volatility relation? J. Bus. Econ. Stat. 1995, 13, 379–396. [Google Scholar]
- Andersen, T.G. Return volatility and trading volume: An information flow interpretation of stochastic volatility. J. Financ. 1996, 51, 169–204. [Google Scholar] [CrossRef]
- Goodman, W.M. Statistically analyzing volume. Tech. Anal. Stocks Commod. 1996, 11, 21–28. [Google Scholar]
- Barron, O.E.; Karpoff, J.M. Information precision, transaction costs, and trading volume. J. Bank. Financ. 2004, 28, 1207–1223. [Google Scholar] [CrossRef]
- Xu, L. Research on multi account trading of institutional investors in chinese stock market. Econ. Res. J. 2005, 2, 72–80. [Google Scholar]
- Hu, S. Trading turnover and expected stock returns: The trading frequency hypothesis and evidence from the tokyo stock exchange. Soc. Sci. Electr. Publ. 1997. [Google Scholar] [CrossRef]
- Rouwenhorst, K.G. Local return factors and turnover in emerging stock markets. J. Financ. 1999, 54, 1439–1464. [Google Scholar] [CrossRef]
- Cready, W.M.; Mynatt, P.G. The information content of annual reports: A price and trading response analysis. Account. Rev. 1991, 66, 291–312. [Google Scholar]
- Bamber, L.S.; Cheon, Y.S. Differential price and volume reactions to accounting earnings announcements. Account. Rev. 1995, 70, 417–441. [Google Scholar]
- Karpoff, J.M. A theory of trading volume. J. Financ. 1986, 41, 1069–1087. [Google Scholar] [CrossRef]
- Atiase, R.K.; Bamber, L.S. Trading volume reactions to annual accounting earnings announcements. J. Account. Econ. 1994, 17, 309–329. [Google Scholar] [CrossRef]
- Kross, W.; Ha, G.-L.; Heflin, F. A test of risk clientele effects via an examination of trading volume response to earnings announcements. J. Account. Econ. 1994, 18, 67–87. [Google Scholar] [CrossRef]
- Kim, O.; Verrecchia, R.E. Market liquidity and volume around earnings announcements. J. Account. Econ. 1994, 17, 41–67. [Google Scholar] [CrossRef]
- Atiase, R.K. Predisclosure information, firm capitalization, and security price behavior around earnings announcements. J. Account. Res. 1985, 23, 21–36. [Google Scholar] [CrossRef]
- Chahine, S.; Chen, X.D. Market reaction around public announcement in the chinese stock market. In Proceedings of the 7th Asia Pacific Finance Association Annual Conference, Shanghai, China, 24–26 July 2000. [Google Scholar]
- Gençay, R.; Gradojevic, N. Private information and its origins in an electronic foreign exchange market. Econ. Modell. 2013, 33, 86–93. [Google Scholar] [CrossRef]
- Gençay, R.; Gradojevic, N.; Olsen, R.; Selçuk, F. Informed traders’ arrival in foreign exchange markets: Does geography matter? Empir. Econ. 2015, 49, 1431–1462. [Google Scholar] [CrossRef]
- Gradojevic, N.; Erdemlioglu, D.; Gençay, R. Informativeness of trade size in foreign exchange markets. Econ. Lett. 2017, 150, 27–33. [Google Scholar] [CrossRef]
- Easley, D.; Kiefer, N.M.; O’Hara, M. One day in the life of a very common stock. Rev. Financ. Stud. 1997, 10, 805–835. [Google Scholar] [CrossRef]
- Easley, D.; Kiefer, N.M.; O’Hara, M. The information content of the trading process. J. Empir. Financ. 1997, 4, 159–186. [Google Scholar] [CrossRef]
- Jiang, G.J.; Lo, I.; Verdelhan, A. Information shocks, liquidity shocks, jumps, and price discovery: Evidence from the U.S. Treasury market. J. Financ. Quant. Anal. 2010, 46, 527–551. [Google Scholar] [CrossRef]
- Easley, D.; O’Hara, M. Price, trade size, and information in securities markets. J. Financ. Econ. 1987, 19, 69–90. [Google Scholar] [CrossRef]
- Anand, A.; Chakravarty, S. Stealth trading in options markets. J. Financ. Quant. Anal. 2007, 42, 167–187. [Google Scholar] [CrossRef]
- Barclay, M.J.; Warner, J.B. Stealth trading and volatility. J. Financ. Econ. 1993, 34, 281–305. [Google Scholar] [CrossRef]
- Chakravarty, S. Stealth-trading: Which traders’ trades move stock prices? J. Financ. Econ. 2001, 61, 289–307. [Google Scholar] [CrossRef]
- Menkhoff, L.; Schmeling, M. Whose trades convey information? Evidence from a cross-section of traders. J. Financ. Mark. 2010, 13, 101–128. [Google Scholar] [CrossRef]
- Easley, D.; Engle, R.F.; O’Hara, M.; Wu, L. Time-varying arrival rates of informed and uninformed trades. J. Financ. Econom. 2008, 6, 171–207. [Google Scholar] [CrossRef]
- Chan, K.; Fong, W.-M. Trade size, order imbalance, and the volatility–volume relation. J. Financ. Econ. 2000, 57, 247–273. [Google Scholar] [CrossRef]
- Kandel, E.; Pearson, N.D. Differential interpretation of public signals and trade in speculative markets. J. Polit. Econ. 1995, 103, 831–872. [Google Scholar] [CrossRef]
- Kim, O.; Verrecchia, R.E. Pre-announcement and event-period private information. J. Account. Econ. 1997, 24, 395–419. [Google Scholar] [CrossRef]
- Hope, O.-K.; Thomas, W.B.; Winterbotham, G. Geographic earnings disclosure and trading volume. J. Account. Public Policy 2009, 28, 167–188. [Google Scholar] [CrossRef]
- Cho, M.; Kwon, S.Y. Trading volume and investor disagreement around management forecast disclosures. J. Account. Audit. Financ. 2014, 29, 3–30. [Google Scholar] [CrossRef]
- Bamber, L.S.; Barron, O.E.; Stober, T.L. Differential interpretations and trading volume. J. Financ. Quant. Anal. 1999, 34, 369–386. [Google Scholar] [CrossRef]
- Easley, D.; O’Hara, M. Adverse selection and large trade volume: The implications for market efficiency. J. Financ. Quant. Anal. 1992, 27, 185–208. [Google Scholar] [CrossRef]
- Kyle, A.S. Continuous auctions and insider trading. Econometrica 1985, 53, 1315–1335. [Google Scholar] [CrossRef]
Figure 1.
Sampling period in the High Tech Listed Company Market (known as the Second Board Stock Market) in China. The chart shows fluctuations and a developing curve of the Growth Enterprise Index (GEI, which is formed by opening quotation and provided by Shenzhen Fortune Trend Technologies Inc.; the software can be downloaded at http://www.tdx.com.cn) in the Second Board Stock Market in China from November 2011 to April 2015. This chart shows the changes in the developments for each day, contrasted with the respective transaction time period at the bottom. In the above chart the sampling periods (March 2014 and May 2014) of this study are indicated.
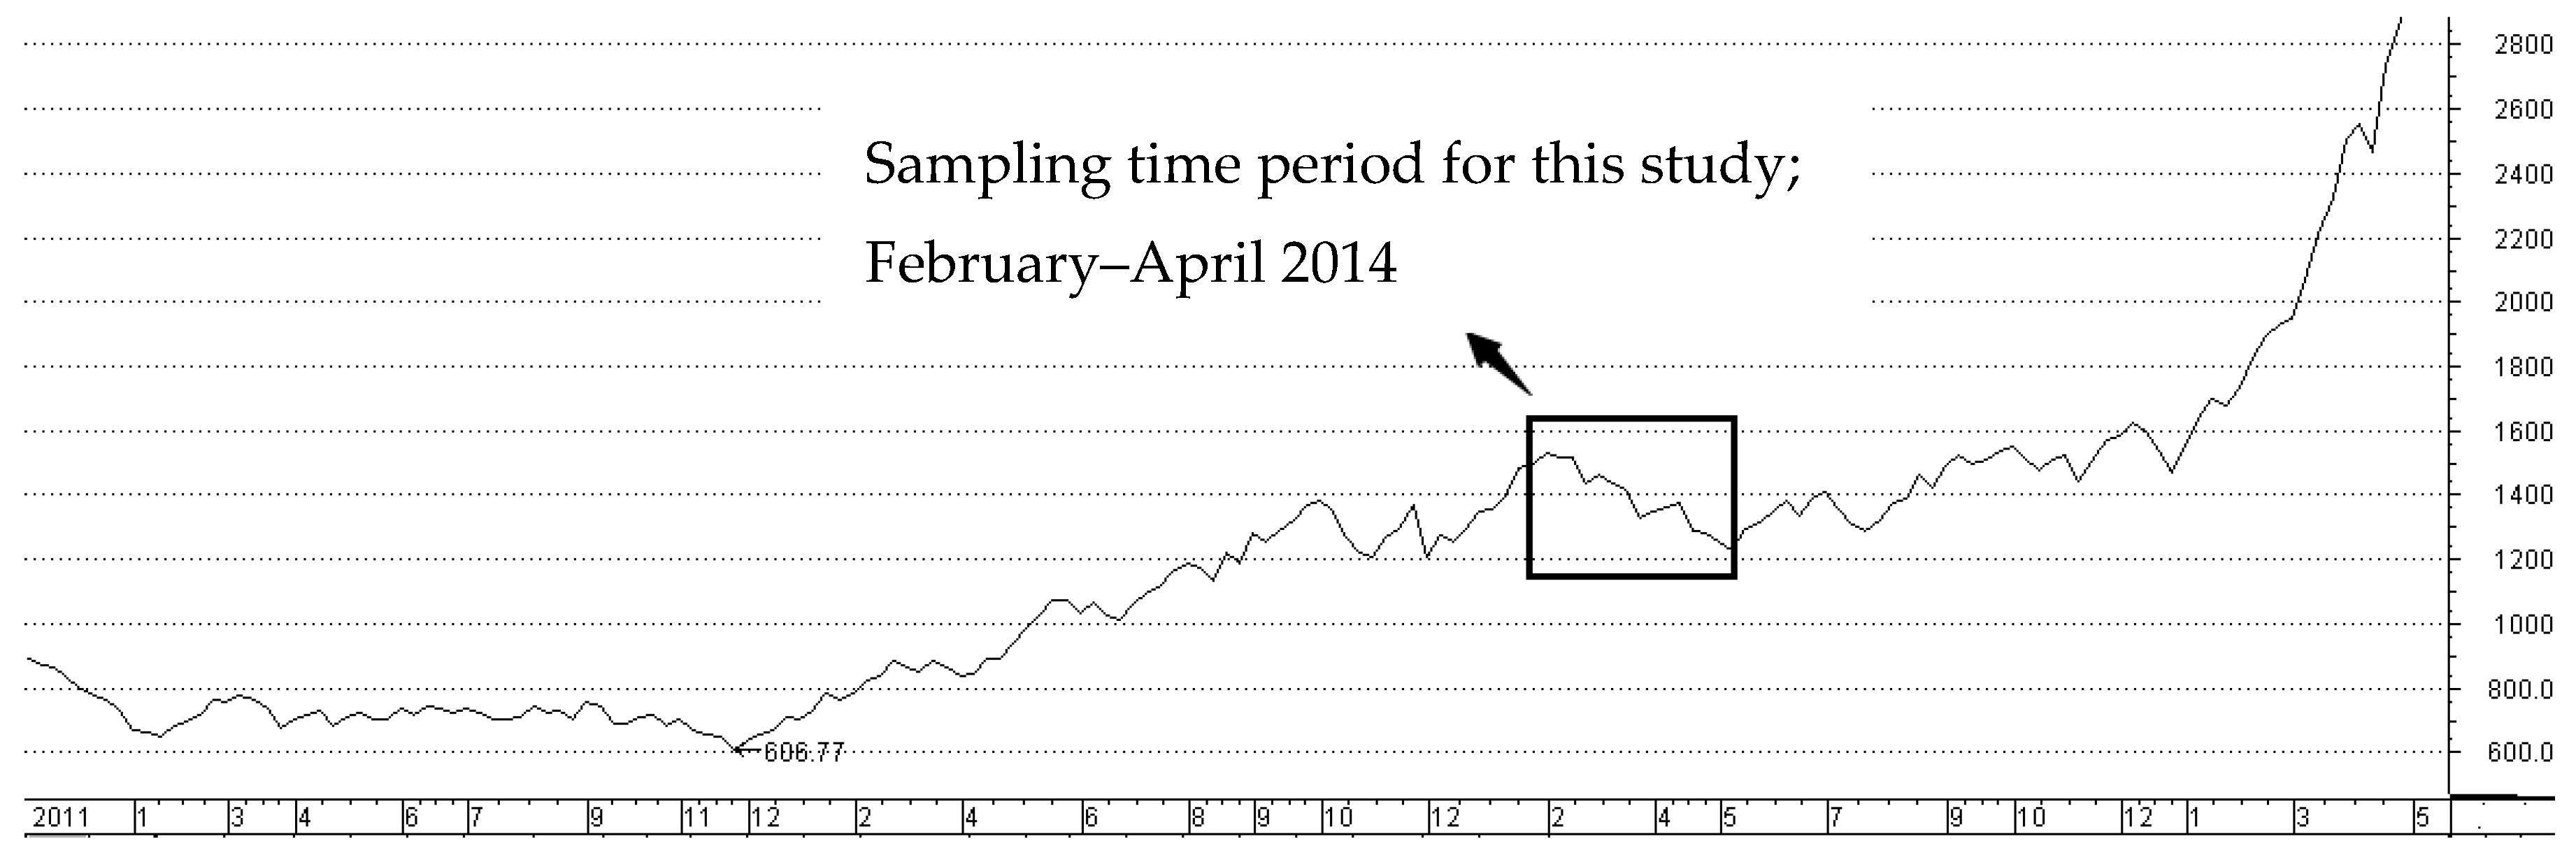
Figure 2.
Distribution of the larger trading volume groups in different trading days.
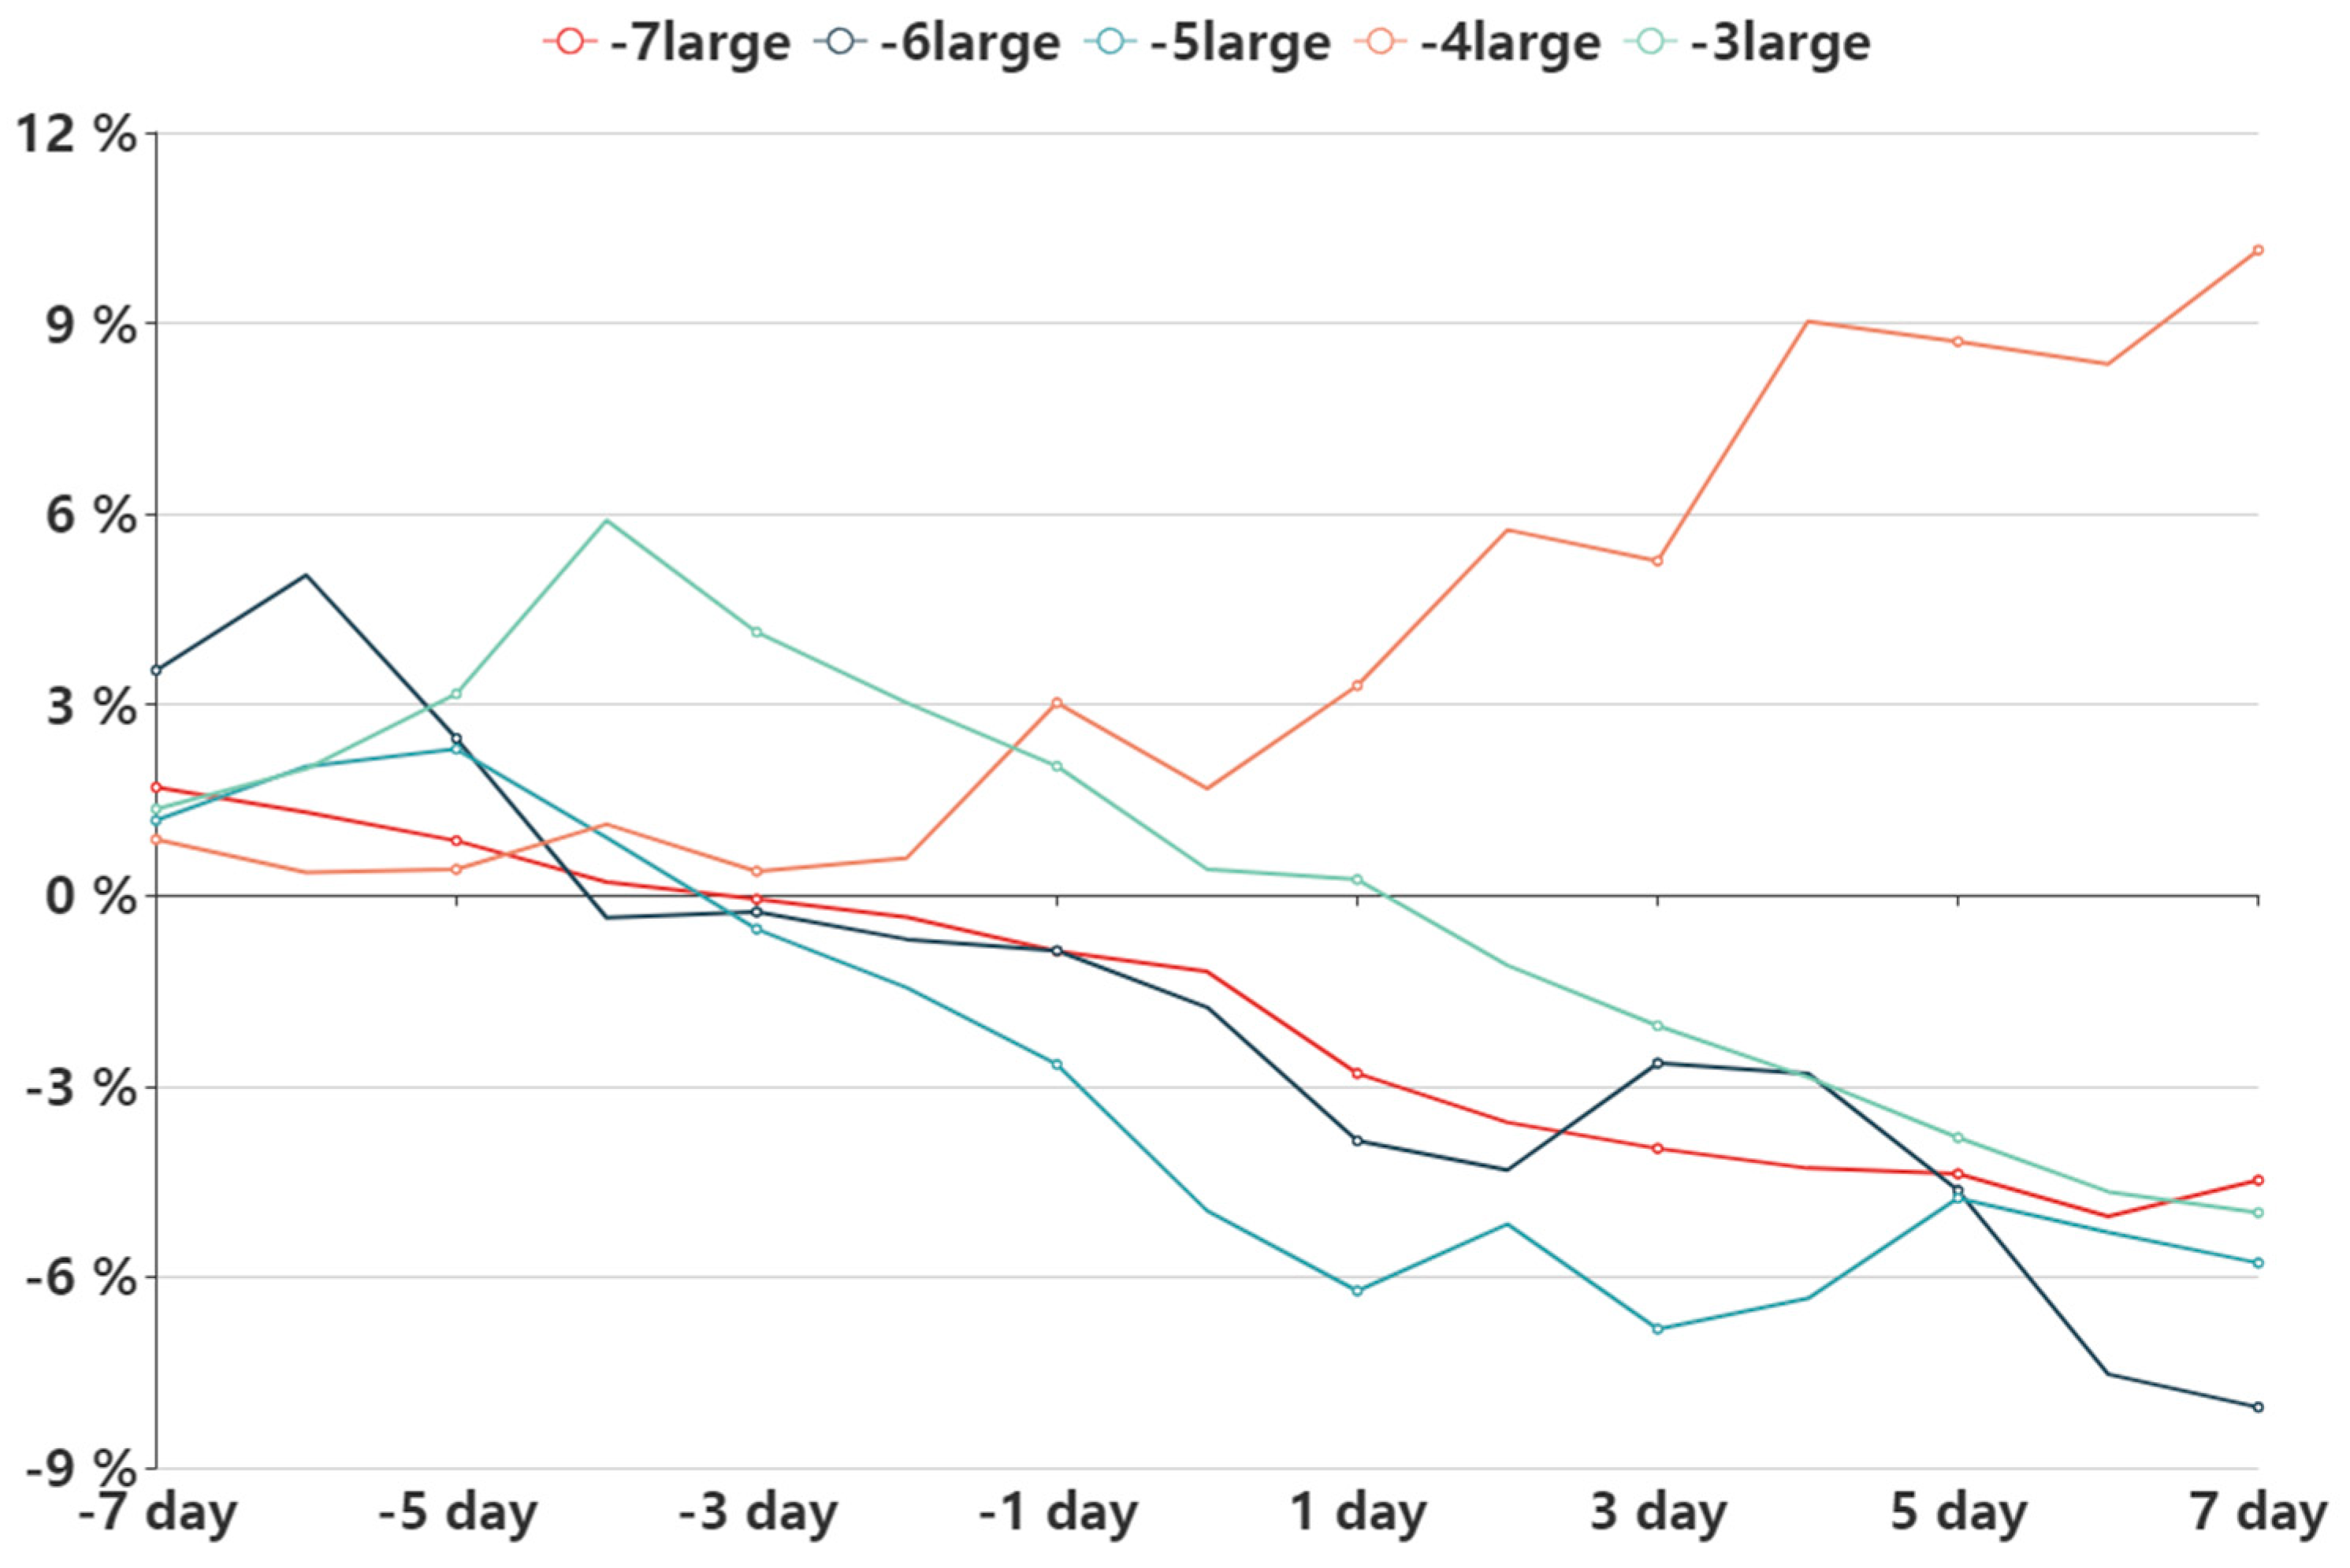
Figure 3.
Distribution of the remaining non-larger trading volume groups on different trading days.

Table 1.
Summary of the relationship between Trading volume and Price change.
| According to K-V and K-P Model (1992–1997), Trading Volume = | Pre-Announcement Period Measured by | Event-Period Measure by |
|---|---|---|
| : Private information/differential precision | : Private information/differential precision; : Private information/equal precision | |
| : Private information/differential precision | No private information | |
| Private information/differential precision | : Private information/equal precision | |
| (Kandel and Pearson’s Model with large volume and small price change) | : Differential interpretation of the information released | : Average difference among investors (price change) |
| (absolute Price Change) + Developed by Hope et al., 2009 | : private information before the announcement | : trading volume not associated with price change |
| Numbers of variables, such as difference between perception and management, size of the market, and many others, by Cho and Kwon (2014) | Perceptions related to private information before the announcement | N/A |
Table 2.
Summary information of samples.
| Windows | Sample Sizes | Price Change | Volume Change | ||||||
|---|---|---|---|---|---|---|---|---|---|
| Minimum | Maximum | Mean | Std. Deviation | Minimum | Maximum | Mean | Std. Deviation | ||
| −7 | 244 | 0 | 5.469 | 0.976 | 0.892 | 0.129 | 3.326 | 1.058 | 0.546 |
| −6 | 244 | 0 | 3.406 | 0.914 | 0.782 | 0.241 | 2.903 | 1.030 | 0.438 |
| −5 | 244 | 0 | 3.303 | 0.818 | 0.699 | 0.160 | 2.364 | 1.003 | 0.421 |
| −4 | 244 | 0 | 4.588 | 0.996 | 0.822 | 0.260 | 3.643 | 1.005 | 0.414 |
| −3 | 244 | 0 | 4.955 | 0.956 | 0.792 | 0.279 | 4.448 | 1.020 | 0.494 |
| −2 | 244 | 0 | 5.536 | 0.930 | 0.806 | 0.250 | 2.282 | 0.955 | 0.373 |
| −1 | 244 | 0 | 3.536 | 1.070 | 0.808 | 0.276 | 2.674 | 1.031 | 0.424 |
| 0 | 244 | 0 | 5.904 | 1.394 | 1.134 | 0.408 | 3.822 | 1.298 | 0.558 |
| 1 | 244 | 0 | 4.011 | 1.149 | 0.856 | 0.333 | 3.451 | 1.045 | 0.446 |
| 2 | 244 | 0 | 4.909 | 1.103 | 0.860 | 0.329 | 2.714 | 0.996 | 0.420 |
| 3 | 244 | 0 | 4.034 | 0.932 | 0.740 | 0.355 | 4.067 | 0.943 | 0.435 |
| 4 | 244 | 0 | 4.703 | 0.989 | 0.799 | 0.217 | 2.633 | 0.910 | 0.399 |
| 5 | 244 | 0 | 4.891 | 0.880 | 0.823 | 0.187 | 2.123 | 0.897 | 0.380 |
| 6 | 244 | 0 | 4.158 | 0.970 | 0.844 | 0.277 | 4.749 | 0.908 | 0.499 |
| 7 | 244 | 0 | 5.517 | 0.908 | 0.787 | 0.186 | 3.748 | 0.902 | 0.449 |
| Average | N/A | 0.999 | 0.830 | N/A | 1.000 | 0.446 | |||
Note: Number of observations is 244. All the announcements are based on fiscal year 2013. The dates of announcements from different companies are different during February to May in 2014. Announcement window for each company is centered on the day of the announcement, extending forward and backward for seven days. Moreover, all companies’ announcements windows form a total sample.
Table 3.
Speculation by informed traders around earnings releases (for both good and bad news).
| The Case of Good News | Pre-Announcement | Announcement | Post-Announcement | ||
|---|---|---|---|---|---|
| T1 | T2 | T3 | T4 | ||
| Informed trading (L + short term.) | B[V(L)1] | B[V(L)1] | S[V(L)1] | S[V(L)1] | S[V(L)1] |
| Informed trading (H + short term.) | B[V(H)1] | B[V(H)2] | S[V(H)1] + S[V(H)2] | S[V(H)2] | S[V(H)2] |
| Informed trading (H + long term.) | B[V(H)1] | B[V(H)2] | N/A | S[V(H)1] | S[V(H)2] |
| Non Insider/but informed | N/A or noisy | B[V(L)1] | B[V(L)1] | B[V(L)1]·S[V(L)1] | S[V(L)2] |
| Un-informed trader | N/A or noisy | N/A or noisy | B[V(X)1] | B[V(X)1, 2, …, i] | |
| characteristics of trades | Divergence | Convergence | Divergence | Divergence | Divergence |
| The case of bad news | Pre-announcement | Announcement | Post-announcement | ||
| T1 | T2 | T3 | T4 | ||
| Informed trader (H) | S[V(H)1] | S[V(H)2] | N/A… | N/A… | N/A… |
| Informed trader (L) | N/A | S[V(L)1] | S[V(L)1] | S[V(L)1] | N/A… |
| Un-informed trader | N/A | N/A | S[V(X)1]… | S[V(X)1, 2, ..., i] | |
| haracteristics of trades | Divergence | Convergence | Convergence | Convergence | Divergence |
Notes: B[V]: buying action on particular share, number will indicate operating times for buying, such as B[V(H)2] as 2nd time buying. S[V]: selling action on particular share. V(H): trading by highly informed traders, generally with higher trading volume. V(L): trading by less informed traders, generally with lower trading volume. N/A: mixture of trade direction, or noisy traders. B[V(X)] or S[V(X)]: buying or selling volume with un-known quantity, but generally smaller.
Table 4.
Comparison between Negative Return Group and All Group (95% are positive earning companies): Descriptive statistics.
Table 4.
Comparison between Negative Return Group and All Group (95% are positive earning companies): Descriptive statistics.
| Items | Windows | Price Change | Volume Change | ||||||
|---|---|---|---|---|---|---|---|---|---|
| Minimum | Maximum | Mean | Std. Deviation | Minimum | Maximum | Mean | Std. Deviation | ||
| Negative return Group (6 samples) | −7 | 0.000 | 0.772 | 0.443 | 0.333 | 0.451 | 2.338 | 1.274 | 0.682 |
| −6 | 0.083 | 1.230 | 0.684 | 0.425 | 0.566 | 1.717 | 1.186 | 0.400 | |
| −5 | 0.000 | 0.950 | 0.669 | 0.339 | 0.632 | 1.472 | 1.099 | 0.313 | |
| −4 | 0.264 | 2.069 | 1.008 | 0.660 | 0.709 | 1.855 | 1.132 | 0.429 | |
| −3 | 0.453 | 2.334 | 1.372 | 0.743 | 0.744 | 3.096 | 1.414 | 0.894 | |
| −2 | 0.030 | 2.569 | 0.804 | 1.009 | 0.693 | 1.359 | 0.976 | 0.262 | |
| −1 | 0.000 | 1.649 | 0.822 | 0.596 | 0.705 | 1.205 | 0.952 | 0.220 | |
| 0 | 0.000 | 3.632 | 1.456 | 1.409 | 0.756 | 1.884 | 1.139 | 0.402 | |
| 1 | 0.104 | 2.301 | 0.935 | 0.822 | 0.700 | 2.351 | 1.061 | 0.641 | |
| 2 | 0.166 | 1.804 | 0.787 | 0.691 | 0.701 | 1.249 | 0.933 | 0.205 | |
| 3 | 0.213 | 0.546 | 0.407 | 0.120 | 0.570 | 1.261 | 0.809 | 0.280 | |
| 4 | 0.389 | 2.133 | 1.322 | 0.607 | 0.543 | 1.025 | 0.725 | 0.164 | |
| 5 | 0.412 | 3.960 | 1.670 | 1.490 | 0.437 | 1.739 | 0.831 | 0.463 | |
| 6 | 0.245 | 2.810 | 1.422 | 1.114 | 0.451 | 1.228 | 0.782 | 0.336 | |
| 7 | 0.602 | 1.513 | 1.197 | 0.331 | 0.375 | 1.216 | 0.689 | 0.308 | |
| Average | N/A | 1.000 | 0.713 | N/A | 1.000 | 0.400 | |||
| All groups (244 samples) | −7 | 0 | 5.469 | 0.976 | 0.892 | 0.129 | 3.326 | 1.058 | 0.546 |
| −6 | 0 | 3.406 | 0.914 | 0.782 | 0.241 | 2.903 | 1.030 | 0.438 | |
| −5 | 0 | 3.303 | 0.818 | 0.699 | 0.160 | 2.364 | 1.003 | 0.421 | |
| −4 | 0 | 4.588 | 0.996 | 0.822 | 0.260 | 3.643 | 1.005 | 0.414 | |
| −3 | 0 | 4.955 | 0.956 | 0.792 | 0.279 | 4.448 | 1.020 | 0.494 | |
| −2 | 0 | 5.536 | 0.930 | 0.806 | 0.250 | 2.282 | 0.955 | 0.373 | |
| −1 | 0 | 3.536 | 1.070 | 0.808 | 0.276 | 2.674 | 1.031 | 0.424 | |
| 0 | 0 | 5.904 | 1.394 | 1.134 | 0.408 | 3.822 | 1.298 | 0.558 | |
| 1 | 0 | 4.011 | 1.149 | 0.856 | 0.333 | 3.451 | 1.045 | 0.446 | |
| 2 | 0 | 4.909 | 1.103 | 0.860 | 0.329 | 2.714 | 0.996 | 0.420 | |
| 3 | 0 | 4.034 | 0.932 | 0.740 | 0.355 | 4.067 | 0.943 | 0.435 | |
| 4 | 0 | 4.703 | 0.989 | 0.799 | 0.217 | 2.633 | 0.910 | 0.399 | |
| 5 | 0 | 4.891 | 0.880 | 0.823 | 0.187 | 2.123 | 0.897 | 0.380 | |
| 6 | 0 | 4.158 | 0.970 | 0.844 | 0.277 | 4.749 | 0.908 | 0.499 | |
| 7 | 0 | 5.517 | 0.908 | 0.787 | 0.186 | 3.748 | 0.902 | 0.449 | |
| Average | N/A | 0.999 | 0.830 | N/A | 1.000 | 0.446 | |||
Table 5.
Results of the model for announcement samples in 2014 in the Second-board Stock market: Positive Earning Group against Negative Earning Group.
Table 5.
Results of the model for announcement samples in 2014 in the Second-board Stock market: Positive Earning Group against Negative Earning Group.
| Windows | Non-Negative Return Group (Sample: 238) | Negative Return Group (Sample: 6) | ||||||||
|---|---|---|---|---|---|---|---|---|---|---|
| Dt | Sig. | Kt | Sig. | R2 | Dt | Sig. | Kt | Sig. | R2 | |
| −7 | 0.763 | 0.000 | 0.293 | 0.000 | 0.235 | 1.014 | 0.127 | 0.587 | 0.582 | 0.082 |
| −6 | 0.860 | 0.000 | 0.181 | 0.000 | 0.105 | 1.455 | 0.012 | −0.393 | 0.410 | 0.174 |
| −5 | 0.776 | 0.000 | 0.273 | 0.000 | 0.207 | 0.980 | 0.042 | 0.178 | 0.714 | 0.037 |
| −4 | 0.745 | 0.000 | 0.257 | 0.000 | 0.264 | 0.531 | 0.025 | 0.596 | 0.010 | 0.841 |
| −3 | 0.722 | 0.000 | 0.305 | 0.000 | 0.254 | 0.823 | 0.393 | 0.431 | 0.486 | 0.128 |
| −2 | 0.750 | 0.000 | 0.219 | 0.000 | 0.219 | 0.839 | 0.002 | 0.170 | 0.159 | 0.427 |
| −1 | 0.791 | 0.000 | 0.224 | 0.000 | 0.181 | 0.787 | 0.007 | 0.201 | 0.264 | 0.297 |
| 0 | 0.941 | 0.000 | 0.259 | 0.000 | 0.272 | 0.855 | 0.013 | 0.195 | 0.134 | 0.467 |
| 1 | 0.881 | 0.000 | 0.142 | 0.000 | 0.076 | 0.468 | 0.160 | 0.635 | 0.049 | 0.663 |
| 2 | 0.719 | 0.000 | 0.251 | 0.000 | 0.262 | 0.988 | 0.002 | −0.070 | 0.652 | 0.056 |
| 3 | 0.698 | 0.000 | 0.263 | 0.000 | 0.201 | 1.688 | 0.001 | −2.159 | 0.009 | 0.853 |
| 4 | 0.682 | 0.000 | 0.237 | 0.000 | 0.223 | 0.668 | 0.025 | 0.043 | 0.765 | 0.025 |
| 5 | 0.709 | 0.000 | 0.221 | 0.000 | 0.215 | 0.540 | 0.123 | 0.174 | 0.247 | 0.315 |
| 6 | 0.725 | 0.000 | 0.194 | 0.000 | 0.105 | 0.456 | 0.057 | 0.229 | 0.081 | 0.574 |
| 7 | 0.695 | 0.000 | 0.237 | 0.000 | 0.173 | −0.004 | 0.993 | 0.579 | 0.186 | 0.388 |
Note: Sig. indicates the significance of the coefficients.
Table 6.
Results of the model for announcement samples in 2014 in the Second-Board Stock Market: Positive Growth vs. Negative Growth on Earnings.
Table 6.
Results of the model for announcement samples in 2014 in the Second-Board Stock Market: Positive Growth vs. Negative Growth on Earnings.
| Windows | Non-Negative Growth Group (Sample: 142) | Negative Growth Group (Sample:102) | ||||||||
|---|---|---|---|---|---|---|---|---|---|---|
| Dt | Sig | Kt | Sig. | R2 | Dt | Sig | Kt | Sig. | R2 | |
| −7 | 0.607 | 0.000 | 0.278 | 0.000 | 0.308 | 0.868 | 0.000 | 0.330 | 0.000 | 0.237 |
| −6 | 0.809 | 0.000 | 0.171 | 0.002 | 0.095 | 0.908 | 0.000 | 0.184 | 0.000 | 0.108 |
| −5 | 0.744 | 0.000 | 0.272 | 0.000 | 0.190 | 0.811 | 0.000 | 0.267 | 0.000 | 0.208 |
| −4 | 0.698 | 0.000 | 0.311 | 0.000 | 0.308 | 0.785 | 0.000 | 0.214 | 0.000 | 0.232 |
| −3 | 0.801 | 0.000 | 0.253 | 0.001 | 0.097 | 0.682 | 0.000 | 0.334 | 0.000 | 0.377 |
| −2 | 0.793 | 0.000 | 0.219 | 0.000 | 0.250 | 0.736 | 0.000 | 0.201 | 0.000 | 0.164 |
| −1 | 0.854 | 0.000 | 0.223 | 0.000 | 0.174 | 0.740 | 0.000 | 0.230 | 0.000 | 0.201 |
| 0 | 1.073 | 0.000 | 0.194 | 0.000 | 0.148 | 0.821 | 0.000 | 0.303 | 0.000 | 0.365 |
| 1 | 0.987 | 0.000 | 0.104 | 0.128 | 0.023 | 0.769 | 0.000 | 0.192 | 0.000 | 0.212 |
| 2 | 0.766 | 0.000 | 0.262 | 0.000 | 0.363 | 0.715 | 0.000 | 0.214 | 0.000 | 0.156 |
| 3 | 0.734 | 0.000 | 0.282 | 0.000 | 0.206 | 0.692 | 0.000 | 0.224 | 0.000 | 0.174 |
| 4 | 0.649 | 0.000 | 0.294 | 0.000 | 0.287 | 0.718 | 0.000 | 0.165 | 0.000 | 0.140 |
| 5 | 0.692 | 0.000 | 0.213 | 0.000 | 0.187 | 0.725 | 0.000 | 0.210 | 0.000 | 0.226 |
| 6 | 0.695 | 0.000 | 0.171 | 0.000 | 0.117 | 0.748 | 0.000 | 0.199 | 0.000 | 0.099 |
| 7 | 0.643 | 0.000 | 0.197 | 0.000 | 0.187 | 0.718 | 0.000 | 0.267 | 0.000 | 0.175 |
Note: Sig. indicates the significance of the coefficients.
Table 7.
Comparison of Larger Trading Volume Classified Groups in typical days during pre-announcement periods.
Table 7.
Comparison of Larger Trading Volume Classified Groups in typical days during pre-announcement periods.
| Larger Trading Volume on Respect Trading Day T | Number of Companies in Group | Average Yearly Growth Rate on Profit According to the Announcement | Nature of Operation (Positive: Buying, Negative: Selling) |
|---|---|---|---|
| −7 | 16 | −9.25% | Negative operation |
| −6 | 9 | −5.52% | Negative operation |
| −5 | 9 | −10.68% | Negative operation |
| −4 | 7 | +27.98% | Positive operation |
| −3 | 10 | −106.24% | Negative operation |
| −2 | 3 | +2.62% | N/A |
| −1 | 6 | −17.62% | Negative operation |
| Total | 60 | Average: −16.96% | N/A |
© 2017 by the authors. Licensee MDPI, Basel, Switzerland. This article is an open access article distributed under the terms and conditions of the Creative Commons Attribution (CC BY) license (http://creativecommons.org/licenses/by/4.0/).
Share and Cite
MDPI and ACS Style
Chen, X.; Wang, F.; Wang, W.; Hunstock, V. Volume Shocks around Announcements in the Chinese Stock Market: An Ex-Post Earnings-Information-Based Study of Speculative Behavior. Information 2017, 8, 112. https://doi.org/10.3390/info8030112
AMA Style
Chen X, Wang F, Wang W, Hunstock V. Volume Shocks around Announcements in the Chinese Stock Market: An Ex-Post Earnings-Information-Based Study of Speculative Behavior. Information. 2017; 8(3):112. https://doi.org/10.3390/info8030112
Chicago/Turabian StyleChen, Xiangdong, Fei Wang, Wei Wang, and Valerie Hunstock. 2017. "Volume Shocks around Announcements in the Chinese Stock Market: An Ex-Post Earnings-Information-Based Study of Speculative Behavior" Information 8, no. 3: 112. https://doi.org/10.3390/info8030112
Note that from the first issue of 2016, this journal uses article numbers instead of page numbers. See further details here.