Fuzzy Color Clustering for Melanoma Diagnosis in Dermoscopy Images


1
Department of Electrical and Computer Engineering, Missouri University of Science and Technology, Rolla, MO 65401, USA
2
Stoecker and Associates, 10101 Stoltz Dr., Rolla, MO 65401, USA
*
Author to whom correspondence should be addressed.
Information 2017, 8(3), 89; https://doi.org/10.3390/info8030089
Submission received: 20 May 2017
/
Revised: 21 July 2017
/
Accepted: 21 July 2017
/
Published: 25 July 2017
(This article belongs to the Special Issue Fuzzy Logic for Image Processing)
Abstract
:A fuzzy logic-based color histogram analysis technique is presented for discriminating benign skin lesions from malignant melanomas in dermoscopy images. The approach extends previous research for utilizing a fuzzy set for skin lesion color for a specified class of skin lesions, using alpha-cut and support set cardinality for quantifying a fuzzy ratio skin lesion color feature. Skin lesion discrimination results are reported for the fuzzy clustering ratio over different regions of the lesion over a data set of 517 dermoscopy images consisting of 175 invasive melanomas and 342 benign lesions. Experimental results show that the fuzzy clustering ratio applied over an eight-connected neighborhood on the outer 25% of the skin lesion with an alpha-cut of 0.08 can recognize 92.6% of melanomas with approximately 13.5% false positive lesions. These results show the critical importance of colors in the lesion periphery. Our fuzzy logic-based description of lesion colors offers relevance to clinical descriptions of malignant melanoma.
1. Introduction
Diagnosis of early-stage melanomas is challenging, especially for melanomas which have an atypical presentation [1,2,3,4]. Dermoscopy is an imaging modality that uses a simple hand-held device that eliminates surface glare and magnifies structures invisible to the naked eye. Although dermoscopy significantly improves diagnostic accuracy compared to naked-eye examination alone [5,6], average dermoscopic melanoma sensitivity for dermatologists and others seeing dermatology patients in three recent reader studies was only 71–85% and specificity 54–71% [7,8,9]. Non-specialist sensitivity and specificity is even lower; when compared to dermatologists, non-specialists were found to have a sensitivity for melanoma of 54% and a specificity of 73% [10].
The relatively low diagnostic accuracy for discrimination of malignant melanoma demonstrates the uncertainty involved in skin lesion analysis. This low diagnostic accuracy is an important medical problem for society, since the incidence of cutaneous melanoma, 161,790 cases estimated in the US in 2017, vs. 140,860 cases for 2016, has risen every year since 1979 [11,12]. In more recent advances, techniques such as deep learning have shown potential using pixel blocks from lesion images with disease labels for significantly improved skin lesion discrimination, achieving an area under the diagnostic ROC curve of approximately 0.91, exceeding the performance of dermatologists [8]. Even with the improvements in computer-assisted techniques for skin lesion classification, learning and application of specific features for skin lesion discrimination is important for clinicians and clinician training. Therefore, the investigation of computer-assisted techniques for the determination and analysis of specific skin lesion features is useful in the dermatology community. In this research, we focus on automatic detection of melanoma colors.
One of the most important features for detecting malignant melanoma is the skin lesion color. Some studies have examined the influence of shape and color for skin lesion discrimination and determined that shape is an important contributor for successful lesion assessment [13]. Contributors to this assessment may include melanomas that tend to have more colors present, often with different shades of tan, brown, brown or black and occasional patches of red, white or blue. Moreover, melanoma colors are present in chaotic patterns, classically described as “variegated” [14]. Many analytic color descriptors have been applied to melanoma detection, most often utilizing the red, green and blue (RGB) color space. These descriptors are among the most significant of all analytic descriptors of melanoma. Ferris et al., found that the top three statistical features for melanoma were all color feature characterizing color histograms and color asymmetry [7]. Analysis of various analytic and clinical features by Rubegni et al., showed that the single most significant feature was red asymmetry [15]. This research group used variables that capture the number and types of color elements within a lesion, to represent the chaotic pattern of color present within a lesion, related to the “color islands” previously described by this group [16]. Other color descriptors used to detect melanoma include variation of hues [17], analytical color techniques for detecting color variegation [18], RGB color channel statistical parameters [19,20,21], spherical color coordinates and (L, a*, b*) color coordinate features [22], percentage of the skin lesion containing absolute shades of reddish, bluish, grayish and blackish areas and the number of those color shades present within the skin lesion [23]. Color quantization for the different color shades examined in [24] was performed using the median cut color quantization algorithm [24]. Using a training set of lesions to populate a cumulative relative color histogram based on clinical melanoma and benign images [25,26] and dermoscopy images [27] has been explored for determining melanoma and benign colors based on probabilistic and histogram region growing techniques for finding the percentage of pixels within the skin lesion that are melanoma colored [25] and the clustering of melanoma colored pixels within the lesion [26,27]. Melanoma discrimination also has been investigated using fuzzy logic techniques to quantify the degree of association of lesion colors with benign lesions based on determining a membership function for benign color derived from a training set of benign lesions [28]. Color features sometimes are combined with other features such as texture, but when comparing texture and color alone the color features outperform the texture features [29].
Using color to characterize melanoma is faced with two major difficulties. First, variations in lighting and slide processing make it difficult to characterize melanoma. The use of relative color [27,30,31], where the average background skin color is subtracted from each lesion pixel, has been used to help compensate for color variability in the imaging process. The use of the relative color technique tries to remove variability of color due to different skin types as well as to lighting and image processing techniques [30]. Second, different melanomas have different color characteristics across skin lesions which makes it difficult to reliably use melanoma color features as distinct differentiators of melanoma. These difficulties highlight the need for color analysis techniques that do not explicitly identify colors representative of melanoma (or benign) lesions as the foundation for color-based skin lesion diagnosis. Fuzzy logic techniques can represent color with these inherent difficulties through quantization of degrees of association as melanoma or benign colors for skin lesion discrimination. This study extends the data-driven approaches from [25,26] using a training set of images for determining relative color degree of association or membership as a benign color for finding the ratio of pixels within a skin lesion with a specified level of membership as a benign color to all pixels within the lesion that have a non-zero membership as a benign color [28]. This study introduces fuzzy logic techniques for relative color representation that incorporates spatial context for the clustering of pixels within specified regions of the skin lesion for color feature analysis. The goal of this study is to present advances in color features for melanoma and benign lesion discrimination that can be useful for clinicians in the diagnostic process.
The remaining sections of the paper include: (1) an overview of dermoscopy image acquisition; (2) the fuzzy logic technique for color histogram analysis and color feature determination; (3) an overview of the lesion region analysis; (4) the automated approach for melanoma detection; (5) experiments performed; (6) results and discussion and (7) conclusions.
2. Methodology
2.1. Dermoscopy Image Data
Imaging of skin lesions is anticipated to have an important role as a diagnostic aid for malignant melanoma. In this research, the red, green and blue (RGB) color space of dermoscopy images was used to analyze skin lesions. In the RGB space each dimension (R, G and B) typically uses 8-bits per pixel, providing 256 possible values for each dimension. Thus, there are a total of 2563 or 16,777,216 possible colors in this color space.
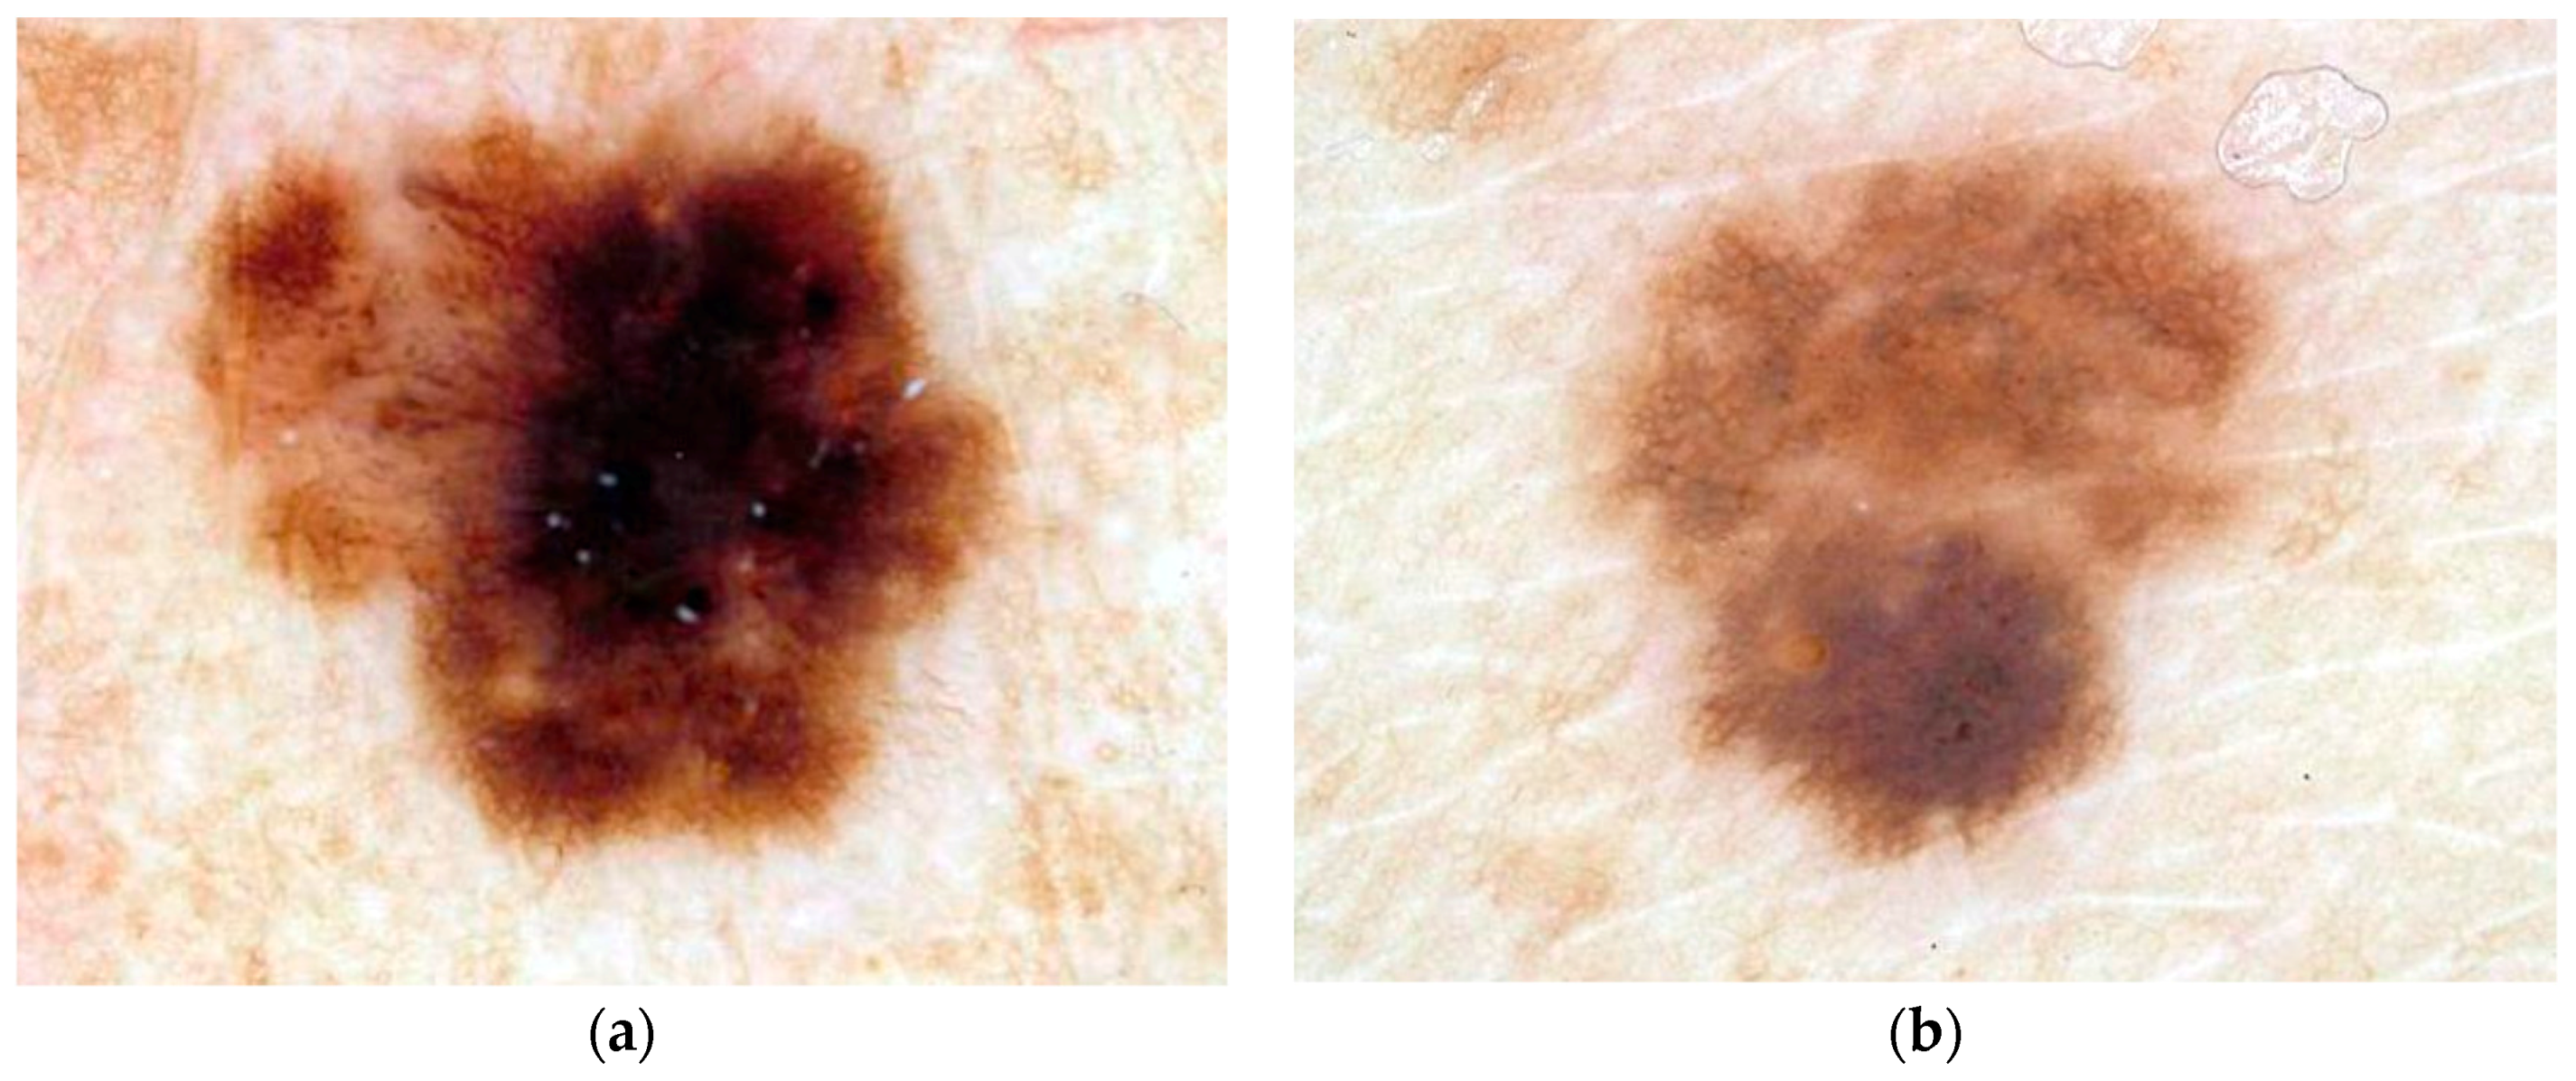
This research uses dermoscopy skin lesion images with a typical size of 1024 × 768 pixels; all are digitized in RGB color space. The data set was selected at random from 2000 dermoscopy images from Skin and Cancer Associates (Plantation, FL) and the Dermatology Associates of Tallahassee, FL, in addition to images acquired from the EDRA Interactive Atlas of Dermoscopy [32]. The images from the EDRA Interactive Atlas of Dermoscopy were acquired from clinics in Europe using Heine Dermaphot equipment with various cameras. Both sets of images were obtained using non-polarized contact dermoscopy techniques. The study set includes 175 malignant melanoma images and 342 dysplastic nevus (benign) images. The melanomas are all invasive malignant melanomas, with no melanomas in situ. Thus the set of images in this study samples a heterogeneous population from a wide geographic area obtained with different techniques. Additionally, dysplastic nevi in the image set show some degree of “atypia”, i.e., they have some degree of the color chaos/variegation found in melanomas. Thus the images chosen comprise a challenging diagnostic set of lesions. Figure 1 shows image examples from the image data set of a malignant melanoma (a) and a benign (dysplastic nevus) lesion (b). These images demonstrate the degree of difficulty of diagnostic assessment in this group of lesions.
2.2. Diagnostic Assessment
Table 1 below shows the diagnostic interpretations of skin lesions for evaluating the automated skin lesion classification results that were applied in this investigation. A true positive (TP) means diagnosing a melanoma as a melanoma. A false negative (FN) means diagnosing a melanoma as a benign skin lesion. A true negative (TN) means diagnosing a benign skin lesion as benign. A false positive (FP) means diagnosing a benign skin lesion as a melanoma. The implication of a false negative is delaying therapy for a melanoma, with worse consequences for the patient, while a false positive results in an unnecessary biopsy.
2.3. Skin Lesion Border Determination
In this research, skin lesion borders are found using the following procedure. A program called xborder developed by McLean [33] is used to choose points along the border manually. After choosing the points, a closed curve is formed using the points; the curve minimizes the spline curve function’s second derivative. A dermatologist, working with a group of students, verified all borders drawn; modification to the borders were done according to the dermatologist’s recommendation. The process therefore sought to find as accurate borders as possible without a known gold standard for border accuracy. This approach has been used in several skin lesion feature analysis studies [22,25,26,27,28,33,34,35].
For an M row by N column RGB image, I, each pixel in position (x,y) can be represented by a 3-tuple I(x,y) = (R(x,y), G(x,y), B(x,y)), where 1 ≤ x ≤ N and 1 ≤ y ≤ M.
2.4. Relative Color
Differences in lighting conditions, cameras, film types, and skin colors should be taken into consideration when building a classification system of skin lesions; the system needs to be relatively tolerant to these variations. This is particularly true for our data set which came from three sources of lesions using digitized 35 mm photographic slides; we had no control over cameras used to capture original photographed skin lesion data. In order to make relative tolerance to these variations possible, a relative color method was used. The relative color of a skin lesion pixel is defined as the difference between that particular pixel value and the average value of pixels in the skin surrounding the lesion [28]. Let ROI denote the skin lesion region in the image and be referenced as ROI = {(x,y)|(x,y) ∈ I and (x,y) ∈ area inside the closed skin lesion boundary}. Then, the relative color for all skin lesion pixels is given as ROIrel(x,y) = (Rrel(x,y),Grel(x,y),Brel(x,y)) = (R(x,y) − Rskin,G(x,y) − Gskin,B(x,y) − Bskin|(x,y) ∈ ROI), where −255 ≤ Rrel(x,y), Grel(x,y),Brel(x,y) ≤ 255. Rskin, Gskin and Bskin are the average red, green and blue plane pixel values computed from the surrounding skin. Section 2.5, presents the procedure for finding the surrounding skin.
Relative color provides many advantages when used for analyzing skin lesions. First, differences resulting from variation in ambient light and their respected digitization errors are reduced when relative color is used. Second, errors in digitizing images from different film types or different film processing techniques can be minimized by relative color. Third, the mammalian visual system operates in a manner similar to the relative color technique. Finally, skin color varies among persons and relative color tries to minimize this variation and produce a skin-tone indifferent system.
2.5. Surrounding Skin Color Determination
Several empirical relationships were utilized to determine non-skin color, pixels in deep shadow, direct flash reflection and exogenous marks are eliminated. An existing dermatology image database was used under the supervision and guidance of a dermatologist to derive the skin pixel finder used in this research. The skin pixel finder has been applied to skin lesion analysis in other research [28,34]. To approximate the surrounding skin color, the distance function is used twice. First, a 10-pixel wide area surrounding the lesion is removed from consideration, to allow for possible inaccuracy in border determination. Then the distance function is used to determine an annular region just outside the 10-pixel-wide region; the area of this outer annular region is 20% of the skin lesion size [28,34], which is the area used for surrounding skin calculation. If the lesion extends close to the image edge, the remaining non-lesion pixels within this annular region are used rather than the standard 20% of lesion size. The pixels determined by this technique are used to determine the average surrounding skin color (Rskin, Gskin, Bskin) pixel values.
2.6. Color Histogram Bin Determination
The relative color histogram for the set of benign lesions is used to develop the fuzzy logic techniques used in this research. The pixel values for Rrel, Grel and Brel in the relative color space, defined by subtracting the R, B and B values from the surrounding skin, can take values in the range [−255,255]. Pixels from the entire benign lesion training set thus have 511 possible values on each of the three color axes, resulting in a three-dimensional histogram for counting pixel values; this histogram has 5113 possible values. To increase statistical significance for benign-malignant color separation and reduce computational complexity, these values are quantized by dividing each original relative color value by 4, to create the final relative color histogram with dimensions 128 × 128 × 128. Each final quantized histogram value represents a cube of dimension 4 × 4 × 4 containing up to 64 original lesion color values. Thus each point in the final relative color histogram is a “bin” that counts pixels with up to 64 possible original color values.
Formally, let Cbin denote the set of relative color bins, and let Cbin(x,y) denote the relative color bin in which the pixel (x,y) of the skin lesion falls. Since each of the original axes has 511 possible values, quantization by dividing the axis by 4 will result in bins on the edges of the cube that are 4 × 4 × 3 and one bin in the corner of the cube that is 3 × 3 × 3. Upon examining the training set relative color histograms, the bin that contains the relative color −255 (before quantization) will not likely occur in dermoscopy images in the three planes R, G, and B; hence that cube is assigned the smaller dimension (33).
2.7. Color Histogram Analysis Technique
2.7.1. Fuzzy Set Description for Trapezoidal Membership Function
The relative skin lesion color was represented using a fuzzy logic-based approach, which was initially developed and reported in [28]. Let B represent a fuzzy set [36] having a trapezoidal membership function for relative skin lesion color, for the specified skin lesion class. This study utilizes the same trapezoidal membership function from [25], which is derived using a data-driven process that assigns membership values to skin lesion relative colors based on frequency of occurrence in the training set of skin lesions. The colors within the color histogram bins defined in the Section 2.6 were assigned membership values using the following process: The training set of images for the specified class is used to populate the three-dimensional relative color histogram bins in batch mode; each bin will contain the sum of pixels with relative color mapping to that bin from all skin lesion regions in all the training images. A secondary histogram is defined as a histogram of the three-dimensional relative color histogram. The secondary histogram is a function of bins in the relative color histogram; it will indicate the number of bins containing x pixels in the relative color histogram.
The benign skin lesion from the training data is used to determine the fuzzy set B. The secondary histogram of the relative colors is used to assign the membership values. The membership function μB(x) denoting the fuzzy set [36] is given as
where x is the bin frequency in the secondary histogram and F is the empirically determined bin frequency count for full membership in the benign fuzzy set B. F is set as the frequency count given that 5% of the secondary histogram of the benign skin lesions have frequency F or greater. Increased bin frequency (up to F) will be reflected as increased membership value in the specified class of skin lesion. Figure 2 shows a representative secondary histogram with the frequency count F labeled in (a) and the trapezoidal membership function generated in (b). The horizontal axis provides the frequency of occurrence (x) that a bin is populated over all benign images of the training set. The vertical axis in Figure 2a gives the number of bins with x “hits” per bin over the training set of benign images.
The trapezoidal shape compensates for the disparities in the 4 × 4 × 4 relative color histogram bins populations from the training set of images where relative color histogram bins with lower hits that are spatially near relative color histogram bins with a higher number of hits are designated with degrees of association (i.e., membership) as benign colors. These lower hit relative color histogram bins would be ignored in a crisp labeling, where a binary decision is made to include or exclude a relative color bin as a benign color.
2.7.2. Color Feature Determination
The level of confidence of being in a skin lesion class B is given by the fuzzy clustering ratio feature. The fuzzy clustering ratio feature is computed as follows. Let M denote the set of relative color values that map into relative color histogram bins labeled with
for a specified α on B and (x,y) contained in the skin lesion. M is given by
Let P denote the set of relative color values that map into relative color histogram bins labeled with
and (x,y) contained in the skin lesion such that
Let L denote the set of pixel locations within the skin lesion region of interest with relative colors ROIrel(x,y) that map into M, formally
Let N((x,y),r) denote the number of 8-connected neighbors within the square neighborhood of radius r for (x,y) ∈ ROI and N(M(x,y),r) denote the number of neighbors connected within the square neighborhood of radius r that are contained in the lesion region of interest for pixel (x,y) ∈ L, such that r = 0 refers to the pixel (x,y) itself, r = 1 refers to the eight-connected neighborhood of (x,y) and so on. By Equation (6), the neighbors of radius r for a point (x,y) ∈ L are excluded from calculating N(x,y) and N(M(x,y),r) if the neighbors lie outside of the lesion ROI. Then,
represents the total number (running sum) of neighbors for all pixels within the skin lesion with relative color values that map as colors of the specified class at the specified alpha-cut. The cumulative total number of eight-connected neighbors for all (x,y) ∈ L is denoted as
V includes all neighbors of pixels within the skin lesion that have a non-zero membership value in B for the specified lesion class. The fuzzy clustering ratio for a skin lesion is given as
Note that R(α,r) is computed based on the pixels within the skin lesion. The surrounding skin pixels are only used for computing the average surrounding skin color for determining the relative color of all pixels within the skin lesion. Thus, for α = 0, R = 1, provided that at least one pixel within the skin lesion has a non-zero membership value in B for a given radius r. If B represents the fuzzy set for benign skin lesion relative color as determined from the benign training set of images, then R(α,r) represents the degree to which the clustering of benign colors within square radius r of the skin lesion are the colors perceived to be associated with benign skin lesions. After determining B, the next step is to compute R(α,r) for all benign and melanoma skin lesions from the training data for a specified value of α. A threshold T is automatically determined from the ratios R(α,r) calculated from the training data. The procedure for finding T is presented in the following Section 2.7.3. Skin lesions are categorized as either benign or melanomas for the data set used in this research. A given skin lesion is classified as benign if R(α) > T. Otherwise, the skin lesion is labeled as a melanoma. A similar process is used to determine B, R(α), and T using melanoma skin lesion images as the training set. However, a given skin lesion would be classified as benign if R(α,r) ≤ T.
2.7.3. Threshold Determination Procedure
The ratios R(α) computed from the training data were sorted to facilitate automated threshold (T) selection. The approach used for automatically selecting T for a particular α is based on computing the true positive and true negative rates for the training data. The procedure for choosing the optimal T involves iterating T through the sorted ascending ratios R(α,r) from [0,1] in increments of 0.001. For each T, tp and tn are determined from the training images. T is chosen as the greatest threshold for which tn ≤ tp. The final melanoma and benign lesion classification results are obtained for the training and the test data using the final threshold T. The procedure is repeated for specified α values.
2.8. Lesion Region Analysis
After determining B and μB from the training set of images for the specified class, R(α,r) is computed over different skin lesion regions, referenced as boundary area percentages, for skin lesion discrimination. The boundary area percentage is defined as the uniform skin lesion region closest to the boundary that contains a specified percentage of the lesion area. The boundary area region is found using the method developed in [37] with summary in pseudocode:
- (1)
- start with the lesion border
- (2)
- compute the distance transform using 8-connected distance to get pixel distance from the lesion boundary inside of the skin lesion
- (3)
- starting with a distance of 0 (lesion boundary), determine the lesion boundary region with distance less than or equal to the current distance
- (4)
- compute the area of the resulting lesion boundary region
- (5)
- retain the lesion boundary region if its area is greater than the boundary area percentage
- (6)
- otherwise, increment the distance by 1 and repeat Steps (2)–(6)
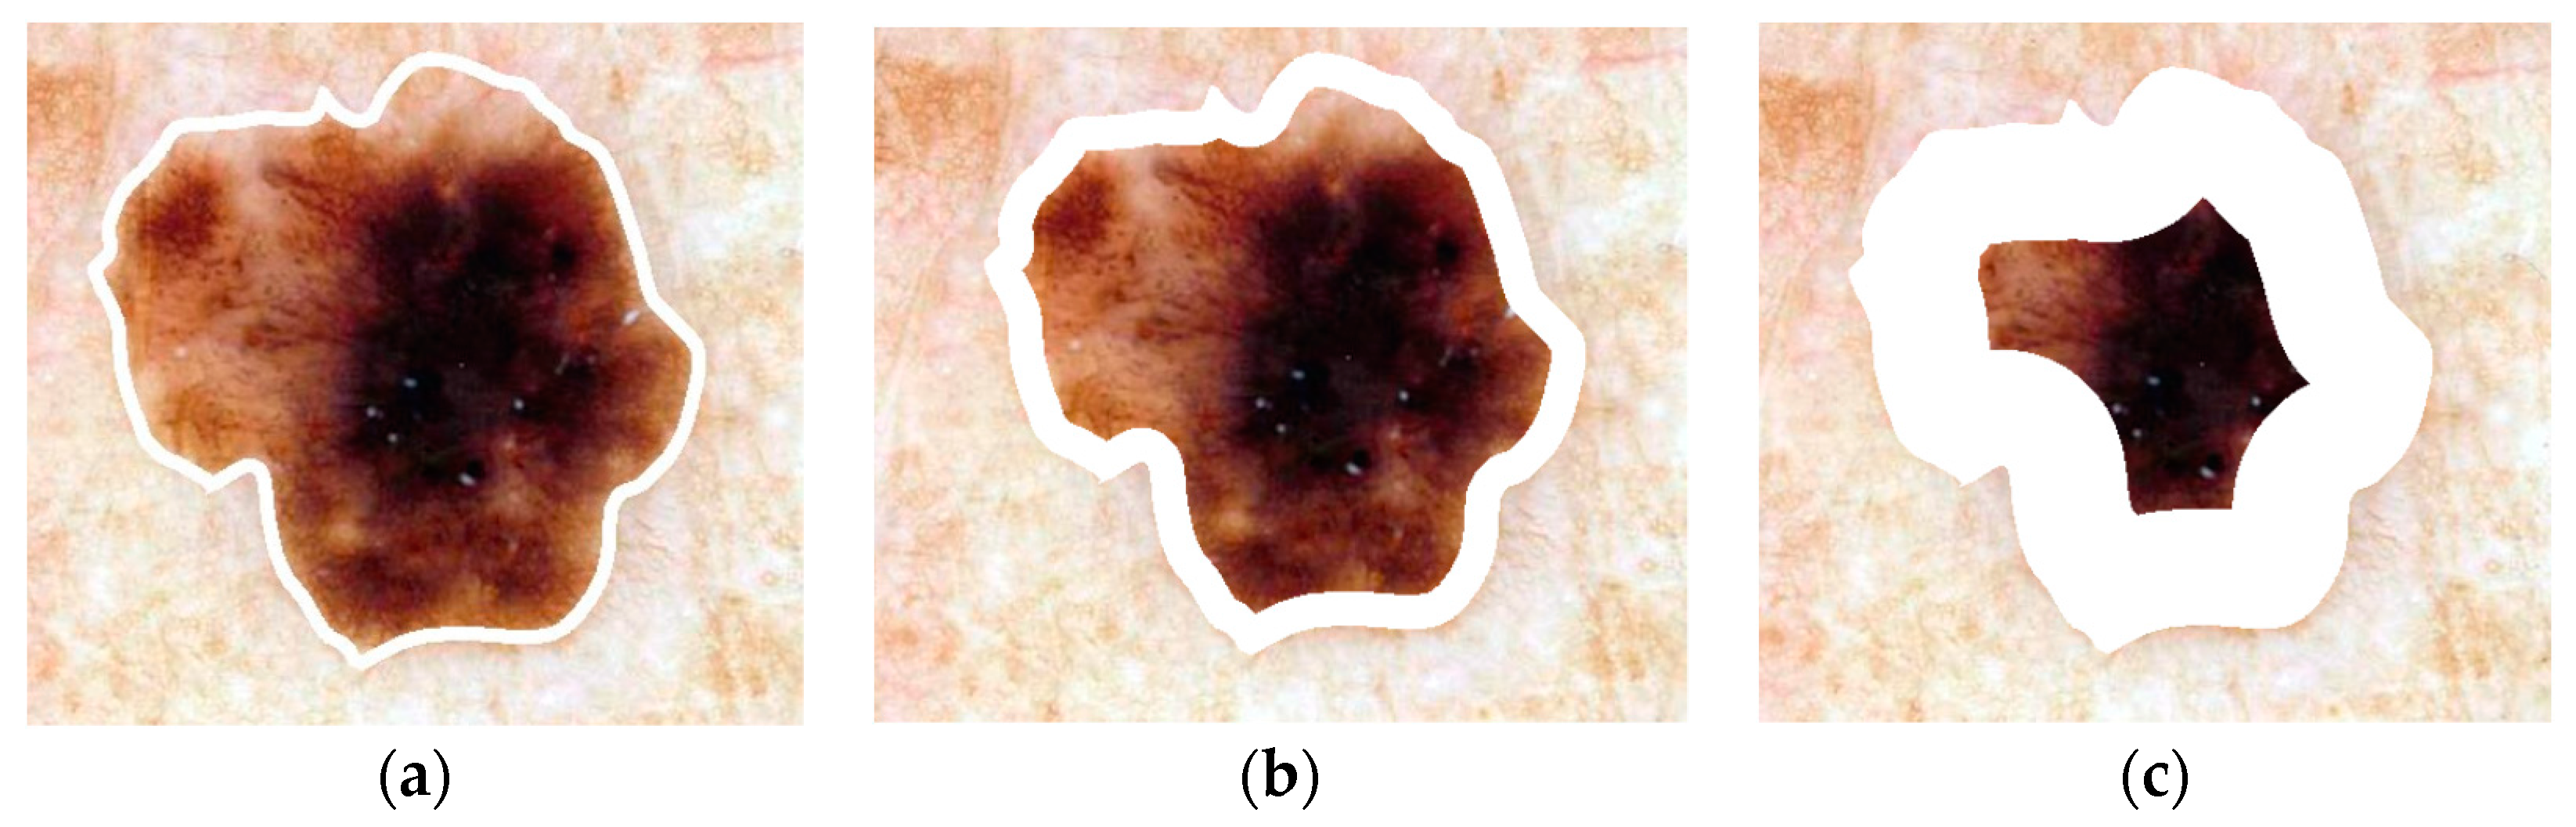
Steps (5) and (6) show that the process continues until the area percentage criterion has been satisfied. Figure 3 shows examples of boundary area percentages of 10%, 25% and 75% of the lesion area; only the areas shown in white are used for feature calculations; the remaining lesion interior is excluded from feature calculations.
3. Experiments Performed
For this research, 175 melanoma and 342 benign dermoscopy images are analyzed. The fuzzy logic-based analysis technique is evaluated on 25 randomly chosen training/test sets with a 90/10 ratio. The relative color fuzzy set B with trapezoidal membership function is determined from the benign training images using the entire skin lesion. Variables are assigned as follows: α = 0.1, 0.2, 0.4, 0.6, 0.8 and 1, r = 0, and 1 and boundary area percentage 10%, 25%, 75%, and 100%; classification of test lesions as melanoma or benign is based upon the optimal threshold T, Section 2.7.3. The entire process is repeated, this time using the melanoma training images to determine B.
4. Results and Discussion
Figure 4 presents the average test results over 25 trials for r = 0 and α = 0.1, 0.2, 0.4, 0.6, 0.8, 1.0 for boundary area percentages of 10%, 25%, 75%, 100% in (a)–(d), respectively. Figure 5 shows the average test results over 25 trials for r = 1 and α = 0.1, 0.2, 0.4, 0.6, 0.8, 1.0 for boundary area percentages of 10%, 25%, 75%, 100% in (a)–(d), respectively. In Figure 4a–d and Figure 5a–d, the horizontal axis provides the alpha-cut value, and the vertical axis gives the correct percentage discrimination rate. For each alpha-cut, the following labeling scheme is used: (1) the average correct melanoma rate found based on computing R(α,r) using the benign training images for determining the fuzzy set B is denoted as FCN-Melanoma; (2) the average correct melanoma rate found based on computing R(α,r) using the melanoma training images for determining the fuzzy set B is denoted as FCM-Melanoma; (3) the average correct benign rate found based on computing R(α,r) using the benign training images for determining the fuzzy set B is denoted as FCN-Benign; and (4) the average correct benign rate found based on computing R(α,r) using the melanoma training images for determining the fuzzy set B is denoted as FCM-Benign. Note that other boundary area percentage areas, including 50%, were tested, but the results were not improved over the tables presented in this study.
The experimental results shown in Figure 5 and Figure 6 highlight several observations. First, from Figure 4 the average correct melanoma and benign rates are higher when computing R(α,r = 0) based on determining B using the benign training set of images than the rates based on the melanoma training set of images for all boundary area percentage cases examined. In particular, the disparity between the melanoma correct rates for the benign and melanoma training approaches, respectively, for determining R(α,r = 0) increases with the boundary area percentage examined, with the greatest disparity observed for the 100% boundary area percentage case (entire lesion). A similar trend is observed between the benign correct rates for the benign and melanoma approaches, respectively. Using the benign training images to determine B for computing R(α,r = 0) may yield better discrimination capability because relative colors may be more consistent in benign lesions than in melanoma lesions.
Second, from Figure 4 and Figure 5 for r = 0 and r = 1, the test true positive rate (FCN-Melanoma) exceeds the true negative rate (FCN-Benign) for all boundary percentage area cases using the benign training images to determine the fuzzy set B. For fuzzy ratio R(α,r) calculations, the numerator S(α,r) and the denominator V(r) are dependent on the training set for the specified class of images used to determine B. Every pixel within every training image of the specified class of images has a nonzero membership in B. Accordingly, V(r) is equal to the lesion area for those training images, and each pixel within every training skin lesion is included in S(α,r) for some range of α > 0. This is not necessarily true for the non-specified class of training images and the melanoma and benign test images. Because the training fuzzy ratios R(α,r) for the specified class of training images are slightly skewed from the test benign fuzzy ratios R(α,r), the threshold T determined from the training set of images may not be as reflective of the test fuzzy ratios for the specified class of images as for the non-specified class of images. A similar trend is observed from Figure 4 and Figure 5 for r = 0 and r = 1 for the true positive (FCM-Melanoma) and true negative (FCM-Benign) rates for all boundary percentage area cases except for the 10% case using the melanoma training images to determine B, where the true positive rate exceeds the true negative rate for α > 0.4. This trend could be attributed to the approach used for deriving the fuzzy set B and the membership function µB. There are fewer melanoma images than benign lesion images, and the 10% boundary area cases results in fewer relative color histogram bins being populated, yielding most relative colors as having low membership in B. Thus, melanoma and benign lesions have similar R(α,r) for small values of α (α < 0.4), leading to low melanoma discrimination rates.
Third, for r = 0 the highest true positive and true negative rates are achieved for the 100% boundary area case, with the highest melanoma discrimination rate of 80.8% at α = 0.6 and the highest benign discrimination rate of 74.6% at α = 0.4. The r = 0 case corresponds to computing the fuzzy ratio introduced in previous research for clinical images [28]. These results for the dermoscopy images are slightly lower than the true positive and true negative results achieved applying this feature to skin lesion discrimination in clinical images, where the highest true positive results obtained were 91.74% with a corresponding true negative rate of 77.49% at α = 0.05 [28]. The dermoscopy image results for r = 0 are likely lower compared to the clinical image results reported in [25] because there are wider color variations in dermoscopy images than in clinical images. The resulting cumulative histograms from the training set of lesions have fewer relative color bins with a high number of hits, so there are a smaller number of relative histogram color bins with high membership. This particularly true for the melanoma lesion images, which tend to have greater color variation than benign lesion images. The r = 0 case provides for all pixels within the lesion that satisfy the alpha-cut constraint in the numerator of R(α,r) and provide for any degree of membership in B in the denominator V(r) without taking into account spatial context for feature determination. As a result, there is less variation in R(α,r = 0) for the benign and melanoma images for different values of α. The experiments for computing R(α,r = 1) incorporate only some spatial context for feature calculations which allows for clustering of neighboring pixels with membership values that satisfy the α constraint.
Fourth, for r = 1 the highest true positive (FCN-Melanoma) and true negative (FCN-Benign) rates are achieved for the 25% boundary area case using the benign images as the training set of images to determine B, with the highest true positive rate of 91.29% at α = 0.4 and the highest true negative rate of 86.9% at α = 0.2 and 0.4. The true negative rates using the benign images as the training set of images are consistently higher at the 25% boundary area case for all alpha-cuts than for the other boundary area percentage case. The feature R(α,r) for r = 1 is computed as the sum of the number of eight-connected neighbors that satisfy the alpha-cut criterion for each pixel within the lesion that satisfies the alpha-cut criterion divided by the sum of eight-connected neighbors that have non-zero membership in B for each pixel within the lesion that has non-zero membership in B. This feature is similar to a crisp color clustering ratio investigated in previous research [26,27].
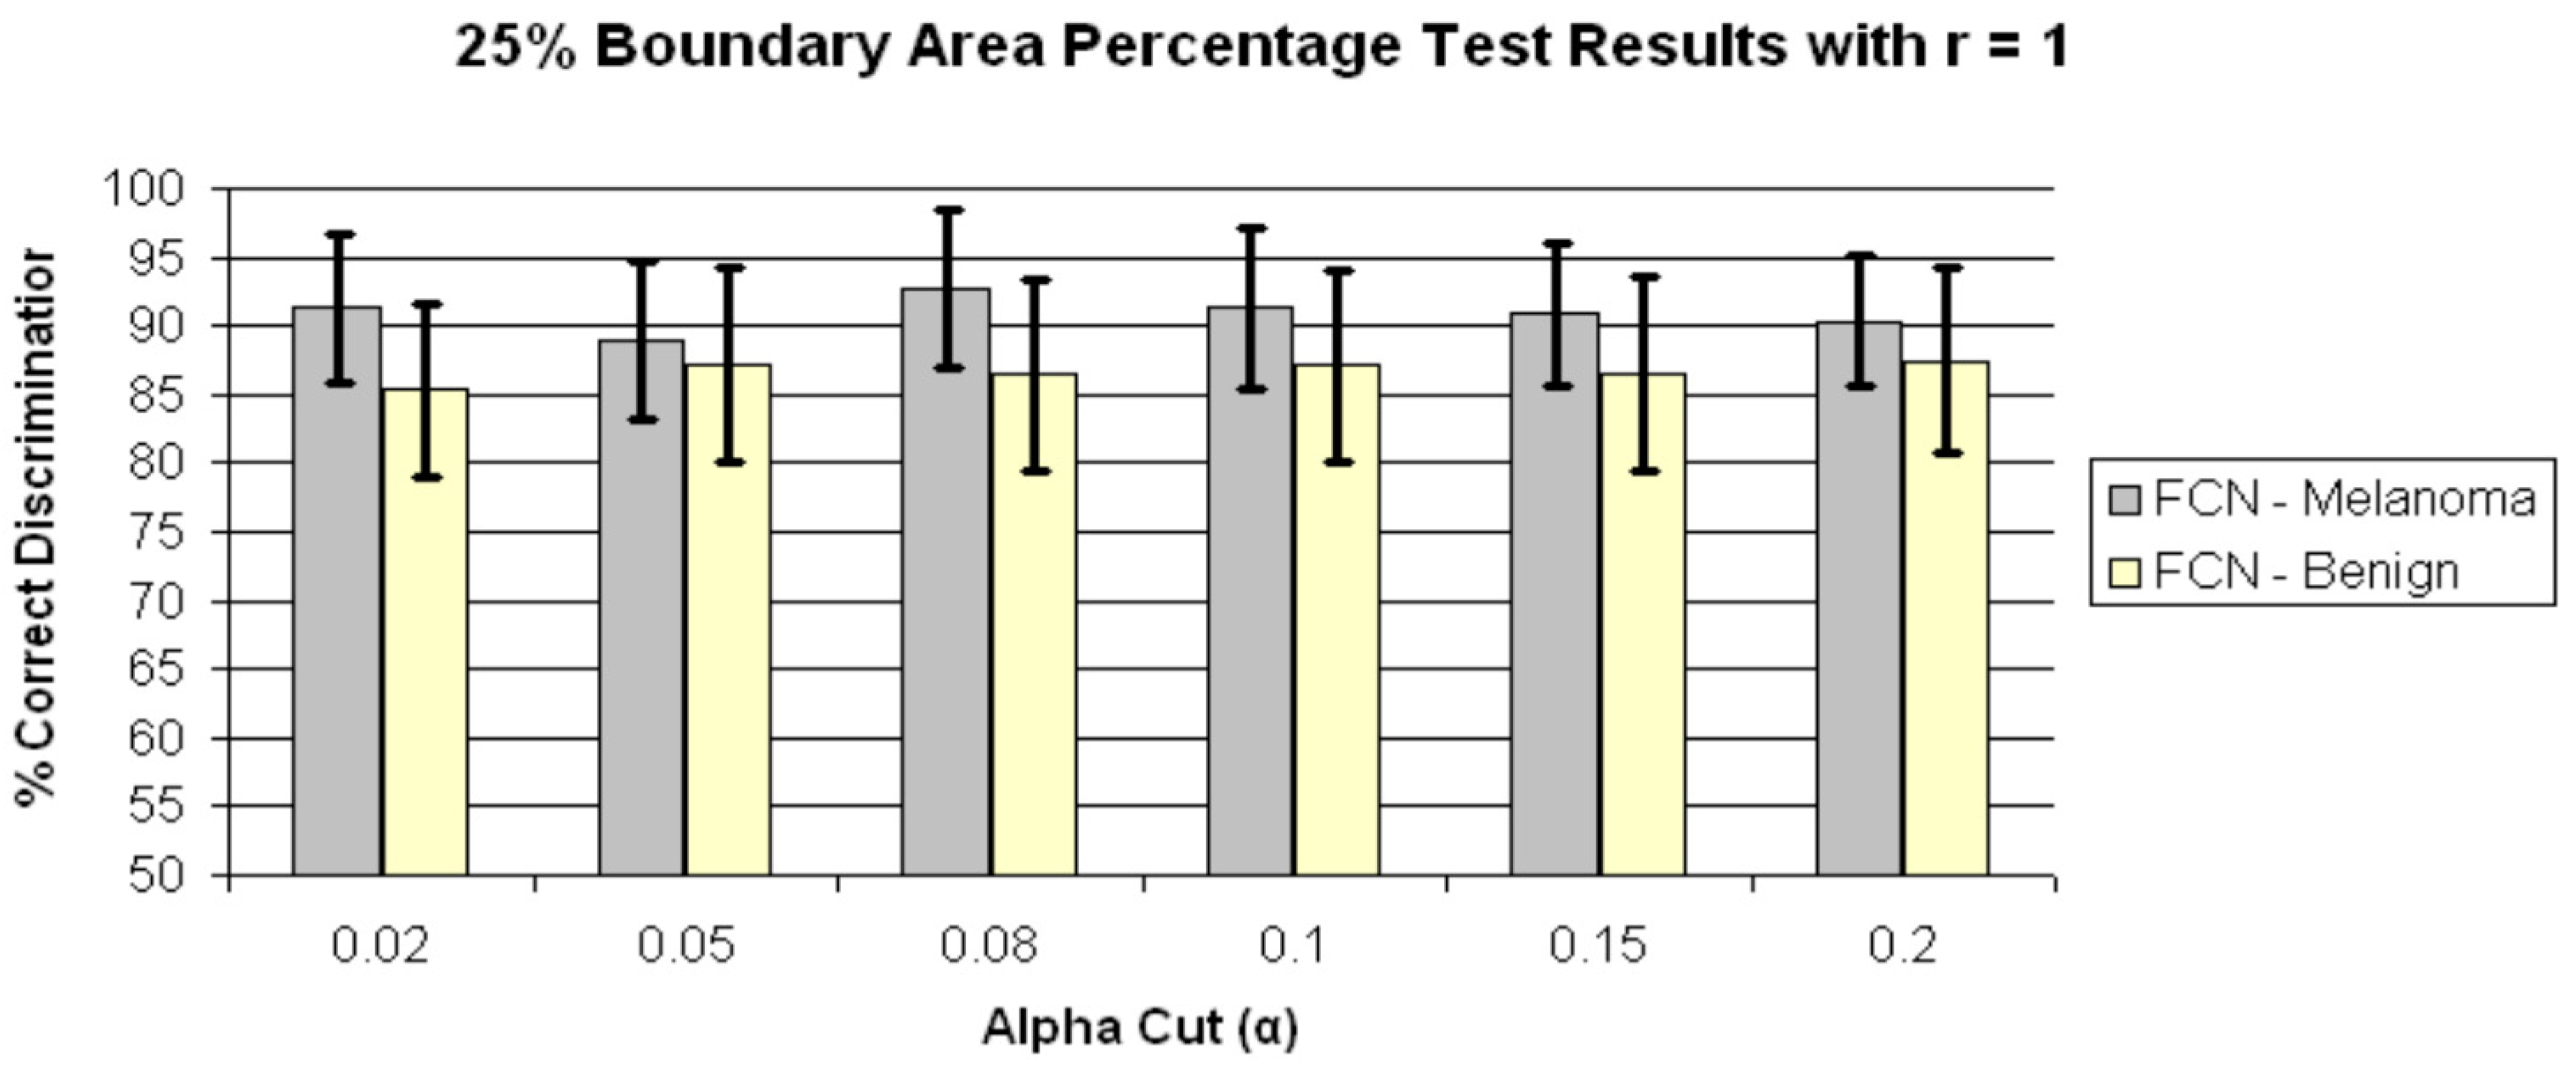
In order to determine if any improvement in lesion discrimination can be achieved based on refining the alpha-cut criterion, an experiment was performed for the r = 1 case using α = 0.02, 0.05, 0.08, and 0.15. Figure 6 shows the average and standard deviation true positive (FCN-Melanoma) and true negative (FCN-Benign) results for r = 1 and α = 0.02, 0.05, 0.08, 0.1, 0.15, and 0.2 based on using the benign images as the training set of images to determine B. Note that the true positive and true negative results for α = 0.1 and 0.2 are contained in Figure 5b. From Figure 6 the highest true positive rate of 92.6% is obtained for α = 0.08 with a corresponding true negative rate of 86.5%. This combination of r = 1 and α = 0.08 also yielded the highest overall weighted true positive and true negative correct recognition rate of 88.51%, compared to the combination r = 0 and α = 1 giving the highest weighted correct recognition rate of 73.73%. These results highlight the significant lesion discrimination capability of the fuzzy clustering ratio, incorporating spatial information using neighbor clustering (r = 1) over individual pixel-based color descriptor determination (fuzzy ratio) for enhancing skin lesion discrimination.
The color clustering ratio is based on using both melanoma and benign training set of images for populating a cumulative relative color histogram, probabilistic labeling of the relative color histogram bins as melanoma or benign colors with melanoma and benign color region growing within the histogram for final melanoma and benign color bin assignments. The clustering ratio feature is computed over the boundary region of interest to determine clustering of melanoma colors. For each melanoma pixel, i.e., for each pixel that maps as a melanoma color, the sum of eight-connected pixels that map as melanoma colors is calculated and added to the cumulative sum for all melanoma pixels in the boundary region. This total is divided by the total of all eight-connected neighboring pixels for all melanoma pixels in the region. Applying the color clustering ratio to skin lesion discrimination in dermoscopy images yielded true positive, true negative, and overall classification rates as high as 87.7%, 74.9%, and 81.3%, respectively, for the 75% boundary area percentage case [27]. The fuzzy logic-based approach improves the skin lesion discrimination capability over the crisp clustering ratio. The fuzzy logic-based approach achieves the true positive highest results in the outer 25% of the lesion, which is consistent with the color clustering ratio results obtained for clinical images [26].
The utility of the fuzzy logic-based approach is that the model used for feature calculations is data-driven based on the class of interest to determine the fuzzy set B and its corresponding membership function μB and only requires information about the remaining class to find the threshold T for discrimination. In the feature calculation process, no decision is necessary to label colors as melanoma or benign. Rather, the data-driven process provides for the degree of association of different colors as melanoma or benign, depending on the class used to determine B, based on the frequency of occurrence in the training set of images. Because relative color is used for mapping RGB colors at each pixel location in the lesion to relative color bins, this framework can easily be updated as additional image data is acquired, adapting to the variations in image acquisition such as lighting and the types of lesions that may be observed in particular geographic locations.
Overall, R(α,r) yields higher true positive results for r = 1 than for r = 0 for all corresponding boundary area percentage cases and alpha-cuts, indicating that quantifying the grouping of similar colors provides more significant discrimination information than quantifying isolated color information. Experimental results also show that the outer 25% of the lesion enhances discrimination capability. Previous research with color feature analysis in clinical images showed that the outer 10% of the skin lesion yielded the highest melanoma discrimination capability [26]. Finally, the fuzzy logic-based approach provided higher discrimination (true positive and true negative results) when computing R(α,r) based on determining B using the benign training set of images over the melanoma training set of images. This finding may be attributed to the presence of specified color clusters in benign lesions more consistently than in melanoma lesions. The features computed using the melanoma and benign training sets of images provide complementary information because only the specified class of training lesion images is used to populate the relative color histogram to determine B. Experimental results presented here provide further confirmation of the effectiveness of relative color, since the image sets were acquired from different patient populations via significantly different imaging systems.
The results found in the current study have relevance for clinicians. First, our results confirm results from a previous study that found that white or hypopigmented areas in the outer three deciles of the lesion were needed for the best discrimination of melanoma vs. benign [38]. Second, we have confirmed the clinical impression that colors within the lesion periphery, specifically the outer lesion deciles, are important in describing benign lesions, since a circumferential “hazy border”, with coloration intermediate between that of skin and lesion, implies a benign lesion [32] and a “pink rim” is a sign of a melanoma [39]. Third, the patches or clusters of color that matter most are larger than a single pixel but still relatively small, in the single-digit range, as in the “peppering” of early malignancies [40,41]. Thus a fuzzy logic-based description of lesion colors offers relevance to clinical descriptions of malignant melanoma.
5. Conclusions
In this research, a fuzzy logic-based color analysis approach was investigated for differentiating benign skin lesions from melanomas in dermoscopy images. The proposed approach extends previous research using a fuzzy clustering technique based on a trapezoidal membership function to represent relative skin lesion color for a specified class of lesions and the degree to which relative skin lesion colors are from the specified class. Color histogram analysis on a training set of images for a specified class provided the basis for skin lesion color membership assignment. A fuzzy ratio for r = 0 and 1 was computed to reflect the area of the skin lesion with a specified degree of association to specified class color to the overall area of the lesion with any degree of color for that specified class. An automated thresholding technique, using the intersection between true negative and positive rates, was developed to differentiate benign skin lesions from melanomas based on the computed ratios over a training set of images. The thresholding determined from the training data is applied to the test data. Experimental results (as summarized in Figure 4, Figure 5 and Figure 6) demonstrate that this technique can be used to successfully differentiate benign skin lesions from melanomas with true positive rates as high as 92.6% for the outer 25% of the lesion with r = 1 and α = 0.08 based on the benign set of training images to determine B. These results provide a substantial improvement over the baseline fuzzy ratio feature for r = 0.
Future work on fuzzy logic-based color analysis will extend this research to larger data sets and explore combinations of percentile-based features, e.g., decile-based calculated features, as well as features based on various radii.
Author Contributions
R.J.S. and A.A.H. conceived and designed the experiments; R.J.S., A.A.H., W.V.S. and R.H.M. analyzed the data; R.J.S., A.A.H., W.V.S. and R.H.M. wrote the paper and R.J.S., A.A.H., W.V.S. and R.H.M. revised the paper.
Conflicts of Interest
The authors declare no conflict of interest.
References
- Marghoob, A.A.; Scope, A. The complexity of diagnosing melanoma. J. Investig. Dermatol. 2009, 129, 11–13. [Google Scholar] [CrossRef] [PubMed]
- Stoecker, W.V.; Stolz, W. Dermoscopy and the diagnostic challenge of amelanotic and hypomelanotic melanoma. Arch. Dermatol. 2008, 144, 1207–1210. [Google Scholar] [CrossRef] [PubMed]
- Menzies, S.W.; Moloney, F.J.; Byth, K.; Avramidis, M.; Argenziano, G.; Zalaudek, I.; Braun, R.P.; Malvehy, J.; Puig, S.; Rabinovitz, H.S.; et al. Dermoscopic evaluation of nodular melanoma. JAMA Dermatol. 2013, 149, 699–709. [Google Scholar] [CrossRef] [PubMed] [Green Version]
- Soon, S.L.; Solomon, A.R., Jr.; Papadopoulos, D.; Murray, D.R.; McAlpine, B.; Washington, C.V. Acral lentiginous melanoma mimicking benign disease: The Emory experience. J. Am. Acad. Dermatol. 2003, 48, 183–188. [Google Scholar] [CrossRef] [PubMed]
- Kittler, H.; Pehamberger, H.; Wolff, K.; Binder, M. Diagnostic accuracy of dermoscopy. Lancet Oncol. 2002, 3, 159–165. [Google Scholar] [CrossRef]
- Vestergaard, M.E.; Macaskill, P.; Holt, P.E.; Menzies, S.W. Dermoscopy compared with naked eye examination for the diagnosis of primary melanoma: A meta-analysis of studies performed in a clinical setting. Br. J. Dermatol. 2008, 159, 669–676. [Google Scholar] [CrossRef] [PubMed]
- Ferris, L.K.; Harkes, J.A.; Gilbert, B.; Winger, D.G.; Golubets, K.; Akilov, O.; Satyanarayanan, M. Computer-aided classification of melanocytic lesions using dermoscopic images. J. Am. Acad. Dermatol. 2015, 73, 769–776. [Google Scholar] [CrossRef] [PubMed]
- Esteva, A.; Kuprel, B.; Novoa, R.A.; Ko, J.; Swetter, S.M.; Blau, H.M.; Thrun, S. Dermatologist-level classification of skin cancer with deep neural networks. Nature 2017, 542, 115–118. [Google Scholar] [CrossRef] [PubMed]
- Carrera, C.; Marchetti, M.A.; Dusza, S.W.; Argenziano, G.; Braun, R.P.; Halpern, A.C.; Jaimes, N.; Kittler, H.J.; Malvehy, J.; Menzies, S.W. Validity and Reliability of Dermoscopic Criteria Used to Differentiate Nevi From Melanoma: A Web-Based International Dermoscopy Society Study. JAMA Dermatol. 2016, 152, 798–806. [Google Scholar] [CrossRef] [PubMed]
- Argenziano, G.; Puig, S.; Zalaudek, I.; Sera, F.; Corona, R.; Alsina, M.; Barbato, F.; Carrera, C.; Ferrara, G.; Guilabert, A.; et al. Dermoscopy improves accuracy of primary care physicians to triage lesions suggestive of skin cancer. J. Clin. Oncol. 2006, 24, 1877–1882. [Google Scholar] [CrossRef] [PubMed]
- Siegel, R.L.; Miller, K.D.; Jemal, A. Cancer statistics, 2016. CA Cancer J. Clin. 2016, 66, 7–30. [Google Scholar] [CrossRef] [PubMed]
- Siegel, R.L.; Miller, K.D.; Jemal, A. Cancer statistics, 2017. CA Cancer J. Clin. 2017, 67, 7–30. [Google Scholar] [CrossRef] [PubMed]
- Bajaj, S.; Marchetti, M.A.; Navarrete-Dechent, C.; Dusza, S.W.; Kose, K.; Marghoob, A.A. The role of color and morphologic characteristics in dermoscopic diagnosis. JAMA Dermatol. 2016, 152, 676–682. [Google Scholar] [CrossRef] [PubMed]
- Friedman, R.J.; Rigel, D.S.; Kopf, A.W. Early detection of malignant melanoma: The role of physician examination and self-examination of the skin. CA Cancer J. Clin. 1985, 35, 130–151. [Google Scholar] [CrossRef] [PubMed]
- Rubegni, P.; Feci, L.; Nami, N.; Burroni, M.; Taddeucci, P.; Miracco, C.; Munezero Butorano, M.A.; Fimiani, M.; Cevenini, G. Computer-assisted melanoma diagnosis: A new integrated system. Melanoma Res. 2015, 25, 537–542. [Google Scholar] [CrossRef] [PubMed]
- Andreassi, L.; Perotti, R.; Rubegni, P.; Burroni, M.; Cevenini, G.; Biagioli, M.; Taddeucci, P.; Dell’Eva, G.; Barbini, P. Digital dermoscopy analysis for the differentiation of atypical nevi and early melanoma: A new quantitative semiology. Arch. Dermatol. 1999, 135, 1459–1465. [Google Scholar] [CrossRef] [PubMed]
- Landau, M.; Matz, H.; Ethel, T.; Dvir, M.; Brenner, S. Computerized system to enhance the clinical diagnosis of pigmented cutaneous malignancies. Int. J. Dermatol. 1999, 38, 443–446. [Google Scholar] [CrossRef] [PubMed]
- Umbaugh, S.E.; Moss, R.H.; Stoecker, W.V. Automatic color segmentation of images with application to detection of variegated coloring in skin tumors. IEEE Eng. Med. Biol. Mag. 1989, 8, 43–50. [Google Scholar] [CrossRef] [PubMed]
- Green, A.; Martin, N.; Pfitzner, J.; O’Rourke, M.; Knight, N. Computer image analysis in the diagnosis of melanoma. J. Am. Acad. Dermatol. 1994, 31, 958–964. [Google Scholar] [CrossRef]
- Seidenari, S.; Burroni, M.; Dell’Eva, G.; Pepe, P.; Belletti, B. Computerized evaluation of pigmented skin lesion images recorded by a videomicroscope: Comparison between polarizing mode observation and oil/slide mode observation. Skin Res. Technol. 1995, 1, 187–191. [Google Scholar] [CrossRef] [PubMed]
- Aitken, J.F.; Pfitzner, J.; Battistutta, D.; O’Rourke, P.K.; Green, A.C.; Martin, N.G. Reliability of computer image analysis of pigmented skin lesions of Australian adolescents. Cancer 1996, 78, 252–257. [Google Scholar] [CrossRef]
- Ercal, F.; Chawla, A.; Stoecker, W.V.; Lee, H.C.; Moss, R.H. Neural network diagnosis of malignant melanoma from color images. IEEE Trans. Biomed. Eng. 1994, 41, 837–845. [Google Scholar] [CrossRef] [PubMed]
- Ganster, H.; Pinz, A.; Röhrer, R.; Wildling, E.; Binder, M.; Kittler, H. Automated melanoma recognition. IEEE Trans. Med. Imaging 2001, 20, 233–239. [Google Scholar] [CrossRef] [PubMed]
- Heckbert, P. Color image quantization for frame buffer display. In Proceedings of the 9th Annual Conference on Computer Graphics and Interactive Techniques—SIGGRAPH ’82, Boston, MA, USA, 26–30 July 1982; Volume 16, pp. 297–307. [Google Scholar]
- Faziloglu, Y.; Stanley, R.J.; Moss, R.H.; Stoecker, W.V.; McLean, R.P. Colour histogram analysis for melanoma discrimination in clinical images. Skin Res. Technol. 2003, 9, 147–156. [Google Scholar] [CrossRef] [PubMed]
- Chen, J.; Stanley, R.J.; Moss, R.H.; Stoecker, W.V. Colour analysis of skin lesion regions for melanoma discrimination in clinical images. Skin Res. Technol. 2003, 9, 94–104. [Google Scholar] [CrossRef] [PubMed]
- Stanley, R.J.; Stoecker, W.V.; Moss, R.H. A relative color approach to color discrimination for malignant melanoma detection in dermoscopy images. Skin Res. Technol. 2007, 13, 62–72. [Google Scholar] [CrossRef] [PubMed]
- Stanley, R.J.; Moss, R.H.; Stoecker, W.V.; Aggarwal, C. A fuzzy-based histogram analysis technique for skin lesion discrimination in dermatology clinical images. Comput. Med. Imaging Graph. 2003, 27, 387–396. [Google Scholar] [CrossRef]
- Barata, C.; Ruela, M.; Francisco, M.; Mendonça, T.; Marques, J.S. Two systems for the detection of melanomas in dermoscopy images using texture and color features. IEEE Syst. J. 2014, 8, 965–979. [Google Scholar] [CrossRef]
- Stoecker, W.V. Computer Applications in Dermatology; Igaku-Shoin: New York, NY, USA, 1993; ISBN-13 978-0896402386. [Google Scholar]
- Nie, D. Classification of melanoma and clark nevus skin lesions based on medical image processing techniques. In Proceedings of the 3rd International Conference on Computer Research and Development (ICCRD), Shanghai, China, 11–13 March 2011; pp. 31–34. [Google Scholar] [CrossRef]
- Argenziano, G.; Soyer, H.P.; De Giorgi, V.; Piccolo, D.; Carli, P.; Delfino, M.; Ferrari, A.; Hofmann-Wellenhof, R.; Massi, D.; Mazzocchetti, G.; et al. Interactive Atlas of Dermoscopy (Book and CD-ROM); Edra Medical Publishing and New Media: Milan, Italy, 2000; ISBN 88-86457-30-8. [Google Scholar]
- McLean, R.P. Tumor Classification Based on Relative Color Analysis of Melanoma and Non-Melanoma Tumor Images. Master’s Thesis, University of Missouri, Rolla, MO, USA, 1994. [Google Scholar]
- Stoecker, W.V.; Li, W.W.; Moss, R.H. Automatic detection of asymmetry in skin tumors. Comput. Med. Imaging Graph. 1992, 16, 191–197. [Google Scholar] [CrossRef]
- Hance, G.A.; Umbaugh, S.E.; Moss, R.H.; Stoecker, W.V. Unsupervised color image segmentation: With application to skin tumor borders. IEEE Eng. Med. Biol. Mag. 1996, 15, 104–111. [Google Scholar] [CrossRef]
- Klir, G.J.; Folger, T.A. Fuzzy Sets, Uncertainty, and Information; Prentice Hall: Englewood Cliffs, NJ, USA, 1988; ISBN-13 978-0133459845. [Google Scholar]
- Stanley, R.J.; Stoecker, W.V.; Moss, R.H.; Rabinovitz, H.S.; Cognetta, A.B., Jr.; Argenziano, G.; Soyer, H.P. A basis function feature-based approach for skin lesion discrimination in dermatology dermoscopy images. Skin Res. Technol. 2008, 14, 425–435. [Google Scholar] [CrossRef]
- Dalal, A.; Moss, R.H.; Stanley, R.J.; Stoecker, W.V.; Gupta, K.; Calcara, D.A.; Xu, J.; Shrestha, B.; Drugge, R.; Malters, J.M.; et al. Concentric decile segmentation of white and hypopigmented areas in dermoscopy images of skin lesions allows discrimination of malignant melanoma. Comput. Med. Imaging Graph. 2011, 35, 148–154. [Google Scholar] [CrossRef] [PubMed]
- Rader, R.K.; Payne, K.S.; Guntupalli, U.; Rabinovitz, H.S.; Oliviero, M.C.; Drugge, R.J.; Malters, J.J.; Stoecker, W.V. The pink rim sign: Location of pink as an indicator of melanoma in dermoscopic images. J. Skin Cancer. 2014, 2014, 719740. [Google Scholar] [CrossRef] [PubMed]
- Braun, R.P.; Gaide, O.; Oliviero, M.; Kopf, A.W.; French, L.E.; Saurat, J.H.; Rabinovitz, H.S. The significance of multiple blue-gray dots (granularity) for the dermoscopic diagnosis of melanoma. Br. J. Dermatol. 2007, 157, 907–913. [Google Scholar] [CrossRef] [PubMed]
- Stoecker, W.V.; Wronkiewiecz, M.; Chowdhury, R.; Stanley, R.J.; Xu, J.; Bangert, A.; Shrestha, B.; Calcara, D.A.; Rabinovitz, H.S.; Oliviero, M.; et al. Detection of granularity in dermoscopy images of malignant melanoma using color and texture features. Comput. Med. Imaging Graph. 2011, 35, 144–147. [Google Scholar] [CrossRef] [PubMed]
Figure 1.
Example of malignant melanoma (a) and benign lesion (b).

Figure 2.
A relative secondary histogram (a) and its corresponding trapezoidal membership function for fuzzy set B (b). The frequency count F is labeled on the secondary histogram and membership function plot.
Figure 2.
A relative secondary histogram (a) and its corresponding trapezoidal membership function for fuzzy set B (b). The frequency count F is labeled on the secondary histogram and membership function plot.
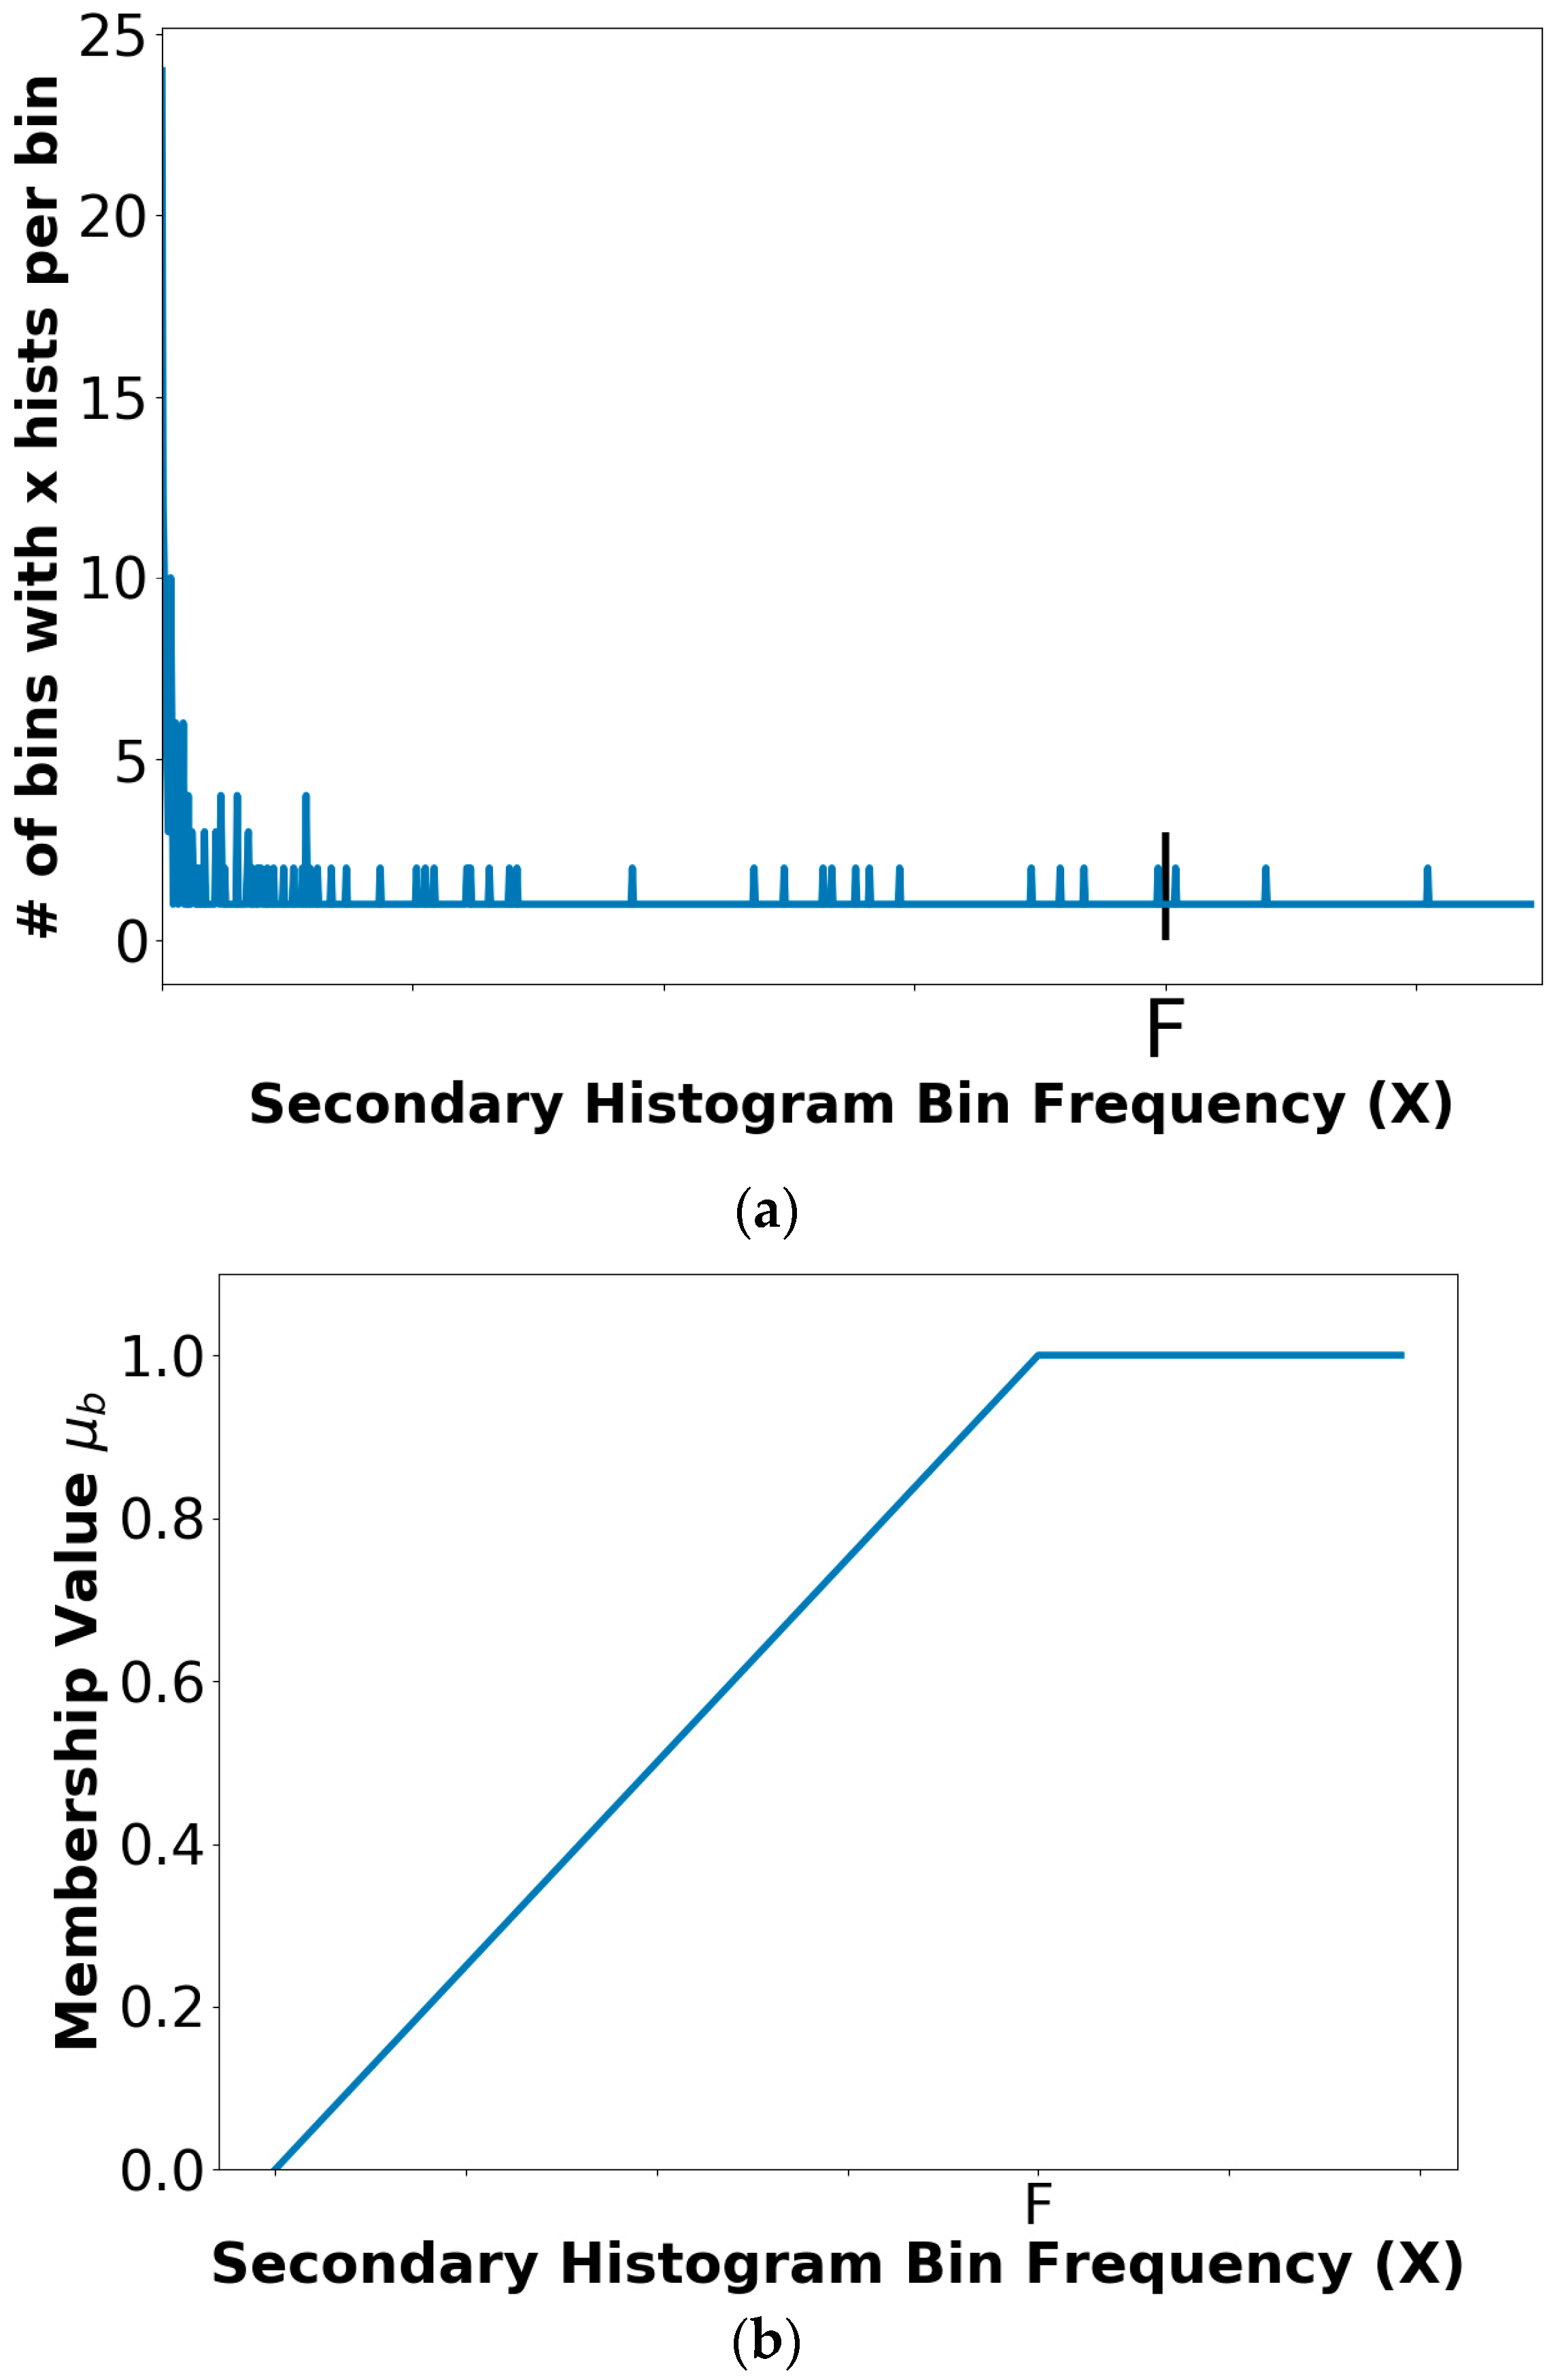
Figure 3.
Boundary area percentage examples using 10% (a), 25% (b) and 75% (c) of the lesion area for analysis (white region). (This is the same lesion as in Figure 1).
Figure 3.
Boundary area percentage examples using 10% (a), 25% (b) and 75% (c) of the lesion area for analysis (white region). (This is the same lesion as in Figure 1).

Figure 4.
Average and standard deviation test results over 25 randomly generated training/test sets for different boundary area percentages for r = 0. FCN and FCM denote the fuzzy ratio features computed using the benign and melanoma training images to determine discrimination accuracy. (a) Boundary area percentage = 10%; (b) Boundary area percentage = 25%; (c) Boundary area percentage = 75%; (d) Boundary area percentage = 100%.
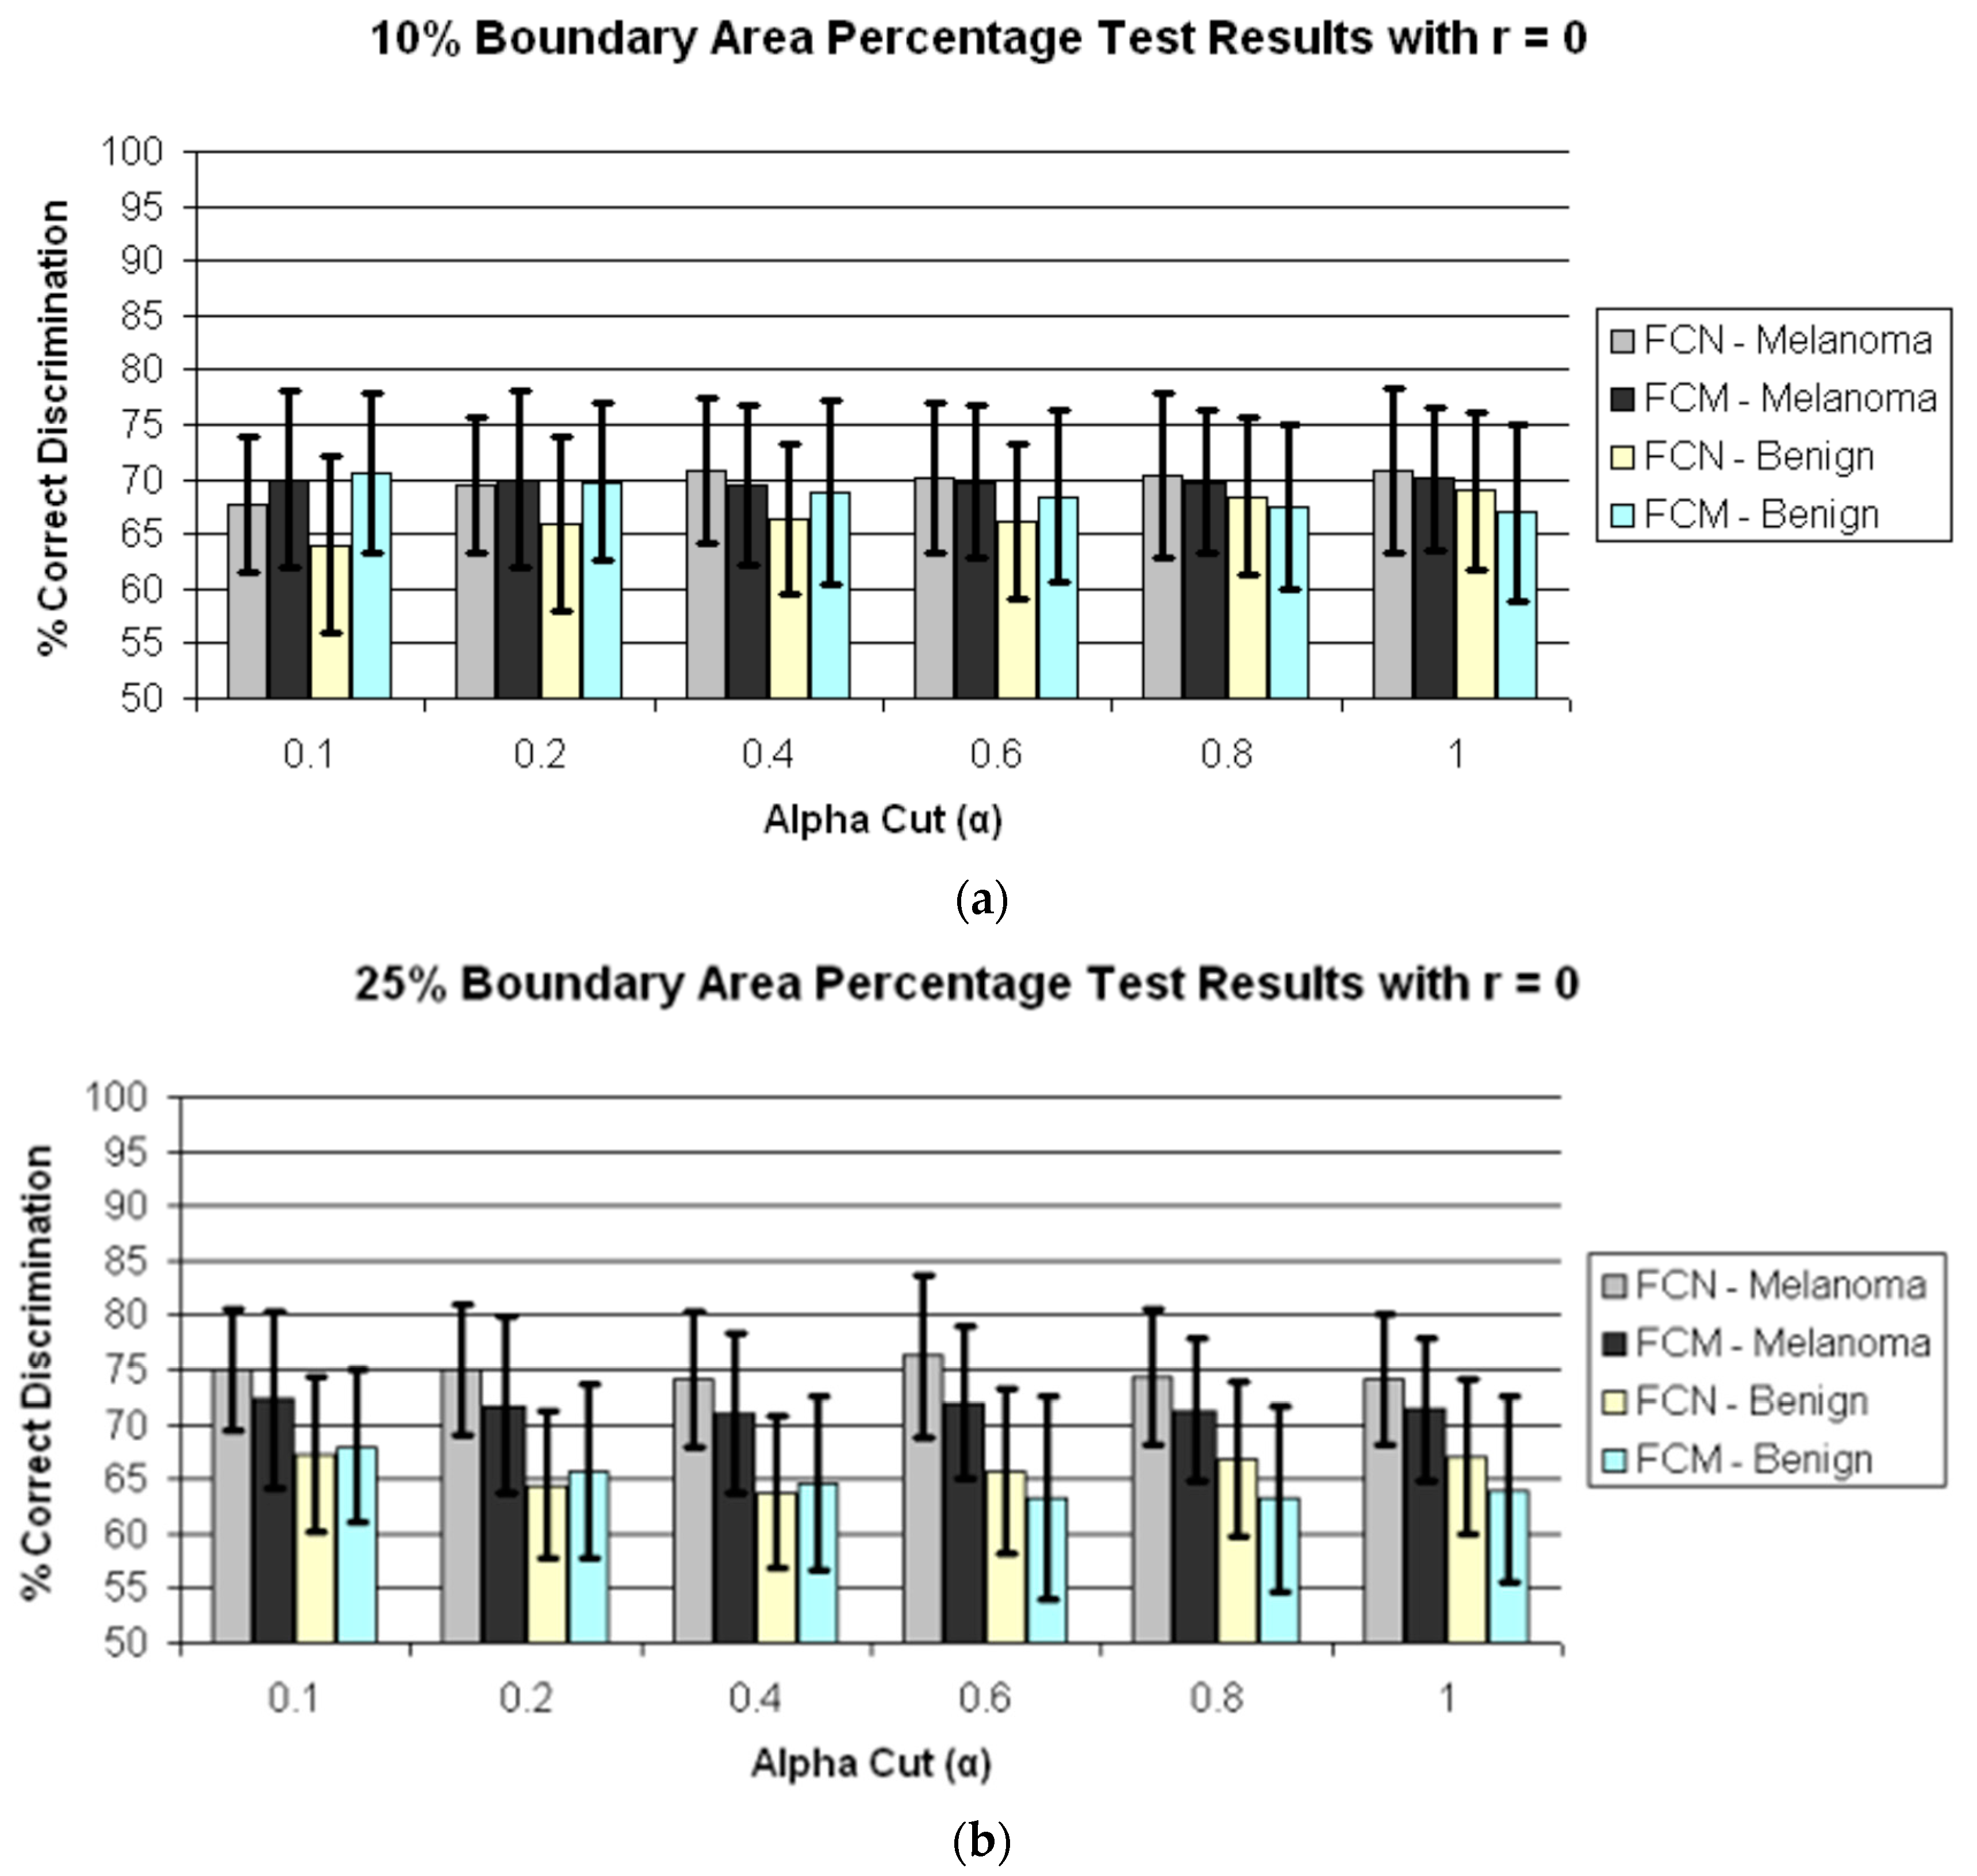
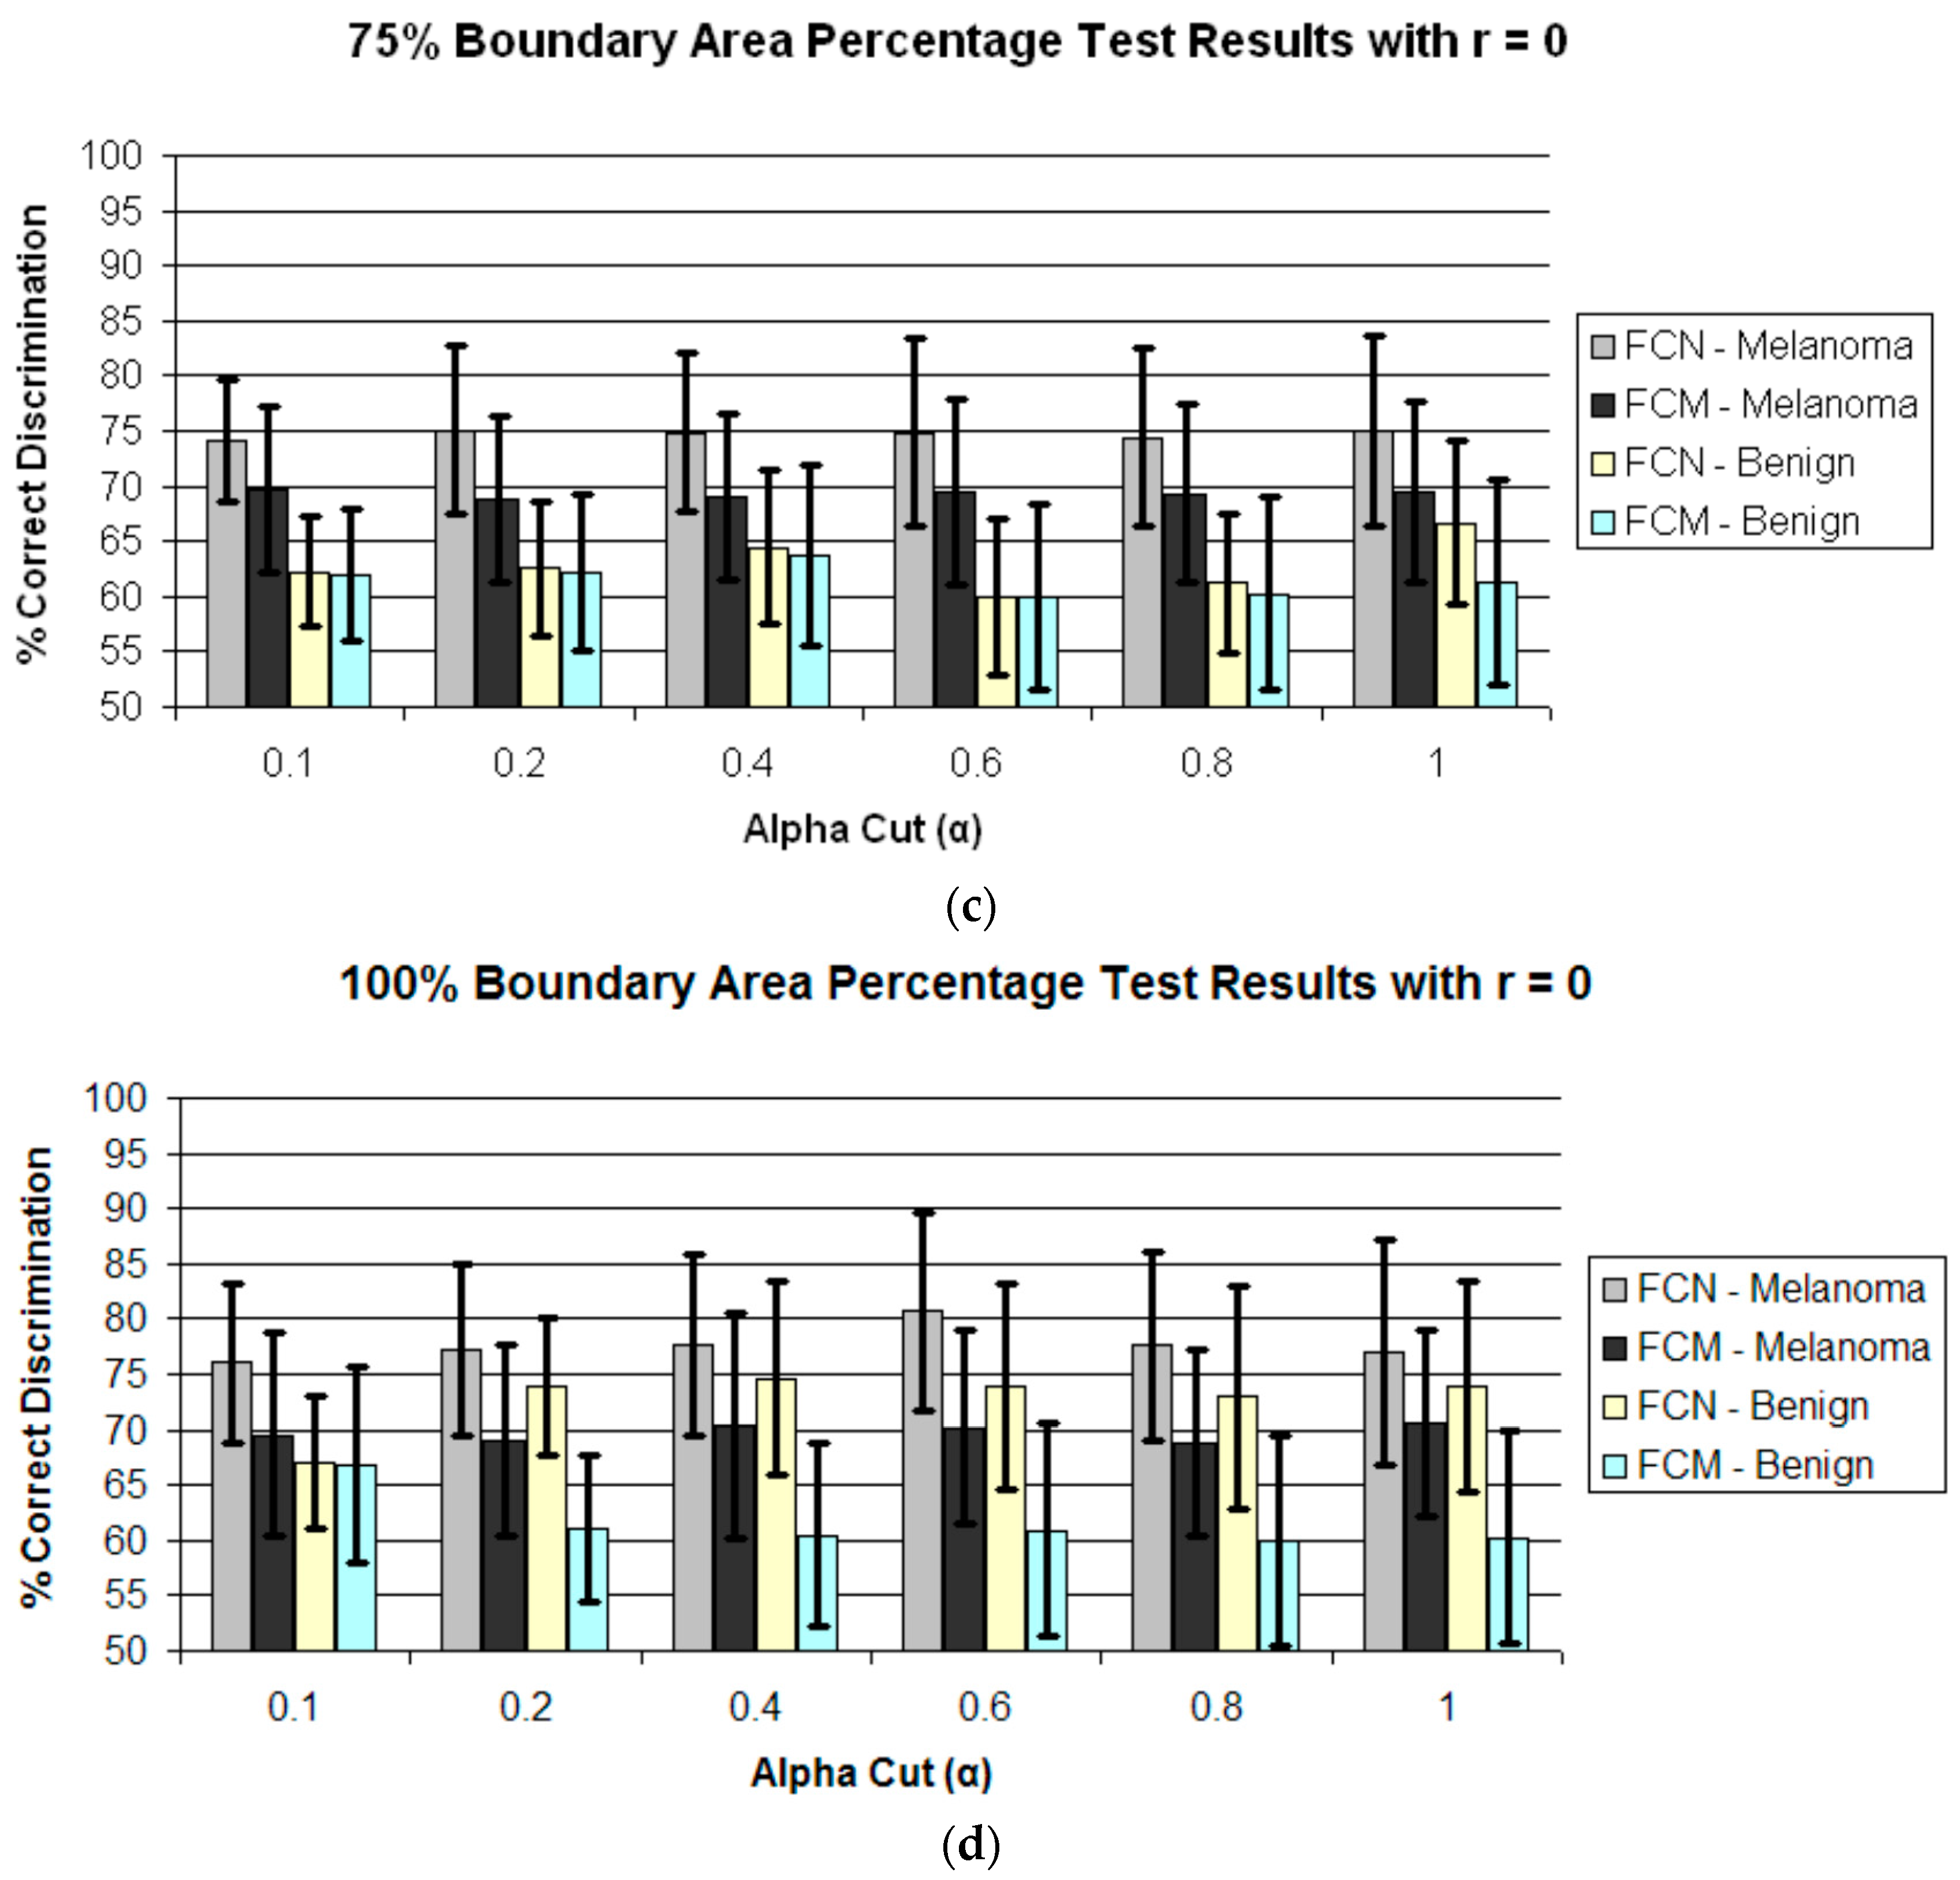
Figure 5.
Average and standard deviation test results over 25 randomly generated training/test sets for different boundary area percentages for r = 1. FCN and FCM denote the fuzzy ratio features computed using the benign and melanoma training images to determine discrimination accuracy. (a) Boundary area percentage = 10%; (b) Boundary area percentage = 25%; (c) Boundary area percentage = 75%; (d) Boundary area percentage = 100%.
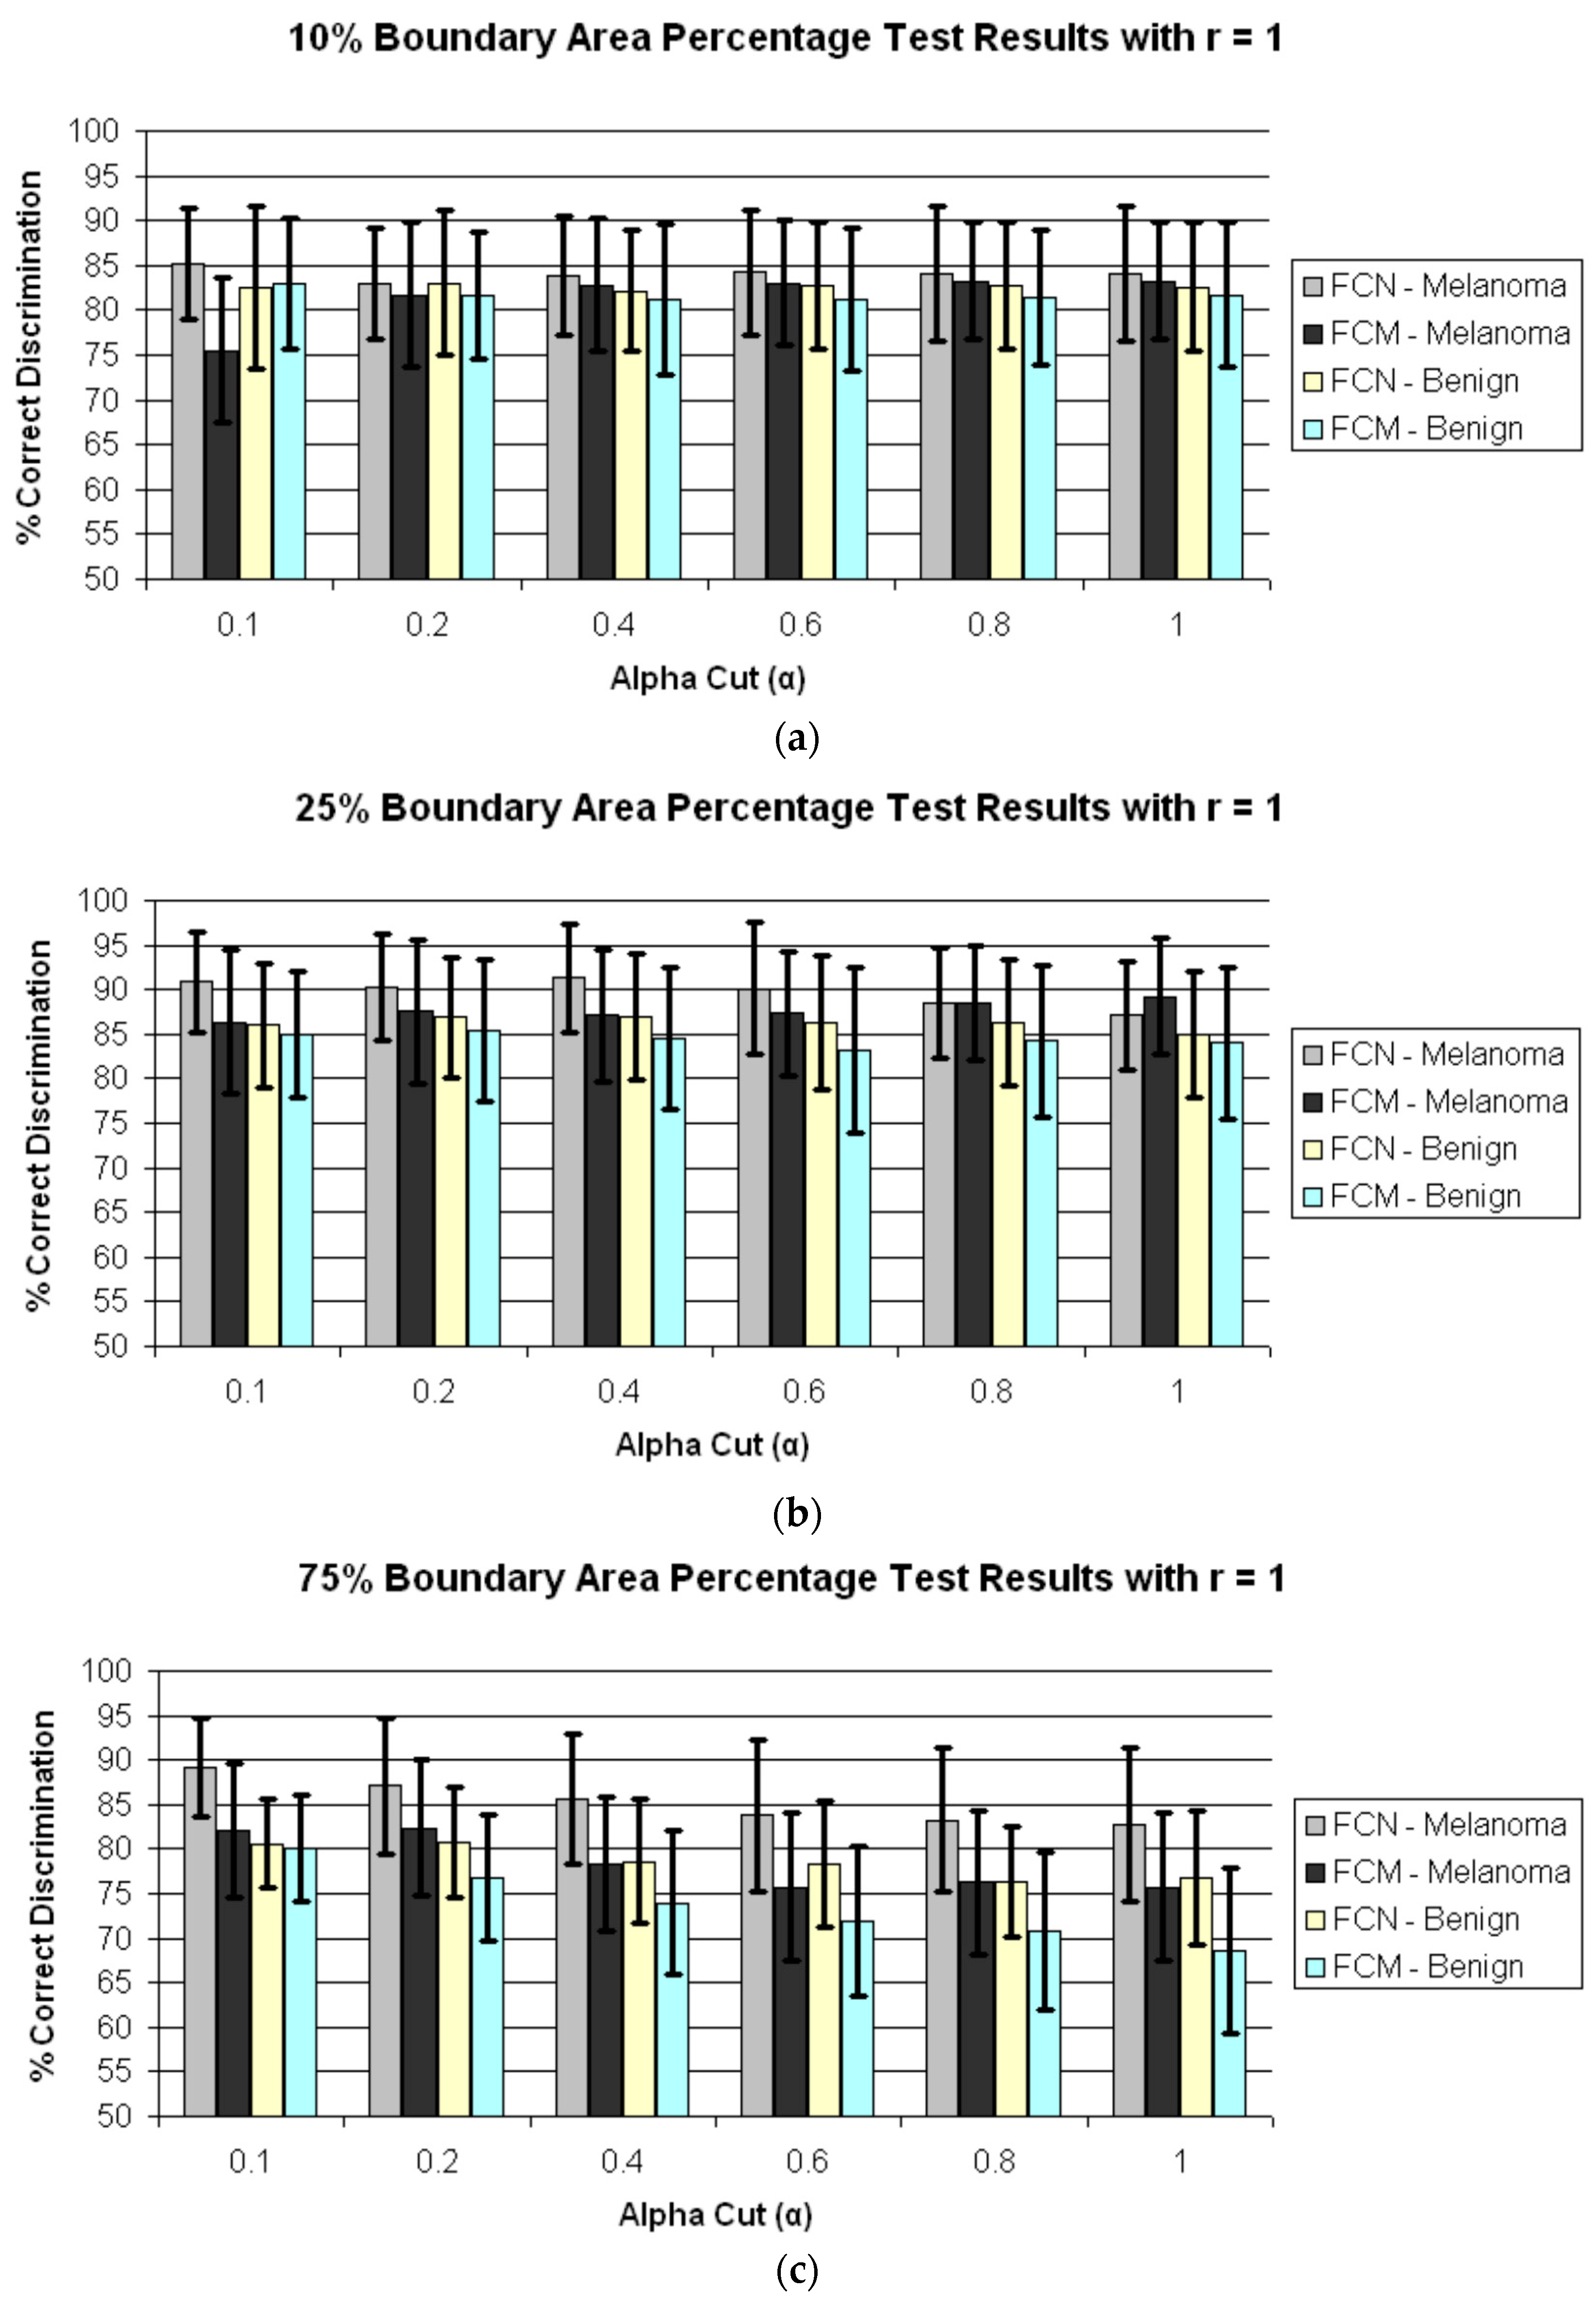
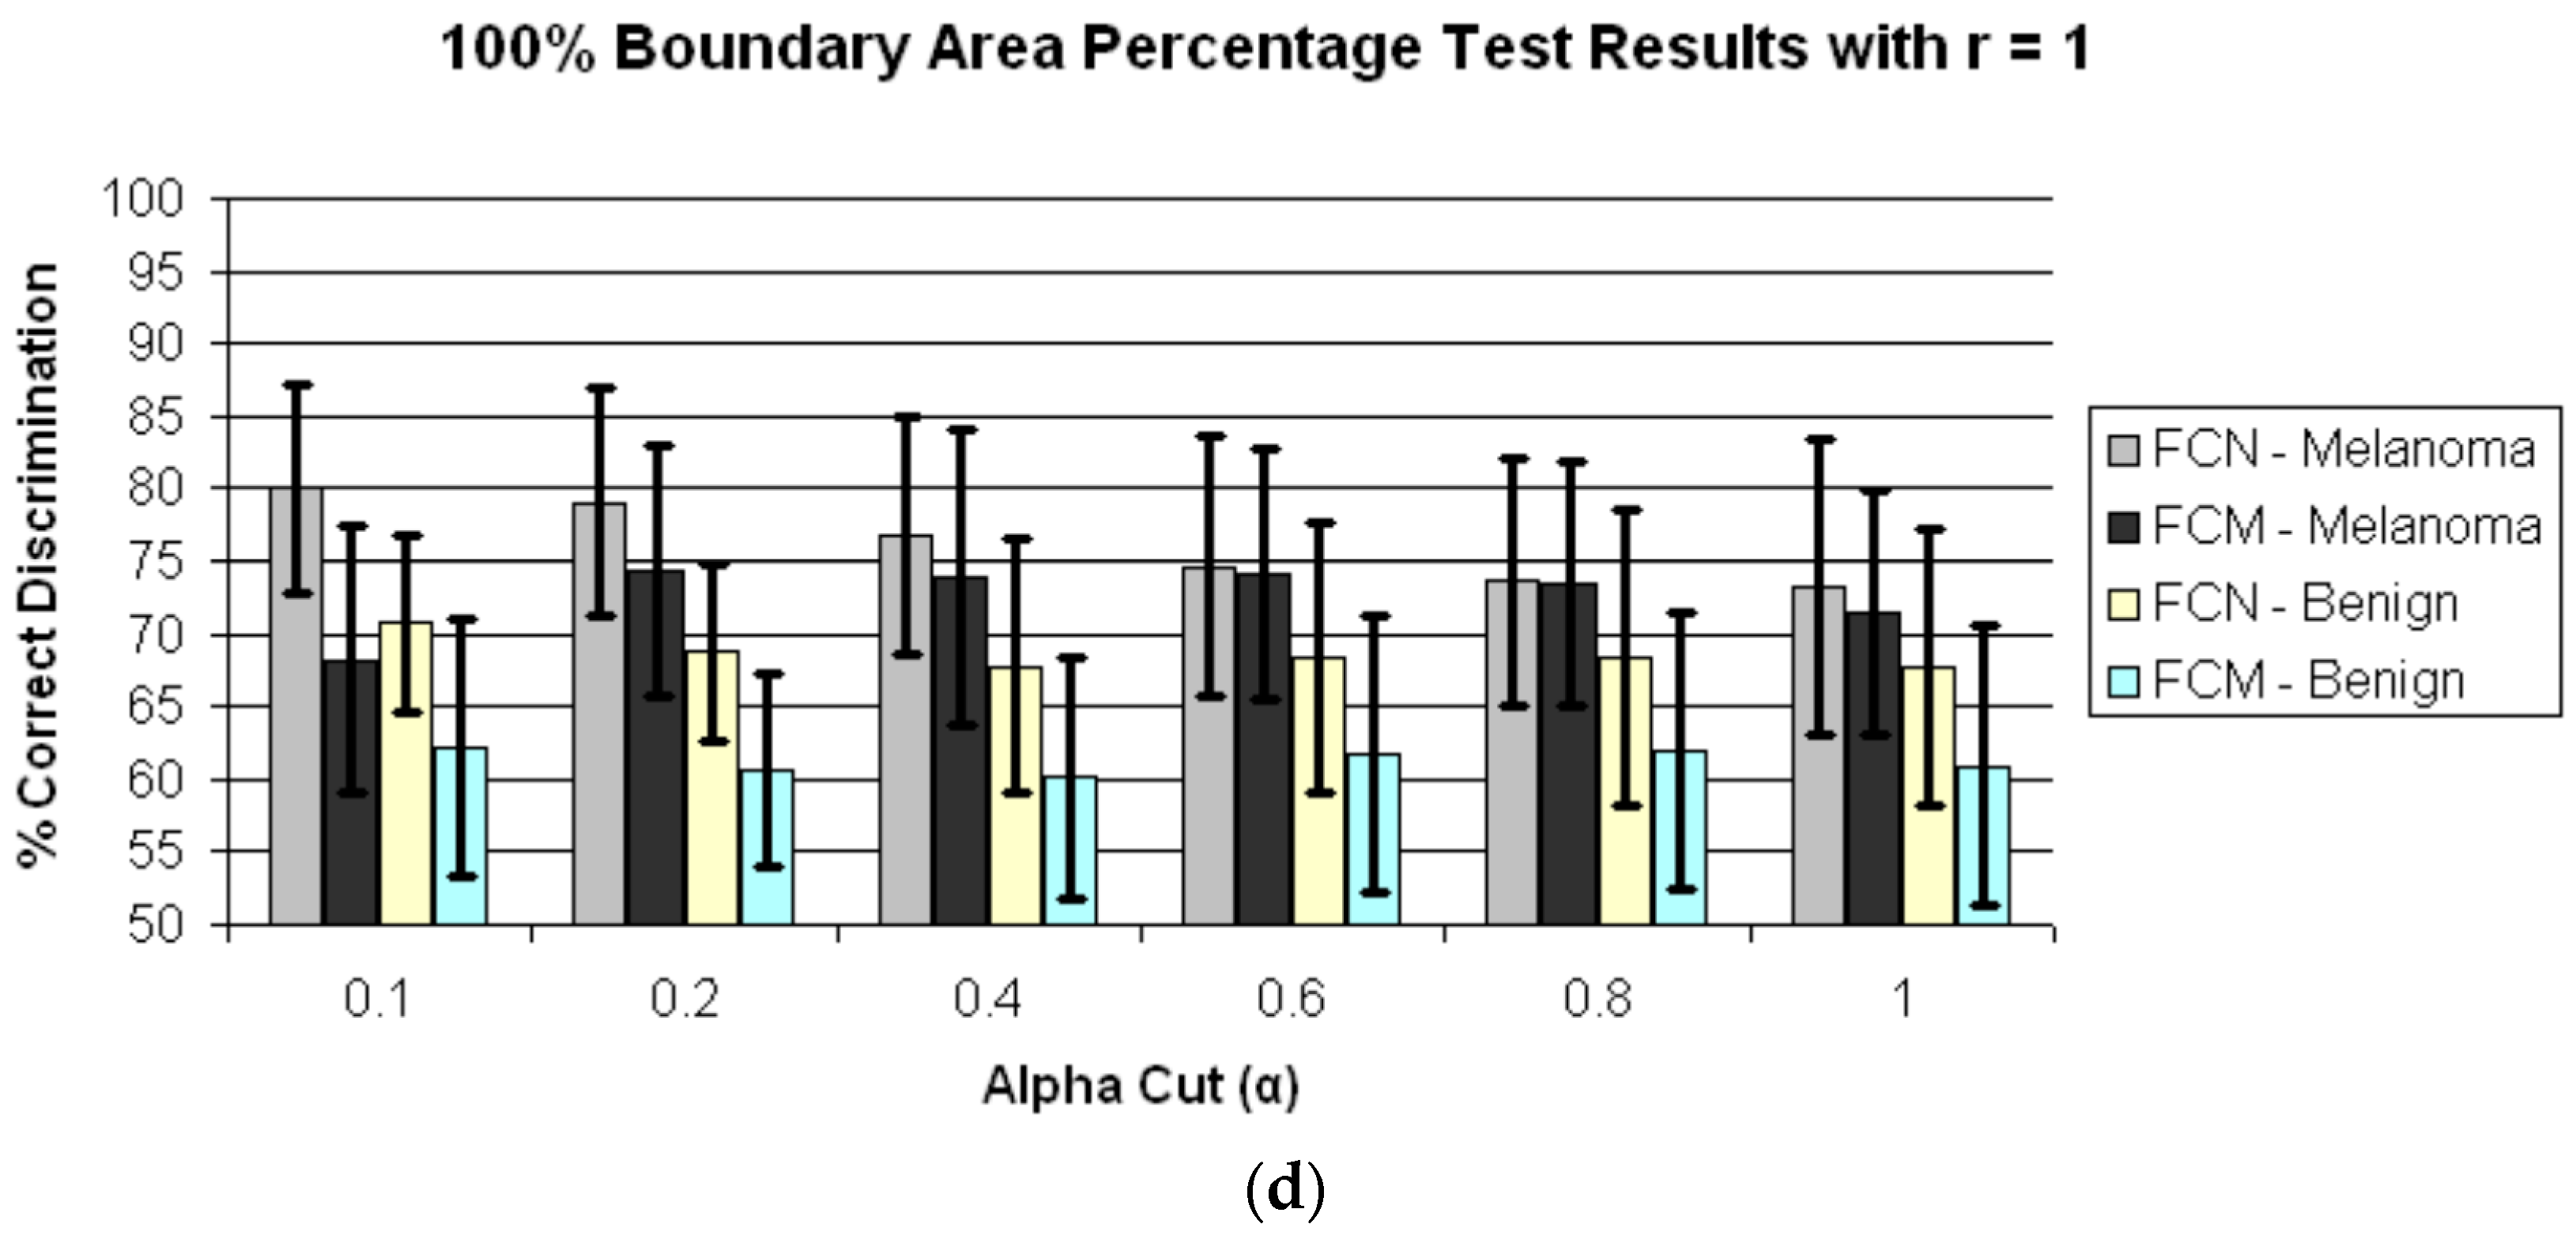
Figure 6.
Average and standard deviation test results over 25 randomly generated training/test sets for 25% boundary area percentage for r = 1 and α = 0.02, 0.05, 0.08, 0.1, 0.15 and 0.2. FCN denotes the fuzzy ratio features computed using the benign training images to determine the fuzzy set B.
Figure 6.
Average and standard deviation test results over 25 randomly generated training/test sets for 25% boundary area percentage for r = 1 and α = 0.02, 0.05, 0.08, 0.1, 0.15 and 0.2. FCN denotes the fuzzy ratio features computed using the benign training images to determine the fuzzy set B.


Table 1.
Skin lesion diagnosis categorization based on the type of skin lesion.
| Computer-Assisted Skin Lesion Diagnosis | ||
|---|---|---|
| Actual Skin Lesion Diagnosis | Benign | Melanoma |
| Benign | True negative (tn) | False positive (fp) |
| Melanoma | False negative (fn) | True positive (tp) |
© 2017 by the authors. Licensee MDPI, Basel, Switzerland. This article is an open access article distributed under the terms and conditions of the Creative Commons Attribution (CC BY) license (http://creativecommons.org/licenses/by/4.0/).
Share and Cite
MDPI and ACS Style
Almubarak, H.A.; Stanley, R.J.; Stoecker, W.V.; Moss, R.H. Fuzzy Color Clustering for Melanoma Diagnosis in Dermoscopy Images. Information 2017, 8, 89. https://doi.org/10.3390/info8030089
AMA Style
Almubarak HA, Stanley RJ, Stoecker WV, Moss RH. Fuzzy Color Clustering for Melanoma Diagnosis in Dermoscopy Images. Information. 2017; 8(3):89. https://doi.org/10.3390/info8030089
Chicago/Turabian StyleAlmubarak, Haidar A., R. Joe Stanley, William V. Stoecker, and Randy H. Moss. 2017. "Fuzzy Color Clustering for Melanoma Diagnosis in Dermoscopy Images" Information 8, no. 3: 89. https://doi.org/10.3390/info8030089
Note that from the first issue of 2016, this journal uses article numbers instead of page numbers. See further details here.