End-to-End Delay Model for Train Messaging over Public Land Mobile Networks


1
Department of Enterprise Engineering “Mario Lucertini”, University of Rome Tor Vergata, Via del Politecnico 1, 00133 Rome, Italy
2
Department of Innovation & Information Engineering, Guglielmo Marconi University, Via Plinio 44, 00193 Rome, Italy
3
Radiolabs, Consorzio Università Industria Laboratori di Radiocomunicazioni, Corso d’Italia 19, 00198 Rome, Italy
*
Author to whom correspondence should be addressed.
†
These authors contributed equally to this work.
Information 2017, 8(4), 145; https://doi.org/10.3390/info8040145
Submission received: 16 October 2017
/
Revised: 7 November 2017
/
Accepted: 8 November 2017
/
Published: 11 November 2017
Abstract
:Modern train control systems rely on a dedicated radio network for train to ground communications. A number of possible alternatives have been analysed to adopt the European Rail Traffic Management System/European Train Control System (ERTMS/ETCS) control system on local/regional lines to improve transport capacity. Among them, a communication system based on public networks (cellular&satellite) provides an interesting, effective and alternative solution to proprietary and expensive radio networks. To analyse performance of this solution, it is necessary to model the end-to-end delay and message loss to fully characterize the message transfer process from train to ground and vice versa. Starting from the results of a railway test campaign over a 300 km railway line for a cumulative 12,000 traveled km in 21 days, in this paper, we derive a statistical model for the end-to-end delay required for delivering messages. In particular, we propose a two states model allowing for reproducing the main behavioral characteristics of the end-to-end delay as observed experimentally. Model formulation has been derived after deep analysis of the recorded experimental data. When it is applied to model a realistic scenario, it allows for explicitly accounting for radio coverage characteristics, the received power level, the handover points along the line and for the serving radio technology. As an example, the proposed model is used to generate the end-to-end delay profile in a realistic scenario.
1. Introduction
Future railway communication systems will integrate a variety of systems, each of them specialized to specific services [1]. The communication platform for railway management will be oriented towards a unified infrastructure to increase efficiency, speed up the business processes, increase operational effectiveness, facilitate information exchange and improve the quality of decision-making. Other and new applications for railways are discussed in [2]. However, to provide broadband communication services for railways (even beyond those services supporting control and management functionalities), innovative communication systems’ architectures should be considered sometimes disregarding the existing infrastructure(s) along the line [3,4]. Moreover, recent advances on the Internet of Things (IoT) open a way to several innovative use cases and applications for creating a connected railway mainly oriented to passengers including: journey planner, social networking apps, gathering status information from diverse on-board public-facing assets, such as toilets, food car chiller, etc., real-time alarms for potential problems, allowing for more timely intervention responses and potentially reducing service outages and many others [5].
Effective management of railway operation processes will require highly reliable and stable telecommunication platforms, supporting new operational modes enabling the increasing of the railway traffic capacity while ensuring high security and safety levels.
The European Rail Agency (ERA) has undertaken studies to evaluate possible options for the evolution of the Global System for Mobile Communications-Railways (GSM-R) that will have to be replaced in the next few years. However, in the definition of a viable solution, two major challenges arise: to comply with the interoperability requirement, as done by the GSM-R today, and, from the train operator side, to protect the investments on the GSM-R. In addition, a migration to full IP-based telecom systems could facilitate the evolution towards a full service-based system for all rail applications [6].
Thus, the main body of current research on railway communication is mainly focused on the application of IP-based radio networks, such as LTE (Long Term Evolution), to high speed railway lines. The problem of supporting train control services by the LTE system is considered in [7]. Authors propose solutions based on modifying QoS (Quality of Service) policies, adjusting some cell parameters with respect to cell planning performed by the operator or optimizing procedures to resolve any network issue. These solutions can be costly for the railway owner. Concerning cost reduction, a first breakthrough in economic sustainability is represented by the replacement of proprietary/dedicated networks based on GSM-R, with public networks such as the cellular and satellite networks operated by commercial operators (mobile network operator, MNO). The use of public telecommunication infrastructure(s) makes it possible to rapidly extend the existing automated train control procedures (such as the European Rail Traffic Management System/European Train Control System (ERTMS/ETCS), and communications based train control [8]) for improving rail traffic capacity for local/regional lines where the deployment of a dedicated radio infrastructure is expensive in terms of both CAPEX (Capital Expenditures) and OPEX (Operating Expenditure). Furthermore, public networks can be considered as low cost and effective enablers for the rapid deployment of the modern railway information systems such as those proposed and investigated in the InteGRail project [9]. This innovative scenario would imply a step-change in the liability process with the introduction of guaranteed QoS in the provisioning of mobile connectivity services by telecommunication operators.
In the last few years, other important European research projects investigated on the railway communications. The RobustRail project [10] has studied the possibility of replacing the GSM-R with LTE in the railway scenario. The Railenium project [11] is concerned with the intelligent interaction between the infrastructure and vehicles to optimize both the performance of signalling systems and railway transport capacity. The Satloc project has addressed the adoption of the European Geostationary Navigation Overlay Service (EGNOS) for train positioning and speed determination [12]. Several papers have investigated the introduction of LTE for railway communications. In [13], authors investigate the use of LTE micro-cell deployment in high-density railway areas to support bandwidth hungry applications. Other papers have focused on transmission performance for high-speed trains, tackling problems due to Doppler shift [14], problems caused by too frequent base-station handovers [15] and retransmissions protection to provide data integrity as in [16].
To evaluate the performance of train control procedures based on public radio networks, channel characterization is important, as also highlighted in [17]. Authors in [17] report the main results of a measurement campaign in China for high-speed railway communications. As shown in [17], due to high channel dispersion and variability, authors propose the adoption of solutions to be considered in the design phase of the LTE system, such as Coordinated Multi Point and the cell combination for improving performance.
In the 3InSat project [18] within the framework of the European Space Agency (ESA) Advanced Research in Telecommunications Systems (ARTES) 20 programme, by means of an experimental campaign, we have investigated on the possibility of achieving acceptable QoS on public terrestrial networks integrated with satellite [8,19] as the economical feasibility of this approach. Considering that in the short/medium-term radio bearers provided by public networks will offer best-effort services, in [18], we also made evidenced that the satellite is an important component to achieve the required QoS levels. Performance results in [8] suggest that the usage of a public radio network including satellite for supporting train control communications is a viable choice for actual and future railway communications on local/regional lines. Typical propagation models used to assess communication performance on the railway focus on transmission aspects at the physical (PHY) layer [17,20]. In this paper, we model the behavior of the radio transmission channel as seen by the railway control applications, which run on the on-board European Vital Computer (EVC) and at the Radio Block Centre (RBC). In this case, the channel behavior can be completely characterized by the end-to-end (E2E) delay and by the loss probability of the control messages exchanged by the applications. The E2E delay channel model presented in this paper allows the railway operator to evaluate performances of train control procedures, whose messages exchanged between the railway control applications (i.e., EVC and RBC) are sent on a public radio network managed by a telecommunication operator. In this case, for the railway operator, it is not possible to know exactly the behavior of the public radio network as well as to influence it in any way. The railway operator can only infer/measure the E2E delay for the messages sent by applications.
The proposed E2E delay model aims at reproducing the main behavioral characteristics of the process describing the E2E delay as observed from experimental data [18] obtained over a regional line. It is shown that the proposed model can be applied to generate the E2E delay for a generic railway line when the positions of handover areas have been identified along the line and the received power levels and information on the radio serving technologies are available. The model can be used for preliminary performance analysis of railway control procedures for trains moving over local/regional lines. Furthermore, our model can also be used to study and infer the performance of IoT applications exchanging messages with the ground segment. Finally, the validity of the proposed model has been assessed by comparing the cumulative distribution function of the E2E delays generated by the model with those obtained from measurements. The E2E delay model presented in this paper is obtained from experimental results concerning the terrestrial radio networks only.
The paper is organized as follows. In Section 2, we summarize the main characteristics of the experimental setup used to measure E2E delay profile on the selected local/regional railway line. In Section 3, we outline the main features concerning the behavior of E2E delay and the message loss over the railway as emerging from the analysis of the available experimental data. These features are then used to derive the E2E delay model, which is presented in Section 4. The practical usage of the two states E2E delay model is discussed in Section 5. The experimental statistics of the random variables driving the proposed two states model are introduced in Section 6. To prove the ability of the proposed model in reproducing the behavior of the E2E delay, we apply it to an example of a realistic railway scenario. In the same section, we provide results concerning the validation of the proposed model. Finally, conclusions are drawn.
2. Scenario and Test Trials
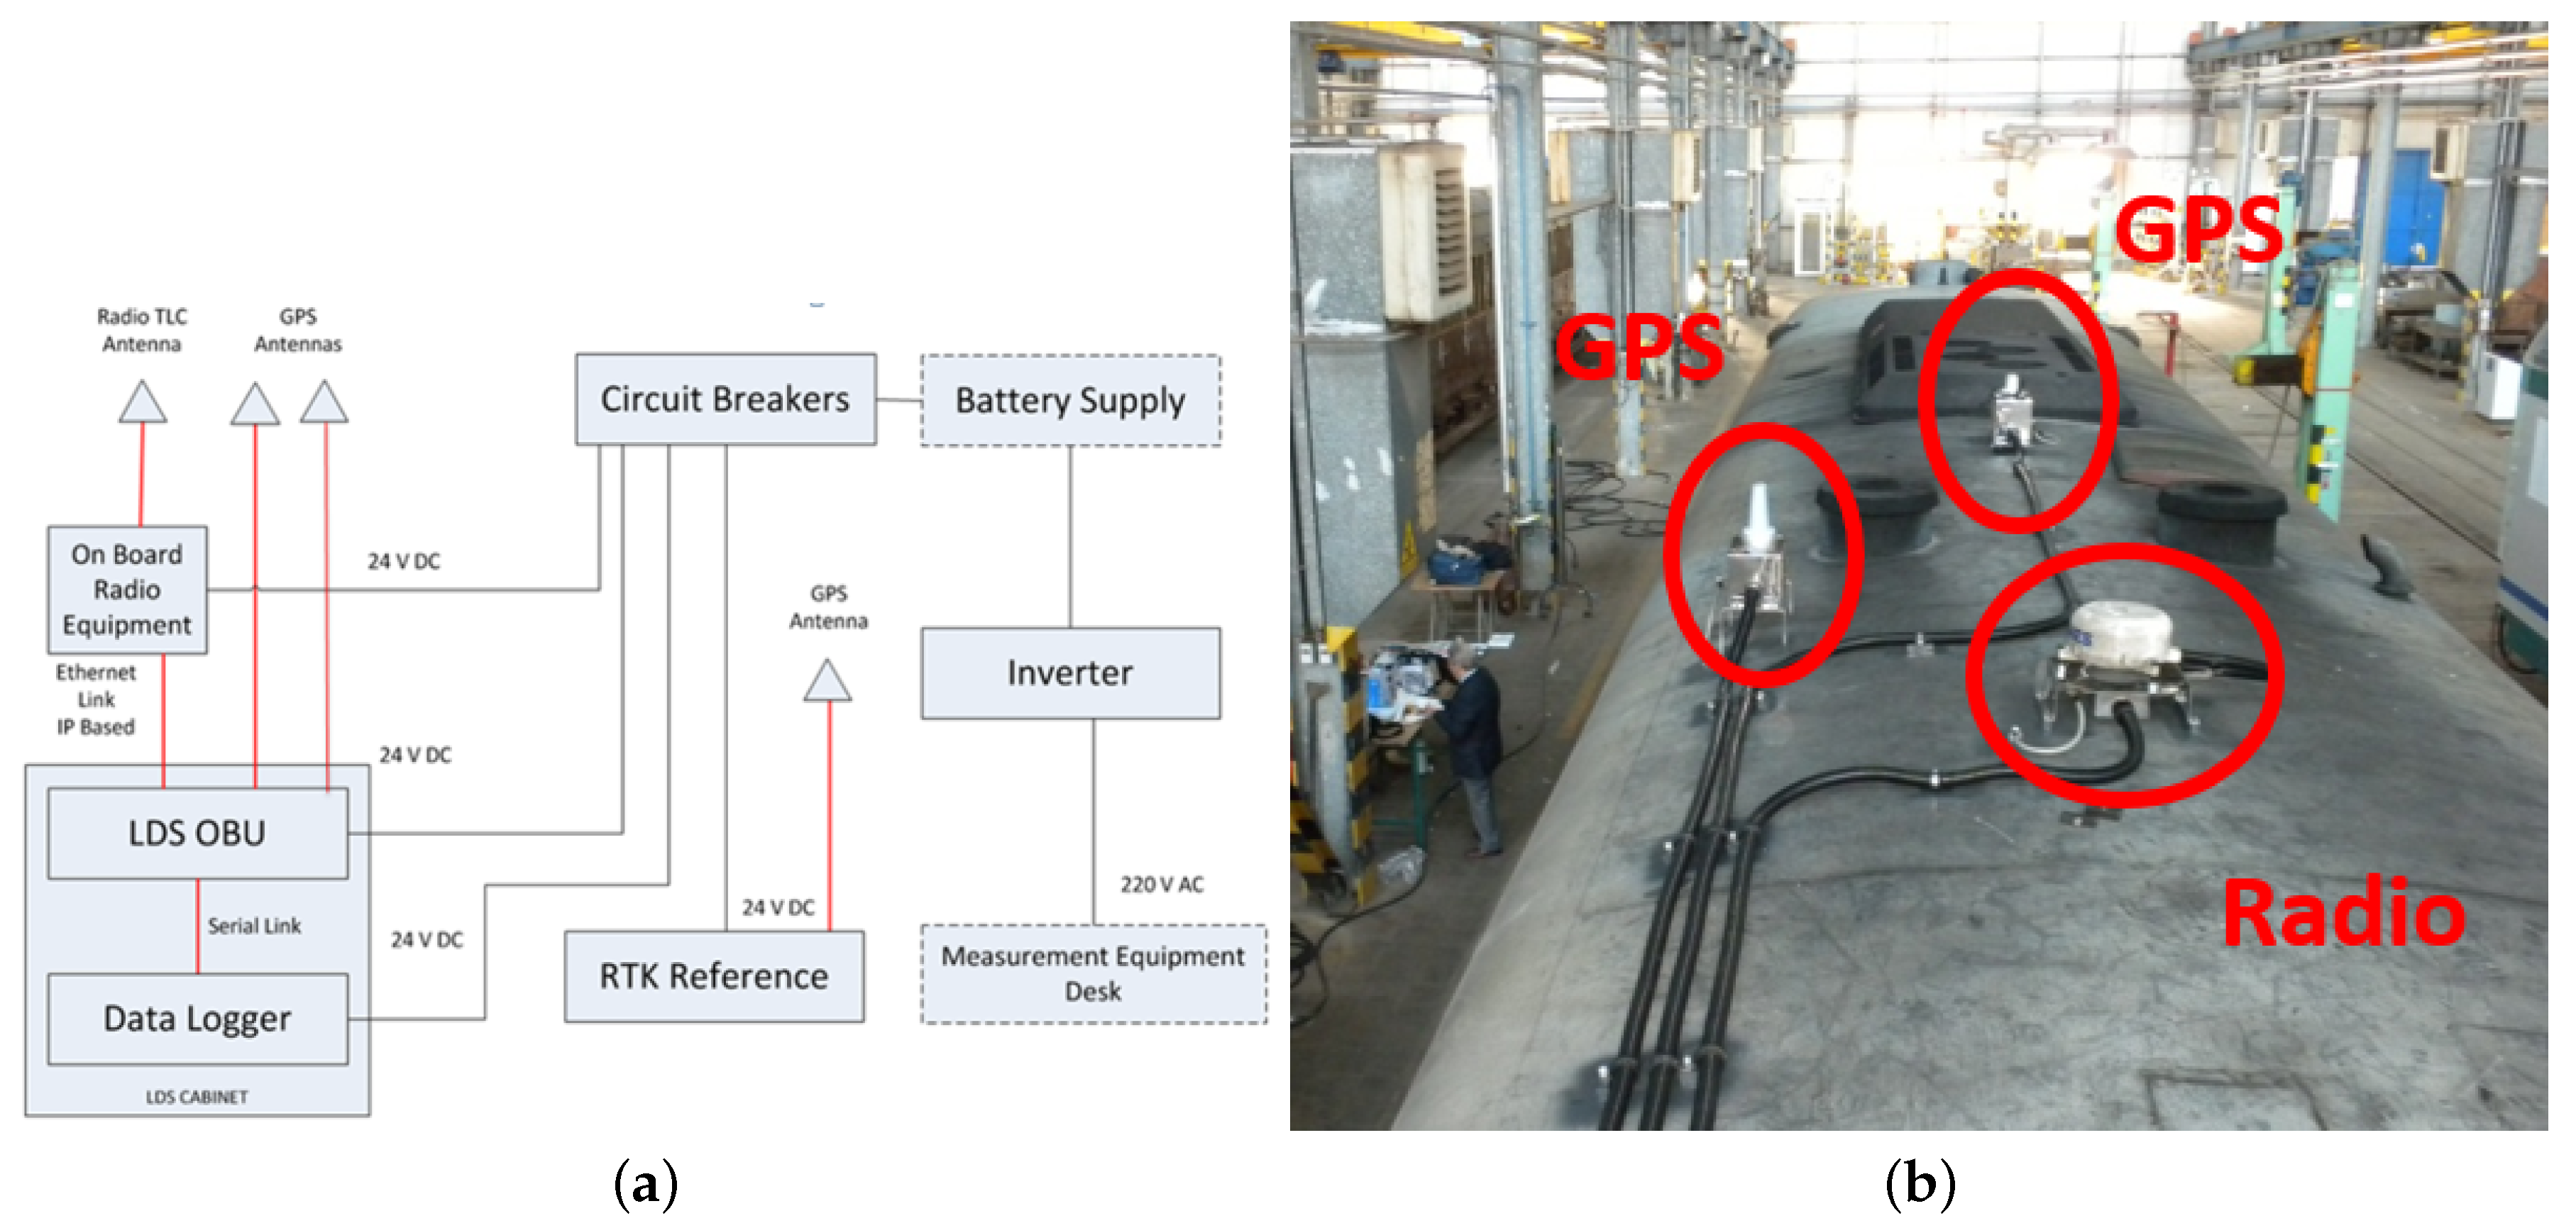
Experimental activities have been developed in the framework of the ESA ARTES 20 3InSat Project [18], which foresees realization of a railway testbed for testing satellite navigation and communication technologies for rail applications under real operational conditions. Trials have been focused on the standard train signalling services. Data have been recorded over the railway line connecting the towns of Cagliari and Olbia in the Sardinia Island (Italy). The considered railway line is about 300 km long and the maximum allowed train speed is 150 km/h, actually limited to 130 km/h (which is the maximum speed of the Minuetto Diesel traction trains used on the line). Tests and demonstrations have been performed reaching the maximum speed. During the four weeks of the test campaign, two trips per day, each lasting 3:50 h each way, have been performed. The cellular, GPS (Global Positioning System) and satellite antennas have been placed on the roof top of the train with an unobstructed view to the sky. For the test, we have used the machine-to-machine (M2M) service provided by the Vodafone (Italy) 2G/3G public mobile access network. The selected operator provides roaming to other mobile networks in case of a lack of Vodafone coverage. The satellite link has been provided by the Inmarsat Satellite (Broadband Global Area Network (BGAN) configuration). The on-board equipment includes the EVC and a Location Determination System (LDS) on board unit (OBU). Both EVC and LDS functionalities have been emulated by software running on a portable PC. The RBC emulator has been hosted by a server cluster located at TriaGnoSys lab facilities (Munich, Germany) [19]. The schematic diagram of the considered onboard measurement system is depicted in Figure 1. The additional Real-Time Kinematic (RTK) GPS receiver in Figure 1 has been used for improving localization with the augmentation network. For our purposes, only the radio sub-system is of interest.
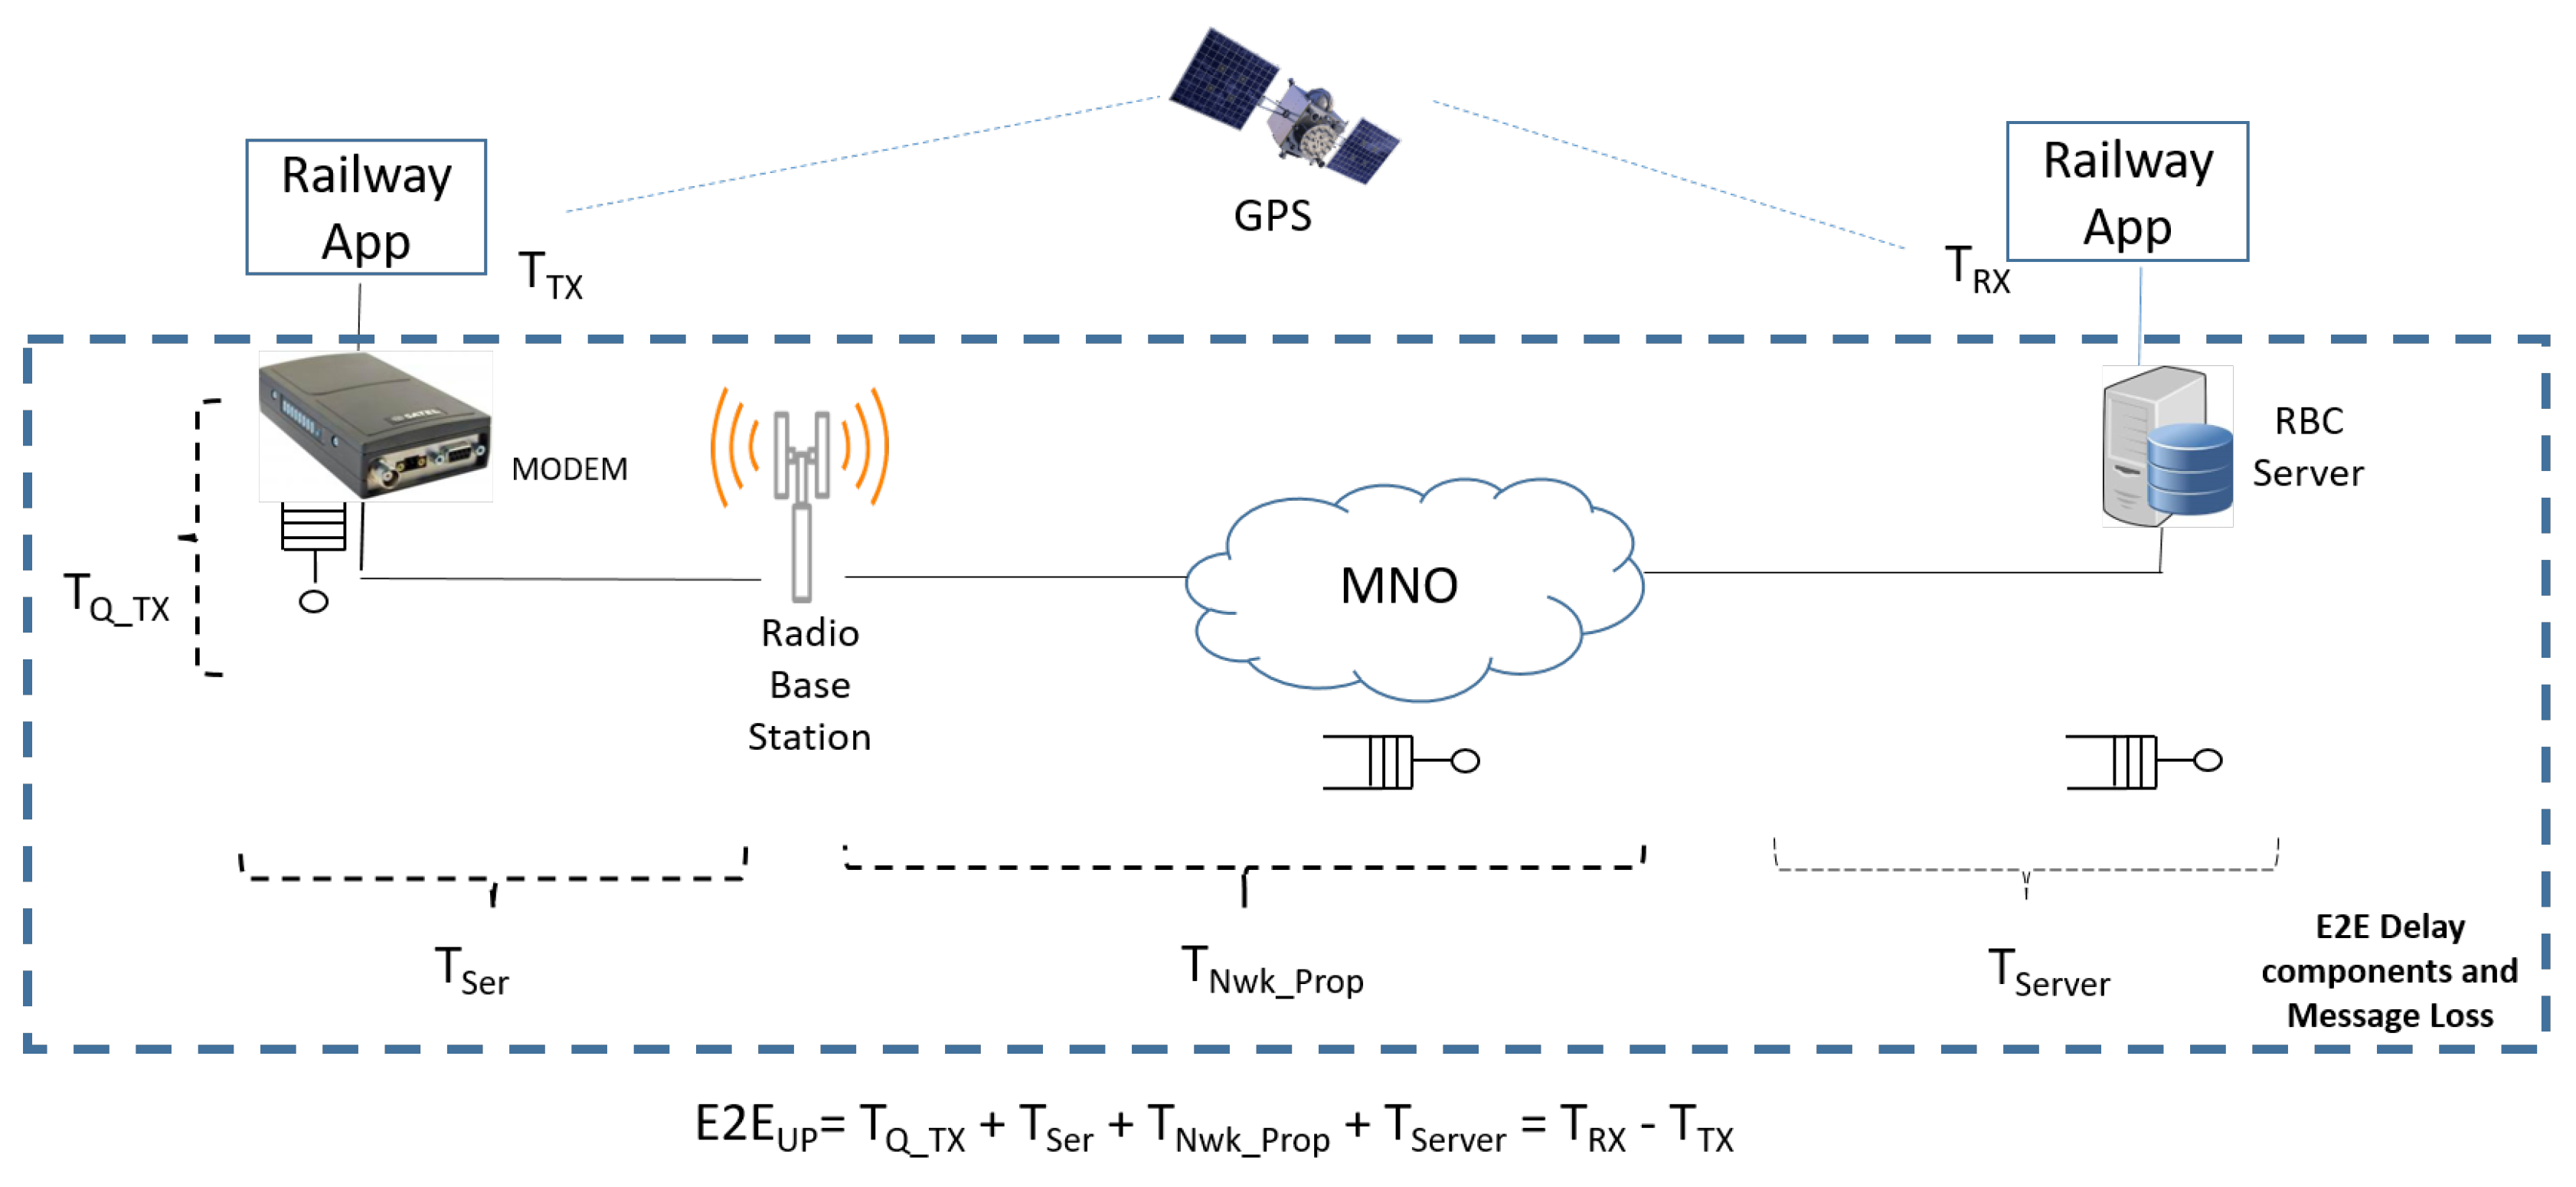
For the trial setup, the delay components contributing to the EVC-to-RBC E2E delay have been made evident in the scheme in Figure 2.
In the scheme in Figure 2, we have implicitly assumed that the MNO network may include Internet segment(s). We have no information if messages in the Vodafone network have been routed over the Internet and/or on any other operator’s private network. In general, it may be expected the public MNO could send its protected/high priority traffic over dedicated networks, which may rest on the incumbents’ networks of the traversed countries. From the analysis of the recorded data we have observed that Vodafone’s network behaves well most of the time. The minimum recorded values for the E2E delays vary between 40 ms up to 60 ms.
In general, the E2E delay accounts for: the (possible) message enqueue in the transmitter before transmission and the serialization time (), the time for message propagation in the network () and the time required for the message at the network output to reach the corresponding application at the RBC. A scheme similar to that in Figure 2 can be devised for the RBC-to-EVC link. Since we are interested in E2E delay and message loss experienced by railway applications running in the RBC and EVC, channel modelling has been restricted to the characterization of the E2E delay formally defined as the difference between and :
where is the message transmission time and is the (corresponding) receive time of the message. During trials, each message has been uniquely identified by its progressive sequence number (message identifier, ID). The transmit timestamp is attached to the message at the application level. Similarly, the receive time is evaluated at application level after having received the entire message. The common GPS time base has been adopted for timestamps generation. Since timestamps are provided at the application level, this prevents us from the possibility of separating the delay components of the E2E delay in Figure 2. The availability of in Figure 2 would have allowed us to achieve a delay model independent on the characteristics of the transmission/receiving chain. However, the mobile network operator has been unable to provide us with this information. Finally, we consider the message loss probability as obtained by the ratio between the number of lost messages and the total number of transmitted messages.
3. Analysis of Experimental Data
The analysis of experimental data is the first step required to provide evidence of the main features characterizing the behavior of the E2E delay over the rail line. The resulting E2E delay model should reproduce the features emerging from this analysis. In Figure 3, we plot one sample of the E2E delay as a function of the travel time as obtained during the experimental campaign. On to the same picture, we have superimposed the corresponding received power profile associated with the transmitted messages (one message every 200 ms in this case). In the same picture, we have also indicated the serving radio technology connecting the terminal along the railway path. At the moment of the measurement campaign, LTE was not present in the considered sub-urban/rural areas. Anyway, it is expected that LTE is and will be mainly deployed in high-densely populated areas. Thus, for regional lines, it is more appropriate to consider 2G and 3G radio technologies.
The presence of the tunnel has been made evident in the picture. At the time of measurements, the km long gallery was not equipped with any radio technology and roaming with GSM 900 technology was not performed until the train exits the gallery. In the following part of this section, we proceed with the examination of the measured E2E delays in order to assess the main features to be owned by the model to reproduce behavior similar to that in Figure 3.
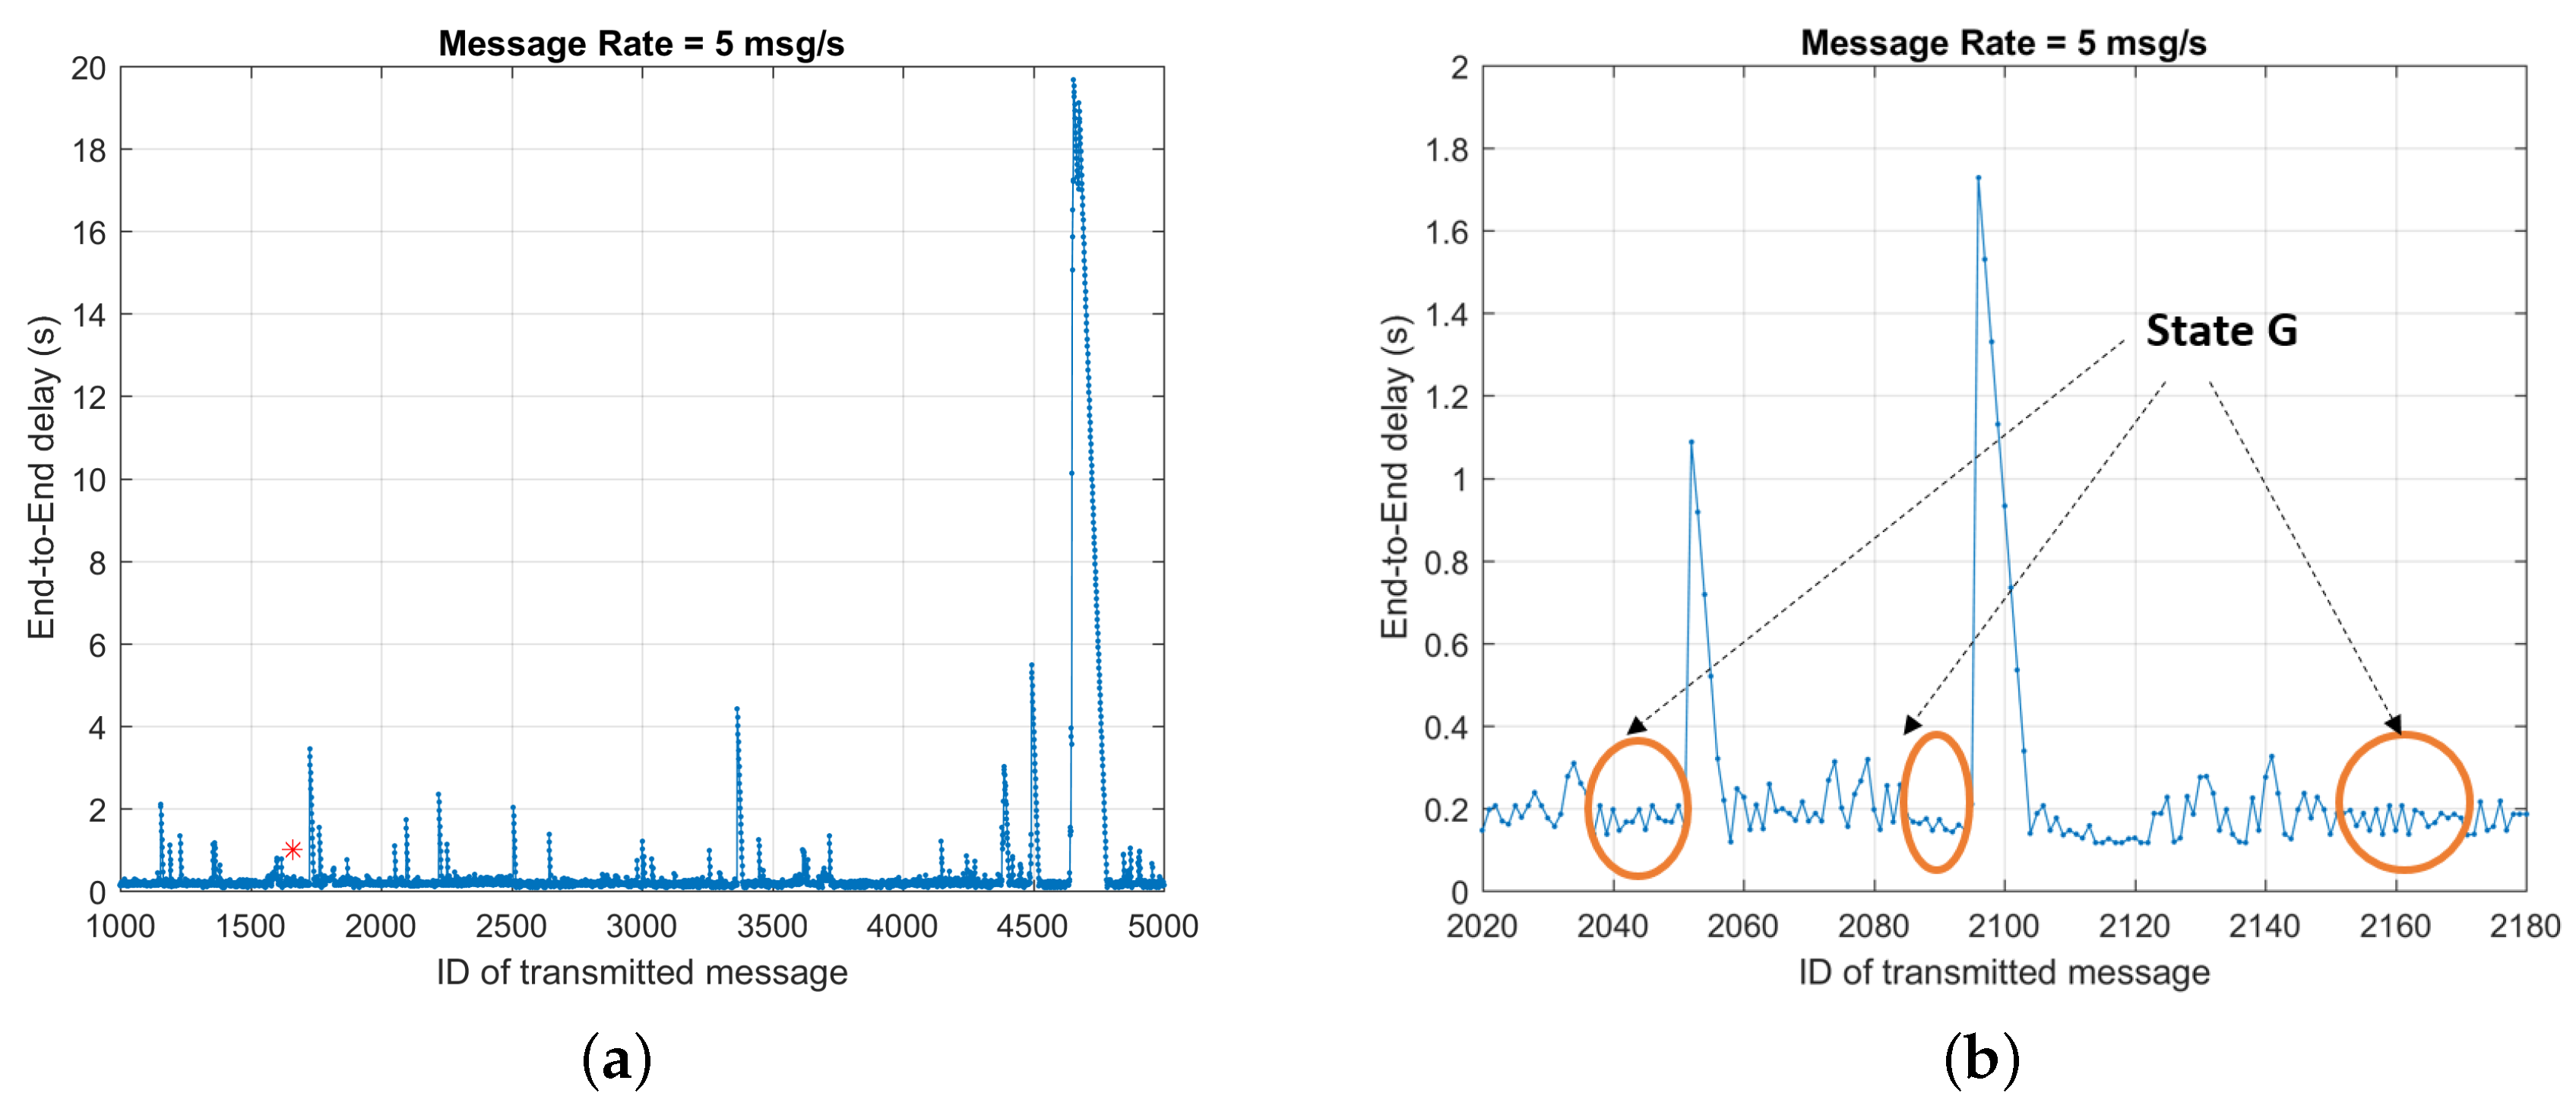
In the G state, the E2E delay is (practically) bounded within hundreds of milliseconds (see circled areas in Figure 4b), sometimes taking values higher than the messages generation interval (e.g., 200 ms), thus causing enqueuing of messages and then a transition in the state Q (see below).
In Table 1, we report a sample of the E2E delays obtained from measurements representing the behavior in state G. The E2E delays and the corresponding transmission and receiving timestamps have been also indicated.
Figure 3b,c are two zooms of Figure 3a. From results in Figure 3b,c, we can observe a correlation between the received power level and the experienced E2E delays. This relation will be studied in the section concerning the parameters of the E2E delay model presented in this paper. The typical pattern of the E2E delay profile obtained from experimental data is shown in Figure 4a. The plot in Figure 4b is a zoom of Figure 4a. Figure 4a provides evidence of a two states-like behavior for the E2E delay. Thus, we can introduce two distinct macro-states that, for convenience, we label as Good (G) and enQueued (Q).
From data in Table 1, in some cases (see numbers in bold), the receive time of the message can be greater than the transmit time of the successive message.
This event can be explained assuming messages have been buffered in the transmitter when the link becomes (temporarily) unavailable and, more in general, due to buffering in any part of the traversed network sections (e.g., Radio Access Network (RAN), backbone, core). In the case of buffering in the transmitter, for messages of constant length, the speed for emptying the buffer depends on the assigned channel bit rate over the wireless link when it returns as available. In general, the instantaneous link bit rate can be considered as random, and its value depends on the locally available radio technology(ies) (e.g., 2G, 3G or 4G), on the traffic load in the cell and on the scheduling strategy of the serving base station (BS).
In the Q state, a large number of messages could be buffered due to link unavailability even for a relatively long time.
In this case, large transmission delays have been experienced leading to the high spikes in the E2E delay as evidenced in Figure 4.
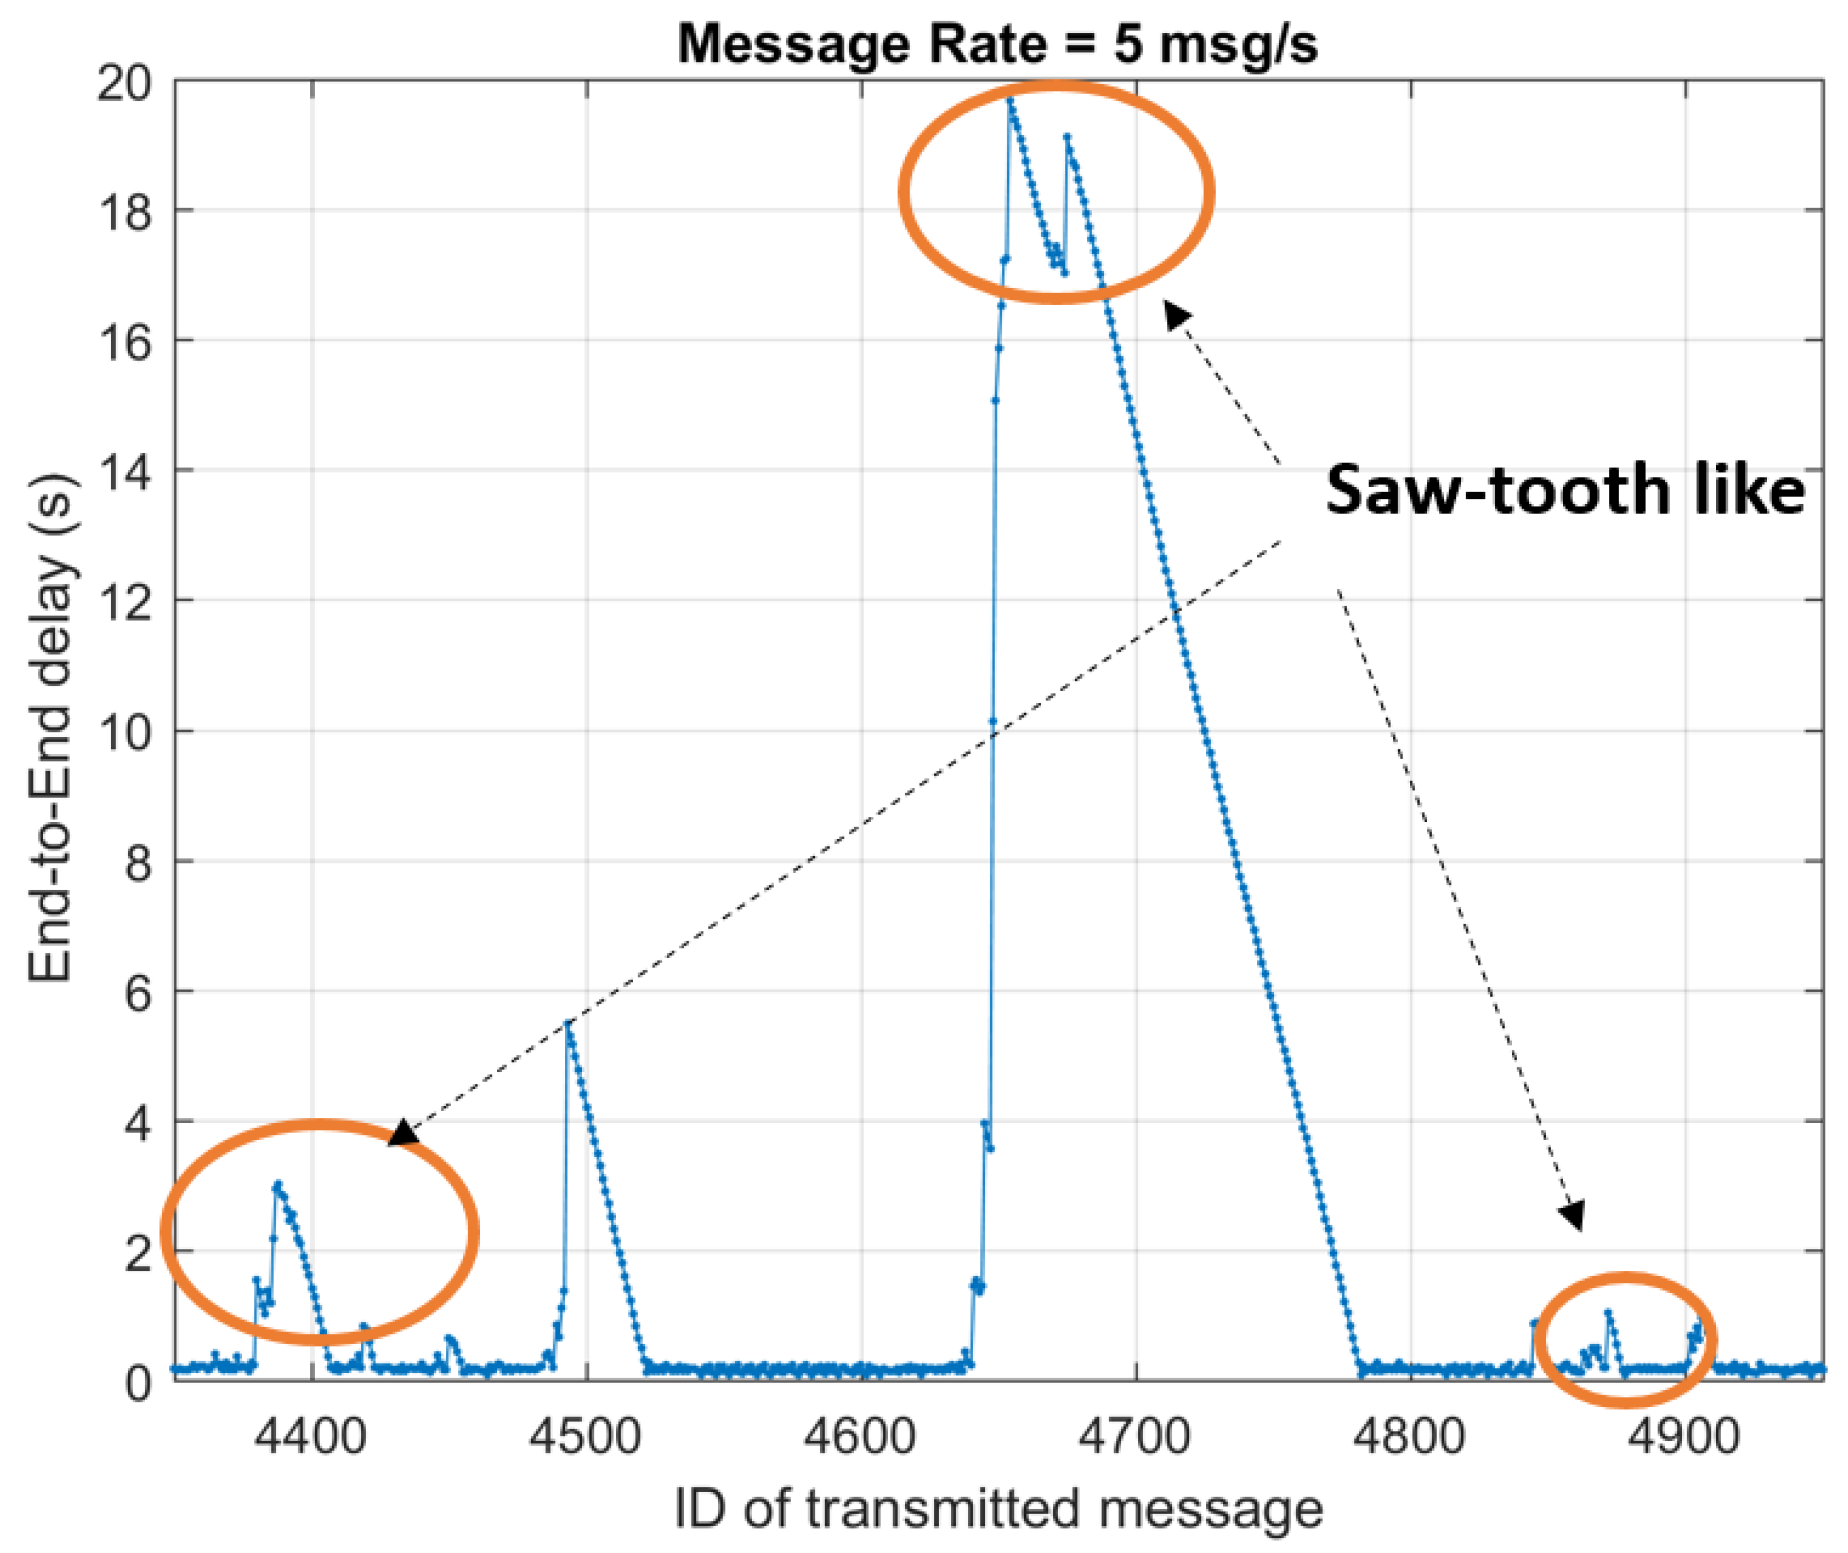
To better understand the nature of these events, we have correlated the time the messages are sent with the positions of the train along the line. We have observed that these phenomena can be related to the received power level, the actual serving radio technology and to the (hard) handover/roaming events. In some sporadic cases, very large E2E delays (on the order of about one minute or more) have led to the automatic reset of the measurement equipment. This has caused the loss of several consecutive messages and, obviously, their IDs have not been recorded at the receiver side. These events have been discarded from the data set used to derive the model presented in this paper. Finally, when the channel is in state Q and the generation rate of the messages is relatively high (e.g., 5 msg/s), buffering of messages to be transmitted may occur frequently. This leads to the saw-tooth like behavior made evident in Figure 5.
The cases in Figure 4 and Figure 5 are for illustrative purposes only of the main phenomena we need to consider for E2E delay modeling.
Before concluding this section, we have also observed the presence of sporadic losses of one or more messages indicated in the previous figures with asterisks. From further analysis, we have observed that sporadic losses are un-correlated and can occur randomly regardless of the channel state G or Q. The message loss probability has been evaluated from experimental results and for different message rates. If we exclude events causing the reset of measurement devices and losses due to coverage holes along the line, we have observed the presence of sporadic messages loss due to momentary bad radio link and/or to message forwarding in the core network. Even though the Vodafone network could be based on a Virtual Private Network Point-to-Point (VPN P2P) link, it still may experience random un-bounded delays. This could be one of the possible causes leading to reset of measurement equipment. From extensive data analysis, after excluding (un-wanted and un-predictable) equipment reset events, we have obtained a (sporadic) message loss probability of about . This value is not surprising. In fact, the service provided by Vodafone was optimized for M2M communications; presumably, it implements high availability and buffering solutions for reducing/avoiding message loss. In general, it is envisaged that the railway operator will request the MNO for reliable and secure message transmission services for the transport of signaling information. If we even include all the events leading to loss of message sequence (such as the presence of coverage holes and tunnels without radio facilities inside, etc.), the loss probability may raise up to as indicated in [19]. However, the positions of tunnels and coverage holes are known in advance so that connection failure can be predicted and properly taken into account for train management operations.
4. Proposed E2E Delay Model
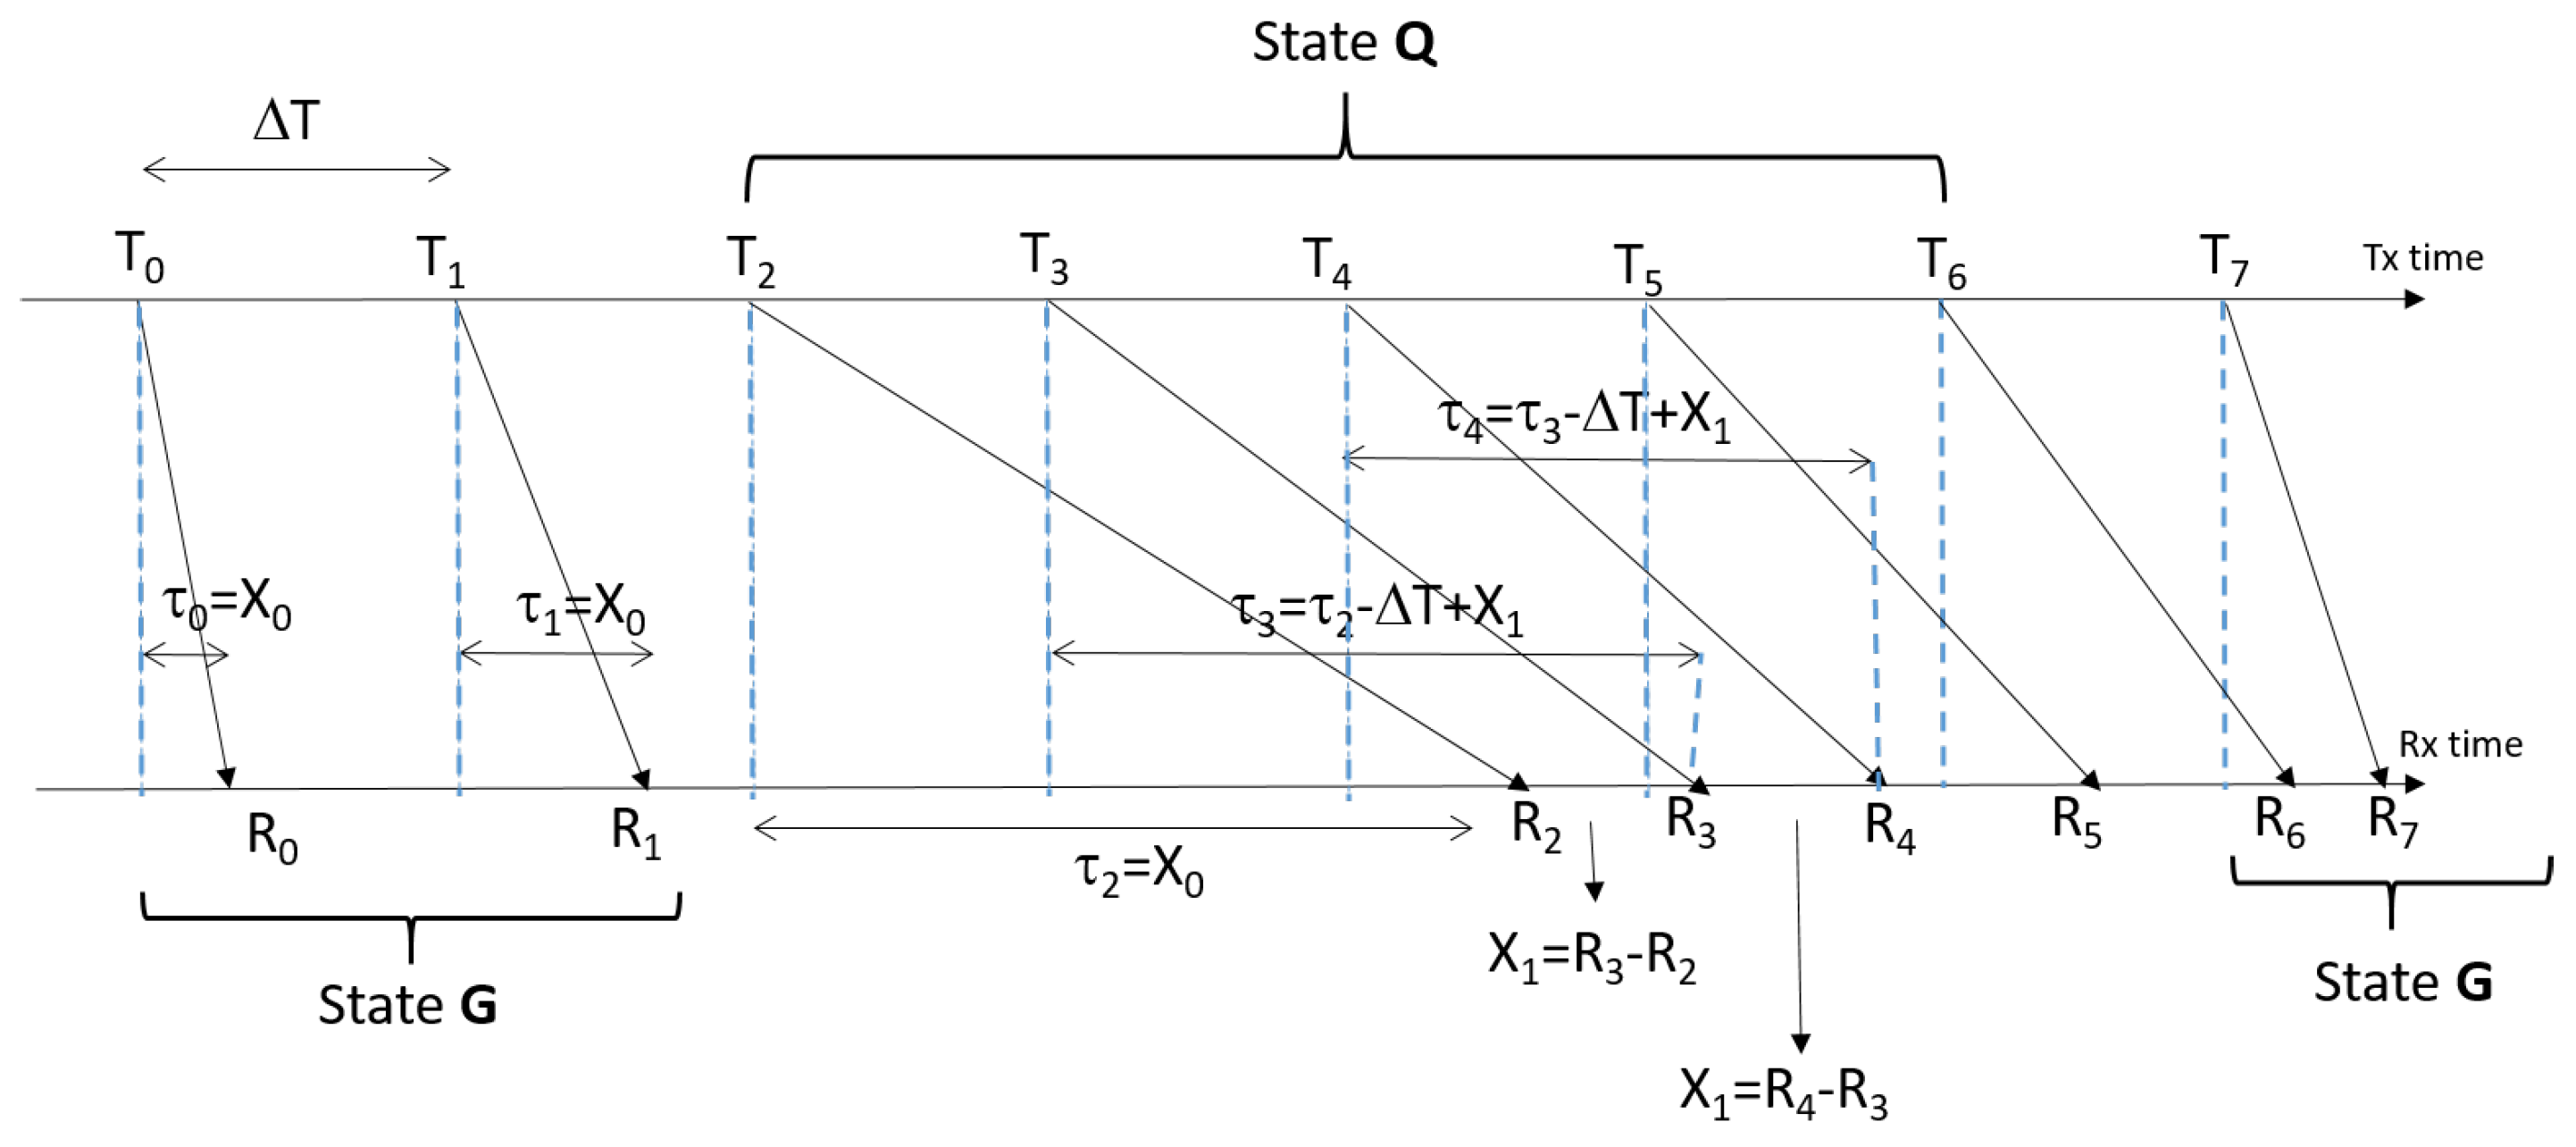
The events associated to G and Q states (discussed in the previous section) can be represented using the time diagram in Figure 6. The diagram reports the transmit and the corresponding receive times of each (single) message on two separate time axes.
Indicating with the receive time of the i-th message and the corresponding transmit time, in the simple case in Figure 6, the inequality is representative of buffering condition leading to transition in the Q state and causing (small or high) spikes in the E2E delay. Starting from the considerations in the previous section, the time scheme in Figure 6 is now used to derive the E2E delay model.
E2E Delay Model
The proposed E2E delay model relates the receive time of the generic i-th message with the corresponding transmit time as:
where is the E2E delay. The proposed model allows for generating the stochastic process modeling the occurrence of the events discussed in the previous section.
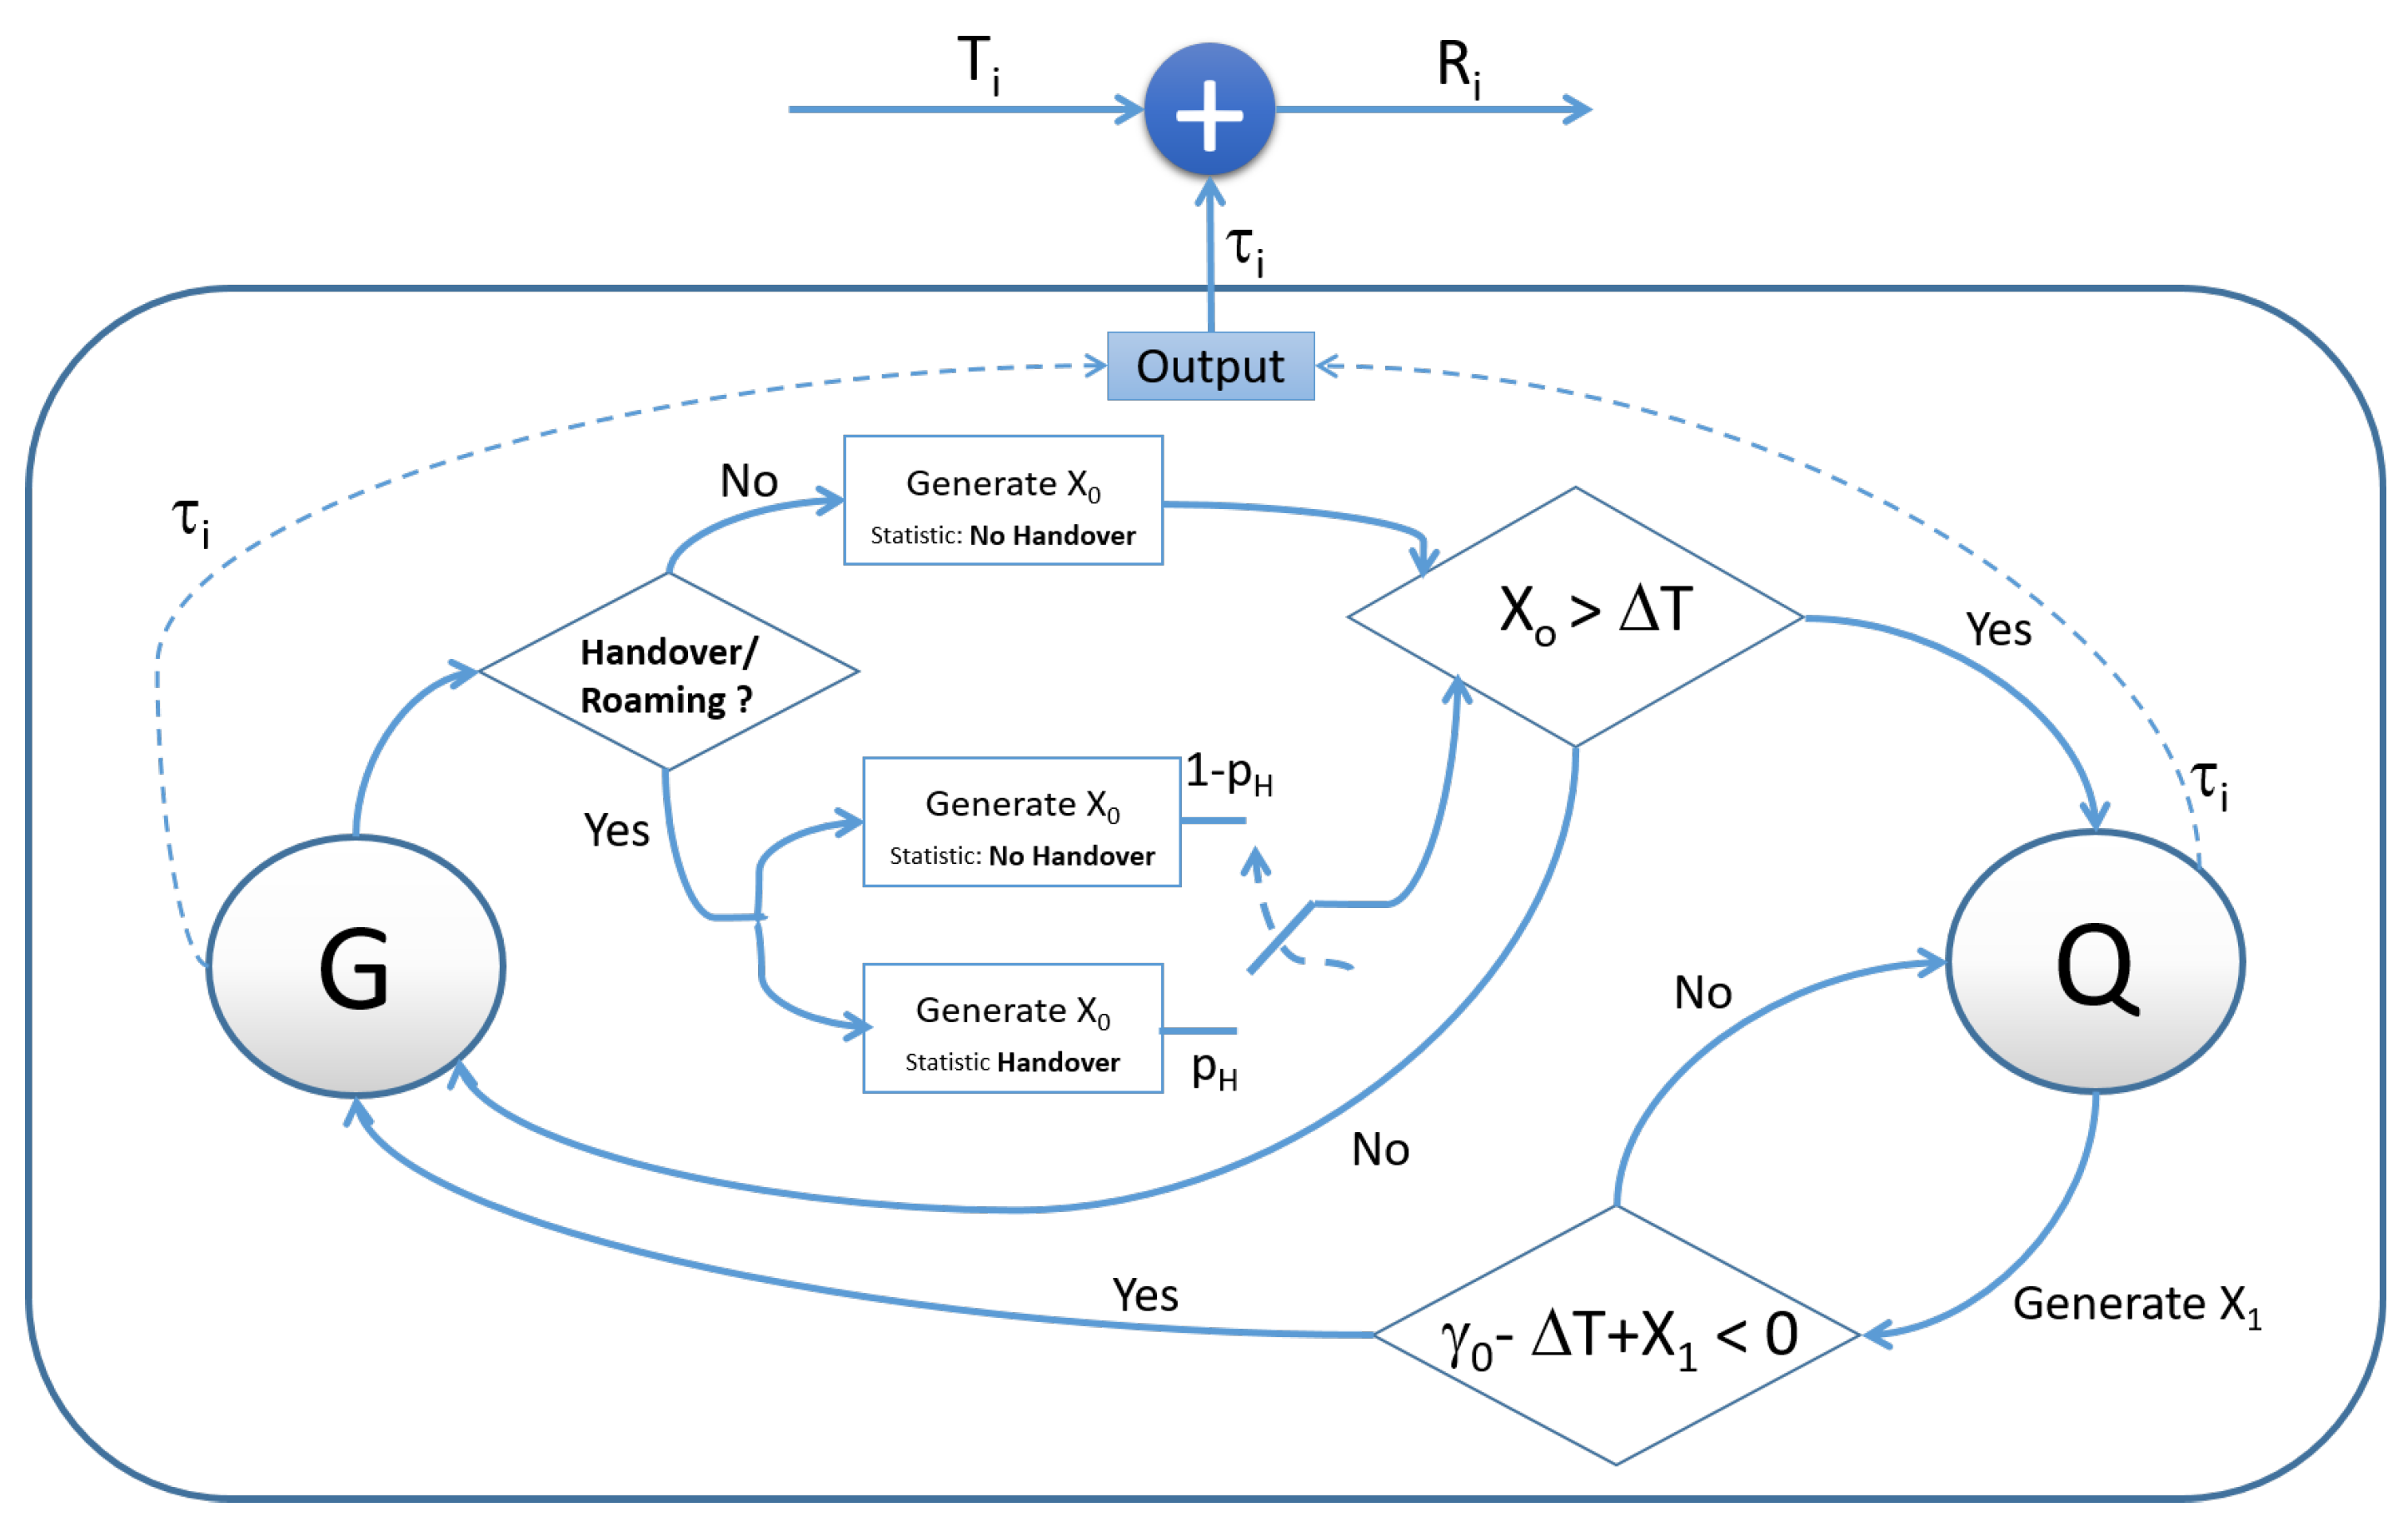
The E2E delay for the i-th transmitted message is generated in accordance with the two states model in Figure 7.
The operations of the two states diagram are detailed in the pseudo-code reported in the following listing:
- Initialize the message generation counter ;
- Set initial channel state variable to G i.e., ;
- Start E2E delay calculation for each time instant ( is the lowest time interval considered for the generation of messages);
- If ,
- For a given position of the train along the line, the received power and the serving radio technology, generate one sample of the random variable (the statistic of will be detailed in the following of this section) accounting for (possible) handover situation as follows:
- -
- if Handover is OFF, generate in accordance with the statistics of in the non-handover case (see after);
- -
- if Handover is ON, with probability , generate in accordance with the statistics of in the handover case (indicated with , see after), else generate in accordance with the statistics of in the non-handover case (see after);
- given the generated ,
- -
- if , set , set , , ;
- -
- if , set , set , , .
- if
- For a given position of the train along the line, the received power and the serving radio technology, generate one sample of the random variable (the statistic of will be detailed in the following of this section);
- Calculate (recursion formula);
- Set , ;
- Given
- -
- if (exit from state Q at the next iteration), set ;
- -
- if , set (stay in state Q for the next iteration and update delay calculation), .
- go to 4
Random variables or are generated every independently of the transmission times of messages from the railway applications. The statistics of and have been differentiated in accordance with the received power level and the selected radio technology. As shown in the two states model diagram in Figure 7, transition from state G to Q is triggered by . In particular, when , the G to Q transition occurs. This is accounted for in the model by the tails of the statistics of , and , which are derived in the next section. When the channel is in state Q, its behavior is regulated by the random variable . The condition triggers the saw-tooth like behavior observed experimentally. The pseudo-code defining the model behavior in state Q implements the following recursive formula:
This is used to evaluate the E2E delay of the message taking into account the buffering (see Figure 6) in the transmitter. In this figure, the relations between the E2E delays and with and have been made evident. Equation (3) has been implemented in the pseudo-code of the Q state, by using the two dummy variables and .
Finally, from Figure 6, it is not difficult to determine the exit condition from the Q state i.e., leads to transition from state Q to state G.
5. Usage of the Proposed E2E Delay Model
The proposed E2E delay model could be used in association with an ERTMS/ETCS traffic simulator (not discussed in this paper) to assess values for the Key Performance Indicators (KPIs) envisaged for the train control procedures on local/regional lines. Railway applications in the EVC and RBC exchange position report (PR) (from EVC to RBC) and movement authorization (MA) messages (from RBC to EVC), while the train is moving on the railway line. Euroradio protocol [21] is commonly adopted to guarantee the required safety level over the radio link. The E2E delay of each PR/MA message is evaluated in accordance with the proposed E2E model. We further assume that the message can be lost with probability , obtained from experimental data, and that loss events are assumed to be statistically independent.
The scheme in Figure 8 shows one possible utilization of the proposed model inside a simulator.
The considered channel model can be implemented as a (software) process running independently by the generation of the messages of the railway applications. Every time a message is generated from the railway application the channel process is interrogated to return the E2E delay associated to the generated message. The E2E delay is added to the transmission time to obtain the receive time in accordance with Equation (2). The channel state is updated at regular time interval . In our case, we assume ms, which is the time interval between two consecutive messages used in the measurement campaign. As outlined in the previous section, model parameters have been related to the radio coverage characteristics over the railway line (e.g., locations of roaming/handover areas and positions of the tunnels, if any), to the received power level and to the serving radio technology. It should be observed that, in realistic simulation setting, PR and MA messages are continuously exchanged between the EVC and RBC for controlling the train speed. Thus, the time instants the train passes over the handover areas or enter/exit the tunnel should be updated step by step accounting for the train speed variations. The main effect of train speed in the simulation can be related to the variation in the received power, which in turn influences the statistics of the random variables () and as detailed in the next section. As shown in Figure 8, the E2E model can use information from the topology database of the (selected) railway line; it can use measurements/estimates of the received power at the train/BS and information on the radio technology at a specific location. The topology database should contain information on the presence of tunnels. Furthermore, preliminary radio coverage analysis of the line (possibly accounting for the presence of one or more MNOs over the area) is necessary to assess the positions and extensions of the handover/roaming areas and possible coverage holes. In the absence of radio coverage, connection is lost so that the process generating the E2E delays is suspended and re-activated when the train exits from the coverage hole.
In an even more realistic simulation setting, train mobility pattern is influenced by the content of the MA message issued by the RBC in accordance with the current traffic on the railway network. For this reason, in Figure 8, we have assumed that the contents of MA messages could be used to modify train mobility. Finally, KPIs can be recorded at the application level to assess performance.
6. Results
Results presented in this section have been derived from the available experimental data representative of the selected railway line. However, the following considerations are general and can be extended to any rail line.
6.1. Statistics of the Random Variables , and
For each trial, we have collected the values of the E2E delay for each one of the transmitted and received messages.
In the selected tracks, we had two tunnels having lengths of about 600 m and km. It has been observed the shortest tunnel didn’t cause any signal loss. At the time of the trial, the longest tunnel was not served by any radio technology. Data corresponding to message generation rate of 5 msg/s have been considered to derive the statistics of , and . Furthermore, the (mean) received power and the indication of the serving radio technology are available for each . For data analysis and classification of statistics, the original experimental data set of the E2E delays have been initially partitioned into three sub-sets on the basis of the serving radio technology: WCDMA 2100, WCDMA 900 and GSM 900 (see Figure 3). Then, E2E delays in each sub-set have been further partitioned by grouping data into the following four received power level intervals: dBm, dBm dBm, dBm dBm and dBm. For each group in each sub-set, state transition from G to Q have been identified using the condition (see Figure 6). E2E delays measured during transitions have been collected to determine the statistics of . To obtain the statistics of in each data group, we have also identified the time instants corresponding to handover events and we have collected the corresponding E2E delays. Handovers (soft or hard) are short time events and occur only a few times, especially when the train is moving on rural/open areas where base stations have large area coverages. We have identified handover events searching for the time instants where the received power inverts its tendency i.e., passing from (monotonically) decrease to (monotonically) increase. Some examples are indicated in Figure 3. In some cases during handover/roaming events, we have observed no enqueue of messages. This fact has been accounted for by the probability in the model. Unfortunately, due to lack of information on the exact handover/roaming time, estimation of is not accurate.
In Figure 9, we plot the Probability Density Functions (PDFs) of the random variables and obtained from experimental data that have been ranked by technology and the received power interval.
From Figure 9, the PDF of is centered about some hundreds of milliseconds and its tails tend to increase with the lowering of the received power i.e., in the low power case the probability of having larger E2E delays increases and this could be due to the reduced transmission rate experienced by the terminal. This proves the (slight) correlation between E2E statistics and the received power level. Larger E2E delays have been observed in the GSM 900 technology case. This is due to the lower data rate provided by GSM with respect to WCDMA 2100 and WCDMA 900. To better make evident the (non-zero) probability of achieving E2E delays of tens of seconds, we have used the log-log scale in the graphs in Figure 9. Fortunately, these events are rare and this causes the unstable behavior of the distribution tails.
The dependence on the received power level can even be observed in the statistics. E2E delays due to handover events are on the order of some hundreds of ms with high probability, especially in the case of WCDMA 2100 and WCDMA 900 where soft-handover occurs. Instead, as expected, the probability of recording E2E delays larger than 1 s is higher in the GSM 900 case. Due to the reduced number of collected E2E data for statistics, we observe instabilities in the corresponding distributions especially at received power levels below dBm.
In Figure 10, we report the PDFs of the random variable obtained from experimental data ranked by technology and by the received power interval.
From Figure 10, the experienced E2E delays are about 200 ms, showing that, most of the time, the behavior of the channel is almost regular in the Q state. Furthermore, the left-tails show that when the link bit rate of the radio channel is larger than the minimum required to transmit one message before another is generated by the application, more than one enqueued message can be transmitted at the same time, thus causing rapid emptying of the queue. From a practical point of view, it means that the received time associated to enqueued messages can be lower than 200 ms. The can also assume values even greater than 10 s with non-zero probability as shown in the log-log scale graphs in Figure 10.
Statistics of , and have been obtained from about of the E2E delay samples measured with days. The remaining E2E experimental samples have been used for validation (see the next section).
Before concluding this section, we would like to point out some aspects concerning the extension of the proposed E2E model to other railway scenarios. For the application of the model, it is important to have characterized the railway line in terms of the handover (roaming) points, the received power profile and the serving radio technologies over the line. These data can be measured and/or can be determined using typical radio planning tools. In this section, we have made evident that the variability of the statistics of , and can be (mainly) related to the previously considered rail line parameters. Since networks of different MNOs use similar technologies/apparatus in the radio access and the core, it is expected that they could offer similar performance. In particular, we could safely assume that every MNO should provide a message transport service with E2E delays similar to that measured during our campaign. Thus, it is reasonable to assume that the statistics for , and should be similar to that presented in this paper even when considering different MNOs.
6.2. Example of Model Application and Validation
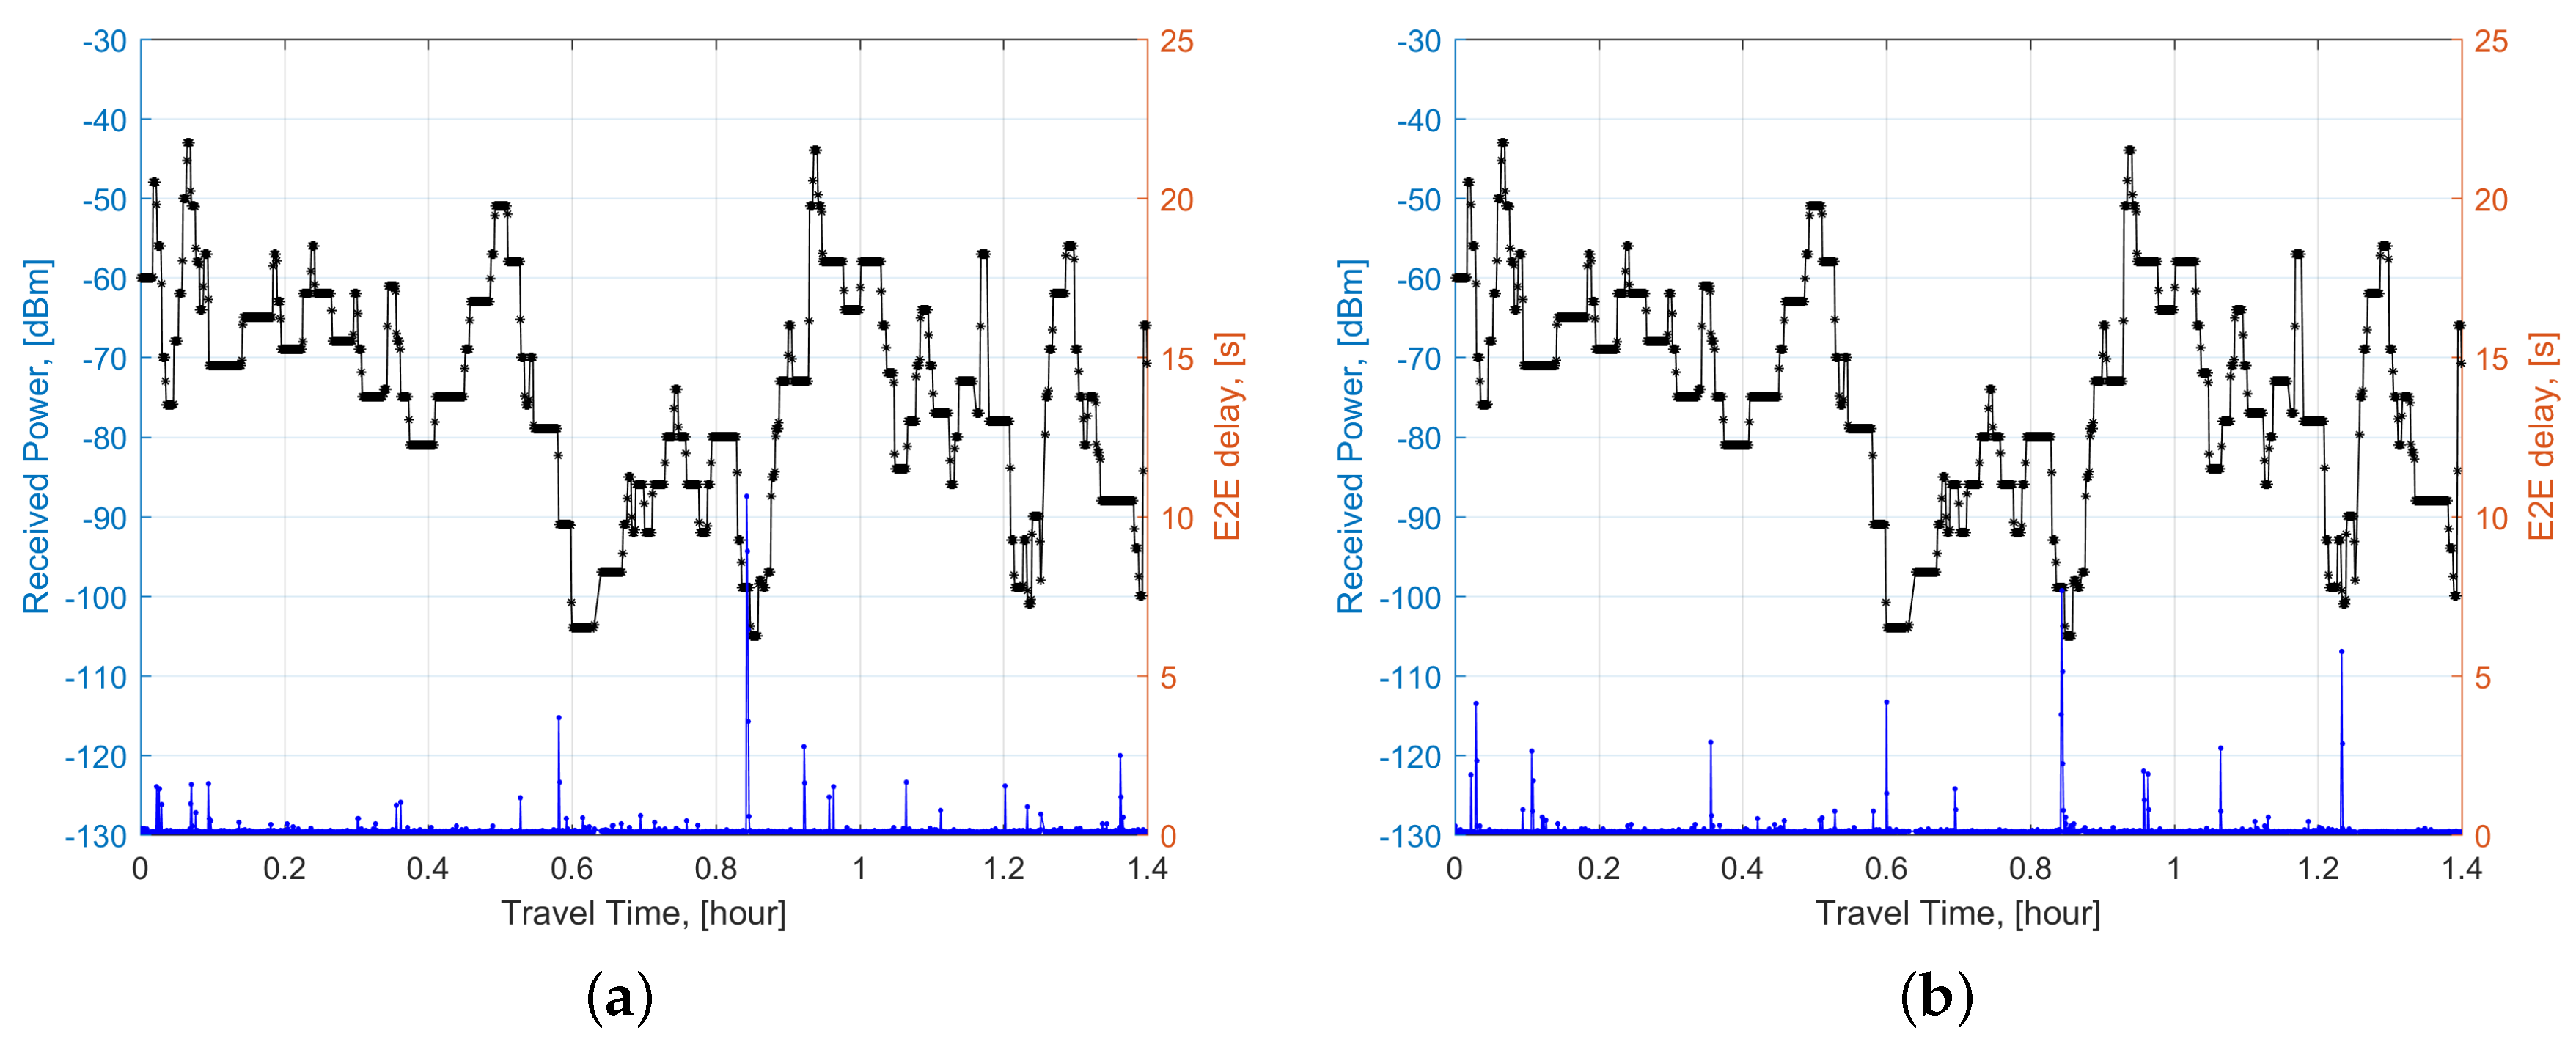
In this section, we provide an example of application of the proposed E2E model in a realistic railway scenario. The model is used to reproduce a situation similar to that depicted in Figure 3. For this purpose, we have considered one received power profile obtained from experimental data and we have first identified the handover points along the track. The E2E delay profile has been generated using the model described in Section 4. In particular, at each time instant integer multiple of ms, we have generated the E2E delay and results have been plotted in Figure 11a,b corresponding to two samples of the E2E process. To obtain results, we have assumed i.e., in the case of handover message, queueing always occurs. The random variables, , and have been generated numerically in accordance with the statistics in Figure 9 and Figure 10, respectively. For simplicity, we have restricted the generation of the E2E delays to the case of one radio technology i.e., the WCDMA 2100; furthermore, no (sporadic) message loss has been considered.
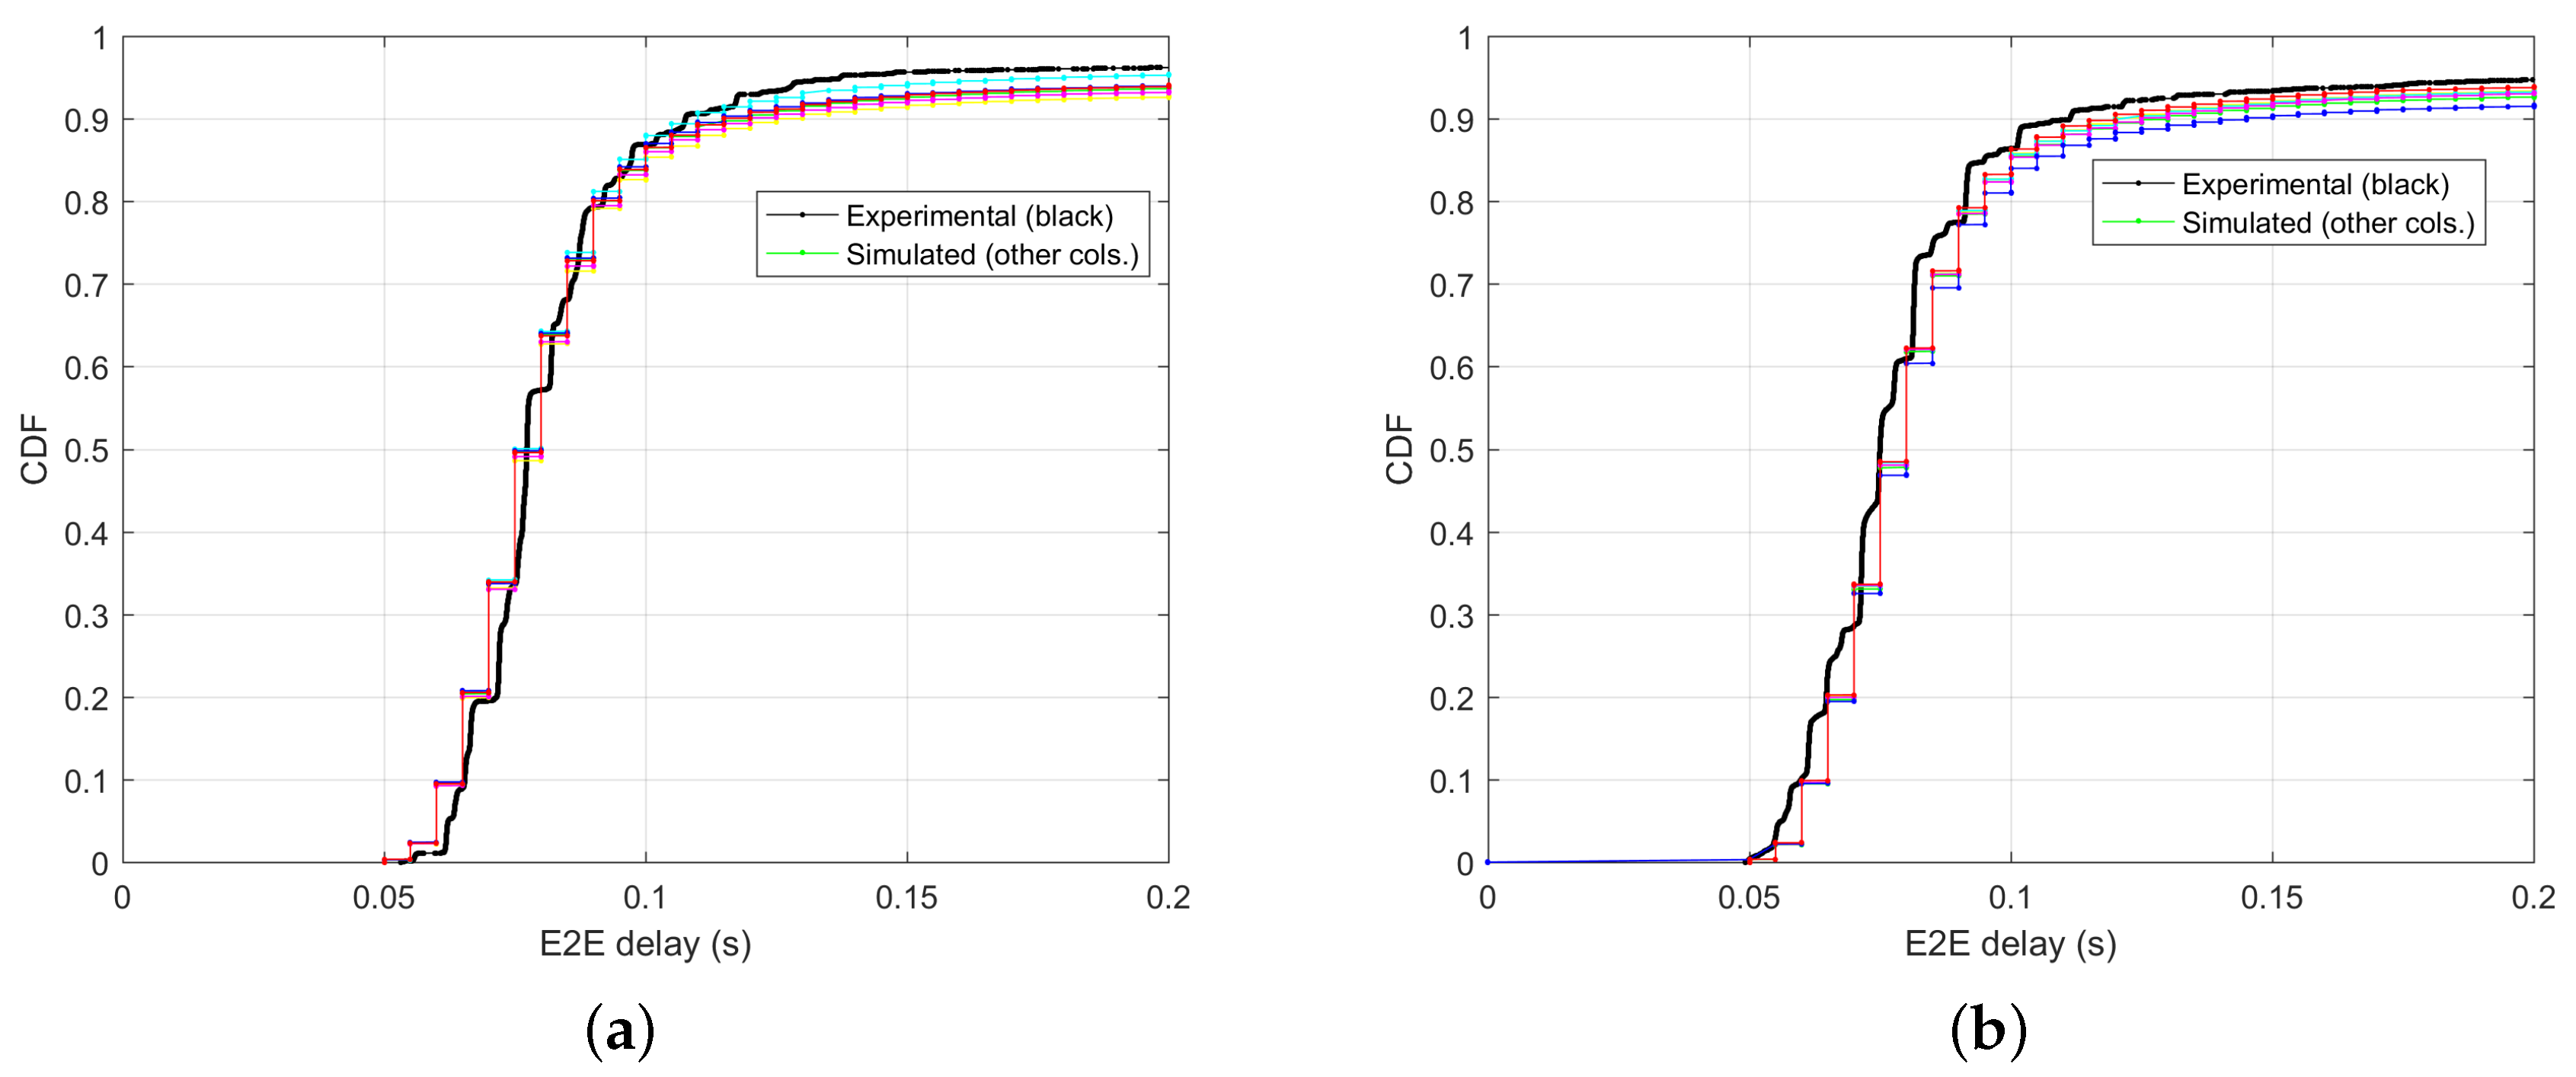
The generated E2E delay behavior can reproduce the main features observed in the experimental data in Figure 3. As expected, low received power levels usually determine the enqueue of messages. In order to validate the proposed model in Figure 12a,b, we compare the Cumulative Density Function (CDF) of the E2E delay from experimental data with the CDFs of the E2E delay obtained by running the proposed model. Results have been achieved considering the same railroad section as in Figure 11 in two different days. The two scenarios are characterized by (partially) different received power profiles along the track and partially different time instants of handover. For each scenario, we have run the proposed E2E delay model several times. The model has been driven by the power profile and handover positions obtained from the corresponding experimental data. To generate the E2E delays, we have used the PDFs of , and indicated in the previous section.
Results obtained from the model (curves with different colors) show a very good agreement with experimental data (black curve) i.e., the CDFs of E2E delay obtained from model are close to the corresponding experimental CDF. Negligible discrepancies obtained for very small E2E delays can be due to statistical instabilities of the PDF of .
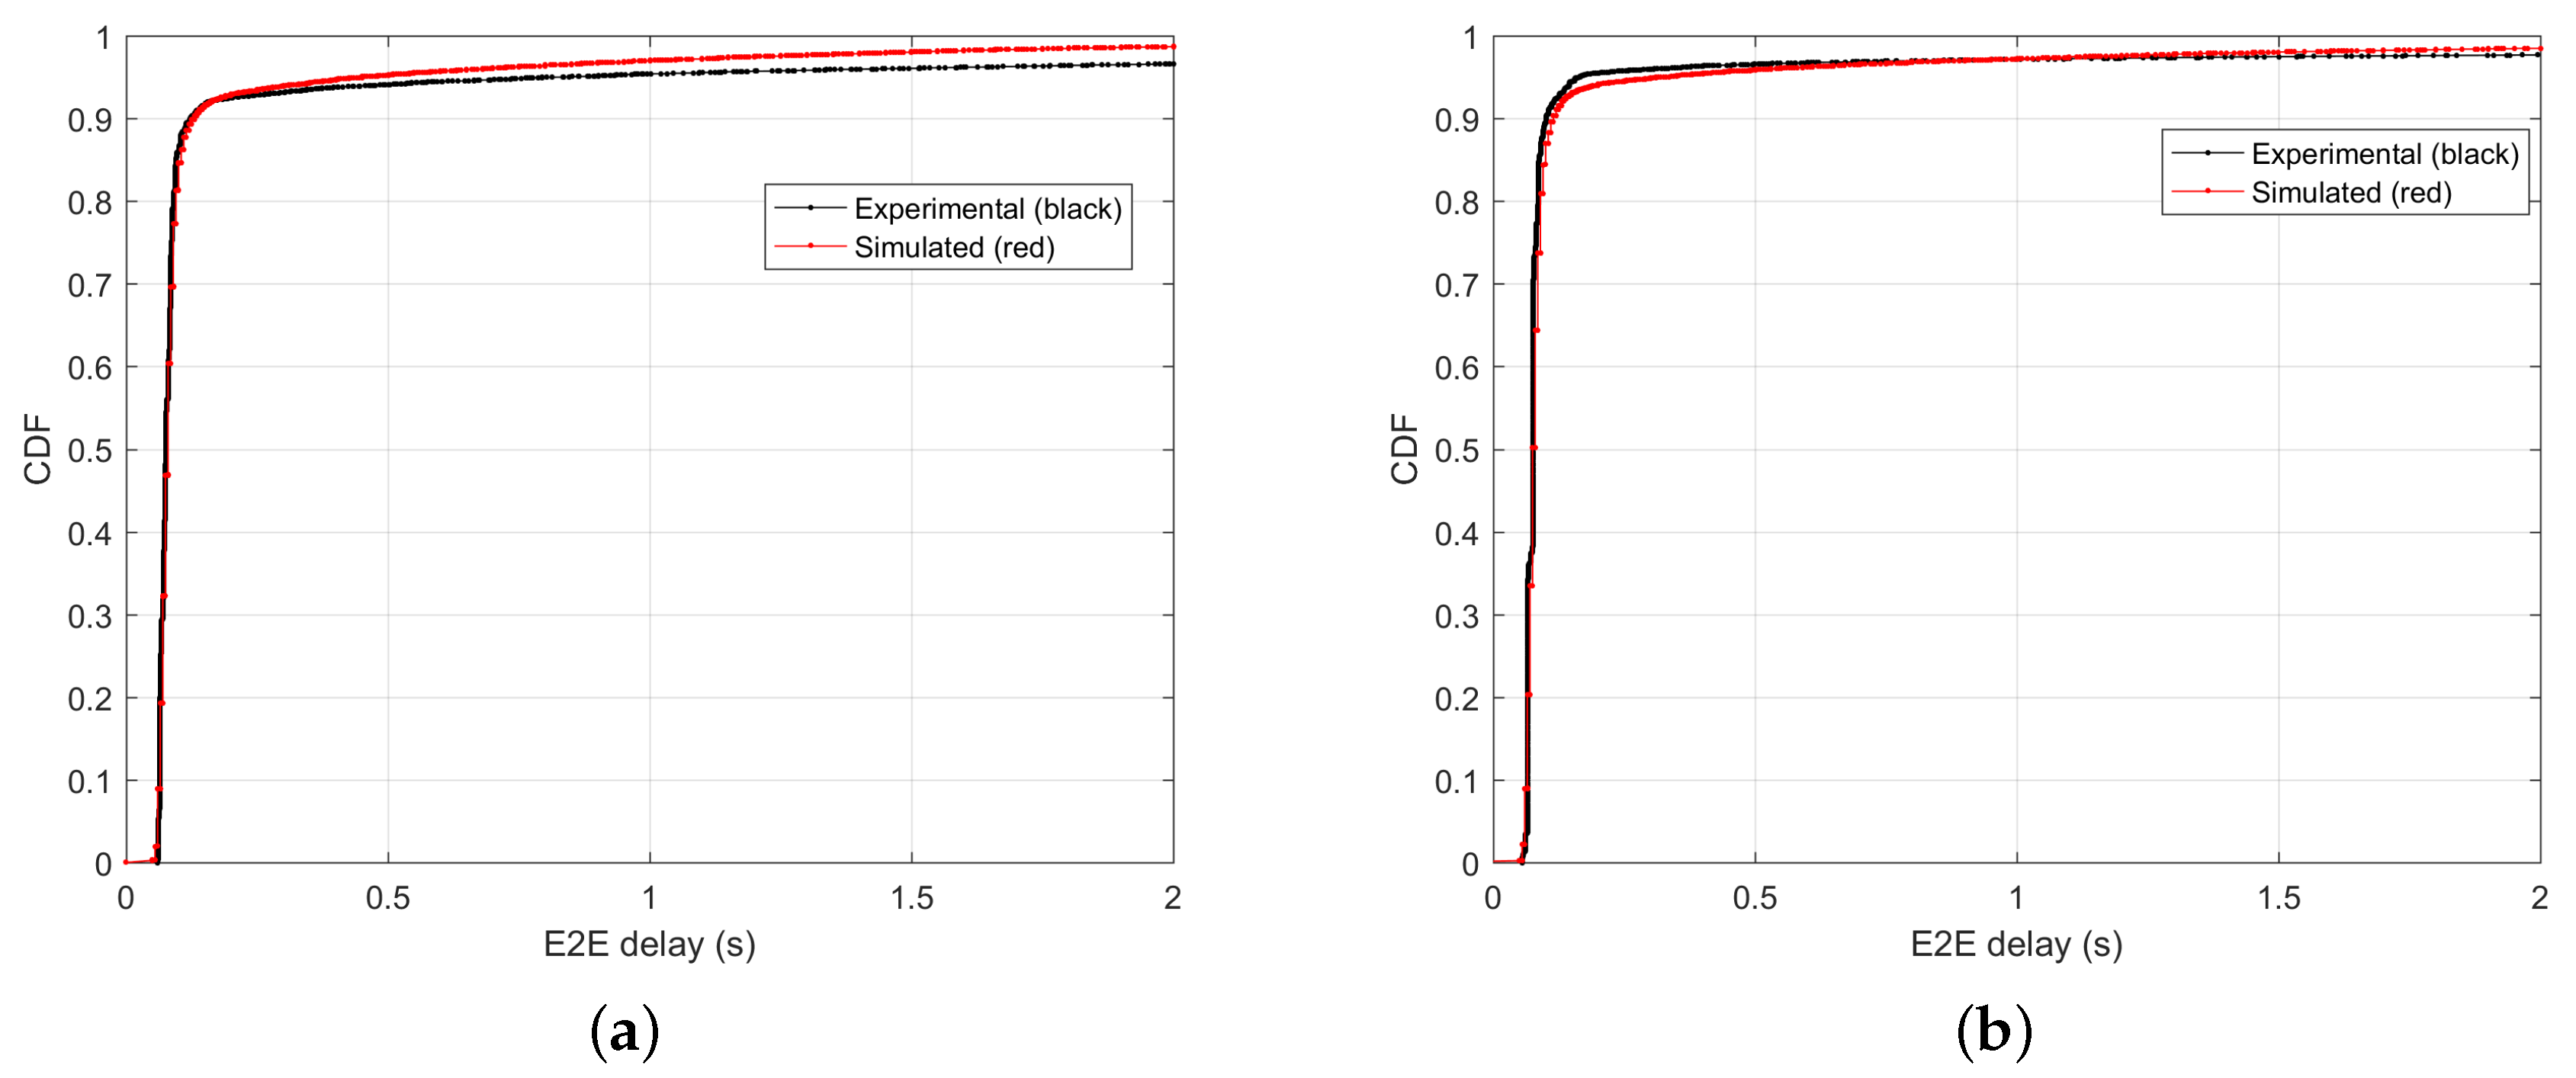
In Figure 13, we plot the CDF of the E2E delays obtained from the model after having collected all the E2E delays generated in each sample.
Results in the figure make evident the good agreement between experimental and model-based results even for large E2E delays (e.g., up to seconds).
We have repeated validation in the railroad section corresponding to the time interval 2.4 h–3.2 h in Figure 3. This part of the rail track is characterized by handovers/roaming mainly between WCDMA 2100 and WCDMA 900. The statistics of the random variables , and used to generate the E2E delays are those in Figure 9 and Figure 10.
In Figure 14, we compare the CDFs of the E2E delays generated by the model (curves with different colors) with those obtained from experimental data (black curve) on the same rail track and corresponding to two different days. All available radio technologies are considered.
In Figure 15, we compare the CDF of the E2E delays obtained from the model after having collected the E2E delays of each generated sample.
Even in these cases, we have obtained a good agreement between experimental and simulated CDFs, thus confirming the effectiveness of the proposed model.
7. Conclusions
We have presented an original two states model for the generation of the E2E delay of messages transmitted to/from train for control (ERTMS/ETCS) and communications. The model structure has been derived from the behavioral analysis of the E2E delay profiles obtained from experimental data collected during the 3InSat EU project campaign. The model allows for simply reproducing the E2E delay behavior and its first order statistics observed from experimental data. Model parameters have been related to the received power, the serving radio technology and handover events along the line. In principle and in the absence of further data, the statistics of the random variables driving the model could be assumed to be independent of the MNO. This allows for applying the model to other railway scenarios, provided the line has been adequately characterized in terms of the received power, handover points and radio technologies. An example of application of the model to a realistic railway scenario has been presented in this paper. Finally, the model can be easily re-adapted to analyse performance on any local/regional railway line possibly served by the same radio technologies available on the test rail line.
As a future roadmap, it would be of interest to repeat the measurement campaign to include LTE technology not available during the first campaign. Since the proposed model explicitly accounts for the selected radio technology, it is not difficult to integrate the statistics of the random variables for the LTE case in the proposed model.
Acknowledgments
This work has been done in the frame of the 3InSat project; Radiolabs has been responsible for the Telecom test campaign. The authors wish to thank ESA (Paris, France), RFI (Rome, Italy), Trenitalia (Rome, Italy), Vodafone Italia (Italy), Telespazio (Rome, Italy), Triagnosys (Wessling, Germany) and DLR (Cologne, Germany).
Author Contributions
These authors contributed equally to this work.
Conflicts of Interest
The authors declare no conflict of interest.
References
- Elia, M. What is the future of telecommunications in rail? In Proceedings of the RAILTEL Europe, Vienna, Austria, 27–29 February 2012. [Google Scholar]
- Moreno, J.; Riera, J.M.; de Haro, L.; Rodríguez, C. A Survey on Future Railway Radio Communications Services: Challenges and Opportunities. IEEE Commun. Mag. 2015, 10, 62–68. [Google Scholar] [CrossRef]
- Ai, B.; Guan, K.; Rupp, M.; Kürner, T.; Cheng, X.; Yin, X.-F.; Wang, Q.; Ma, G.-Y.; Li, Y.; Xiong, L.; et al. Future Railway Services-Oriented Mobile Communications Network. IEEE Commun. Mag. 2015, 10, 78–85. [Google Scholar] [CrossRef]
- Tien Dat, P.; Kanno, A.; Yamamoto, N.; Kawashaki, T. WDM RoF-MMW and Linearly Located Distributed Antenna System for Future High-Speed Railway Communications. IEEE Commun. Mag. 2015, 10, 86–94. [Google Scholar]
- Taberner, T. How the Internet of Things Will Change the Way We Monitor the Railways. White Paper Eurotech. 2016. Available online: http://www.eurotech.com/dla/Library/WP/Eurotech-White-Paper-Rail-Solutions-FINAL.pdf (accessed on 10 November 2017).
- Evolution of GSM-R. ERA/2014/04/ERTMS/OP. 2015. Available online: http://www.era.europa.eu/Document-Register/Documents/IDATEEvolutionofGSMRFINALReportforERA.pdf (accessed on 10 November 2017).
- Kim, J.; Choi, S.W.; Song, Y.; Yoon, Y.; Kim, Y. Automatic Train Control over LTE: Design and Performance Evaluation. IEEE Commun. Mag. 2015, 10, 102–109. [Google Scholar] [CrossRef]
- Mazzenga, F.; Giuliano, R.; Neri, A.; Rispoli, F. Integrated Public Mobile Radio Networks/Satellite for Future Railway Communications. IEEE Wirel. Commun. 2017, 2, 90–97. [Google Scholar] [CrossRef]
- InteGRail: Intelligent Integration of Railway Systems, Project No. FP6-012526. 2016. Available online: www.integrail.info; www.integrail.eu (accessed on 10 November 2017).
- RobustRail Project. 2016. Available online: http://www.robustrails.man.dtu.dk (accessed on 10 November 2017).
- Railenium Project: Railway Infrastructure and Its Interfaces. 2011. Available online: http://railenium.eu/en/the-irt/ (accessed on 10 November 2017).
- Satloc Project: Satellite Based Operation and Management of Local Low Traffic Lines. 2012. Available online: http://satloc.uic.org/Project-summary (accessed on 10 November 2017).
- Sniady, A.; Kassab, M.; Soler, J.; Berbineau, M. LTE Micro-cell Deployment for High-Density Railway Areas. Int. Workshop Commun. Technol. Veh. 2014, 8435, 143–155. [Google Scholar]
- Guan, K.; Zhong, Z.; Ai, B. Assessment of LTE-R using high speed railway channel model. In Proceedings of the 3rd International Conference Communications Mobile Computing, Qingdao, China, 18–20 April 2011; pp. 461–464. [Google Scholar]
- Parichehreh, A.; Spagnolini, U. Seamless LTE connectivity in High Speed Trains. In Proceedings of the IEEE Wireless Communication and Networking Conference, Istanbul, Turkey, 6–9 April 2014; pp. 2067–2072. [Google Scholar]
- Sniady, A.; Soler, J.; Kassab, M.; Berbineau, M. Ensuring Long-Term Data Integrity. IEEE Veh. Technol. Mag. 2016, 2, 60–70. [Google Scholar] [CrossRef]
- Zhou, T.; Tao, C.; Salous, S.; Liu, L.; Tan, Z. Channel Sounding for High-Speed Railway Communication Systems. IEEE Commun. Mag. 2015, 10, 70–77. [Google Scholar] [CrossRef]
- ESA. 3InSat Project Description. 2014. Available online: https://artes-apps.esa.int/projects/3insat (accessed on 10 November 2017).
- Mazzenga, F.; Giuliano, R.; Neri, A.; Rispoli, F.; Ruggeri, A.; Salvitti, M.; Del Signore, E.; Fontana, V. The Adoption of Public Telecom Services for the Evolution of the ERTMS-ETCS Train Control Systems: Challenges and Opportunities. Commun. Technol. Veh. 2015, 9066, 177–188. [Google Scholar]
- Cota, N.; Serrador, A.; Vieira, P.; Beire, A.R.; Rodrigues, A. On the Use of Okumura—Hata Propagation Model on Railway Communications. Wirel. Pers. Commun. 2017, 93, 726–736. [Google Scholar] [CrossRef]
- Alcatel; Alstom; Ansaldo Signal; Bombardier; Invensys Rail; Siemens. Euroradio FIS. Subset-037, v. 2.3.0. 2005. Available online: http://www.era.europa.eu/Document-Register/Documents/Set-1-Index010-SUBSET-037v230.pdf (accessed on 10 November 2017).
Figure 1.
Test trial: (a) schematic diagram of the onboard architecture of the measurement system; (b) GPS and radio antennas on the train roof.
Figure 1.
Test trial: (a) schematic diagram of the onboard architecture of the measurement system; (b) GPS and radio antennas on the train roof.

Figure 2.
Delay components contributing to the overall end-to-end (E2E) delay between the transmitted and received messages—EVC to RBC link.
Figure 2.
Delay components contributing to the overall end-to-end (E2E) delay between the transmitted and received messages—EVC to RBC link.

Figure 3.
Example of the received power (left y−axis) and E2E delay (right y−axis) as a function of the travel time in (a). Corresponding zoomings are in (b,c). The red line indicates the duration of the time interval the train uses the radio technology as in the corresponding label (i.e., Wideband Code Division Multiple Access (WCDMA) 2100, WCDMA 900, GSM 900) for train to ground communications; the black line is the received power level measured by the on board terminal; the blue line is the measured E2E delay.
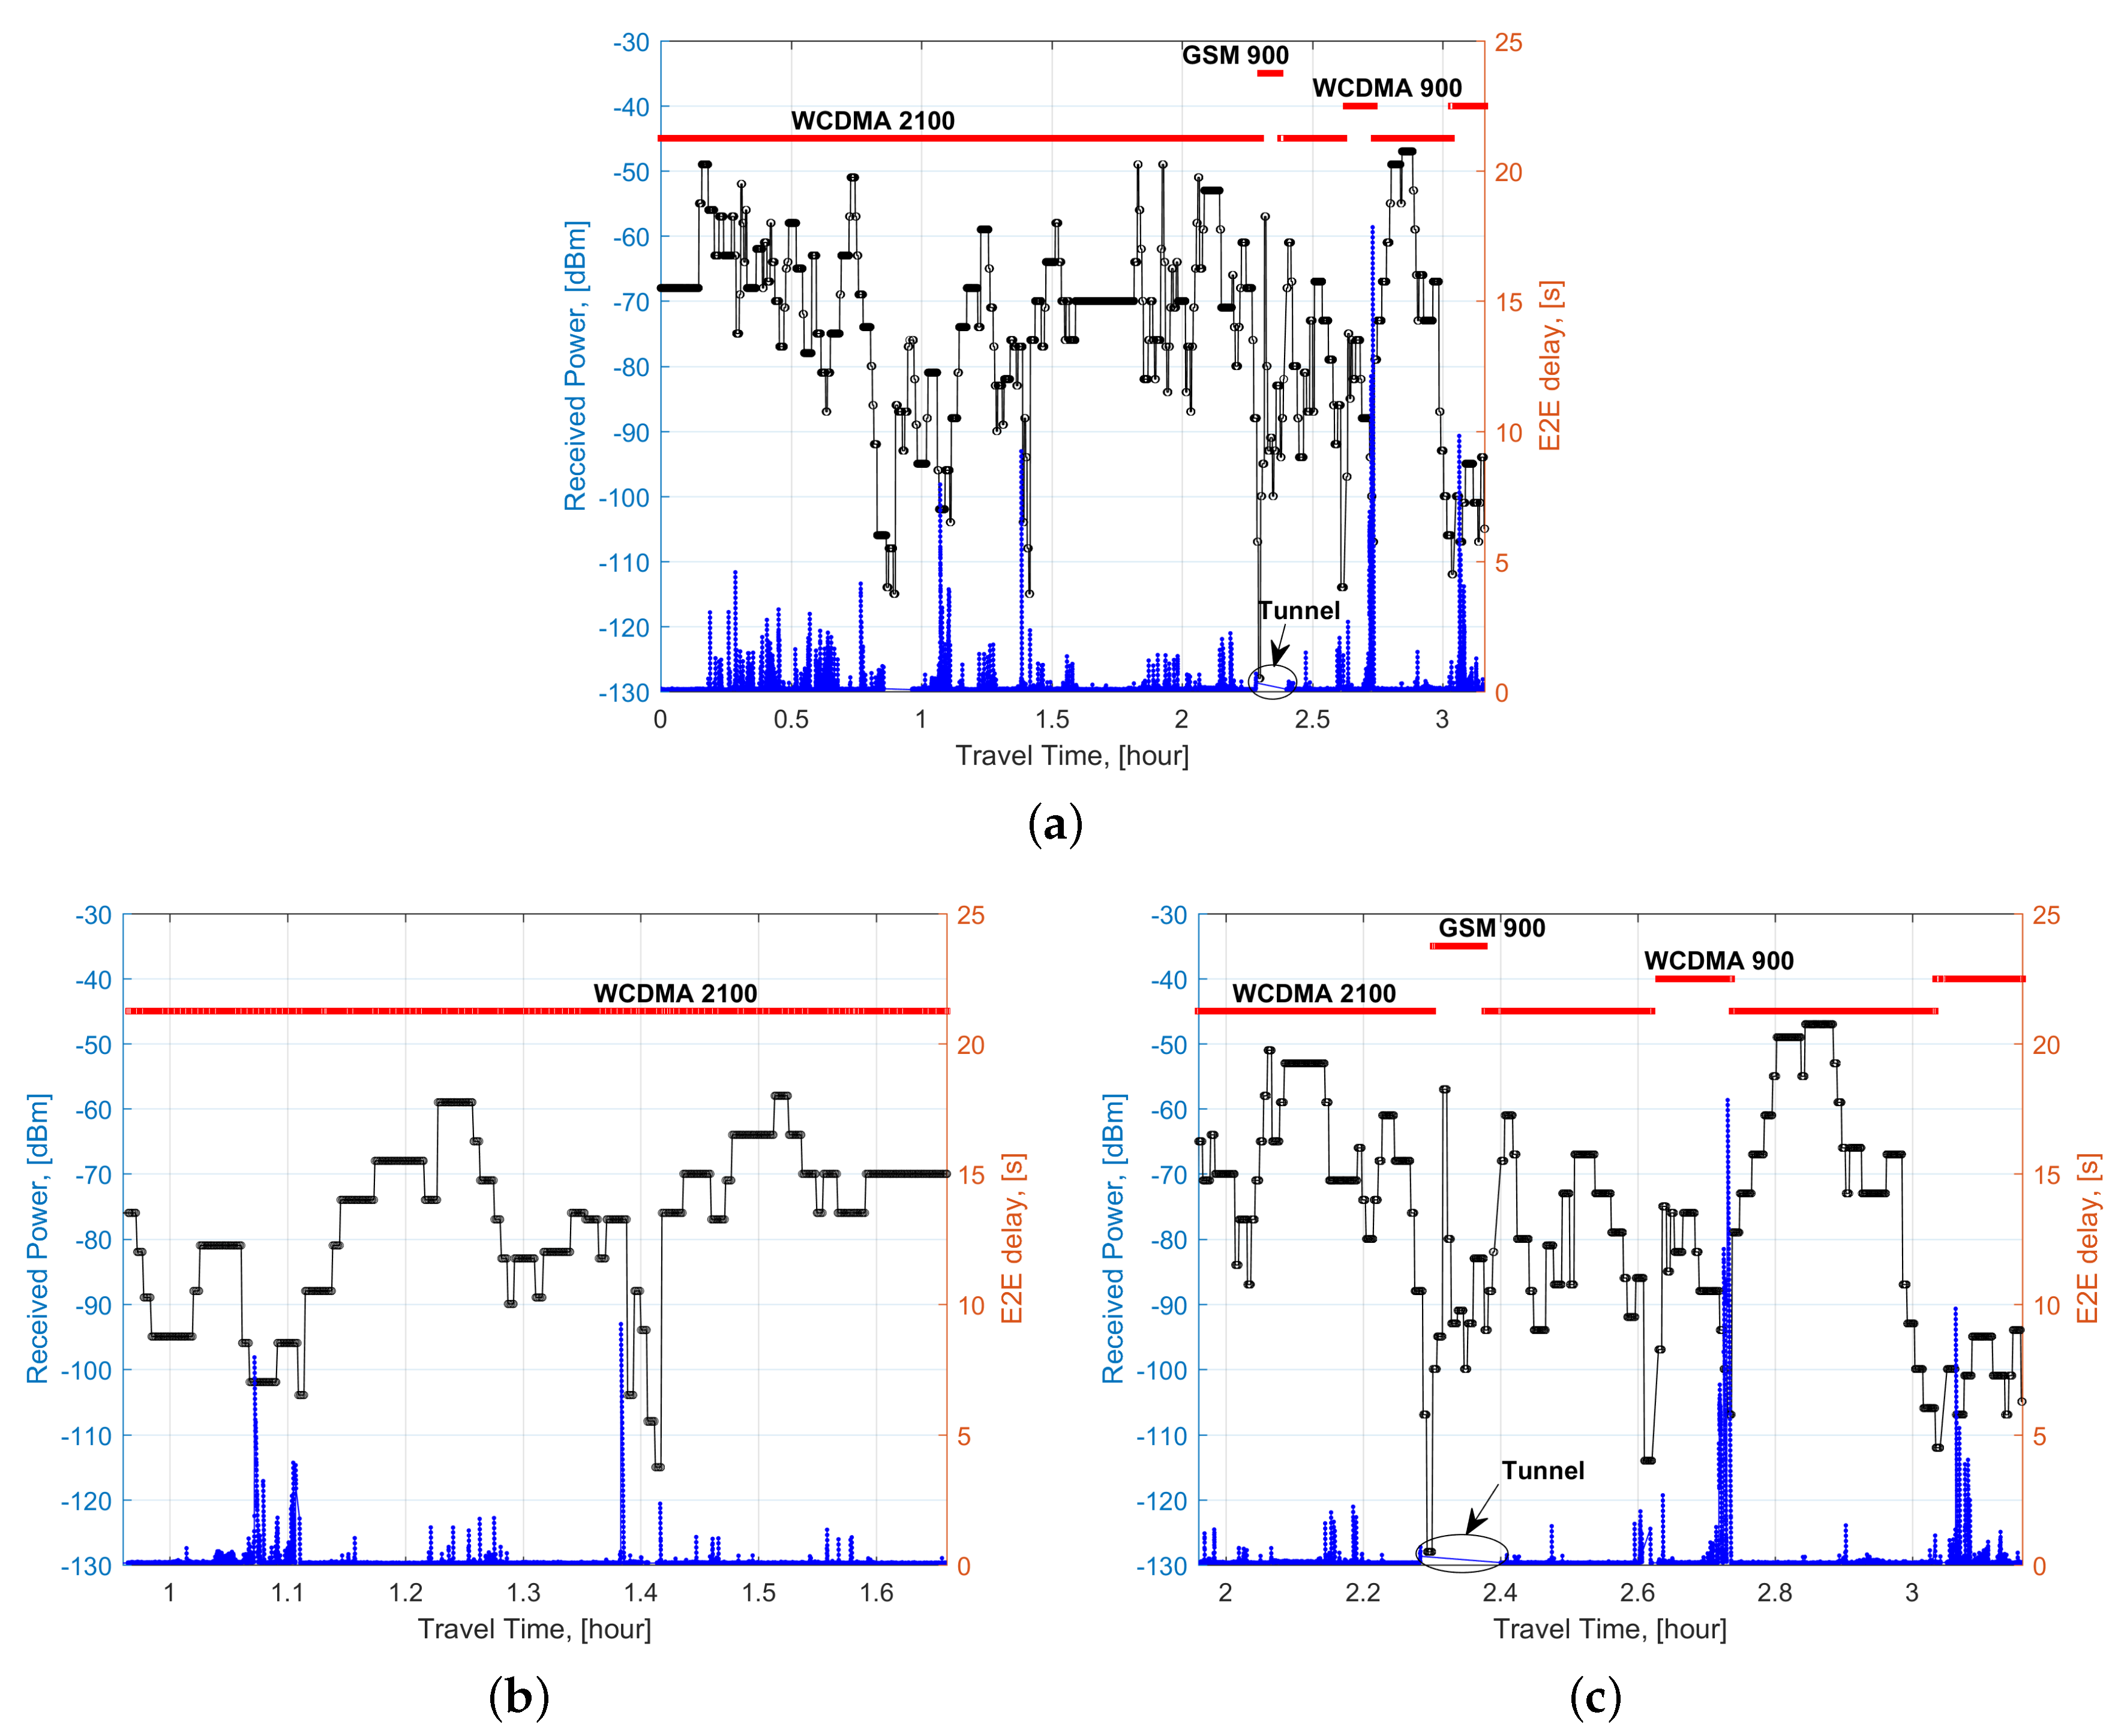
Figure 4.
E2E delay as a function of the message IDs. Each message is 500 bytes long; messages are generated at a constant rate of 5 msg/s i.e., one message every 200 ms.
Figure 4.
E2E delay as a function of the message IDs. Each message is 500 bytes long; messages are generated at a constant rate of 5 msg/s i.e., one message every 200 ms.

Figure 5.
Examples of saw-tooth like behavior for the message generation rate of 5 msg/s.

Figure 6.
Time-based representation of buffering (state Q) and direct transmission (state G) conditions in the channel.
Figure 6.
Time-based representation of buffering (state Q) and direct transmission (state G) conditions in the channel.

Figure 7.
Two states diagram of the proposed E2E delay model.

Figure 8.
Principle scheme for the usage of the proposed model for performance assessment.

Figure 9.
Probability Density Functions of the random variables and obtained from experimental data ranked by technology and the received power interval: and for WCDMA 2100 (a,b); and for WCDMA 900 (c,d); and for GSM 900 (e,f).
Figure 9.
Probability Density Functions of the random variables and obtained from experimental data ranked by technology and the received power interval: and for WCDMA 2100 (a,b); and for WCDMA 900 (c,d); and for GSM 900 (e,f).
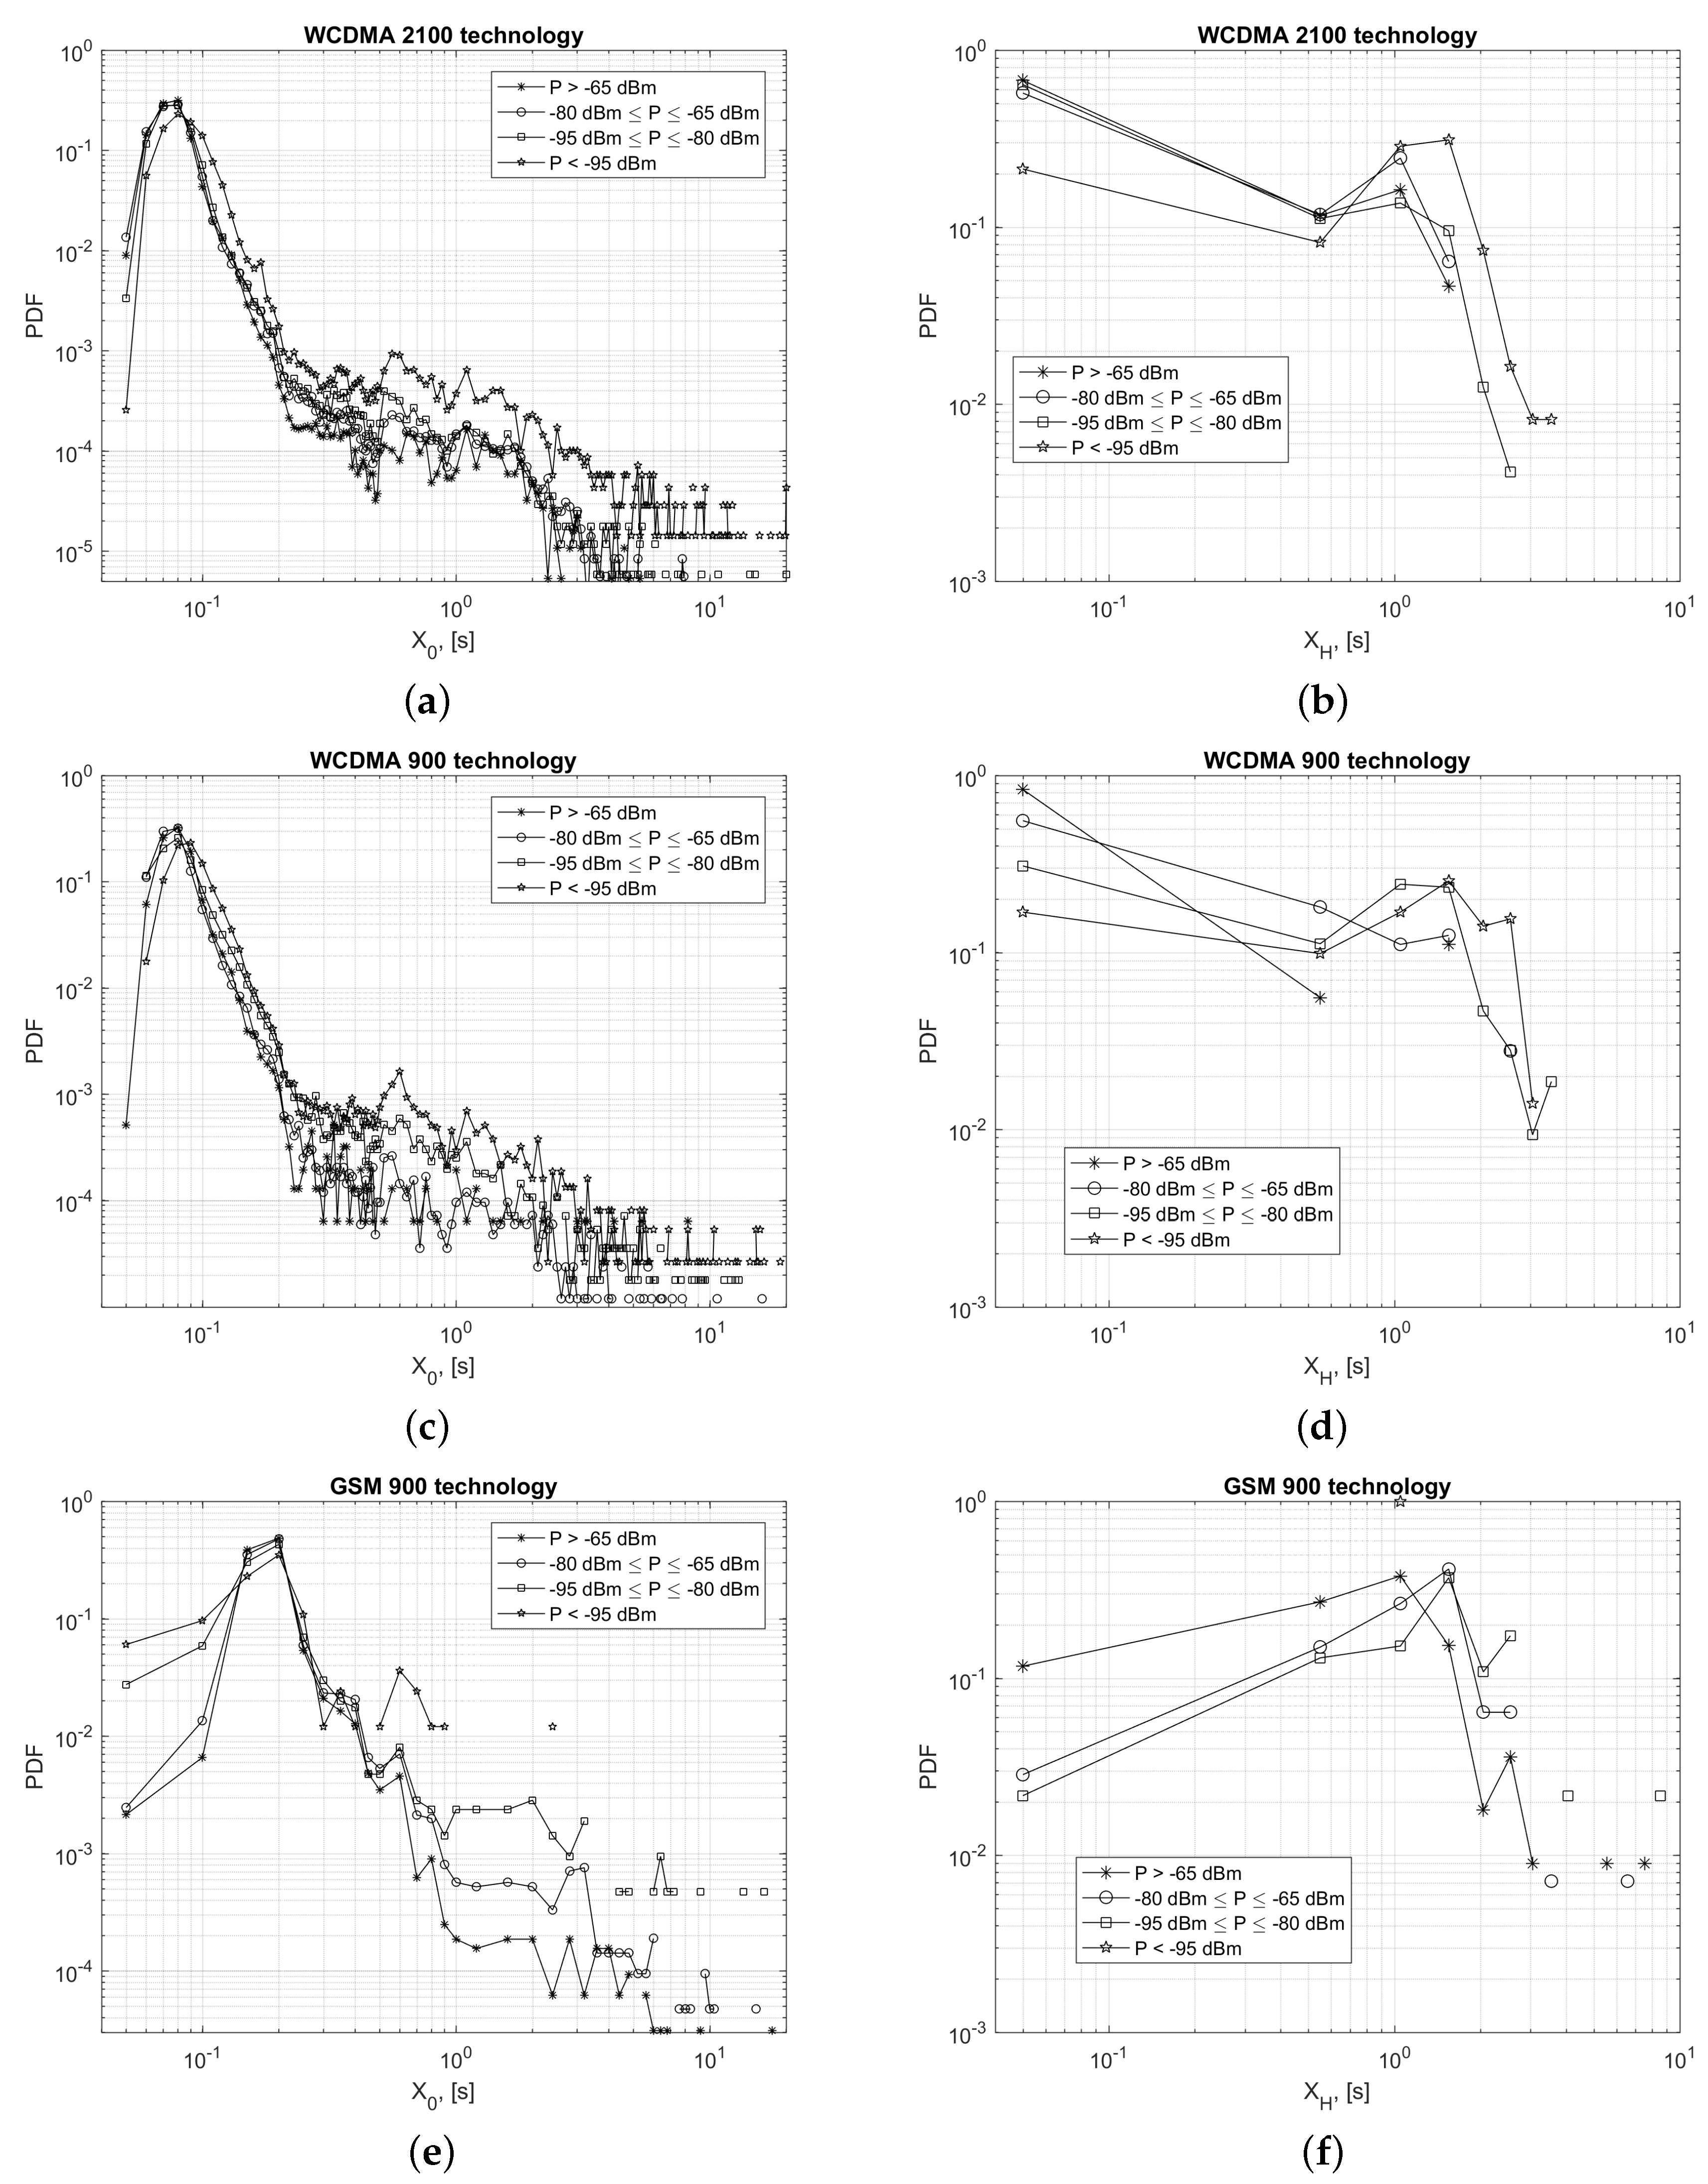
Figure 10.
Probability Density Functions of the random variable obtained from experimental data ranked by technology and the received power interval: WCDMA 2100 (a), WCDMA 900 (b), GSM 900 (c).
Figure 10.
Probability Density Functions of the random variable obtained from experimental data ranked by technology and the received power interval: WCDMA 2100 (a), WCDMA 900 (b), GSM 900 (c).
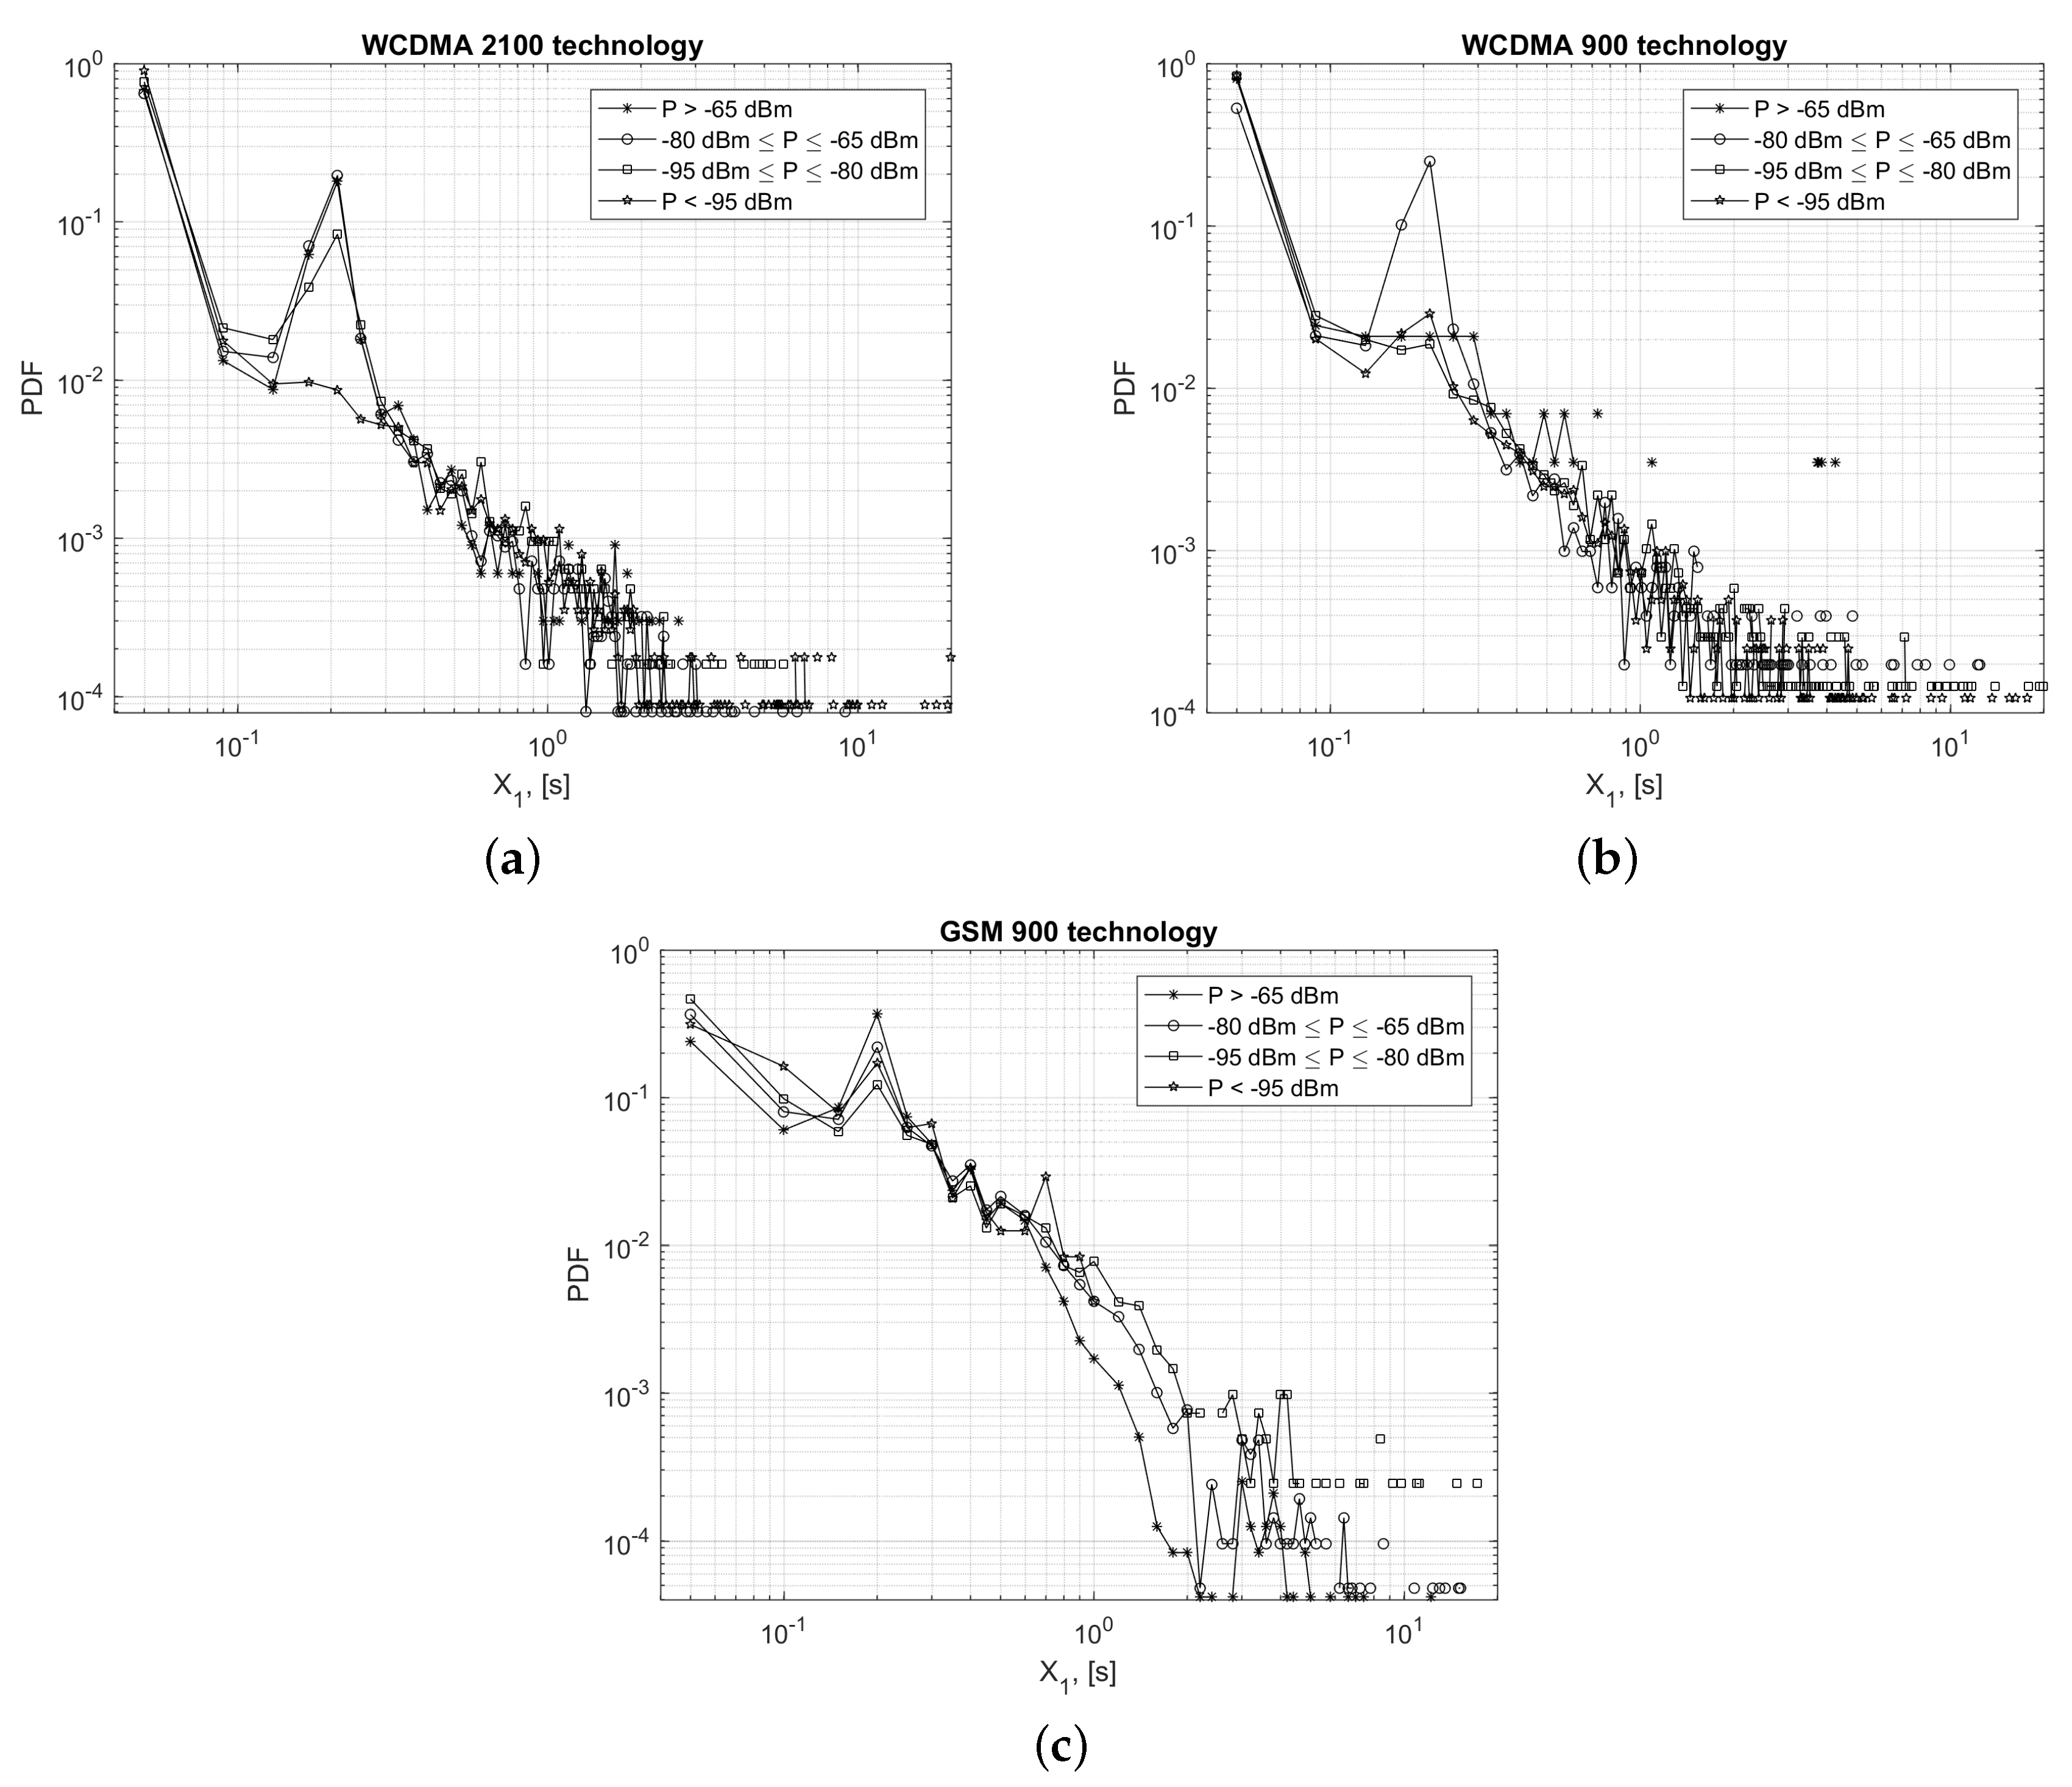
Figure 11.
Example of E2E delay generation based on a given received power profile and for a single technology (i.e., WCDMA 2100).
Figure 11.
Example of E2E delay generation based on a given received power profile and for a single technology (i.e., WCDMA 2100).

Figure 12.
Comparison of E2E delay Cumulative Density Function generated from the model with the corresponding experimental Cumulative Density Function: Two different measured samples on the same railway section (WCDMA 2100 technology only).
Figure 12.
Comparison of E2E delay Cumulative Density Function generated from the model with the corresponding experimental Cumulative Density Function: Two different measured samples on the same railway section (WCDMA 2100 technology only).

Figure 13.
Comparison of E2E delay CDF generated from the model after collecting E2E delays of each generated samples: Expanded time scale up to 2 s, two different experimental samples of the same railway section (WCDMA 2100 technology only).
Figure 13.
Comparison of E2E delay CDF generated from the model after collecting E2E delays of each generated samples: Expanded time scale up to 2 s, two different experimental samples of the same railway section (WCDMA 2100 technology only).
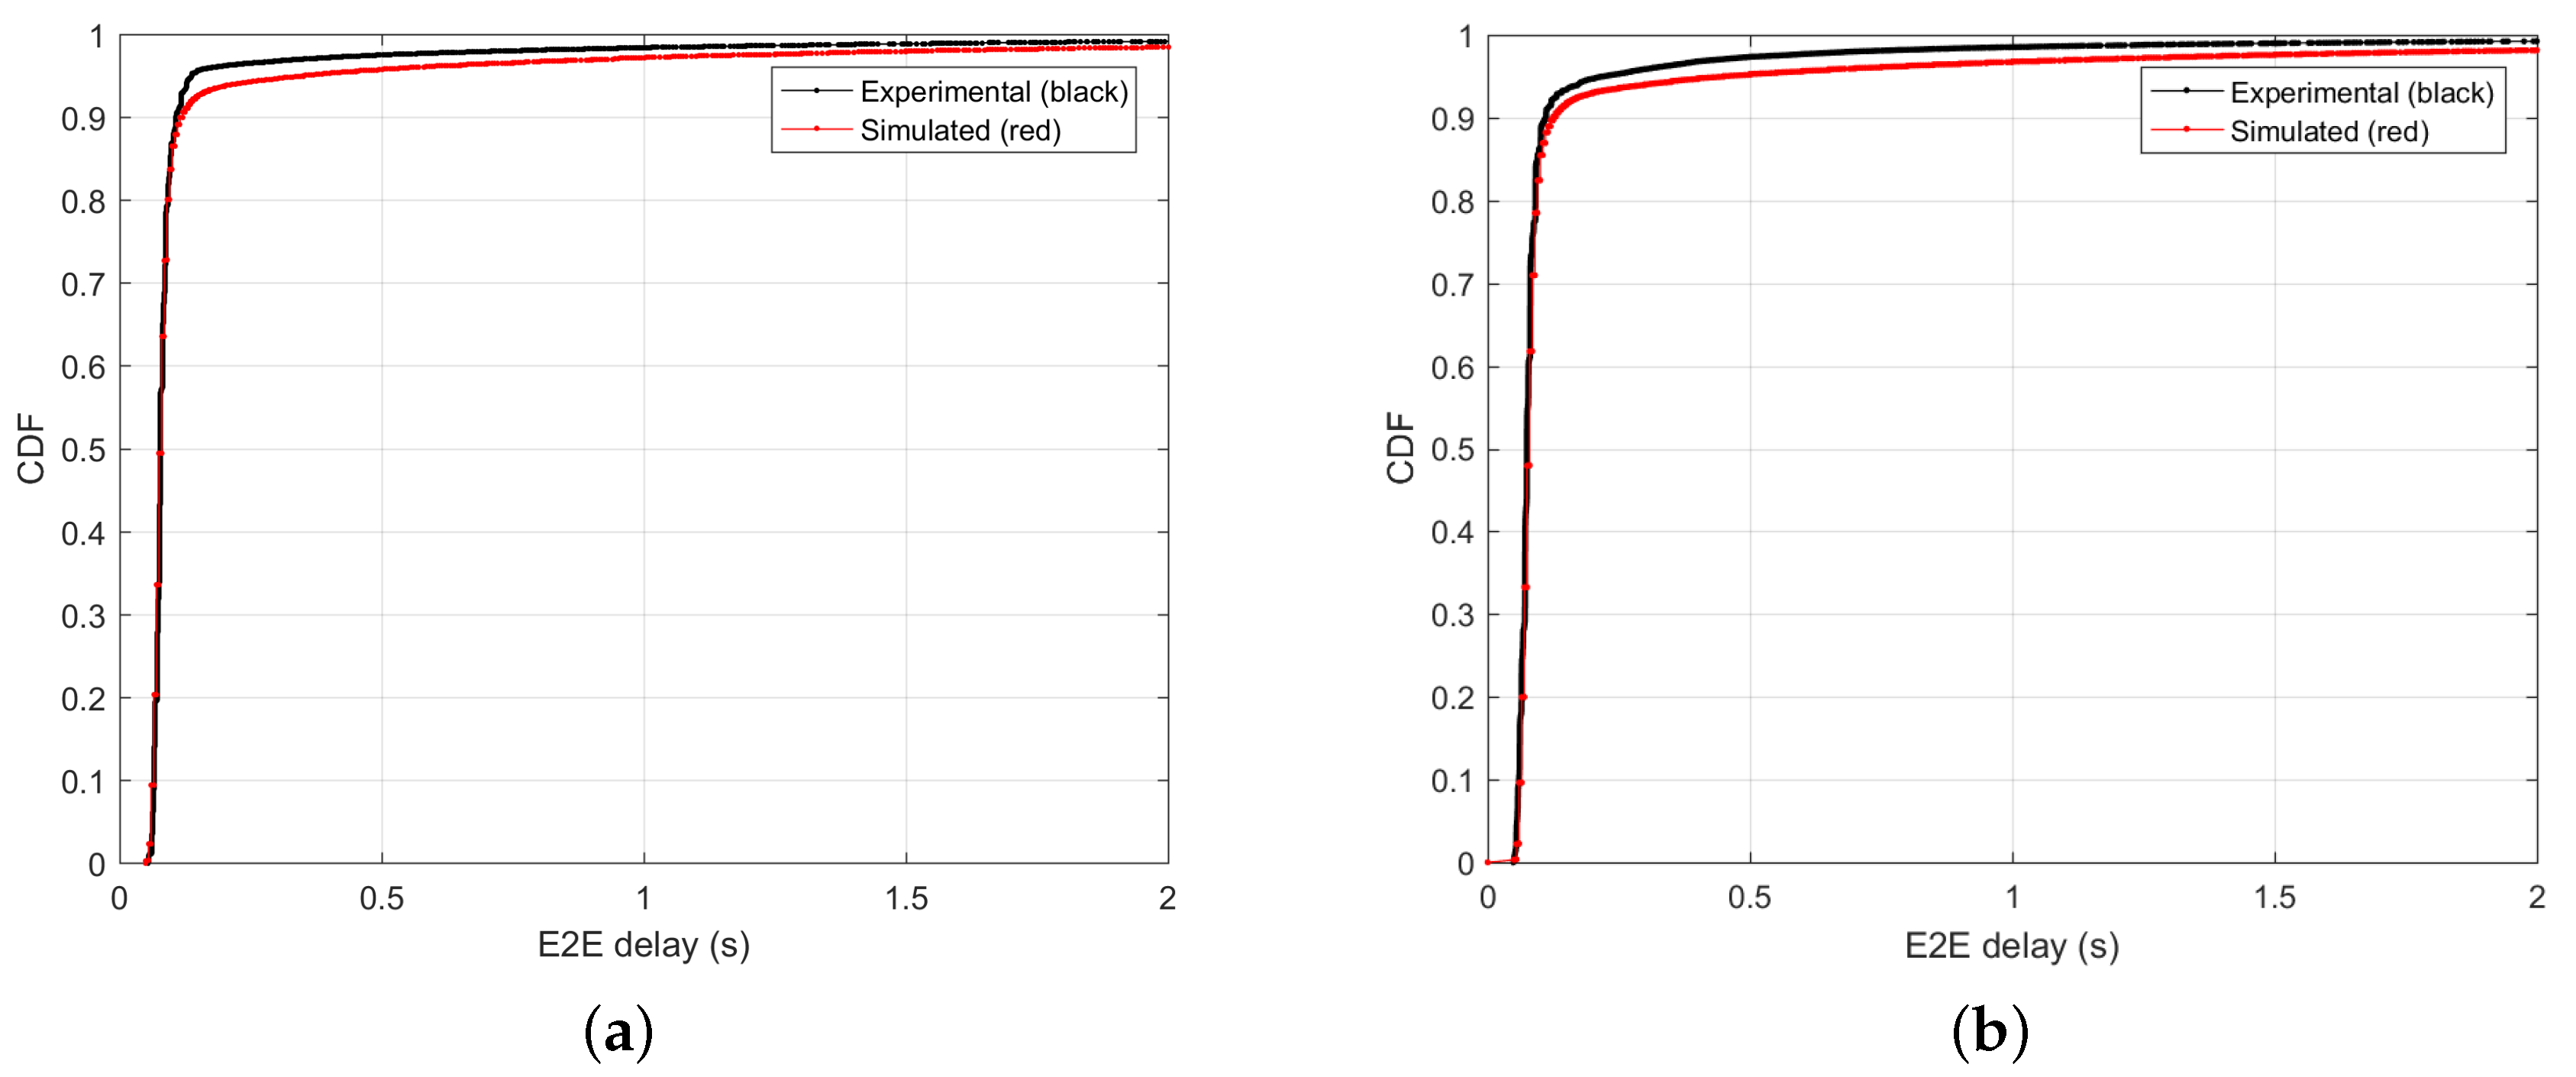
Figure 14.
Comparison of E2E delay CDF generated from the model with the corresponding experimental CDF: Two different measured samples on the same railway section (all available radio access technologies).
Figure 14.
Comparison of E2E delay CDF generated from the model with the corresponding experimental CDF: Two different measured samples on the same railway section (all available radio access technologies).
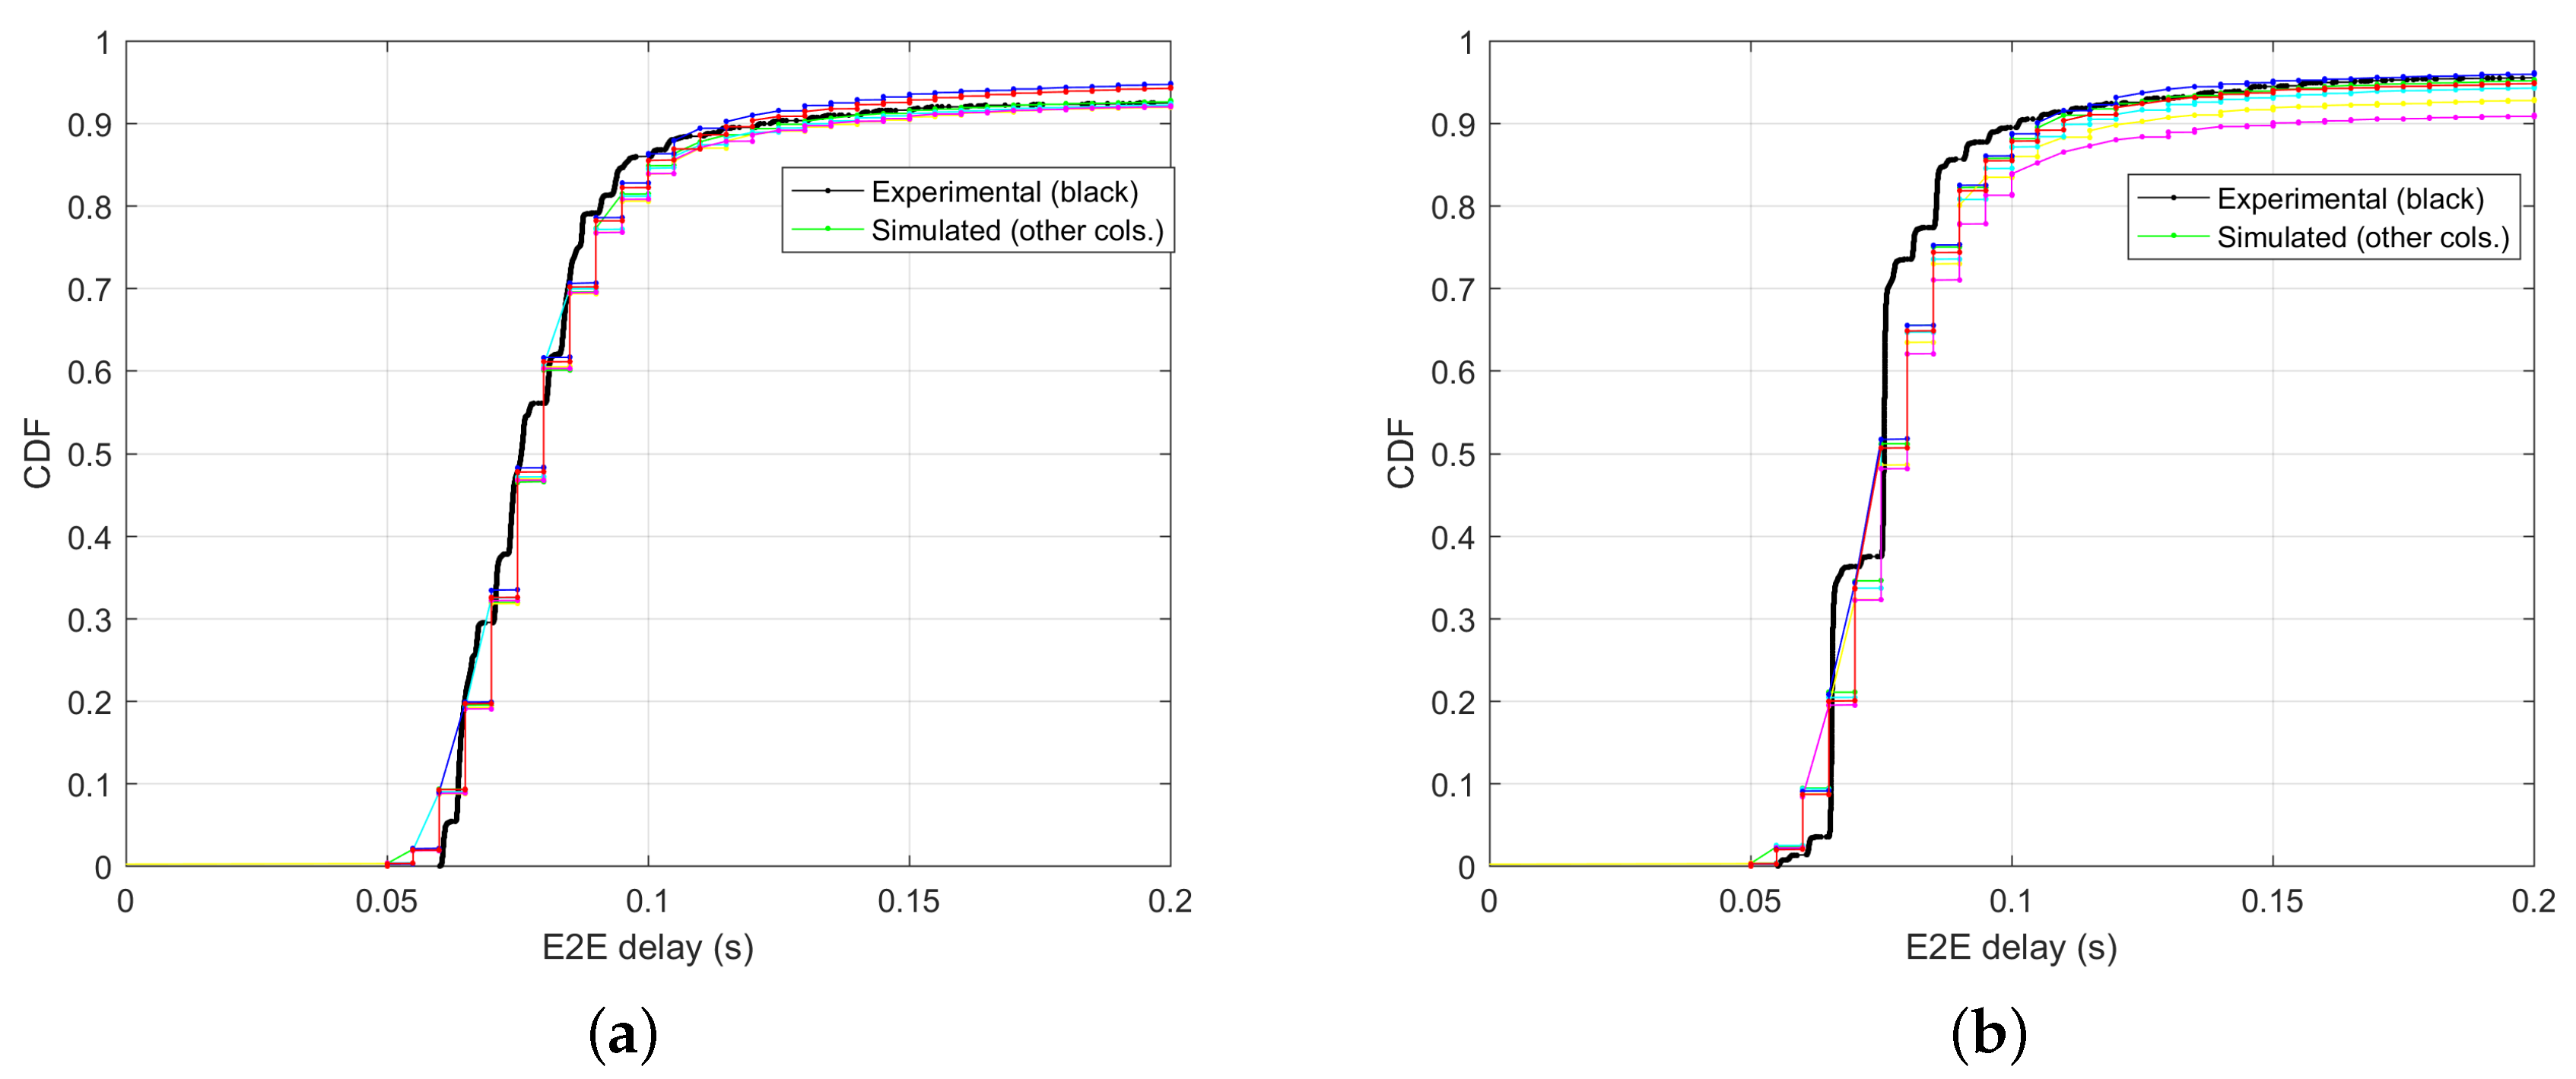
Figure 15.
Comparison of E2E delay CDF generated from the model after collecting E2E delays of each generated sample: Expanded time scale up to 2 s, two different experimental samples of the same railway section (all available radio access technologies).
Figure 15.
Comparison of E2E delay CDF generated from the model after collecting E2E delays of each generated sample: Expanded time scale up to 2 s, two different experimental samples of the same railway section (all available radio access technologies).

Table 1.
Numerical sample of the E2E delay sequence.

© 2017 by the authors. Licensee MDPI, Basel, Switzerland. This article is an open access article distributed under the terms and conditions of the Creative Commons Attribution (CC BY) license (http://creativecommons.org/licenses/by/4.0/).
Share and Cite
MDPI and ACS Style
Mazzenga, F.; Giuliano, R.; Vizzarri, A. End-to-End Delay Model for Train Messaging over Public Land Mobile Networks. Information 2017, 8, 145. https://doi.org/10.3390/info8040145
AMA Style
Mazzenga F, Giuliano R, Vizzarri A. End-to-End Delay Model for Train Messaging over Public Land Mobile Networks. Information. 2017; 8(4):145. https://doi.org/10.3390/info8040145
Chicago/Turabian StyleMazzenga, Franco, Romeo Giuliano, and Alessandro Vizzarri. 2017. "End-to-End Delay Model for Train Messaging over Public Land Mobile Networks" Information 8, no. 4: 145. https://doi.org/10.3390/info8040145
Note that from the first issue of 2016, this journal uses article numbers instead of page numbers. See further details here.