Importance Degree Research of Safety Risk Management Processes of Urban Rail Transit Based on Text Mining Method


1
School of Mechanics and Civil Engineering, China University of Mining & Technology, Xuzhou 221000, China
2
School of Management, Henan University of Urban Construction, Pingdingshan 467000, China
3
School of Architectural Engineering, North China Institute of Science and Technology, Weifang 261000, China
*
Author to whom correspondence should be addressed.
Information 2018, 9(2), 26; https://doi.org/10.3390/info9020026
Submission received: 29 November 2017
/
Revised: 21 January 2018
/
Accepted: 22 January 2018
/
Published: 26 January 2018
Abstract
:China’s urban rail transit (URT) construction is coming into the stage of rapid development under the guidance of national policies. However, the URT construction projects belong to high-risk projects and construction safety accidents occur frequently. Presently, safety risk management is in continuous development. Unfortunately, due to risk data deficiencies and lack of relationship between participants and safety risk factors, most of the research results cannot be well applied to URT projects. To overcome the limits, this paper has applied the text mining method into safety risk analysis. Through word frequency analysis and cluster analysis, 15 safety risk factors and 3 participants are identified from 156 accident reports. In addition, the accident descriptive model has been established, which is composed of indirect safety risk factors (management defects), direct safety risk factors and participants. In this model, each accident is the standardized description of the corresponding accident information. This is useful for risk data accumulation and analysis. Then the network structure analysis and risk assessment methods are utilized to make clear 63 relationships among participants, management defects and direct safety risk factors. Subsequently, the risk value of each relationship is evaluated. These safety risk information is integrated into the accident descriptive model by using accident points. Finally, ABC analysis which is a popular and effective method used to classify items into specific categories that can be managed and controlled separately is used to analyze the safety risk management’s core process(A), important process(B) and general process(C) in the accident descriptive model. The research results show that the constructor should pay attention to construction coordination, safety specifications, safety measures and personnel education, the supervisor should attach importance to timely communication, the monitoring unit should pay attention to advanced forecast and dynamic control. The main research contributions are as follows: (1) A method of obtaining risk data from unstructured content has been provided; (2) The accident descriptive model could be utilized for risk data continuous accumulation; (3) The emphases of URT construction safety risk management are made clear.
1. Introduction
In order to solve the problem of urban congestion and drive economic development, China has put forward to develop URT during the 12th and 13thFive-Year Plan Period. China’s URT operating mileage is expected to reach about 7000 km by 2020. The URT construction projects belong to high-risk projects, so the construction safety deserves the most attention during the rapid development. As in other countries around the world, China’s URT construction safety accidents occur frequently, causing a large number of casualties and property damage. The construction workers in this field are more likely be hurt than workers in other fields [1]. Data from the Ministry of Housing and Urban-Rural Development show that 442 accidents of municipal engineering occurred in 2015 in China, and a total of 551 people were killed. 634 accidents of municipal engineering occurred in 2016 and a total of 735 people were killed in 2016. The URT accidents accounted for 30% and occurred frequently [2]. At the same time, the URT accidents will lead to enormous property losses. For example, on November 15 of 2008, a collapse accident occurred in Hangzhou Line 1, and a total of 21 people were killed and 24 people were injured. The direct economic loss caused by the accident was 49.61 million yuan [3]. In order to fulfill 7000 km operating mileage by 2020, the number of China’s URT projects will be increased year by year in the next few years, which means that more building workers may suffer casualties and property losses.
Above all, how to improve the construction safety of URT projects becomes a problem to be solved urgently in China. Domestic and foreign scholars have conducted a lot of research on this issue. According to Esmaeili and Hallowell [4], the risk was composed of three most basic elements, namely frequency, severity and exposure. They proposed that risk assessment could be subjective and objective. The subjective method was based on the expert’s experience and knowledge, while the objective method required a lot of history data. Khan et al. [5] proposed that dynamic risk assessment was the key element for continuous improvement of safety performance, and Ahmed et al. [6] put forward a risk-based failure assessment approach that could avoid repetitive errors and potential failures while improving safety performance. In addition to safety risk assessment and safety risk management approaches, Aven et al. [7,8] argued that only the misunderstanding of risk and risk-related concepts between organizations and scholars was solved, could reduce misused of these concepts used in safety risk assessment and safety risk management. Presently, safety risk management is in continuous development. This contributes to the formation of a large number of safety innovations, which the construction industry utilizes to continuously improve its safety performance.
Uncertainty is the essential characteristic of the risk. We can identify the uncertainty through accident, incident and near-miss analysis, including the risk types and probability of occurrence. Generally, safety risk analysis is based on the accident causation theory, such as Heinrich’s accident causation theory and the Cheese Model of Reason, etc. [9,10]. What these theories have in common is that they are formed by underlying risk factors, indirect risk factors and direct factors. The underlying risk factors could not be changed in a short time, such as economic environment, secure environment, legal environment, etc. The indirect risk factors mainly refers to the management defect, and the direct risk factors usually include unsafe behavior of human and unsafe conditions of object. The risk analysis aims to identify and quantify various risk factors [11]. Accidents, incidents and near-misses are caused by similar safety risk factors [12,13,14]. Therefore, it is clear that identification of those factors can control incidents and near-misses to some extent so as to control the accidents in advance and reduce accident losses. Zhou and Irizarry [3] have applied the accident causation theory to analyze the collapse accident of a foundation pit of Hangzhou Metro No.1 line project. Zhou believes that this accident is caused by continuous rainfall, damaging foundation pit supporting system and insufficient safety training. Wen and Xu [15] analyzed the TBM construction accident caused by tunnel deformation and divided the consequences of the accident into five grades. Based on the grade of consequences and the probability of an accident, they put forward the deformation risk assessment matrix and risk probability of the tunnel.
Although achievements have been made during the research of construction safety risk analysis, they could not be applied and circulated because of restrictions. The lack of safety risk data is one limiting factor. The theoretical basis of safety risk analysis is the accident causation theory, and most of data come from similar projects’ accident reports [16]. Rivas et al. [17] have analyzed the contents of accident reports in construction industry in most countries around the world and made clear that the accident report is usually composed of fixed contents and descriptive contents. The fixed contents include the accident’s time, location, casualty, type, etc. The descriptive contents are more informative, including the accident’s details, reasons, confirmation of responsibility, etc. Currently, there is a lack of safety risk data extraction methods from accident reports’ unstructured descriptive contents, so that the safety risk analysis lacks data supporting [18]. Due to this limitation, most researches on risk analysis rely on subjective judgments, and thus the reliability of the research results are lowered. The other limitation lies in the unclear relationship among participants, indirect risk factors (management defects) and direct risk factors. As mentioned above, the accident is caused by underlying risk factors, indirect risk factors and direct risk factors. However, the current research mainly focuses on direct risk factor identification and assessment and often ignore the relationship among participants, management defects and the direct risk factors [19]. Once the above-mentioned relationship is ignored, each participant could not link the management work, responsibilities and direct safety risk factors, which is not helpful to distinguish each participant’s safety risk management responsibilities and improve the overall management level [16,20]. For example, Zhou has found that the damaging foundation pit support system is the direct safety risk factor for the collapse accident, but the responsible participant is not clear and the lessons are unclear for the further projects [3]. Esmaeili and Hallowell [4] found that in recent years, the application rate of safety innovations in the construction industry has been declining year by year. The construction industry has reached saturation with respect to safety innovations. Therefore, the safety performance could be improved only by new methods.
To overcome the limitations of data deficiencies, a few scholars have introduced the text mining method into the safety risk analysis. The text mining could convert unstructured contents into structured data and provide plenty of data for safety risk analysis. Esmaeili and Hallowell [4] have considered that all building construction safety accidents are caused by a common set of safety risk factors. They have applied text mining to analyze thousands of accident reports and identified 22 common safety risk factors. Gholizadeh et al. [21] have used the principal component analysis to restudy the above 22 common safety risk factors and reduced the factors to 5. Figueres-Esteban et al. [22] used text mining techniques to visualize the documentary records of UK railway safety risk incidents and successfully identified the safety risk factors from these unstructured document data. Tixier and Hallowell [23] have combined text mining and natural language processing and created a way to automatically extract safety risk factors from the accident reports.
Hola [24] used the process research method to identify, analyze, evaluate and adjust the management of construction enterprises, thereby improving the ability of administrative decisions. Similarly, this research aims to use text mining to identify safety risk factors and reveal the relationship among participant, management defects and direct safety risk factors. Only in this way can each participant make clear their responsibility and management emphases, arrange the works properly, improve the management level and finally avoid the occurrence of safety accidents.
2. Proposed Methodology
The literature review shows that the existing risk analysis research results could not be widely applied and popularized due to lack of risk data and unclear relationships among participants, management defects and direct safety risk factors. This paper has applied the text mining method into the risk analysis to identify participants and safety risk factors from unstructured contents of accident reports. The overall research approach and methods are shown in Figure 1. The following sections will give detailed explanations.
2.1. Data Collection
The accident reports are the most important data source of safety risk analysis. Esmaeili and Hallowell [25] have acquired accident reports from National Institute for Occupational Safety and Health. Rodrigues and Balestrassi [26] have obtained the accident report from European Aviation Safety Agency to analyze the causes of aviation accident. Other academics have also obtained accident information from official channels to ensure the quality and reliability of the risk data [27,28,29]. Since the establishment of Regulations on the Reporting, Investigation and Disposition of Production Safety Accidents (hereinafter referred to as “the Regulation”) in China, any accident involving casualties could be recorded and preserved truly and objectively. The Regulation stipulates that the accident report should be complete, accurate and recorded timely. No unit or individual is allowed to conceal an accident. The contents of the accident reports shall include the reasons, losses, responsibilities, rectification measures, etc. Like other countries, China has specialized safety production management functional departments. As the top safety production management body, the State Administration of Work Safety will make the accident investigation details and the accident report public to society in a timely manner. Compared with other data sources, these data will be more representative of the general situations of China’s safety risk management.
2.2. Text Mining Method
The accident report is mostly composed by unstructured descriptive text and the traditional statistical approaches are not fitted for text analysis and tend to neglect important information. The text mining method makes up this disadvantage and makes it available to analyze more contents and discover more new knowledge [30]. Text mining is a relatively new practice derived from Information Retrieval [31] and natural language processing [32].The strict definition of text mining includes only the methods capable of discovering new information that is not obvious or easy to find in a document collection, i.e., reports, historical documents, e-mails, spreadsheets, papers and others. The text mining process is generally divided into: text preprocessing, data analysis, result visualization, knowledge discovery, etc., of which text preprocessing is key to determine the quality of follow-up analysis. In the process of text preprocessing and natural language processing, there is a big difference between Chinese and English: (1) English documents usually need to be checked for spelling and syntax errors and morphological normalization, while Chinese document only needs to be checked for spelling errors, because there is no change of the Chinese words due to a change in case, singular & plural and tense. (2) As for word segmentation, as Chinese words are not required to be separated by blank spaces, which are different from the English words, it is recommended to use the lexicon query method rather than directly the blank spaces for words segmentation. In this sense, the development of lexicon has become the most important step in the process of Chinese text mining. The words in the professional lexicon used in this paper come from professional dictionaries in the field of safety engineering, construction engineering, civil engineering, structural engineering, project management, URT construction, etc. The words in daily expression lexicon such as names, place names, etc., are all from the dictionaries commonly used in China and self-contained in text input software; at the same time, the Dictionary of Modern Chinese Function Words is used to build the stop words lexicon, and delete meaningless function words in the word segmentation results. In order to make the word segmentation more precise, the lexicon suitable for this study is further developed on the basis of professional lexicon, daily expression lexicon and stop words lexicon. The specific steps are described in Section 2.2.1. After the text preprocessing is completed and the unstructured documents are transformed into structured data, data analysis and visualization can proceed, including keyword recognition, word frequency statistics, cluster analysis and network structure.
Considering that the accident reports are all written in Chinese, so the text mining software named ROST supporting Chinese has been chosen for analysis. The advantage of the ROST software is to customize the lexicon according to different research purposes. During words segmentation of the unstructured document, the software can automatically compare the keywords in the contents of the document and the lexicon to identify fixed collocations, synonyms and entities. At the same time, the software integrates basic functions, such as word frequency statistics, cluster analysis, network structure, etc., to facilitate text mining.
2.2.1. Lexicon Development and Keywords Identification
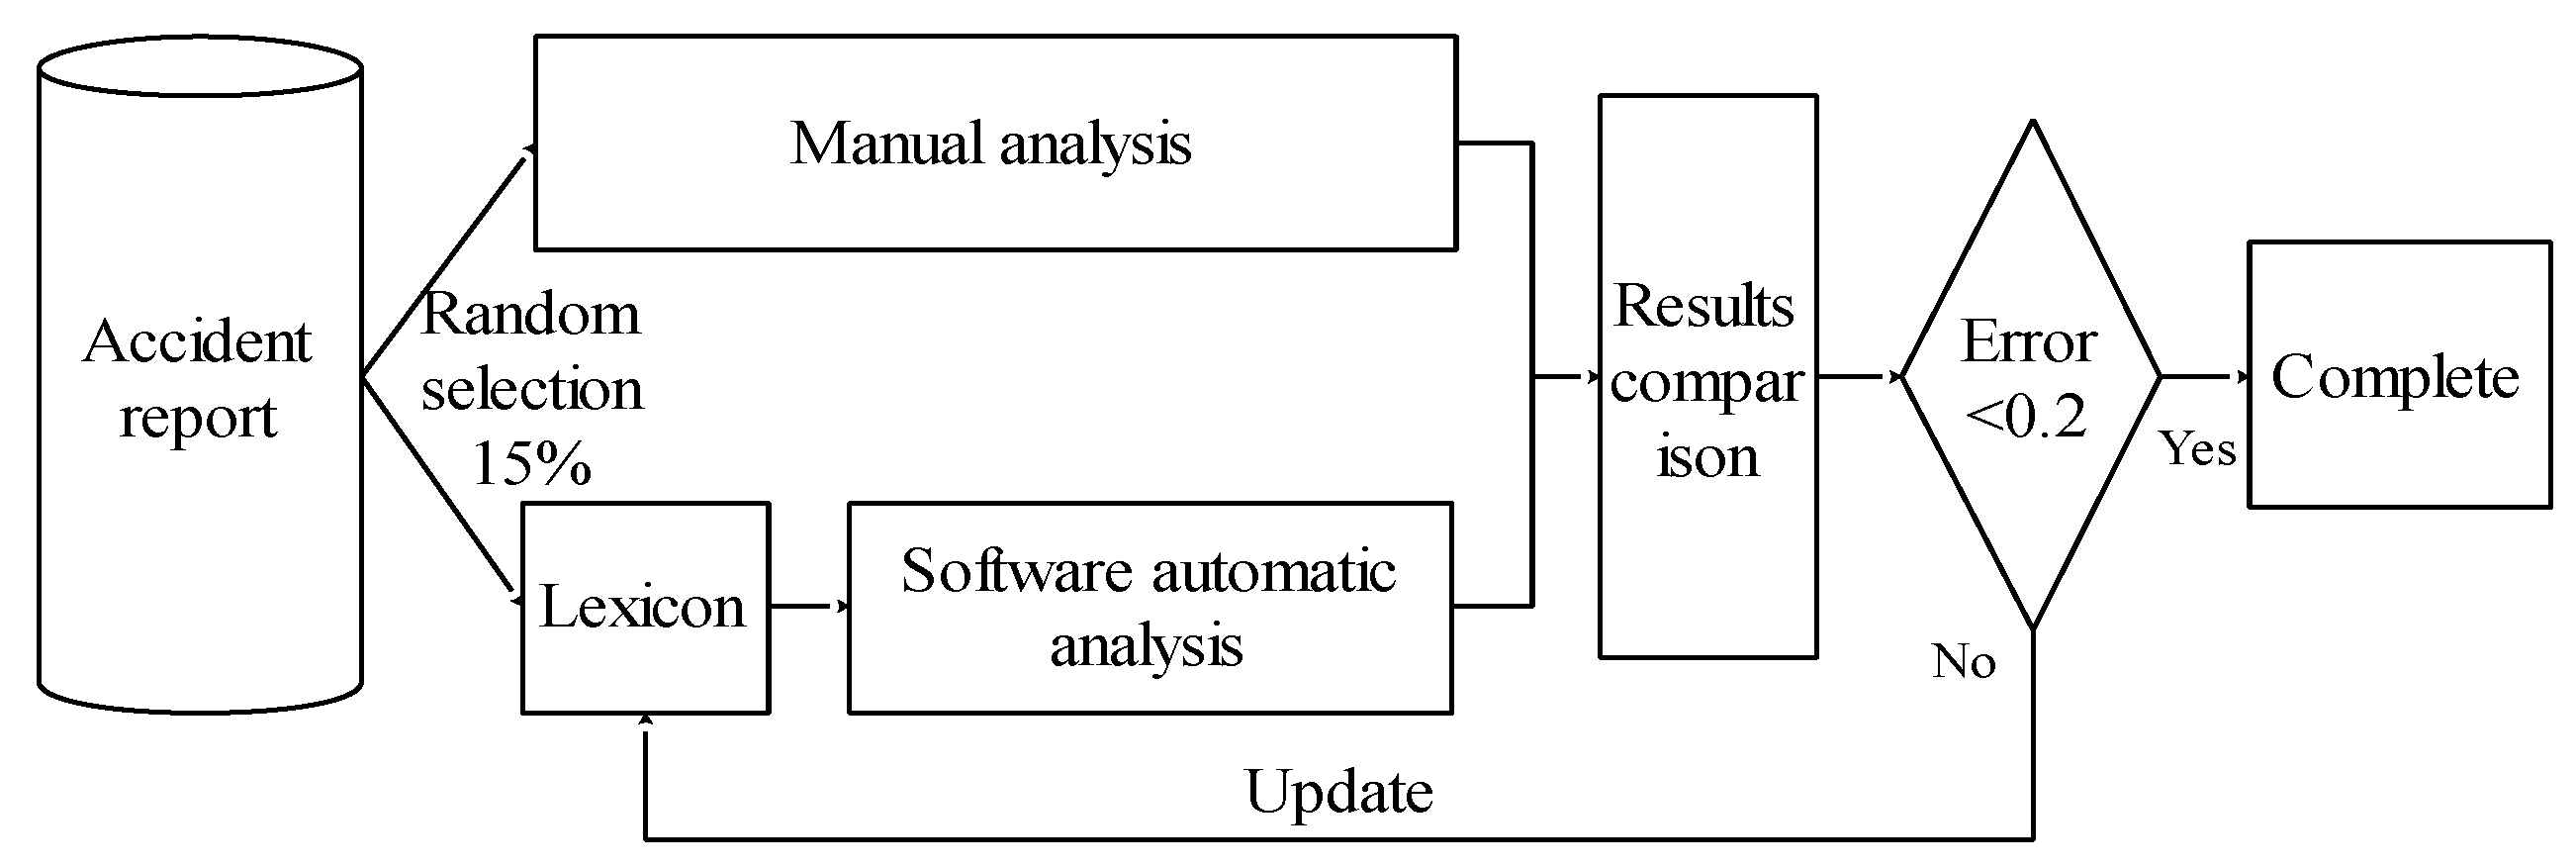
To use the text mining method to identify keywords, we need to develop a reliable lexicon. The role of the lexicon is shown in two aspects: (1) the text mining software will divide the unstructured contents into single noun, adjective, verb, etc., which is called segmentation. During segmentation operation, the software will compare the unstructured contents with the words in the lexicon and give preference to word collocation. It could be seen that the accuracy of segmentation has close relationship with the lexicon and will directly influence the keyword identification. (2) The Chinese language contains a large number of synonyms. A reliable lexicon could effectively distinguish these synonyms. This research uses the lexicon development method proposed by Esmaeili and Hallowell [4], which is shown in Figure 2. Firstly, 15% of all the accident reports are randomly selected for manual analysis and software automatic analysis. During the manual analysis, the analyst will carefully read each accident report, and identify the keywords related to safety risk factors from the paragraphs describing the process and the cause of the accident. The analyst may make clear whether there is a synonymous relationship between the keywords and classify the synonymous keywords into a list, such as “drainpipe”, “sewage pipe”, “gas pipeline”, “power pipeline” and “underground pipeline”. From the liability identification paragraph, the analyst will analyze keywords and their synonyms related to the participants, and add those keywords to the keyword list.
Finally, the list of keywords will be compared with the results of software automatic analysis. The comparison results are usually as follows: (1) The most promising result is that same keywords are identified by manual analysis and software automatic analysis; (2) Some keywords are identified by manual analysis while not identified by the software automatic analysis; (3) Some keywords are identified by software automatic analysis while not identified by manual analysis. When the latter two errors occur, Formula (1) could be used to calculate the error value. If the error value is less than 0.2, the lexicon is acceptable. If the error value is more than 0.2, the list of keywords by manual analysis needs to be added into the lexicon. Because there are keywords and the synonymous relationship between them in the lexicon, the ROST software can automatically convert synonyms when counting word frequency to make the statistical data more centralized, which is good for subsequent clustering and network analysis. For example, when “drainpipe”, “sewage pipe”, “gas pipeline”, “power pipeline” and “underground pipeline” appear at 2, 3, 4, 6, 2 times respectively, ROST transforms these terms into their synonyms, and gets the conclusion that “underground pipeline” appears for 17 times.
where Dn refers to the number of discrepancies; Tn refers to the total number of keywords from manual.
Error = Dn/Tn
2.2.2. Cluster Analysis
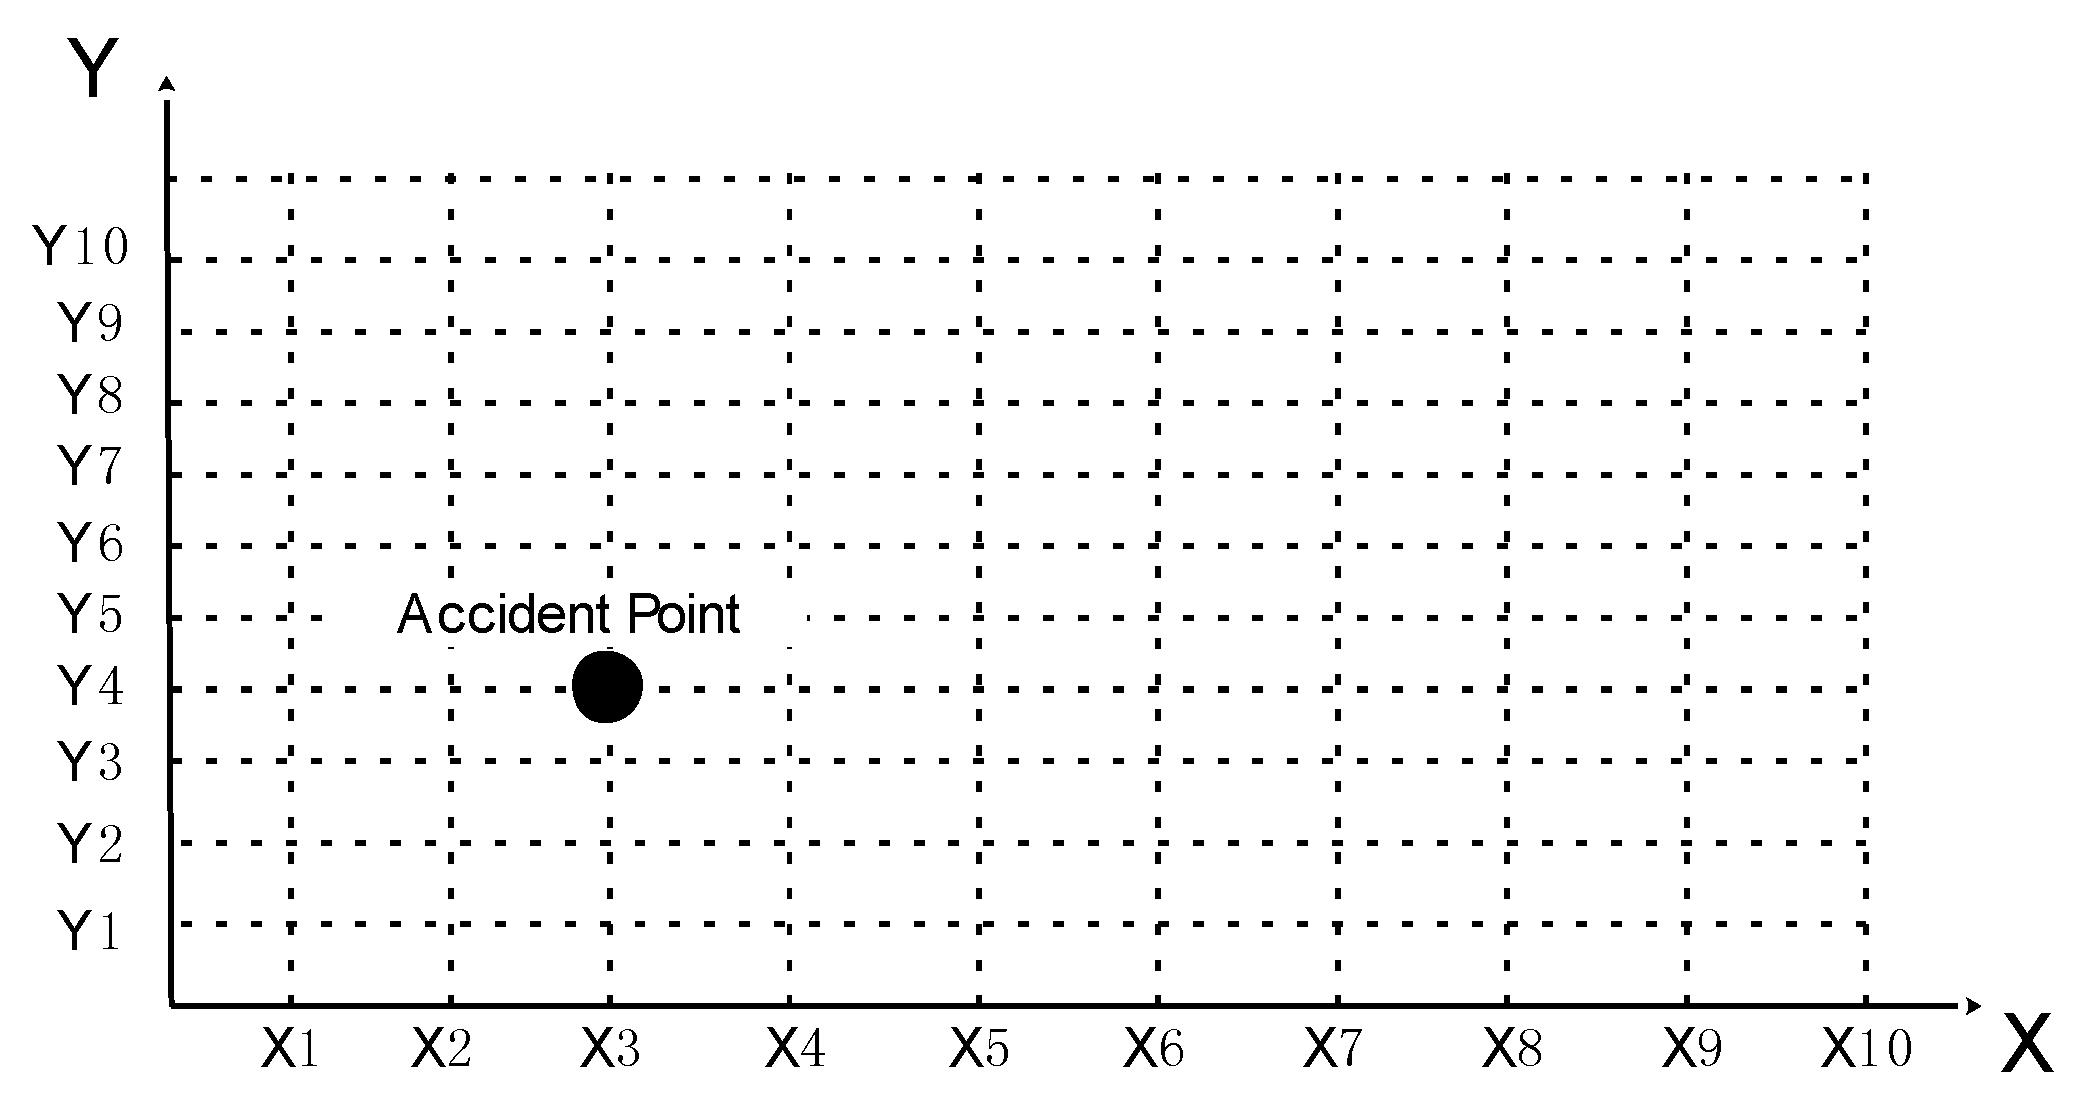
After identifying safety risk factors and participants from accident reports, it is necessary to classify the factors to determine which are direct safety risk factors and which are management defects. Cluster analysis can be utilized for safety risk factors classification. Clustering is a process of dividing a set of given data into classes or clusters, such that all the data in the same group are similar to each other, while data from different clusters are dissimilar [18,34]. This research adopts K-means clustering algorithm to classify the safety risk factors. The steps for K-means algorithm are as follows: (1) finding the center of clustering; (2) calculating the distance from each point to the cluster center and assigning each point to the nearest cluster; (3) calculating the coordinate mean of all points in each cluster and taking the average mean as a new cluster center; (4) repeating the operations in (2) and (3) until the cluster center doesn’t move in a large scale or the clustering meets the requirements [35]. After the cluster analysis, the safety risk factors will have clear categories, on which basis the accident descriptive model could be established. The idea of the accident descriptive model is that since the safety risk factors are identified from all accident reported and classified by cluster analysis, then each accident could be explained by the factors in these categories. Thus the category could be seen as the coordinate axis, the number of categories could be seen as the dimension and safety risk factors could be seen as the values of different dimensions, so each accident is a point in the coordinate and could be called an accident point. For example, if all safety risk factors are divided into two categories, the accident descriptive model will be made up of two coordinate axes (x-axis and y-axis). The values of each coordinate axis is the safety risk factor in each category (X1–X10, Y1–Y10). If an accident is caused by X3 and Y4, this accident could be expressed by the accident point in Figure 3. Subsequently, the information of participants in the cluster analysis is added to the accident descriptive model, which can explain which participants contributed to these safety risk factors.
Hola and Sawicki [36] developed a knowledge map model and used it to successfully and accumulatively acquire the data, information and knowledge related to the construction enterprises. In the same way, the accident descriptive model is the standard pattern of accident analysis. It is to use accident points to record all unstructured accident information, which is helpful for further safety risk assessment and importance degree determination of management processes.
2.2.3. Network Structure Analysis
Network structural analysis is based on social network theory. Social network is originally used to study the relations between people, consisting of nodes and lines. The nodes could be people, organizations, departments and even countries and lines represent the various relationships that exist between them [37]. Zhou and Irizarry [3] has applied this method to analyze Hangzhou Metro Line 1 accident. He holds that this accident has gone through several stages and multiple risk events hide in every stage. The network structure of accident could clearly describe the relationships between these risk events in every stage, which is helpful to fully know the accident. This research also applies this method to analyze the relationships among participants, management defects and direct safety risk factors. The nodes in the network structure are previously identified safety risk factors and participants. Their relationships could be calculated by the co-occurrence matrix. The co-occurring values are determined by simultaneous occurrence of safety risk factors and participants in accident reports. As shown in Figure 3, the accident is caused by X3 and Y4, which means that the X3 and Y4 simultaneously occur for once. The network structure analysis could not only specify the relationship between participants and safety risk factors, but also draw each accident point in the accident descriptive model for further analysis.
2.2.4. Safety Risk Assessment
The estimation of safety risk values is the core of safety risk assessment. This research uses Formulas (2) and (3) to estimate the safety risk [4,33] to determine each accident point’s safety risk value.
where RVi refers to the safety risk values; RFi refers to the risk probability; mi refers to the number of accident reports involving the safety risk factors; n refers to the number of all accident reports; RMi refers to the risk loss made of casualties and property losses, whose values comply with the national standards of the Code for Safety Risk Management of Underground Works in URT shown in Table 1. WH refers to the work duration of building workers. Chinese people usually work 8 h, so all the estimation of risk values complies with eight-hour work system.
RVi = RFi × RMi × WH
RFi = mi/n
2.3. ABC Analysis Method
ABC analysis is a popular and effective method used to classify items into specific categories that can be managed and controlled separately. Conventional ABC classification was developed by General Electric during the 1950s. The classification scheme is based on the Pareto principle, or the 80/20 rule, which employs the principle of “vital few and trivial many”. The process of ABC analysis classifies inventory items into A, B or C categories based on so-called annual dollar usage. Annual dollar usage is calculated by multiplying the dollar value per unit by the annual usage rate [38]. Inventory items are then arranged according to the descending order of their annual dollar usage. Class A items are relatively small in number, but account for the greatest amount of annual dollar usage. In contrast, class C items are relatively large in number, but make up a rather small amount of annual dollar usage. Items between classes A and C are categorized as class B. A large number of scholars have applied ABC analysis method into the field of management to determine the important degree of management processes. It has also been utilized to classify management defects in the accident descriptive model, where class A refers to the management defects with accumulative safety risk values between 0% and 70%, class B refers to the defects with safety risk values between 70% and 95% and class C refers to the defects with safety risk values between 95% and 100% [39,40]. The larger the safety risk value, the more important the management defect and its corresponding process. So class A is defined as the core process, class B is the important process and class C is the general process. Thus the importance degree of processes involving different safety risk factors could be analyzed and made clear.
3. Results
3.1. Safety Risk Factors and Participants Identification in URT Construction
One hundred and fifty-six urban rail transit accident reports collected from the State Administration of Work Safety and involved 24 cities, as shown in Table 2. In addition, 80% of the cities with URT have occurred accidents by the end of 2016, and the ratio of the number of accident reports to the launched lines is 1.51:1. Plenty of data could ensure the reliability of the further analyses.
As mentioned above, a lexicon is needed to be developed before using the text mining to identify safety risk factors and participants, whose development process is shown in Figure 2. The professional analysts analyze the selected 15% of accident reports and list keywords related to safety risk factors and participants which will be compared with the automatic analysis results by ROST text mining software. This work goes through five rounds and the words in the lexicon have been updated for five times. The final error value is controlled lower than 0.2. Through five rounds of comparison and analysis, a reliable lexicon has been developed. The corresponding error value after each round of development could be seen in Table 3.
The URT safety risk factors and participants could be identified automatically by simultaneously importing the updated lexicon and 156 accident reports into ROST text mining software. Through ROST analysis, 18keywords have been identified, 15 of which are safety risk factors, and the other 3 are participants. Formula (3) is used to calculate the relative probability of each safety risk factor and participants, the results are shown in Table 4.
3.2. Safety Accident Descriptive Model of URT
The identified Keywords are classified and used to establish the accident descriptive model. The K-means algorithm in ROST software is firstly used to classify the Keywords. The clustering results are shown in Figure 4.
The figures in Figure 4 are clustering indexes, indicating the distance between different categories. A smaller clustering index indicates a greater difference between categories and a better classification effect. However, the final classification is also subject to the previous experience and research purposes. Usually, 2 to 4 categories are more reasonable. As shown in Figure 4, the clustering results have 18 classes from right to left. When the clustered index reaches 0.133, 18 nodes are divided into three classes. Class 1 refers to the accident’s responsible participants. Class 2 refers to the management processes or the indirect safety risk factors. Class 3 refers to direct safety risk factors. On the basis of clustering results, the accident descriptive model is established as shown in Figure 5.
The accident descriptive model is a three-dimensional coordinate system, where X-axis refers to the constructor (X1), supervisor (X2) and the monitoring unit (X3); Y-axis refers to management defects with advance forecast (Y1), dynamic control (Y2), construction coordination (Y3), safety specification (Y4), communication (Y5), safety measures (Y6), personnel education (Y7) and construction management plan (Y8); and Z-axis refers to direct safety risk factors with underground pipeline (Z1), hidden danger elimination (Z2), enclosure protection (Z3), safety consciousness (Z4), Violation of regulations working (Z5), hydrogeologic condition (Z6) and construction monitoring (Z7).
3.3. Network Structure Analysis and Assessment of Safety Risk Factors
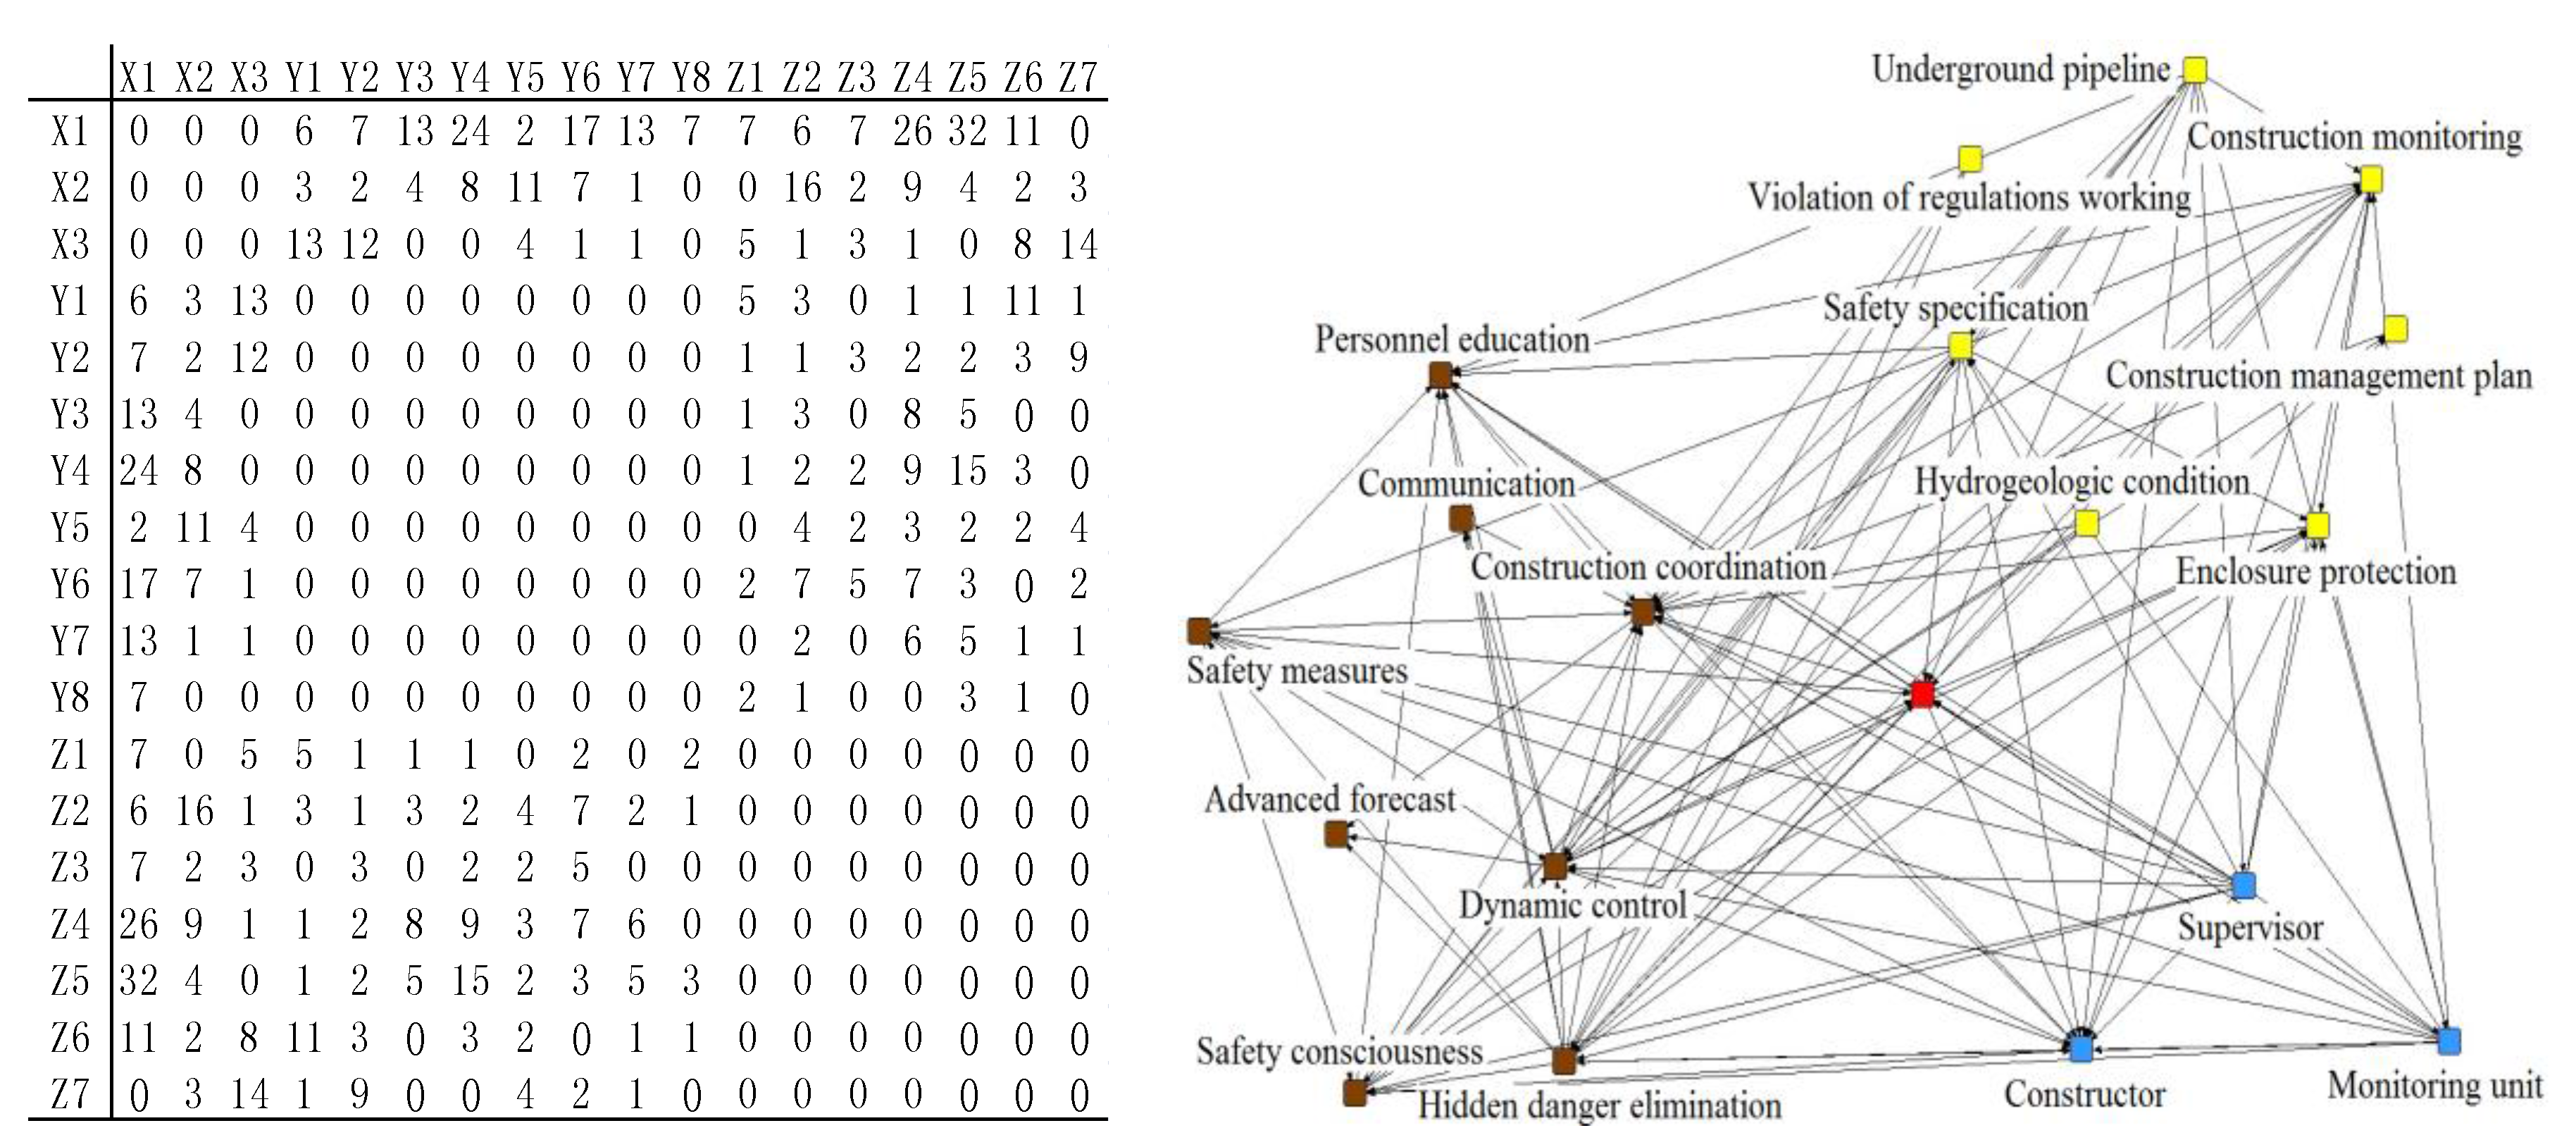
The network structure analysis is useful to establish the relationship among participants, management defects and direct safety risk factors. Based on word-word co-occurrence matrix, the network structure diagram could be obtained by using the network structure analysis in ROST. The co-occurrence matrix and the network structure diagram could be seen in Figure 6.
The nodes in the network structure diagram are the obtained safety risk factors and participants. Different colors refer to different categories. The straight lines are determined by the co-occurrence matrix. For example, the corresponding number of 6 indicates that X1 and Y1 simultaneously occur for 6 times in all accident reports. Considering that there are straight lines connecting three nodes in the network structure diagram only when the participants, management defects and direct risk factors co-occur in the same accident report, we can judge whether an accident occurs, by checking whether there are straight lines among them. Thus, a relationship that leads to the accident is acquired. According to this thought, the network structure is split and 63 kinds of factors are analyzed to determine the accident report that those relations correspond.
Table 5 includes the report’s number, relationships among participants, management defects and direct risk factors, risk probability, casualties, loss values and risk values. Report 1 records the accident caused by damaged underground pipelines by the management defect in constructor’s advanced forecast (X1-Y1-Z1). The probability of the accident is the joint probability of the simultaneous occurrence of the three safety risk factors, which could be calculated by multiplying their each probability in Table 4. Table 1 lists the loss values of different accidents, and the safety risk values could be obtained by Formula (2). As mentioned above, each accident could be represented by an accident point, so the corresponding accident descriptive model could be established by drawing 156 accident points in Table 5.
Distributed in 168 three-dimensional space composed by three coordinates, each accident point represents a URT construction accident, shown in Figure 7. For example, X1-Y1-Z1 are distributed in 111 three-dimensional space and have safety risk values. If two points are in the same three-dimensional space, such as report 4 and report 5 in space 116, the safety risk value of space 116 is the accumulated value of each point’s safety risk value. The safety risk value in each three-dimensional space could indicate the risk of simultaneous occurrence of safety risk factors in this space.
3.4. Importance Degree of Safety Risk Management Processes
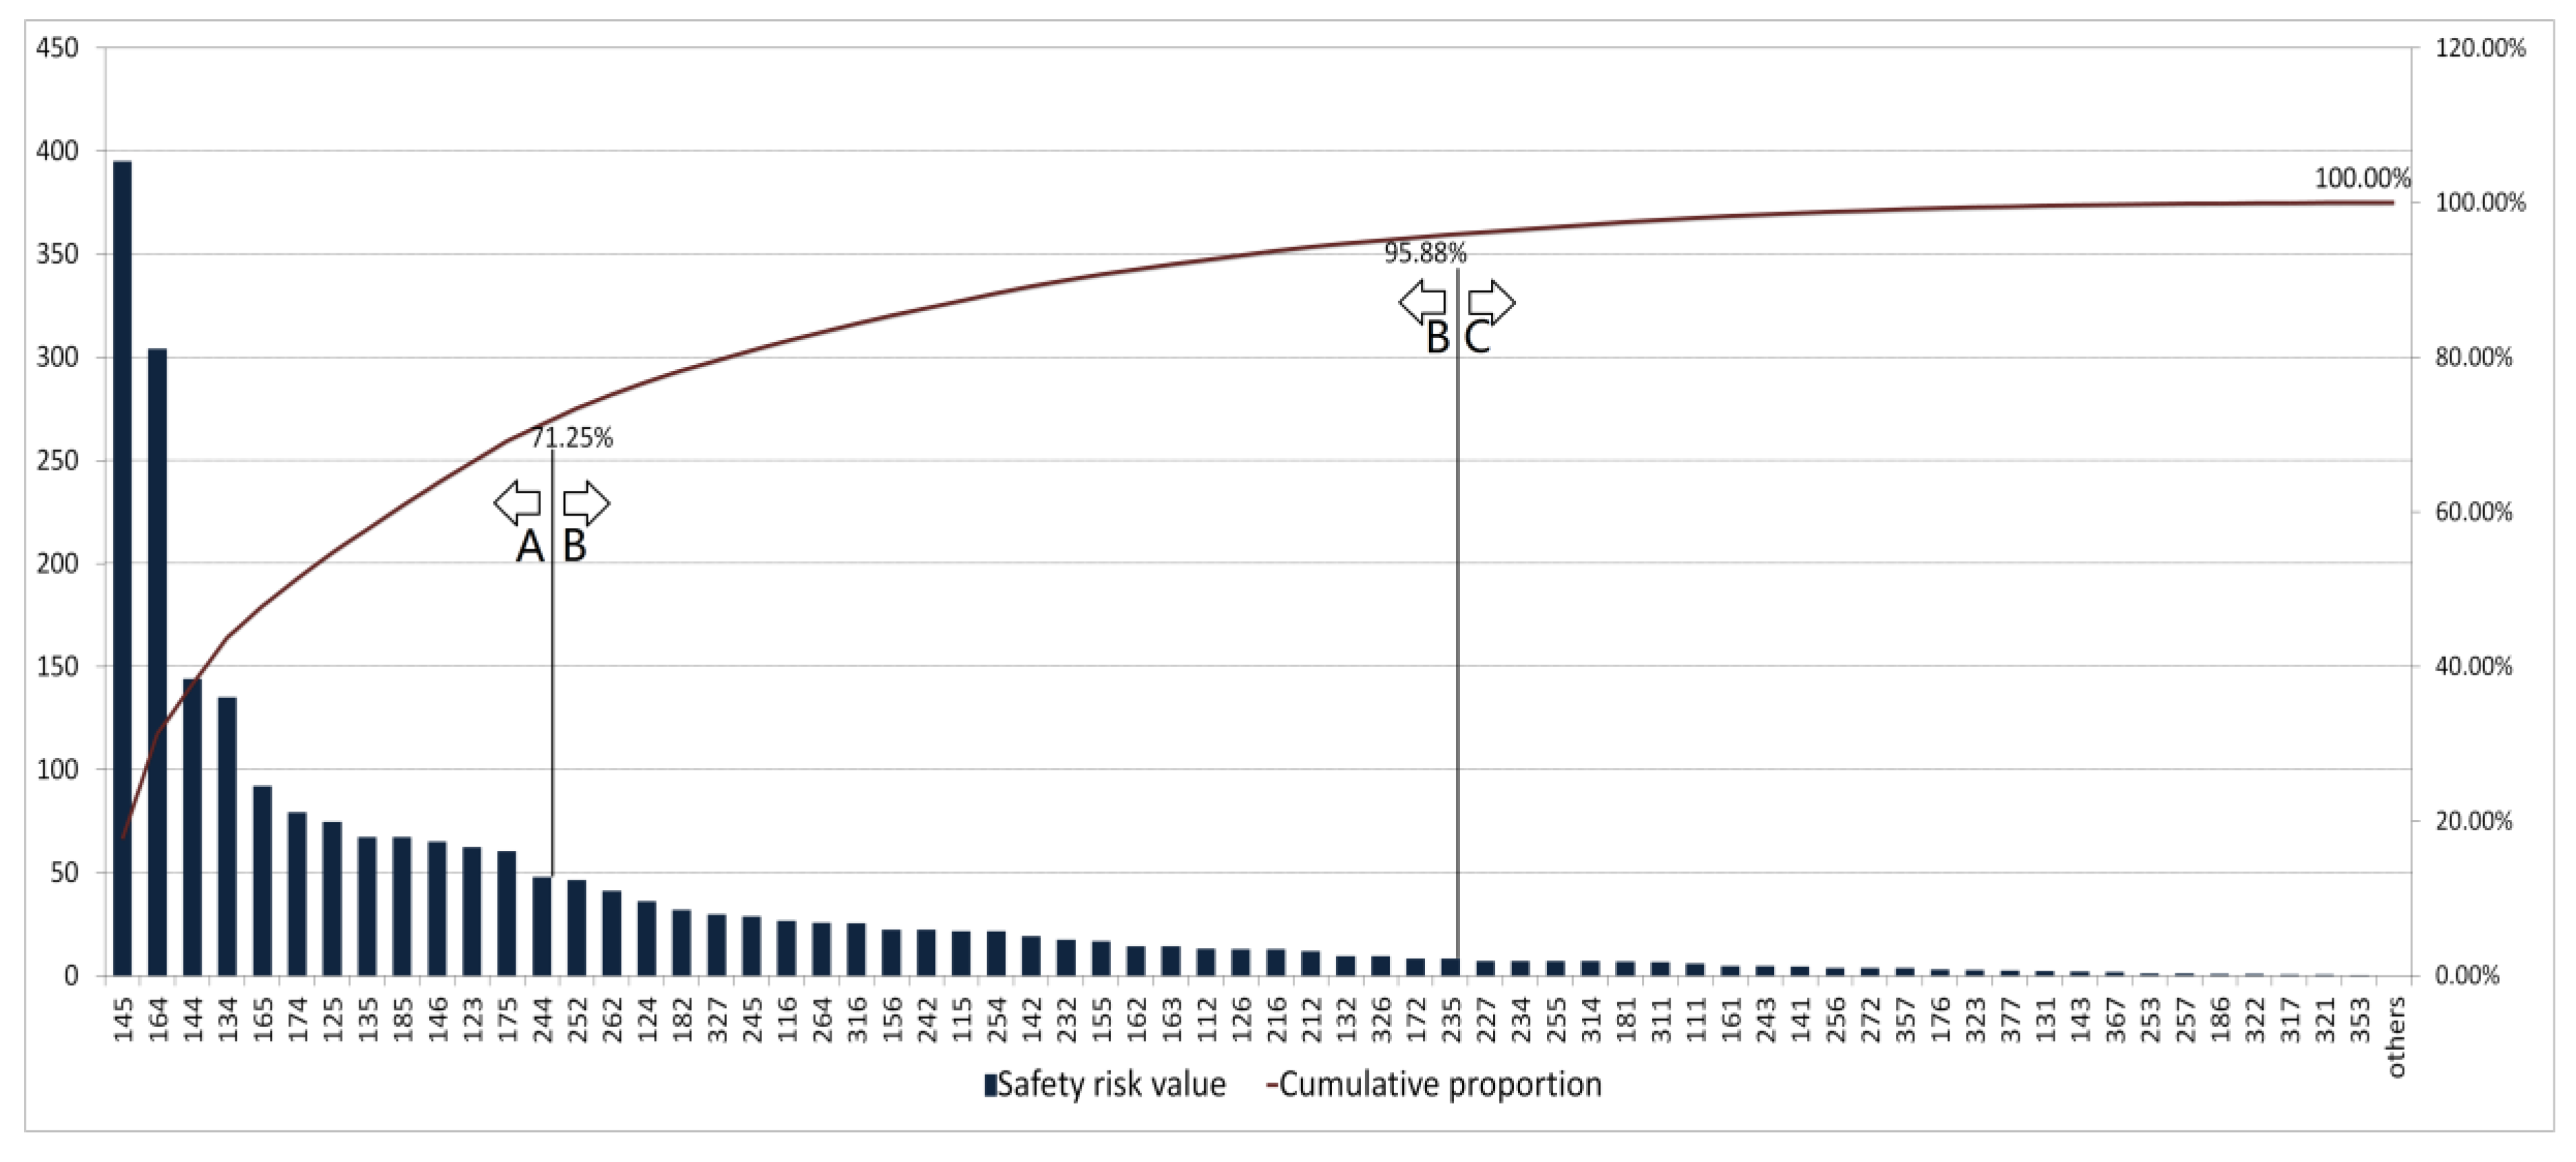
ABC analysis method is applied to analyze the importance degree of each management process. The three-dimensional space with the accumulative safety risk value between 0–70%, 70–95% and 95–100% are defined as the core process, important process and general business, respectively. The final analysis of important degree of safety risk management processes could be seen in Figure 8.
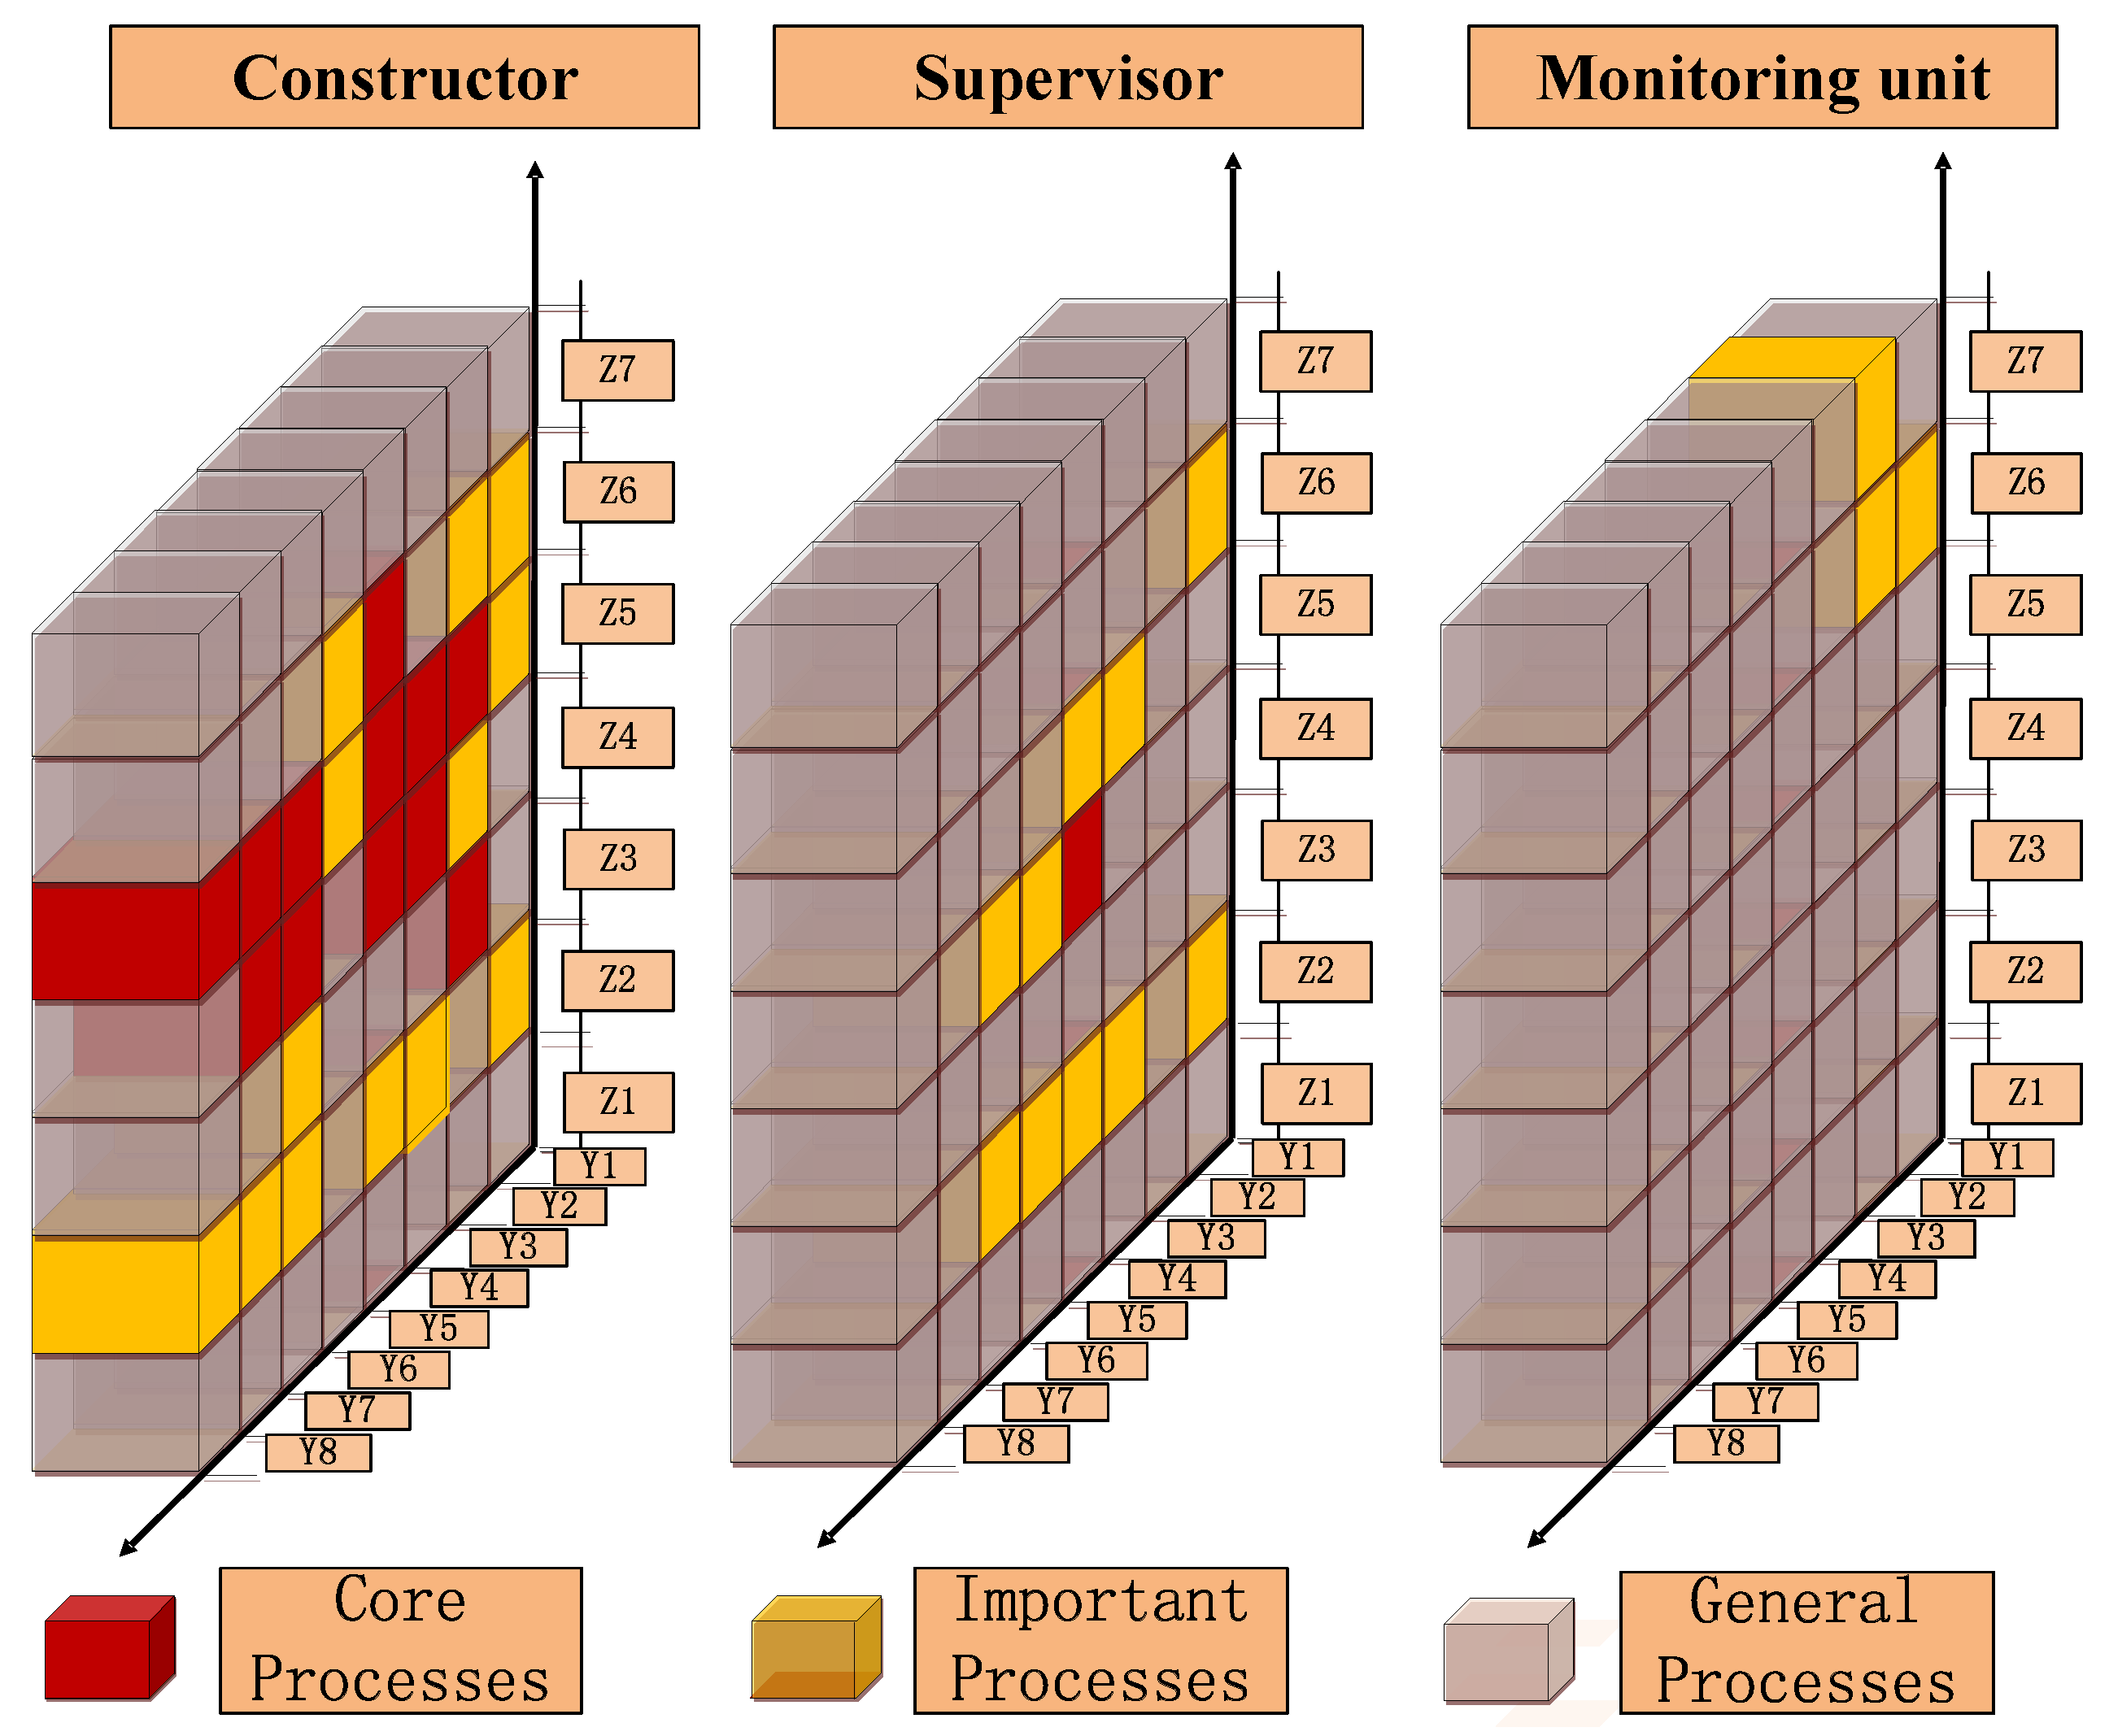
In Figure 8, X-axis refers to the number of the three-dimensional space and Y-axis refers to safety risk value and cumulative proportion. The three-dimensional spaces from 145–244 are defined as the core processes with the cumulative proportion between 0–71.25%. The three-dimensional spaces from 252–235 are defined as the important processes with the cumulative proportion between 71.25–95.88%. The left spaces are defined as the general processes. To visualize the results of ABC analysis, the results in Figure 8 are drawn to the accident descriptive model and divided according to the participants, where the core processes are marked in red and the important processes are marked in yellow, as shown in Figure 9.
4. Discussion
The accident reports are vital basis for safety risk analysis and importance degree research of safety risk management processes. 24 cities are involved in these accident reports, and the accident rates are the highest and account for over 50% in Beijing, Shanghai, Guangzhou and Shenzhen. This is because these cities have more developed URT networks and much longer operation mileage and have higher accident rates during the construction. In fact, the number of accidents per kilometer is basically same in URT projects. Using the method of text mining to analyze unstructured texts in these accident reports, we identified 18 keywords related to the accident. As shown in Table 4, the safety risk probabilities of violation of regulations working, safety consciousness and safety specification are the largest, which is related to the current situations of URT projects and the whole building industry in China. The URT project is part of municipal engineering, whose significance is that the government offers paid or free public goods and service for citizens based on the obligations and responsibilities. Compared to other engineering projects, the URT project is more concerned about the schedule objective. Sometimes, the constructor is asked to deliver the project at a specific time such as some festivals or by the end of the year. Such unreasonable schedule will make the constructor choose time-saving construction methods and the operations against rules and safety specification could often be found. The vast majority of Chinese construction workers are migrant workers with poor safety consciousness and low professional quality and without professional training. They usually accept short training before the construction, which could not improve their safety consciousness. Among various participants, the constructor is the direct implementer of the project, so the constructor should assume the main responsibility for the accident.
The URT project is complicated with various construction safety risk management processes. If the differences between primary and secondary management processes could not be distinguished, the resources could be easily wasted and the management performance could not be improved. Figure 9 clearly shows the importance degree of management processes by constructor, supervisor and the monitoring unit. Due to the lack or only amount of information about the owner, designer and surveyor, their management behaviors could not be analyzed. The occurrence of an accident has a close relationship with each participant’s management defects. On the whole, the constructor has more red and yellow three-dimensional spaces than the supervisor and the monitoring unit, indicating that the constructor’s management defects are more easily to cause accidents. Meanwhile, the constructor should focus on construction coordination (Y3), safety specification (Y4), safety measures (Y6) and personnel education (Y7). Without direct involvement in the construction, the supervisor conducts the supervision of construction quality, safety and other fields according to national laws, regulations and the corresponding technical specifications. On behalf of the owner’s interests, the supervisor should pay the most attention to timely communication (Y5). Each participant in URT has different views on safety risks. The owner is concerned about the project’s overall safety risks. The constructor focuses on the specific sub-projects’ safety risks during construction. As a crucial link of information transmission between the owner and the constructor, the supervisor should be aware of the differences between their understandings and views, such that the information transmission can be ensured and contrasting feelings can be reduced, and all members could participate in safety risk management processes. The monitoring unit is to use various technical means to monitor key parts of the construction to ensure the safety of construction process. The advanced forecast could be applied to identify the hydrological and geological conditions and reduce the probability of accidents and the extent of damage. Although the advanced forecast (Y1) and dynamic control (Y2) are made of yellow three-dimensional spaces, they should get the most attention compared with the monitoring unit’s other management processes. The essence of management is the optimal allocation of resources. Generally, the resources in the projects such as funds and labors are limited, so how to scientifically and selectively allocate resources are the key to improving safety management performance. The research results could provide a reference for resource input strategy formulation. For example, if the current resources could improve one defect in management process, Y4 with the most red three-dimensional space should be selected for maximum safety management performance. By optimizing resource allocation and arranging the order of resource input, the safety risk management level of URT could be improved, with a maximum avoidance of accidents.
5. Conclusions and Limits
Currently, the safety risk managers could not effectively determine the management focuses due to the limitations of data deficiencies and unclear relationships among participants, management defects and direct safety risk factors. To overcome the limitations, this research has applied the text mining method for the safety risk analysis. Fifteen safety risk factors and 3 participants of URT construction have been identified from 156 accident reports, which respectively are underground pipeline, hidden danger elimination, enclosure protection, safety consciousness, violation of regulations working, hydrogeologic condition, construction monitoring, advanced forecast, dynamic control, construction coordination, safety specification, timely communication, safety measures, personnel education, construction management plan, constructor, supervisor and monitoring unit. Then calculation by formula 3, the relative probabilities of these safety risk factors and participants are 23.08%, 44.23%, 23.08%, 69.23%, 76.92%, 40.38%, 30.77%, 42.31%, 40.38%, 32.69%, 61.54%, 32.69%, 48.08%, 28.85%, 13.46%, 57.00%, 24.00% and 19.00%. Moreover, the accident descriptive model has been established by clustering algorithm provided by the text mining software, including management defects, direct safety risk factors and participants. The model is to extract structured knowledge from a large amount of unstructured data. The construction accidents of follow-up projects could also refer to the model for analysis and statistics to continuously accumulate safety risk data. Then through network structure analysis of safety risk factors and risk assessment, 63 kinds of relationships and corresponding safety risk values are determined among participants, management defects and direct safety risk factors. At the same time, it is found that the safety risk value of the relationship among the constructor, the safety specification and the regulations working is the largest, which means that the relationship is the most likely to cause an accident. The visualization of the risk values has been realized on the basis of the accident descriptive model and ABC analysis, and the core processes, important processes and general processes of safety risk management are made clear. The constructor should focus on the construction coordination, safety specification, safety measures, personnel education, etc. The supervisor should pay attention to timely communication. The monitoring unit should emphasis on advanced forecast and dynamic control. To sum up, the safety risk management of URT construction could be ultimately improved by paying great attention to the planning, strengthening process monitoring and coordination on the basis of full communication and enhancing the knowledge level within the organization. The essence of management is to allocate limited resources into different processes to achieve the organization’s target. The management performance and economic benefit could also be improved by clearing the importance degree of safety risk management processes and reasonably arranging and using the limited resources. At present, China is at a rapid development stage. As the trend shows that number of construction projects increase year to year, countless of unstructured Chinese documents will be produced, where manual analysis is not economically feasible by project management. Therefore, a rapid extraction of useful knowledge and information from these Chinese documents to support management decision-making and improvement of management has become a pressing issue. Although this paper chooses only one type of accident reports, and the problem about importance degree of safety risk management is only solved according to the research results, other scholars can also refer to the method proposed in the paper to deal with other documents from the safety risk management process and solve other problems. They even can apply this method to quality management, cost management and schedule management. Having rich historical experience, lessons, knowledge and information which is hidden in uncountable unstructured documents are the preconditions to solve the problem correctly and reasonably.
This research also has limitations. The data are from the State Administration of Work Safety and its subordinate departments. These national safety management departments usually release accidents involving death or serious economic losses, while a large number of accidents without serious losses are not released. In addition, some safety risk factors is described by a sentence or a paragraph. However, the text mining method cannot understand the semantics of sentences and paragraphs, which can leave out useful knowledge and information. In the future research, we need to deeply analyze the characteristics of Chinese grammar, and consider how to combine ontology and text mining, how to design text mining algorithms using R language or python language. Through such research and analysis, the text mining method has the ability of semantic analysis to find more useful knowledge from unstructured documents.
Acknowledgments
This work was supported by National Natural Science Foundation of China (No. 71672180) and Foundation of Ministry of Housing and Urban-Rural Development of China (No.R32016036 and 2015-R3-010).
Author Contributions
The initial idea of the study was comprehended by Jie Li, Jianping Wang and Na Xu; Jie Li, Yunpeng Hu and Caiyun Cui designed and performed the experiments; Yunpeng Hu and Caiyun Cui analyzed the data; Jie Li wrote the paper. All authors have read and approved the final manuscript.
Conflicts of Interest
The authors declare no conflict of interest.
References
- Gnoni, G.; Andriulo, S.; Maggio, G.; Nardone, P. Lean Occupational Safety: An Application for a Near-miss Management System Design. Saf. Sci. 2013, 53, 96–104. [Google Scholar] [CrossRef]
- Ministry of Housing and Urban-Rural Construction of the People’s Republic of China. Report on Safety of Municipal Works Production in 2016. 2016. Available online: http://www.mohurd.gov.cn/wjfb (accessed on 20 March 2017).
- Zhou, Z.P.; Irizarry, J. Integrated Framework of Modified Accident Energy Release Model and Network Theory to Explore the Full Complexity of the Hangzhou Subway Construction Collapse. J. Manag. Eng. 2016, 32, 131–139. [Google Scholar] [CrossRef]
- Esmaeili, B.; Hallowell, M. Attribute-Based Safety Risk Assessment I: Analysis at the Fundamental Level. J. Constr. Eng. Manag. 2015, 141, 15–21. [Google Scholar] [CrossRef]
- Khan, F.; Hashemi, S.J.; Paltrinieri, N. Dynamic Risk Management: A Contemporary Approach to Process Safety Management. Curr. Opin. Chem. Eng. 2016, 14, 9–17. [Google Scholar] [CrossRef]
- Ahmed, Q.; Khan, F.; Ahmed, S. Improving Safety and Availability of Complex Systems Using a Risk-based Failure Assessment Approach. J. Loss Prev. Process Ind. 2014, 32, 218–229. [Google Scholar] [CrossRef]
- Aven, T.; Renn, O.; Rosa, E.A. On the Ontological Status of the Concept of Risk. Saf. Sci. 2011, 49, 1074–1079. [Google Scholar] [CrossRef]
- Aven, T.; Zio, E. Foundational Issues in Risk Assessment and Risk Management. Risk Anal. 2013, 32, 1164–1172. [Google Scholar]
- Heinrich, H.W. Industrial Accident Prevention; McGraw-Hill: New York, NY, USA, 1931. [Google Scholar]
- Reason, J. Managing the Risks of Organizational Accidents; Routledge: New York, NY, USA, 1997. [Google Scholar]
- Hola, B.; Szostak, M. Methodology of Analysing the Accident Rate in the Construction Industry. Proced. Eng. 2017, 172, 355–362. [Google Scholar] [CrossRef]
- Swian, A.D. The Human Element in Systems Safety: A Guide for Modern Management; Industrial and Commercial Techniques: London, UK, 1974. [Google Scholar]
- Ferry, T.S. Modern Accident Investigation and Analysis; Wiley: New York, NY, USA, 1988. [Google Scholar]
- Grayson, G.B.; Hakkert, A.S. Accident Analysis and Conflict Behavior. Road Users Traffic Safety; VAN GORCUM & COMP BV: Assen, The Netherlands, 1987. [Google Scholar]
- Wen, S.; Xu, X. Risk Analysis of Double Shield TBM Construction Accident Induced by Tunnel Deformation. Chin. J. Rock Mech. Eng. 2011, S1, 3060–3065. [Google Scholar]
- Sousa, V.; Almeida, N.; Dias, L. Risk-based Management of Occupational Safety and Health in the Construction Industry-Part 2: Quantitative model. Saf. Sci. 2015, 74, 184–194. [Google Scholar] [CrossRef]
- Rivas, T.; Paz, M.; Martin, J.; Matias, J. Explaining and Predicting Workplace Accidents Using Data-mining Techniques. Reliab. Eng. Syst. Saf. 2011, 96, 739–747. [Google Scholar] [CrossRef]
- Weng, J.; Zheng, Y.; Yan, X. Development of a Subway Operation Incident Delay Model Using Accelerated Failure Time Approaches. Accid. Anal. Prev. 2014, 73, 12–19. [Google Scholar] [CrossRef] [PubMed]
- Leu, S.; Chang, C. Bayesian-network-based Safety Risk Assessment for Steel Construction Projects. Accid. Anal. Prev. 2013, 54, 22–123. [Google Scholar] [CrossRef] [PubMed]
- Sousa, V.; Almeida, N.D. Risk-based Management of Occupational Safety and Health in the Construction Industry-Part 1: Background Knowledge. Saf. Sci. 2014, 66, 75–86. [Google Scholar] [CrossRef]
- Gholizadeh, P.; Esmaeili, B. Electrical Contractors’ Safety Risk Management: An Attribute-based Analysis. Comput. Civ. Eng. 2015, 181–189. [Google Scholar] [CrossRef]
- Figueres-Esteban, M.; Hughes, P.; Gulijk, C.V. Visual Analytics for Text-based Railway Incident Reports. Saf. Sci. 2016, 89, 72–76. [Google Scholar] [CrossRef]
- Tixier, J.; Hallowell, M. Automated Content Analysis for Construction Safety: A Natural Language Processing System to Extract Precursors and Outcomes from Unstructured Injury Reports. Autom. Constr. 2016, 62, 45–56. [Google Scholar] [CrossRef]
- Hola, B. Identification and Evaluation of Processes in a Construction Enterprise. Arch. Civ. Mech. Eng. 2015, 15, 419–426. [Google Scholar] [CrossRef]
- Esmaeili, B.; Hallowell, M. Attribute-Based Risk Model for Measuring Safety Risk of Struck-By Accidents. Constr. Res. Congr. 2012, 289–298. [Google Scholar] [CrossRef]
- Rodrigues, R.S.; Balestrassi, P.P. Aircraft Interior Failure Pattern Recognition Utilizing Text Mining and Neural Networks. J. Intell. Int. Syst. 2012, 38, 741–766. [Google Scholar] [CrossRef]
- Fan, H.; Li, H. Retrieving Similar Cases for Alternative Dispute Resolution in Construction Accidents Using Text Mining Techniques. Autom. Constr. 2013, 34, 85–91. [Google Scholar] [CrossRef]
- Sanmiquel, L.; Rossell, J. Study of Spanish Mining Accidents Using Data Mining Techniques. Saf. Sci. 2015, 75, 49–55. [Google Scholar] [CrossRef]
- Tanguy, L.; Tulechki, N.; Urieli, A. Natural Language Processing for Aviation Safety Reports: From Classification to Interactive Analysis. Comput. Ind. 2016, 78, 80–95. [Google Scholar] [CrossRef] [Green Version]
- Stojadinovic, S.; Svrkota, I.; Petrovic, D. Mining Injuries in Serbian Underground Coal Mines-a 10-year Study. Injury 2012, 43, 2001–2005. [Google Scholar] [CrossRef] [PubMed]
- Baeza, Y. Modern Information Retrieval; ACM Press Books: New York, NY, USA, 1999. [Google Scholar]
- Kao, A.; Poteet, S.R. Natural Language Processing and Text Mining; Springer: Berlin, Germany, 2007. [Google Scholar]
- Esmaeili, B.; Hallowell, M.; Rajagopalan, B. Attribute-Based Safety Risk Assessment II: Predicting Safety Outcomes Using Generalized Linear Models. J. Constr. Eng. Manag. 2017, 141, 15–22. [Google Scholar] [CrossRef]
- Sugihara, K.; Okabe, A.; Satoh, T. Computational Method for the Point Cluster Analysis on Networks. GeoInformatica 2011, 15, 167–189. [Google Scholar] [CrossRef]
- Capo, M.; Perez, A.; Lozano, J. An Efficient Approximation to the K-means Clustering for Massive Data. Knowl. Based Syst. 2017, 117, 56–69. [Google Scholar] [CrossRef]
- Hola, B.; Sawicki, M. Tacit Knowledge Contained in Construction Enterprise Documents. Proced. Eng. 2014, 85, 231–239. [Google Scholar] [CrossRef]
- Kushwah, A.; Manjhvar, A. A Review on Link Prediction in Social Network. Int. J. Grid Distrib. Comput. 2016, 9, 43–50. [Google Scholar] [CrossRef]
- Yu, M.C. Multi-criteria ABC Analysis Using Artificial-intelligence-based Classification Techniques. Expert Syst. Appl. 2011, 38, 3416–3421. [Google Scholar] [CrossRef]
- Bhattacharya, A.; Sarkar, B. Distance-based Consensus Method for ABC Analysis. Int. J. Prod. Res. 2007, 45, 3405–3420. [Google Scholar] [CrossRef]
- Flores, B.E.; Whybark, D.C. Implementing Multiple Criteria ABC Analysis. Eng. Costs Prod. Econ. 1989, 15, 191–195. [Google Scholar] [CrossRef]
Figure 1.
Research approach and methodology.
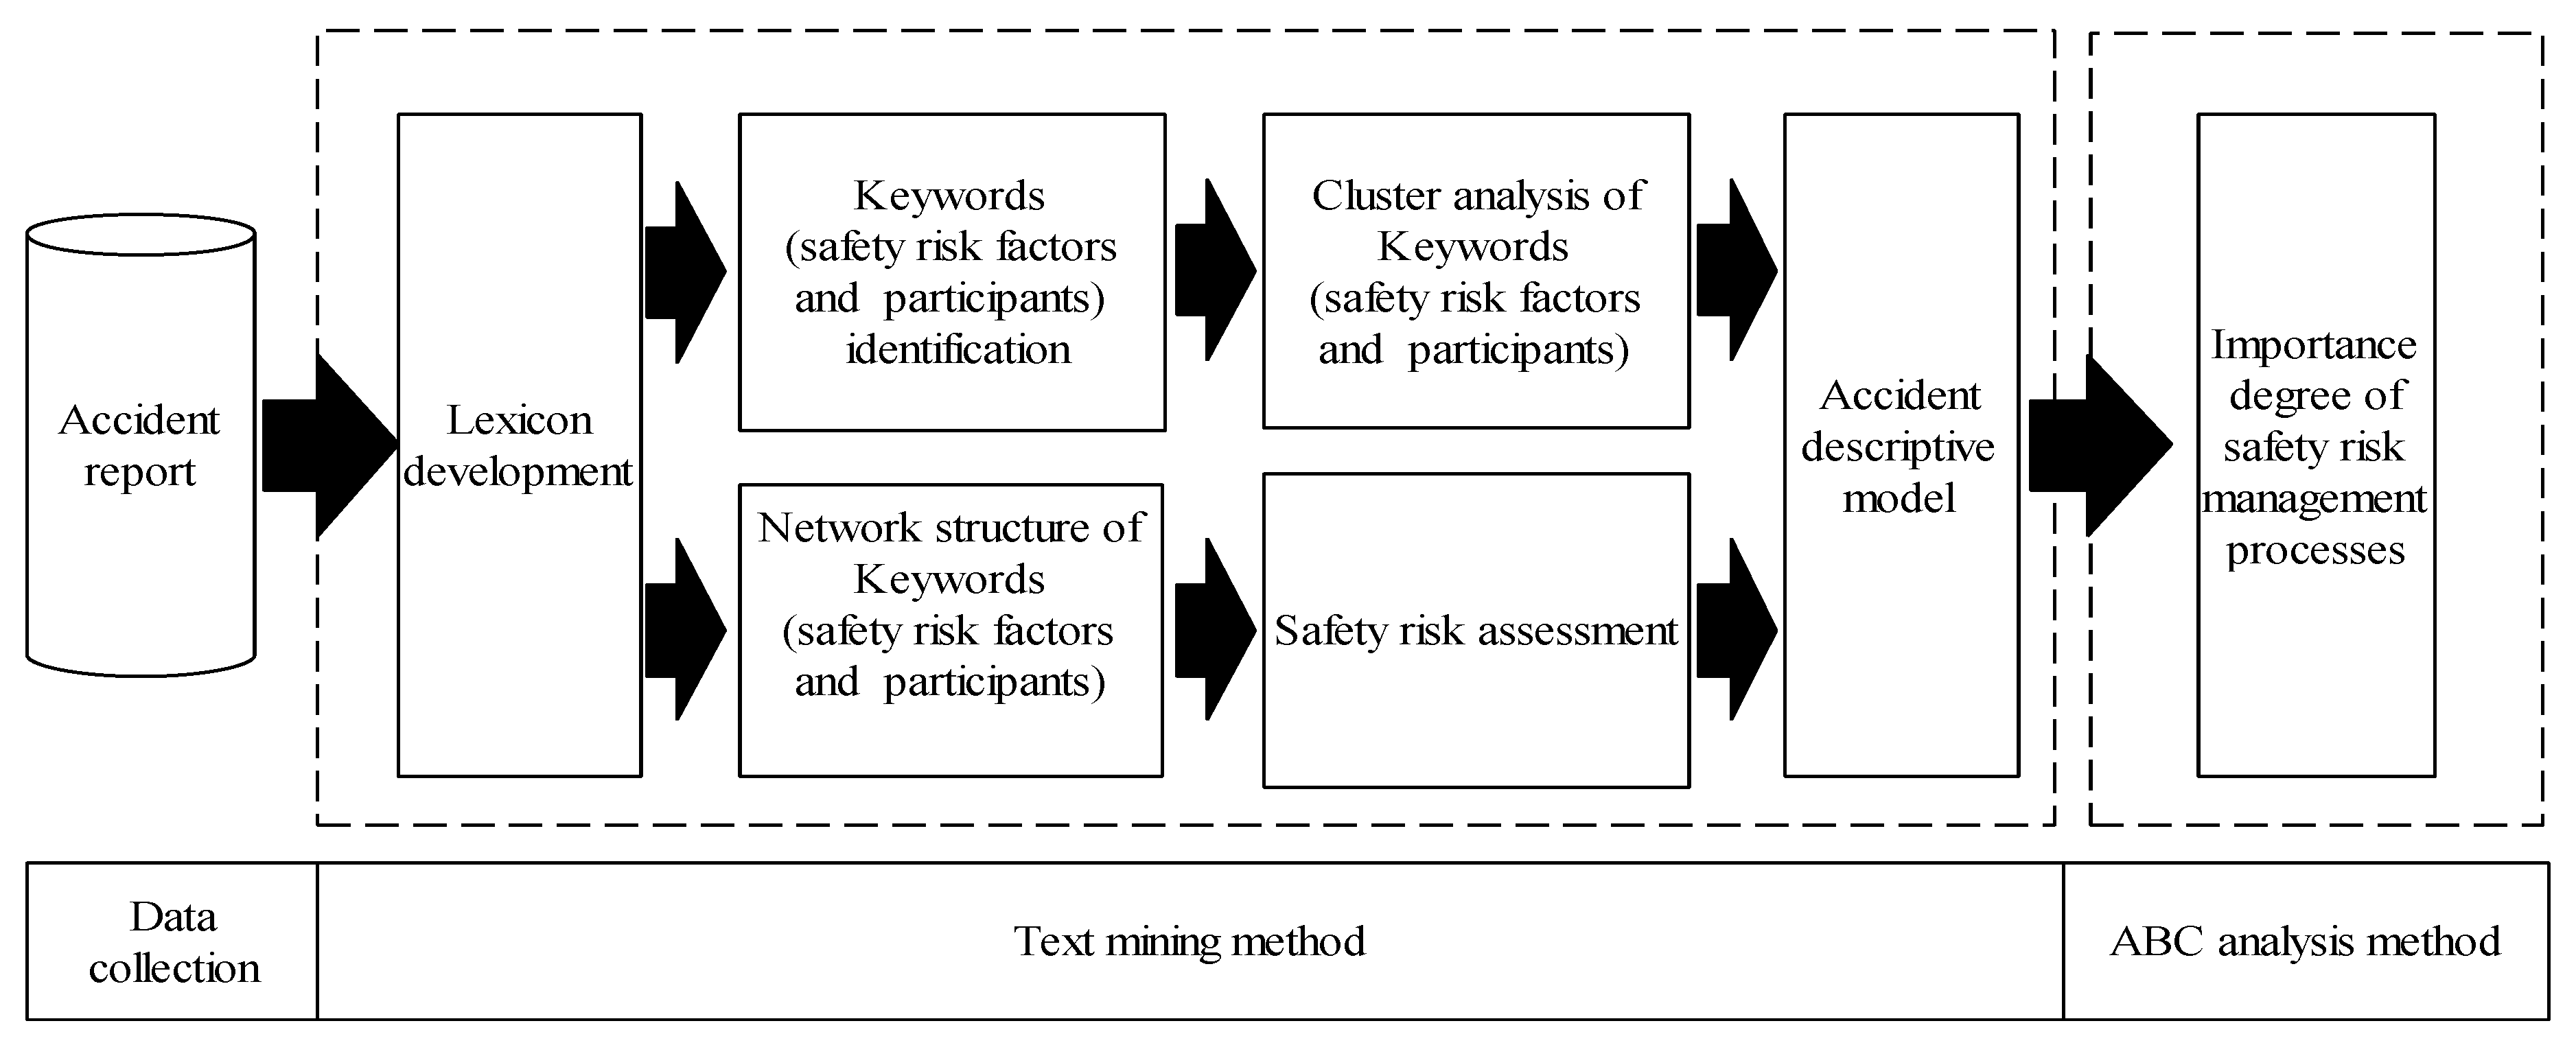
Figure 2.
Lexicon development process.

Figure 3.
Accident descriptive model.

Figure 4.
Cluster analysis results of safety risk factors and participants.
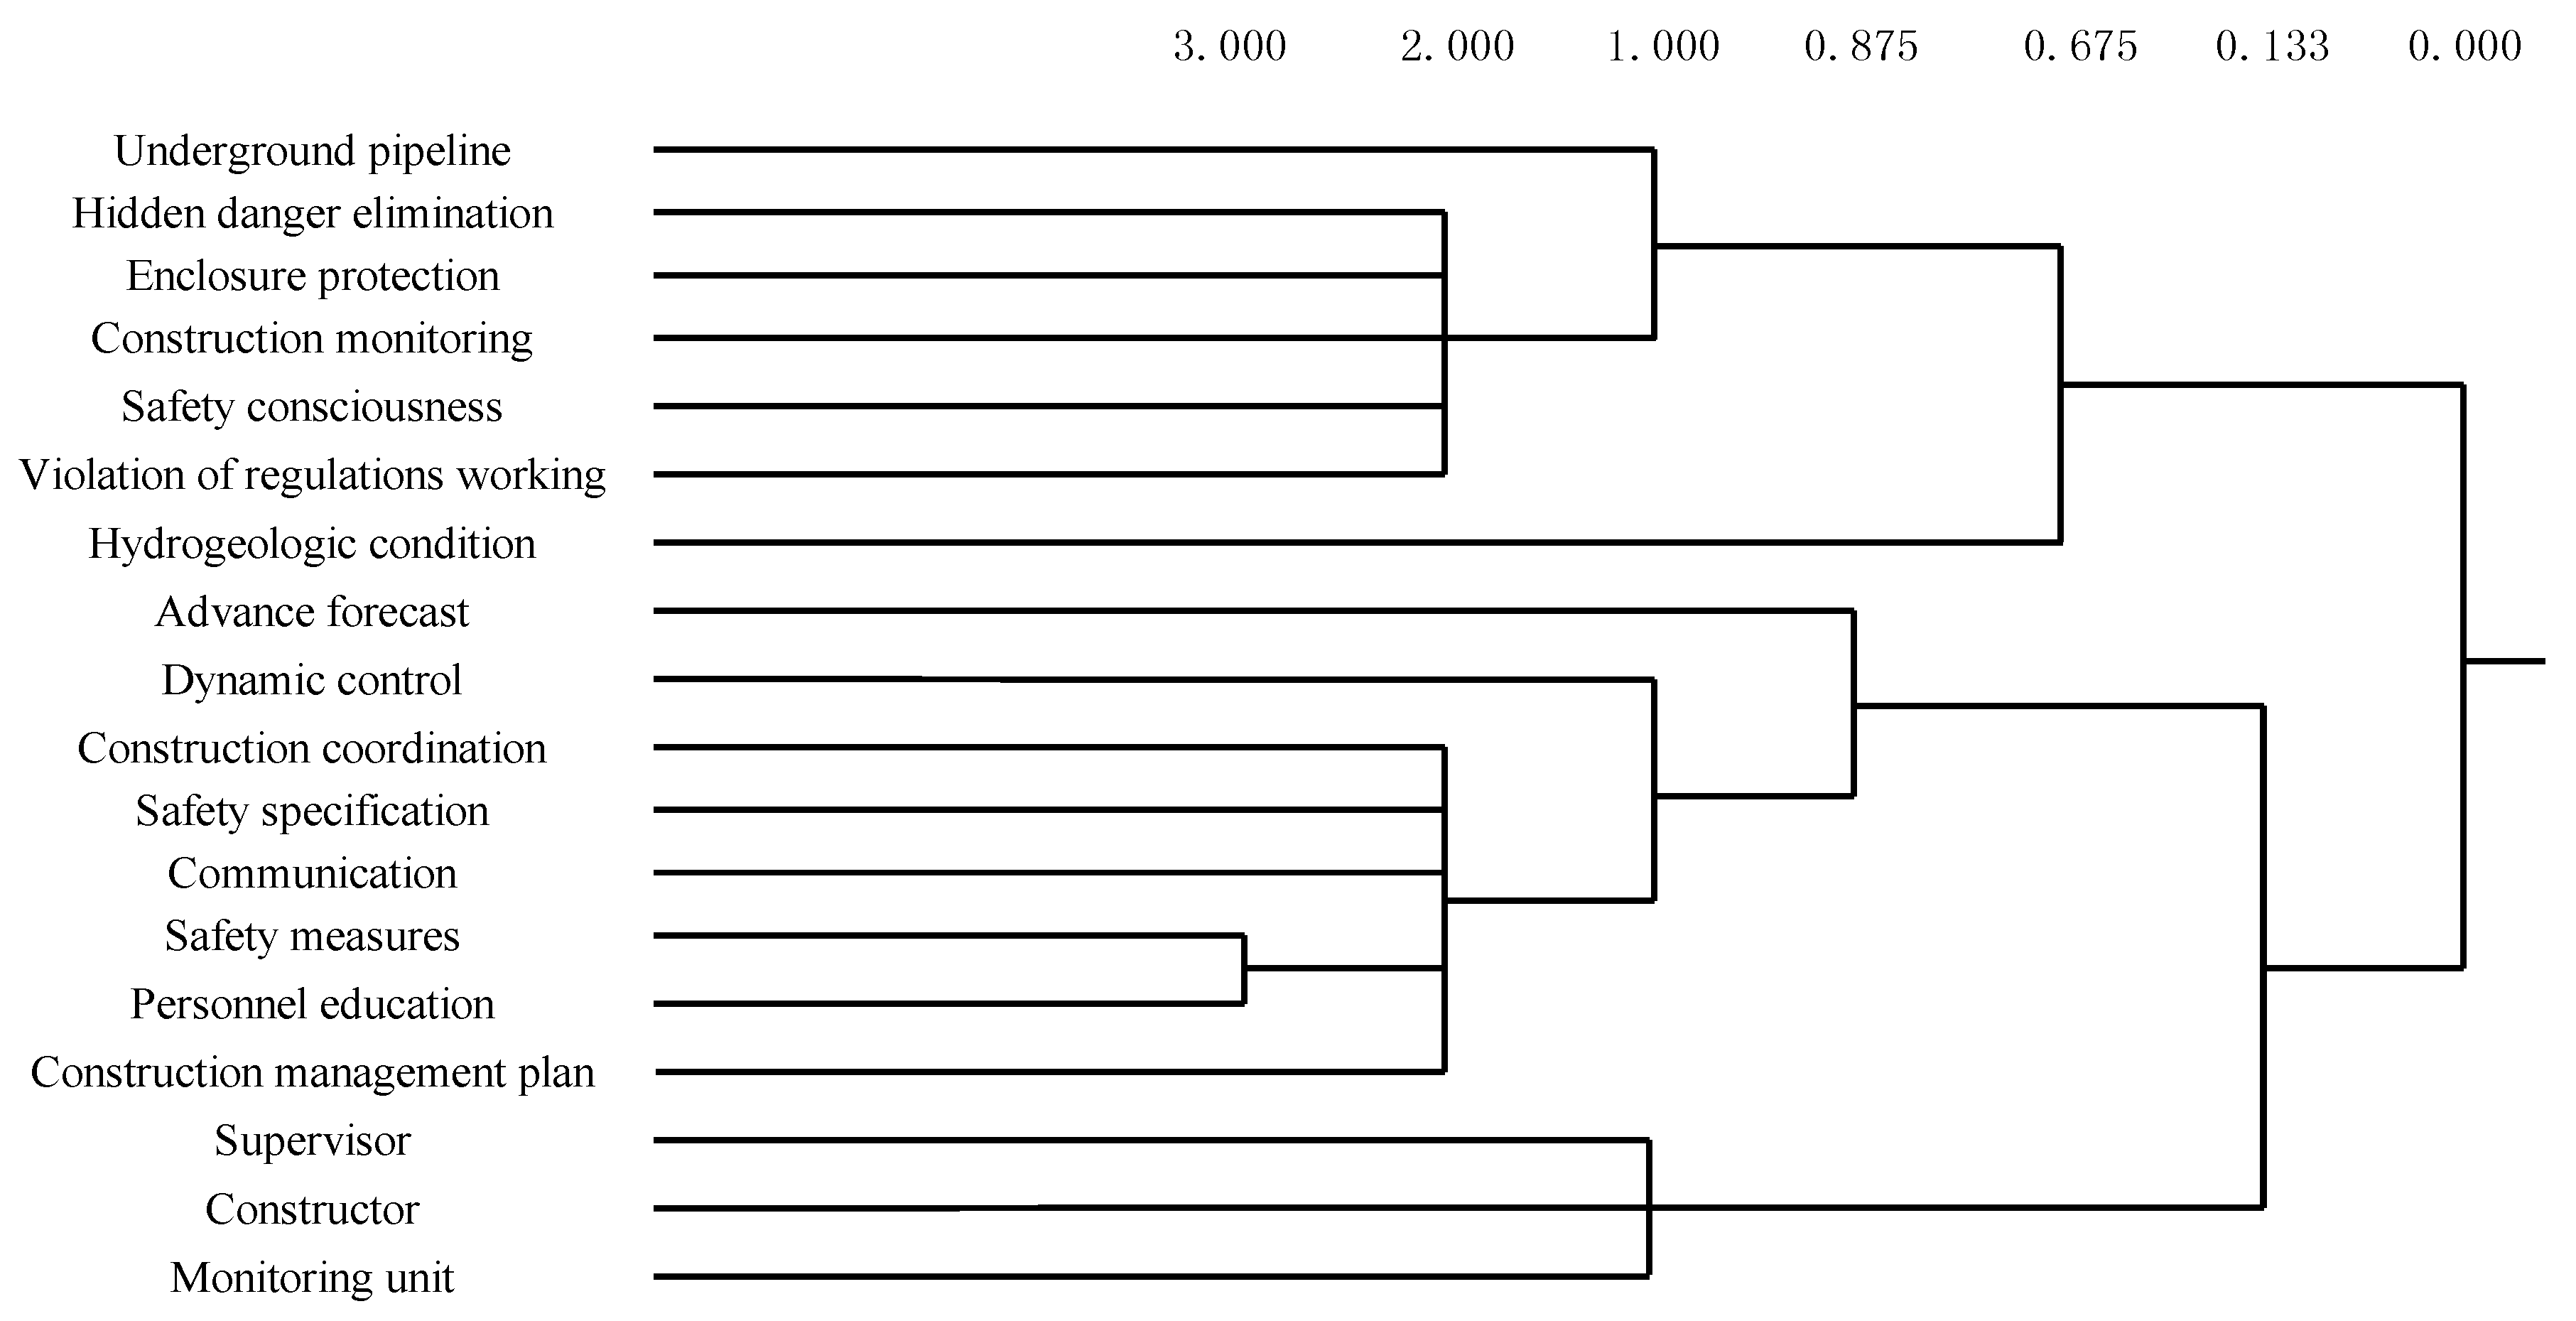
Figure 5.
Accident descriptive model.
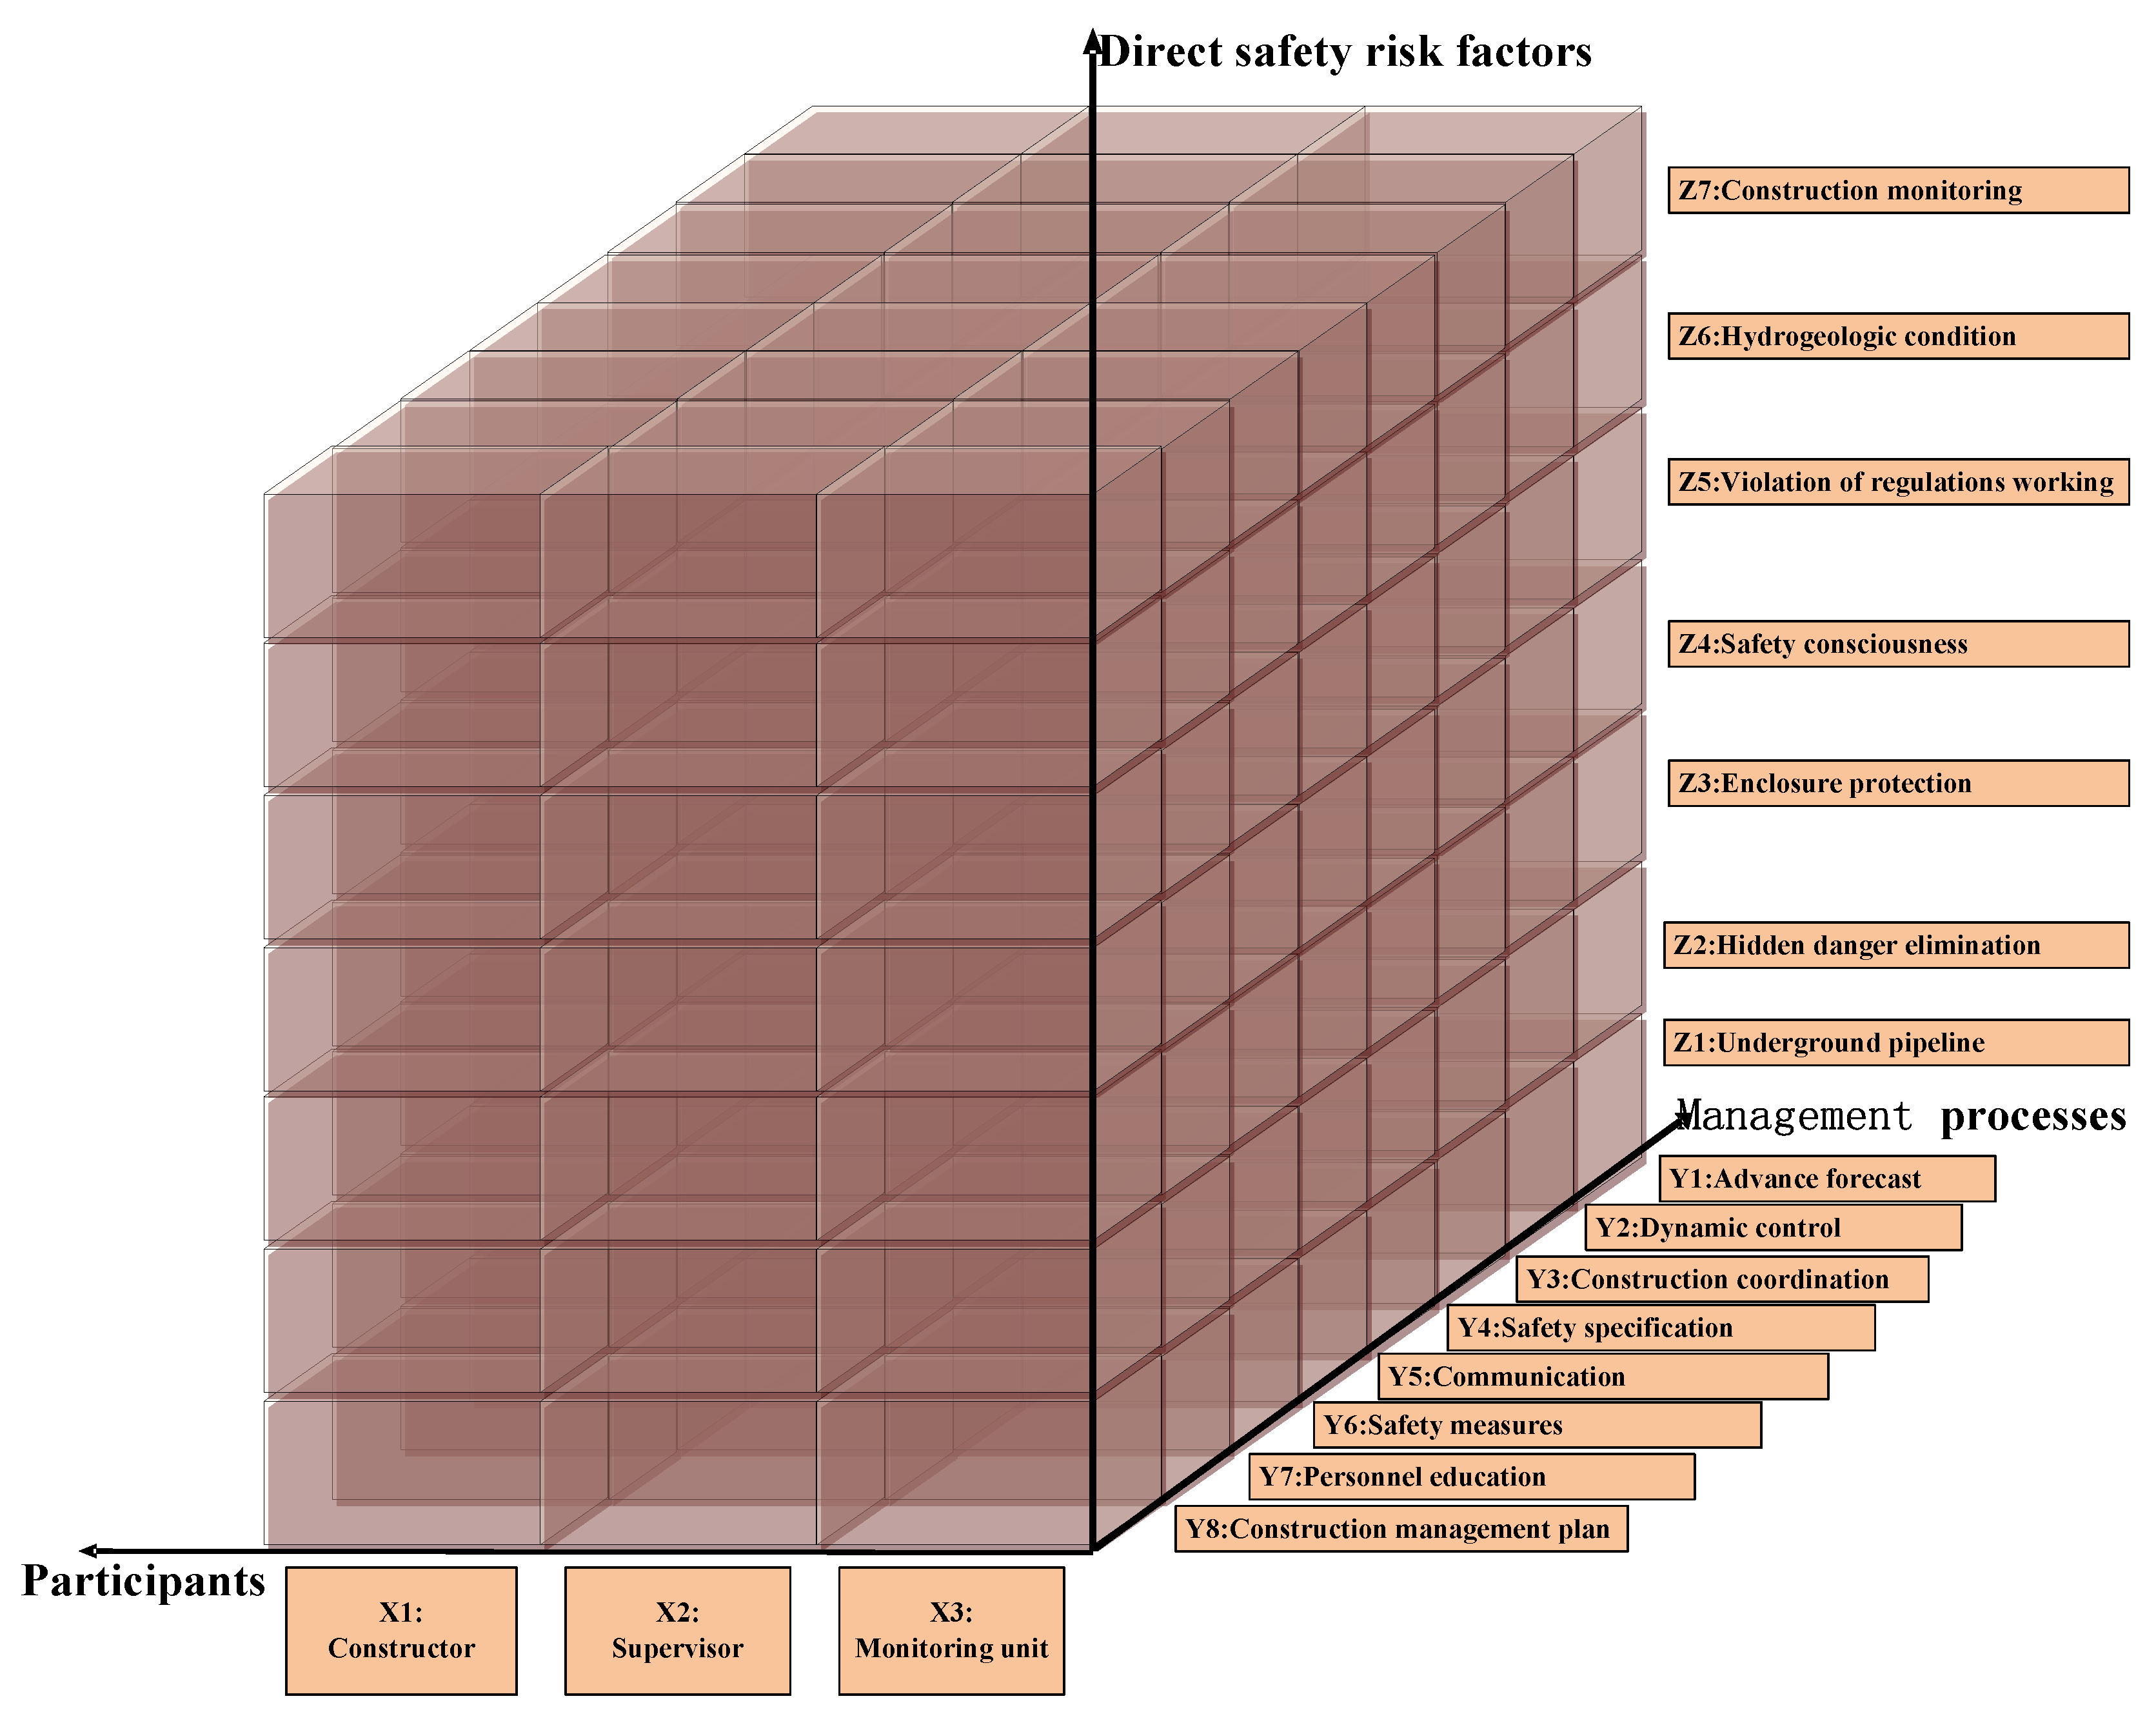
Figure 6.
The co-occurrence matrix and the network structure.

Figure 7.
156 accident points.
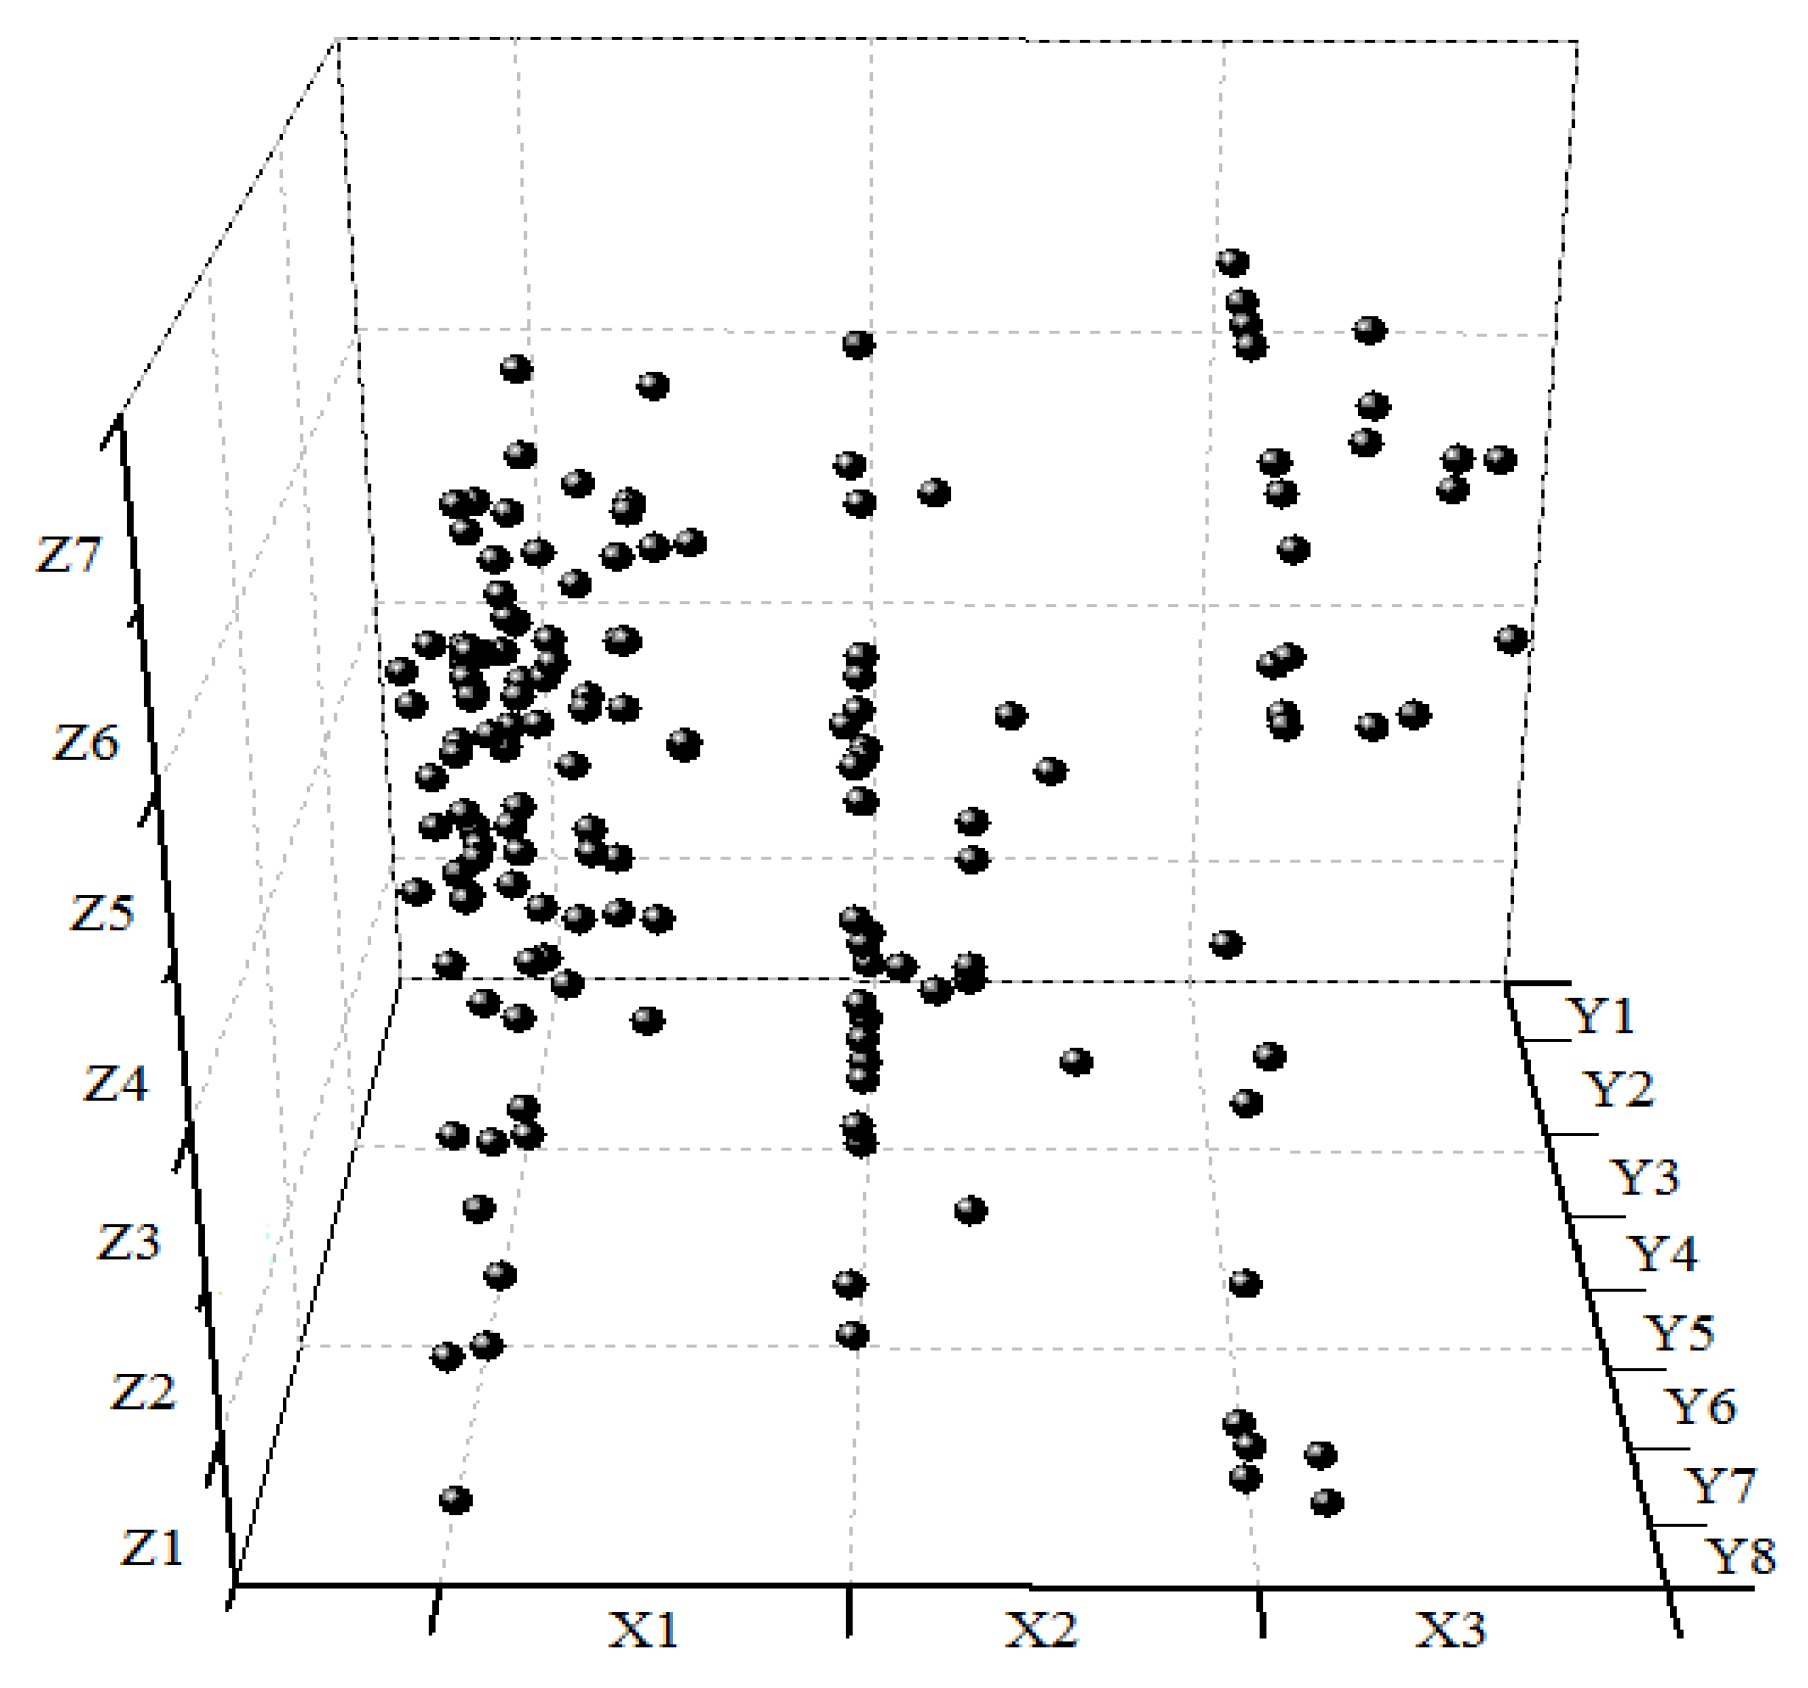
Figure 8.
Importance degree of safety risk management processes by ABC analysis.

Figure 9.
Importance degree of safety risk management processes.


Table 1.
Value standard of accident loss.
| Level of Risk | A | B | C | D | E |
|---|---|---|---|---|---|
| Deaths | >10 | 3–9 | 1–2 | seriously wounded | slight injury |
| Economic loss(million) | >10 | 5–10 | 1–5 | 0.5–1 | <0.5 |
| Loss value | 100 | 40 | 15 | 7 | 3 |
Table 2.
Quantity of accident reports in urban rail transit (URT) construction.
| City | Quantity | City | Quantity |
|---|---|---|---|
| Beijing | 24 | Fuzhou | 3 |
| Shanghai | 20 | Shenyang | 3 |
| Guangzhou | 22 | Chongqing | 2 |
| Shenzhen | 21 | Nanning | 2 |
| Nanjing | 10 | Haerbin | 2 |
| Wuhan | 6 | Ningbo | 1 |
| Hangzhou | 6 | Kunming | 1 |
| Tianjin | 6 | Changchun | 1 |
| Xian | 5 | Changsha | 1 |
| Qingdao | 5 | Dongguan | 1 |
| Dalian | 4 | Chengdu | 1 |
| Zhengzhou | 3 | Xiamen | 1 |
Table 3.
Error values during lexicon development.
| Updating Times | 1 | 2 | 3 | 4 | 5 |
|---|---|---|---|---|---|
| Error values | 0.68 | 0.41 | 0.29 | 0.22 | 0.18 |
Table 4.
Safety risk factors and relative risk probability.
| No. | Safety Risk Factor | Report Amount (mi) | Total Report Amount (n) | Relative Risk Probability (RFi) |
| 1 | Underground pipeline | 36 | 156 | 23.08% |
| 2 | Hidden danger elimination | 69 | 156 | 44.23% |
| 3 | Enclosure protection | 36 | 156 | 23.08% |
| 4 | Safety consciousness | 108 | 156 | 69.23% |
| 5 | Violation of regulations working | 120 | 156 | 76.92% |
| 6 | Hydrogeologic condition | 63 | 156 | 40.38% |
| 7 | Construction monitoring | 48 | 156 | 30.77% |
| 8 | Advanced forecast | 66 | 156 | 42.31% |
| 9 | Dynamic control | 63 | 156 | 40.38% |
| 10 | Construction coordination | 51 | 156 | 32.69% |
| 11 | Safety specification | 96 | 156 | 61.54% |
| 12 | Communication | 51 | 156 | 32.69% |
| 13 | Safety measures | 75 | 156 | 48.08% |
| 14 | Personnel education | 45 | 156 | 28.85% |
| 15 | Construction management plan | 24 | 156 | 13.46% |
| No. | Participant | Report Amount (mi) | Total Report Amount (n) | Relative Risk Probability (RFi) |
| 1 | Constructor | 89 | 156 | 57.00% |
| 2 | Supervisor | 36 | 156 | 24.00% |
| 3 | Monitoring unit | 31 | 156 | 19.00% |
Table 5.
Safety risk factor relationships and risk values.
| No. | Relationship | Risk probability (RFi) | Casualties | Loss Value (RMi) | Risk Value (WH=8) (RVi) |
|---|---|---|---|---|---|
| Report 1 | X1-Y1-Z1 | 0.05 | 1 dead | 15 | 6.00 |
| Report 2 | X1-Y1-Z2 | 0.11 | 2 dead | 15 | 13.20 |
| Report 3 | X1-Y1-Z5 | 0.18 | 2 dead | 15 | 21.60 |
| Report 4 | X1-Y1-Z6 | 0.09 | 1dead 1slightly injured | 15 | 10.80 |
| Report 5 | X1-Y1-Z6 | 0.09 | 1dead | 15 | 10.80 |
| …… | …… | …… | …… | …… | …… |
| Report 153 | X3-Y5-Z7 | 0.02 | 1slightly injured | 3 | 0.48 |
| Report 154 | X3-Y5-Z7 | 0.02 | 1dead | 15 | 2.40 |
| Report 155 | X1-Y6-Z7 | 0.03 | 1seriously injured | 7 | 1.68 |
| Report 156 | X1-Y7-Z7 | 0.02 | 1dead | 15 | 0.30 |
© 2018 by the authors. Licensee MDPI, Basel, Switzerland. This article is an open access article distributed under the terms and conditions of the Creative Commons Attribution (CC BY) license (http://creativecommons.org/licenses/by/4.0/).
Share and Cite
MDPI and ACS Style
Li, J.; Wang, J.; Xu, N.; Hu, Y.; Cui, C. Importance Degree Research of Safety Risk Management Processes of Urban Rail Transit Based on Text Mining Method. Information 2018, 9, 26. https://doi.org/10.3390/info9020026
AMA Style
Li J, Wang J, Xu N, Hu Y, Cui C. Importance Degree Research of Safety Risk Management Processes of Urban Rail Transit Based on Text Mining Method. Information. 2018; 9(2):26. https://doi.org/10.3390/info9020026
Chicago/Turabian StyleLi, Jie, Jianping Wang, Na Xu, Yunpeng Hu, and Caiyun Cui. 2018. "Importance Degree Research of Safety Risk Management Processes of Urban Rail Transit Based on Text Mining Method" Information 9, no. 2: 26. https://doi.org/10.3390/info9020026
Note that from the first issue of 2016, this journal uses article numbers instead of page numbers. See further details here.