Experimental Analysis of Stemming on Jurisprudential Documents Retrieval †

Departamento de Computação, Universidade Federal de Sergipe—UFS, São Cristóvão/SE 49100-000, Brazil
*
Author to whom correspondence should be addressed.
†
This paper is an extended version of our paper published in the ICEIS 2017: 19th International Conference on Enterprise Information Systems, Porto, Portugal, 26–29 April 2017.
Information 2018, 9(2), 28; https://doi.org/10.3390/info9020028
Submission received: 3 January 2018
/
Revised: 24 January 2018
/
Accepted: 25 January 2018
/
Published: 27 January 2018
(This article belongs to the Special Issue Information Technology: New Generations (ITNG 2017))
Abstract
:Stemming algorithms are commonly used during textual preprocessing phase in order to reduce data dimensionality. However, this reduction presents different efficacy levels depending on the domain that it is applied to. Thus, for instance, there are reports in the literature that show the effect of stemming when applied to dictionaries or textual bases of news. On the other hand, we have not found any studies analyzing the impact of radicalization on Brazilian judicial jurisprudence, composed of decisions handed down by the judiciary, a fundamental instrument for law professionals to play their role. Thus, this work presents two complete experiments, showing the results obtained through the analysis and evaluation of the stemmers applied on real jurisprudential documents, originating from the Court of Justice of the State of Sergipe. In the first experiment, the results showed that, among the analyzed algorithms, the RSLP (Removedor de Sufixos da Lingua Portuguesa) possessed the greatest capacity of dimensionality reduction of the data. In the second one, through the evaluation of the stemming algorithms on the legal documents retrieval, the RSLP-S (Removedor de Sufixos da Lingua Portuguesa Singular) and UniNE (University of Neuchâtel), less aggressive stemmers, presented the best cost-benefit ratio, since they reduced the dimensionality of the data and increased the effectiveness of the information retrieval evaluation metrics in one of analyzed collections.
1. Introduction
Every day, the courts, through their magistrates, judge the most varied themes of the law, generating a large body of legal knowledge that guides new decisions and serves as argumentative base to the related parties that plead their interests. Thus, from the corpus formed by the set of uniform decisions handed down by the judiciary on a given subject [1], emerges the concept of jurisprudence, a fundamental instrument for law professionals to play their role. For Santos [2] (p. 137), jurisprudence is the science of law and the principles of law followed in a country, at a given time or in certain and determined legal matters.
Faced with the need to search in these jurisprudential bases, each court ends up developing its own solution, both to recover and to display the results found. According to Magalhaes [3], most of these tools make use of keywords, without applying any radicalization algorithm, so that searching for “fatal” returns only documents that contain exactly that term, ignoring those who only have “fatalidade” (fatality), for example. Thus, many documents that could be relevant to the user’s need, end up not being found during searches. Faced with these gaps, third parties, such as JusBrasil [4], develop solutions that seek to make jurisprudential searches in a standardized way in the different Courts of the country. However, since these third party applications are proprietary, they do not publish technical aspects of their implementations on their websites.
Outside the legal domain, Flores and Moreira [5] evaluated the impact of stemming algorithms on improving document retrieval systems written in English, French, Spanish and Portuguese. For this purpose, they used different document collections for each language. In the case of Portuguese, using the Folha de São Paulo database, they concluded that the algorithms reduced the number of distinct terms in the index by up to 31.59% and at least six of them presented a statistically significant increase in Mean Average Precision (MAP). However, the legal domain has its own jargon, emphasizes the non-repetition of words and makes use of a more elaborate vocabulary. Thus, these characteristics may have a direct influence on the effectiveness of the algorithms [6].
Knowing that on non-juridic documents the application of radicalization reduced the dimensionality of the data and also increased the relevance of the results returned by the search system, the judiciary could benefit from these findings if there was experimental evidence showing that the same results are obtained by stemming judicial databases. In addition, this reduction of dimensionality would contribute to increase the savings of computational resources, since smaller indexes occupy less disk space and RAM, allowing them to be reallocated to other activities related to the provision of judicial service to the citizen.
In this sense, we use the jurisprudential database of the Supreme Court of the State of Sergipe (in Portuguese, Tribunal de Justiça do Estado de Sergipe (TJSE)), consisting of four collections of documents (detailed in Section 2): judgments of Appeals Court (acórdãos do Segundo Grau), monocratic decisions of Appeals Court (decisões monocráticas do Segundo Grau), judgments of Special Courts (Acórdãos da Turma Recursal) and monocratic decisions of Special Courts (decisões monocráticas da Turma Recursal). For dimensionality reduction, we made use of the Porter, RSLP, RSLP-S and UniNE algorithms (explained in Section 3). Faced with such a scenario, the following research questions were enumerated:
- Q1: In the jurisprudential context, does the application of radicalization algorithms significantly reduce the number of unique terms per document?
- Q2: Is the effectiveness of stemming algorithms the same in all court collections?
- Q3: Does radicalization have an effect on the jurisprudential documents retrieval?
Although Q1 seems trivial because, theoretically, we would suppose the stemmers can reduce the number of unique terms in any document, only the scientific data can support a hypothesis that, when put to the test, can produce evidences that allow, temporarily, not to reject some pattern. In fact, according to Weiss et al. [7]:
We cannot make any broad recommendations as to when or when not to use such stemmers. The usefulness of stemming is very much application-dependent. When in doubt, it doesn’t hurt to try both with and without stemming if one has the resources to do so.[7] (p. 25)
To guide this work, we synthesized these three questions under the hypothesis that, among the algorithms Porter, RSLP, RSLP-S and UniNE, there is at least one that has a statistically significant dimensionality reduction without decreasing the efficacy of jurisprudential retrieval. Considering this hypothesis, we conducted two experiments: one to measure dimensionality reduction and another to analyze the impact of this reduction on the documents retrieval.
In the first experiment, the results showed that, among the analyzed algorithms, the RSLP possessed the greatest capacity of dimensionality reduction of the data. In the second one, through the evaluation of the stemming algorithms on the legal documents retrieval, the RSLP-S and UniNE, less aggressive stemmers, presented the best cost-benefit ratio, since they reduced the dimensionality of the data and increased the effectiveness of the information retrieval evaluation metrics in one of analyzed collections.
This paper is an extended version of our paper published in [8] and it was organized as follows. The next section presents the concept of jurisprudence in the context of Brazilian law. Section 3 introduces Stemming. Section 4 describes the information retrieval evaluation metrics used throughout the article. In Section 5, we detail the experimental evaluation of our approach. Section 6 discusses related works. Finally, Section 7 closes the paper with conclusions and a discussion of future work.
2. Jurisprudence
In Brazil, the decisions issued by magistrates generate three types of documents [2]:
- Sentence: when the judge utters a procedural trial in first instance;
- Monocratic Decision: when a magistrate decides alone, in second instance, a lawsuit that has uniform interpretation; and
- Judgment (Acórdão): when collegiate organ, composed by one rapporteur and at least two magistrates, utters sentence in second instance.
Thus, jurisprudence is a decision in second instance and may be the result of an appeal from a sentence uttered by an Appeals Court (Primeiro Grau) judge or by Special Courts (Juizados Especiais) judge, creating specifics documents for each one of them. With such document base, it is necessary to adopt techniques that increase the efficiency of storage and search for such information, otherwise there is a loss of both computing resources and access to justice, as stakeholders may not find the document they need to plead their rights.
In this scenario, according to [5,9], stemming algorithms can reduce the texts dimensionality, thereby improving the use of computing resources, and increase the relevancy of the results returned by retrieval systems. However, this reduction presents different efficacy levels depending on the domain it is applied. The legal universe has its own jargon and we have not found reports in the literature showing that the same benefits are obtained when stemming is applied to jurisprudential bases.
3. Stemming
The stemming process consists of grouping different words connected by a common stem, based on a set of rules which act by removing suffixes and prefixes. Table 1 shows the application of five stemming algorithms used during this experiment with six distinct words, in which NoStem is the control group, i.e., it generates no reduction of terms.
Except for the control group, the other algorithms used in the experiment are based on rules and act by removing suffixes [5]:
- Porter: originally written in English, in 1980, and adapted to Portuguese language later [10];
- RSLP (Removedor de Sufixos da Lingua Portuguesa): published in 2001, contains approximately 200 rules and an exception list to almost each one of them [11];
- RSLP-S (Removedor de Sufixos da Lingua Portuguesa Singular): a lean version of RSLP that uses only plural reduction [9]; and
- UniNE (University of Neuchâtel): contains less rules than Porter and RSLP, however it is more aggressive than RSLP-S [5].
Thus, considering semantic and morphological aspects, a stemming algorithm can commit two error types: (a) overstemming, when the part removed is not a suffix, instead it is part of the word stem; and (b) understemming, when the suffix removal does not take place fully. In this study, the analysis of these errors would not contribute to the metrics calculation, since the algorithm used to make the relevance judgment, nruns, takes into account only the number of times a given document appears in the search results, regardless of the semantic aspects of the terms involved.
4. Information Retrieval Evaluation
In the mid-1960s, a work was published with the results of the experimental evaluation of a collection containing 1400 documents and 225 queries in the aerodynamics area, evaluating the effectiveness of different indexing languages [12]. To this end, for each query, the collection of documents was divided into two groups: relevant and non-relevant (Table 2).
According to the classification of the document and whether it was found or not by the search system, as illustrated by Table 2, three metrics were calculated: precision (Equation (1)), recall (Equation (2)), and fallout (Equation (3)).
Even today, the method used by Cleverdon [12] represents the foundation on which the effectiveness of the retrieval systems is evaluated [13]. However, with the increase in computational power that occurred in the following decades, the volume of documents in the digital collections raised dramatically, making it impossible to analyze the relevance of millions of documents in full. Thus, should different retrieval systems that work on these large collections be compared?
With this in mind, in 1990, the Advanced Research Projects Agency (DARPA) started a partnership with the National Institute of Standards and Technology to build a test collection of millions of documents to evaluate the TIPSTER [13] project. That was hundreds of times bigger than non-proprietary collections at the time. The following year, this collection was made available to the community and gave rise to the first Text Retrieval Conference (TREC) to encourage research on retrieval systems on large collections.
Thus, experts have compiled a list of topics, each containing a single identifier, describing an information need and what would be the judgment criteria used to consider a given document in the collection as being relevant. This list was made available to conference participants and they developed their retrieval systems to meet those information needs. Participants then submitted a list of documents returned by topic to the conference evaluators. To make the relevance judgment, the following procedure was adopted [13]:
- For each result set of a topic, the first X documents were chosen to compose a pool.
- Results from each system were combined, sorted by document identifier, and duplications were removed.
After that, this list of documents was provided for assessors to make the relevance judgment. To maintain the consistency of evaluation, each topic was judged by a single assessor. At the end of this step, each pool document was tagged as relevant or not. All documents that were not part of the pool, i.e., not judged, were considered as irrelevant. Finally, with the results of the queries returned by his system and the list containing the relevance judgment, each conference participant could calculate the metrics and publish the findings.
This process has a high cost of time and money, since it is necessary to allocate specialists both to elaborate the information needs and to judge the relevance of each pair of query-document. In fact, Roitblat et al. [14] (p. 78) said that “employing human reviewers to manually categorize the documents can cost millions of dollars [...]”. Given this issue, we have used samples from the TJSE jurisprudence retrieval system logs to elaborate the information needs (queries), since they represent the real needs of users.
For the relevance judgment, Sakai and Lin [15] conducted an experiment comparing six methods, two of which proposed by them, that do not require human intervention to evaluate the information retrieval performance. Despite the simplicity of the methods proposed by the author, they achieved an accuracy of about 80% when compared to the judgment made by humans. Faced with this result, we have decided to use the most efficient method proposed by the authors, nruns, on the jurisprudence database. In this way, the judgment of relevance was as follows:
- The same set of documents was indexed using each one of the chosen algorithms.
- One query was triggered for each of the different indexes.
- A pool of documents was composed of the first 30 results obtained from each algorithm.
- This pool was ordered in descending order by the number of times the same document appeared in the results.
- The first 30% were marked as relevant.
- This process was repeated for 100 queries in each of the four collections.
Thus, most popular documents were marked as relevant, since “systems that retrieve popular documents are not necessarily good; However, systems that do not retrieve popular documents are probably bad.” [16] (p. 98). Considering the relevance of the TREC conference to the field of research in IR, we will use three of its metrics, exemplified from a list of hypothetical documents returned by a search system (Table 3).
Thus, we will describe Pr@10, R-Precision and Average Precision metrics, through a document collection , ordered by a similarity value between the document d and the query q, calculated from a ranking function r, such that to , and a relevance judgment , returning “Yes”, assigned as 1, in the case of d being relevant to q and “No”, assigned as 0, otherwise.
Precision at Document Cutoff . This metric aims to measure the accuracy of a system considering a certain cut-off point ():
In this work, we will adopt , commonly used as a cut-off point for this metric [9,13,17]. We will call MPC (10) when we calculate the Pr@10 average of n topics (queries).
R-Precision. This metric calculates the precision in R, where R is the number of relevant documents:
While Pr@ is useful for measuring the effectiveness of a system with respect to the application, this metric is more suitable for comparing systems [13]. It is worth mentioning that in point R the precision and the recall have the same value. We will call it MRP when we calculate the R-Precision average of n queries.
For example, R-Precision (R = 8) = 5/8 = 0.62% (Table 3 R-Precision).
Average Precision. Given the number of relevant documents (R), this metric calculates the precision and recall for each position of the n documents returned by the query:
The principle is that the sooner a relevant result appears, the better. When the AP average is calculated between different topics, this metric is called Mean Average Precision (MAP).
For example, AP = (1/2 + 2/3 + 3/6 + 4/7 + 5/8 + 6/9 + 7/11 + 8/12) / 8 = 0.6 = 60% (Table 3 Average Precision).
5. The Family of Experiments
The rest of this paper describes an experimental evaluation of our approach. The presented experimental processes follow the guidelines by Wohlin et al. [18]. For each experiment, first sections will focus on the experiment definition and planning. The following sections will present the obtained experimental results. The data and artifacts used in this experiment are available at https://osf.io/as8uv/.
5.1. First Experiment
5.1.1. Goal Definition
The goal of this work is to analyze the impact of stemming algorithms in the dimensionality reduction of jurisprudential documents. To achieve it, we will conduct an experiment, in a controlled environment, in which the reduction of unique terms per document will be measured, inside each collection, along with an analysis of statistically significant differences of effectiveness of the same algorithm, among four documentary bases adopted by the study.
The following is the goal formalization, according to GQM model proposed by Basili [19]: Analyze stemming algorithms with the purpose of evaluating them with respect to dimensionality reduction and effectiveness from the point of view of data analysts in the context of TJSE’s jurisprudential documents.
5.1.2. Planning
Context Selection. The experiment will be in vitro and will use the entire judicial jurisprudence database of Supreme Court of the State of Sergipe, formed by four collections: (a) judgments of Appeals Court (181,994 documents); (b) monocratic decisions of Appeals Court (37,044 documents); (c) judgments of Special Courts (37,161 documents); and (d) monocratic decisions of Special Courts (23,149 documents).
Dependent Variables. The average of unique terms per document (UTD) and the average percentage of reduction of unique terms per document (RP) taken from the stemmer application.
- Unique Terms: = Frequency of unique terms after document stemming.
- Average of unique terms: .
- Reduction percentage: .
- Average of reduction percentage: .
Independent Variables. Document collection of judgments of Appeals Court (ASG), monocratic decisions of Appeals Court (DSG), judgments of Special Courts (ATR) monocratic decisions of Special Courts (DTR); the stemming algorithms (NoStem, Porter, RSLP, RSLP-S and UniNE).
Hypothesis Formulation. The research questions for this experiment are: Do stemming algorithms reduce the dimensionality of jurisprudential documents? Is the effectiveness of each algorithm the same for all four collections studied?
For the first research question, we considered the quantity of unique terms per document as a metric to evaluate the dimensionality reduction. For the second question, we adopted the reduction percentage of each algorithm, considering that the comparison was made among documents of a different nature, making the use of absolute values inadequate. In this scenario, the following assumptions will be verified:
Hypothesis 1 (For each of the four collections).
- Null Hypothesis H0UTD: The stemming algorithms have the same average of unique terms per document ().
- Alternative Hypothesis H1UTD: The stemming algorithms have different averages of unique terms per document ( for at least one pair()).
Hypothesis 2 (For each of the stemming algorithms).
- Null Hypothesis H0RP: The percentage averages of reduction of unique terms per document are the same in all four collections ().
- Alternative Hypothesis H1RP: The percentage averages of reduction of unique terms per document are different in all four collections ( for at least one pair()).
Selection of Participants and Objects. The documents of each collection were chosen randomly taking into consideration their number of unique terms. Thus, the quantity of documents were determined by the sample calculation of a finite population:
where n is the sample size, z is the standardized value (we adopted 1.96, i.e., 95% of trust level), is the standard deviation of population, e is the margin of error (we adopted 5% of ) and N is the population size. Table 4 shows the number of selected documents after sample calculation, along with size, mean and standard deviations of the population.
Experiment Project. The jurisprudential documents have a great variability in terms of number of characters, thus, to ensure confidence on hypothesis tests, we will utilize a randomized complete block design (RCBD) [18], this way, each algorithm will be applied to the same document and those documents will be randomly taken from each collection, increasing the experiment precision. Furthermore, before applying stemming, a preprocessing for textual standardization will be performed in which the content of documents will be shifted to small caps and punctuation characters will be removed. NoStem represents the unique terms of the document with no stemming, therefore, it acts as a control group.
Instrumentation. We developed a Java application in order to iterate on each document of the sample, applying stemming algorithms and counting the frequency of unique terms after the execution. In the end, the application will store the observations performed in a CSV file (Comma Separated Values) for each collection.
5.1.3. Experiment Execution
Preparation. The preparation phase consisted of obtaining collections referring to judicial jurisprudence. Thus, documents were extracted from an OLTP base (Online Transaction Processing) and converted to XML format (eXtensible Markup Language) facilitating the experiment packaging.
Execution. By the end of previous phases, the experiment started executing the Java application, in accordance with what was defined in the planning phase.
Data Collection. The application recorded, for each collection, the document identifier, the number of unique terms and the stemming algorithm adopted (Table 5).
Data Validation. The Java application was built using Test Driven Development (TDD) [20] approach, therefore, we wrote unit test cases to validate if the frequency count of unique terms per document worked as expected.
Averages of unique terms per document were computed and the percentage averages of dimensionality reduction were obtained by applying stemming algorithms, considering control group.
To support this analysis, interpretation and results validation, we used five types of statistical tests: the Shapiro–Wilk test, the Friedman test, the Kruskal–Wallis test, the Wilcoxon test and the Mann–Whitney test. The Shapiro–Wilk test was used to verify sampling normality, as literature shows it has higher test power than other approaches [21,22]. Considering RCBD project of the experiment, with a factor and multiple treatments, the Friedman test [23] and the Kruskal–Wallis test [18] were used to demonstrate the existence of different averages of paired and independent samples, respectively, that did not obtain data normality, verifying (Chi-Square) magnitude. Finally, a post hoc analysis of the Friedman and Kruskal–Wallis tests was run using, respectively, the Wilcoxon and Mann–Whitney tests, to compare the averages of each treatment, applying the Benferroni adjustment in the significance level [24]. As we perform multiple comparisons among different treatments, this adjustment is important, since it reduces the possibility of rejection of the null hypothesis when it is indeed true (Error Type I) [25].
5.1.4. Results and Discussions
To answer experimental questions, CSV files generated by the Java application were analyzed. The results of stemming impact on the average of unique terms per document and on percentage average of dimensionality reduction per document, can be seen in Figure 1 and Figure 2, respectively.
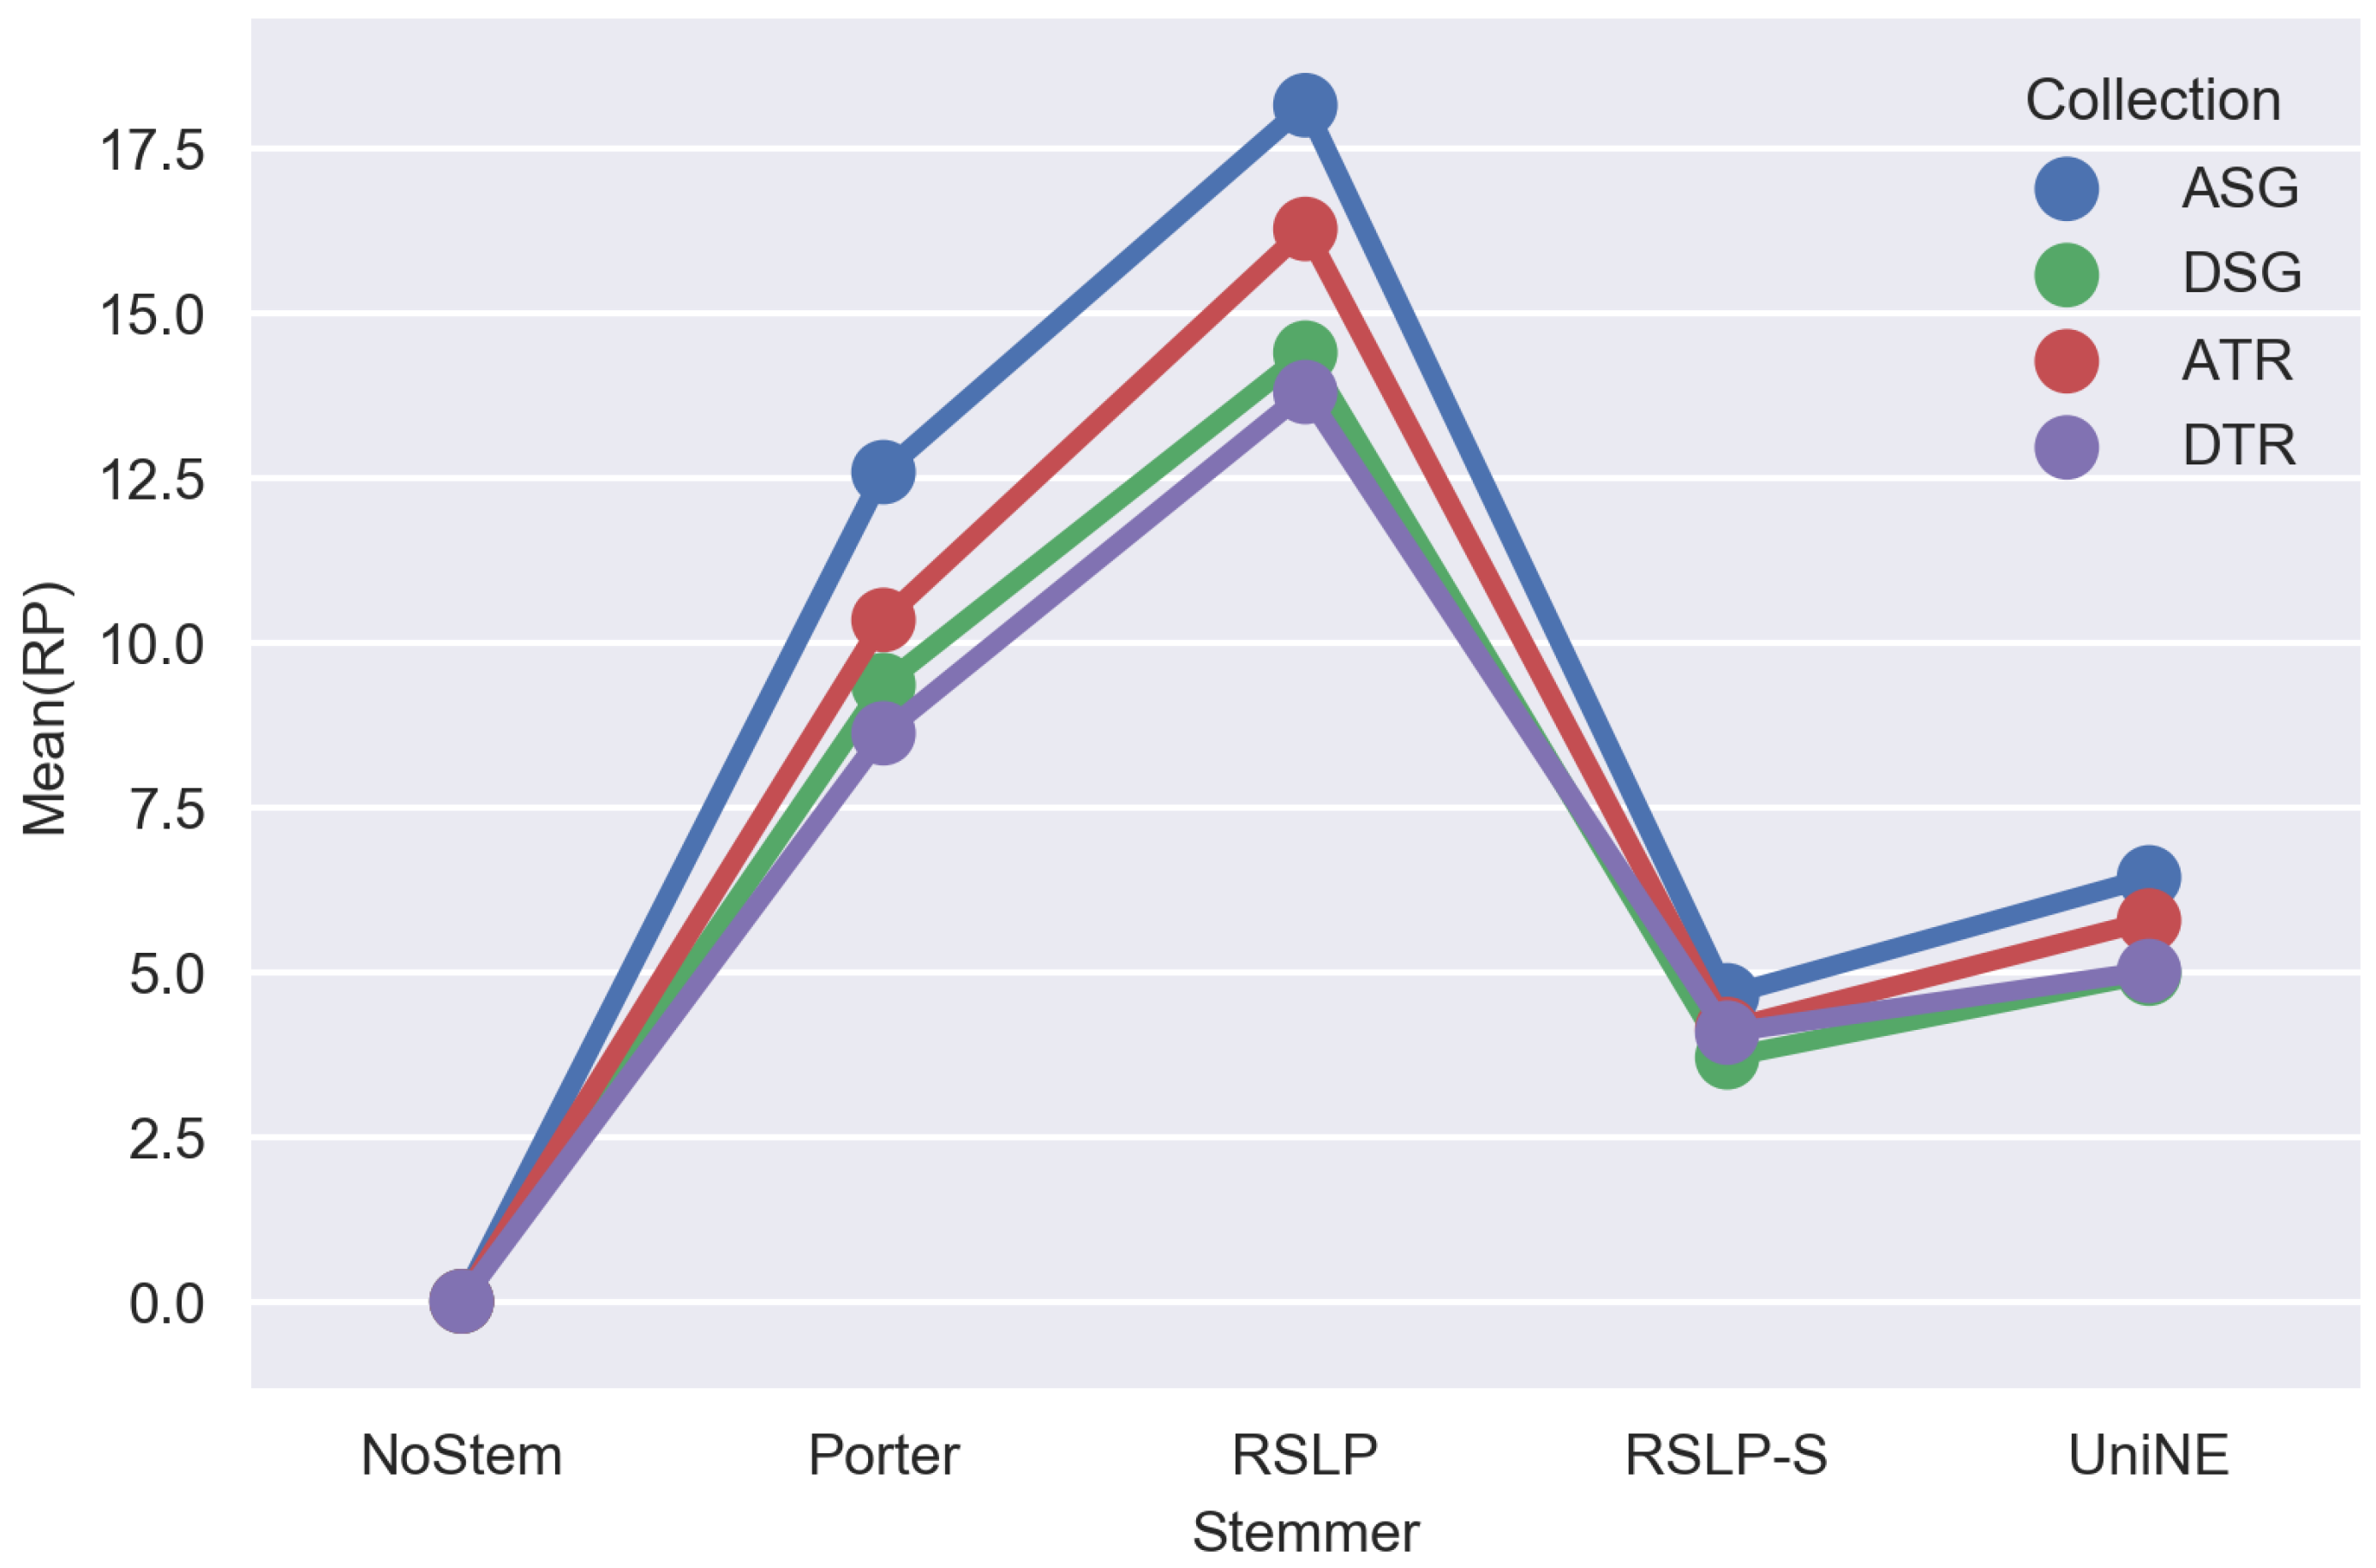
Visually, analyzing Figure 1 and Figure 2, a stemming application seems to generate differences in both, the average of reduction of unique terms per document and in the average percentage of dimensionality reduction. However, it is not possible to claim that with no statistical evidence that confirm that.
Finally, we used 95% of trust level ( = 0.05), to the entire experiment and, later on, we analyzed if the samples had normal distribution. However, this hypothesis was rejected, since the Shapiro–Wilk test obtained p-value below 0.001, lower than the significance level adopted, in every collection and algorithm. This way, considering data distribution and RCBD design adopted for the experiment, we performed the Friedman test to verify Hypothesis 1 (Table 6).
After applying the tests, we found a strong evidence for the hypothesis H1UTD, showing that the averages of unique terms per document are not the same among the algorithms, since we verified a p-value below 0.001, to every collection, and equal to 5883.84; 5590.32; 5863.67 and 5474.95, referred to collections ASG, DSG, ATR and DTR, respectively. After a post-hoc analysis with the Wilcoxon test, applying the Benferroni correction ( = /10), we found the following order related to the number of unique terms obtained after stemming: NoStem > RSLP-S > UniNE > Porter > RSLP, to every collection. In other words, RSLP algorithm was the most effective in the reduction of unique terms per document.
For Hypothesis 2, considering that the jurisprudential bases are independent, i.e., the same document does not appear in more than one collection, we adopted Kruskal–Wallis tests (Table 7).
According to the results, the percentage averages of reduction of algorithms are not the same for every collection, since p-value was less than 0.001 and equal to 687.93; 711.83; 250.31 and 295.25, referred, respectively, to Porter, RSLP, RSLP-S and UniNE algorithms, therefore, hypothesis H0RP was refuted. By conducting a post-hoc with the Mann–Whitney test, also applying the Benferroni adjustment ( = /6), we noticed that stemming algorithms reduced dimensionality more effectively in JAC collection.
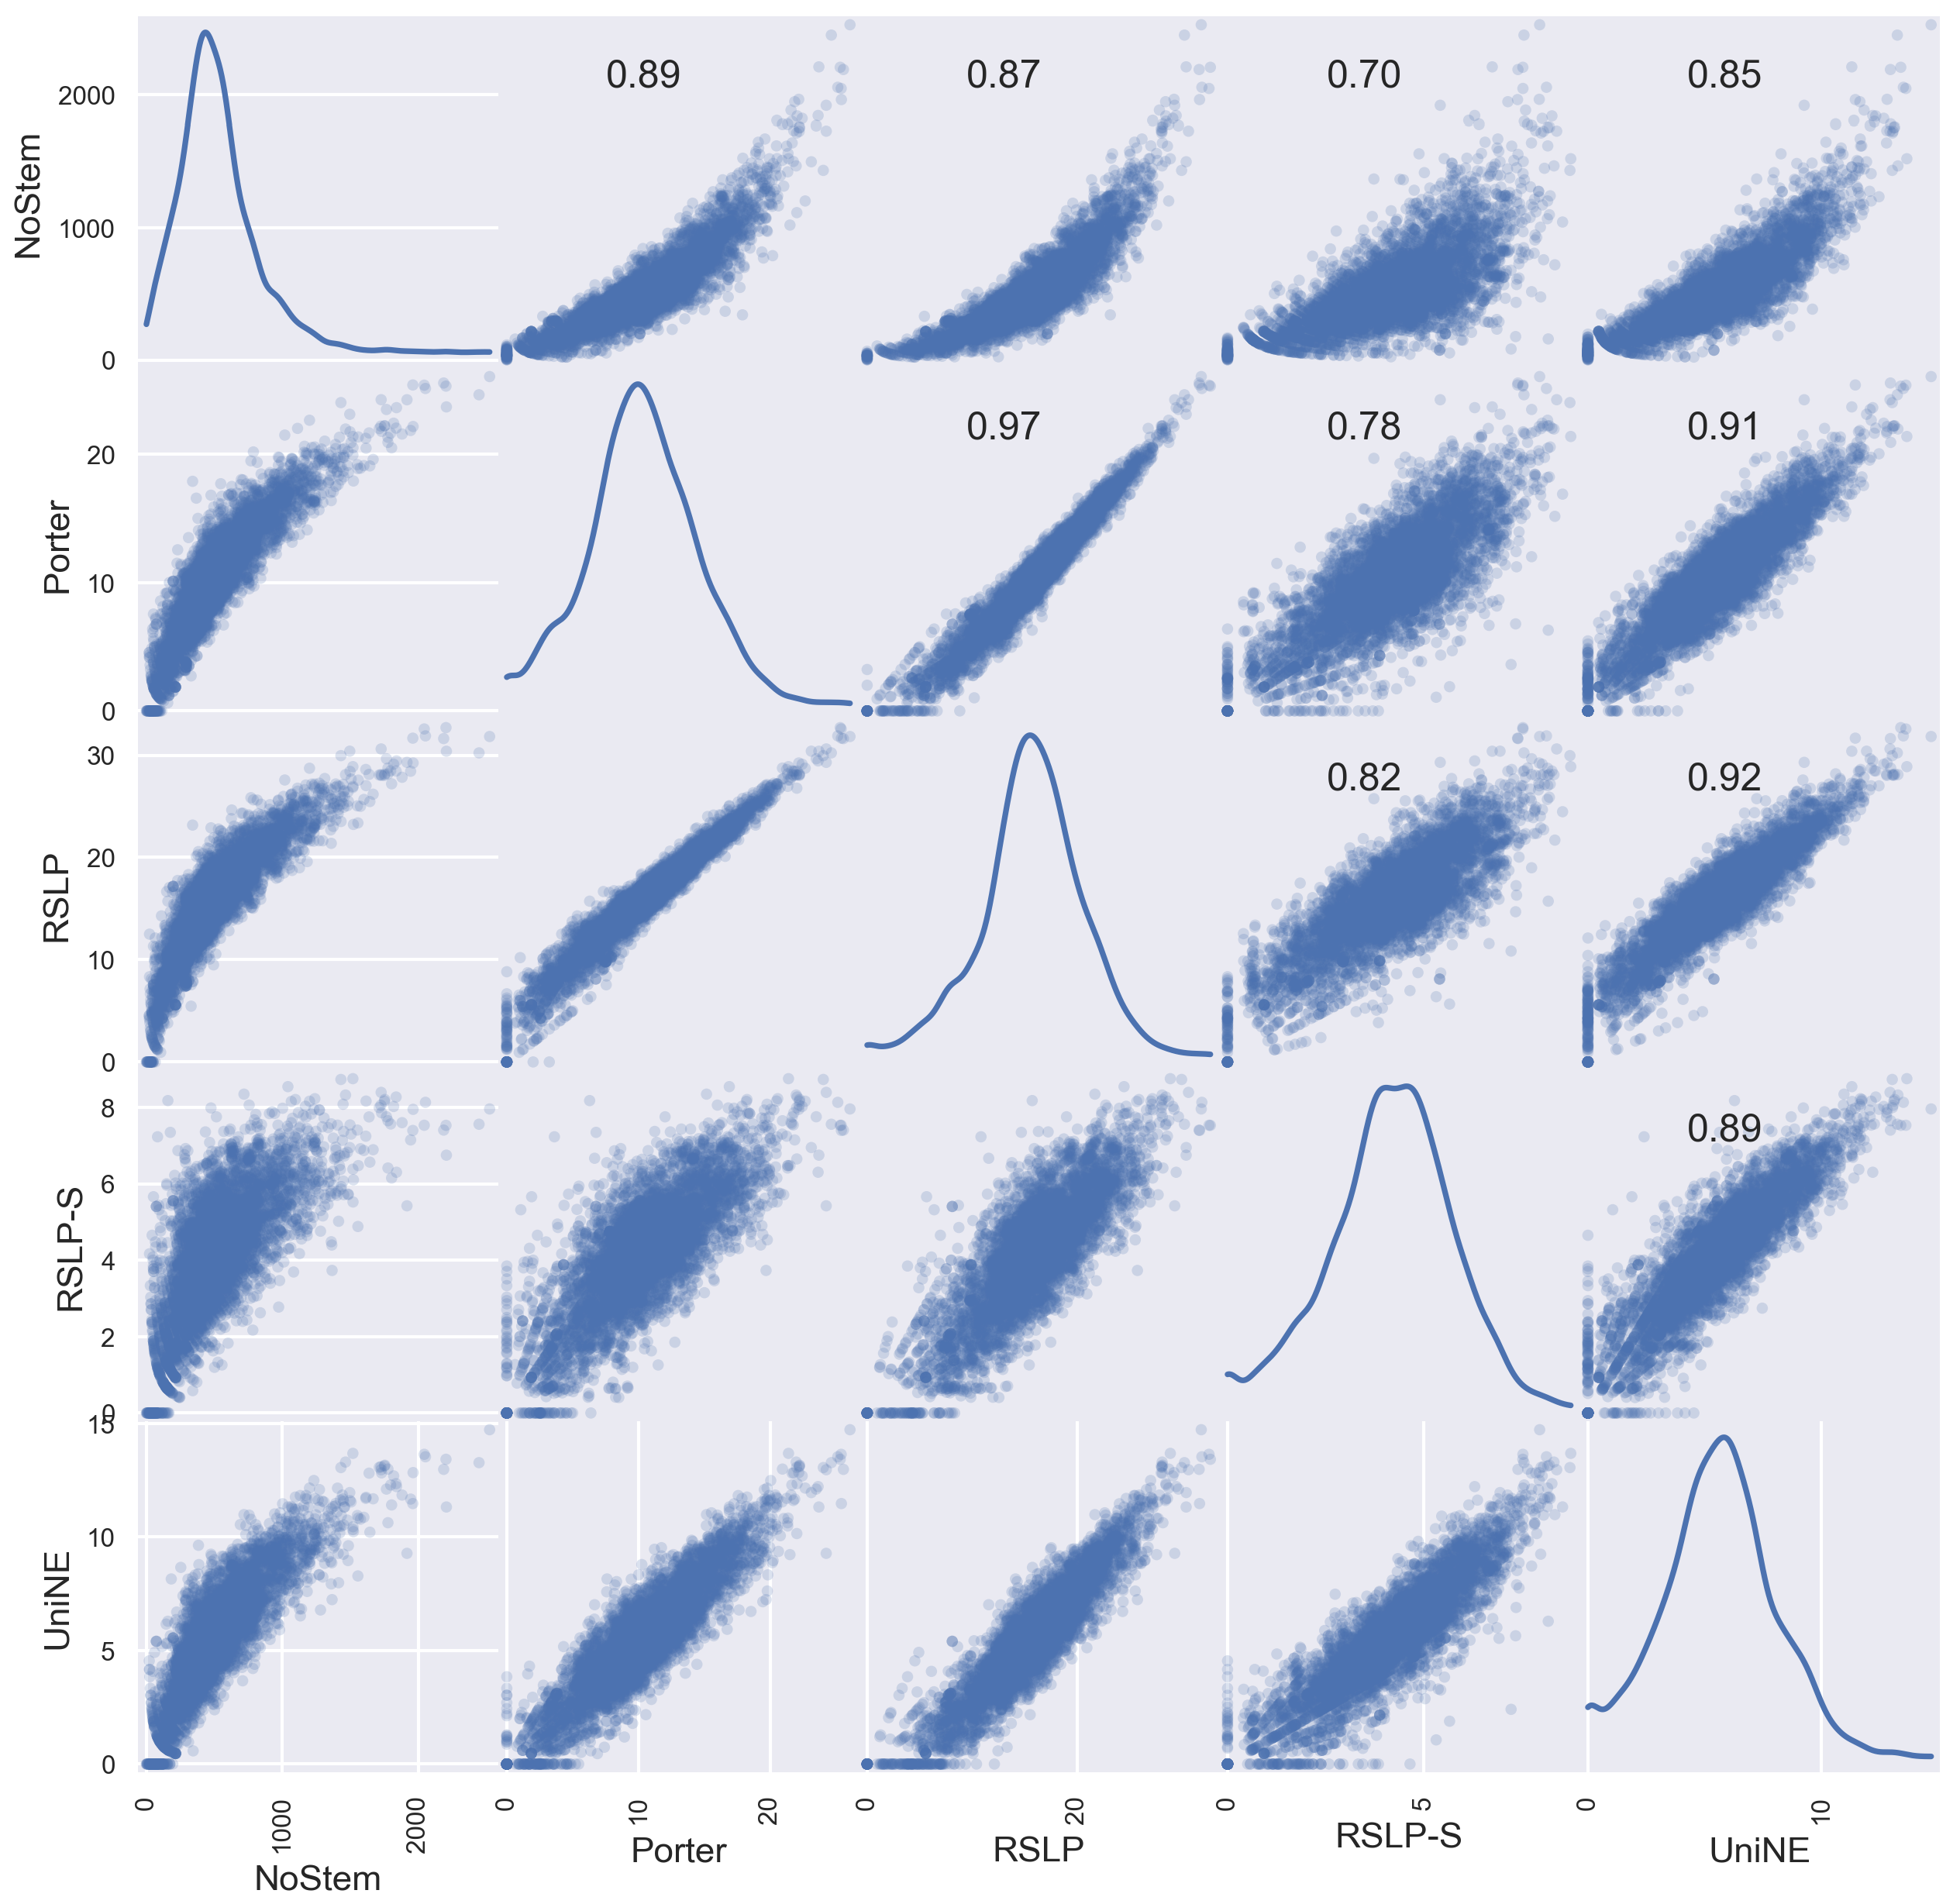
As can be seen in the first line of the correlation matrix shown in Figure 3, there is a strong positive correlation, ranging from 0.70 to 0.89, between the quantity of unique terms per document and the reduction percentage achieved by stemming algorithms. In other words, it suggests that the more words jurisprudential documents have, the better results the analyzed stemming algorithms will get. Furthermore, in the same figure, we noticed a linear relation between the algorithms, indicating that they maintain a proportionality related to the potential of dimensionality reduction of texts. Thus, the Porter and RSLP algorithms, for example, have a 0.97 correlation coefficient, indicating an almost perfect positive linear relationship.
To illustrate this correlation potential between quantity of unique terms and reduction percentage, we considered the entire sample of each collection as a single document. Then, we applied stemming algorithms to the collection.
In this scenario, shown in Table 8, one of the stemming algorithms achieved 52% of reduction (ASG-RSLP), confirming the linear relation mentioned above. We also noticed that the order of effectiveness was equivalent to the one found in the experiment using single documents (RSLP > Porter > UniNE > RSLP-S > NoStem).
Hence, due to the results found, it is possible to say that RSLP algorithm reduced judicial jurisprudence dimensionality more effectively than Porter, UniNE and RSLP-S. Besides, ASG collection showed higher reduction of unique terms, regardless which stemming algorithm was adopted.
5.1.5. Threats to Validity
Because the data were collected and analyzed by the authors, there is a strong threat to internal and external validities. However, there is no conflict of interest. Thus, there are no reasons to privilege one algorithm over another. To mitigate any possible bias, documents were chosen randomly, according to RCBD guidelines.
5.2. Second Experiment
5.2.1. Goal Definition
As illustrated by Table 9, the Porter, RSLP, RSLP-S, UniNE, and NoStem (control group) algorithms were applied over all jurisprudential databases: judgments of Appeals Court (ASG), the monocratic decisions of Appeals Court (DSG), the judgments of Special Courts (ATR), and the monocratic decisions of Special Courts (DTR).
For instance, the ASG collection has 408,336 unique terms. After stemming, this number decreased by 23% (Porter), 27% (RSLP), 6% (RSLP-S) and 14% (UniNE). Thus, this experiment analyzed the impact of this reduction of dimensionality, obtained through radicalization, on the retrieval of jurisprudential documents.
To achieve this, we conducted an experiment in a controlled environment, calculating the MAP, MRP and MPC (10) metrics of the information retrieved from each of the stemming algorithms. After that, it was verified whether there was a statistically significant difference between the recovery of radicalized documents and the control group.
The following is the goal formalization, according to the GQM (Goal Question Metric) proposed by Trendowicz et al. [29]:
- Analyze information retrieval systems
- with the purpose of evaluate them
- with respect to MAP, MRP and MPC(10)
- from the point of view of data analysts
- in the context of TJSE’s jurisprudential documents.
5.2.2. Planning
Context Selection. The experiment will be in vitro and will use the entire judicial jurisprudence database of Supreme Court of the State of Sergipe, formed by four collections: (a) judgments of Appeals Court (181,994 documents); (b) monocratic decisions of Appeals Court (37,044 documents); (c) judgments of Special Courts (37,161 documents); and (d) monocratic decisions of Special Courts (23,149 documents).
Figure 4 shows the independent and dependent variables used in this experiment.
Independent Variables. Set of user queries logged by the TJSE information retrieval system for each document collection (1). The search engine with 20 indexed databases (four collections × five algorithms) (2). The submission results of these queries to the search engine for each of the indexed databases (3). The relevance judgment of these results using the algorithm nruns [15] (4). Dependent Variables. MAP, MRP, and MPC(10), defined in the Section 4 (5).
Hypothesis Formulation. The research question for this experiment was: did dimensionality reduction degrade the retrieval of jurisprudential documents?
To answer this research question, we analyzed, by collection, the MAP, MRP and MPC metrics. Therefore, the following assumptions were verified:
Hypothesis 1
- : The stemming algorithms do not have impact on MAP ().
- : The stemming algorithms have impact on MAP ( for at least a pair ()).
Hypothesis 2
- : The stemming algorithms do not have impact on MPC(10) ().
- : The stemming algorithms have impact on MPC(10) ( for at least a pair ()).
Hypothesis 3
- : The stemming algorithms do not have impact on MRP ().
- : The stemming algorithms have impact on MRP ( for at least a pair ()).
Selection of Participants and Objects. The queries used during the experiment were obtained through the TJSE jurisprudential information retrieval logs. For each document collection, 100 queries were randomly selected, a number considered sufficient by the literature to evaluate retrieval systems [13,30]
Experiment Project. To assure the reliability of the hypothesis tests, we adopted the randomized complete block design (RCBD) model, so each query was randomly chosen and submitted to the search engine for each radicalized database. We emphasize that the NoStem represents the terms of the document without radicalization, therefore, it acts as a control group.
Instrumentation. The instrumentation process began with the preparation of the environment for the experiment and the planning of data collection. We used the Apache Solr [31], version 6.1.0, as search engine for jurisprudential documents. This Apache Solr version uses the Okapi BM25 [32] as similarity metric for ranking documents in response to the queries. Next, we indexed the entire jurisprudential database of the TJSE, using the stemming algorithms and the control group. Finally, a Java application was developed to iterate over the queries, submit them to the search engine and calculate the metrics according to the relevance judgment algorithm proposed by Sakai and Lin [15], registering them in CSV (Comma Separated Values) files.
5.2.3. Experiment Execution
Preparation. The preparation phase consisted in obtaining the collections referring to the judicial jurisprudence and the logs of the search system of the TJSE. Thus, the documentary base was the same as that used in the previous experiment, XML (eXtensible Markup Language) files extracted from the OLTP (Online Transaction Processing) database. Similarly, the search system logs were consolidated into a single file and the random selected queries were placed in XML files organized by collection.
Execution. At the end of the previous steps, the experiment was started, with the execution of the Java application, following what was defined in the planning.
Data Collection. The application registered, for each of the databases indexed by the search engine, the documents returned by the query submission, the relevance judgments and the calculated metrics. It should be noted that the files was generated using the format adopted by the trec_eval [33], standard evaluation tool of the Text REtrieval Conference (http://trec.nist.gov/).
Data Validation. The Java application was built using the test-driven development approach (TDD) [20], therefore, we wrote unit test cases to validate if the calculated metrics was in accordance with the standards adopted by Voorhees and Harman [13]. Thus, the tests showed that the calculations made by the application were in accordance with those made by the trec_eval utility.
To ensure the analysis, interpretation and validation of the results, we performed the bootstrap [34] technique, we visualized the data distribution as suggested by Kitchenham et al. [35] and used four statistical tests: Shapiro–Wilk test , Levene’s test, Kruskal–Wallis test and the Mann–Whitney test. We adopted the R language [27] to perform all statistical tests.
We conducted bootstrap with thousand iterations on the metrics results, generating more consistent means, since they take into account the values that would be obtained by repeating the experiment a thousand times over different results of the queries. To select the most suitable statistical test to compare the stemming algorithms, we used the Shapiro–Wilk test to verify the normality of the samples, a condition required to perform parametric tests, since the literature shows that it has a superior statistical power than other approaches [21,22]. We used the Levene test [36] to verify the equality of the variance (homoscedasticity) between the groups. Considering the RCBD project of the experiment, with a factor and multiple treatments, and that there was no homogeneity in the variance and in the data distribution, we performed the nonparametric Kruskal–Wallis test to validate the experimental hypotheses. Finally, we conducted a post-hoc analysis using the Mann–Whitney test to compare the difference between the means of each treatment by applying Benferroni’s correction on the level of significance [24], reducing the possibility of we reject the null hypothesis when it is, in fact, true (Type I Error) [25].
Considering also that a result can be statistically significant without practical relevance, and it must be retained that the substantiality does not run out of the p-values obtained [37] (p. 153), we used the Cohen’s d index [38] to show the effect sizes and their respective confidence intervals. According to Ellis [39], there are at least three reasons to report effect size:
First, doing so facilitates the interpretation of the practical significance of a study’s findings [...]. Second, expectations regarding the size of effects can be used to inform decisions about how many subjects or data points are needed in a study [...] Third, effect sizes can be used to compare the results of studies done in different settings [...].[39] (p. 24)
5.2.4. Results and Discussions
To answer the experimental question, the CSV files generated by the Java application were analyzed. Table 10 shows the metrics obtained after applying the stemming algorithms on the judicial database. Thus, we can visualize the effectiveness of algorithms grouped by metric and collection. In addition, the % column shows the percentage difference between the treatment and the control group, and the |d| column displays the Cohen’s d index with its respective confidence interval.
Looking at Table 10, the use of radicalization seems to have a positive impact only in the judgments of Special Courts (ATR), with the algorithms RSLP-S and UniNE causing an increase of the metrics when compared with the control group (NoStem). However, we need to analyze this data in the light of statistics to find evidence to corroborate, or not, the apparent differences described. For this, we adopted a confidence level of 95% () for the whole experiment. To improve understanding, we separated the analysis by collection, facilitating the visualization of the impact of dimensionality reduction on the metrics studied.
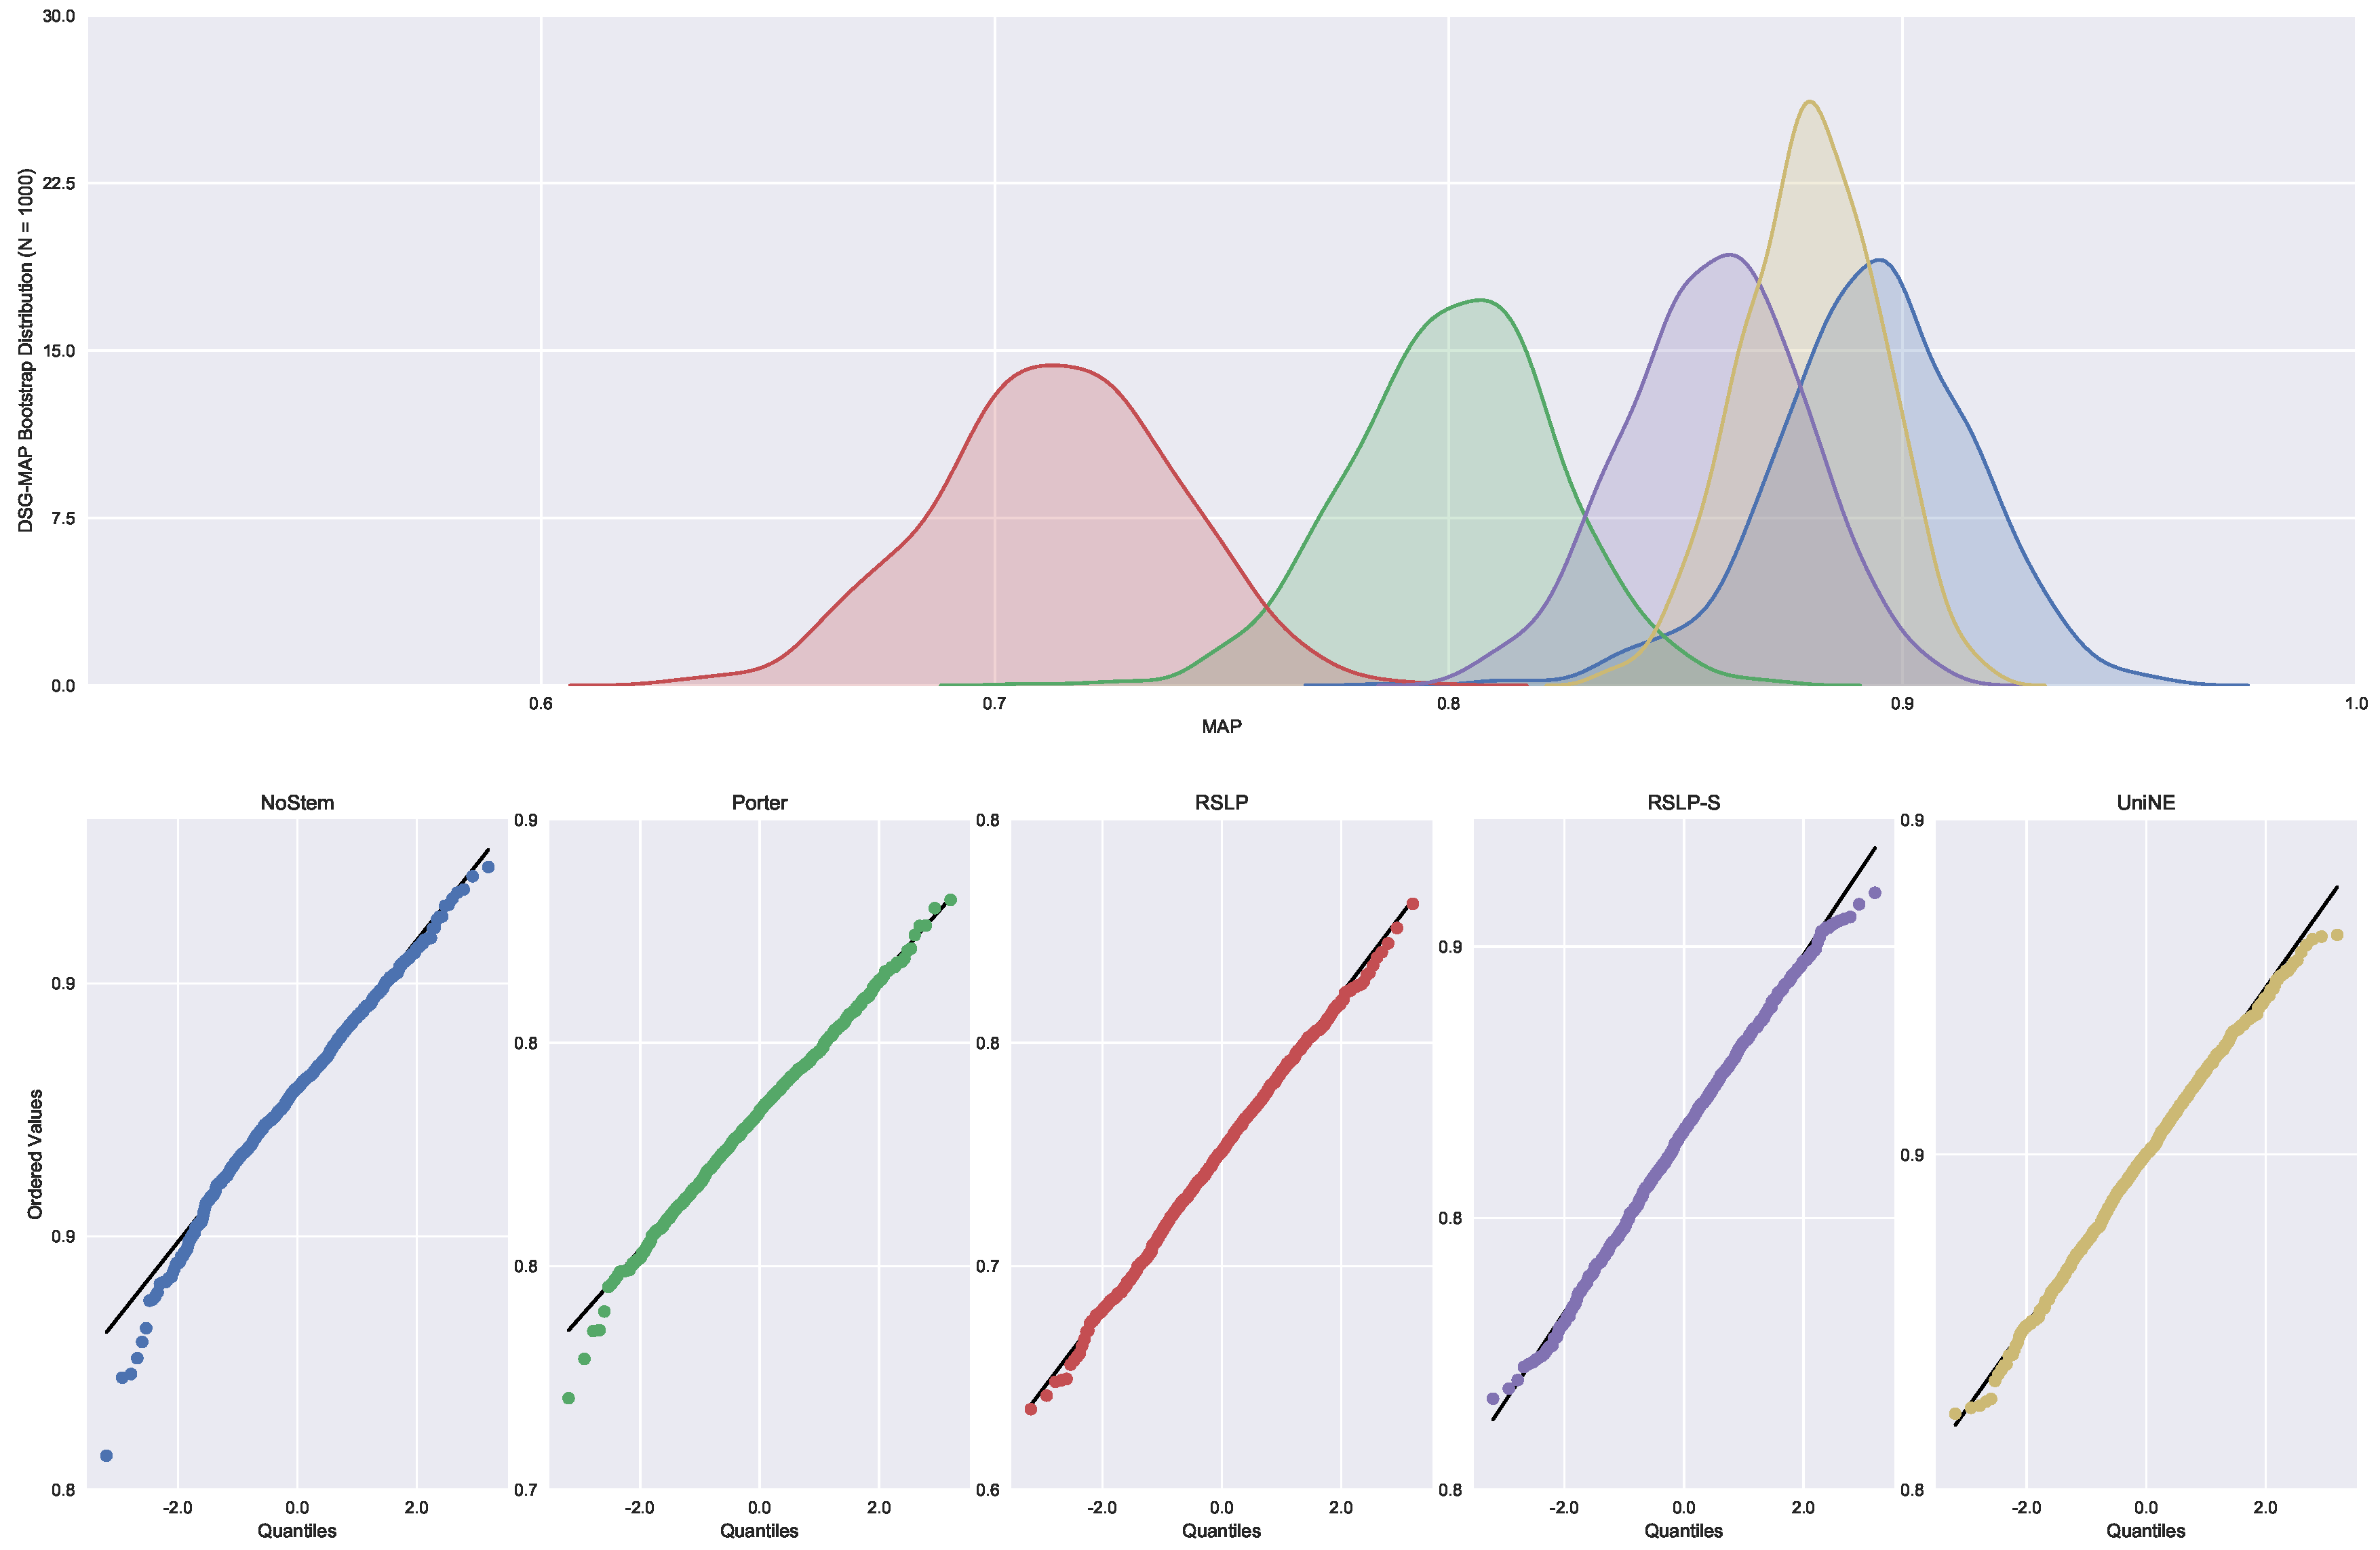
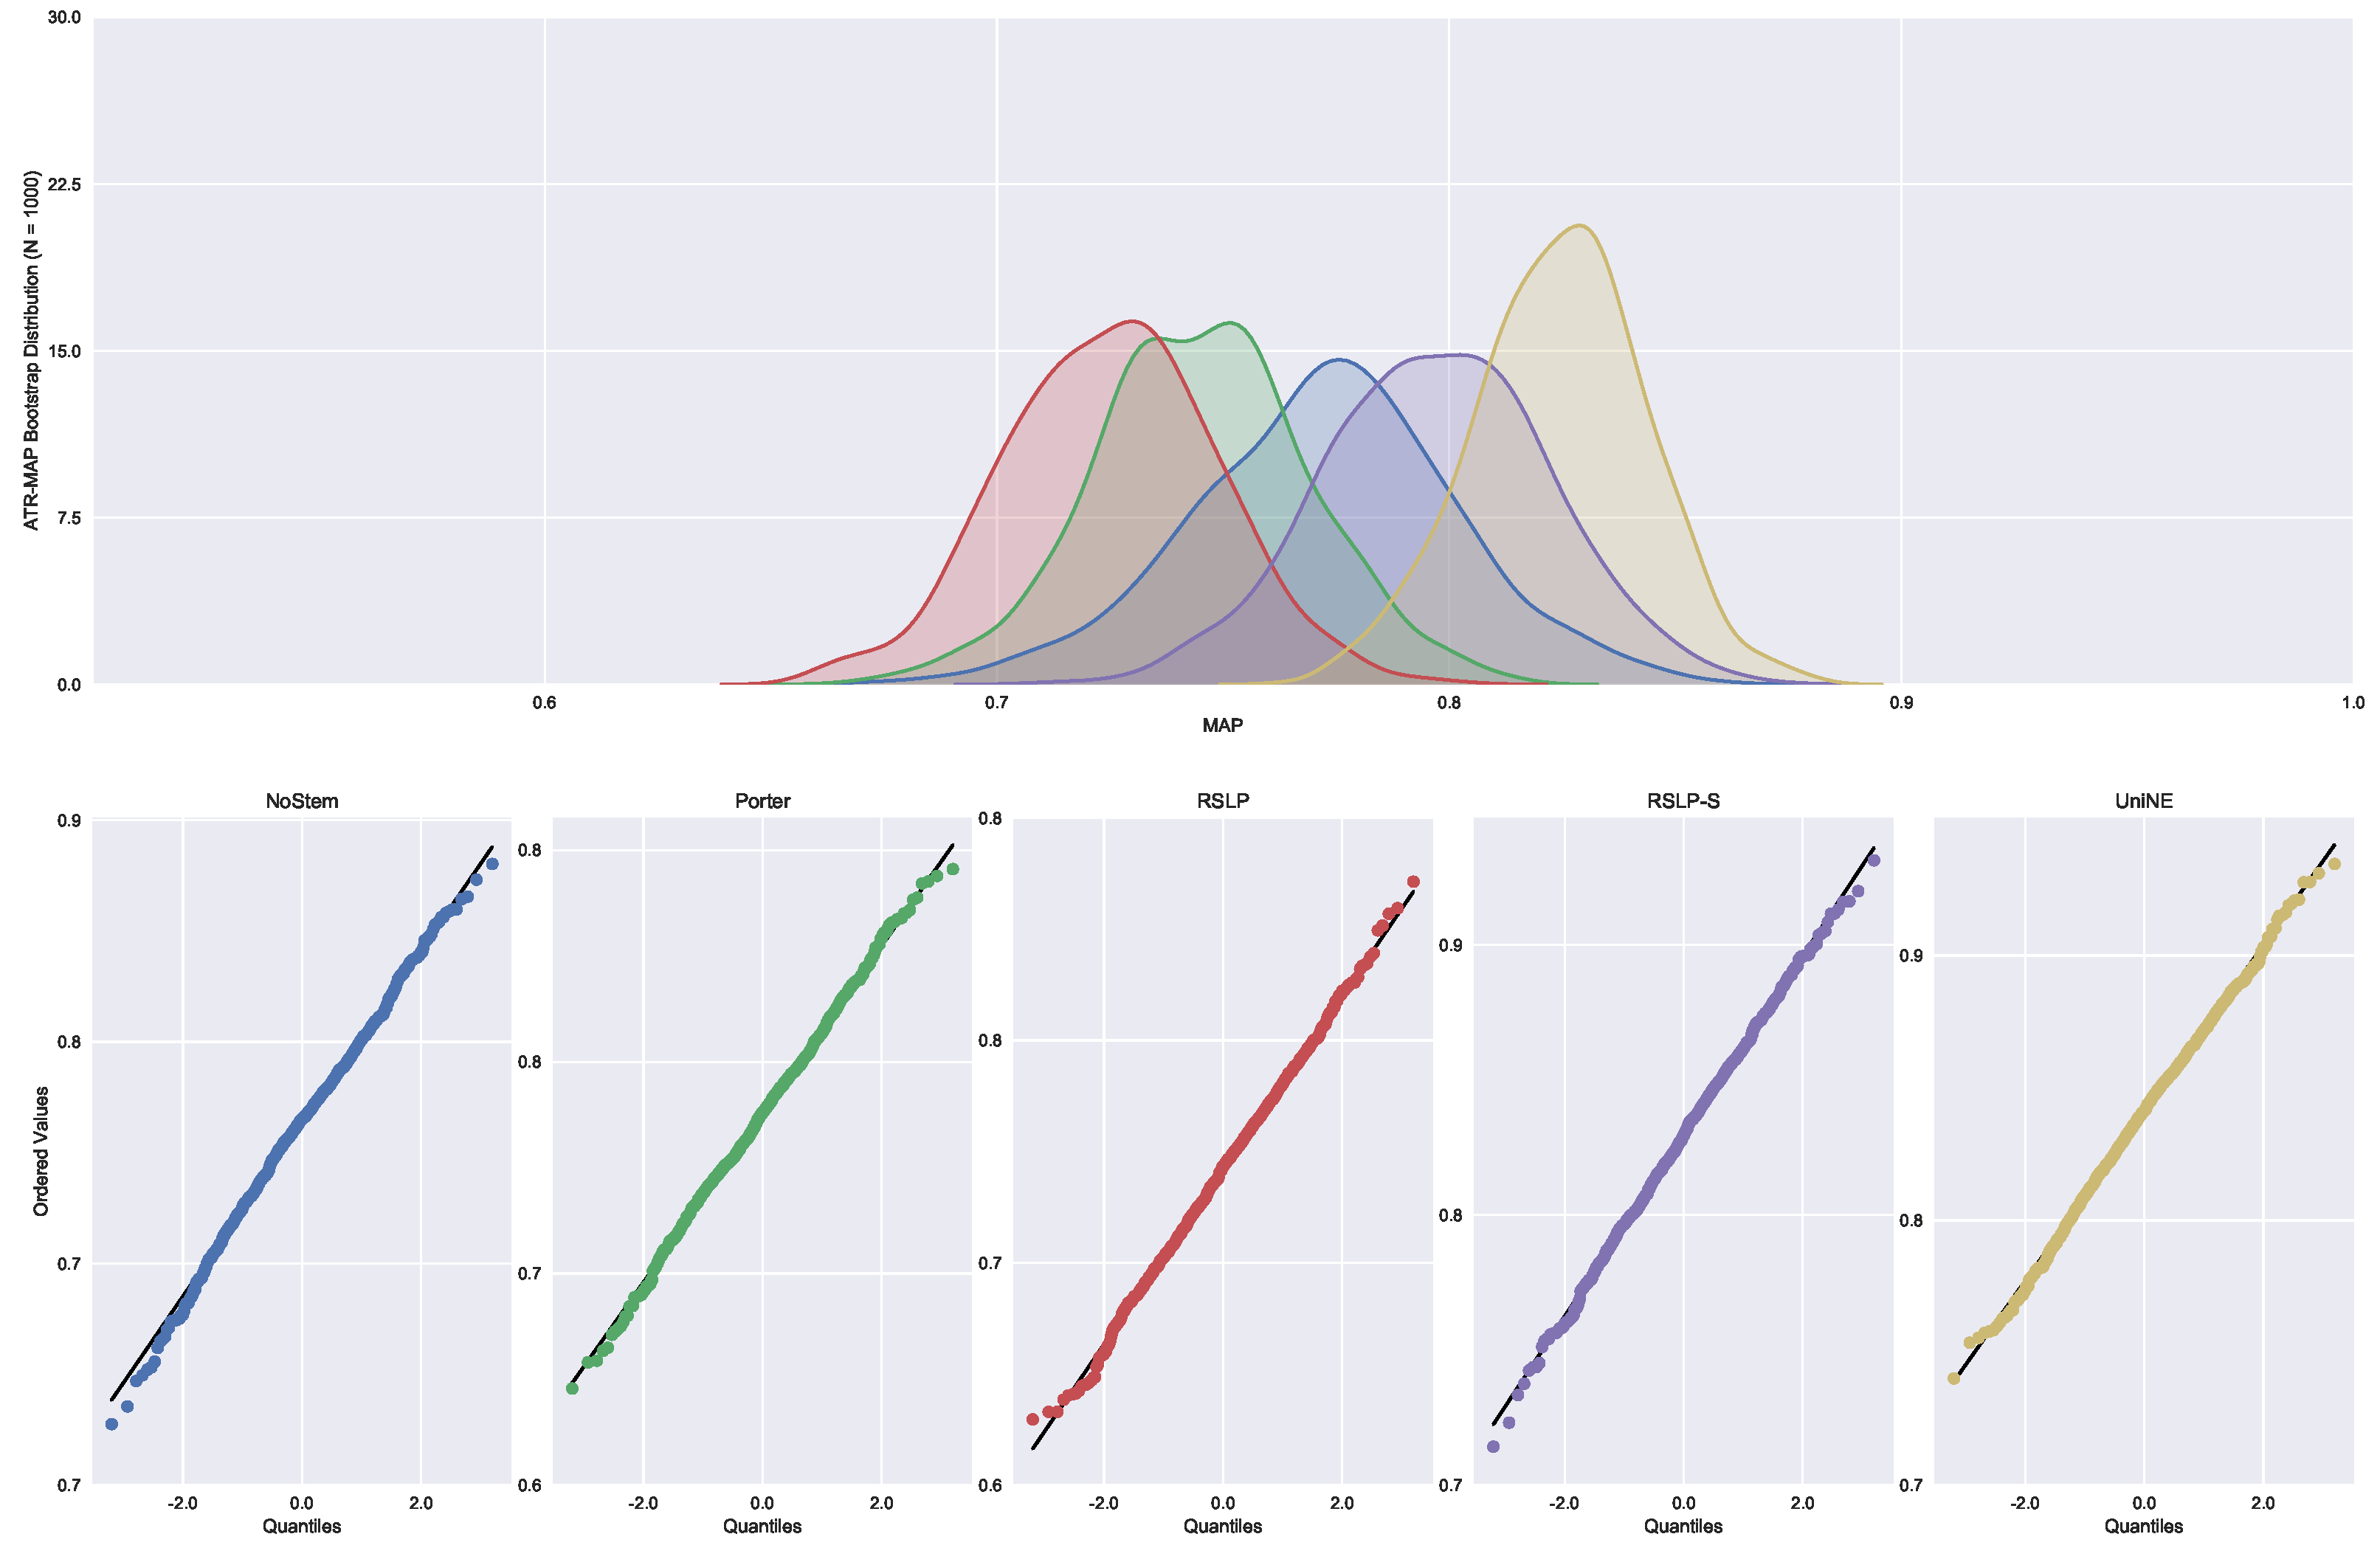
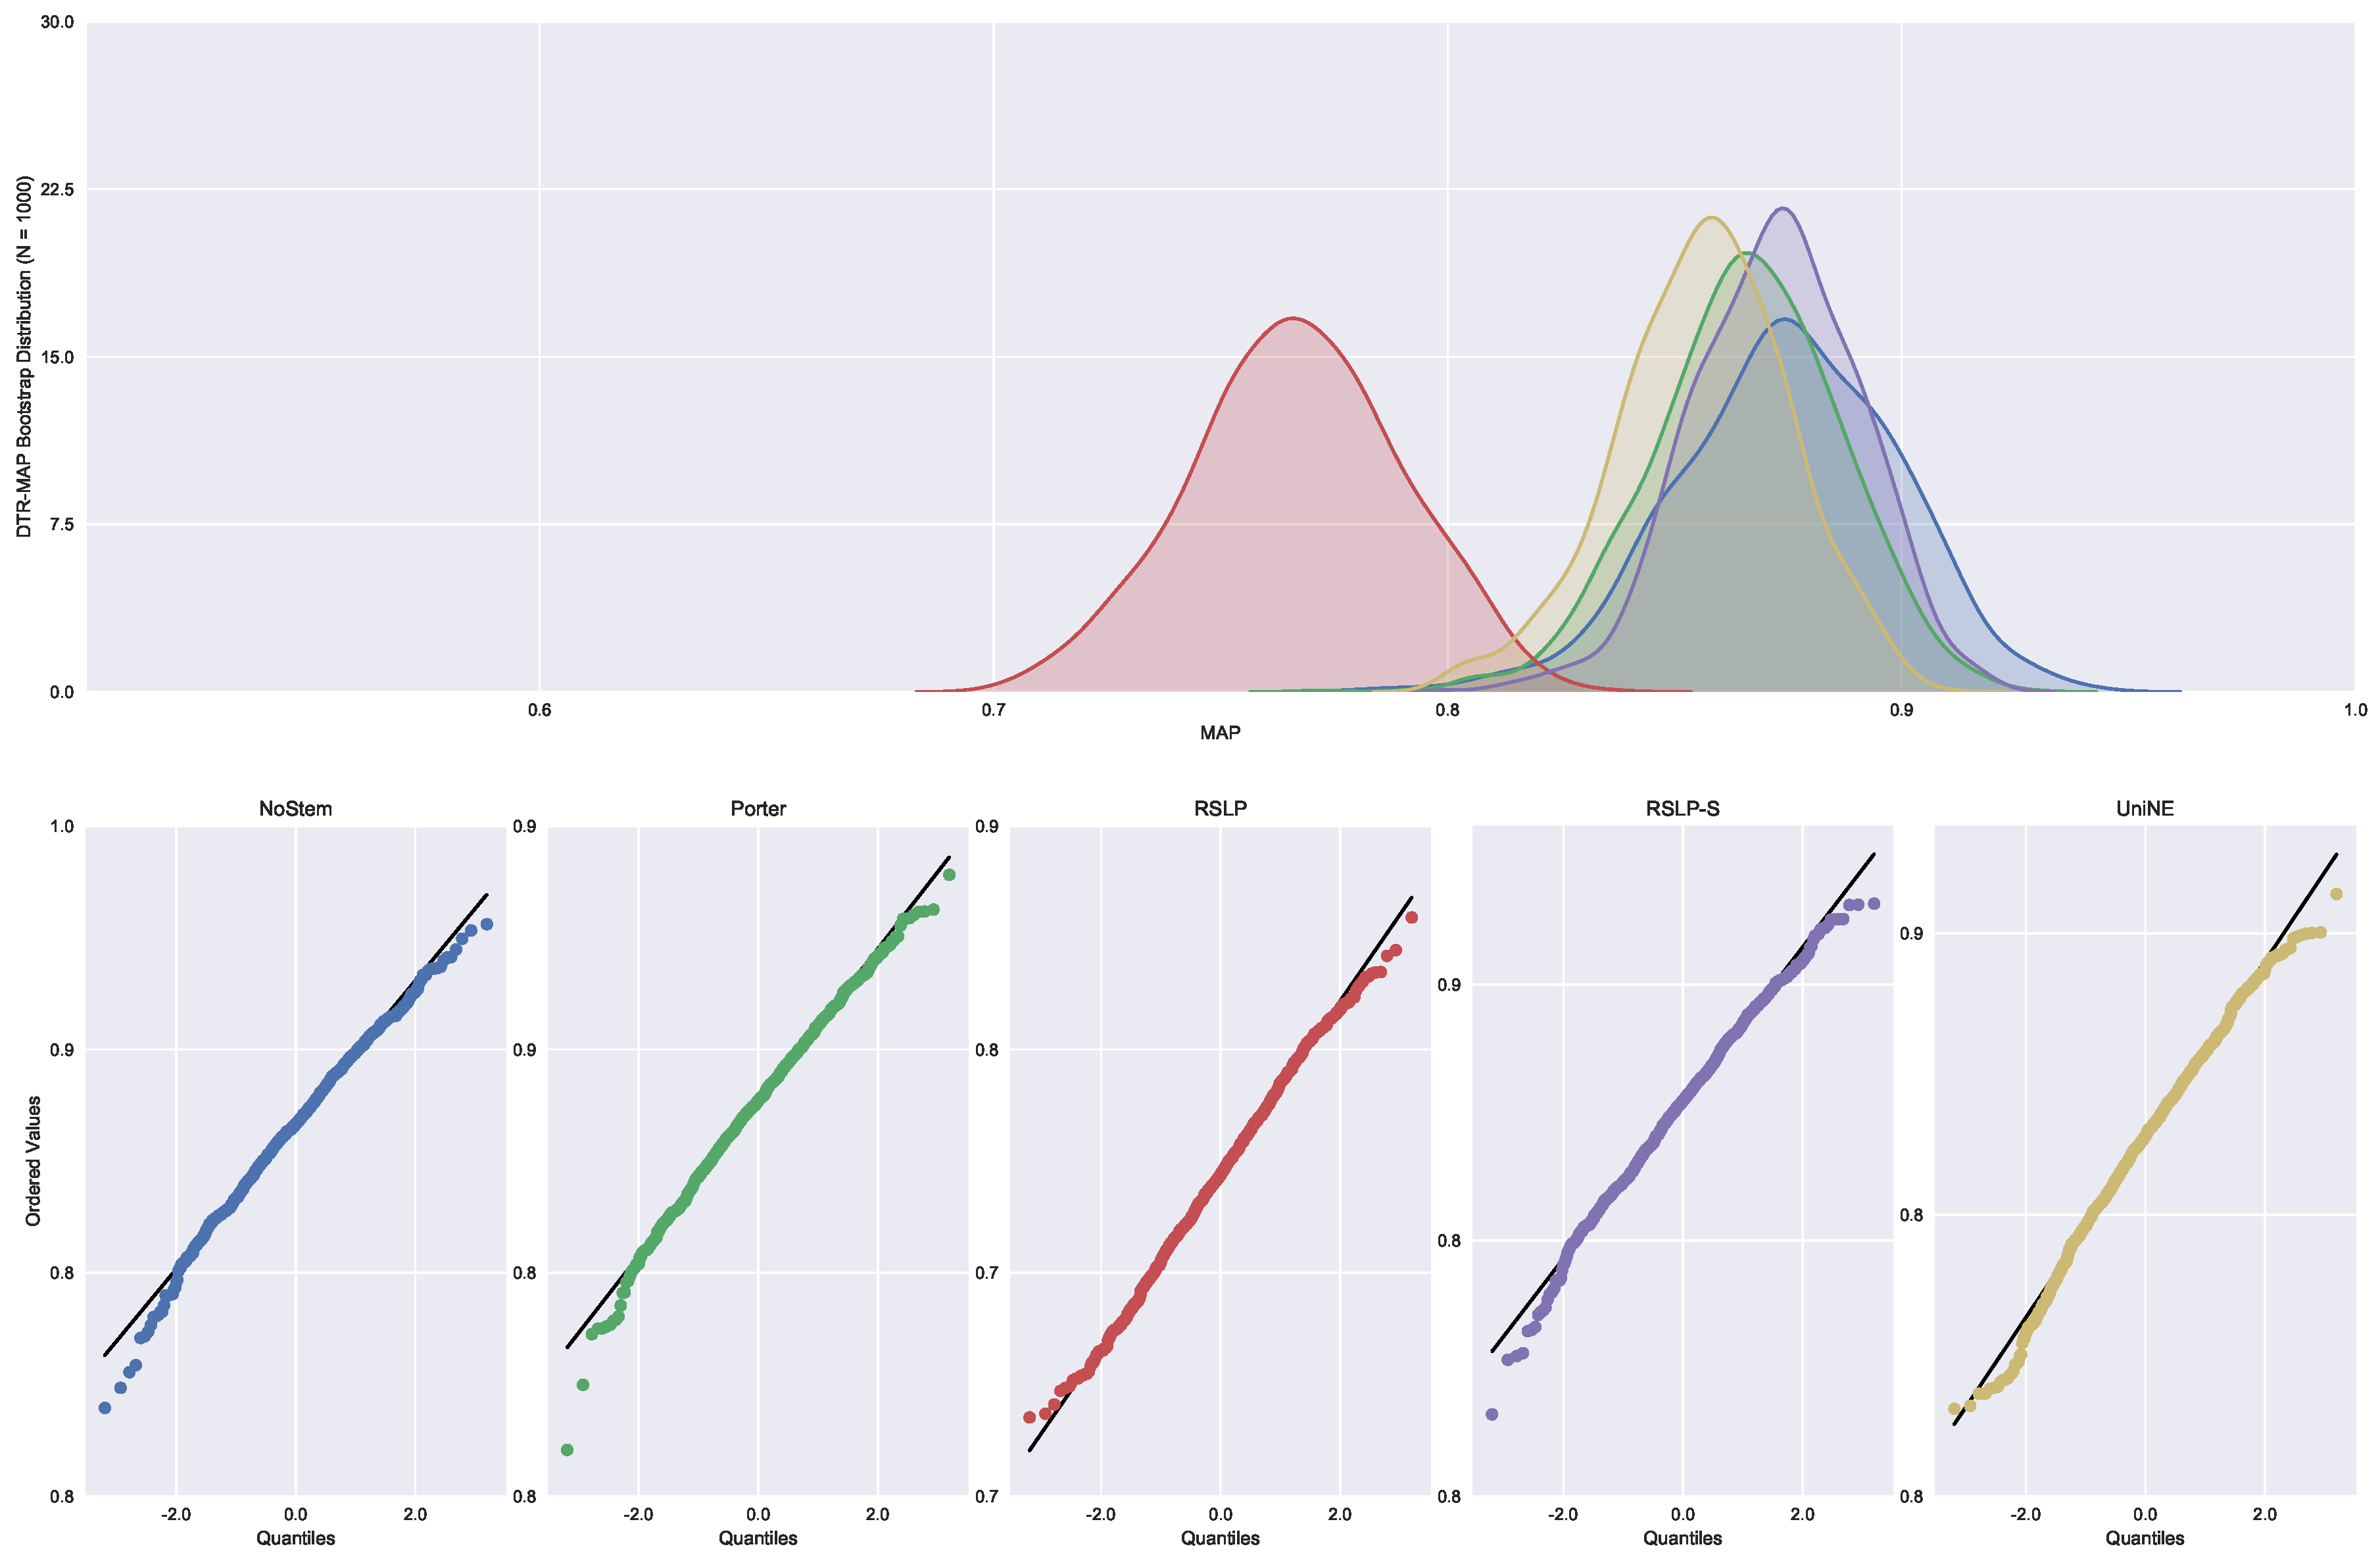
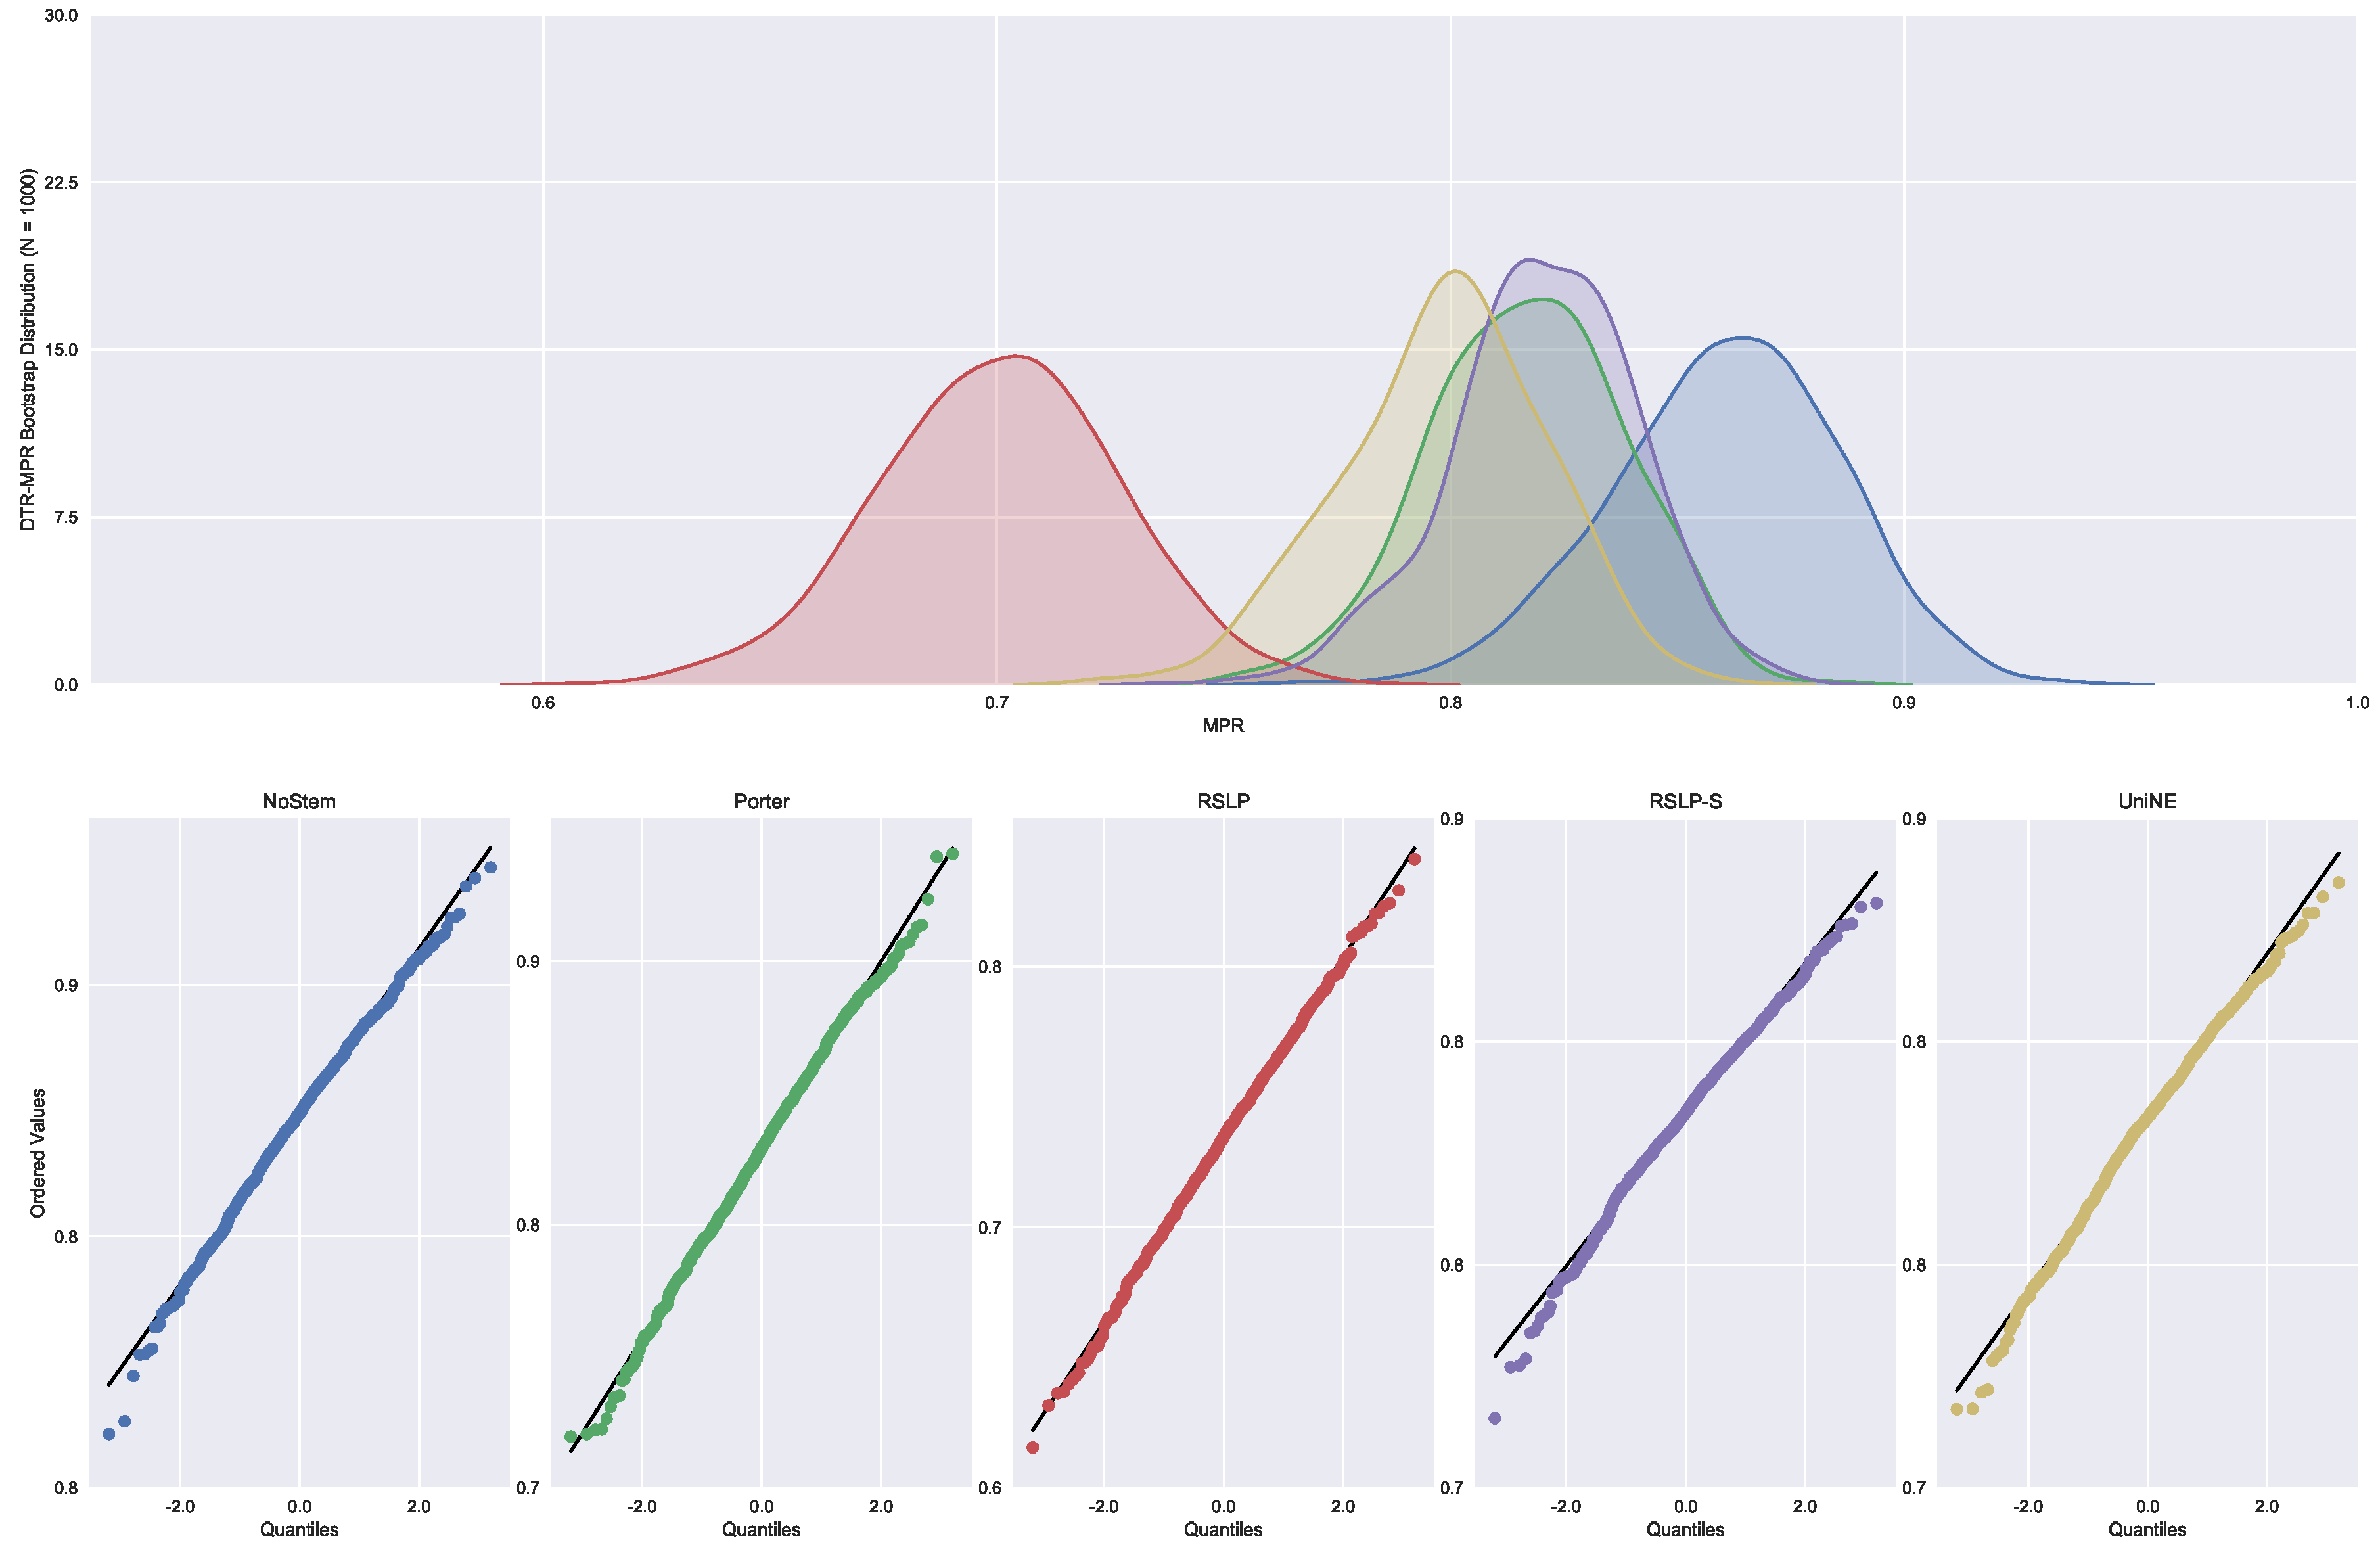
Judgments of Appeals Court (ASG). We started by analyzing the normality with respect to MAP metric. Looking at the graphs, Figure 5, the five treatments seem to have a normal distribution, since they present most of the values around the mean (a bell curve shape). In addition, the probability graphs at the bottom of the same figure show that almost all points lie on the line, expected behaviour for a Normal distribution.
However, the hypothesis of data normality was rejected, since the Shapiro–Wilk test presented a p-value of less than 0.001 for the RSLP-S treatment, below, therefore, the significance level adopted for this experiment. We then conducted the Levene test to validate the null hypothesis of homoscedasticity (equality of variances) between the groups. However, this hypothesis was rejected (p-value < 0.001).
As not all treatments had a Normal distribution and there was heteroscedasticity, we conducted the Kruskal–Wallis test to validate Hypothesis 1, equality of MAP between treatments (). Once conducted, the test showed evidence of difference between the algorithms (p-value < 0.001).
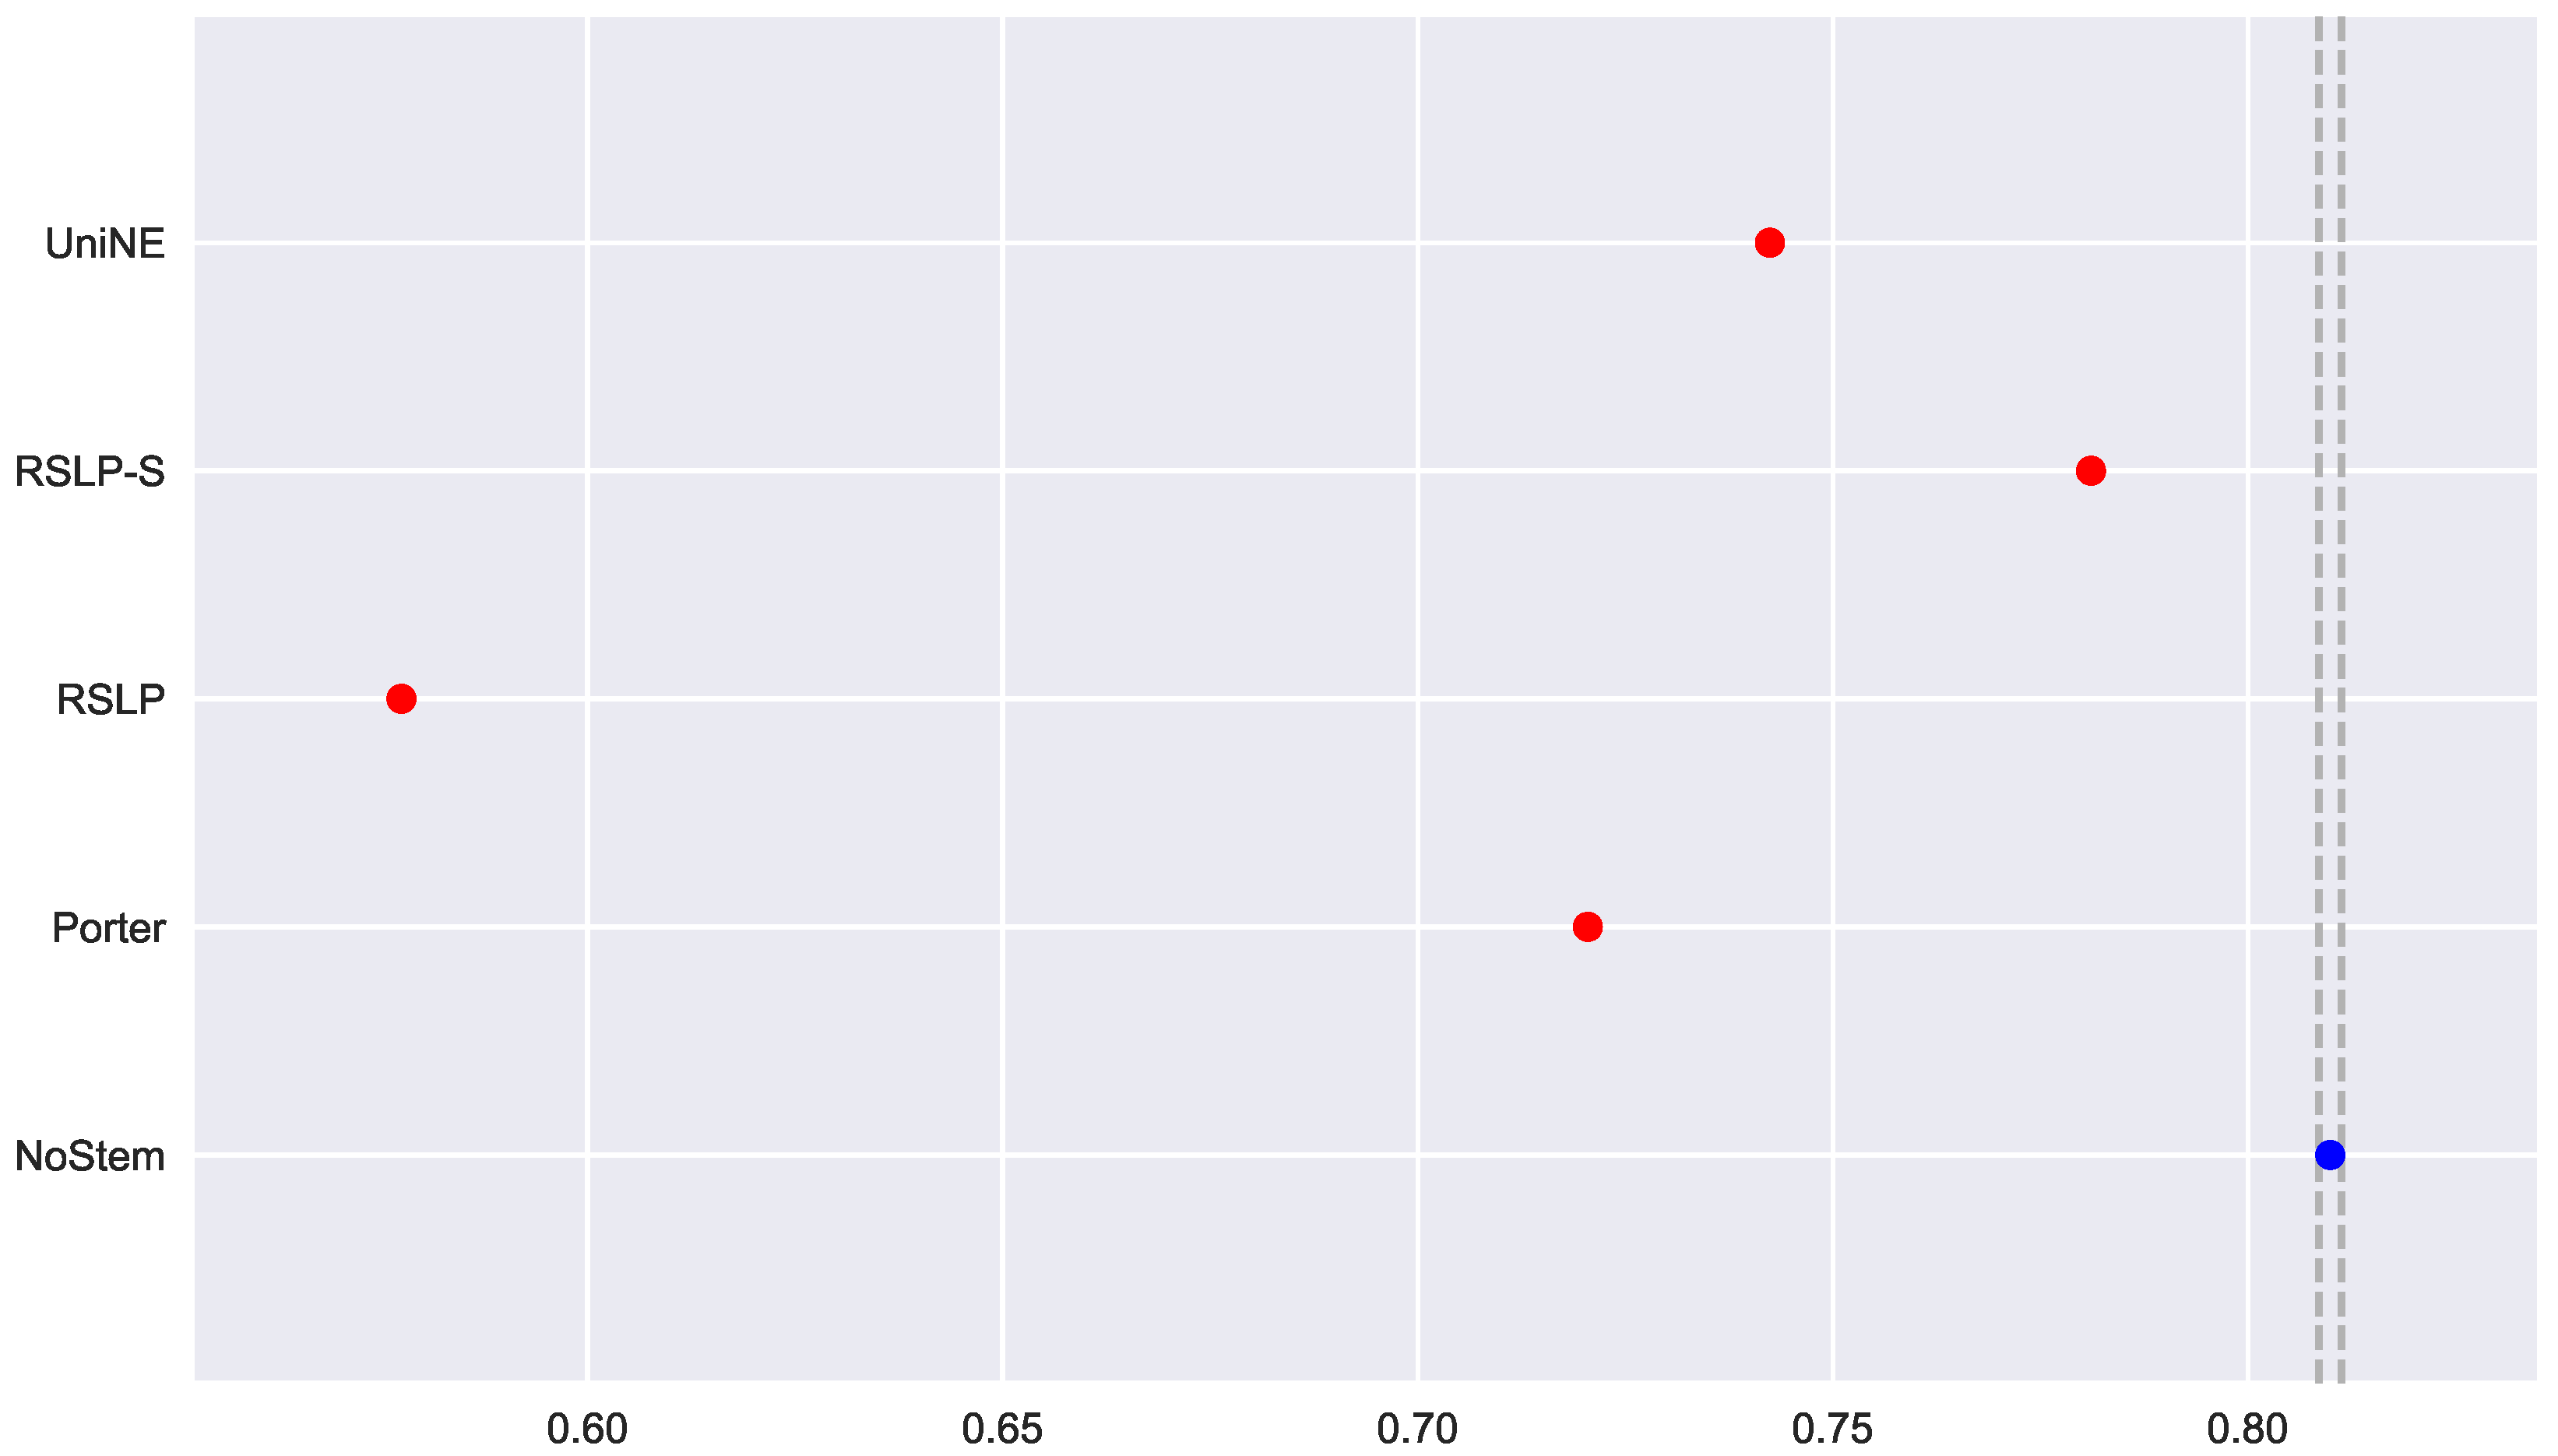
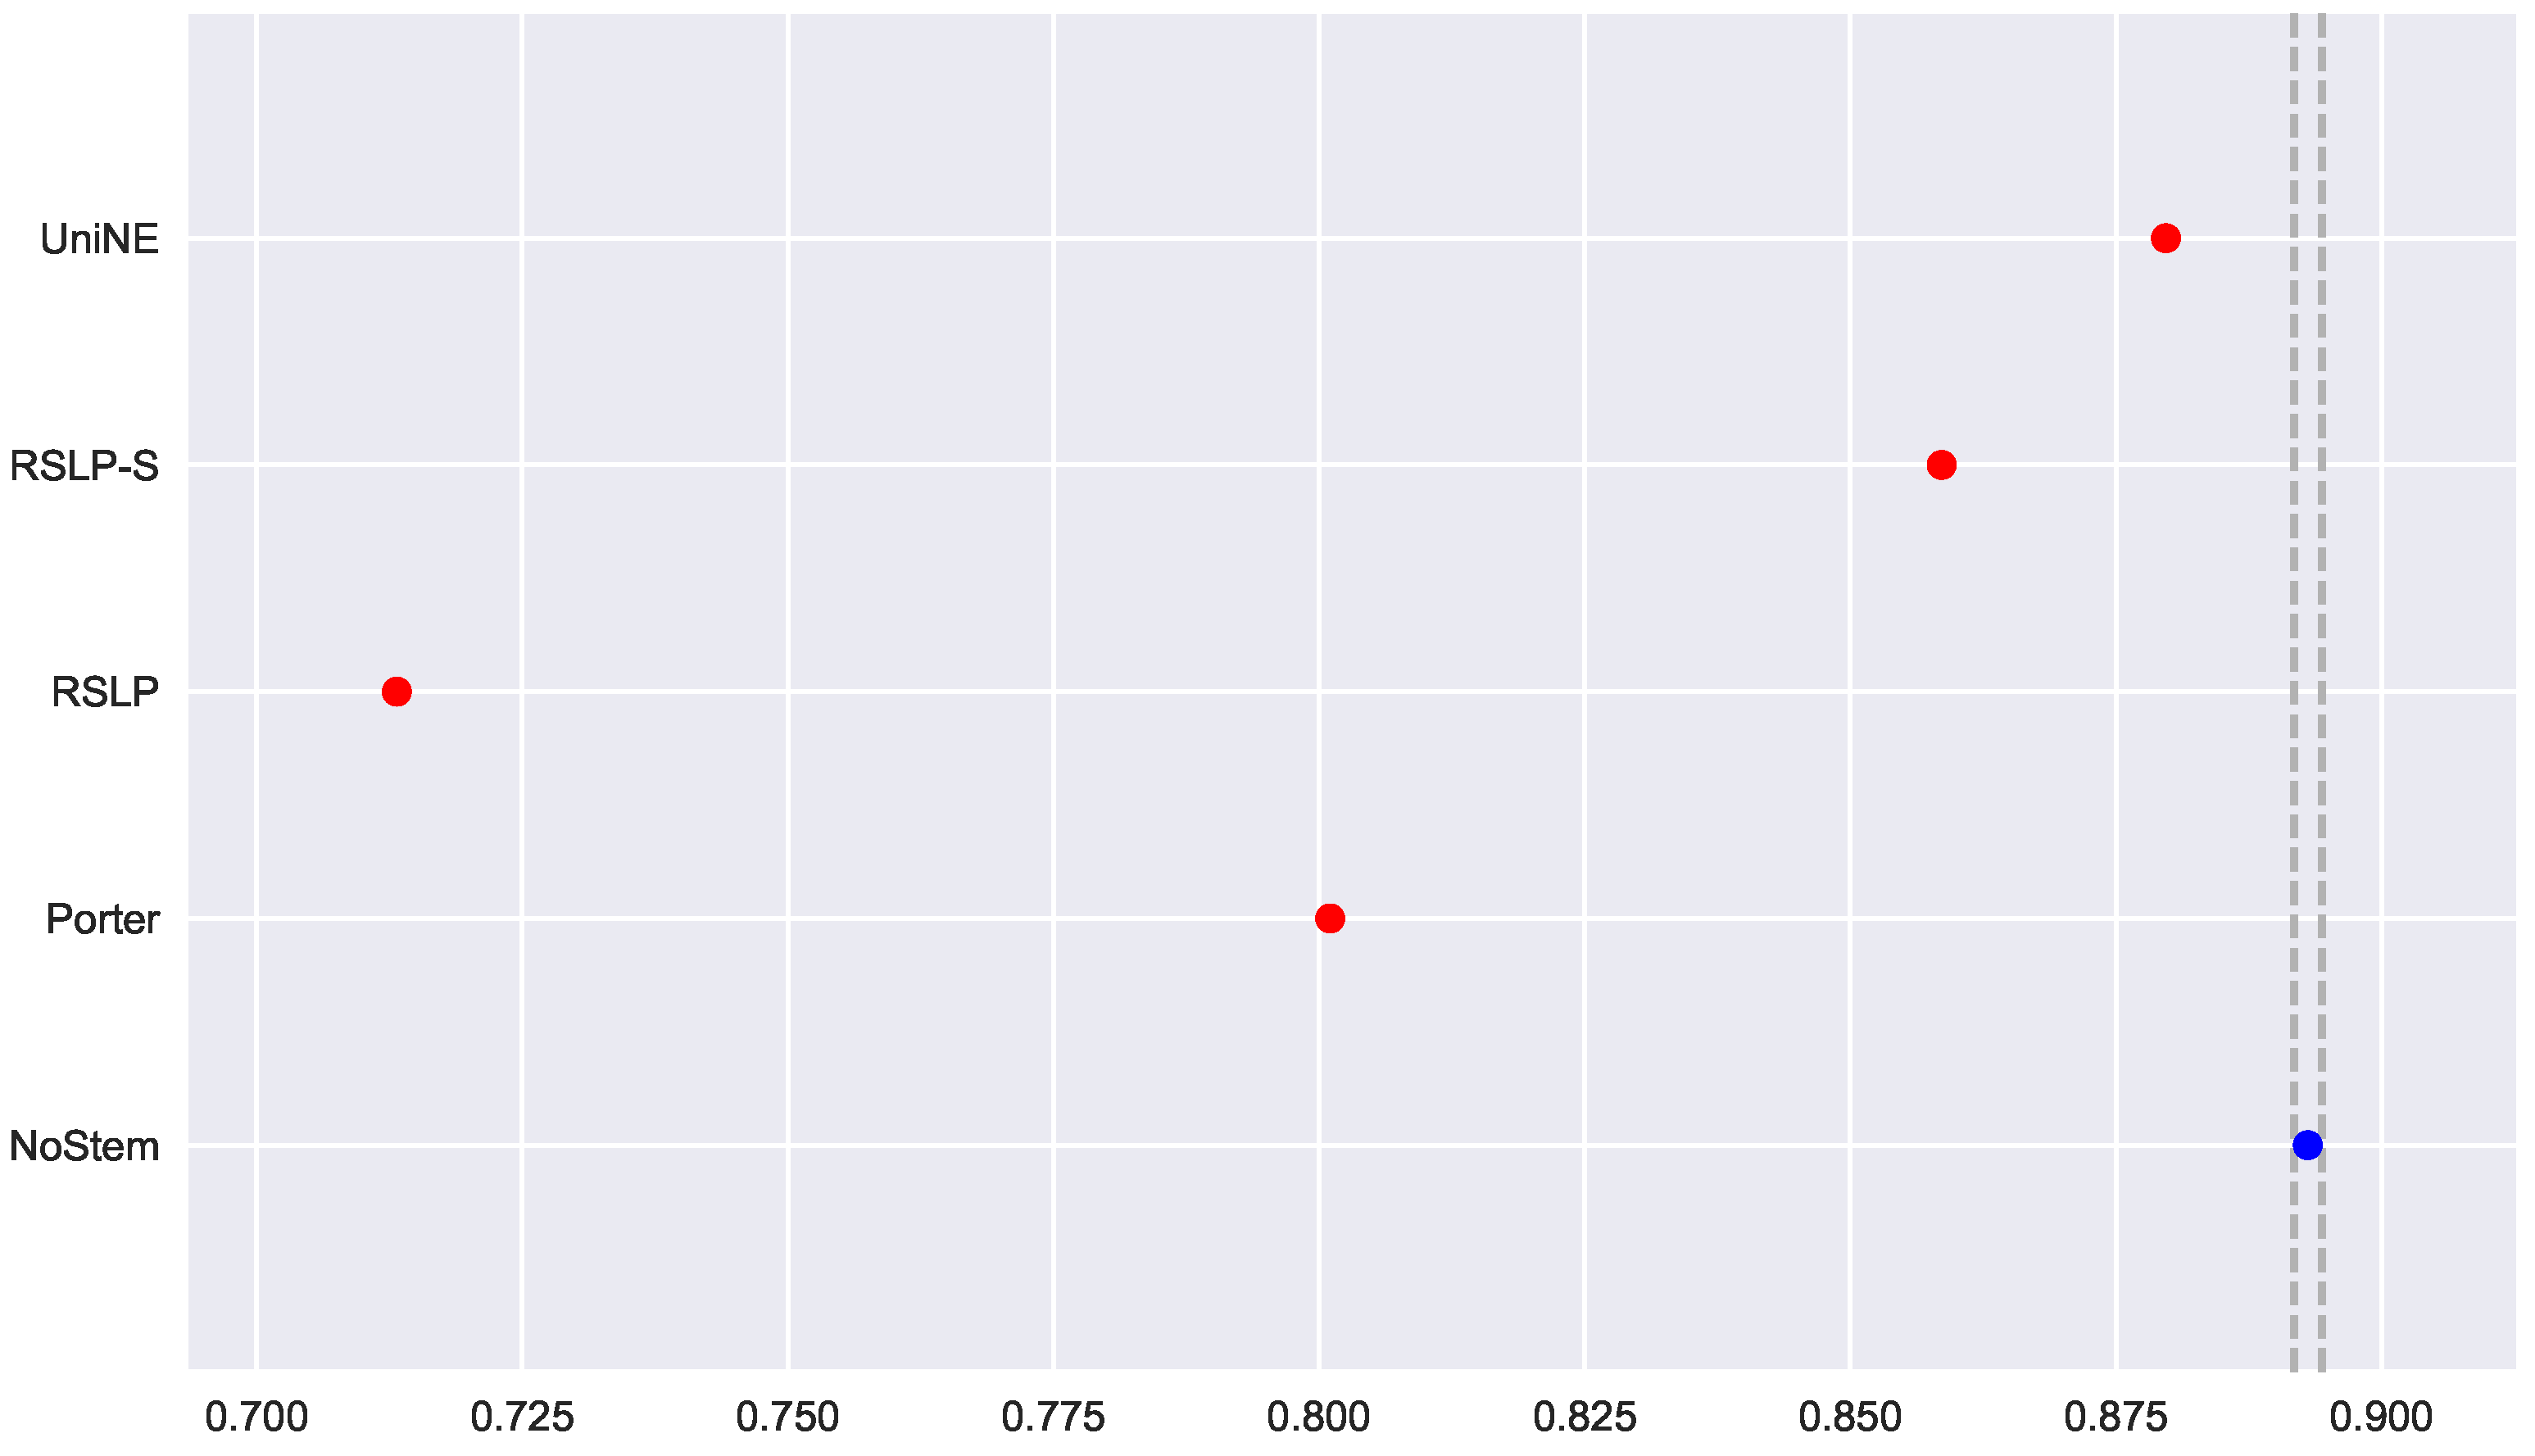
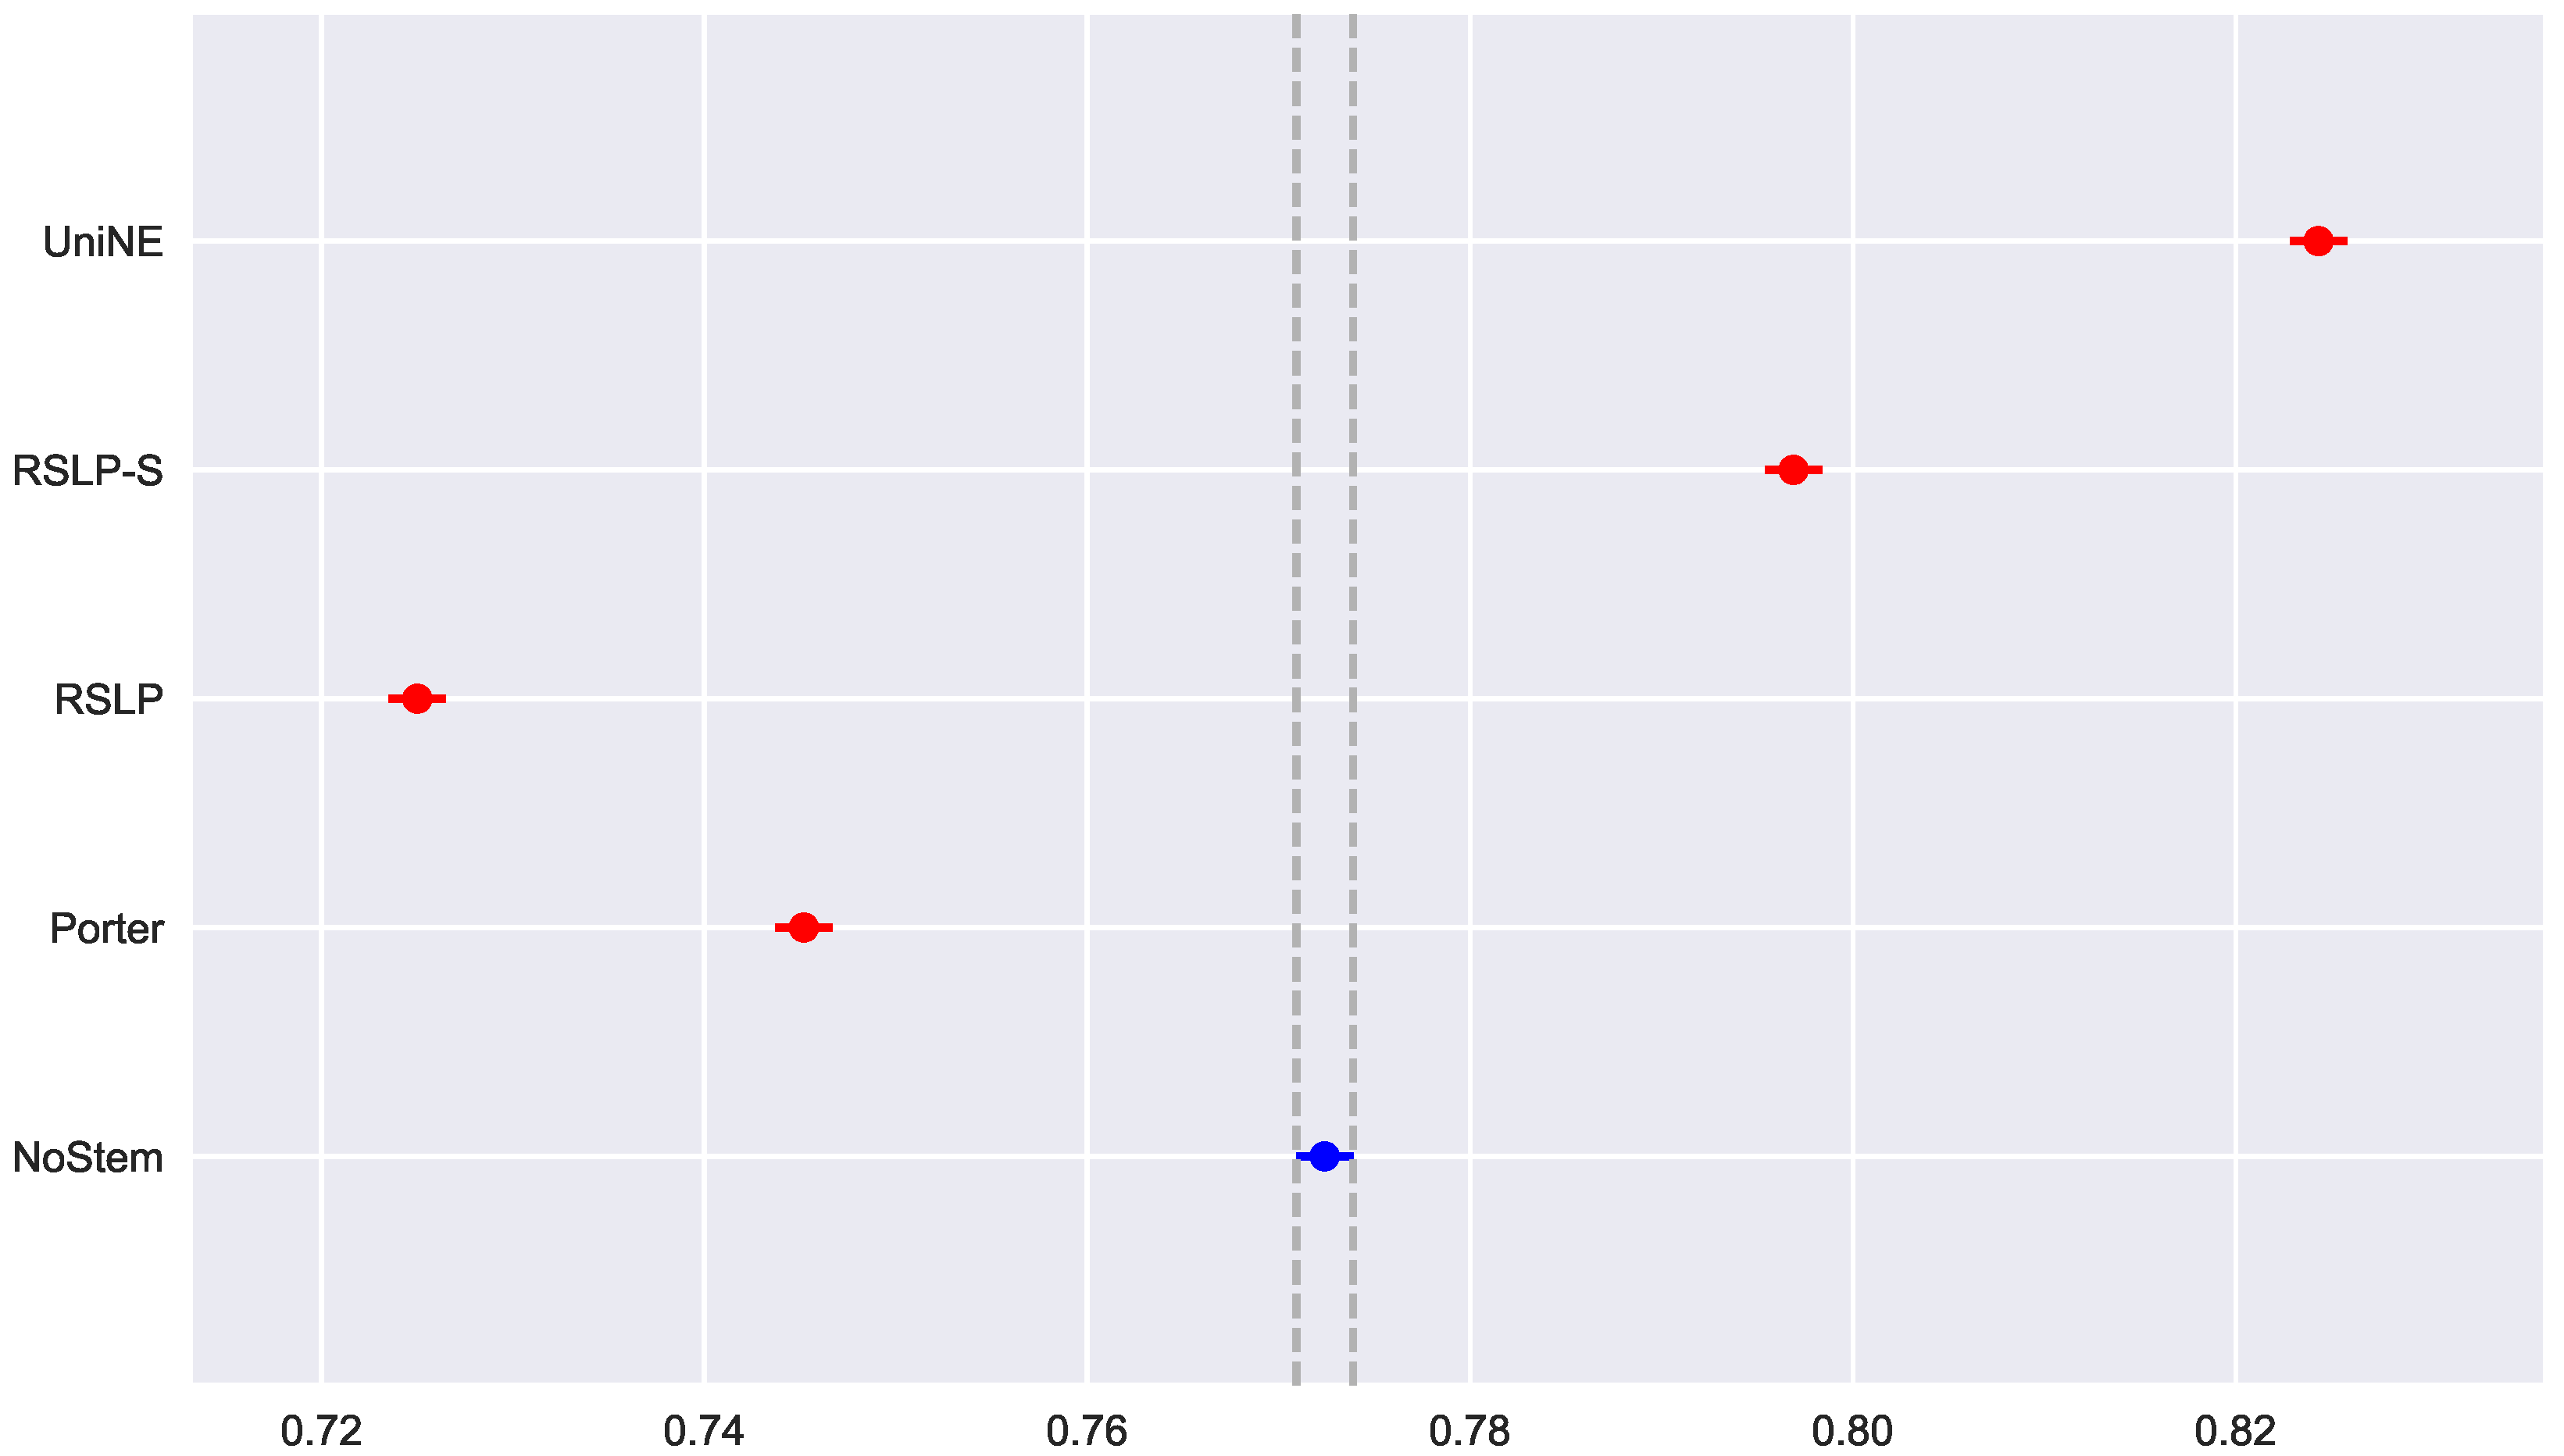
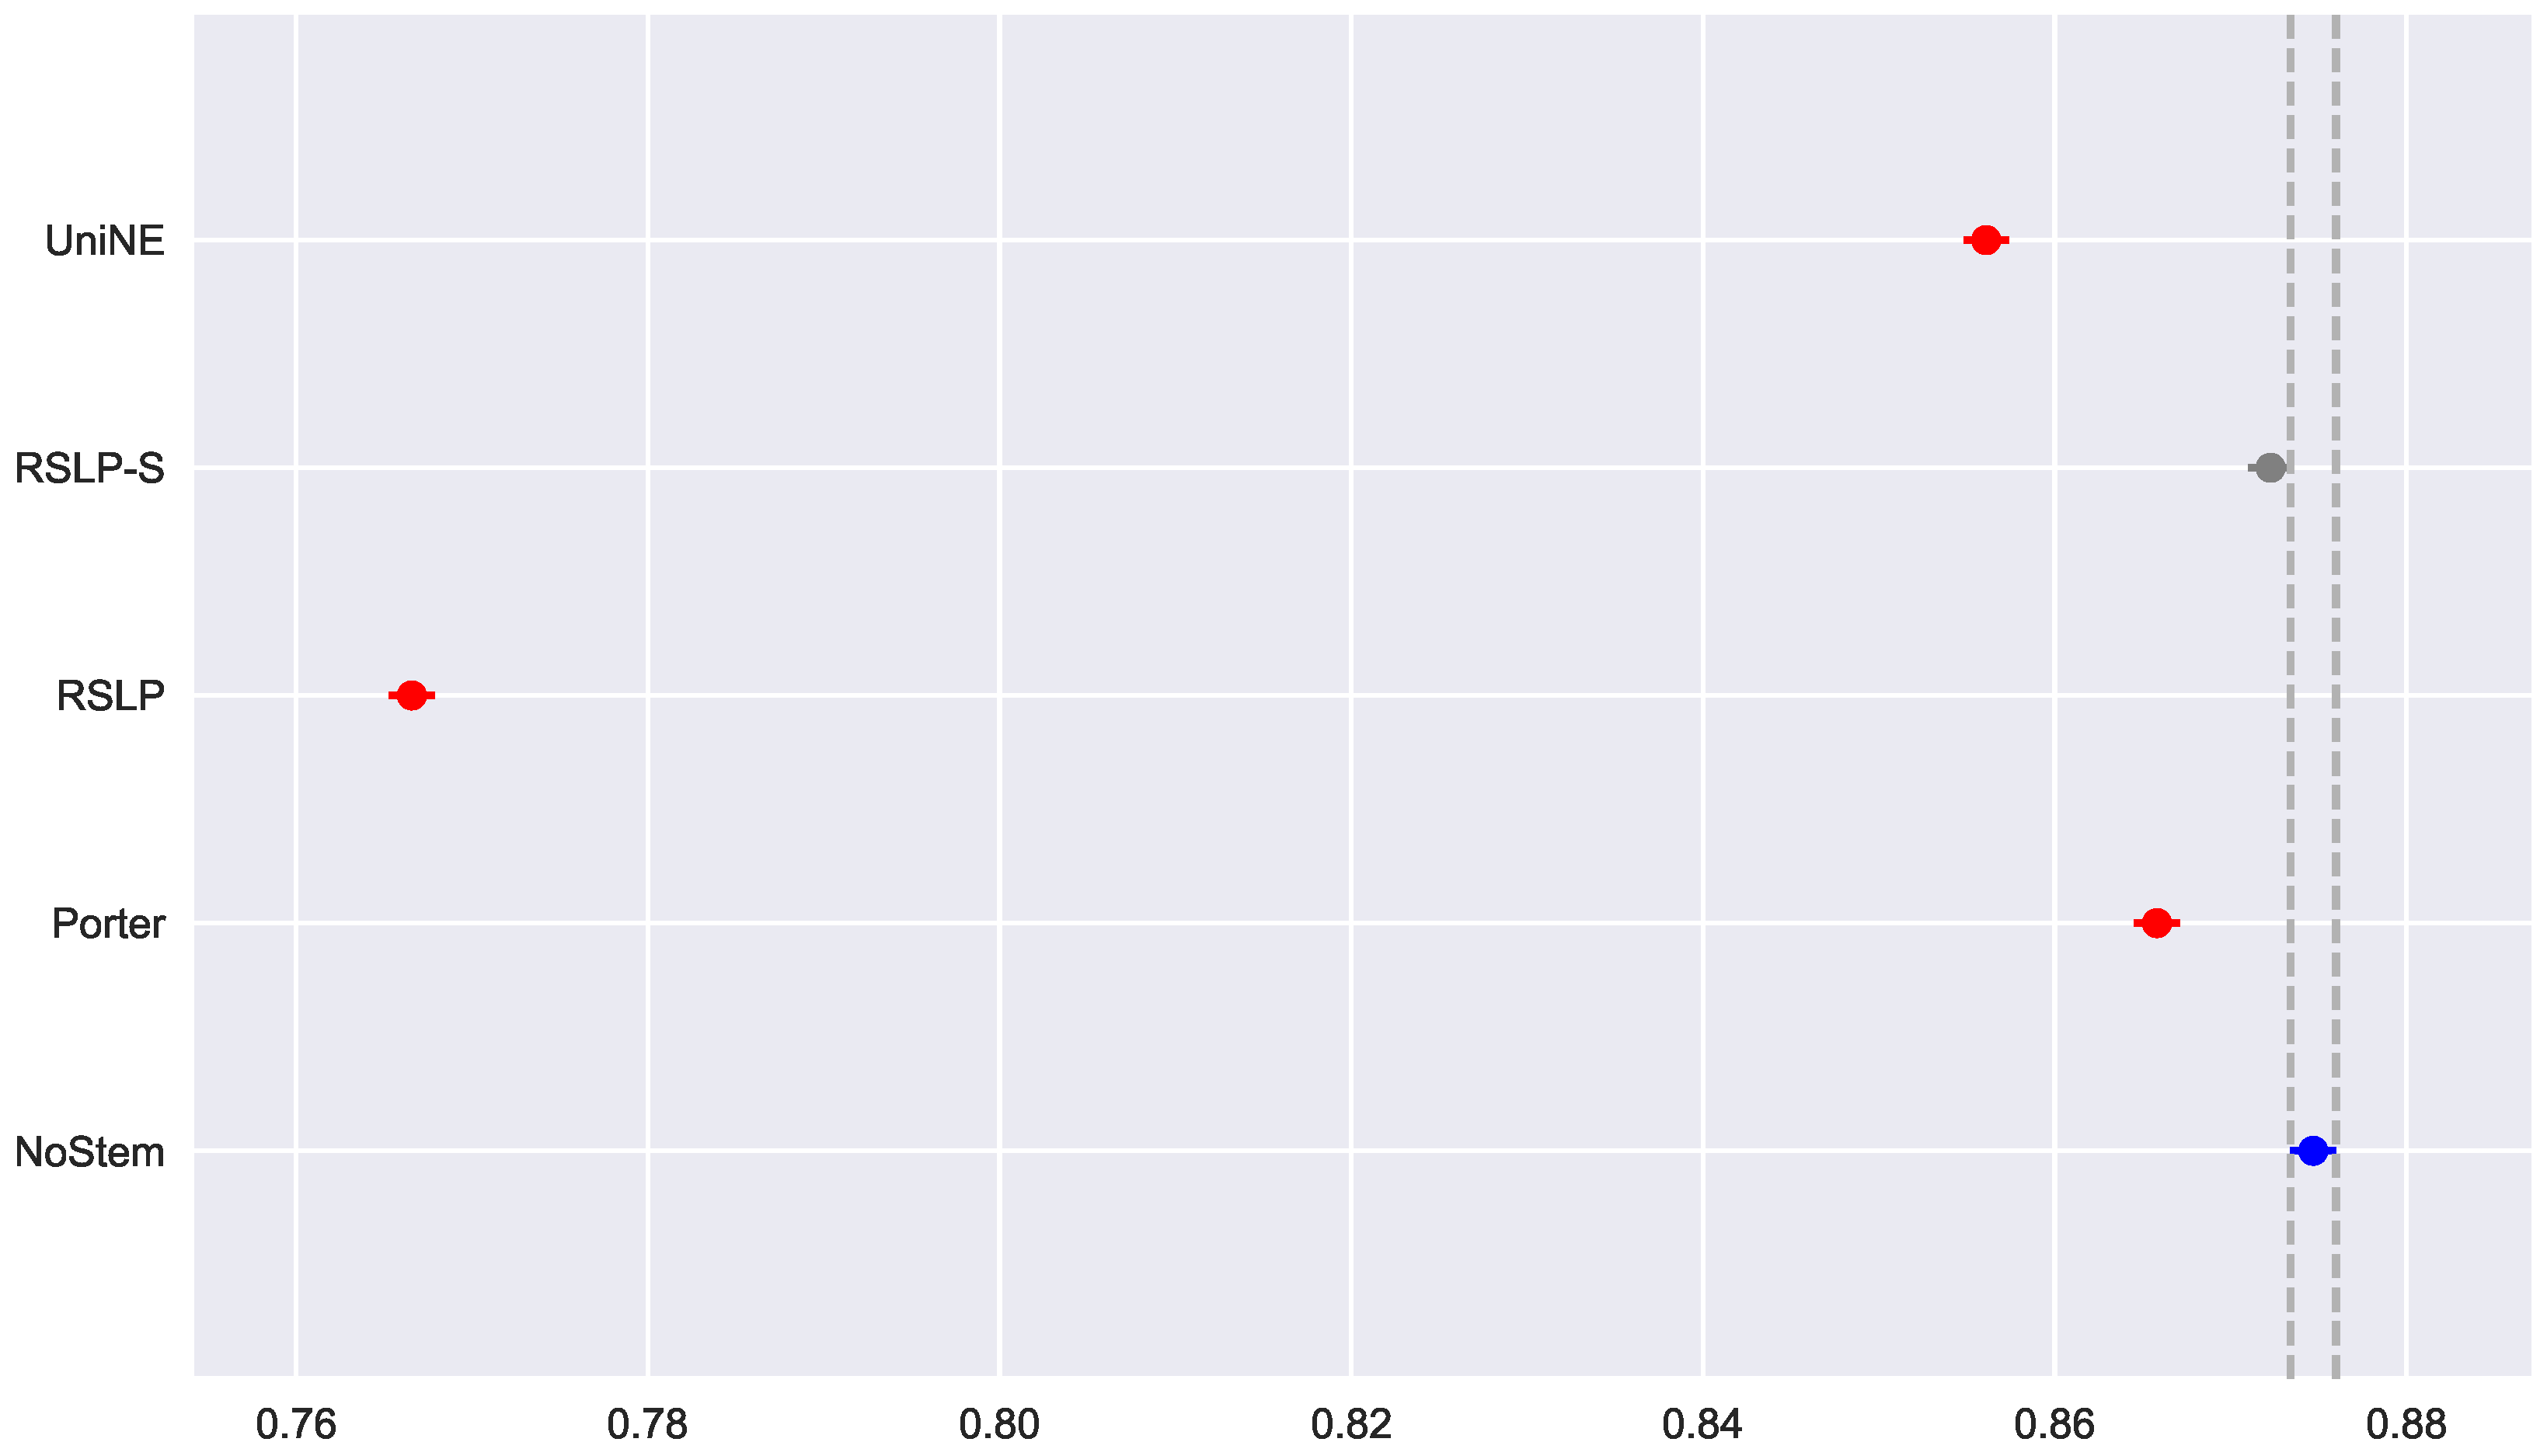
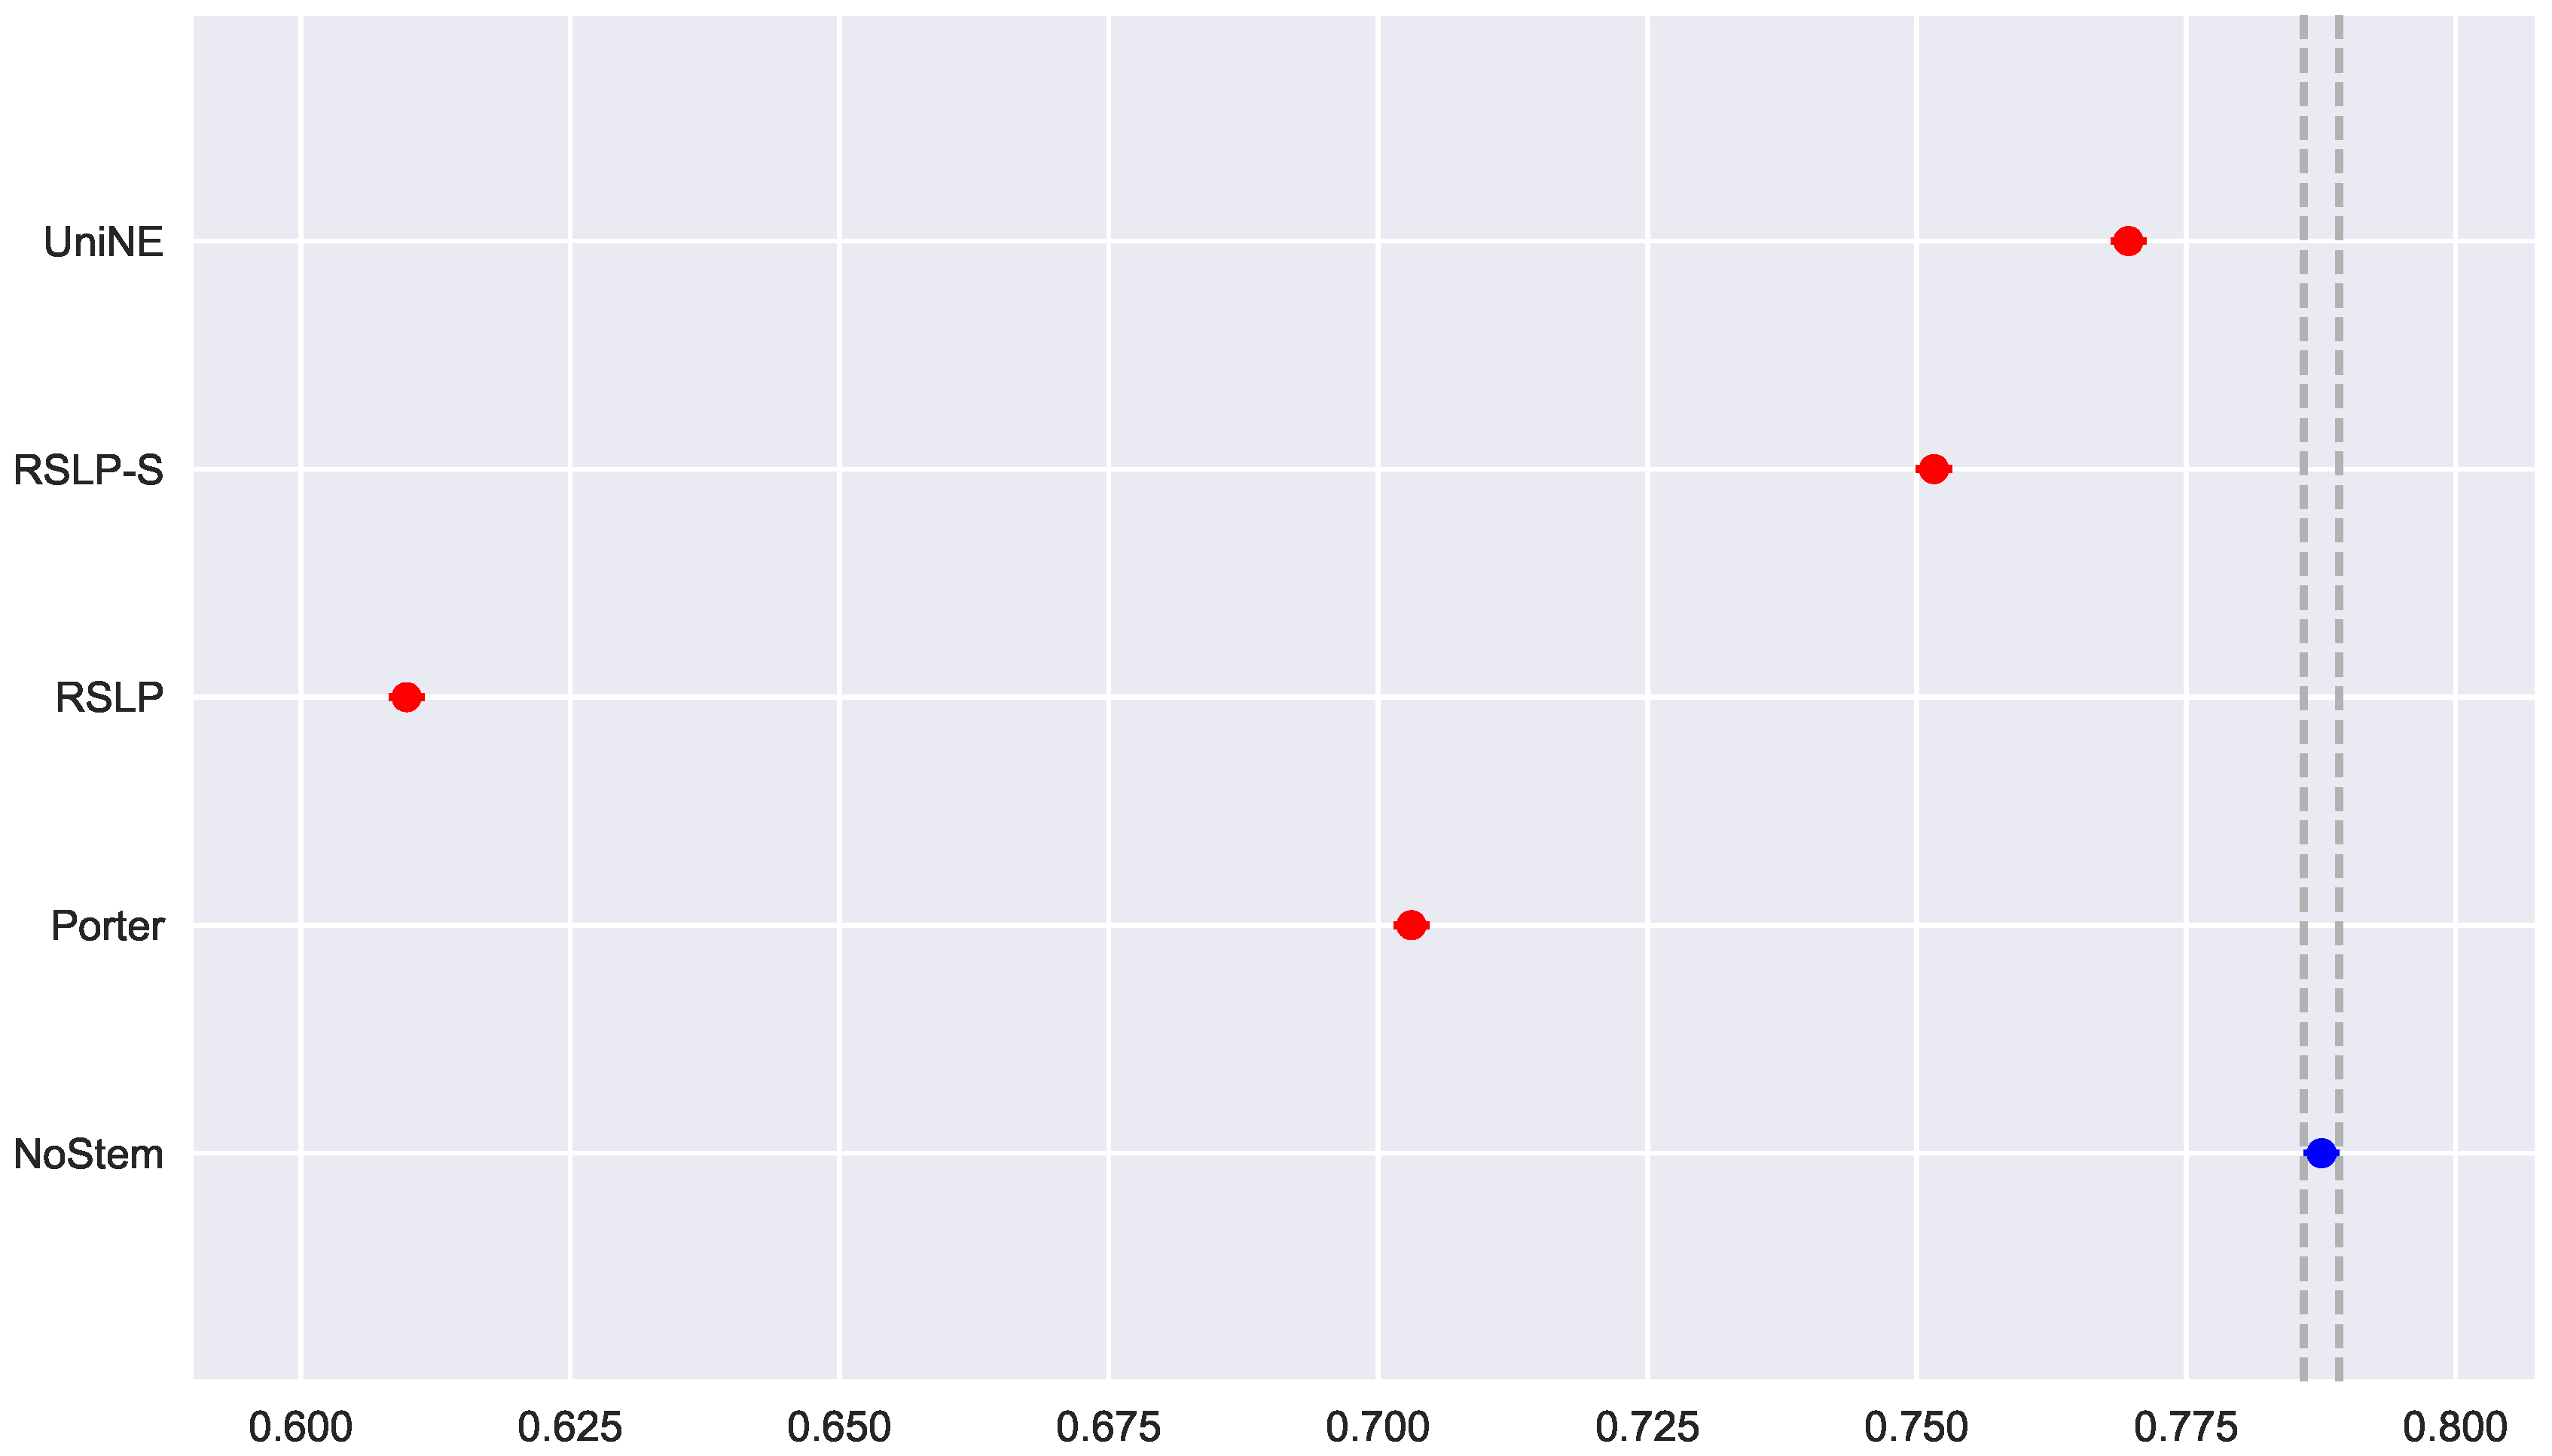
To visualize these differences, we construct Figure 6 and conduct a post hoc analysis with Mann–Whitney tests, applying the Benferroni correction (). In the figure, the blue dot highlights the control group and the vertical lines represent the confidence interval. Thus, both the graph and the tests conducted showed a decrease in effectiveness of the jurisprudential information retrieval with respect to MAP.
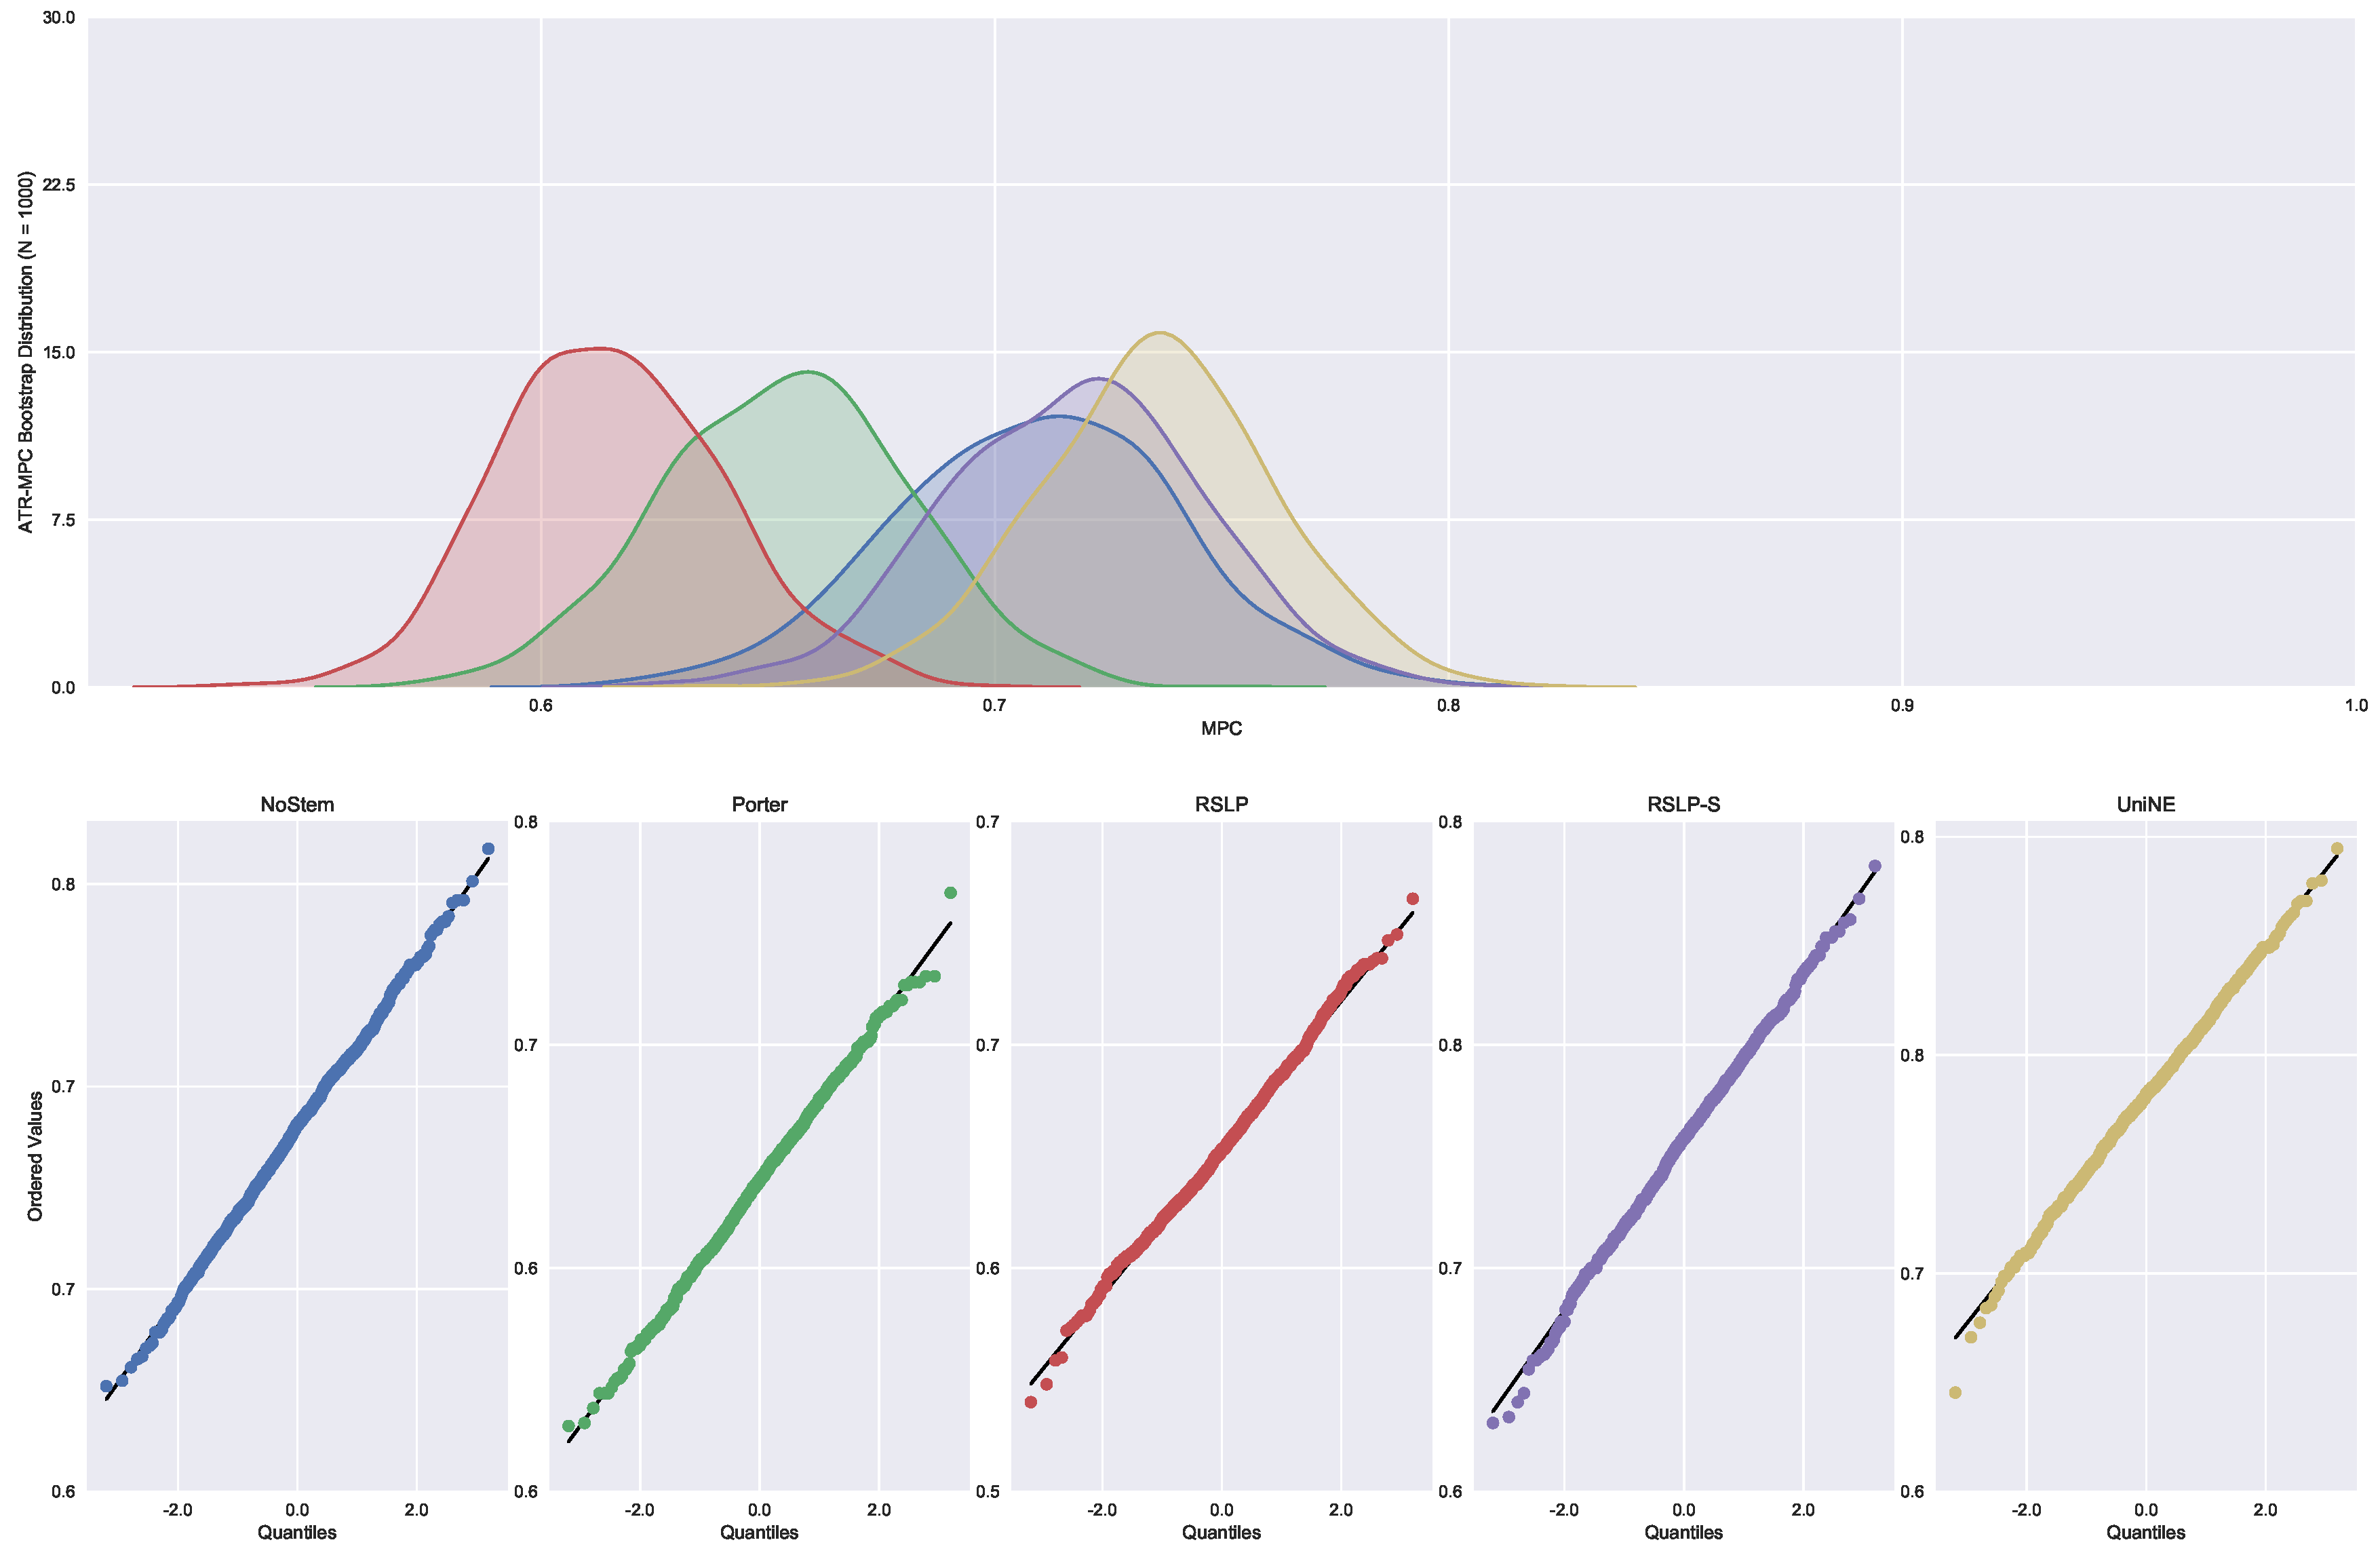
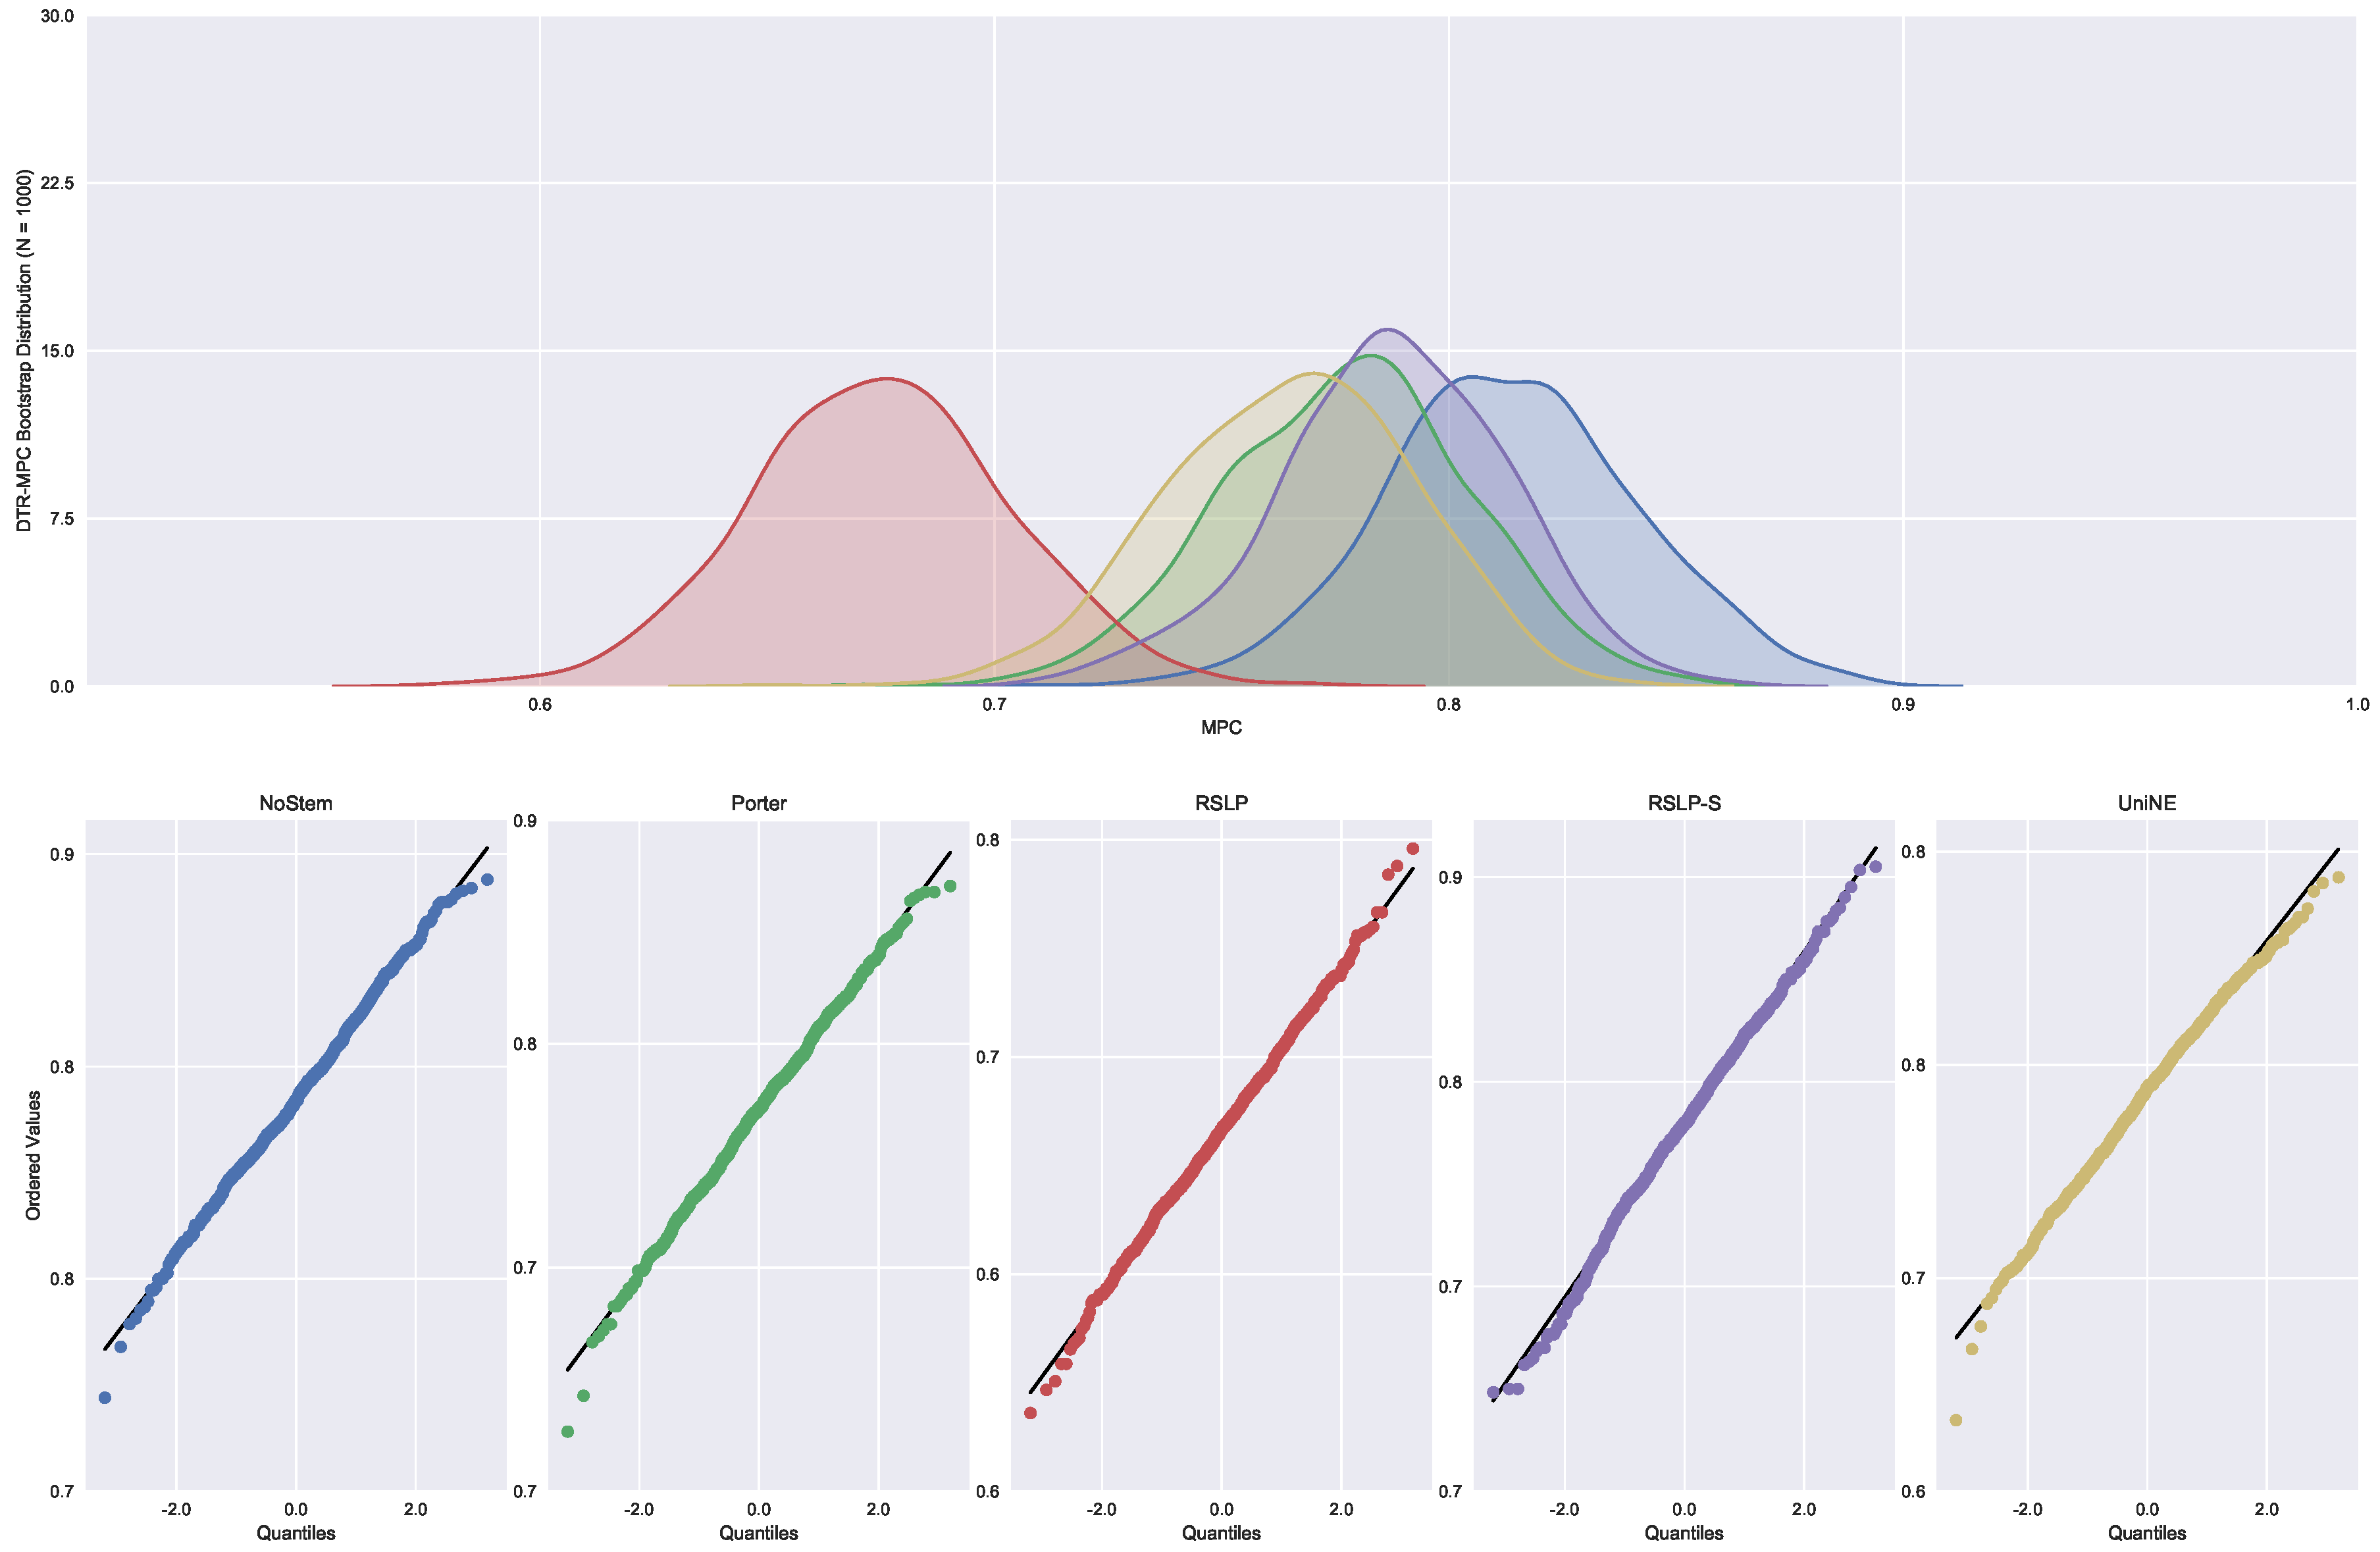
Continuing the analysis of the metrics, we checked the assumption of data normality regarding the MPC. In this case, we can see in Figure 7 that the distributions appear normal and the execution of the Shapiro-Wilk test did not reject this hypothesis, except for the UniNE algorithm, because it was below the level of significance (p-value = 0.027). The Levene test showed heteroscedasticity of the data (p-value < 0.001) and the Kruskal–Wallis test refuted the hypothesis of MPC equality among the groups (). After visual analysis of the metric for each treatment (Figure 8) and study of the statistical significance of these differences using the Mann–Whitney test, with all comparisons having p-value below 0.001, we arrived to the conclusion that MPC, as well as MAP, was negatively affected by the use of radicalization.
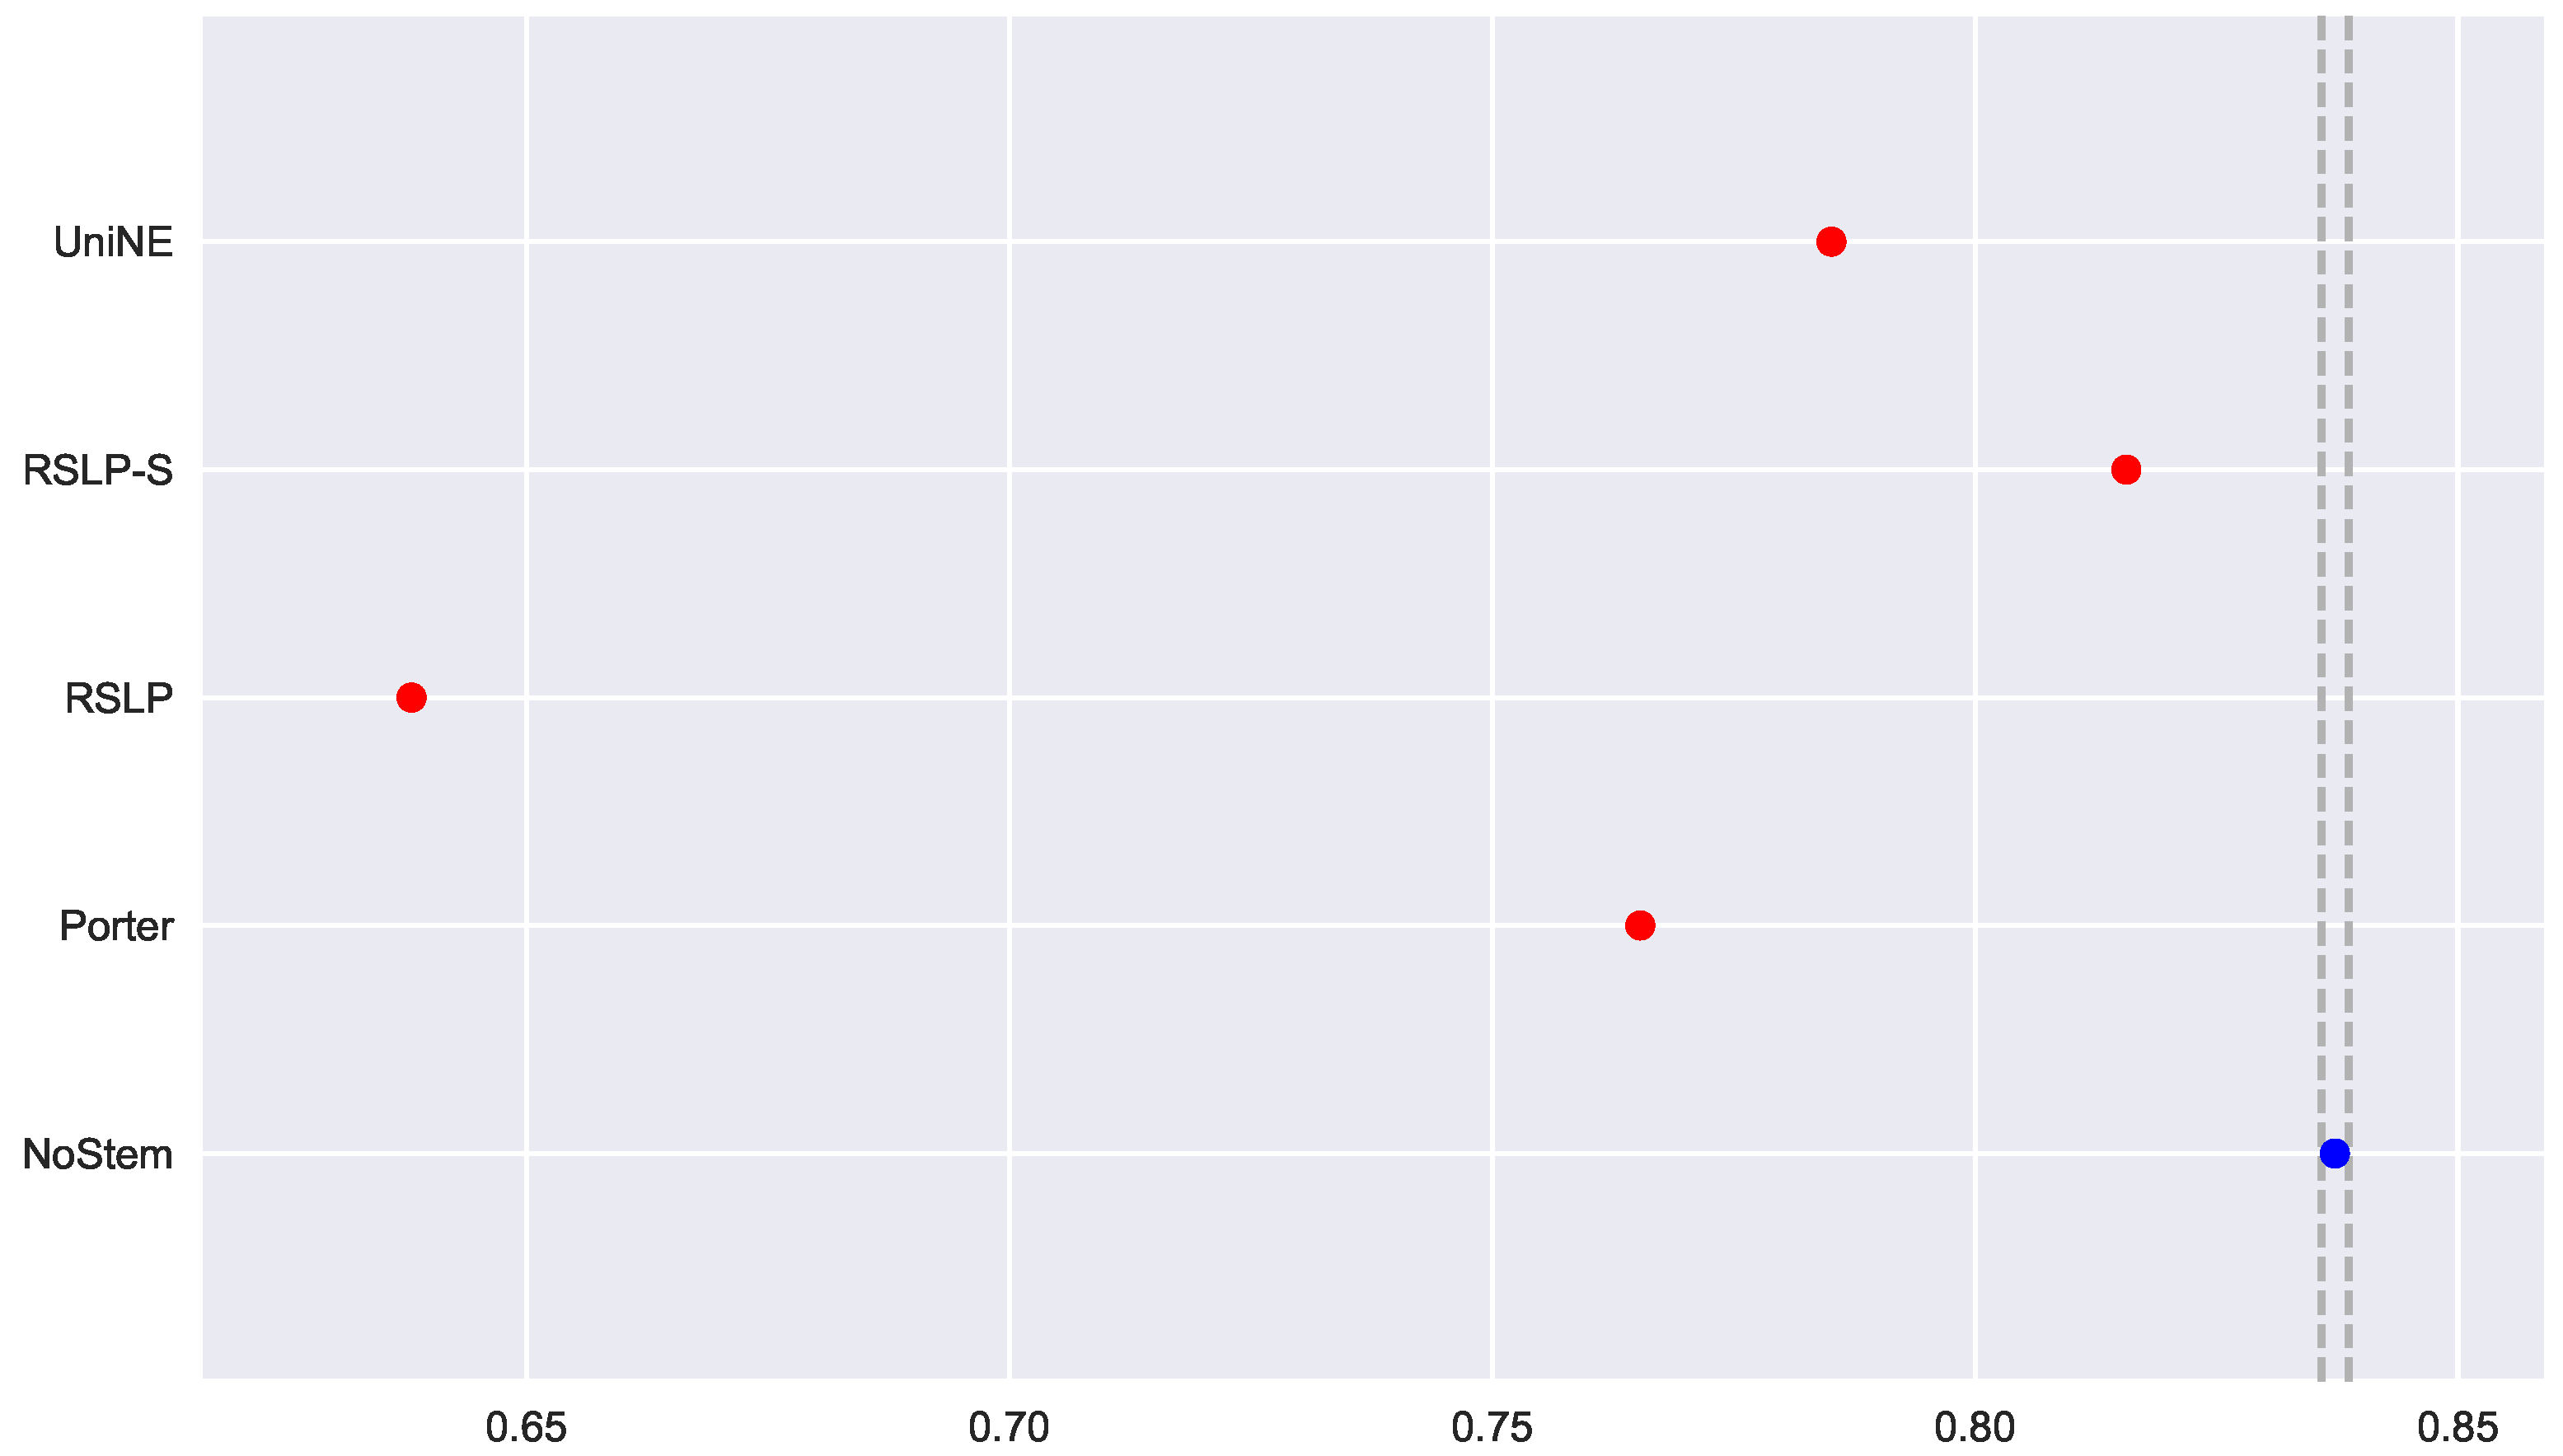
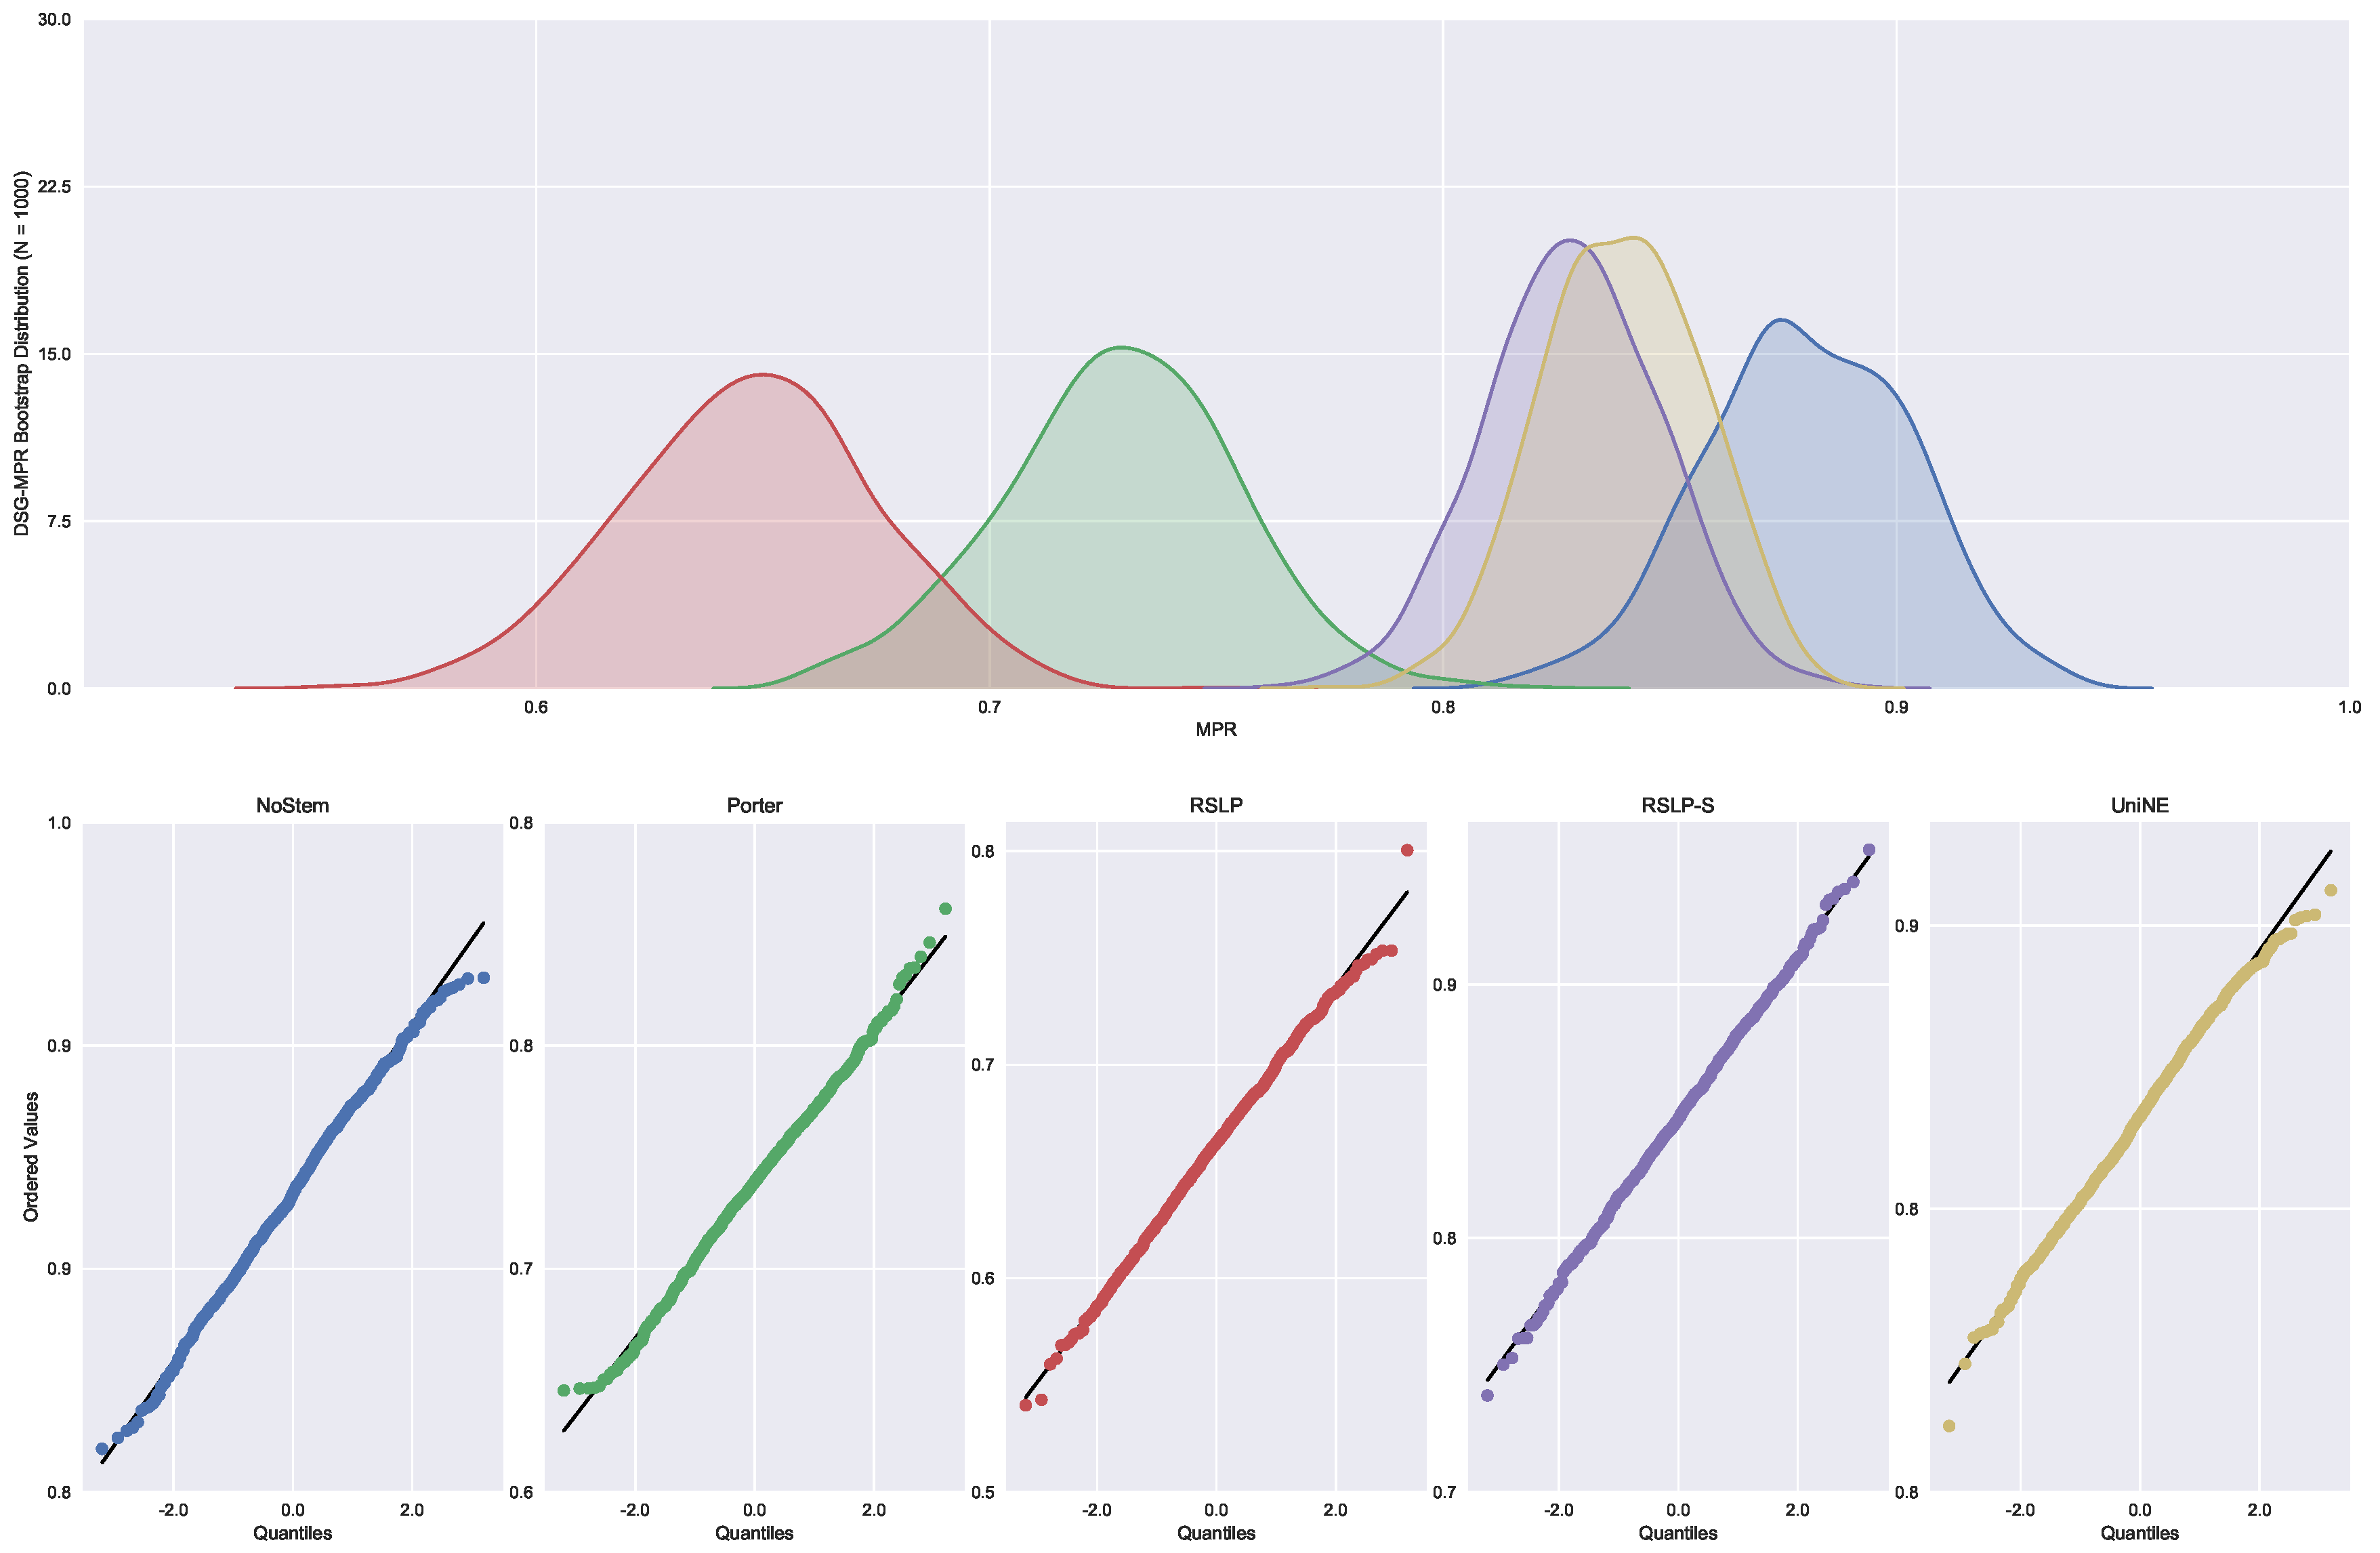
Finally, the data distribution of MRP (Figure 9) behaved in a manner analogous to that of MPC, with the same deviation of normality from the UniNE algorithm detected by the Shapiro–Wilk test (p-value < 0.001) and heteroscedasticity found by the Levene test (p-value < 0.001). As in the other two metrics, the Kruskal–Wallis test refuted the MRP equality between the algorithms () and the post hoc analysis with Mann–Whitney showed that the difference among the treatments , illustrated by Figure 10, and the control group was statistically significant (p-value < 0.001).
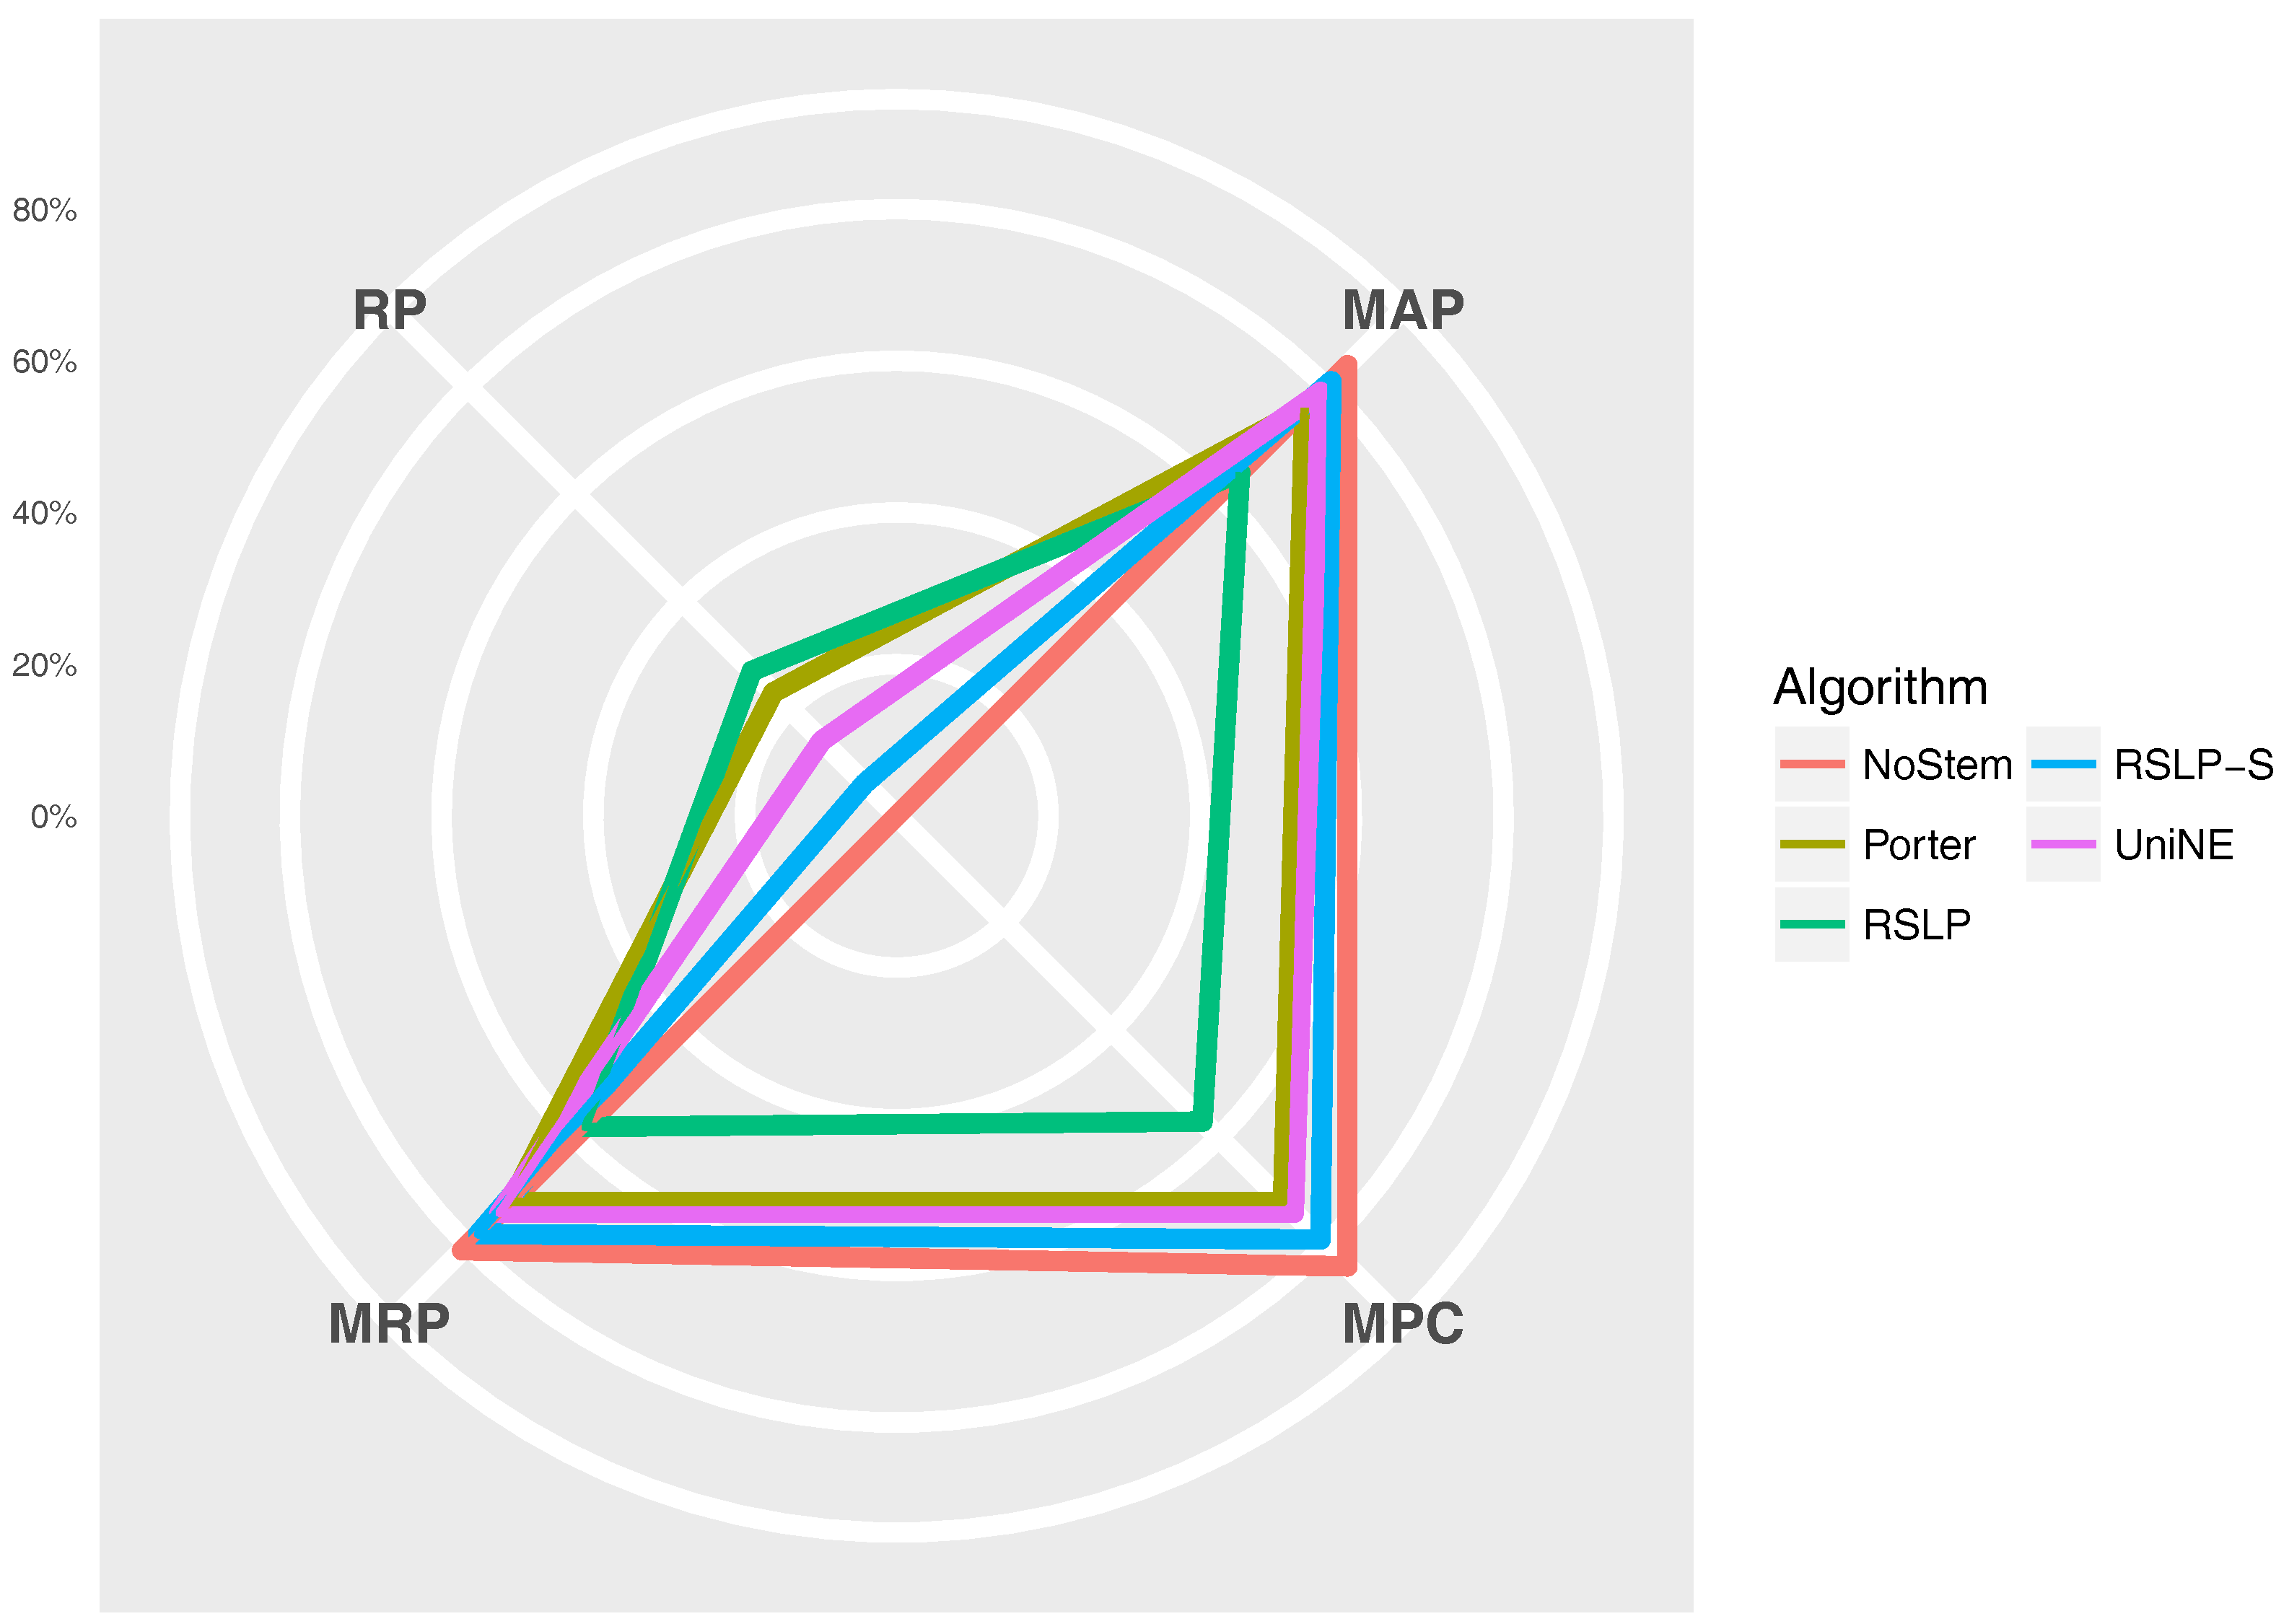
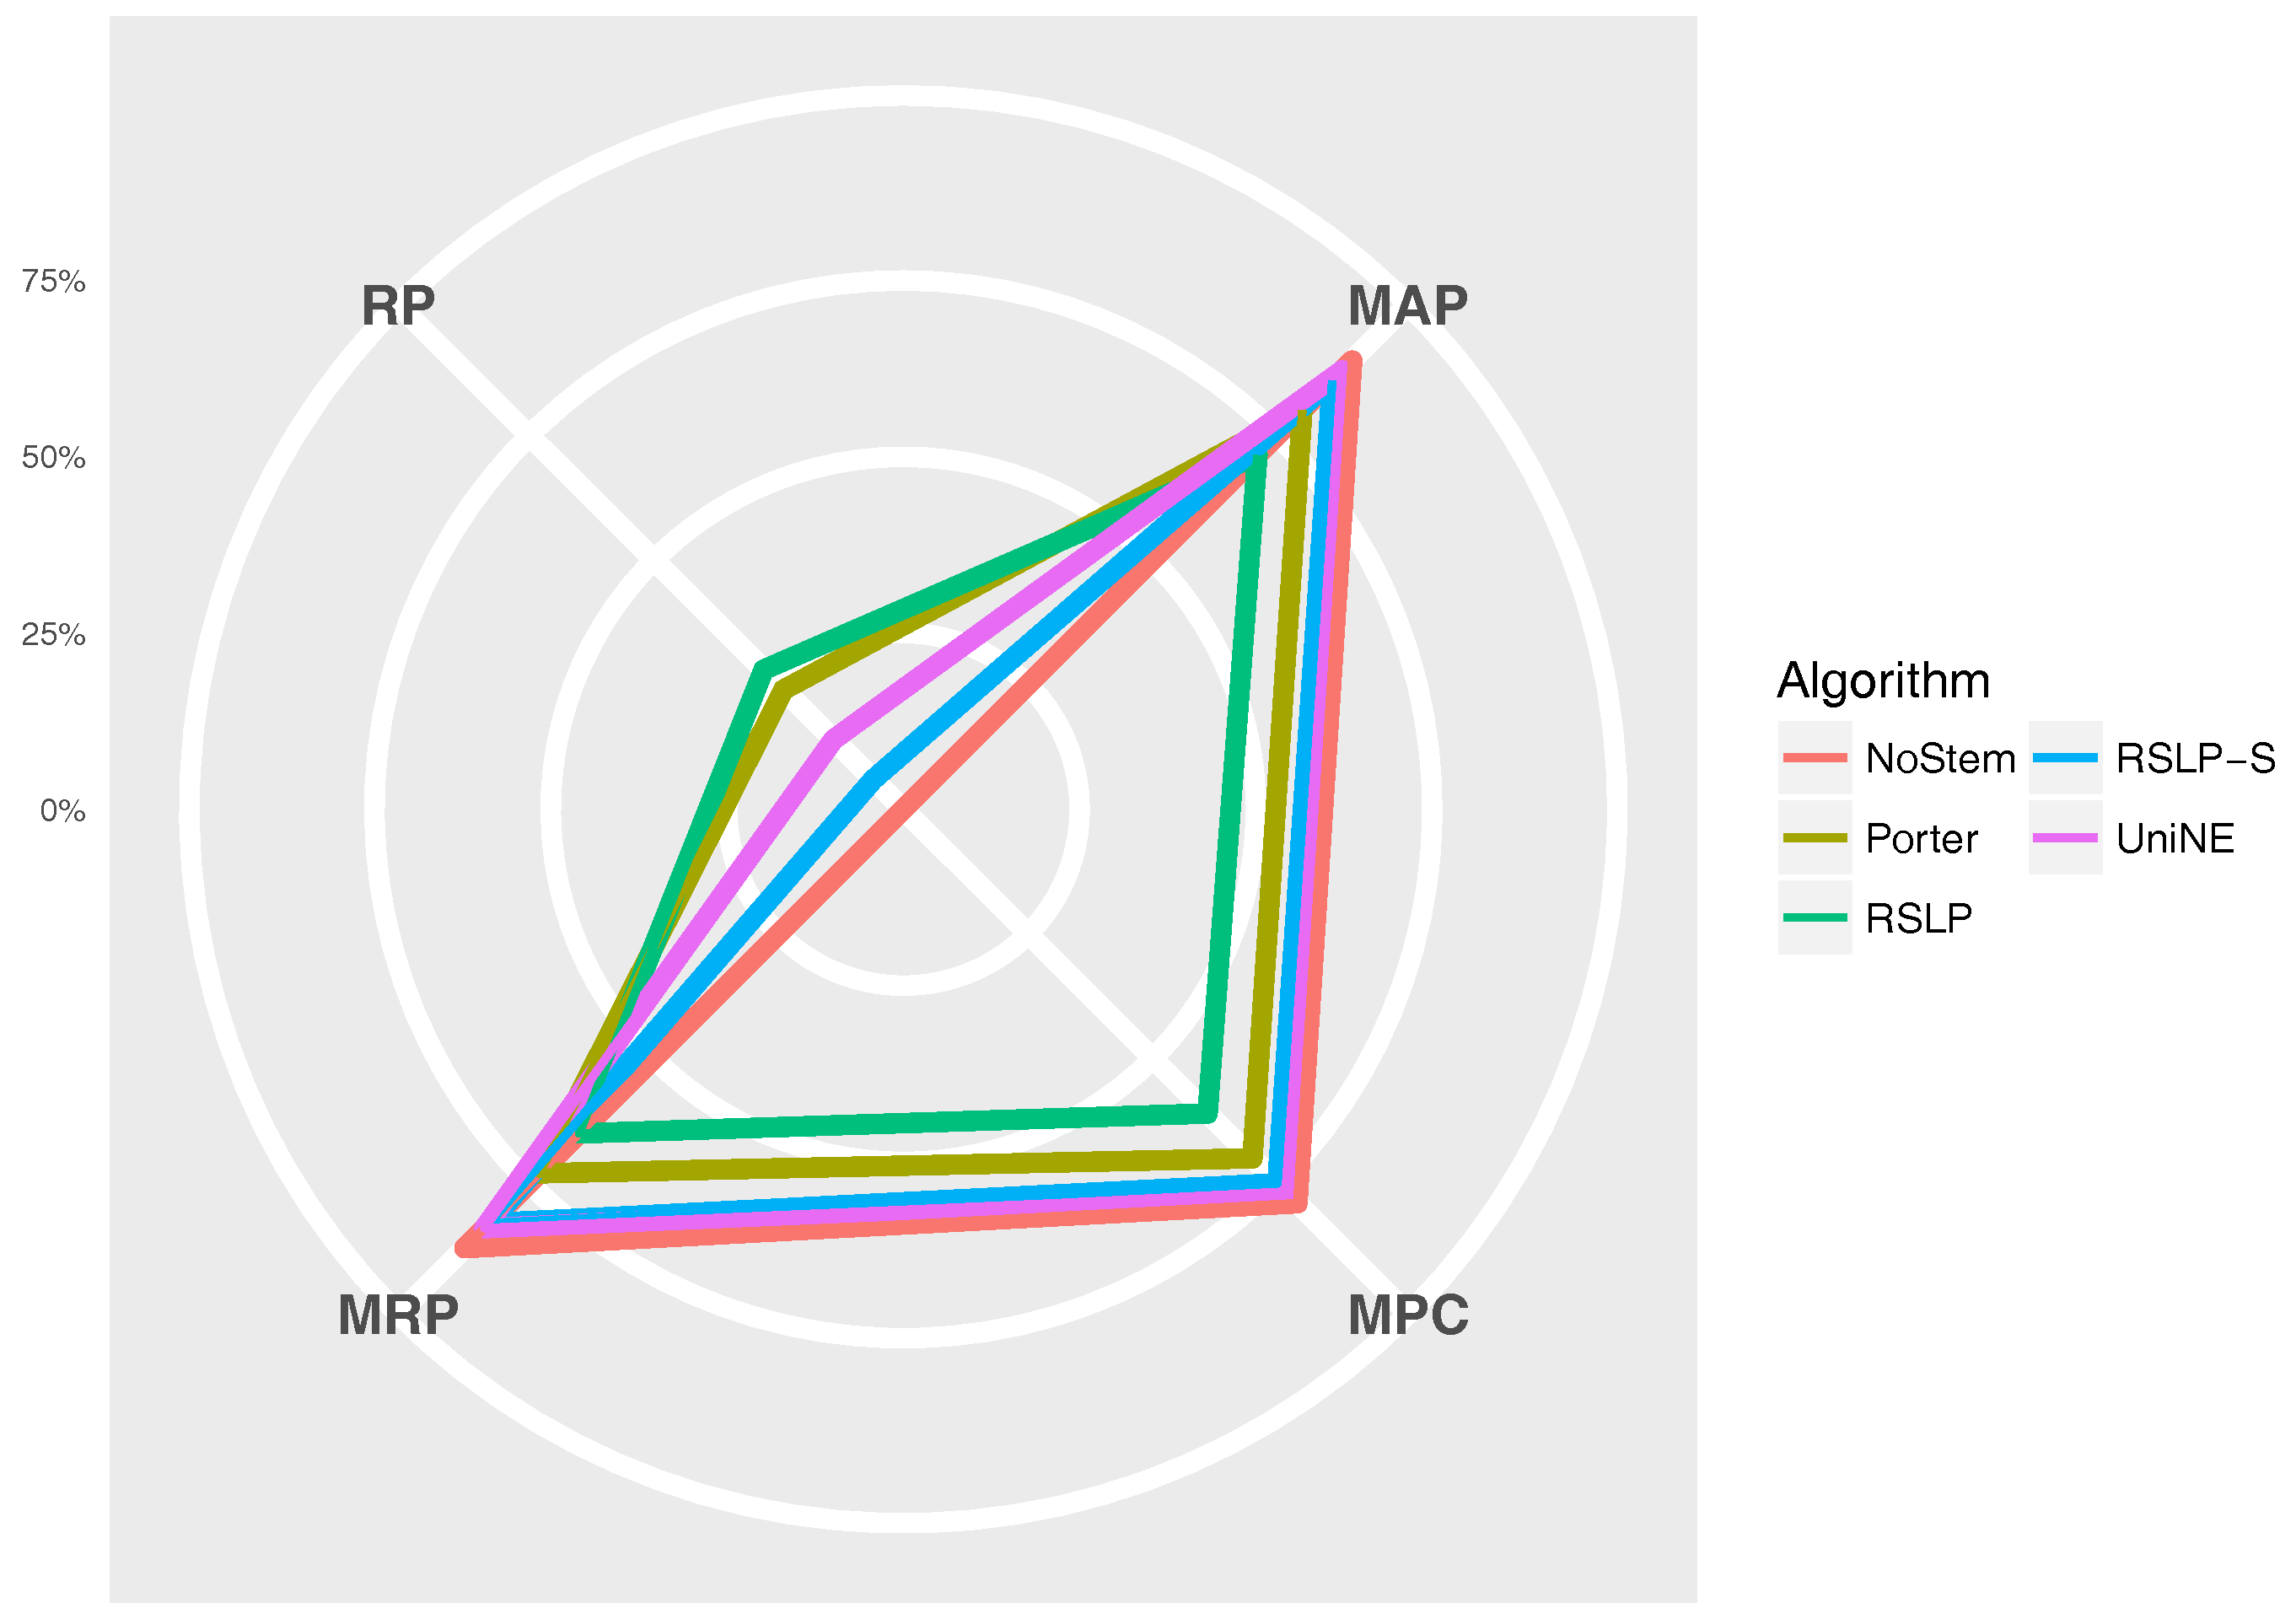
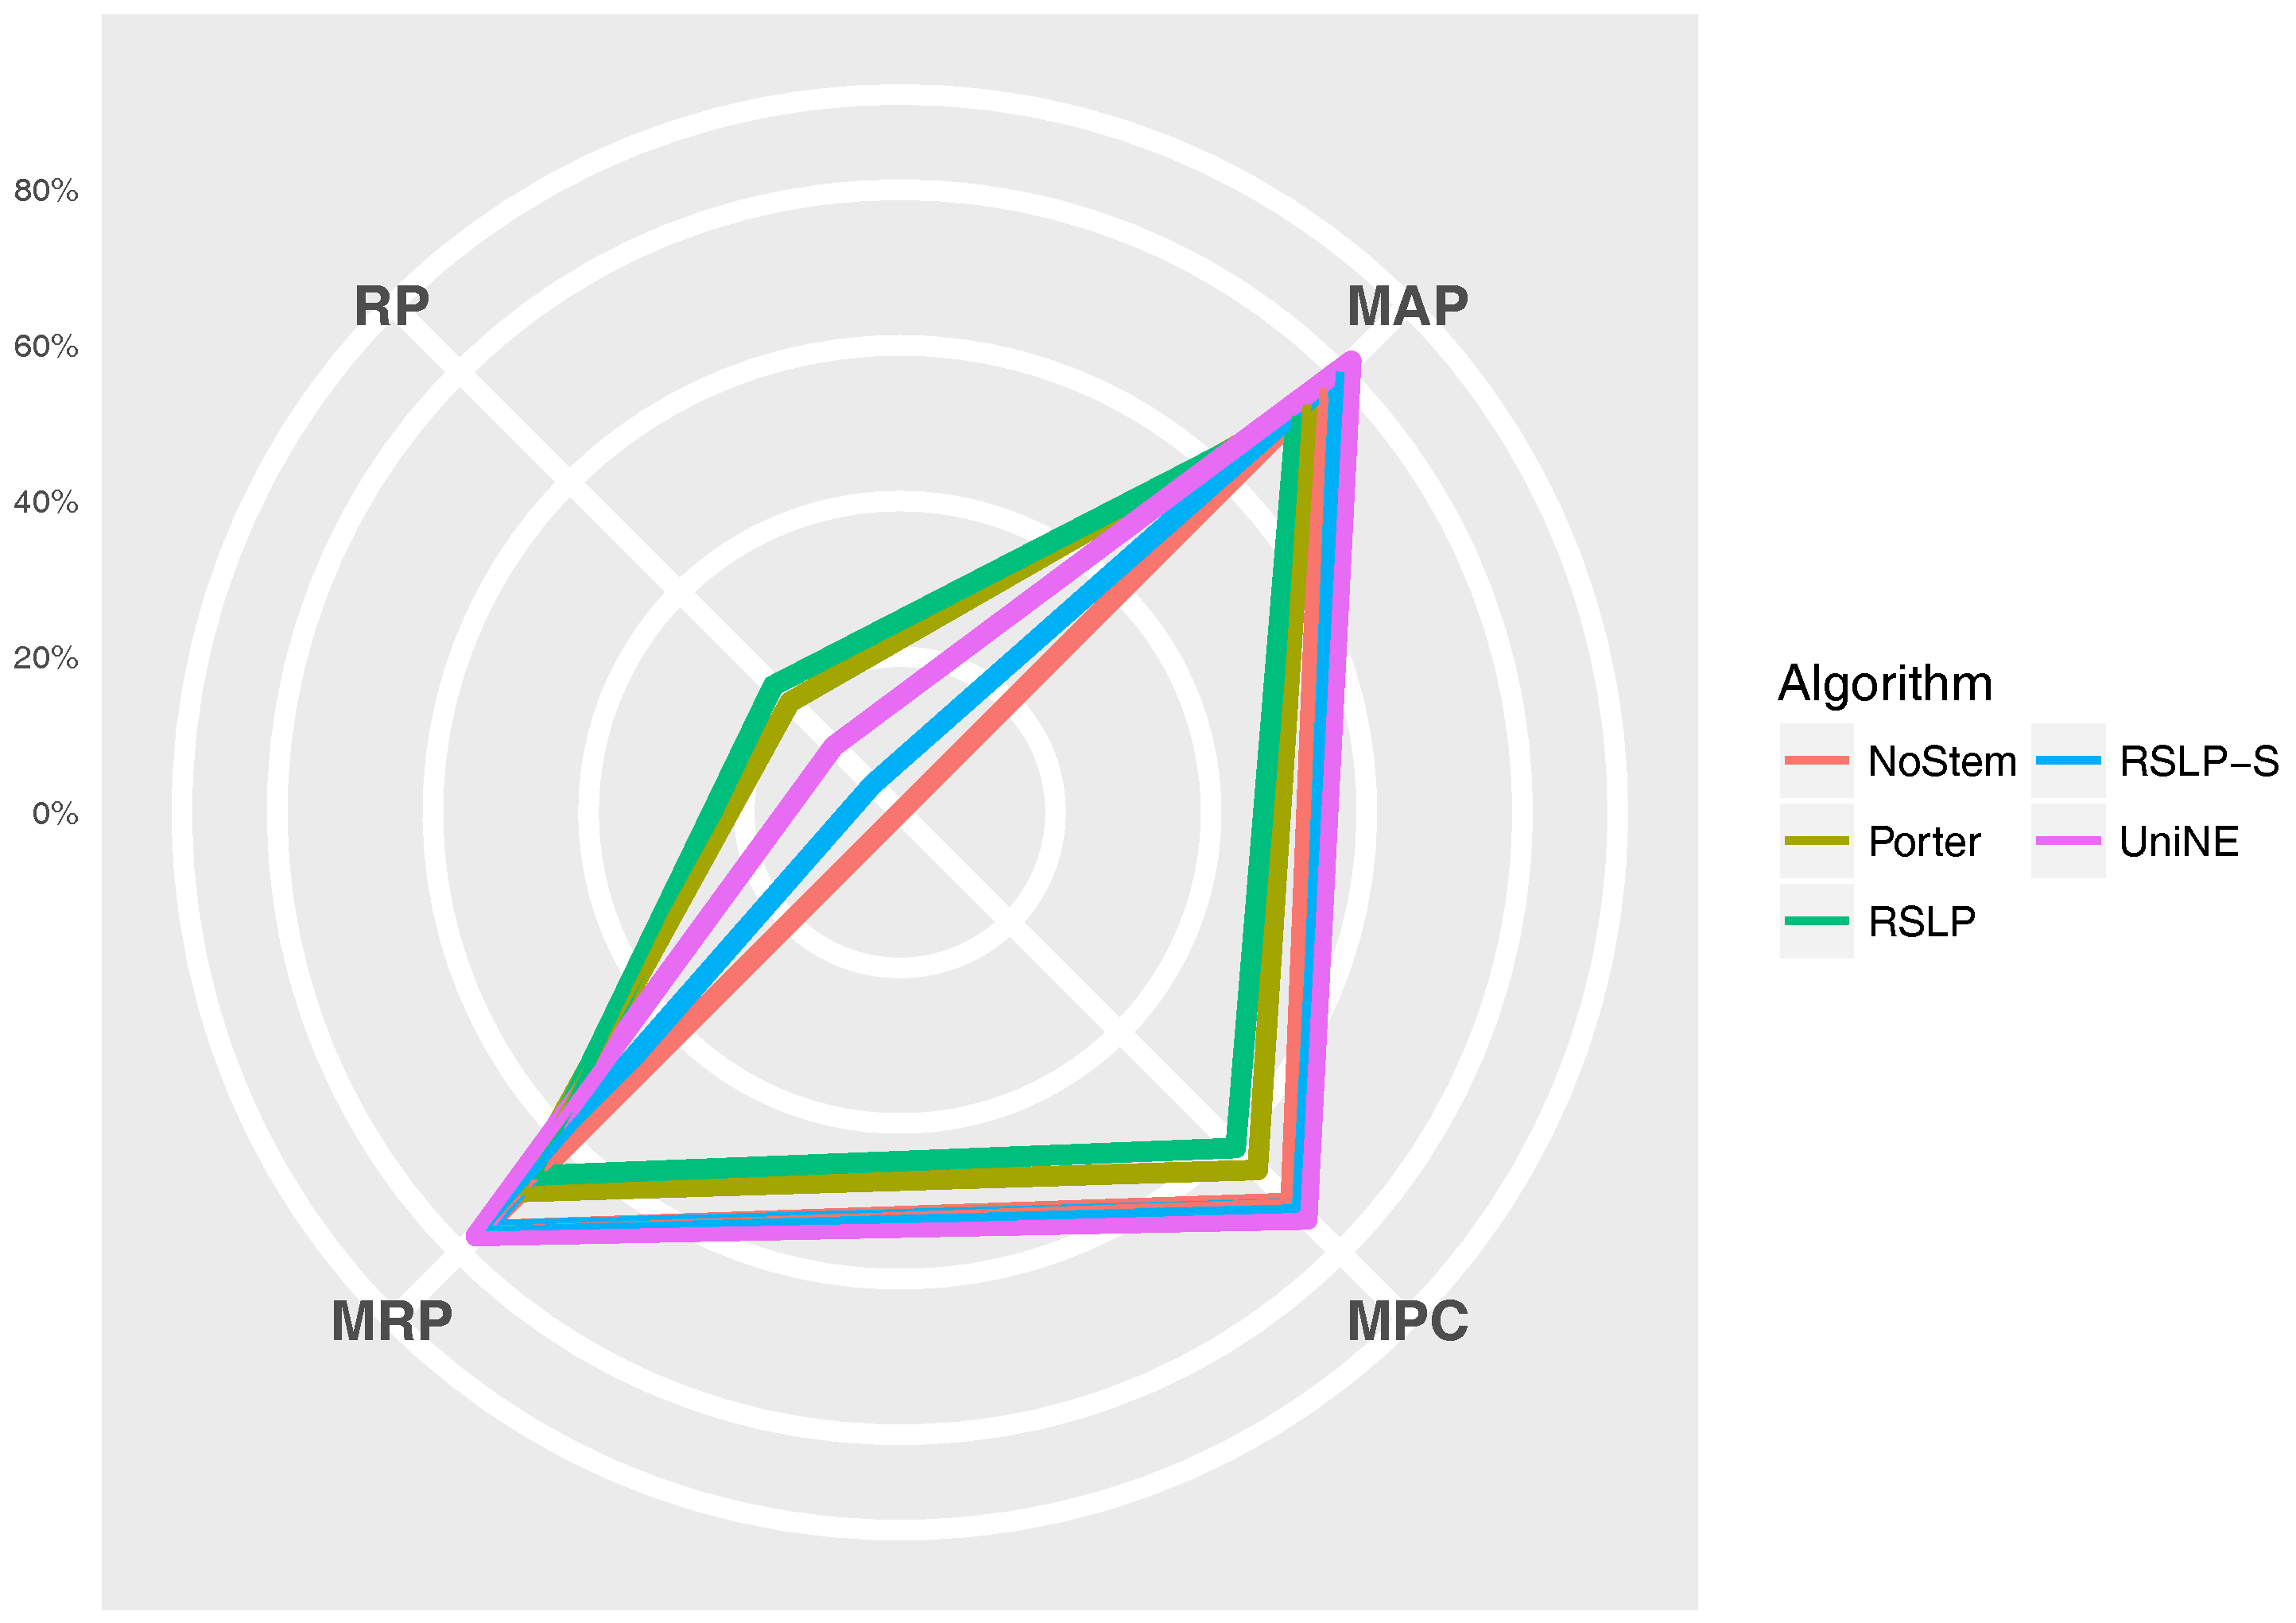
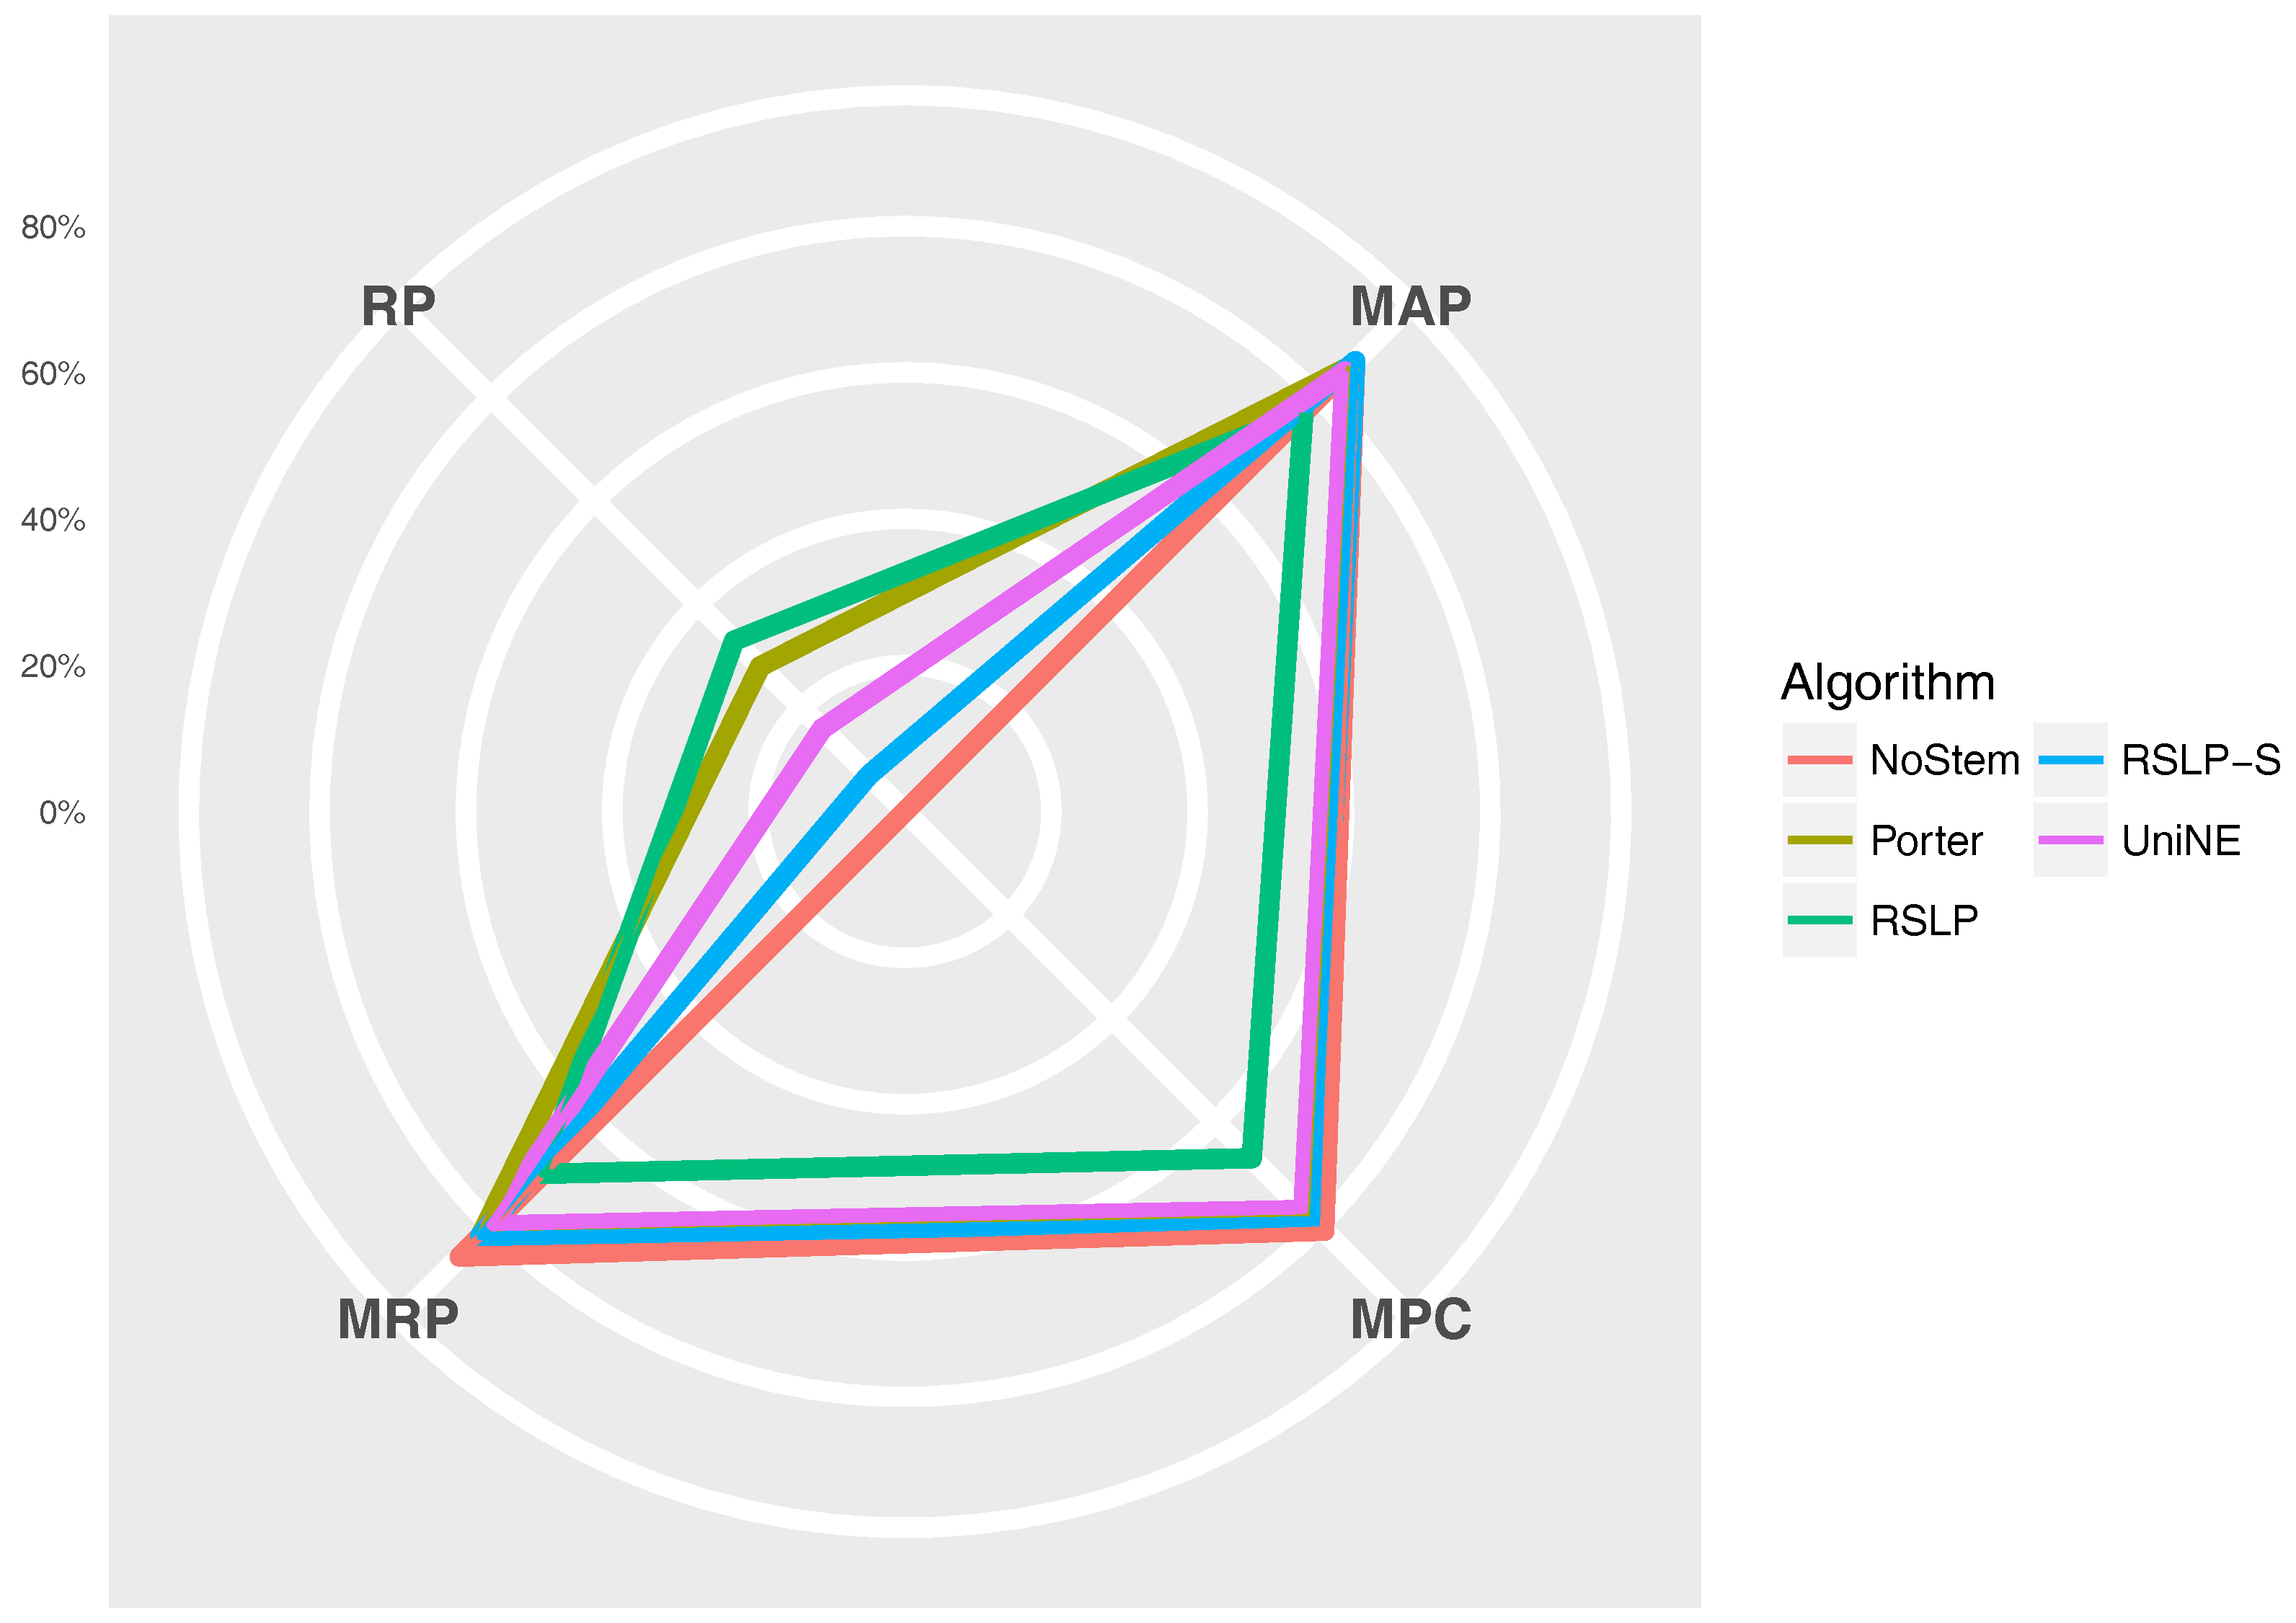
The Figure 11 radius shows the percentage value of the RP (dimensionality reduction), MAP, MPC and MRP metrics. Thus, we can see, for example, that, although the RSLP algorithm reduces the dimensionality of the data to a greater degree, it stands out in relation to the others due to the decrease in the efficiency of the jurisprudential information retrieval.
Monocratic decisions of Appeals Court (DSG). In this and the next two subsections, we will describe the results found in a more direct way, considering that we use the same analysis process described by the previous topic.
With regard to the distribution of the distribution of MAP data (Figure 12), the Shapiro–Wilk test refuted the normality hypothesis of the NoStem (p-value < 0.001) and Porter (p-value = 0.049) algorithms. Then, the Levene test refuted the hypothesis of homoscedasticity among the groups (p-value < 0.001) and the MAP equality, hypothesis , was rejected by the Kruskal–Wallis test with p-value less than 0.001. The differences illustrated by Figure 13 were statistically significant (p-value < 0.001) through a post hoc analysis with the Mann–Whitney test.
On the other hand, the normality premise of MPC (Figure 14) was violated by the Porter and UniNE algorithms, with p-values equals to 0.017 and 0.006, respectively. In addition, we confirmed the heteroskedasticity of the data and the significance of the differences between the treatments (Figure 15), refuting the hypothesis , since the tests found a p-value less than 0.001.
Although the normality of the MRP (Figure 16) was evidenced by the Shapiro–Wilk tests, with all treatments presenting p-value higher than the level of significance adopted by the experiment, the Levene test refuted the hypothesis of homoscedasticity of the data. With this, we again chose to use the non-parametric Kruskal–Wallis test to verify the hypothesis of MRP equality among groups (). This hypothesis was rejected (p-value < 0.001) and the Mann–Whitney test evidenced the difference between radicalization and control group (Figure 17). Finally, we can visualize the multiple variables involved in the experiment through Figure 18.
Judgments of Special Courts (ATR). According to Table 10, this collection was the only one of the four studied in which radicalization caused an increase of the three metrics. Thus, we will analyze whether this difference in relation to the control group was statistically significant.
The control group did not present data normality (p-value = 0.045) with respect to MAP (Figure 19) and the homoscedasticity hypothesis was rejected (p-value < 0.001). Following the process, conduction of the Kruskal–Wallis test showed that there was a difference among the studied groups (p-value < 0.001), that is, the hypothesis was rejected. Post hoc analysis showed that the RSLP-S and UniNE algorithms (Figure 20) showed a significant improvement of MAP.
In addition to an improvement in MAP, these two algorithms also caused an improvement in the MPC of the ATR jurisprudence information retrieval. For this analysis, we conducted the Shapiro–Wilk test on the bootstrap data distribution (Figure 21) and tested the homoskedasticity of the data. Although all groups were normal, there were heteroscedasticity of the treatments. Thus, we reject the hypothesis , MPC equality among groups, with the Kruskal–Wallis test (p-value < 0.001) and validate the significance of this difference, illustrated by Figure 22 with Mann–Whitney.
Similar to the previous metric, all treatments followed a Normal distribution and there was heteroscedasticity of the MRP data (Figure 23). However, according to post hoc analysis, only the UniNE algorithm caused an improvement of this metric (Figure 24), thus rejecting the hypothesis of MRP equality among the treatments (). However, as Figure 25 shows, the RSLP-S algorithm presented a greater dimensionality reduction than the control group, so even though they have the same MRP, it becomes a more advantageous option in storage efficiency.
Monocratic decisions of Special Courts (DTR). In this collection, the MAP normality distribution (Figure 26) was rejected for the NoStem (p-value < 0.001), Porter (p-value = 0.001), RSLP-S (p-value = 0.002) and UniNE (p-value < 0.001).
After rejecting the homoscedasticity of the data, we tested the hypothesis of MAP equality among treatments (). Having been refuted by the Kruskal–Wallis test, we conducted a post hoc analysis with the Mann–Whitney test. The difference among the treatments and the control group, shown by Figure 27, was statistically significant, however, the RSLP-S algorithm presented a p-value equals to 0.02, very close to the significance level of the experiment.
Then, the normality premise of the MPC, Figure 28, was violated by the RSLP-S and UniNE algorithms, with p-values equals to 0.021 and 0.016, respectively. In addition, we confirmed the heteroscedasticity of the data and the significance of the differences between the treatments (Figure 29), refuting the hypothesis , since the tests found a p-value less than 0.001.
Lastly, the analysis of the MRP metric (Figure 30) showed that the algorithms NoStem (p-value = 0.01), RSLP-S (p-value < 0.001) and UniNE (p-value = 0.001) do not adhere to the Normal distribution. As in the other metrics, the Levene test showed heteroscedasticity among the groups. In this scenario, we found non-equality of MRP among the treatments using the Kruskal–Wallis test, and the Mann–Whitney tests showed a statistically significant difference, with a p-value lower than 0.001, among all treatments and the control group (Figure 31). Through Figure 32, we can see that the RSLP-S and UniNE algorithms present MAP, MPC and MRP very close to those of the control group. Thus, the data analyst can make the choice for one of these algorithms and benefit from the dimensionality reduction.
5.2.5. Threats to Validity
Although the results obtained through the experiment have been satisfactory, it presents threats to its validity that need to be considered:
Threats to internal validity. Whereas data were collected and analyzed by the authors, there is a strong threat to internal validity. However, there is no reason to privilege a certain algorithm since there is no conflict of interest. To mitigate any possible bias, the queries used during the experiment were randomly chosen, using experimental RCBD design.
Threats to external validity. According to the related works, the dimensionality reduction should improve the documents retrieval, however, the improvement occurred only in one of the analyzed collections. Thus, the nruns algorithm may not have been adequate to judge the relevance of jurisprudential documents. As a way to mitigate this threat, the judgments made by the algorithm have been preserved, allowing future works to use Law experts to validate their consistency.
6. Related Works
This paper analyzes the impact of stemming on dimension reduction of jurisprudence texts in Brazilian Portuguese, therefore this section will present articles that had a similar approach.
Alvares et al. [40] carried out an assessment of vocabulary reduction, along with overstemming and understemming errors—described in the following section—by stemming 1500 words available in dictionaries of Brazilian Portuguese language. This approach differs from ours, since they propose a new stemming algorithm, StemBR, and compares it to two different ones. On the other hand, here we will use algorithms available in [41].
Orengo et al. [9] conducted a comparative study of stemming algorithm related to reduction of terms in a collection of tests formed by the Folha de São Paulo newspaper and evaluated its impact on the results returned by a retrieval system. Different from this proposal, there are no further details on the dimensionality reduction per document, considering that they focused on an analysis of the metrics taken from the search system.
Similar to the article mentioned above, Flores and Moreira [5] measured the impact of stemming on testing collections available in different languages (English, French, Portuguese and Spanish). This way, they collected dimensionality reduction metrics, overstemming, understemming and also measured the reflection on the application of these algorithms in precision and recall of information retrieval systems. However, due to its scope, the paper did not go into detail on any of the analyzes.
It is worth mentioning that, until now, papers that run a detailed analysis of dimensionality reduction per document, such as the one presented, were not found. In addition, related work used collections that do not reflect the documents found in the legal universe.
7. Conclusions
Day after day, magistrates, in the exercise of their functions, produce a vast number of documents. Thus, it is necessary to evaluate techniques that aid in the storage and retrieval of such information. However, how should quantitative assessments be made systematically?
It is not uncommon to notice in the media, news that shows the waste of resources on the part of the public authorities. Technologies, approaches and methods are simply exchanged based on the manager’s feeling, without empirical evidence, lacking objective criteria to guide decisions.
In this sense, the approach proposed by Wohlin et al. [18] was the foundation on which we conducted both the experiment to analyze dimensionality reduction obtained through radicalization, and the experiment that evaluated its impact on the retrieval of court documents. Thus, the quantitative data described in this work were obtained through a systematic process, mitigating possible bias attributable to the authors, as well as providing subsidy for more objective decision making.
7.1. Contributions
Thus, following the previous topic, we emphasize that the main contribution of this study was the conduction of an experimental process to analyze the reduction of dimensionality obtained by radicalizing the four collections of jurisprudential documents of the Supreme Court of the State of Sergipe. Furthermore, the impact of this reduction on jurisprudential information retrieval was analyzed.
Among the main contributions of this work, the following stand out:
- Generation of a test corpus with jurisprudential documents obtained from a real environment in production;
- Experiment that analyzes the impact of stemming on the dimensionality reduction of jurisprudential databases; and
- Experimental evaluation of radicalized jurisprudence information retrieval.
As a consequence of these contributions, we were able to answer the research questions elaborated at the beginning of this study:
Q1: In the jurisprudential context, does the application of radicalization algorithms significantly reduce the number of unique terms per document? Yes, radicalization has reduced the number of unique terms in all collections. The largest reduction occurred with the use of the RSLP algorithm on the Judgments of Appeals Court (ASG), reaching 52%.
Q2: Is the effectiveness of stemming algorithms the same in all court collections? No, the stemming algorithms varied their effectiveness depending on the collection upon which they were applied.
Q3: Does radicalization have an effect on the jurisprudential documents retrieval? Yes, radicalization has changed the jurisprudential documents retrieval in all collections. However, it had a positive effect only in the documents referring to the judgments of Special Courts (ATR). In other collections, there was a deterioration in the jurisprudential information retrieval.
In this way, other Brazilian courts may use the data collected in this research to choose more suitable stemming algorithms, or even to replicate this experiment and compare the results. It should be noted, as appropriate, that the database administrators of the Supreme Court of the State of Sergipe, currently managed by the author of this work, has developed actions to promote the use of the experimental approach as a basis for decision-making.
Due to the costs involved in creating tests using human-made trials, we chose the nruns method, proposed by Sakai and Lin [15], considering that it presented satisfactory results when applied to test collections made available by specialized conferences. However, knowing that the algorithm was not tested on jurisprudential bases and that the experiments performed here, in contrast to the related works, showed that the stemming did not generate an improvement in the documents retrieval in all collections, a possible evolution of this research would be to collect a sample of the judgments made to be evaluated by Law experts. In the end, we would check the effectiveness of nruns in the jurisprudential domain.
7.2. Future Work
Besides this suggestion, other possible directions for future research are:
- Create a stemming algorithm specific to the Law domain and compare its effectiveness against generic algorithms.
- Combine other information retrieval techniques, evaluating variations in effectiveness when compared to the application of stemming only.
- Analyze the impact of radicalization on the classification of jurisprudential documents.
- Measure the effects of dimensionality reduction on the clustering of jurisprudential documents.
Acknowledgments
This study counted on the full support of the Supreme Court of the State of Sergipe by sharing their database of judicial jurisprudence in text format.
Author Contributions
Robert A. N. de Oliveira and Methanias C. Junior conceived and designed the experiments. Robert A. N. de Oliveira performed the experiments, analyzed the data and wrote the paper. All authors have read and approved the final manuscript.
Conflicts of Interest
The authors declare no conflict of interest.
Abbreviations
The following abbreviations are used in this manuscript:
| TJSE | Tribunal de Justiça do Estado de Sergipe (Supreme Court of the State of Sergipe) |
| MAP | Mean Average Precision |
| RAM | Random Access Memory |
| TREC | Text Retrieval Conference |
| ASG | acórdãos do Segundo Grau (judgments of Appeals Court) |
| DSG | decisões monocráticas do Segundo Grau (monocratic decisions of Appeals Court) |
| ATR | acórdãos da Turma Recursal (judgments of Special Courts) |
| DTR | decisões monocráticas da Turma Recursal (monocratic decisions of Special Courts) |
| GQM | Goal Question Metric |
| CSV | Comma Separated File |
| RCBD | Randomized Complete Block Design |
References
- Maximiliano, C. Hermenêutica e Aplicação do Direito, 20th ed.; Forense: Rio de Janeiro, Brazil, 2011; pp. 1–352. [Google Scholar]
- Santos, W. Dicionário Jurídico Brasileiro; Livraria Del Rey Editora LTDA: Belo Horizonte, Brazil, 2001. [Google Scholar]
- Magalhães, C.C. Minerjur: Uma Ferramenta Para Mineração de Bases de Jurisprudência. Master’s Thesis, Dissertação (Mestrado em Sistemas e Computação)—Universidade Salvador, Salvador, Brazil, 2008. [Google Scholar]
- Jusbrasil. Conectando Pessoas à Justiça. Available online: https://www.jusbrasil.com.br/ (accessed on 24 January 2018).
- Flores, F.N.; Moreira, V.P. Assessing the impact of Stemming Accuracy on Information Retrieval—A multilingual perspective. Inf. Process. Manag. 2016, 52, 840–854. [Google Scholar] [CrossRef]
- Câmara Júnior, A.T. Indexação Automática de Acórdãos por Meio de Processamento de Linguagem Natural. Ph.D. Thesis, Universidade de Brasília, Brasília, Brazil, 2007. [Google Scholar]
- Weiss, S.M.; Indurkhya, N.; Zhang, T.; Damerau, F. Text Mining: Predictive Methods for Analyzing Unstructured Information; Springer Science & Business Media: Berlin, Germany, 2010. [Google Scholar]
- De Oliveira, R.A.N.; Júnior, M.C. Assessing the Impact of Stemming Algorithms Applied to Judicial Jurisprudence—An Experimental Analysis. In Proceedings of the 19th International Conference on Enterprise Information Systems, ICEIS, Porto, Portugal, 26–29 April 2017; INSTICC, SciTePress: Setúbal, Portugal, 2017; Volume 1, pp. 99–105. [Google Scholar]
- Orengo, V.M.; Buriol, L.S.; Coelho, A.R. A Study on the Use of Stemming for Monolingual Ad-Hoc Portuguese Information Retrieval. In Evaluation of Multilingual and Multi-Modal Information Retrieval; Springer Science & Business Media: Berlin, Germany, 2007. [Google Scholar]
- Porter, M.F. An algorithm for suffix stripping. Program 1980, 14, 130–137. [Google Scholar] [CrossRef]
- Orengo, V.M.; Huyck, C. A stemming algorithm for the portuguese language. In Proceedings of the Eighth International Symposium on String Processing and Information Retrieval, SPIRE 2001, Laguna de San Rafael, Chile, 13–15 November 2001; IEEE: Piscataway, NJ, USA, 2001; pp. 186–193. [Google Scholar]
- Cleverdon, C. The Cranfield tests on index language devices. Aslib Proc. 1967, 19, 173–192. [Google Scholar] [CrossRef]
- Voorhees, E.M.; Harman, D.K. TREC: Experiment and Evaluation in Information Retrieval; MIT Press Cambridge: Cambridge MA, USA, 2005. [Google Scholar]
- Roitblat, H.L.; Kershaw, A.; Oot, P. Document Categorization in Legal Electronic Discovery: Computer Classification vs. Manual Review. Int. Rev. Res. Open Distance Learn. 2009, 14, 90–103. [Google Scholar] [CrossRef]
- Sakai, T.; Lin, C.Y. Ranking Retrieval Systems without Relevance Assessments—Revisited. In Proceedings of the 3rd International Workshop on Evaluating Information Access (EVIA), EVIA 2010, Tokyo, Japan, 15 June 2010; pp. 25–33. [Google Scholar]
- Sakai, T.; Kando, N.; Lin, C.J.; Mitamura, T.; Shima, H.; Ji, D.; Chen, K.H.; Nyberg, E. Overview of the NTCIR-7 ACLIA IR4QA Task. In Proceedings of the Seventh NTCIR Workshop Meeting on Evaluation of Information Access Technologies: Information Retrieval, Question Answering, and Cross-Lingual Information Access, Tokyo, Japan, 16–19 December 2008; pp. 77–114. [Google Scholar]
- Fang, H.; Tao, T.; Zhai, C. Diagnostic Evaluation of Information Retrieval Models. ACM Trans. Inf. Syst. 2011, 29, 2–41. [Google Scholar] [CrossRef]
- Wohlin, C.; Runeson, P.; Höst, M.; Ohlsson, M.C.; Regnell, B.; Wesslén, A. Experimentation in Software Engineering; Springer: Berlin/Heidelberg, Germany, 2012. [Google Scholar]
- Basili, V.R.; Caldiera, G.; Rombach, H.D. The goal question metric approach. Encycl. Softw. Eng. 1994, 2, 528–532. [Google Scholar]
- Agarwal, N.; Deep, P. Obtaining better software product by using test first programming technique. In Proceedings of the 5th International Conference on Confluence 2014: The Next Generation Information Technology Summit, Noida, India, 25–26 September 2014; pp. 742–747. [Google Scholar]
- Ahad, N.A.; Yin, T.S.; Othman, A.R.; Yaacob, C.R. Sensitivity of normality tests to non-normal data. Sains Malays. 2011, 40, 637–641. [Google Scholar]
- Razali, N.M.; Wah, Y.B. Power comparisons of Shapiro-Wilk , Kolmogorov-Smirnov, Lilliefors and Anderson-Darling tests. J. Stat. Model. Anal. 2011, 2, 21–33. [Google Scholar]
- Theodorsson-Norheim, E. Friedman and Quade tests: BASIC computer program to perform nonparametric two-way analysis of variance and multiple comparisons on ranks of several related samples. Comput. Biol. Med. 1987, 17, 85–99. [Google Scholar] [CrossRef]
- Holm, S. A Simple Sequentially Rejective Multiple Test Procedure. Scand. J. Stat. 1979, 6, 65–70. [Google Scholar]
- Dunn, O.J. Multiple Comparisons Among Means. J. Am. Stat. Assoc. 1961, 56, 52–64. [Google Scholar] [CrossRef]
- SPSS Inc. Statistical Package for Social Science; International Business Machines Corporation SPSS Statistics: Armonk, NY, USA, 2012. [Google Scholar]
- Team, R.D.C. R: A Language and Environment for Statistical Computing; Technical Report; R Foundation for Statistical Computing: Vienna, Austria, 2008. [Google Scholar]
- Jones, E.; Oliphant, T.; Peterson, P.; Others, A. SciPy: Open Source Scientific Tools for Python. 2001. Available online: https://www.scipy.org/ (accessed on 24 January 2018).
- Trendowicz, V.B.A.; Heidrich, M.K.J.; Münch, C.S.J.; Rombach, D. Aligning Organizations Through Measurement; Springer: New York, NY, USA, 2014. [Google Scholar]
- Manning, C.D.; Raghavan, P.; Schütze, H. An Introduction to Information Retrieval; Cambridge University Press: Cambridge, UK, 2009. [Google Scholar]
- Apache Solr, 2011. Available online: http://lucene.apache.org/solr/ (accessed on 24 January 2018).
- Robertson, S.; Zaragoza, H. The probabilistic relevance framework: BM25 and beyond. Found. Trends® Inf. Retr. 2009, 3, 333–389. [Google Scholar] [CrossRef]
- TREC Eval. Available online: https://github.com/usnistgov/trec_eval (accessed on 24 January 2018).
- James, G.; Witten, D.; Hastie, T.; Tibshirani, R. An Introduction to Statistical Learning; Springer: New York, NY, USA, 2013. [Google Scholar]
- Kitchenham, B.; Madeyski, L.; Budgen, D.; Keung, J.; Brereton, P.; Charters, S.; Gibbs, S.; Pohthong, A. Robust Statistical Methods for Empirical Software Engineering. Empir. Softw. Eng. 2017, 22, 579–630. [Google Scholar] [CrossRef] [Green Version]
- Levene, H. Robust tests for equality of variances. Contrib. Probab. Stat. 1960, 1, 278–292. [Google Scholar]
- Loureiro, L.; Gameiro, M. Interpretação crítica dos resultados estatísticos: Para lá da significância estatística. Revista de Enfermagem Referência 2011, III Série, 151–162. [Google Scholar] [CrossRef]
- Cohen, J. A power primer. Psychol. Bull. 1992, 112, 155–159. [Google Scholar] [CrossRef] [PubMed]
- Ellis, P.D. The Essential Guide to Effect Sizes: Statistical Power, Meta-Analysis, and the Interpretation of Research Results; Cambridge University Press: Cambridge, UK, 2010. [Google Scholar]
- Alvares, R.V.; Garcia, A.C.B.; Ferraz, I. STEMBR: A stemming algorithm for the Brazilian Portuguese language. In Lecture Notes in Computer Science (including Subseries Lecture Notes in Artificial Intelligence and Lecture Notes in Bioinformatics); Springer: New York, NY, USA, 2005; Volume 3808, pp. 693–701. [Google Scholar]
- Apache Lucene, 2010. Available online: https://lucene.apache.org/core/ (accessed on 24 January 2018).
Figure 1.
The average number of unique terms per document obtained by each stemmer.
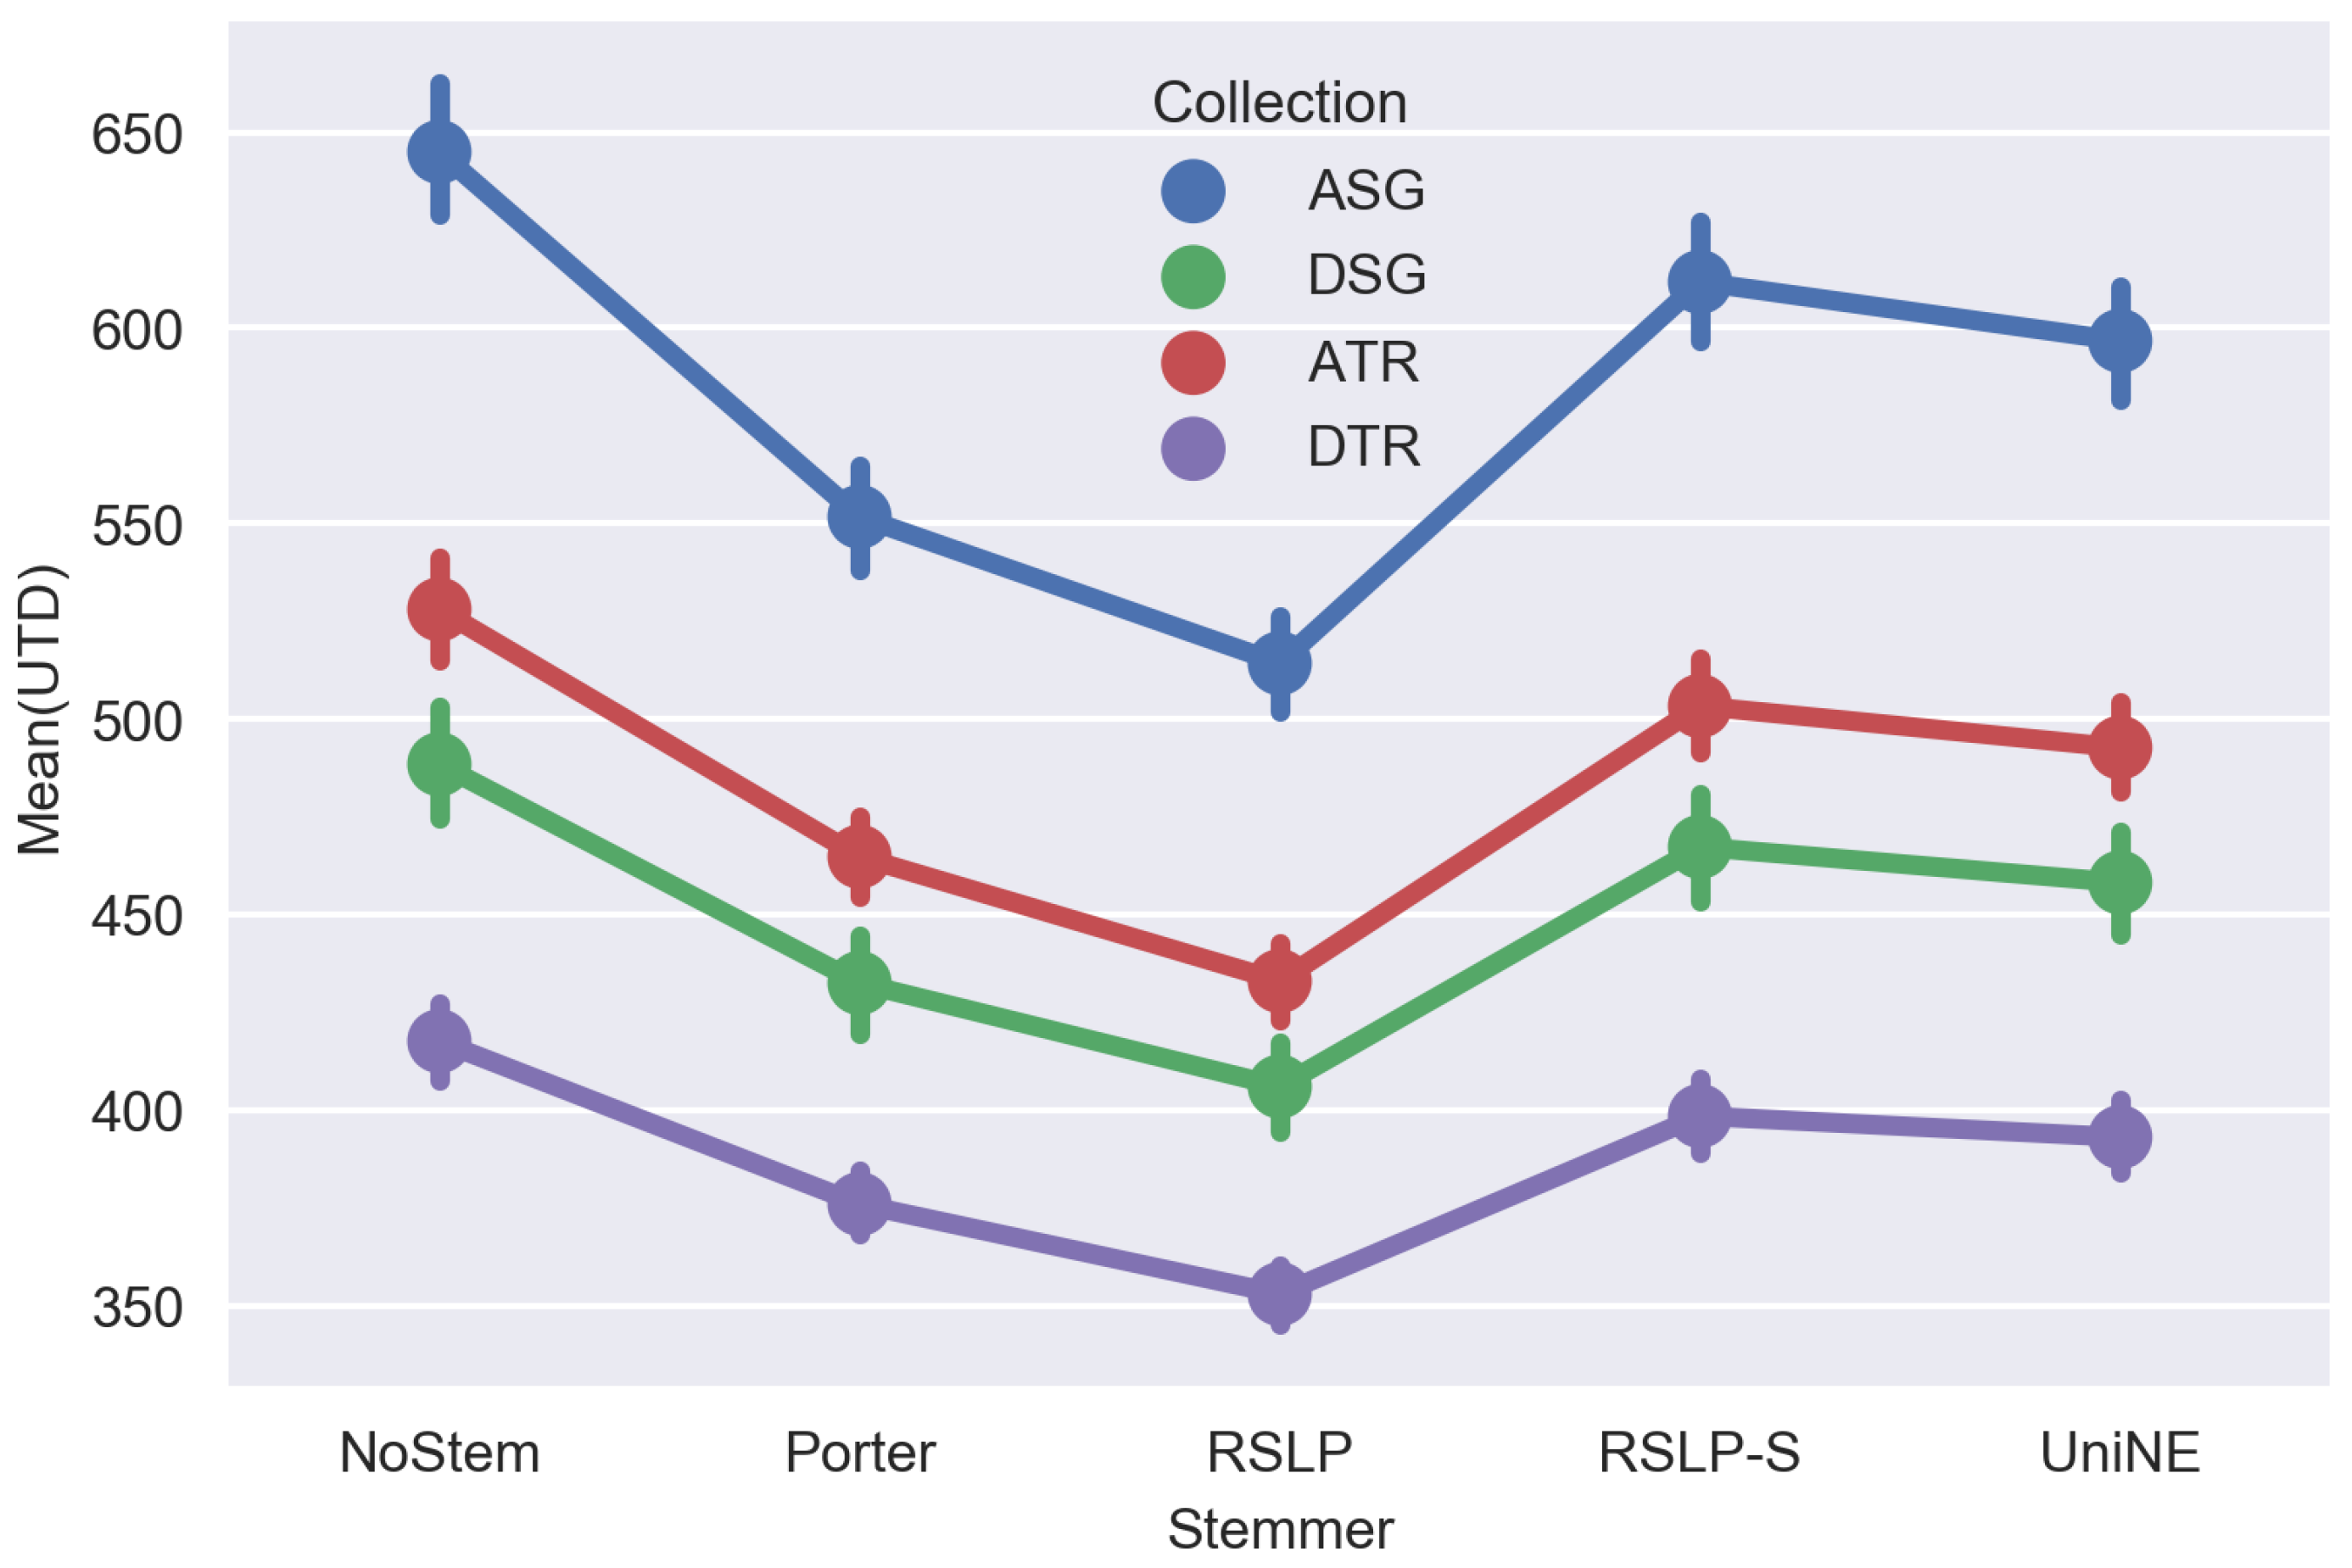
Figure 2.
The average percentage of dimensionality reduction per document generated by stemming.

Figure 3.
Correlation matrix among stemming algorithms. NoStem unit is UTD and others are RP.

Figure 4.
Dependent and independent variables of the experiment.

Figure 5.
ASG-MAP bootstrap distribution and probability plots.
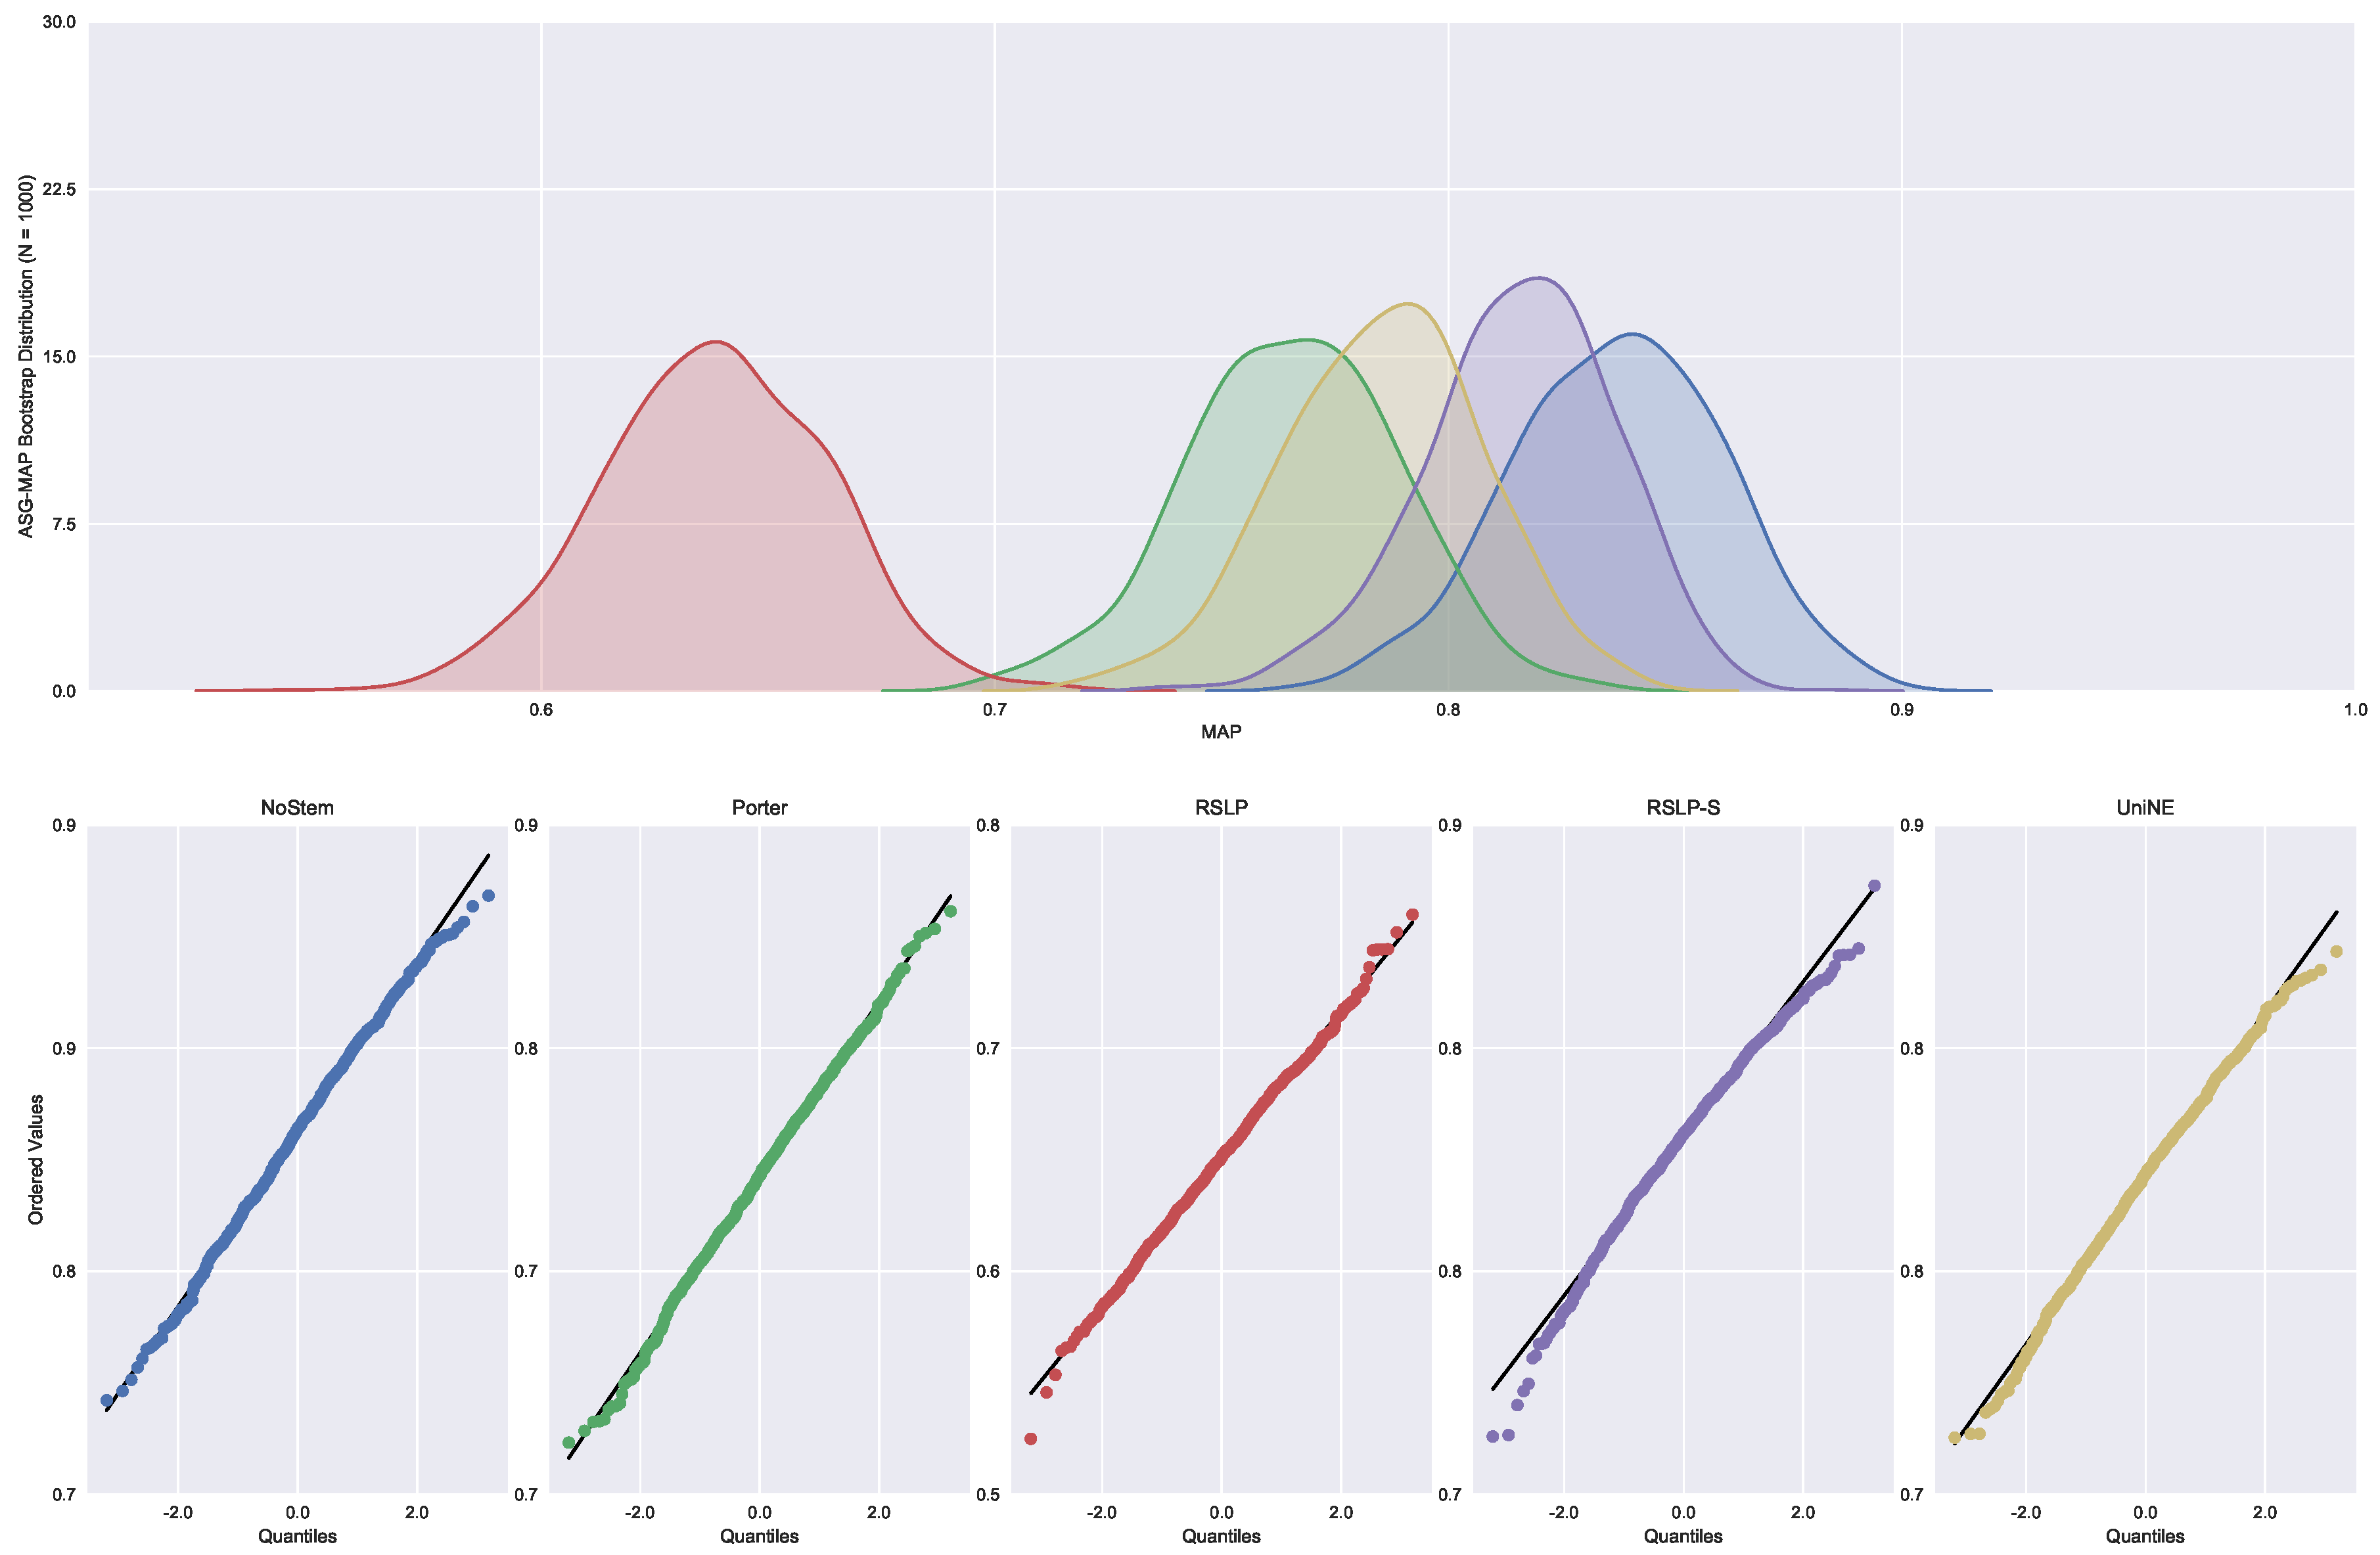
Figure 6.
ASG-MAP comparison between stemming algorithms.

Figure 7.
ASG-MPC bootstrap distribution and probability plots.
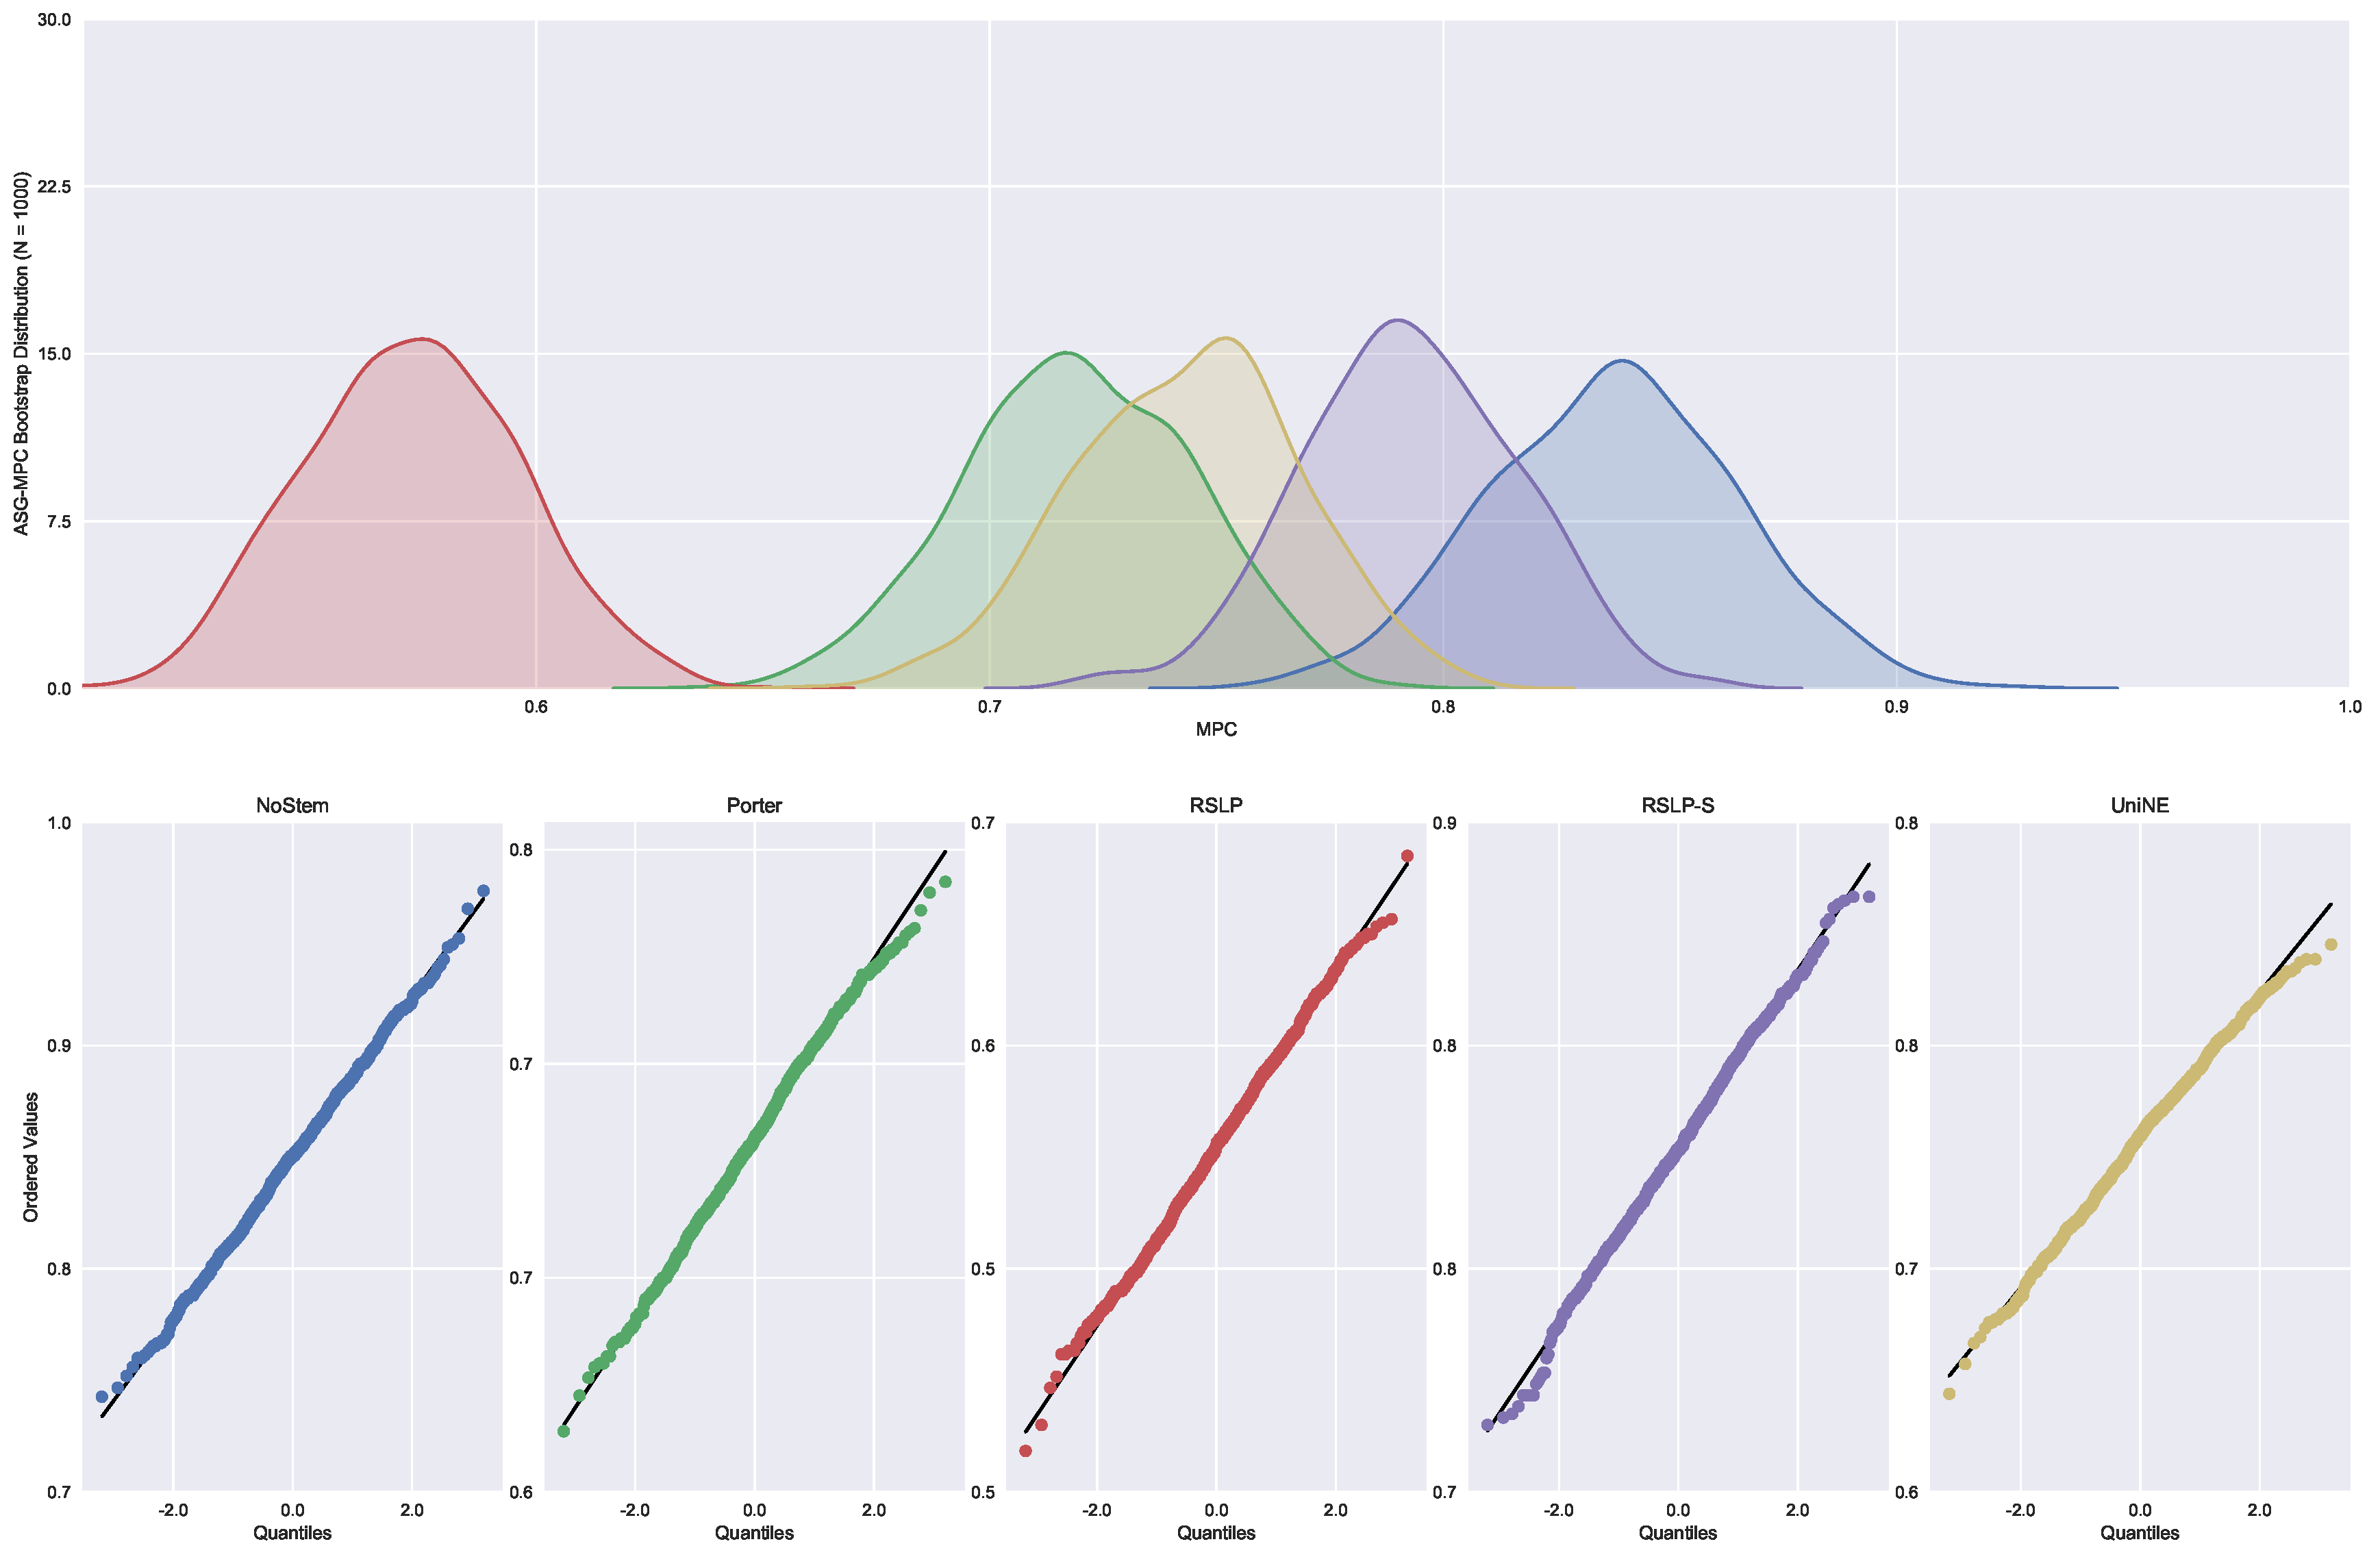
Figure 8.
ASG-MPC comparison between stemming algorithms.
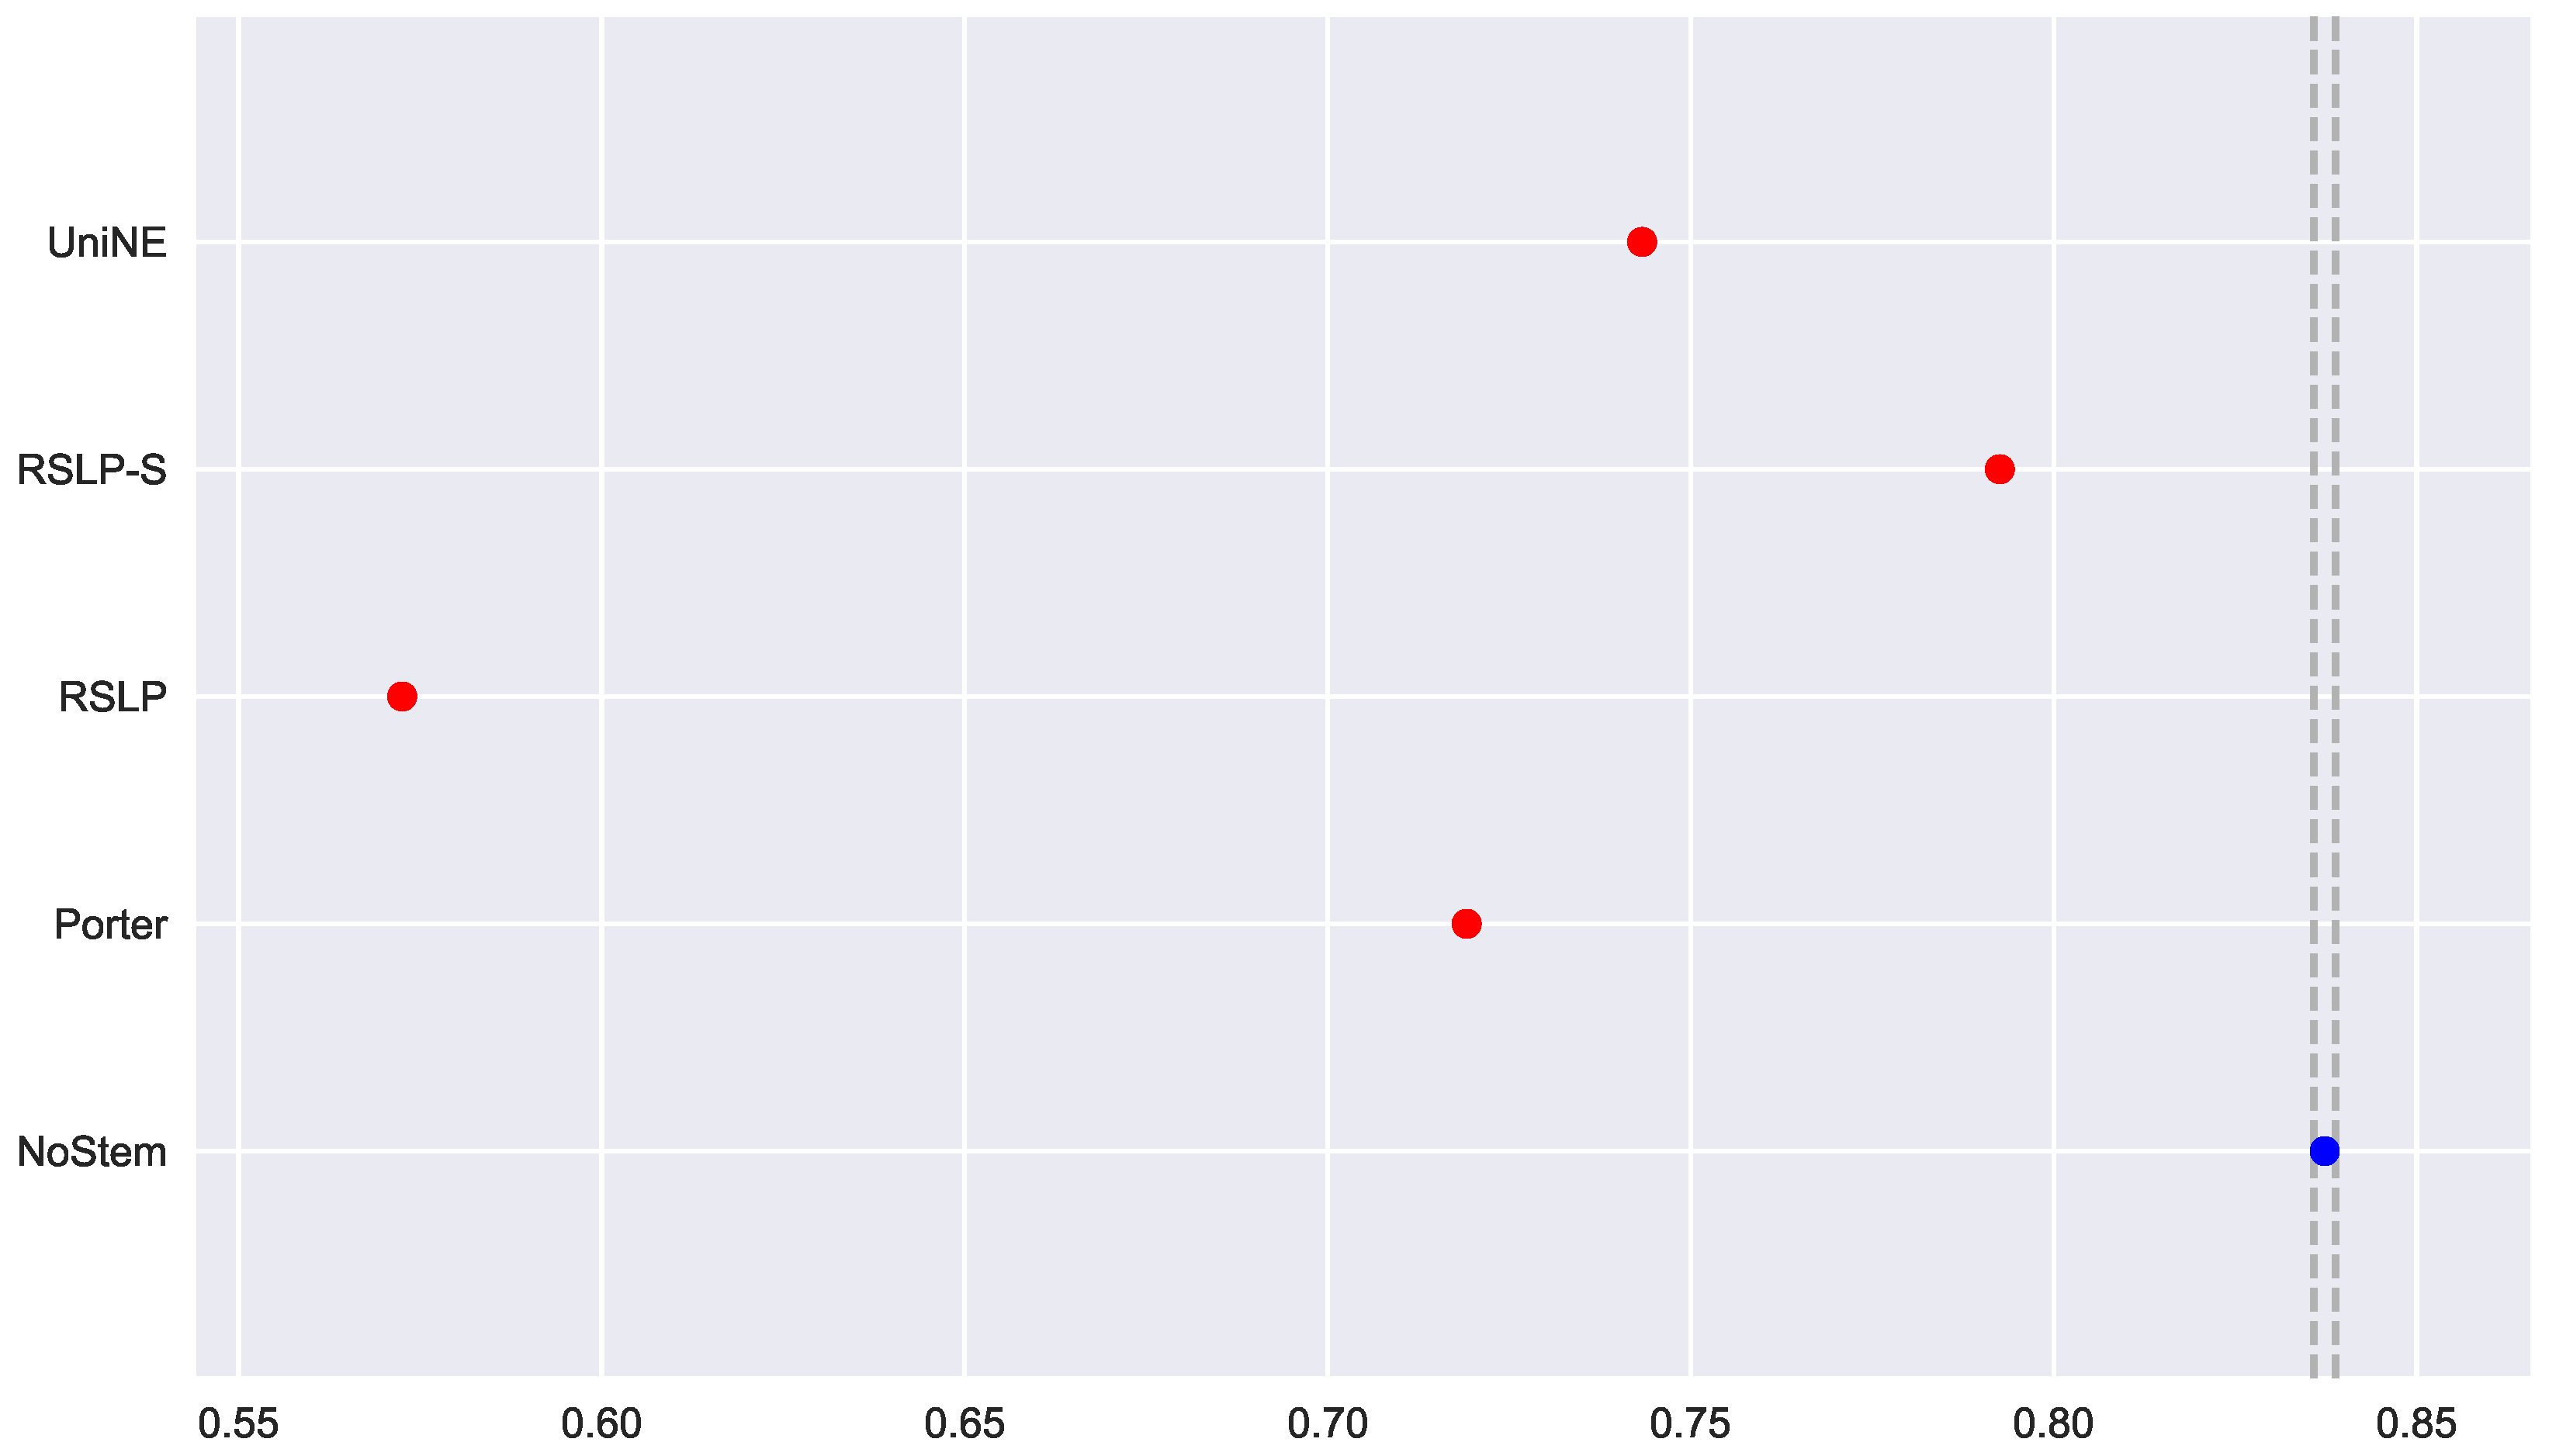
Figure 9.
ASG-MRP bootstrap distribution and probability plots.
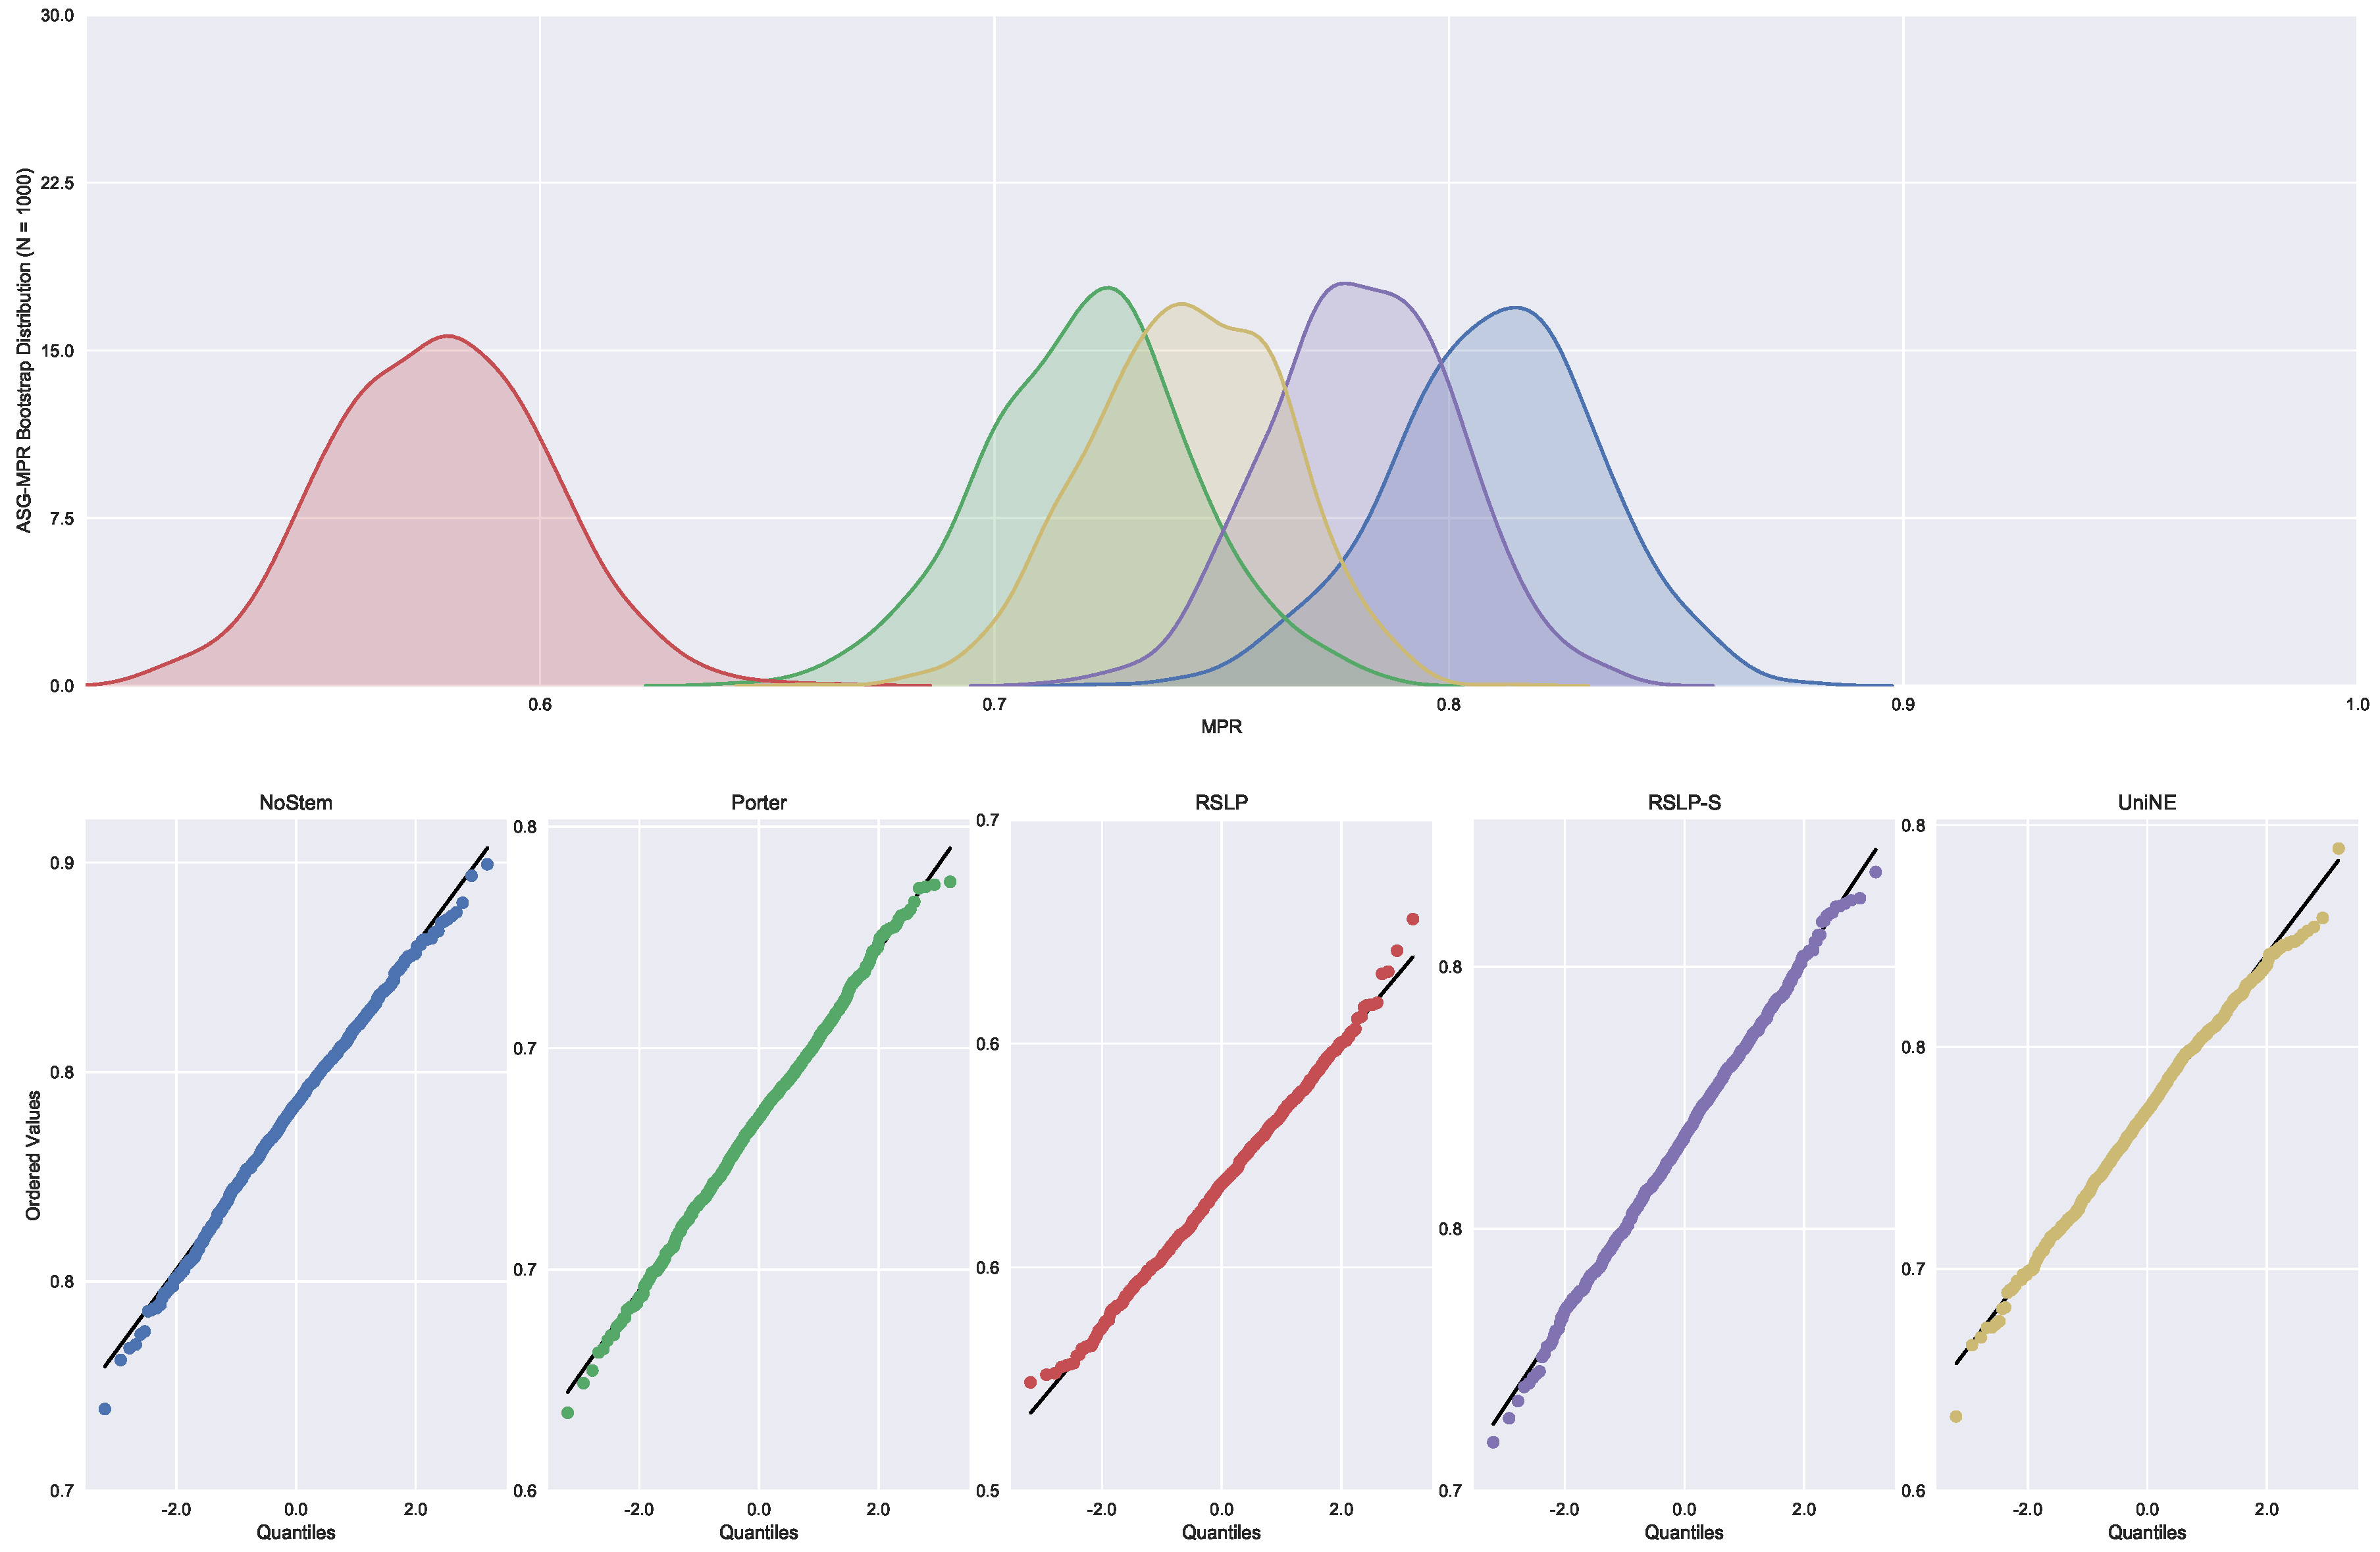
Figure 10.
ASG-MRP comparison between stemming algorithms.

Figure 11.
Reduction percentage of unique terms (RP), MAP, MPC and MRP by stemming the ASG collection.
Figure 11.
Reduction percentage of unique terms (RP), MAP, MPC and MRP by stemming the ASG collection.

Figure 12.
DSG-MAP bootstrap distribution and probability plots.

Figure 13.
DSG-MAP comparison between stemming algorithms.

Figure 14.
DSG-MPC bootstrap distribution and probability plots.
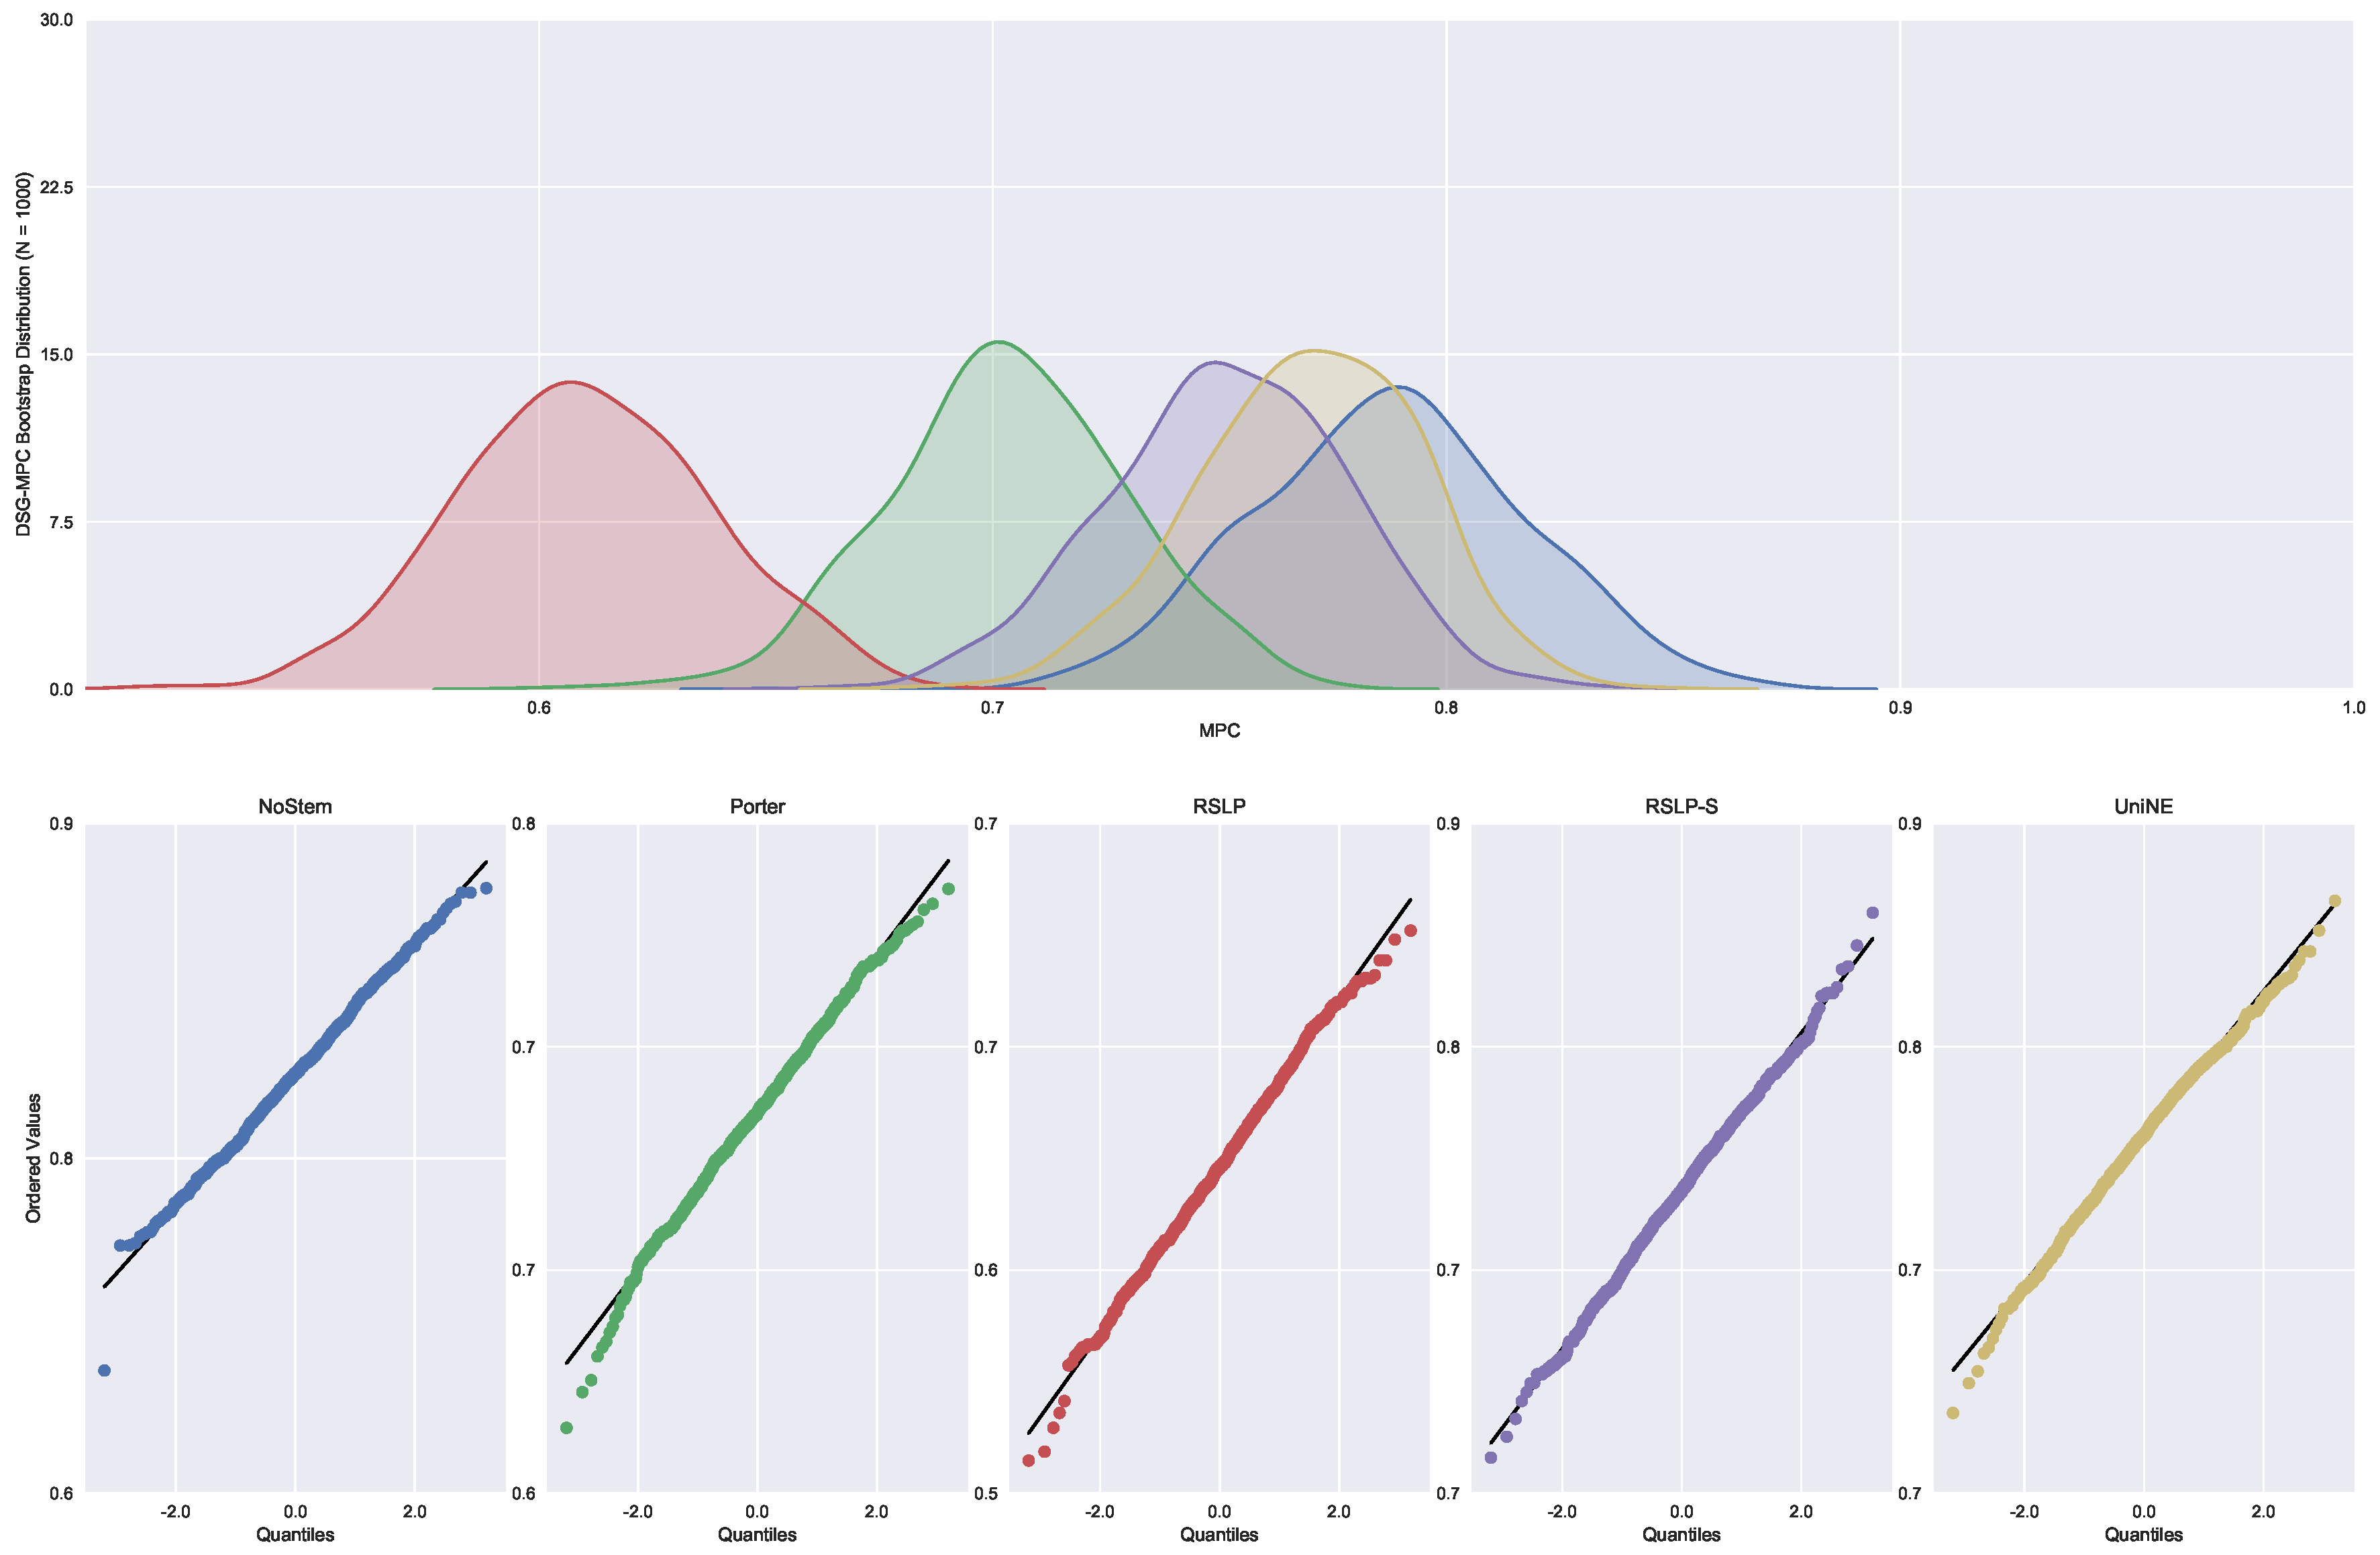
Figure 15.
DSG-MPC comparison between stemming algorithms.
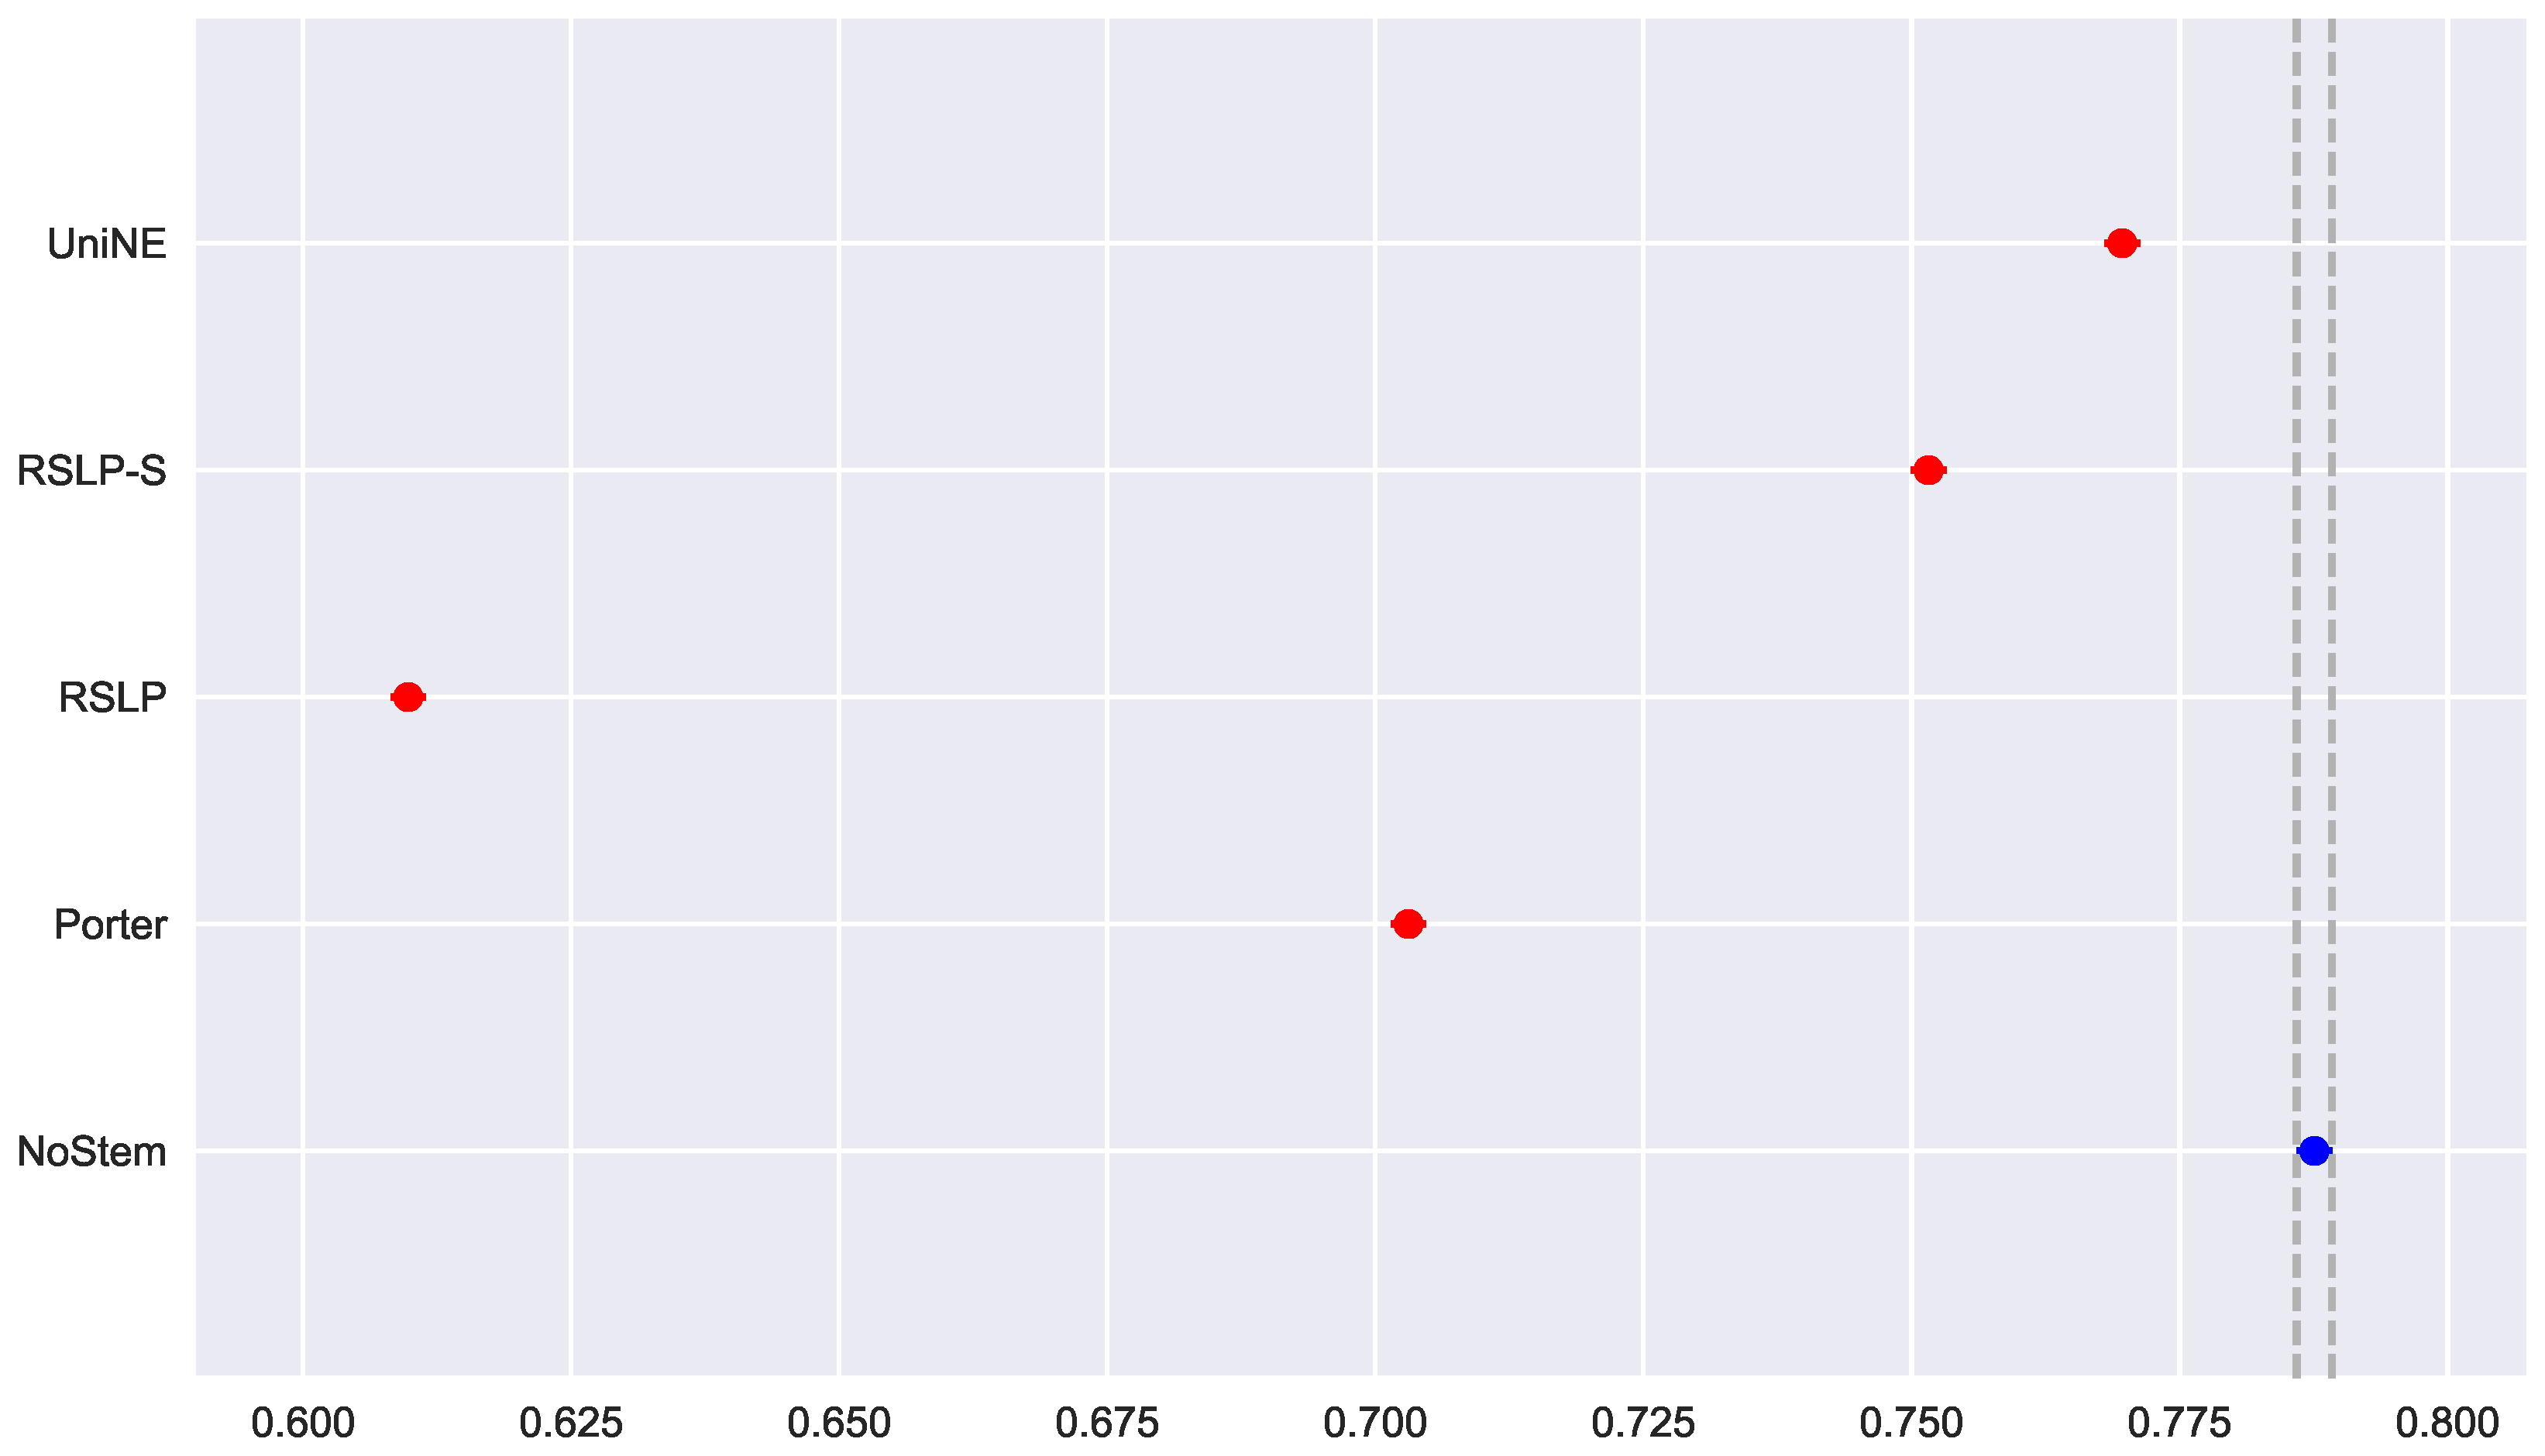
Figure 16.
DSG-MRP bootstrap distribution and probability plots.

Figure 17.
DSG-MRP comparison between stemming algorithms.
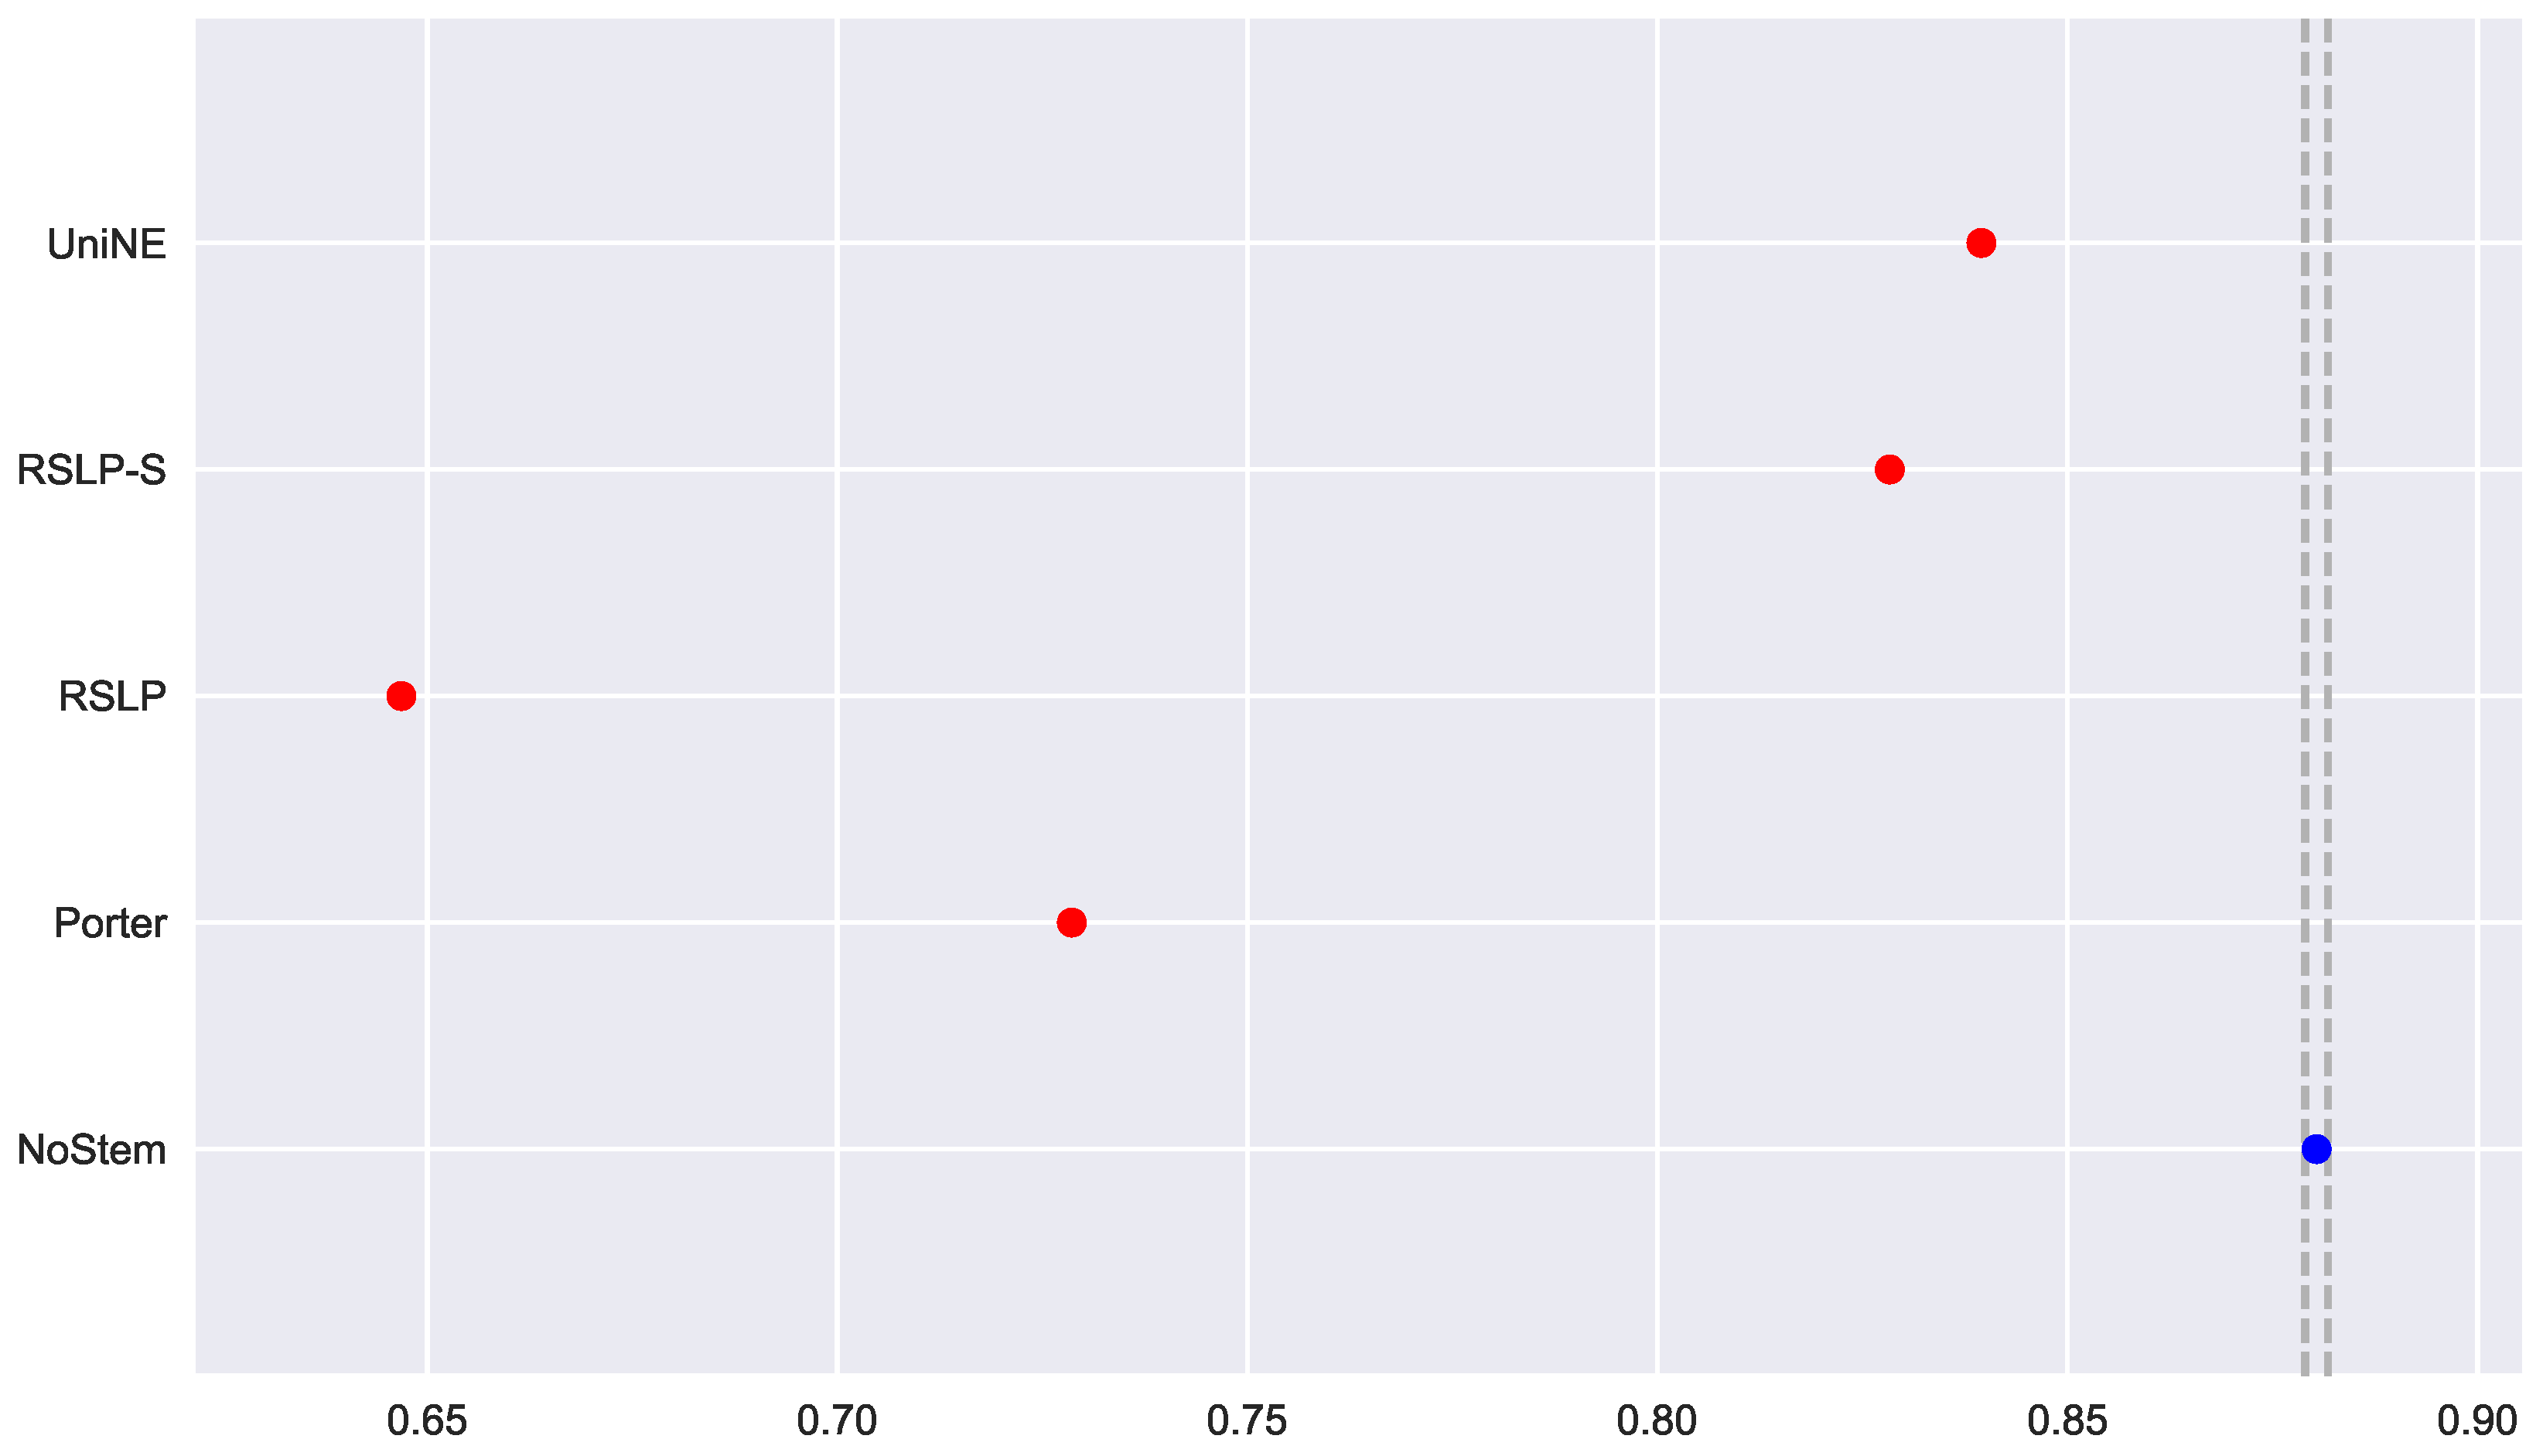
Figure 18.
Reduction percentage of unique terms (RP), MAP, MPC and MRP by stemming the DSG collection.
Figure 18.
Reduction percentage of unique terms (RP), MAP, MPC and MRP by stemming the DSG collection.

Figure 19.
ATR-MAP bootstrap distribution and probability plots.

Figure 20.
ATR-MAP comparison between stemming algorithms.

Figure 21.
ATR-MPC bootstrap distribution and probability plots.

Figure 22.
ATR-MPC comparison between stemming algorithms.
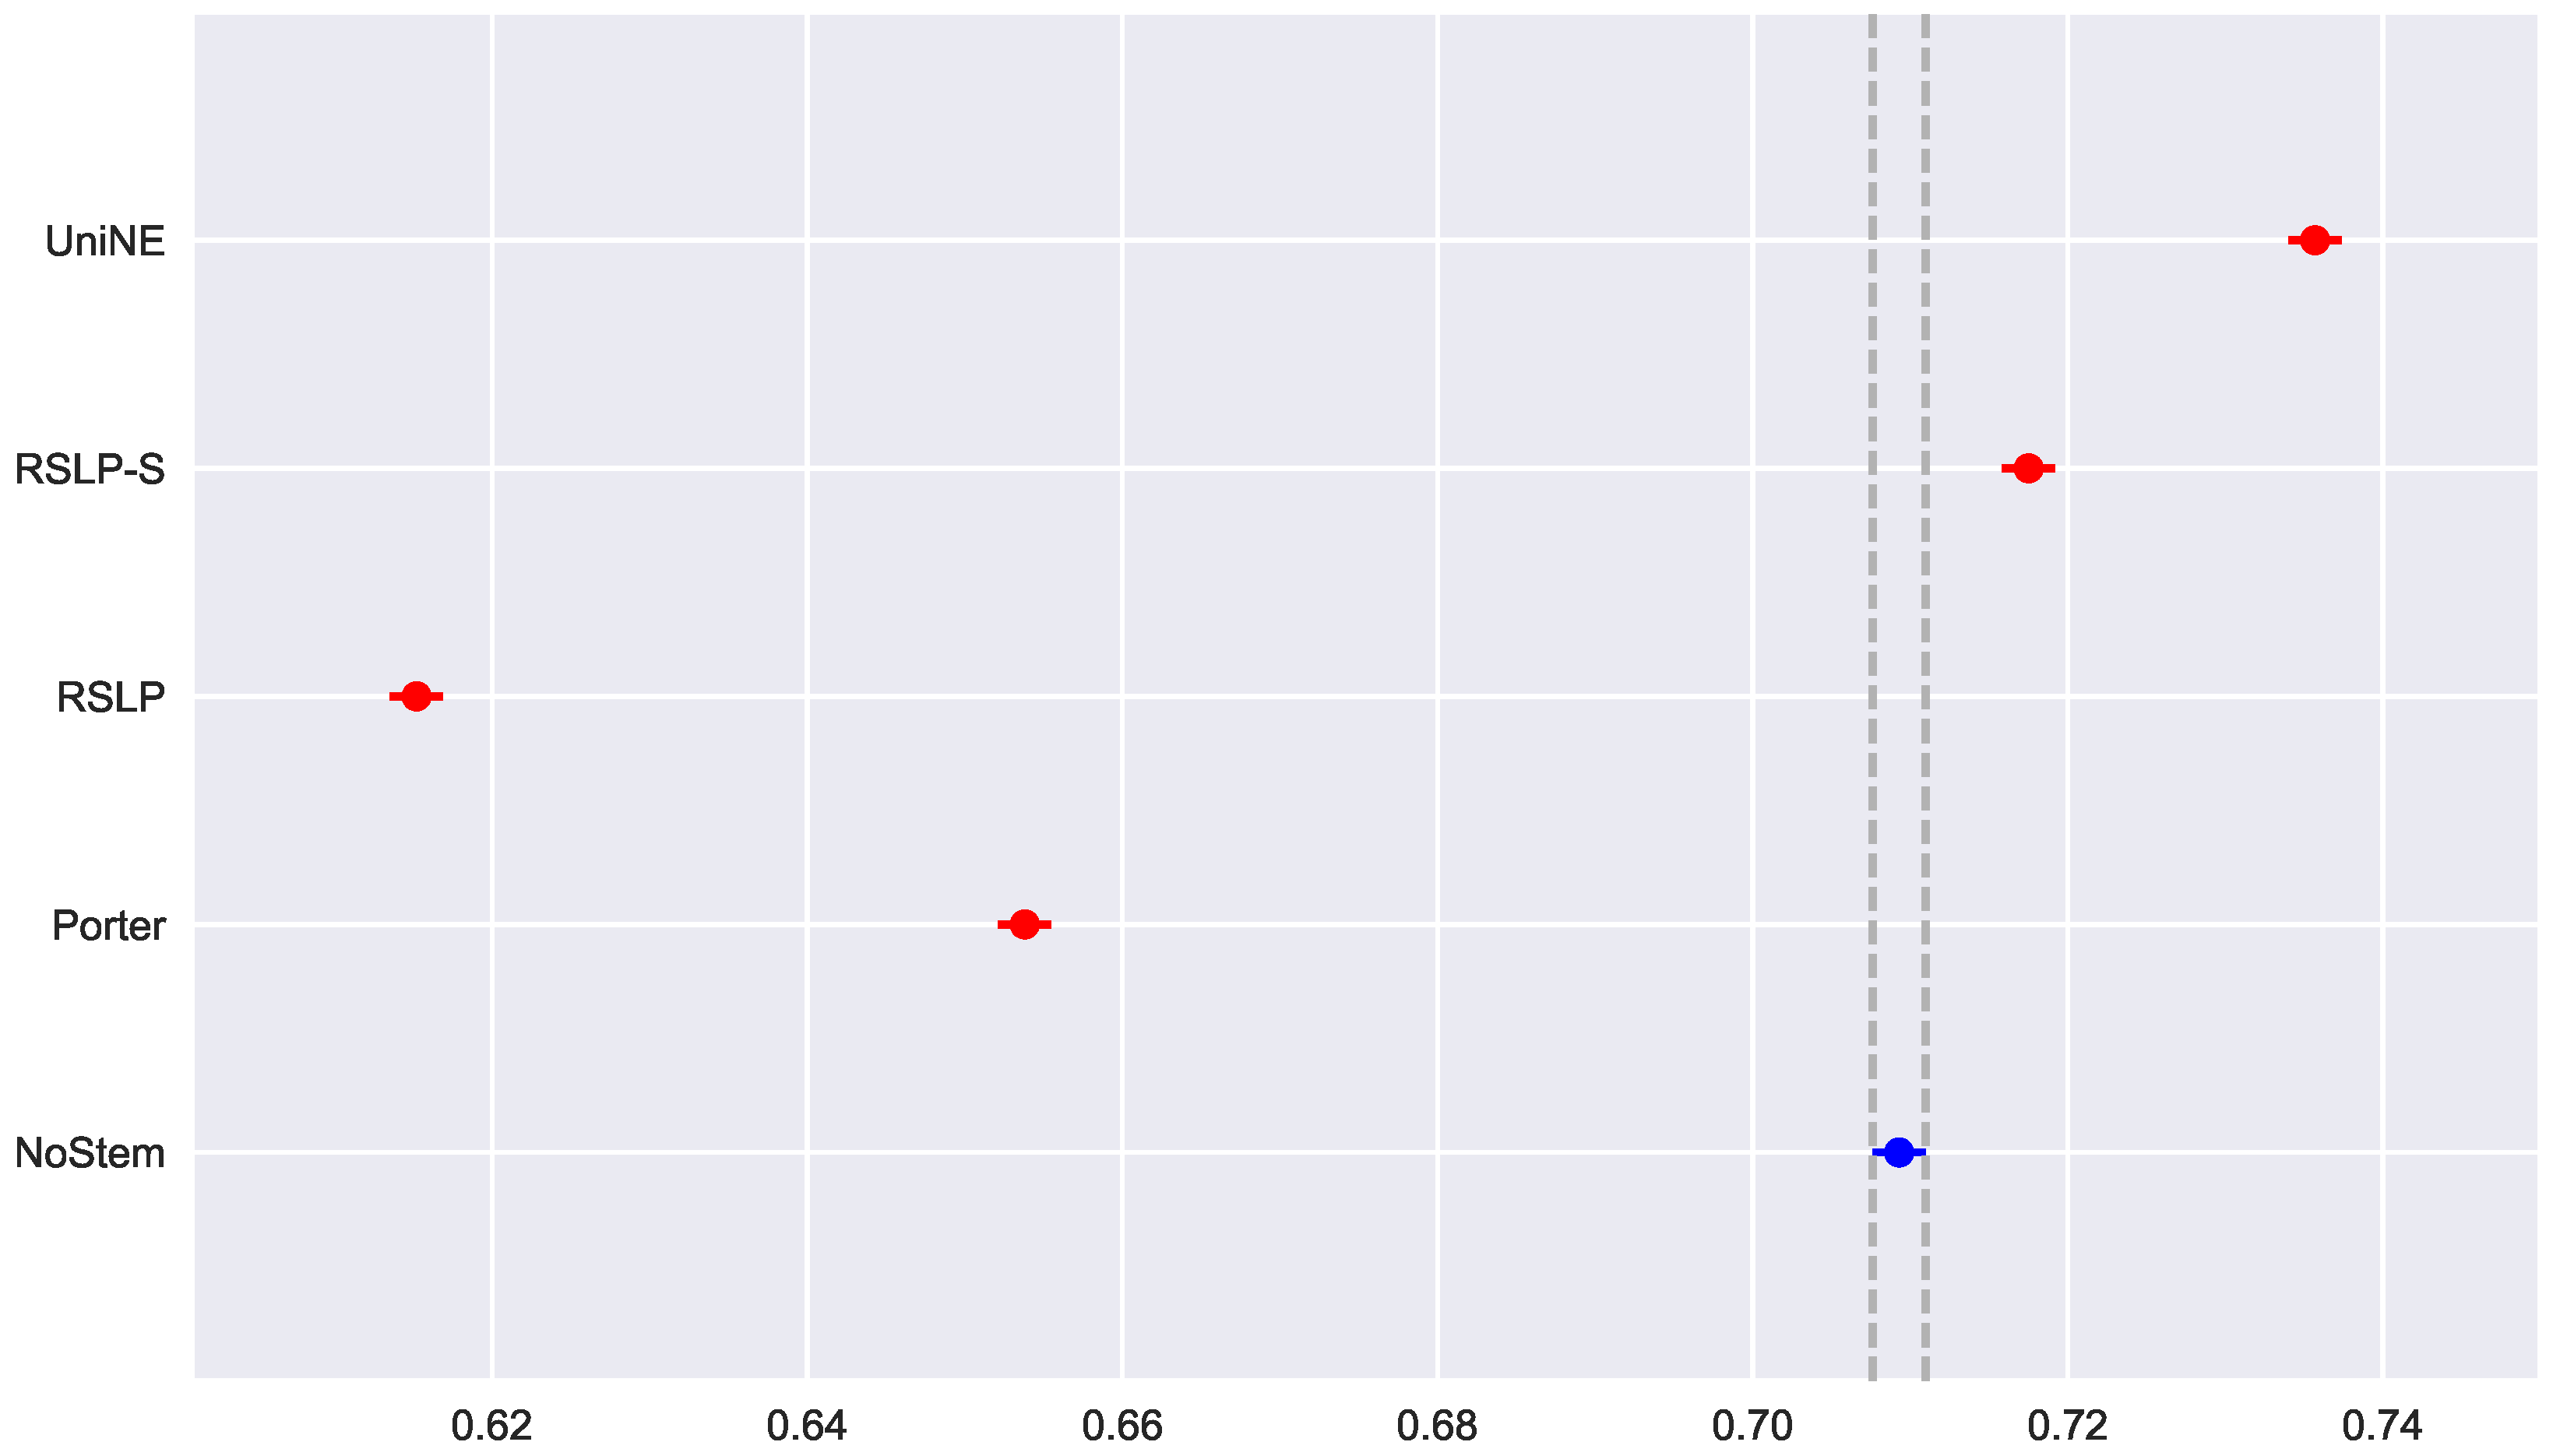
Figure 23.
ATR-MRP bootstrap distribution and probability plots.
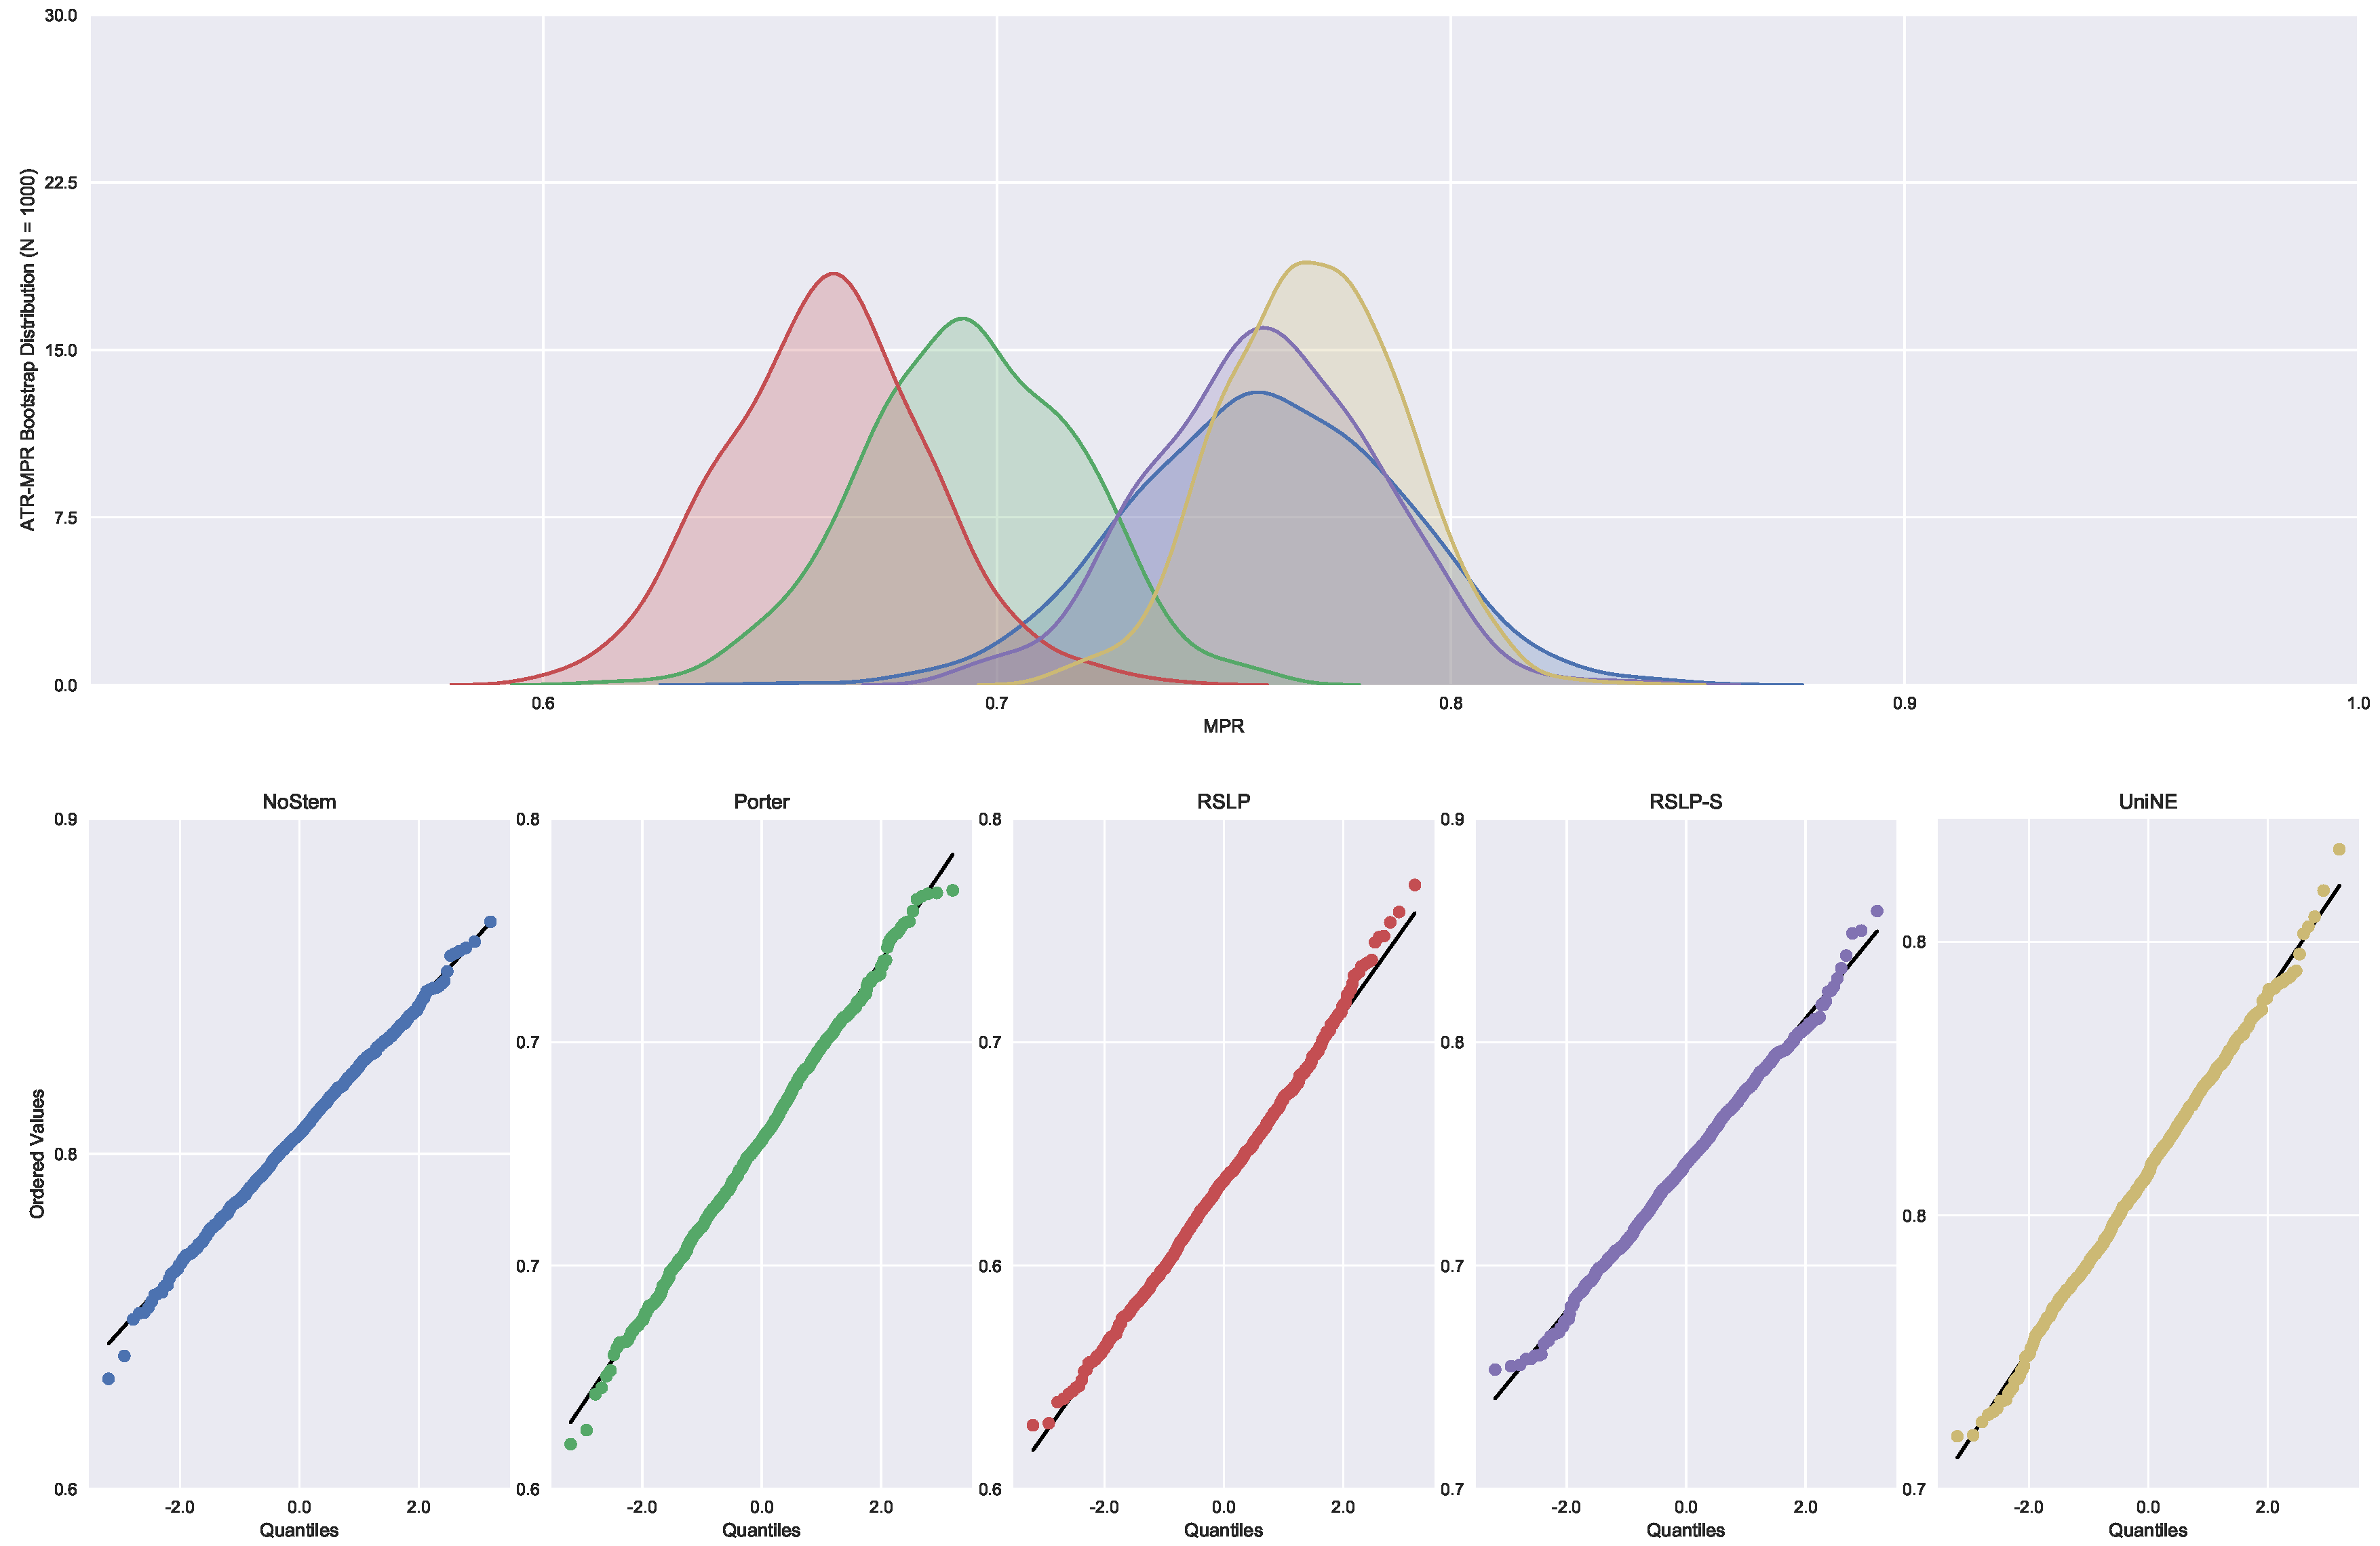
Figure 24.
ATR-MRP comparison between stemming algorithms.
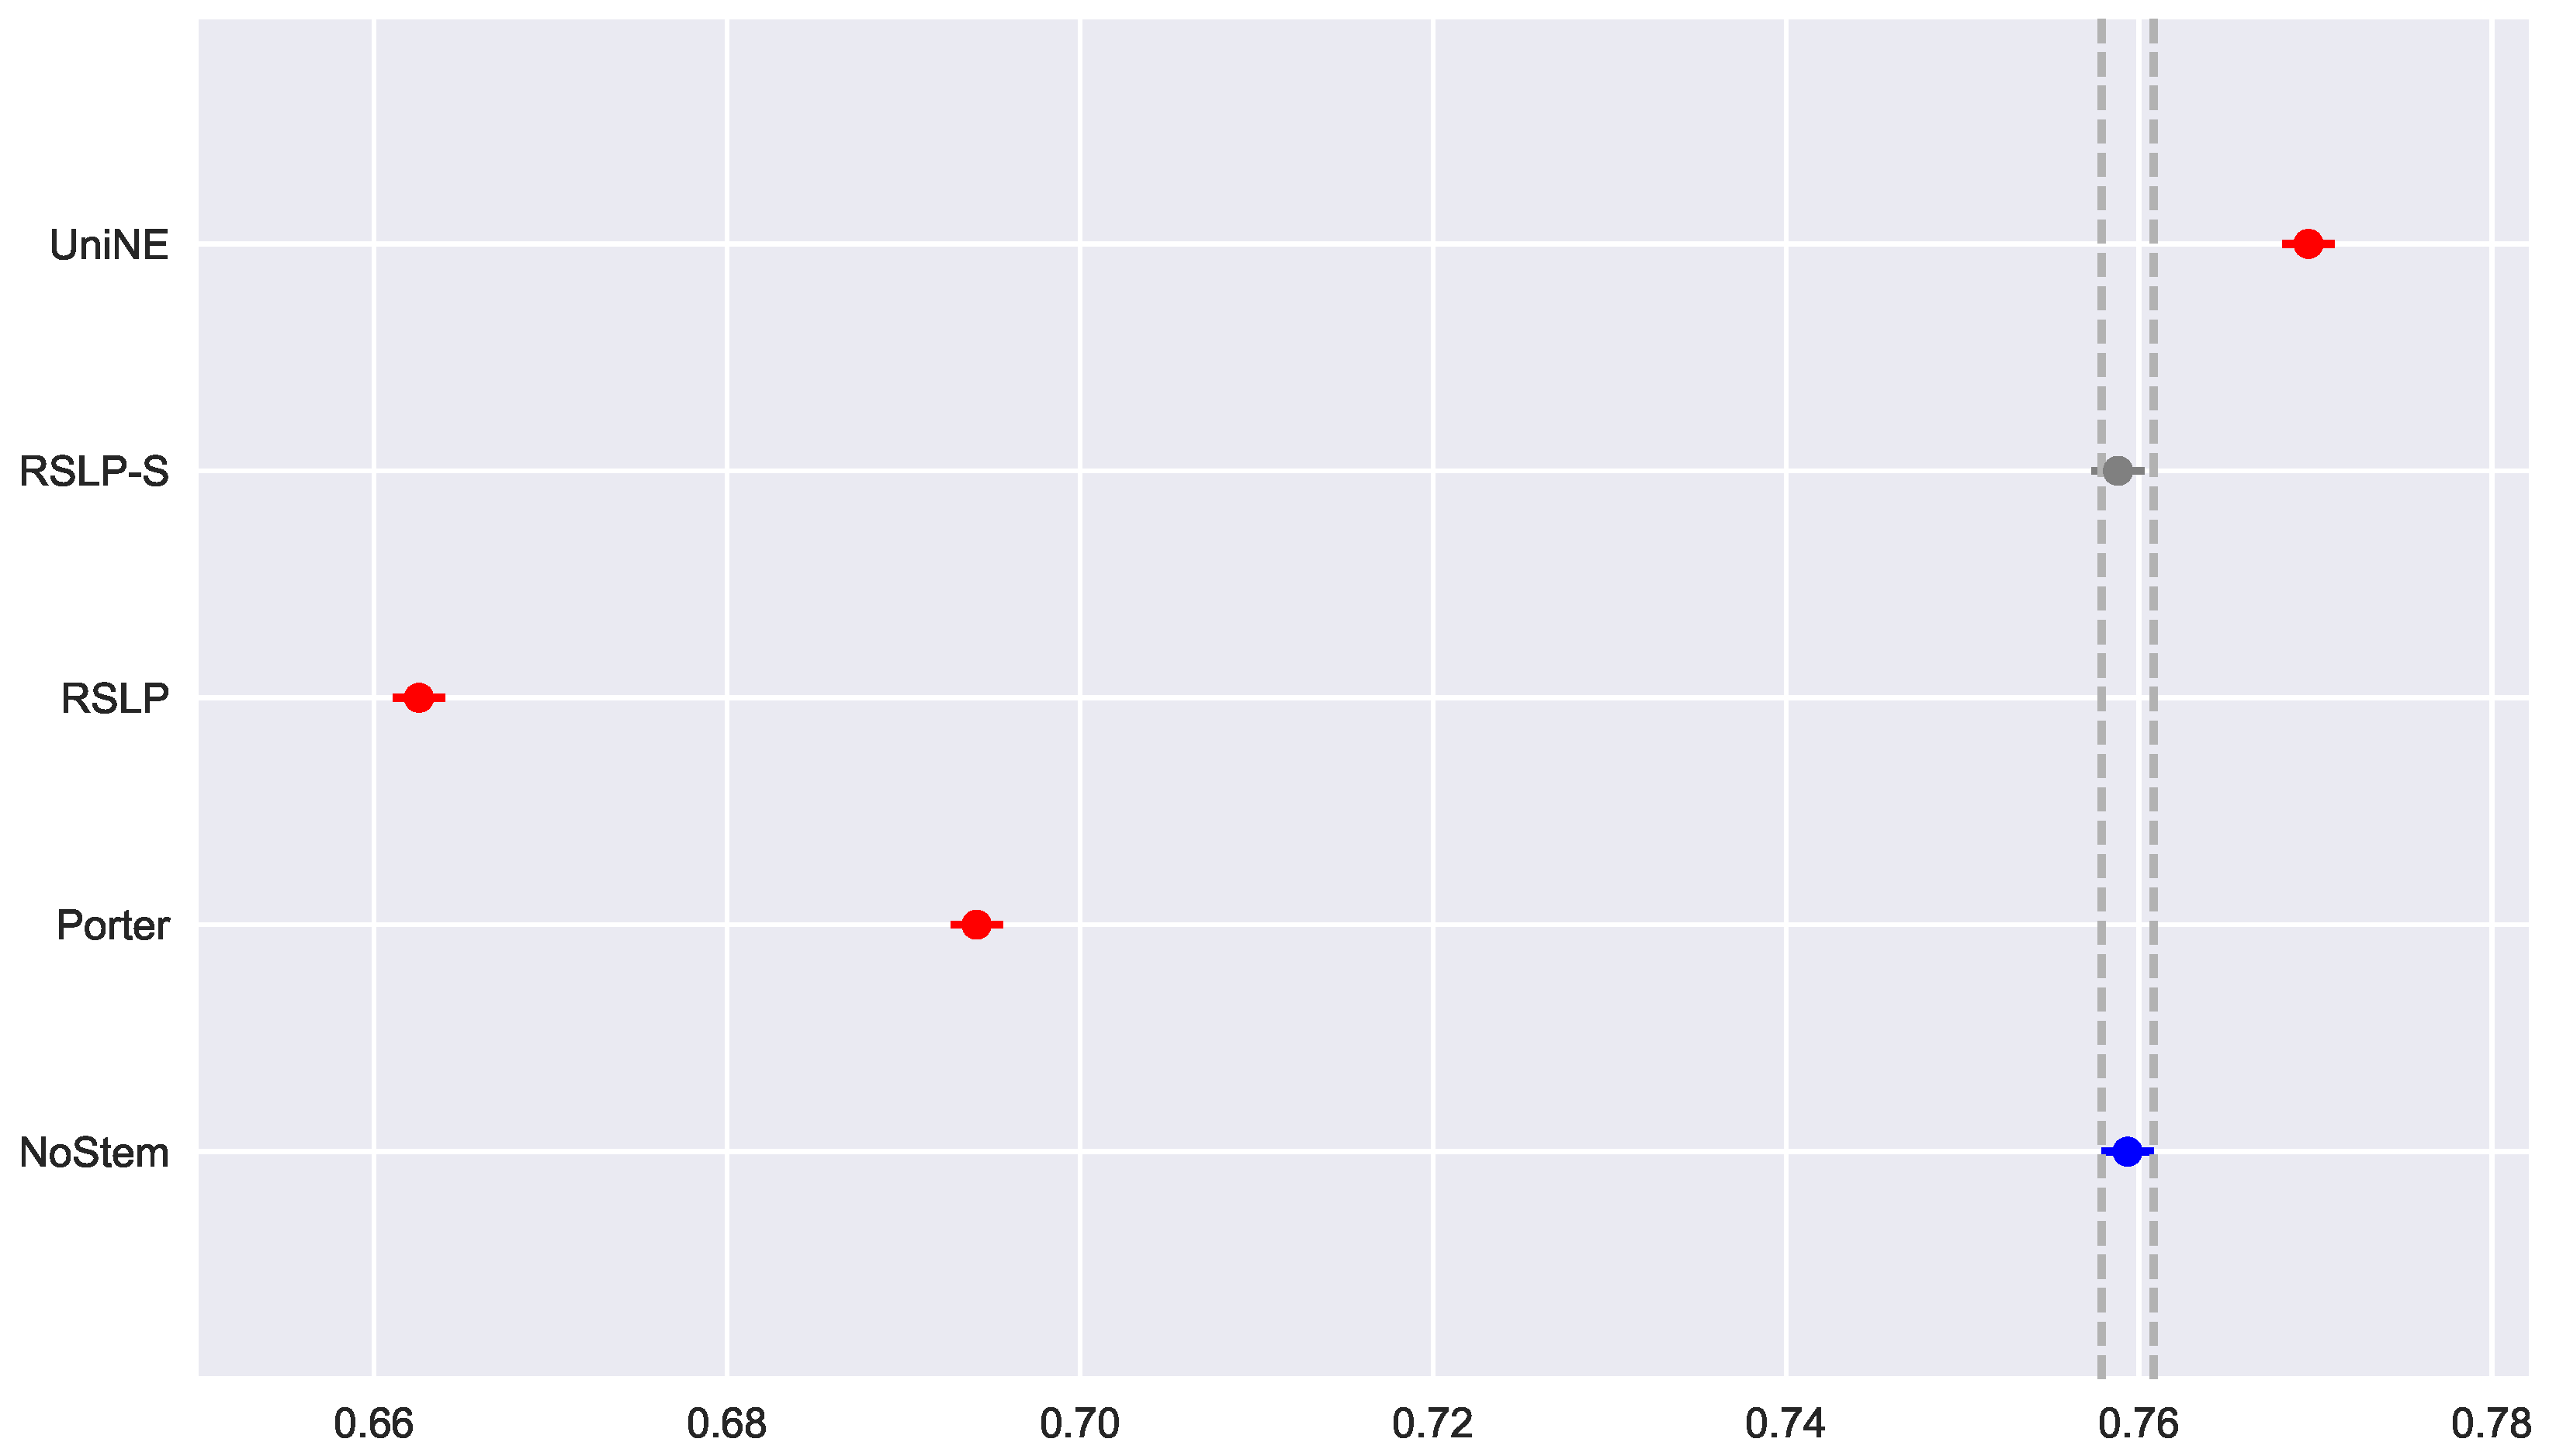
Figure 25.
Reduction percentage of unique terms (RP), MAP, MPC and MRP by stemming the ATR collection.
Figure 25.
Reduction percentage of unique terms (RP), MAP, MPC and MRP by stemming the ATR collection.

Figure 26.
DTR-MAP bootstrap distribution and probability plots.

Figure 27.
DTR-MAP comparison between stemming algorithms.

Figure 28.
DTR-MPC bootstrap distribution and probability plots.

Figure 29.
DTR-MPC comparison between stemming algorithms.

Figure 30.
DTR-MRP bootstrap distribution and probability plots.

Figure 31.
DTR-MRP comparison between stemming algorithms.
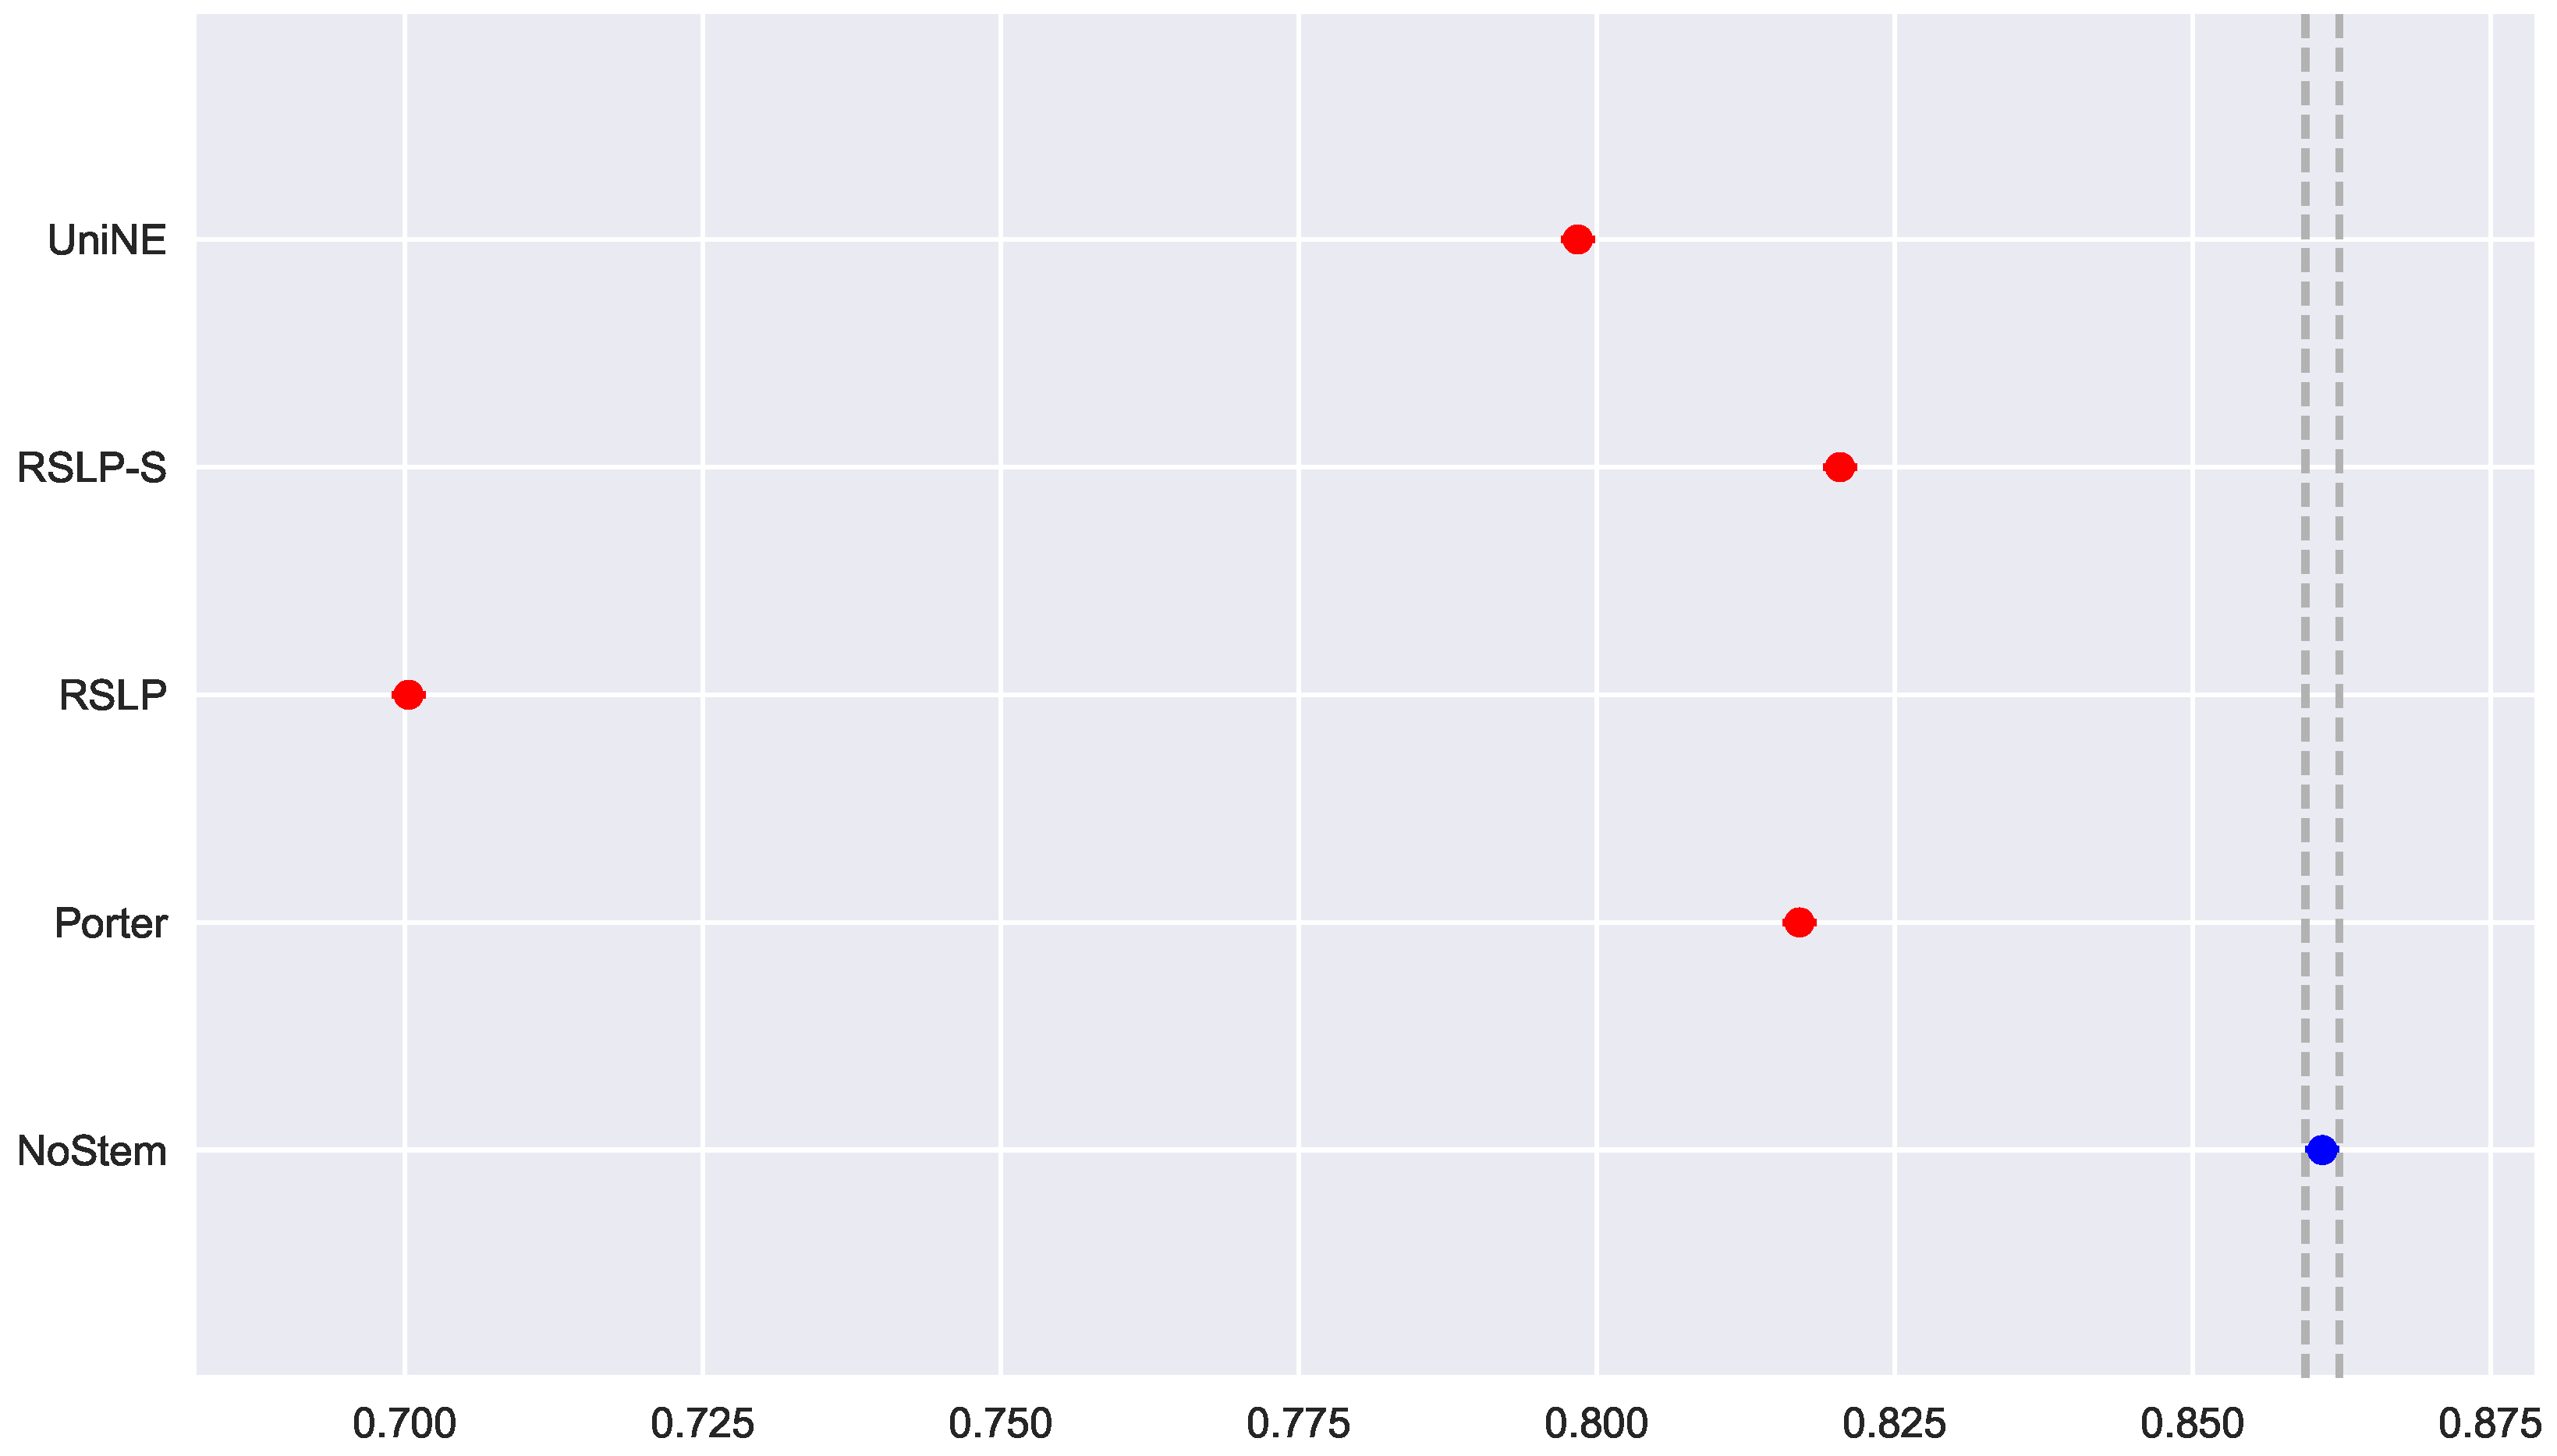
Figure 32.
Reduction percentage of unique terms (RP), MAP, MPC and MRP by stemming the DTR collection.
Figure 32.
Reduction percentage of unique terms (RP), MAP, MPC and MRP by stemming the DTR collection.


Table 1.
Example of stemming using five algorithms of the experiment.
| Stemmer | Word 1 | Word 2 | Word 3 | Word 4 | Word 5 | Word 6 |
|---|---|---|---|---|---|---|
| NoStem | constituições | limitações | regimento | considerando | anuência | estelionato |
| Porter | constituiçõ | limit | regiment | consider | anuênc | estelionat |
| RSLP | constitu | limit | reg | consider | anu | estelionat |
| RSLP-S | constituição | limitação | regimento | considerando | anuênc | estelionato |
| UniNE | constituica | limitaca | regiment | considerand | anuenci | estelionat |
Table 2.
2 × 2 Contingency table. Data from [12].
Table 2.
2 × 2 Contingency table. Data from [12].
| Relevant | Non-Relevant | Total | |
|---|---|---|---|
| Retrieved | a | b | a + b |
| Not Retrieved | c | d | c + d |
| Total | a + c | b + d | a + b + c + d = N |
Table 3.
Hypothetical results returned by an information retrieval system.
| Document | Relevant |
|---|---|
| d1 | No |
| d2 | Yes |
| d3 | Yes |
| d4 | No |
| d5 | No |
| d6 | Yes |
| d7 | Yes |
| d8 | Yes |
| d9 | Yes |
| d10 | No |
| d11 | Yes |
| d12 | Yes |
| d13 | No |
| d14 | No |
Table 4.
Sample size per collection.
| Coll. | N | n | ||
|---|---|---|---|---|
| ASG | 181,994 | 638.45 | 322.15 | 1524 |
| DSG | 37,044 | 488.63 | 276.56 | 1476 |
| ATR | 37,161 | 520.07 | 247.05 | 1476 |
| DTR | 23,149 | 419.54 | 192.39 | 1442 |
Table 5.
An example of the recorded data.
| ID | UTD | Stemmer |
|---|---|---|
| 201100205001443632662 | 679 | NoStem |
| 201100205001443632662 | 580 | Porter |
| 201100205001443632662 | 547 | RSLP |
| 201100205001443632662 | 651 | RSLPS |
| 201100205001443632662 | 636 | UniNE |
Table 6.
Results of the Friedman tests for the Hypothesis 1.
| Coll. | p-Value | |
|---|---|---|
| ASG | 5883.84 | 0.000 |
| DSG | 5590.32 | 0.000 |
| ATR | 5863.67 | 0.000 |
| DTR | 5474.95 | 0.000 |
Table 7.
Results of the Kruskal–Wallis tests for the Hypothesis 2.
| Stemmer | p-Value | |
|---|---|---|
| Porter | 687.93 | 0.000 |
| RSLP | 711.83 | 0.000 |
| RSLP-S | 250.31 | 0.000 |
| UniNE | 295.25 | 0.000 |
Table 8.
Sample dimensionality reduction.
| Coll. | Porter | RSLP | B | UniNE |
|---|---|---|---|---|
| ASG | 46% | 52% | 12% | 24% |
| DSG | 39% | 45% | 11% | 22% |
| ATR | 35% | 41% | 10% | 20% |
| DTR | 35% | 41% | 10% | 19% |
Table 9.
Dimensionality reduction over all collections.
| Coll. | NoStem | Porter | RSLP | B | UniNE |
|---|---|---|---|---|---|
| ASG | 408,336 (0%) | 316,008 (23%) | 295,822 (27%) | 384,393 (6%) | 350,679 (14%) |
| DSG | 145,270 (0%) | 110,378 (24%) | 104,082 (28%) | 135,851 (6%) | 124,661 (14%) |
| ATR | 188,266 (0%) | 151,139 (20%) | 144,213 (23%) | 178,675 (5%) | 165,836 (12%) |
| DTR | 54,862 (0%) | 39,640 (28%) | 36,833 (33%) | 50,944 (7%) | 45,897 (16%) |
Table 10.
Evaluation metrics results by collection.
| Coll. | Metric | Algorithm | Value | % | |d| | Coll. | Metric | Algorithm | Value | % | |d| |
|---|---|---|---|---|---|---|---|---|---|---|---|
| ASG | MAP | NoStem | 0.84 | - | - | ATR | MAP | NoStem | 0.77 | - | - |
| Porter | 0.76 | (-)9 | 3.07 ± 0.13 | Porter | 0.74 | (-)4 | 1.09 ± 0.09 | ||||
| RSLP | 0.64 | (-)24 | 8.29 ± 0.27 | RSLP | 0.72 | (-)6 | 1.79 ± 0.10 | ||||
| RSLP-S | 0.81 | (-)3 | 0.97 ± 0.09 | RSLP-S | 0.80 | (+)4 | 0.90 ± 0.09 | ||||
| UniNE | 0.79 | (-)6 | 2.29 ± 0.11 | UniNE | 0.82 | (+)6 | 2.11 ± 0.11 | ||||
| MPC | NoStem | 0.84 | - | - | MPC | NoStem | 0.71 | - | - | ||
| Porter | 0.72 | (-)14 | 4.52 ± 0.17 | Porter | 0.65 | (-)8 | 1.89 ± 0.11 | ||||
| RSLP | 0.57 | (-)32 | 10.36 ± 0.33 | RSLP | 0.61 | (-)14 | 3.34 ± 0.14 | ||||
| RSLP-S | 0.79 | (-)6 | 1.75 ± 0.10 | RSLP-S | 0.72 | (+)1 | 0.28 ± 0.09 | ||||
| UniNE | 0.74 | (-)11 | 3.62 ± 0.14 | UniNE | 0.74 | (+)4 | 0.92 ± 0.09 | ||||
| MRP | NoStem | 0.81 | - | - | MRP | NoStem | 0.76 | - | - | ||
| Porter | 0.72 | (-)11 | 3.87 ± 0.15 | Porter | 0.69 | (-)9 | 2.44 ± 0.12 | ||||
| RSLP | 0.58 | (-)28 | 9.86 ± 0.32 | RSLP | 0.66 | (-)13 | 3.69 ± 0.14 | ||||
| RSLP-S | 0.78 | (-)4 | 1.32 ± 0.10 | RSLP-S | 0.76 | 0 | 0.02 ± 0.09 | ||||
| UniNE | 0.74 | (-)9 | 3.03 ± 0.13 | UniNE | 0.77 | (+)1 | 0.41 ± 0.09 | ||||
| DSG | MAP | NoStem | 0.90 | - | - | DTR | MAP | NoStem | 0.87 | - | - |
| Porter | 0.80 | (-)11 | 4.08 ± 0.15 | Porter | 0.86 | (-)1 | 0.40 ± 0.09 | ||||
| RSLP | 0.71 | (-)21 | 7.32 ± 0.24 | RSLP | 0.77 | (-)11 | 4.56 ± 0.17 | ||||
| RSLP-S | 0.86 | (-)4 | 1.63 ± 0.10 | RSLP-S | 0.87 | 0 | 0.11 ± 0.09 | ||||
| UniNE | 0.88 | (-)2 | 0.70 ± 0.09 | UniNE | 0.85 | (-)2 | 0.85 ± 0.09 | ||||
| MPC | NoStem | 0.79 | - | - | MPC | NoStem | 0.81 | - | - | ||
| Porter | 0.70 | (-)11 | 3.01 ± 0.13 | Porter | 0.78 | (-)4 | 1.32 ± 0.10 | ||||
| RSLP | 0.61 | (-)23 | 6.16 ± 0.21 | RSLP | 0.67 | (-)17 | 4.97 ± 0.18 | ||||
| RSLP-S | 0.75 | (-)5 | 1.28 ± 0.10 | RSLP-S | 0.79 | (-)2 | 0.99 ± 0.09 | ||||
| UniNE | 0.77 | (-)2 | 0.66 ± 0.09 | UniNE | 0.77 | (-)5 | 1.78 ± 0.10 | ||||
| MRP | NoStem | 0.88 | - | - | MRP | NoStem | 0.86 | - | - | ||
| Porter | 0.73 | (-)17 | 6.23 ± 0.21 | Porter | 0.82 | (-)5 | 1.88 ± 0.11 | ||||
| RSLP | 0.65 | (-)26 | 9.22 ± 0.03 | RSLP | 0.70 | (-)19 | 6.27 ± 0.21 | ||||
| RSLP-S | 0.83 | (-)6 | 2.47 ± 0.12 | RSLP-S | 0.82 | (-)5 | 1.77 ± 0.10 | ||||
| UniNE | 0.84 | (-)4 | 2.01 ± 0.11 | UniNE | 0.80 | (-)7 | 2.62 ± 0.12 |
© 2018 by the authors. Licensee MDPI, Basel, Switzerland. This article is an open access article distributed under the terms and conditions of the Creative Commons Attribution (CC BY) license (http://creativecommons.org/licenses/by/4.0/).
Share and Cite
MDPI and ACS Style
N. de Oliveira, R.A.; C. Junior, M. Experimental Analysis of Stemming on Jurisprudential Documents Retrieval. Information 2018, 9, 28. https://doi.org/10.3390/info9020028
AMA Style
N. de Oliveira RA, C. Junior M. Experimental Analysis of Stemming on Jurisprudential Documents Retrieval. Information. 2018; 9(2):28. https://doi.org/10.3390/info9020028
Chicago/Turabian StyleN. de Oliveira, Robert A., and Methanias C. Junior. 2018. "Experimental Analysis of Stemming on Jurisprudential Documents Retrieval" Information 9, no. 2: 28. https://doi.org/10.3390/info9020028
Note that from the first issue of 2016, this journal uses article numbers instead of page numbers. See further details here.