A Hybrid Information Mining Approach for Knowledge Discovery in Cardiovascular Disease (CVD)


Department of Engineering for Innovation, University of Salento, 73100 Lecce, Italy
*
Author to whom correspondence should be addressed.
Information 2018, 9(4), 90; https://doi.org/10.3390/info9040090
Submission received: 14 March 2018
/
Revised: 8 April 2018
/
Accepted: 10 April 2018
/
Published: 12 April 2018
(This article belongs to the Special Issue Semantics for Big Data Integration)
Abstract
:The healthcare ambit is usually perceived as “information rich” yet “knowledge poor”. Nowadays, an unprecedented effort is underway to increase the use of business intelligence techniques to solve this problem. Heart disease (HD) is a major cause of mortality in modern society. This paper analyzes the risk factors that have been identified in cardiovascular disease (CVD) surveillance systems. The Heart Care study identifies attributes related to CVD risk (gender, age, smoking habit, etc.) and other dependent variables that include a specific form of CVD (diabetes, hypertension, cardiac disease, etc.). In this paper, we combine Clustering, Association Rules, and Neural Networks for the assessment of heart-event-related risk factors, targeting the reduction of CVD risk. With the use of the K-means algorithm, significant groups of patients are found. Then, the Apriori algorithm is applied in order to understand the kinds of relations between the attributes within the dataset, first looking within the whole dataset and then refining the results through the subsets defined by the clusters. Finally, both results allow us to better define patients’ characteristics in order to make predictions about CVD risk with a Multilayer Perceptron Neural Network. The results obtained with the hybrid information mining approach indicate that it is an effective strategy for knowledge discovery concerning chronic diseases, particularly for CVD risk.
1. Introduction
1.1. Big Data and Business Intelligence
Big Data is changing the way in which we analyze, manage, and leverage data in any ambit. Today’s industry needs effective methods and tools to simplify data availability and knowledge sharing, requiring research on techniques and methods to resolve the problem of managing data abundance. “Information mining” is different approach to traditional data analysis from, for example, query and reporting, as it is aimed at the discovery of information and knowledge in the absence of a prior formulated hypothesis [1]. In this complex context, it is necessary to make a distinction between two categories of big data: semantically poor big data and semantically rich big data (rich data). Rich data are datasets where objects are classified according to powerful taxonomies—for example, data about health, business data, and most of the data that must be directly investigated by users with the aim of making a decision [2]. Consequently, faced with the complexity of rich data, it is very important to focus our attention on the concept of data exploration in order to transform the data into the information we need. The process of extracting useful information from the data is known by various names: knowledge extraction, information discovery, exploratory computing, data exploration, information mining, data pattern processing, or data mining. All these techniques create what is known as business intelligence (BI) which, according to its definition, means the set of business processes used to collect and analyze strategic information, the technology used to perform these processes, and the information obtained as a result of these processes [3]. A fundamental part of the BI process consists of Data Mining (DM), to which is often added the concept of Knowledge Discovery (KD); it is therefore common to speak, more generally, about KDDM. The output of the KDDM process, and then of BI, can provide new inspiration to collect other data, or to generate new indices or hypercubes for analysis; this is why, in business applications, we speak of a virtuous circle of knowledge [4], since the extraction of knowledge leads to new information, which can, in turn, be used to obtain further and more detailed information about it. Thus, KDDM is not simply the use of algorithms or statistical techniques on data by using a computer, but it is also a BI process that must be used together with all the tools of Information Technology (IT) for the purpose of providing decision support in the business environment.
1.2. Knowledge Discovery in Healthcare
One the most promising areas in which to apply information mining and business intelligence systems in order to produce a significant change is in healthcare. The healthcare industry is among the most critical and vast industries, but is also very inefficient [5]. Healthcare data is enormous, and includes patient-centric data, resource management data, and transformed data. Progress in information technology has also seen advances in healthcare technologies: data is increased in volume, quickly created by various devices, and stored in different formats. Thus, the healthcare industry has entered the big data era [6]. One main problem, in this context, is to do with data quality: many minimum datasets are incomplete, out of date, and inaccurate [7]. Another aspect to consider is how, even today, these data are actually turned into knowledge. The traditional method is based on manual analysis and interpretation; therefore, for these applications, it is a process that is long, costly, and very subjective. The application of big data analytics represents for these problems one promising step forward. Starting with business intelligence systems and decision support systems, big data analytics has been developed. Big data analytics is used to characterize datasets in very large and complex applications, where advanced and unique storage, management, analysis, and visualization are required [1]. Healthcare organizations can analyze a massive volume, variety and velocity of data through a vast range of healthcare networks thanks to big data analytics’ technique, with the aim of supporting evidence-based decision-making and action-taking [8]. For these reasons, the healthcare industry is beginning to approach the innovative methods and tools of business intelligence and data exploration in big and rich data scenarios, as a way of providing better health management of a population or generating innovative solutions to healthcare—for example, to create predictive models to reduce cost or to improve quality of care [5]. Another very motivating factor is that all parties involved in the healthcare industry (hospitals, clinics and physicians, and patients) benefit from information discovery when it results in efficacious treatments and best practices [9]. The many data mining applications in healthcare can be classified into four main groups: evaluation of treatment effectiveness; management of healthcare; customer relationship management; and detection of fraud and abuse [10]. In particular, in evaluating the effectiveness of medical treatments, data mining techniques are useful for verifying what actions are efficacious or not, and for comparing causes, symptoms, and courses of treatments [11]. In the current system, much of the focus is on patients with chronic care diseases, which represent the bulk of costs in healthcare. In the past ten years, the main cause of death globally has been heart disease. Decision support from data exploration is particularly difficult in this context because the management of heart disease patients is very complex—multiple and often concurrent elements are involved in the treatment. Through data mining techniques, it is possible develop applications to better identify and monitor chronic disease states and high-risk patients, defining effective and opportune interventions to decrease the amount of hospital admissions and claims [10]. Previously, various data mining techniques have been implemented in healthcare systems; however, hybridization in addition to single techniques in the identification of heart disease shows promising outcomes, and may be useful in further investigating the treatment of heart disease [12]. This paper proposes a hybrid information mining approach to heart disease data analysis, with the aim to improve knowledge discovery related to Cardiovascular Disease (CVD).
The paper is organized as follows: In Section 2, we present a literature review of data exploration techniques in chronic care diseases. In Section 3, we describe the research method. In Section 4, we present the analysis methods. In Section 5, we present data analysis and results and, finally, in Section 6 and Section 7, the discussion and conclusion, respectively.
2. Literature Review
The increasing number of deaths of patients with heart disease around the world every year, the inherently complex context that involves multiple and often concurrent elements, and the massive amount of data available from which to extract knowledge are the motivations that push researchers to use data exploration techniques—in particular, data mining techniques—to aid healthcare professionals in the management of heart disease [13]. Many works by researchers use big data infrastructure to design risk calculation tools, predictive modeling techniques, and feature extraction techniques, and try to extend the proposed solutions to address other clinical risks. Naïve Bayes, Decision Trees, and Neural Networks are the classification techniques most often used. Other data mining techniques include kernel density, the bagging algorithm, and support vector machines [13]. In Srinivas et al. [14], we find the application of data mining classification techniques to a large volume of health data. Different algorithms were used for the purpose of predicting combinations of different target attributes. The algorithms used were Decision Trees, Naïve Bayes, and Artificial Neural Networks. This study aimed to provide a method for effectively predicting a heart attack using the mentioned data mining techniques; more specifically, the aim was to provide an approach for predicting a heart attack from the analysis of a heart disease dataset. The authors proposed to improve the results achieved by including other data mining techniques. Two of the same authors, furthermore, introduced a rough-fuzzy classifier that combined rough set theory with the fuzzy set with the aim of predicting heart disease [15]. Another prototype of a heart disease prediction system was proposed by Palaniappan and Awang [16] using Decision Tree, Naïve Bayes, and Neural Network classification algorithms. This prototype uses data from a historical database of heart disease related to medical profiles (such as age, sex, blood pressure, and blood sugar) to predict heart disease in patients. The result obtained can be improved by expanding it with other medical attributes not considered, using other data mining techniques like Time Series, Clustering, and Association Rules and also by increasing the size of the dataset used in this research because it was quite small. Another paper [17] concerned the study of several classifiers that were compared through different experiments to find the one best able to predict heart disease in patients. The best algorithm was found to be “Classification And Regression Tree”. Moreover, through the use of three tests (Chi-square, Info Gain, and Gain Ratio) the attributes that are most significant in cardiac pathologies were also identified. Karaolis et al. [18] implemented a data mining system for the assessment of heart-event-related risk factors, targeting the reduction of coronary heart disease (CHD) events. The study analyzed a total of 528 cases, most of them with more than one event, using the C4.5 decision tree algorithm. The most important risk factors, as extracted from the classification rules analysis were (1) MI (myocardial infarction), age, smoking, and history of hypertension; (2) PCI (percutaneous coronary intervention), family history, history of hypertension, and history of diabetes; and (3) CABG (coronary artery bypass graft surgery), age, history of hypertension, and smoking. In this work, further investigation with larger datasets and other rule extraction algorithms and criteria is need. Zolfaghar et al. [19] studied big-data-driven solutions to predict the 30-day risk of readmission for congestive heart failure (CHF) incidents. In this work, several risk prediction factors were considered: clinical, socio-demographic, health conditions, disease parameters, hospital care quality parameters, and a variety of specific variables for each healthcare provider. The number of factors considered increases the complexity of the problem. The validity of the solution was evaluated through different experiments taking into account both quality and scalability.
3. Research Method
Arising from the context described, the aim of our research paper is to develop a hybrid information mining approach for the assessment of heart-event-related risk factors targeting the reduction of CVD risk. To achieve this aim, we have selected three data exploration techniques to extract knowledge from our experimental dataset. The selected techniques are clustering, association rules, and neural networks. The dataset available is very broad and includes a very large number of cases of patients; it is also very rich semantically as it includes a large number of attributes after a great deal of work put into collection, integration, and reconciliation of the data.
3.1. Domain Context: CVD Risk Dataset
In medical fields that deal with chronicity, there is the need to plan and implement effective and efficient management of chronicity with the aim to improve care for people suffering from chronic diseases, reducing the burden on the individual, their family, and the social context, and improving quality of life. One of the key macro-activities for this goal is “stratification and targeting of the population” through models that take into account health and socio-economic needs (population management) according to the National Plan of Chronicity of the Italian Ministry of Health [20]. Researchers and experts have been called to identify the tools able to identify people affected by a specific chronic pathology, developing algorithms or methods of population selection which allow verification if a person is affected by one of the diseases under study. Furthermore, using administrative information it is possible to understand if the patients are adequately assisted [21]. The general objective is to use the existing administrative flows to read how people with certain chronic and complex diseases are monitored/treated/assisted. Based on these objectives, our work focuses on the context related to cardiovascular risk and the pathologies involved—in particular, diabetes, hypertensive disease, heart failure, cardio-circulatory disease, cerebral vascular diseases, and circulatory system diseases. The risk factors for heart disease are multiple and we can find 12 in the literature that are useful to healthcare professionals in recognizing patients with a high risk of heart disease [13]. An important factor that we have considered in our analysis is the individual risk score. “The individual risk score is a simple tool for assessing the probability of developing a first major cardiovascular event (myocardial infarction or stroke) over the following 10 years, when the values of eight risk factors are known” [22]. In this way, the total evaluation of all higher risk factors is taken into account, not based on the mere summation of risk factors’ values, but considering the multifactorial cause of cardiovascular disease [22].
3.2. Data Source
To illustrate the work, suppose that as part of its healthcare management program, LHO (a local healthcare organization) is interested in finding out how certain variables are associated with the onset of CVD risk and in assessing the efficacy of a patient’s therapeutic path. The purpose is to stratify the population of patients, to identify patterns of high-risk patients, and to find groups of patients who have worsened after 10 years after initial enrollment. We have collected and integrated information related to all services (hospital, diagnostic, specialist, therapeutic, etc.) with the aim of obtaining useful information to intercept indications on the diagnostic–therapeutic assistance pathways (PDTA) of patients, which are difficult to obtain from the simple registration of a care contact. The administrative databases are re-read in the longitudinal direction, associating each succession of patients with the succession of contacts. The administrative flows useful for the purposes are those related to the patient registry, exemptions for pathology, hospital discharge cards, outpatient specialists, and pharmaceuticals. A dataset exists in the database of LHO that contains the following variables of particular interest to CVD risk: gender, age, smoking habit, onset of diabetes, onset of hypertension, individual risk score, systolic blood pressure, serum cholesterol, High-Density Lipoprotein cholesterol. Furthermore, the presence of the following diseases has been considered: cardiac disease, cardio-circulatory disease, heart failure, cerebrovascular disease, and circulatory system disease. A sample population of 5134 “healthy” patients (i.e., who have never had any cardiovascular events) was enrolled in 2008, recording all the variables mentioned above. The CVD risk score at enrollment of patients is shown in Table 1.
In Table 2, we present the initial distribution of diseases at time of patients’ enrollment.
Then, the following data related to the treatment and therapy of patients from 2008 to 2017 were collected: specialist medical services, hospitalizations, consumed medicines, and new diagnoses for the diseases considered. In Table 3, we present the final distribution of diseases, after 10 years from patients’ enrollment.
Based upon this context, we apply the following combination of techniques: Clustering, Neural Networks, and Association Rules using the Waikato Environment for Knowledge Analysis (WEKA) platform for the data analytics experiments (version 3.8.1). Weka is a collection of machine learning algorithms for data mining tasks. The algorithms can either be applied directly to a dataset or called from your own Java code. Weka contains tools for data preprocessing, classification, regression, clustering, association rules, and visualization [23]. Weka has a GUI Chooser from which any of the four major WEKA application environments (Explorer, Experimenter, Knowledge Flow, and Simple Command Line Interface) can be selected. The Explorer Application was selected for this study because it has a workbench that contains a collection of visualization tools, data processing, attribute ranking, and predictive modeling with a graphical user interface (GUI), which are very useful in this work.
4. Analysis Methods
A very delicate and important phase of the data exploration process is the selection of analytical methods to be used according to the objectives we have defined. There are many statistical methods and each of them has been implemented in a myriad of algorithms. The choice of method depends on the type of analysis we want to do, which in turn depends on the objectives set and the data we have available. The main classes of statistical methods are three in number: descriptive methods, predictive methods, and local methods [24]. The descriptive methods, also called unsupervised or indirect methods, aim to group the data on the basis of relationships not known (and we could say “non-notable”) a priori or from an exploratory analysis. Among the various algorithms dealt with by descriptive methods, we have chosen clustering for our context. Predictive methods, also called supervised or direct methods, aim to find relationships between features and targets, in order to identify classifications or predictions. A target is always present in the dataset used. Among these methods we have chosen to apply a multilayer perceptron neural network. Finally, the local methods aim to identify particular characteristics and relationships in subsets of the dataset. We have chosen to apply the Association Rules algorithm for the local methods. Below we describe the methods chosen for our analysis.
4.1. Descriptive Method: Clustering
Clustering is a technique that finds groups of elements, such that the elements within a group are similar to each other and different from the elements of another group [25]. Clustering, considered the most important unsupervised learning technique, is based on the concept of distance, which is therefore central to the analysis. “Near” elements (according to a certain metric) are to be considered homogeneous and must be inserted in the same cluster; heterogeneous patterns will be “distant” and included in different sets. We have chosen to use the K-means algorithm that finds K-many disjoint groups from a dataset where, with K value set at the beginning of the process. There are two steps in the execution of the algorithm. In the first step, K-many centroids are defined—one for each cluster; in the second step, each point of the dataset is associated to the nearest centroid through a metric of distance between data points and the centroids. When the first pass is completed, it is necessary to recalculate the new centroids and the new distances, producing a loop. In this loop, the K centroids may modify their position in a step-by-step way. When the centroids no longer change position, the convergence criterion for the clustering is satisfied [26]. Thus, the algorithm for learning is iterative and requires two inputs (in addition to the training set): a metric of distance between patterns (Euclidean distance is generally used) and the number of clusters K < p (K is found by trial), where p is the number of patterns of training. The function that we intend to minimize is
where μj, j = 1, ..., K, indicate the K-many centroids and Sj are the K-many clusters. The centroid is identified by mediating the position of the points belonging to the cluster. The K-means algorithm in general produces satisfactory results. A disadvantage to it is that the quality of the final clusters depends on the values of the initial centroids [26].
4.2. Local Method: Association Rules
Association Rules is a technique that shows the relationship between data attributes. The algorithm finds rules of the type “if antecedent, then (likely) consequent”, where antecedent and consequent are itemsets, which are sets of one or more items. Support and confidence are the metrics used to evaluate the quality of an association rule in two steps: First, minimum support is applied to find all frequent itemsets in a database. Second, these frequent itemsets and the minimum confidence constraint are used to form rules. Support is an indication of how frequently an item occurs in the dataset. For a rule A ⇒ B, its support is the percentage of transactions in the dataset that contain A ∪ B (meaning both A and B); confidence indicates the number of times the statements are found to be true [27]. The association rules algorithms are unsupervised, as we start from the principle of not knowing anything about our dataset and wanting to try to obtain information through the application of some algorithm. In the case of association rules, what interests us is not to find a model to be applied at runtime, but only to identify relationships within the dataset. For this reason, quality indices for results are not definable. Among the different algorithms for finding the rules of associations between features, we use the Apriori Association algorithm to discover in the dataset the best combination of attributes. Apriori [28] is an iterative method which proceeds by creating so-called itemsets, or sets of rules for which the conditions of support and confidence are verified. The Apriori association algorithm is given below.
Apriori Algorithm
Apriori principle: Any subset of a frequent itemset is a frequent itemset. This principle is applied for the calculation of frequent itemsets. Given a K-itemset with K elements in input, Apriori looks for a large itemset by considering the K-itemsets for K values. More precisely, the following steps are executed:
- Step 1: Count item occurrences to calculate large 1-itemsets;
- Step 2: Iterate until no new large 1-itemsets are found;
- Step 3: (K + 1)-length candidate itemsets are identified from K large itemsets;
- Step 4: Candidate itemsets containing non-large subsets of K length are not considered;
- Step 5: Count the Support of each candidate itemset by scanning the dataset;
- Step 6: Remove candidate itemsets that are small.
The output generated is itemsets that are “large” and that satisfy the minimum support and minimum confidence thresholds [28].
4.3. Predictive Method: Neural Networks
An artificial neural network (ANN) is a computational system that emulates biological neural networks in the way the human brain processes information. A Multilayer Perceptron (MLP) is the type of feedforward artificial neural network that is most well-known. An MLP is formed of at least three layers of nodes and each node is a neuron that uses a nonlinear activation function, except for the input nodes. For training, MLP uses a supervised learning technique called backpropagation [29,30].
The general structure of an MLP consists of three layers of neurons, as follows:
- The first layer is called an input layer and is in direct contact with the input data;
- The intermediate layer is called a hidden layer and has no direct contact with the outside, as it receives data from the input layer and sends it to the output neuron layer;
- The last level is the output layer, which receives data from the neurons of the intermediate layer and interfaces with the output.
Regarding the determination of the number of neurons and layers for the hidden layer, there is no precise method in the literature, but usually we proceed to a comparison between architectures to choose the optimal one. Hidden neurons, therefore, receive information from the input neurons through the weights w, and produce the output hk = f(x, wk), where f(·) is the activation function of the neuron. The output neurons, in turn, receive the data from the hidden layer, apply the appropriate z weights, and then produce the output yj = g(h, zj). By combining the two functions, the output of the jth neuron is therefore
This equation shows how the mapping of the inputs in an MLP is highly nonlinear. However, it is necessary to find the weights that characterize the network. Among the different types of MLP, we have chosen the supervised learning MLP in which in the training set we have defined a target so it is possible to define an error function with respect to the optimal output.
5. Data Analysis and Results
The Clustering, Association Rules, and Artificial Neural Networks were analyzed on the Weka workbench. In order to allow for data analysis, exploration, and information, a long phase of data preprocessing became necessary.
5.1. Data Preprocessing
The main preprocessing tasks are described below.
- Data Selection. Selection of the data and attributes that are most advantageous for mining.
- Data Cleaning. Cleaning of all data considered noisy data. In addition, some patients had not collected all attributes; we integrated the missing data where this was possible and we discarded the information about these patients where it was not possible to integrate.
- Data Discretization. Transformation into discrete variables of attributes that take a small set of values, partitioning the values of continuous attributes within a small list of intervals. For the same attributes, the process of discretization it was done manually on the basis of the healthcare literature; in other cases, we used the “Discretize” function of the Weka software (v 3.8.1).
- Data Integration. In the data mining task, usually, a single dataset must first be set when there are data that come from several sources. In this case, we have multiple sources: (1) tables that stored patients’ monitoring data of specific attributes of CVD risk; (2) tables related to hospital admissions, which also stored other information such as the death of the patients; (3) tables related to specialist health services; (4) tables related to medicines used; and (5) tables related to diagnosis of diseases pertinent to CVD risk. Integrating all these data, a general database was created.
- Data Filtering. Every data mining problem requires a search domain restriction based on the purpose of the task. Thus, each resulting temporary table will contain only patient attributes and data with respect to the applied filter.
5.2. Clustering Results
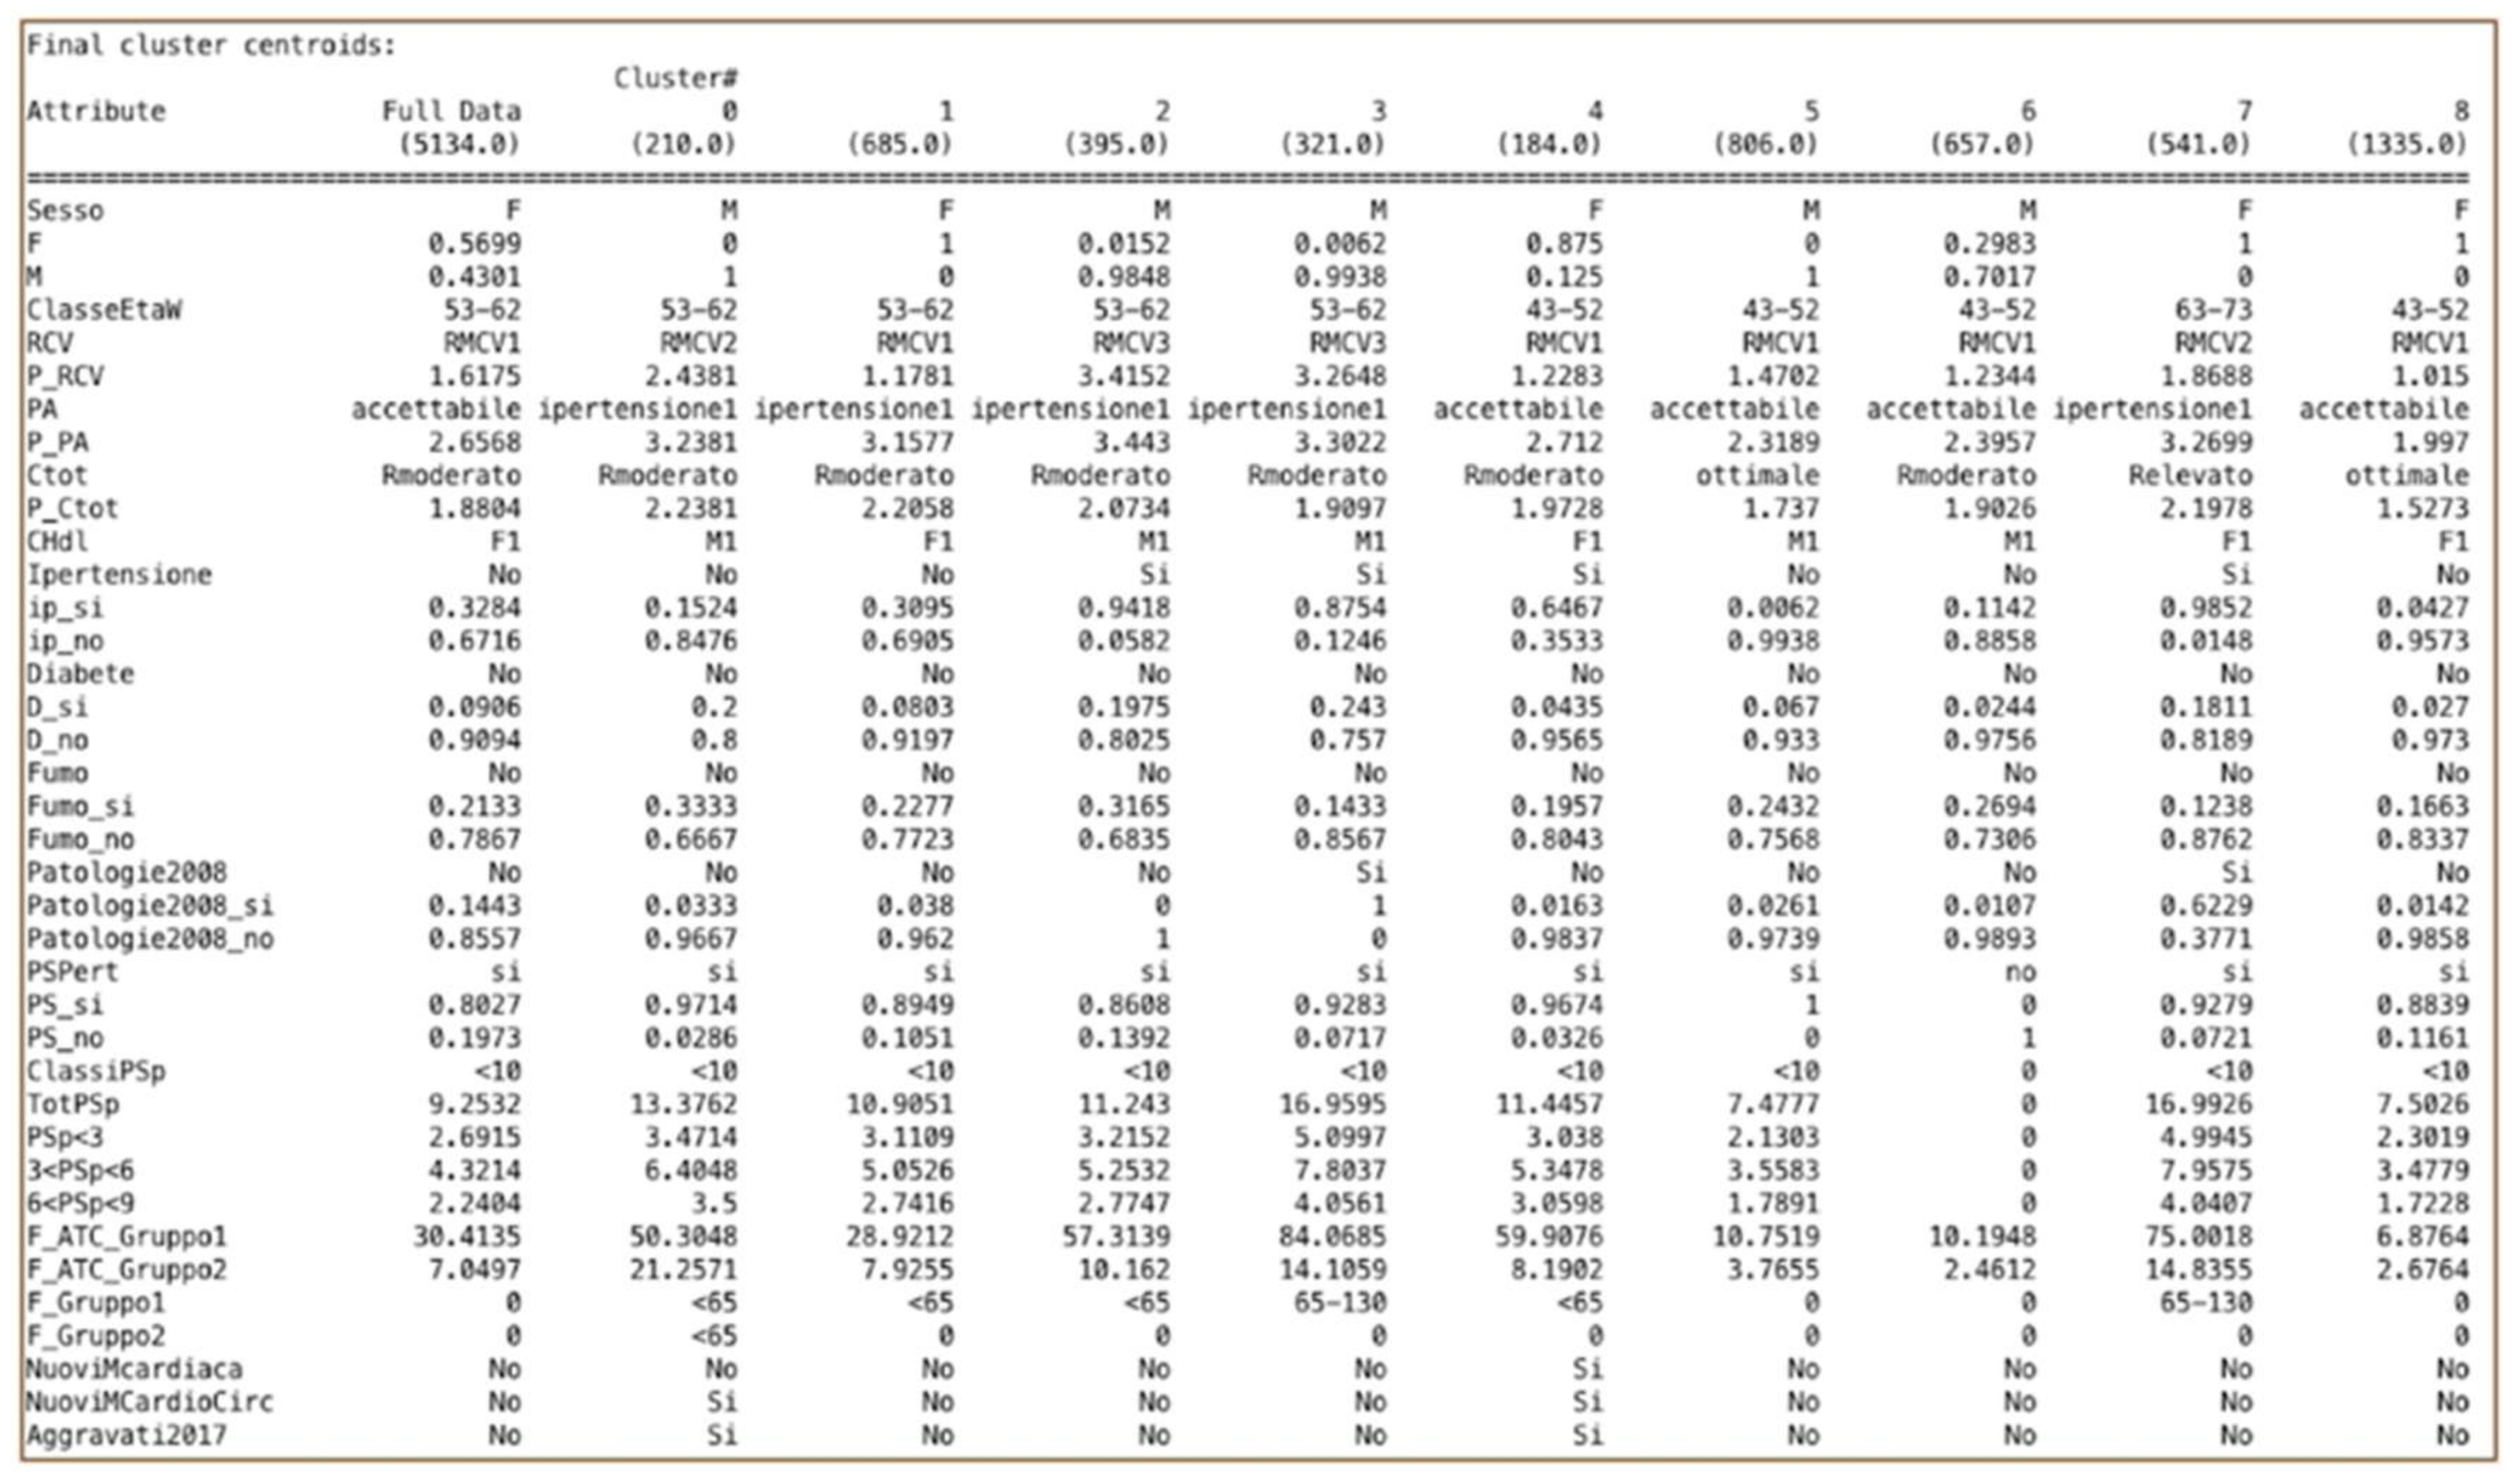
In Weka, the “SimpleKmeans” algorithm is available, and some of the available parameters on which to act are distancefunction, initializationMethod, maxIterations, numClusters (k), numExecutionSlots, and seed. In the WEKA SimpleKMeans algorithm, we used the Euclidean distance measure to compute distances between instances and clusters. The best clustering was made by changing the classification parameters. The optimal configuration was obtained by setting K = 9, seed = 27, and number of epochs = 500. Figure 1 shows the result of the K-means clustering method.
We therefore obtained nine clusters that stratify the patient population according to precise criteria. There are five groups of males and four groups of women that differ in turn by age class, cardiovascular risk level, and by other behaviors and parameters. Note that the data concerning hospital admissions do not characterize any cluster because they are very small in number. For this reason, clustering was re-executed without this attribute, as it was not significant for the clusterization. The specialist medical services characterize the clusters; in particular, Cluster 5 does not use any. In terms of the pharmaceutical drugs, we can observe the variability of the packs assumed in each cluster. We have identified two clusters of patients whose conditions became aggravated—one male group (Cluster 0) and one female (Cluster 4). Cluster 0 (males) has risk class RMCV2 and age range 53–62, while Cluster 4 (females) has risk class RMCV1 and age range 43–52. Through the next step that implements the association rule algorithm, we want to search and investigate the relationships between data, first looking within the whole dataset, and then refining the results through the subsets defined by these clusters.
5.3. Association Rules Results
In Weka, from a drop-down list of available association rule algorithms, we selected “APriori”. We interacted with a wide range of options that allow us to find the best results through appropriate parameter tuning. The real work for association rule learning is in the interpretation of results. From looking at the “Associator output” window, we can see that the algorithm presented the rules learned from the dataset. The algorithm is configured to stop at 10 rules by default and ends when there are at least 10 rules with the minimum confidence established or when the support has achieved a 10% lower bound. It possible to click on the algorithm name and configure it to find and report more rules by changing the “numRules” value. We conducted several experiments using the Apriori algorithm on different groups of data. Starting from the entire dataset, we found meaningful rules for the general dataset, and we subsequently applied the algorithm on the basis of the appropriate filter operation to the following subsets of data: the subset of patients with aggravated conditions, the subset of patients whose conditions were not aggravated, and subsets related to each cluster identified with clustering. We present below the results of some of the experiments.
Experiment 1.
General dataset (5134 instances)
Best rules found:
- Diabete2008=No AltrePP2008=No F_Gruppo2=0 ClassiRp=0 3517 ==> Aggravati2017=No 3260 conf:(0.93)
- AltrePP2008=No F_Gruppo2=0 ClassiRp=0 3700 ==> Aggravati2017=No 3429 conf:(0.93)
- Diabete2008=No F_Gruppo2=0 ClassiRp=0 3526 ==> Aggravati2017=No 3267 conf:(0.93)
- F_Gruppo2=0 ClassiRp=0 3710 ==> Aggravati2017=No 3437 conf:(0.93)
- Diabete2008=No AltrePP2008=No F_Gruppo2=0 ClassiRp=0 Decesso=no 3420 ==> Aggravati2017=No 3167 conf:(0.93)
- Diabete2008=No F_Gruppo2=0 ClassiRp=0 Decesso=no 3428 ==> Aggravati2017=No 3173 conf:(0.93)
- AltrePP2008=No F_Gruppo2=0 ClassiRp=0 Decesso=no 3583 ==> Aggravati2017=No 3316 conf:(0.93)
- F_Gruppo2=0 ClassiRp=0 Decesso=no 3591 ==> Aggravati2017=No 3322 conf:(0.93)
- Diabete2008=No AltrePP2008=No F_Gruppo2=0 Decesso=no 3606 ==> Aggravati2017=No 3305 conf:(0.92)
- Diabete2008=No AltrePP2008=No F_Gruppo2=0 3723 ==> Aggravati2017=No 3412 conf:(0.92)
Experiment 2.
Subset of aggravated patients (587 instances)
Best rules found:
- AltrePP2008=No 581 ==> Aggravati2017=Si 581 conf:(1)
- ClassiRp=0 440 ==> Aggravati2017=Si 440 conf:(1)
- Fumo2008=No 439 ==> Aggravati2017=Si 439 conf:(1)
- AltrePP2008=No ClassiRp=0 436 ==> Aggravati2017=Si 436 conf:(1)
- Fumo2008=No AltrePP2008=No 435 ==> Aggravati2017=Si 435 conf:(1)
- Sesso=M 332 ==> Aggravati2017=Si 332 conf:(1)
- F_Gruppo2=0 332 ==> Aggravati2017=Si 332 conf:(1)
- Fumo2008=No ClassiRp=0 332 ==> Aggravati2017=Si 332 conf:(1)
- Fumo2008=No AltrePP2008=No ClassiRp=0 330 ==> Aggravati2017=Si 330 conf:(1)
- Sesso=M AltrePP2008=No 329 ==> Aggravati2017=Si 329 conf:(1)
Experiment 3.
Cluster 0 (210 instances)
Best rules found:
- Ipertensione=Si 32 ==> Aggravati2017=Si 32 conf:(1)
- Ipertensione=Si Patologie2008=No 32 ==> Aggravati2017=Si 32 conf:(1)
- Ipertensione=Si F_Gruppo2=<65 31 ==> Aggravati2017=Si 31 conf:(1)
- Ipertensione=Si Patologie2008=No F_Gruppo2=<65 31 ==> Aggravati2017=Si 31 conf:(1)
- RCV=RMCV1 Diabete=No 29 ==> Aggravati2017=Si 29 conf:(1)
- RCV=RMCV1 Diabete=No PSPert=si 29 ==> Aggravati2017=Si 29 conf:(1)
- Ipertensione=Si PSPert=si 28 ==> Aggravati2017=Si 28 conf:(1)
- RCV=RMCV1 CHdl=M1 Diabete=No 28 ==> Aggravati2017=Si 28 conf:(1)
- RCV=RMCV1 Ipertensione=No Diabete=No 28 ==> Aggravati2017=Si 28 conf:(1)
- RCV=RMCV1 Diabete=No Patologie2008=No 28 ==> Aggravati2017=Si 28 conf:(1)
Experiment 4.
Cluster 4 (184 instances)
Best rules found:
- F_Gruppo2=0 130 ==> Aggravati2017=Si 124 conf:(0.95)
- PSPert=si F_Gruppo2=0 124 ==> Aggravati2017=Si 118 conf:(0.95)
- RCV=RMCV1 F_Gruppo2=0 110 ==> Aggravati2017=Si 104 conf:(0.95)
- RicovPert=no F_Gruppo2=0 110 ==> Aggravati2017=Si 104 conf:(0.95)
- PSPert=si 178 ==> Aggravati2017=Si 168 conf:(0.94)
- Fumo=No 148 ==> Aggravati2017=Si 139 conf:(0.94)
- Fumo=No PSPert=si 142 ==> Aggravati2017=Si 133 conf:(0.94)
- RicovPert=no 155 ==> Aggravati2017=Si 145 conf:(0.94)
- RCV=RMCV1 151 ==> Aggravati2017=Si 141 conf:(0.93)
- CHdl=F1 120 ==> Aggravati2017=Si 112 conf:(0.93)
The best rules identified in the cluster experiments allow us to better understand the characteristics of patients with aggravated conditions compared with those identified in the general dataset for Experiment 1.
5.4. Artificial Neural Network Results
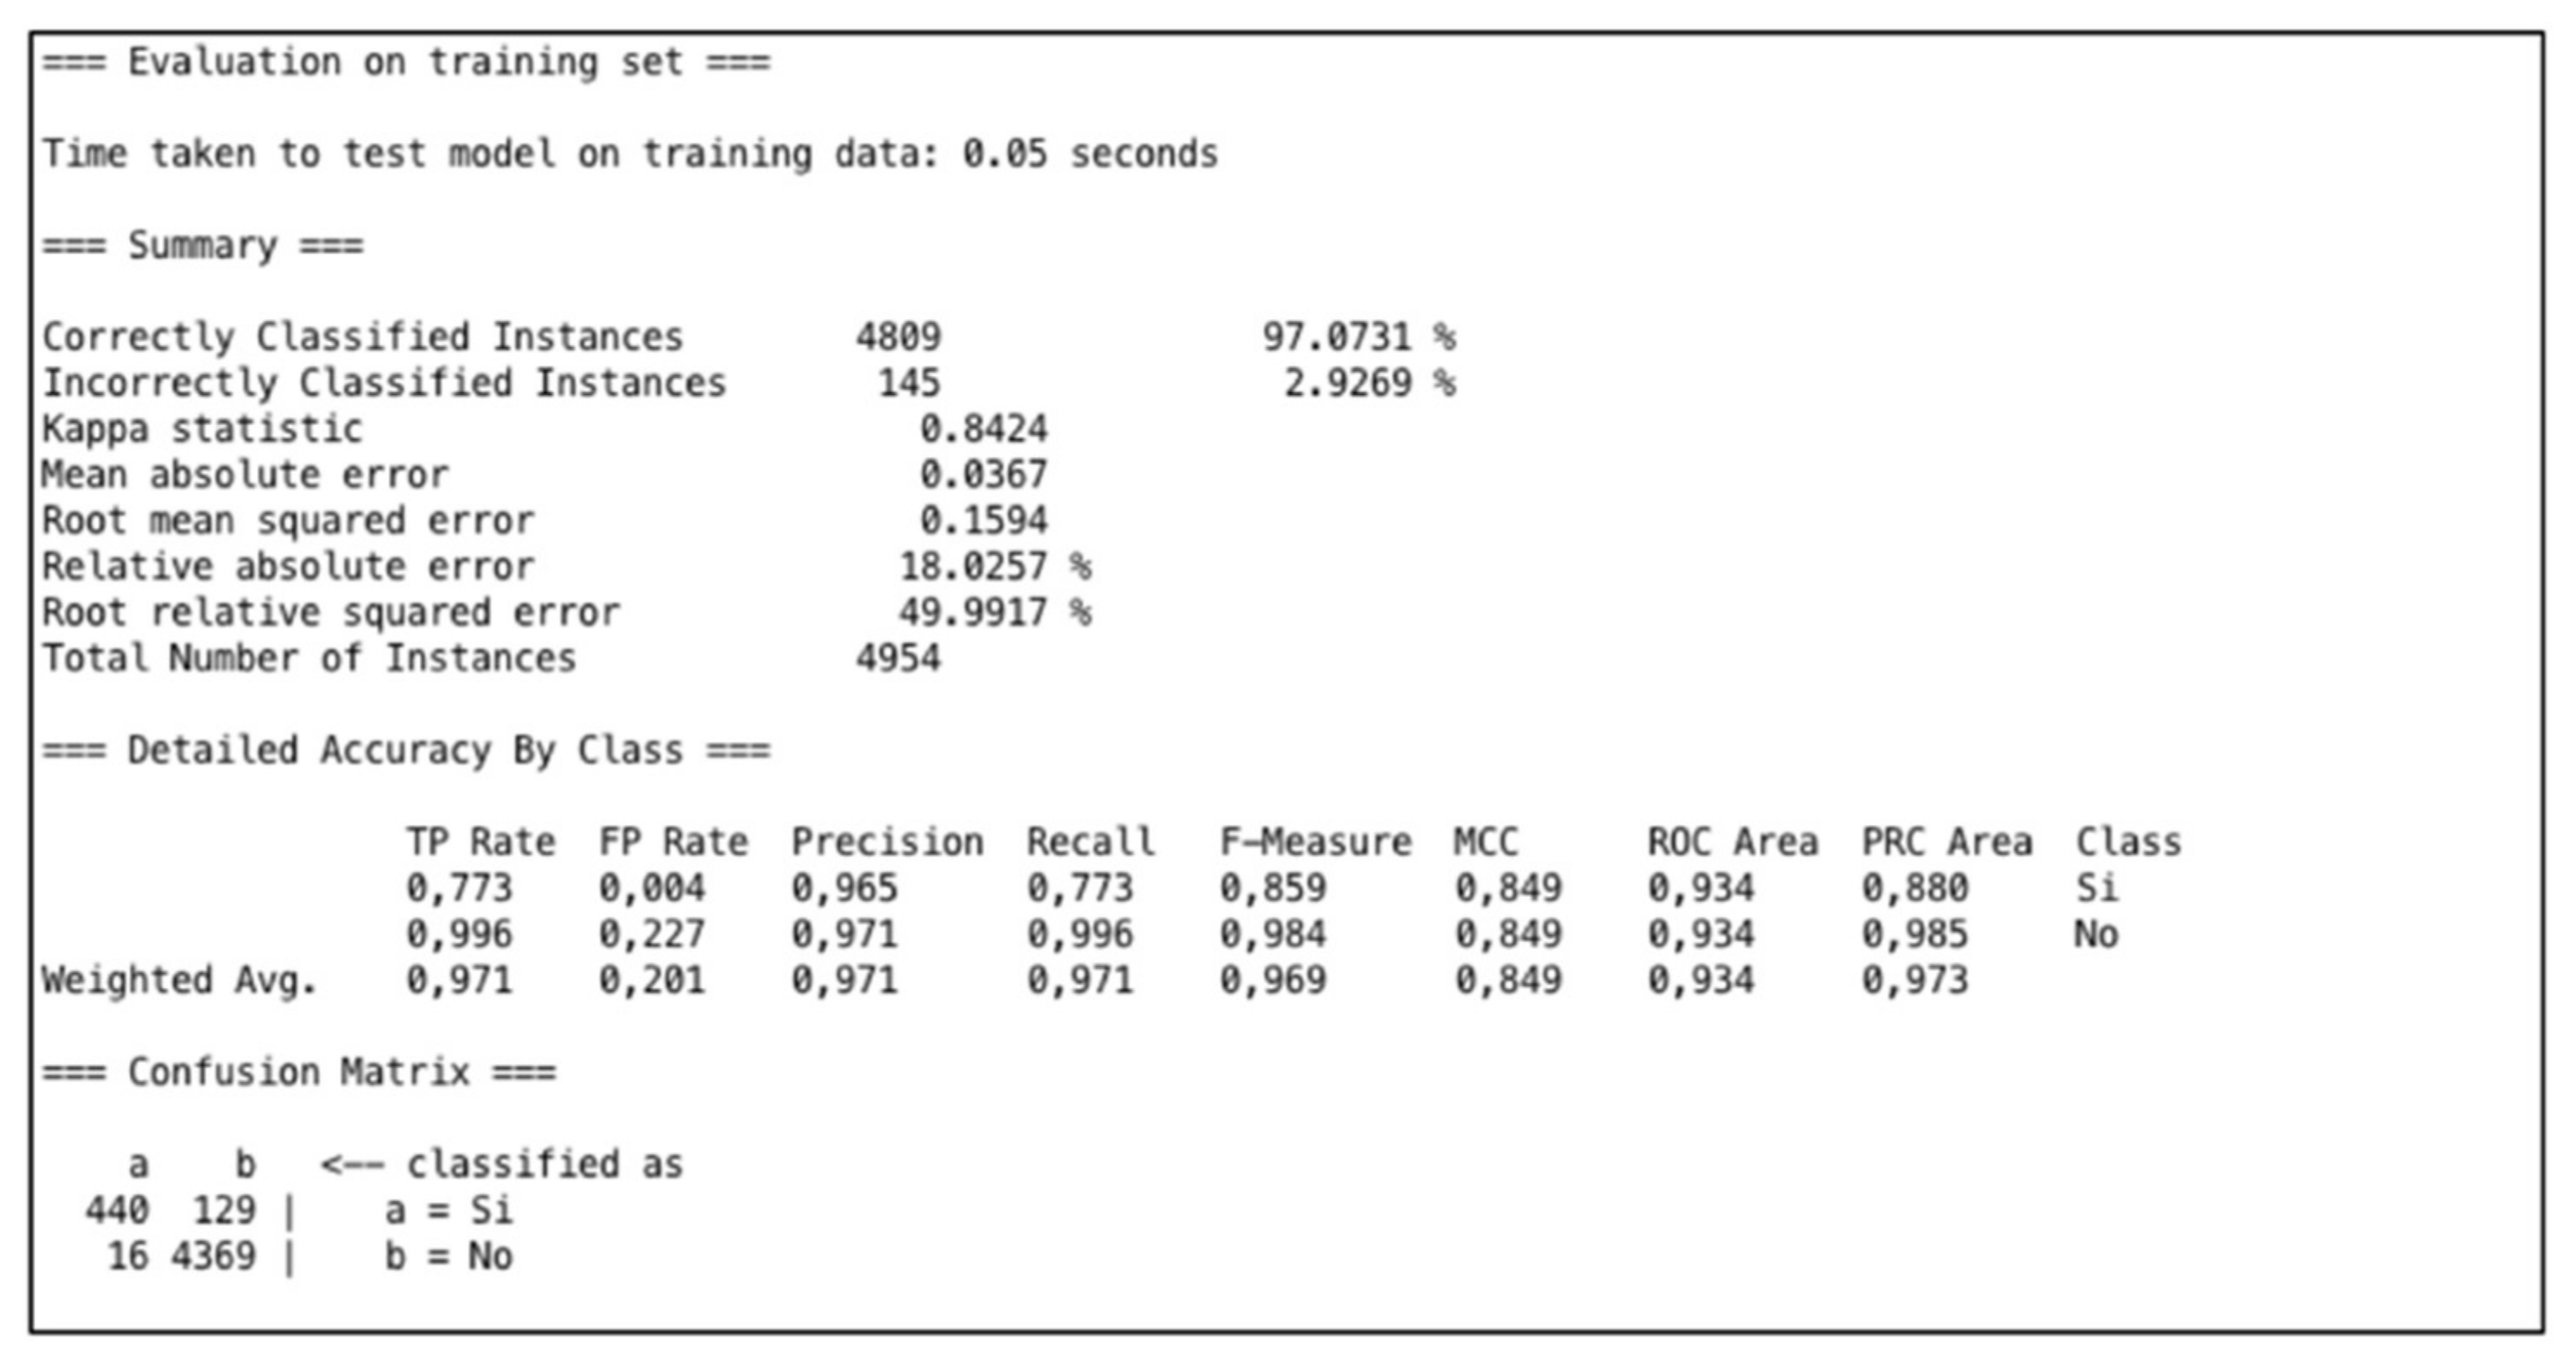
In Weka, we selected the “MultiLayerPerceptron” algorithm. We applied the algorithm with the goal of predicting the aggravation of patients’ conditions. The total number of patients with aggravated conditions after 10 years is 569 out of 4954 (patients with aggravated conditions are considered to be those who have developed at least one new pathology after 10 years). The optimal configuration for the network was made by setting the following parameters: learning rate L = 0.3, momentum M = 0.4, and number of epochs (training time) N = 1000. Figure 2 shows the best result from the application of the Multilayer Perceptron algorithm.
To analyze the performance of the several experiments executed, we evaluated the following measures: Kappa Statistic, Mean Absolute Error (MAE), and Root Mean Square Error (RMSE). The Kappa Statistic, or Cohen’s Kappa, is a statistical coefficient that represents the degree of accuracy and reliability between two sets of categorized data [31]. Kappa assumes values between 0 and 1, where 1 means that there is perfect accordance, while 0 means there is no accordance. Values of Kappa within the range of 0.40 to 0.59 are defined as moderate, 0.60 to 0.79 are substantial, and above 0.80 are outstanding [32]. In our case we have obtained an optimum Kappa statistic equal to 0.84; this means that the network is well trained. MAE is a statistical coefficient calculated as the sum of absolute errors divided by the number of predictions. It measures the nearness of the predicted model with respect to the actual model. In our case, we have MAE = 0.0367. RMSE is calculated as the square root of the mean squared error; thus, it evaluates the differences between values predicted by a model and the values really observed. Lower values of RMSE and MAE therefore mean better prediction and accuracy. In our case, we have an RMSE score of 0.15. Thus, this research work has proposed an approach for efficiently predicting the aggravation of patients’ conditions in terms of CVD risk. To validate this training, we repeated the experiment, applying two test options: “Percentage Split” and “K-Cross-validation”. In the first method, the prediction results are evaluated on a test set that is a part of the original data. The split is 66%, which means that 66% (3270) of the data go for training and the remaining 34% (1684) for testing. In this case, the Correctly Classified Instances numbered 1611 (95.66%) while the Incorrectly Classified Instances numbered 73 (4.33%); the K statistic in this case was 0.767. With K-cross validation, we set K = 10; this means that the original dataset is partitioned into ten equal size subsets. We employ 9 partitions for learning and leave 1 partition out for testing. The cross-validation process is then repeat 10 times, each time leaving a different partition for testing. In this case, the Correctly Classified Instances numbered 4702 (94.91%), while the Incorrectly Classified Instances numbered 252 (5.08%); the K statistic was 0.717. With both tests, the K statistic decreases, but remains in the range of optimal values (0.60–0.79); this means that the network is well trained.
6. Discussion
From the analysis of 5134 patient cases, we present our results according to the three distinct data exploration techniques of Clustering, Association rules, and Neural Networks. Clustering stratified the patient population into nine heterogeneous clusters divided by males and females, each with a precise characterization. Our results (see Figure 1) show that the clusters identified provide interesting, well-defined groups of patients. On the basis of the clusters obtained, it was possible to better understand the characteristics of patients who took more pharmaceutical drugs or who received more specialist medical services. We also identified the characteristics of patients who worsened compared to others; in particular, Cluster 0 and Cluster 4 are the two groups of patients whose condition was aggravated after 10 years. Cluster 0 is a group of male patients with an individual CVD score equal to Level 2 and age range of 53–62; also, compared to clusters of patients with the same age range, this group took fewer drugs. Cluster 4, instead, is a group of female patients with an individual CVD score equal to Level 1 and age range 43–52; compared with other clusters of female patients, this group is a group of hypertensive women patients. Starting with the clustering and with the information obtained, we further investigated this information through the association rules algorithm.
The associative rules allowed us to discover hidden relationships between attributes; for example, in Cluster 0 we found the rule “Ipertensione=Si Patologie2008=No F_Gruppo2=<65 ==> Aggravati2017=Si” (Hypertension = Yes, Pathologies2008 = No, ‘pharmacological drugs Groups2′ = <65 ==> Aggravated Patients 2017 = Yes), which allows us to better understand the characteristics of patients with aggravated conditions. If we had not applied clustering, we would not have had the appropriate subset (in this case, Cluster 0) in which to find this rule.
Finally, the results of the neural network (see Figure 2) allowed us to effectively predict new cases of condition aggravation; this can also provide decision support to assist doctors in making better clinical decisions and also to assist the managers of health organizations in predicting health spending.
In our future work, this can further be improved and developed. For predicting CVD risk, significant attributes are listed. We want to identify and incorporate other variables, besides those listed in heart study literature. According to local health organizations, we want to collect, for example, data on weight, sedentary lifestyle, and social context, which can lead to consideration of other data mining techniques to improve the results and to allow discovery of other useful information.
In addition, we want to apply this approach in the health context of chronic respiratory diseases (CRDs); CRDs are another health issue among the main causes of morbidity and mortality, and a growing trend in them is expected for the next years.
7. Conclusions
Business intelligence could be applied to a diversity of domains where there exist huge amounts of semantically rich data that need to be analyzed in order to provide useful knowledge. The knowledge gained could be used in several applications and contexts. In this paper, we combine different techniques of data exploration with the aim of extracting information and knowledge from a rich dataset in the healthcare context. The results were obtained according to three distinct perspectives—descriptive, local, and predictive—as follows: (1) the stratification of the patient population into nine patterns obtained through a descriptive method, represented by a clustering algorithm; (2) relationships between attributes identified in the general dataset and within clusters through a local method—the association rule algorithm; and (3) the prediction of patients with aggravated conditions through a predictive method, that is, the MLP algorithm. The techniques were useful for better understanding and discovery of new information from the results of another, since the extraction of knowledge leads to new information, which can, in turn, be used to obtain further and more detailed information. Clustering can be used to group the collected patients based on some specific criteria of similarity and heterogeneity. Then, an association rule mining algorithm can be applied to the obtained classes to detect the kinds of behavior related to each cluster. The application of Neural Networks provides an accurate prediction for the cases of condition aggravation by applying the predictive model to the records of incoming patients. The combination of Clustering techniques, Neural Networks, and Association Rules is an efficient strategy for information discovery and management of chronic disease, particularly in terms of CVD risk.
Acknowledgments
The authors would like to thank Health Organization of Salento (ASL Lecce) and, in particular, the manager Rodolfo Rollo, for making the data available and for the inspiring conversations.
Author Contributions
Both authors conceived and designed the experiments, and analyzed the data; Stefania Pasanisi performed the experiments and wrote the paper; Roberto Paiano modified and refined the manuscript.
Conflicts of Interest
The authors declare no conflict of interest.
References
- Paiano, R.; Pasanisi, S. A New Challenge for Information Mining. Broad Res. Artif. Intell. Neurosci. 2017, 8, 63–80. [Google Scholar]
- Di Blas, N.; Mazuran, M.; Paolini, P.; Quintarelli, T.; Tanca, L. Exploratory computing: A draft Manifesto. In Proceedings of the 2014 International Conference on Data Science and Advanced Analytics (DSAA), Shanghai, China, 30 October–1 November 2014; pp. 577–580. [Google Scholar]
- Kimball, R.; Ross, M. The Data Warehouse Toolkit: The Definitive Guide to Dimensional Modeling; John Wiley & Sons: Hoboken, NJ, USA, 2013. [Google Scholar]
- Berry, M.L.; Linoff, G. Data Mining Techniques: For Marketing, Sales, and Customer Support; John Wiley & Sons, Inc.: Hoboken, NJ, USA, 1997. [Google Scholar]
- Nambiar, R.; Bhardwaj, R.; Sethi, V.; Vargheese, R. A look at challenges and opportunities of big data analytics in healthcare. In Proceedings of the 2013 IEEE International Conference on Big Data, Silicon Valley, CA, USA, 6–9 October 2013; pp. 17–22. [Google Scholar]
- Zhang, Y.; Qiu, M.; Tsai, C.W.; Hassan, M.A.; Alamri, A. Health-CPS: Healthcare cyber-physical system assisted by cloud and big data. IEEE Syst. J. 2017, 11, 88–95. [Google Scholar] [CrossRef]
- Brittain, J.M.; MacDougall, J. Information as a resource in the National Health Service. Int. J. Inf. Manag. 1995, 15, 127–133. [Google Scholar] [CrossRef]
- Wang, Y.; Kung, B.; Byrd, T.A. Big data analytics: Understanding its capabilities and potential benefits for healthcare organizations. Technol. Forecast. Soc. Chang. 2018, 126, 3–13. [Google Scholar] [CrossRef]
- Gillespie, G. There’s gold in them thar’ databases. Health Data Manag. 2000, 8, 40–44. [Google Scholar] [PubMed]
- Koh, H.T.; Tan, G. Data mining applications in healthcare. J. Healthc. Inf. Manag. 2011, 19, 65. [Google Scholar]
- Milley, A. Healthcare and data mining. Health Manag. Technol. 2000, 21, 44–47. [Google Scholar]
- Meenal Baliyan, N.; Bassi, V. Towards Heart Disease Prediction Using Hybrid Data Mining. Master’s Thesis, Thapar Institute of Engineering & Technology Digital Repository (TuDR), Patiala, India, August 2017. [Google Scholar]
- Shouman, M.; Turner, S.; Stocker, R. Using data mining techniques in heart disease diagnosis and treatment. In Proceedings of the 2012 Japan-Egypt Conference on Electronics, Communications and Computers (JEC-ECC), Alexandria, Egypt, 6–9 March 2012; pp. 173–177. [Google Scholar]
- Srinivas, K.; Rani, B.G.; Govrdhan, A. Applications of data mining techniques in healthcare and prediction of heart attacks. Int. J. Comput. Sci. Eng. 2010, 2, 250–255. [Google Scholar]
- Srinivas, K.; Rao, G.G.; Govardhan, A. Rough-Fuzzy classifier: A system to predict the heart disease, by blending two different set theories. Arabian J. Sci. 2014, 39, 2857–2868. [Google Scholar] [CrossRef]
- Palaniappan, A.; Awang, R. Intelligent heart disease prediction system using data mining techniques. In Proceedings of the IEEE/ACS International Conference on Computer Systems and Applications, AICCSA 2008, Doha, Qatar, 31 March–4 April 2008; pp. 108–115. [Google Scholar]
- Chaurasia, V.; Pal, S. Early prediction of heart diseases using data mining techniques. Caribb. J. Sci. Technol. 2013, 1, 208–217. [Google Scholar]
- Karaolis, M.A.; Moutiris, J.A.; Hadjipanayi, P.; Pattichis, C.S. Assessment of the risk factors of coronary heart events based on data mining with decision trees. IEEE Trans. Inf. Technol. Biomed. 2010, 14, 559–566. [Google Scholar] [CrossRef] [PubMed]
- Zolfaghar, K.; Meadem, N.; Teredesai, A.; Roy, S.B.; Chin, S.M.; Muckian, B. Big data solutions for predicting risk-of-readmission for congestive heart failure patients. In Proceedings of the 2013 IEEE International Conference on Big Data, Silicon Valley, CA, USA, 6–9 October 2013; pp. 64–71. [Google Scholar]
- National Plan of Chronicity of the Italian Ministry of Health. 2013. Available online: http://www.salute.gov.it (accessed on 23 February 2018).
- Matrice Project. 2014. Available online: www.agenas.it/monitor35 (accessed on 23 February 2018).
- Risk Assessment, “The Cuore Project” by National Institute of Health. 1998. Available online: http://www.cuore.iss.it/eng/default.asp (accessed on 23 February 2018).
- Witten, I.H.; Frank, E.; Hall, M.P.; Pal, C.J. Data Mining: Practical Machine Learning Tools and Techniques; Morgan Kaufmann: Burlington, MA, USA, 2016. [Google Scholar]
- Giudici, P. Applied Data Mining: Statistical Methods for Business and Industry; John Wiley & Sons: Hoboken, NJ, USA, 2005. [Google Scholar]
- El-Halees, A. Mining Students Data to Analyze Learning Behavior: A Case Study. In Proceedings of the 2008 international Arab Conference of Information Technology (ACIT2008), Sfax, Tunisia, 15–18 December 2008. [Google Scholar]
- Nazeer, K.S.; Sebastian, M.P. Improving the Accuracy and Efficiency of the k-means Clustering Algorithm. In Proceedings of the World Congress on Engineering, London, UK, 1–3 July 2009; Volume I, pp. 1–3. [Google Scholar]
- Suresh, J.; Ramanjaneyulu, T. Mining Frequent Itemsets Using Apriori Algorithm. Int. J. Comput. Trends Technol. 2013, 4, 760–764. [Google Scholar]
- Agrawal, S.; Srikant, R. Fast algorithms for mining association rules. In Proceedings of the 20th International Conference on Very Large Data Bases, San Francisco, CA, USA, 12–15 September 1994; Volume 1215, pp. 487–499. [Google Scholar]
- Rosenblatt, F. Principles of Neurodynamics: Perceptrons and the Theory of Brain Mechanisms; Spartan Books: Washington, WA, USA, 1961. [Google Scholar]
- Rumelhart, D.E.; Hinton, G.W.; Williams, R.J. Learning Internal Representations by Error Propagation; James McClelland, L., Rumelhart, D.E., Eds.; Parallel Distributed Processing; MIT Press: Cambridge, MA, USA, 1987; pp. 318–362. [Google Scholar]
- Melville, P.; Yang, S.M.; Saar-Tsechansky, M.; Mooney, R. Active learning for probability estimation using Jensen-Shannon divergence. In Proceedings of the European Conference on Machine Learning, Porto, Portugal, 3–7 October 2005; Springer: Berlin/Heidelberg, Germany, 2005; pp. 268–279. [Google Scholar]
- Landis, J.R.; Koch, G.G. The measurement of observer agreement for categorical data. Biometrics 1977, 33, 159–174. [Google Scholar] [CrossRef]
Figure 1.
SimpleKMeans results.

Figure 2.
Results of Multilayer Perceptron Algorithm.


Table 1.
Distribution of cardiovascular disease (CVD) risk classes.
| CVD Risk Class | Score | No. |
|---|---|---|
| CVD1 | <5% | 3414 |
| CVD2 | 5–10% | 931 |
| CVD3 | 10–15% | 391 |
| CVD4 | 15–20% | 195 |
| CVD5 | 20–30% | 143 |
| CVD6 | >30% | 60 |
Table 2.
Disease distribution.
| Disease | Yes | No |
|---|---|---|
| diabetes | 465 | 4669 |
| hypertension | 1686 | 3448 |
| cardiac disease | 682 | 4452 |
| cardio-circulatory disease | 104 | 5030 |
| other CV disease | 26 | 5108 |
Table 3.
New diagnoses of diseases within 10 years of patients’ enrollment.
| Disease | New Diagnoses | Total |
|---|---|---|
| diabetes | 135 | 600 |
| hypertension | 54 | 1740 |
| cardiac disease | 338 | 1020 |
| cardio-circulatory disease | 413 | 517 |
| other CV disease | 36 | 62 |
© 2018 by the authors. Licensee MDPI, Basel, Switzerland. This article is an open access article distributed under the terms and conditions of the Creative Commons Attribution (CC BY) license (http://creativecommons.org/licenses/by/4.0/).
Share and Cite
MDPI and ACS Style
Pasanisi, S.; Paiano, R. A Hybrid Information Mining Approach for Knowledge Discovery in Cardiovascular Disease (CVD). Information 2018, 9, 90. https://doi.org/10.3390/info9040090
AMA Style
Pasanisi S, Paiano R. A Hybrid Information Mining Approach for Knowledge Discovery in Cardiovascular Disease (CVD). Information. 2018; 9(4):90. https://doi.org/10.3390/info9040090
Chicago/Turabian StylePasanisi, Stefania, and Roberto Paiano. 2018. "A Hybrid Information Mining Approach for Knowledge Discovery in Cardiovascular Disease (CVD)" Information 9, no. 4: 90. https://doi.org/10.3390/info9040090
Note that from the first issue of 2016, this journal uses article numbers instead of page numbers. See further details here.