#europehappinessmap: A Framework for Multi-Lingual Sentiment Analysis via Social Media Big Data (A Twitter Case Study)


Department of Management Information Systems, Bogazici University, 34470 Istanbul, Turkey
*
Author to whom correspondence should be addressed.
Information 2018, 9(5), 102; https://doi.org/10.3390/info9050102
Submission received: 9 March 2018
/
Revised: 2 April 2018
/
Accepted: 20 April 2018
/
Published: 24 April 2018
(This article belongs to the Section Information Theory and Methodology)
Abstract
:The growth and popularity of social media platforms have generated a new social interaction environment thus a new collaboration and communication network among individuals. These platforms own tremendous amount of data about users’ behaviors and sentiments since people create, share or exchange their information, ideas, pictures or video using them. One of these popular platforms is Twitter, which via its voluntary information sharing structure, provides researchers data potential of benefit for their studies. Based on Twitter data, in this study a multilingual sentiment detection framework is proposed to compute European Gross National Happiness (GNH). This framework consists of a novel data collection, filtering and sampling method, and a newly constructed multilingual sentiment detection algorithm for social media big data, and tested with nine European countries (United Kingdom, Germany, Sweden, Turkey, Portugal, The Netherlands, Italy, France and Spain) and their national languages over a six year period. The reliability of the data is checked with peak/troughs comparison for special days from Wikipedia news lists. The validity is checked with a group of correlation analyses with OECD Life Satisfaction survey reports’, Euro-Dollar and other currency exchanges, and national stock market time series data. After validity and reliability confirmations, the European GNH map is drawn for six years. The main problem addressed is to propose a novel multilingual social media sentiment analysis framework for calculating GNH for countries and change the way of OECD type organizations’ survey and interview methodology. Also, it is believed that this framework can serve more detailed results (e.g., daily or hourly sentiments of society in different languages).
1. Introduction & Literature Review
The rise of social broadcasting technologies has led to open data access for researchers. Most of the popular social media platforms allow researchers to collect valuable public data for free and to conduct studies based on those data [1,2]. Also, the use of social media has diffused widely in society with recent statistical data showing high penetration rates [3,4,5,6]. As it is mentioned by Quan-Haase and Young [7] users tend to embrace new media and adopt them as part of their communication repertoire. To some degree this is an advantage at the current stage of studying social media, as it leaves much room for exploring approaches to address research questions [8,9]. These studies are inspiring about the social media and big data analysis concepts, then, to this respect, a deep literature review was done on social media and big data analysis concepts at the beginning of this study. First of all, common and popular social media platforms and the studies about them were investigated. Then, chronological trending topics analysis was done. The results showed that although 50% of the users of Twitter are from the Asia Pacific region, when the ratios of users to country populations are examined, Twitter is in fact mostly used in European and North American countries (https://www.statista.com/statistics/303684/regional-twitter-user-distribution/). Also, it has been the most available data source for the social media researchers due to its related Application Programming Interfaces (APIs) that make it easy to collect data. After discussing social media studies, a common trend on user generated content analysis was detected and also was seen that sentiment analysis on these platforms is an emerging topic. Thus, Twitter sentiment analysis studies in the literature were deeply analyzed. Specifically, the following ideas for this study can be summarized from the literature review as follows:
- Data collection methods have not been mentioned in the studies. Generally, researchers mention the collected data but not how to collect.
- Generally English language used in the studies. Also, if English is not used, then researchers use only one dictionary and analyze only one language and one country.
1.1. Cultural Well-Being and Life Satisfaction Studies
Since the sentiment analysis on social media has been found a trending topic among information systems and cyber-psychology researchers [21,22,23], this study aims to focus on this topic. However, analyzing public sentiments is not a new methodology for scientist. Thus, a deep literature review was done on cultural well-being and life satisfaction studies to find out general tendency and possible contribution areas. As a result of the analysis of cultural well-being, cultural differences and life satisfaction studies, it can be concluded that this kind of studies are generally made with survey [24,25,26,27], interviews and other types of qualitative methods [27,28,29]. On the other hand, social media sentiment analysis studies have a tendency to be popular in the literature. Combining these two type of studies, it is believed that, a multicultural and multidimensional study, which compares and contrasts the cultural and lingual differences, would contribute to information systems and social sciences literature. Moreover, if a novel methodology for data collection and analysis can be conducted, this framework can be useful for not only social media analysis but also for researchers working on social media.
1.2. Ethics on Social Media Studies
The last part of the literature review is about ethical issues. Actually, the ethical aspects of using social media data for researches are still not clearly defined even though the structure of the data is publicly available. Related to ethical issues, it is seen that six studies [30,31,32,33,34,35] were approved by their authors’ corresponding Institutional Review Boards (IRB) and five [34,36,37,38,39] received consent from participants prior to data analysis. However, Youyou, et al. [40] stated that IRB approval is not essential for using the data. Similarly, in their study, Chancellor, et al. [41] did not collect IRB approval, because their study used Instagram data without personally identifiable information. In addition, several studies [32,42,43,44,45] showed that, anonymizing user profile data is another method for this kind of social media studies. For instance, changing the names and usernames in tweets with other texts is a method of anonymization [42,44,46]. Based on these studies, it can be stated that, there is still not a common approach for handling ethical issues among researchers.
It is obvious that this issue is still unstable and fuzzy [47], but in order to contribute social media studies and science itself, public data should be used for scientific manner. Thus, the best approach to reducing the ethical issues of accessing to and using personal information is to anonymize the collected data sets and filtering the result to state a common (public) result (e.g., Gross National Happiness—GNH).
1.3. Results of Literature Review
To conclude, a deep literature review was conducted in this study to discover trending topics, possible contributions of the related studies and their future recommendations to form a basis for the research of this study. Therefore, to the best of authors’ knowledge, it can be concluded that;
- There is not a multi-lingual framework for Twitter sentiment analysis.
- Lexicon-based (dictionary-based) sentiment analysis is still most popular instead of machine learning, classification and clustering.
- Multicultural comparison of social media data on sentiment analysis has not been done yet.
- Data collection is the least mentioned part in articles, while proposing a novel method for this issue can be very supportive for the academics.
- The user Twitter features such as follower count, friends count, Twitter age, number of Tweets have not been taken into account yet in terms of possible relations of them.
- Whereas business effect and value are mentioned in several studies, the result of a multicultural sentiment analysis and GNH map of a continent have not considered by the researchers yet.
- Some of the dictionaries aimed to be used in this study are mentioned in some studies but have not been used all together yet (possibly because of huge work requirement).
- Big data studies are becoming very popular on sentiment analysis but have not been defined well yet.
- English is very popular and people usually use the LICW dictionary, but except for a few local small scale studies, other languages have not been examined with big data analysis to detect sentiments.
- Validation and accuracy of findings is not a concept for sentiment analysis studies while it should be.
- Anonymizing users’ information, converting the info with other texts and filtering out results to conclude a general result are the frequent methods for ethical consideration on social media studies.
2. Research Questions and Scientific Value
The main research question stated for this study is:
“Is the social media big data appropriate for the sentiment analysis (instead of surveys or interviews) to draw a happiness map of Europe?”
Moreover, combining with “designing a social media big data sentiment analysis algorithm” for the aim of the study the following objective is stated:
“To design, develop, implement and evaluate a framework for multi-lingual sentiment analysis via social media big data for calculating Gross National Happiness (GNH) levels of European Countries”
In the way of main purpose, sentiment analysis framework is implemented for determining the happiness polarities of European citizens through answering the following four research questions:
- Is there face validity when the polarities determined by sentiment analysis framework are compared with Stock Market Index and Exchange Rates?
- Is there convergent validity when the GNH results of the sentiment analysis framework and GNH survey results of Organization for Economic Cooperation and Development (OECD) report are compared?
- Is there data reliability when the peaks/troughs of the graphs of sentiment analysis framework are compared with specific dates obtained from news archives?
- What are the GNH polarities of European countries in accordance with the proposed Twitter sentiment analysis framework?
The first two questions are about the validation and third question is about the reliability of sentiment detection algorithm and social media data collection and filtering methodology (social media data analysis framework at all). The last is for exploring the GNH polarities of related countries.
3. Materials and Methodology
Ferraro [48] defines the term “framework” as; “in general, a framework is a real or conceptual structure intended to serve as a support or guide for the building of something that expands the structure into something useful”. In addition, according to Duncan [49] a framework may be for a set of functions within a system and how they interrelate. Combining these, a framework is generally more comprehensive than a protocol and more prescriptive than a structure. Thus, the original scientific contribution of this study is intended to “propose an integrated framework (not only an opinion mining algorithm but also data collection and sampling techniques) via social media big data analysis for sentiment calculation”. In addition to all the sequences of this proposed integrated framework (design, development, implementation and evaluation), a unique data collection methodology and a purposive sampling technique for the sentiment analysis social media big data are proposed as demonstrated in the following subsections.
3.1. Design of Sentiment Analysis Algorithm
As an emerging and promising research area, text mining for sentiment analysis has been extensively studied [50,51,52,53], where sentiment analysis is used for text classification tasks [54,55]. Li and Wu [56] summarize that existing sentiment calculation approaches fall into two types: machine learning-based approaches [51,52] and semantic orientation based approaches [52,53,57]. While text sentiment analysis is very popular, the literature has a big gap on multicultural and multilingual studies.
Moreover, in the literature, sentiment analysis studies can be grouped into two main categories: “supervised” and “unsupervised”. The pre-defined words and their polarities are used in one, on the other hand, the other classifies the most frequent words and drives a dictionary with them. However, Thelwall, et al. [58] state that similar results and accuracy rates are achieved from those two methods, since big data eliminates the noise of data and extreme cases which cause the differences between those two methods. Due to these facts, predefined dictionaries are used in this study instead of creating new dictionaries from the data set, which would possibly take the progress, workload and timeline of the project to unmanageable levels.
Also, it is stated by Thelwall, Buckley and Paltoglou [58] that dual output for the sentiment analysis of blogging short texts concludes more accurate results. Therefore, the polarity of the tweets in the algorithm is better to be calculated not in one (binary classification) dimension but in two dimensions (positive, negative).
The language dictionaries for the algorithm is taken from a short text sentiment analysis tool (SentiStrength) created by Thelwall, et al. [59]. This tool was developed for short text analysis and is still on testing phase due to accuracy concerns. The sentiment dictionaries of this study are found to be appropriate for our study since some of the dictionaries were previously tested with different platforms for single language studies [60,61,62,63,64,65,66,67].
Additionally, Pfitzner, et al. [68] conclude that the sentences ending with a “question mark (?)” should not be included in sentiment analysis. Because those texts do not represent the feelings of the people who write them. To this end, in this study the tweets ending with or including “question mark” are removed in the algorithm.
In addition to these common text sentiment analysis concepts, which are used by different social median platforms than Twitter (blogs, Facebook etc.) in different languages, it is a well-known fact that limiting the polarity scale for analyzed texts in a range (e.g., −5 to +5) is appropriate for balancing the standard deviation of total (or filtered) score.
Moreover, Rudra, et al. [69] state that idioms usage in Twitter is 9% and this percentage would increase from 21.88% (in mentioned network user groups) to 49.57% (in subscription network user groups). Thus, since the dictionaries of the algorithm include idioms, idiom looking up operations are embedded in the proposed algorithm to increase the validity and accuracy.
Lastly, the booster and negating words have an effect on the polarities of the neighbor words. Therefore, this calculation is included in the algorithm, too.
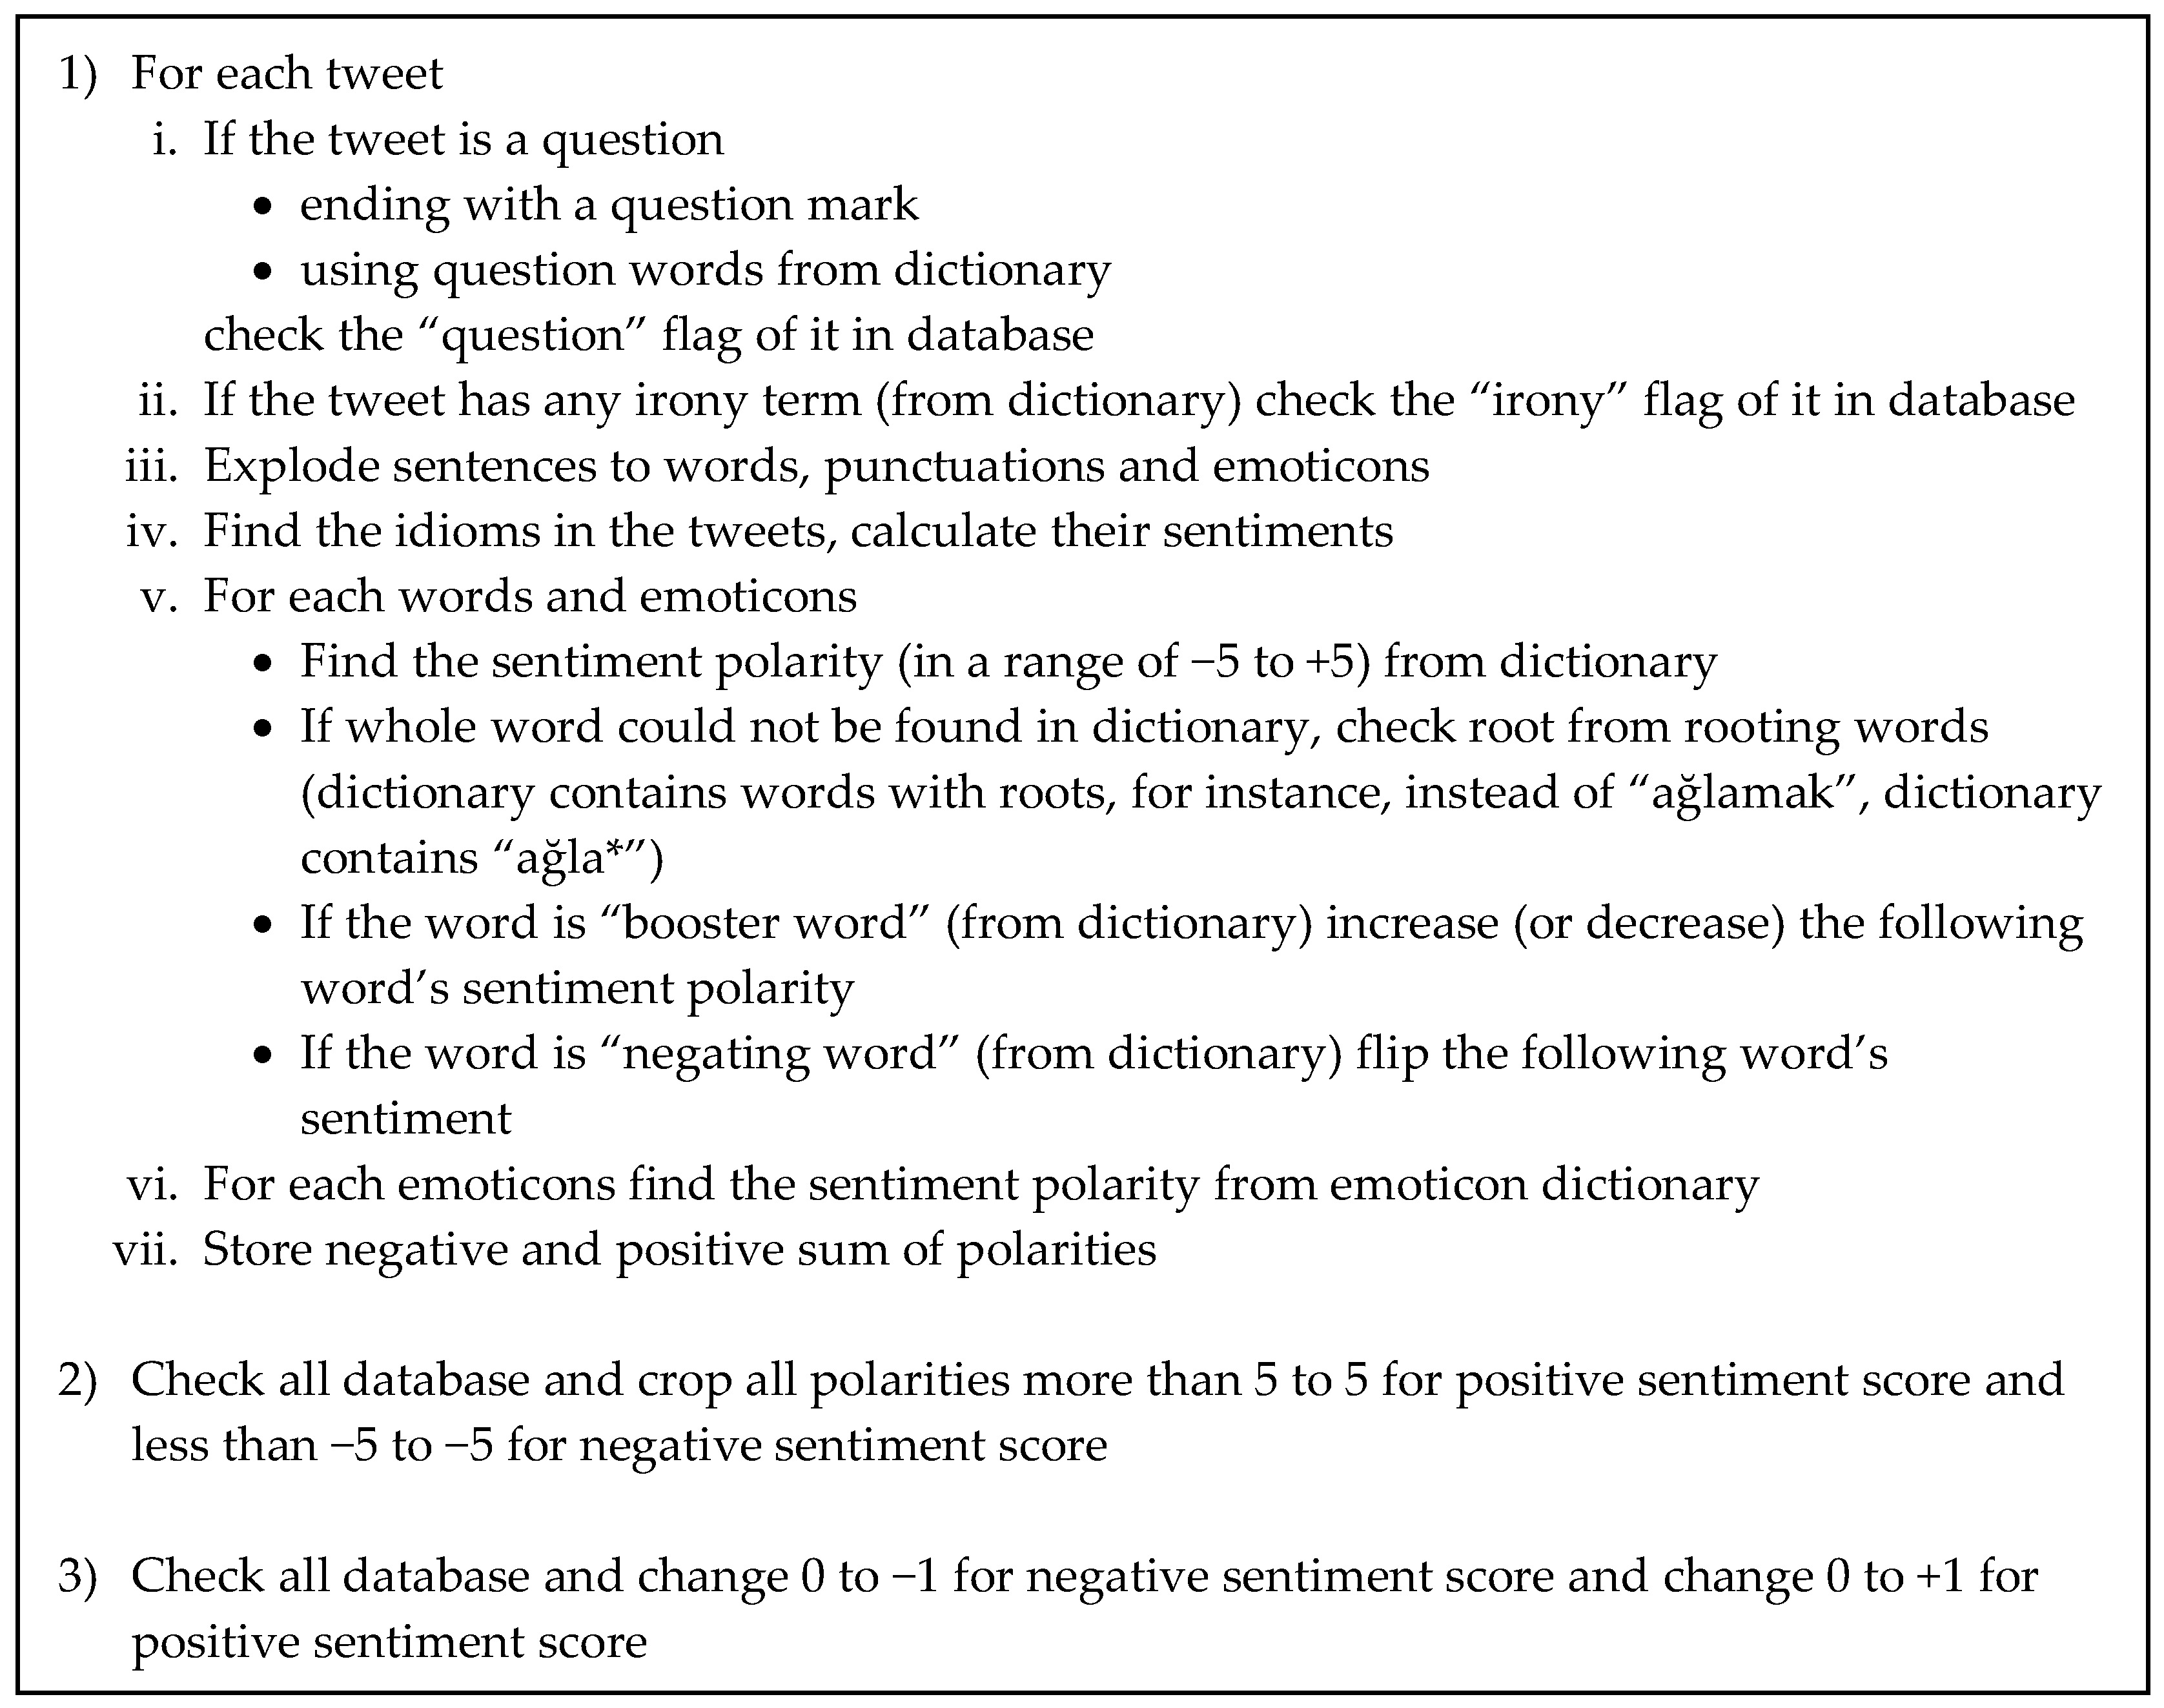
As a conclusion of these sentiment analysis literature survey and using the text mining dictionaries a new sentiment analysis algorithm was developed as shown with pseudocodes in Figure 1.
3.2. GNH Calculation for Countries
In the second half of the 20th century, Bhutan, as a South Asian country stated that “Gross National Happiness is more important than Gross National Product (GDP)” and started a visionary study at the governmental (kingdom) level for calculating GNH [70]. This country level work can be accepted as the first GNH dominated study under United Nations, because the previous studies were mainly based on GDP. Therefore, since social media can be defined as a screaming platform for society to define public feeling, the idea of “a country level happiness measurement methodology can be defined and tested via social media big data” inspired this study. For the calculation of GNH for European calculation, a unique (but combined by a deep literature survey) algorithm was created.
3.3. Gross National Happiness Calculation Algorithm
Big data of this proposed social media analysis framework constitutes of daily tweets of the users coming from chosen countries (filtering options is explained in related section). GNH of each country is calculated by considering the daily tweets’ happiness polarities of the users of the related country; therefore, for GNH Calculation in Tweets Domain (GNH-TD) operation, tweets of users are analyzed in terms of their polarities. For GNH Calculation in Tweets Domain (GNH-TD) operation, tweets of users are analyzed in terms of their polarities. In his novel GNH study, Kramer [71] used a Linguistic Inquiry and Word Count (LIWC) dictionary, and stated that this dictionary has different number of positive and negative words (and also their polarities are different at total). Thus, it is claimed that the potential for positive and negative word use is not equivalent. To cope with this problem and to generate a metric that is interpretable independent of language and dictionary, adapting from Kramer [71], the idea of “how much standard deviation away from mean?” is used in the GNH-TD algorithm. The proposed GNH-TD calculation algorithm is shown in Figure 2.
3.4. Design of Social Media Big Data Collection Method
The proposed sentiment calculation algorithm for social media texts is intended to be used for measuring GNH for countries. On the other hand, the proposed framework which is uniquely designed for this study is not only composed of only sentiment calculation algorithm (GNH-TD) but also includes a novel social media big data collection technique which is designed to be used for Twitter platform. This method consists of three main steps. These steps are defined in the following part.
3.5. Accessing and Collecting Trend Topics (TT)
In their study, Zheng, et al. [72] discussed the location prediction methods on Twitter researches. They state that possible methods for location based studies can be as listed below:
- Accepting users’ self-declared profiles for location
- Aggregating geo-tags attached with users’ tweets
- Choosing the most frequent city involved in the geotags
- Choosing the first valid geotag, and convert it to an administrative region, a cell, or coordinates
- Choosing the geometric median of the geo-tags
In addition to these, due to possible privacy concerns, empty and noisy information also appear in user profiles. Therefore stating a location and accessing users (public) of that location is not a proper way. Also, if the research is about GNH calculation for a country, collecting users from Twitter who are from a specific country is not directly applicable with Twitter APIs. Similarly, although Twitter allows programs and devices to state geo-codes while publishing their tweets, the ratio of this geo-code usage is very low [73]. Due to this fact, collecting tweets and classifying them in terms of their possible geo-codes is not appropriate and efficient method. Instead, a complex but more efficient and valid method is be designed in data collection phase of proposed framework.
As it is well known, Twitter provides APIs that allow developers, researchers and practitioners to collect data relevant to their studies at no cost. Twitter allows programmers to utilize those APIs which can be classified in terms of their objectives as: (a) REST API, which is popularly used for designing web APIs to use pull strategy for data retrieval; and (b) Streaming API, which is used for continuous stream of public data with a push strategy. At this point, REST API method is advised to be used to collect data.
In order to gather a sample of active users, since it cannot be directly accessed with a single REST API, a TT search API (“GET trends/place”) is suggested to be executed. This TT API works for different weeks for random sampling. Executing this API within the limit (100 APIs/h) and from each executions, gathering 10 trend topics together with their characteristics, a dataset of approximately 300 unique trend topics (hashtags) for each country are intended to be collected using their “where on Earth identifier” (woeid). The data includes the following features;
- TT name,
- TT created at,
- TT search query,
- TT URL values.
3.6. Accessing Users from TT and Filtering Bot (Automatic) Accounts
Collecting TT for a given “woeid”, TT search query feature is advised to be used in “GET search /tweets” API to get 200 recent tweets about each TT. This API would help to collect tweets and unique users’ features of those tweets. The following variables can be stored for each user account using the “json” format of the API.
- Account ID
- User name
- Screen name
- Number of followers
- Number of friends (followees, number of people s/he follows)
- Number of tweets
- Number of “favorited” tweets
- Account description
- Language
- Account creation time
After accessing the users and storing the account information of them, filtering phase begins. One of the most problematic issues in big data collection methodologies is detecting and filtering bot accounts (automatic—computer controlled—accounts used for publishing tweets with commercial or political purposes). In the proposed framework, eliminating the accounts (users) whose number of tweets are 2 standard deviations away from the mean of the users from that country is used to cope with this problem. Also, private accounts whose tweets cannot be collected via related APIs should be dropped from resultant dataset before the tweets collecting phase. This process is also important for ethical constraints in social media researches. Thus, filtering out private accounts is embedded to the framework.
3.7. Collecting Tweets of Chosen Users
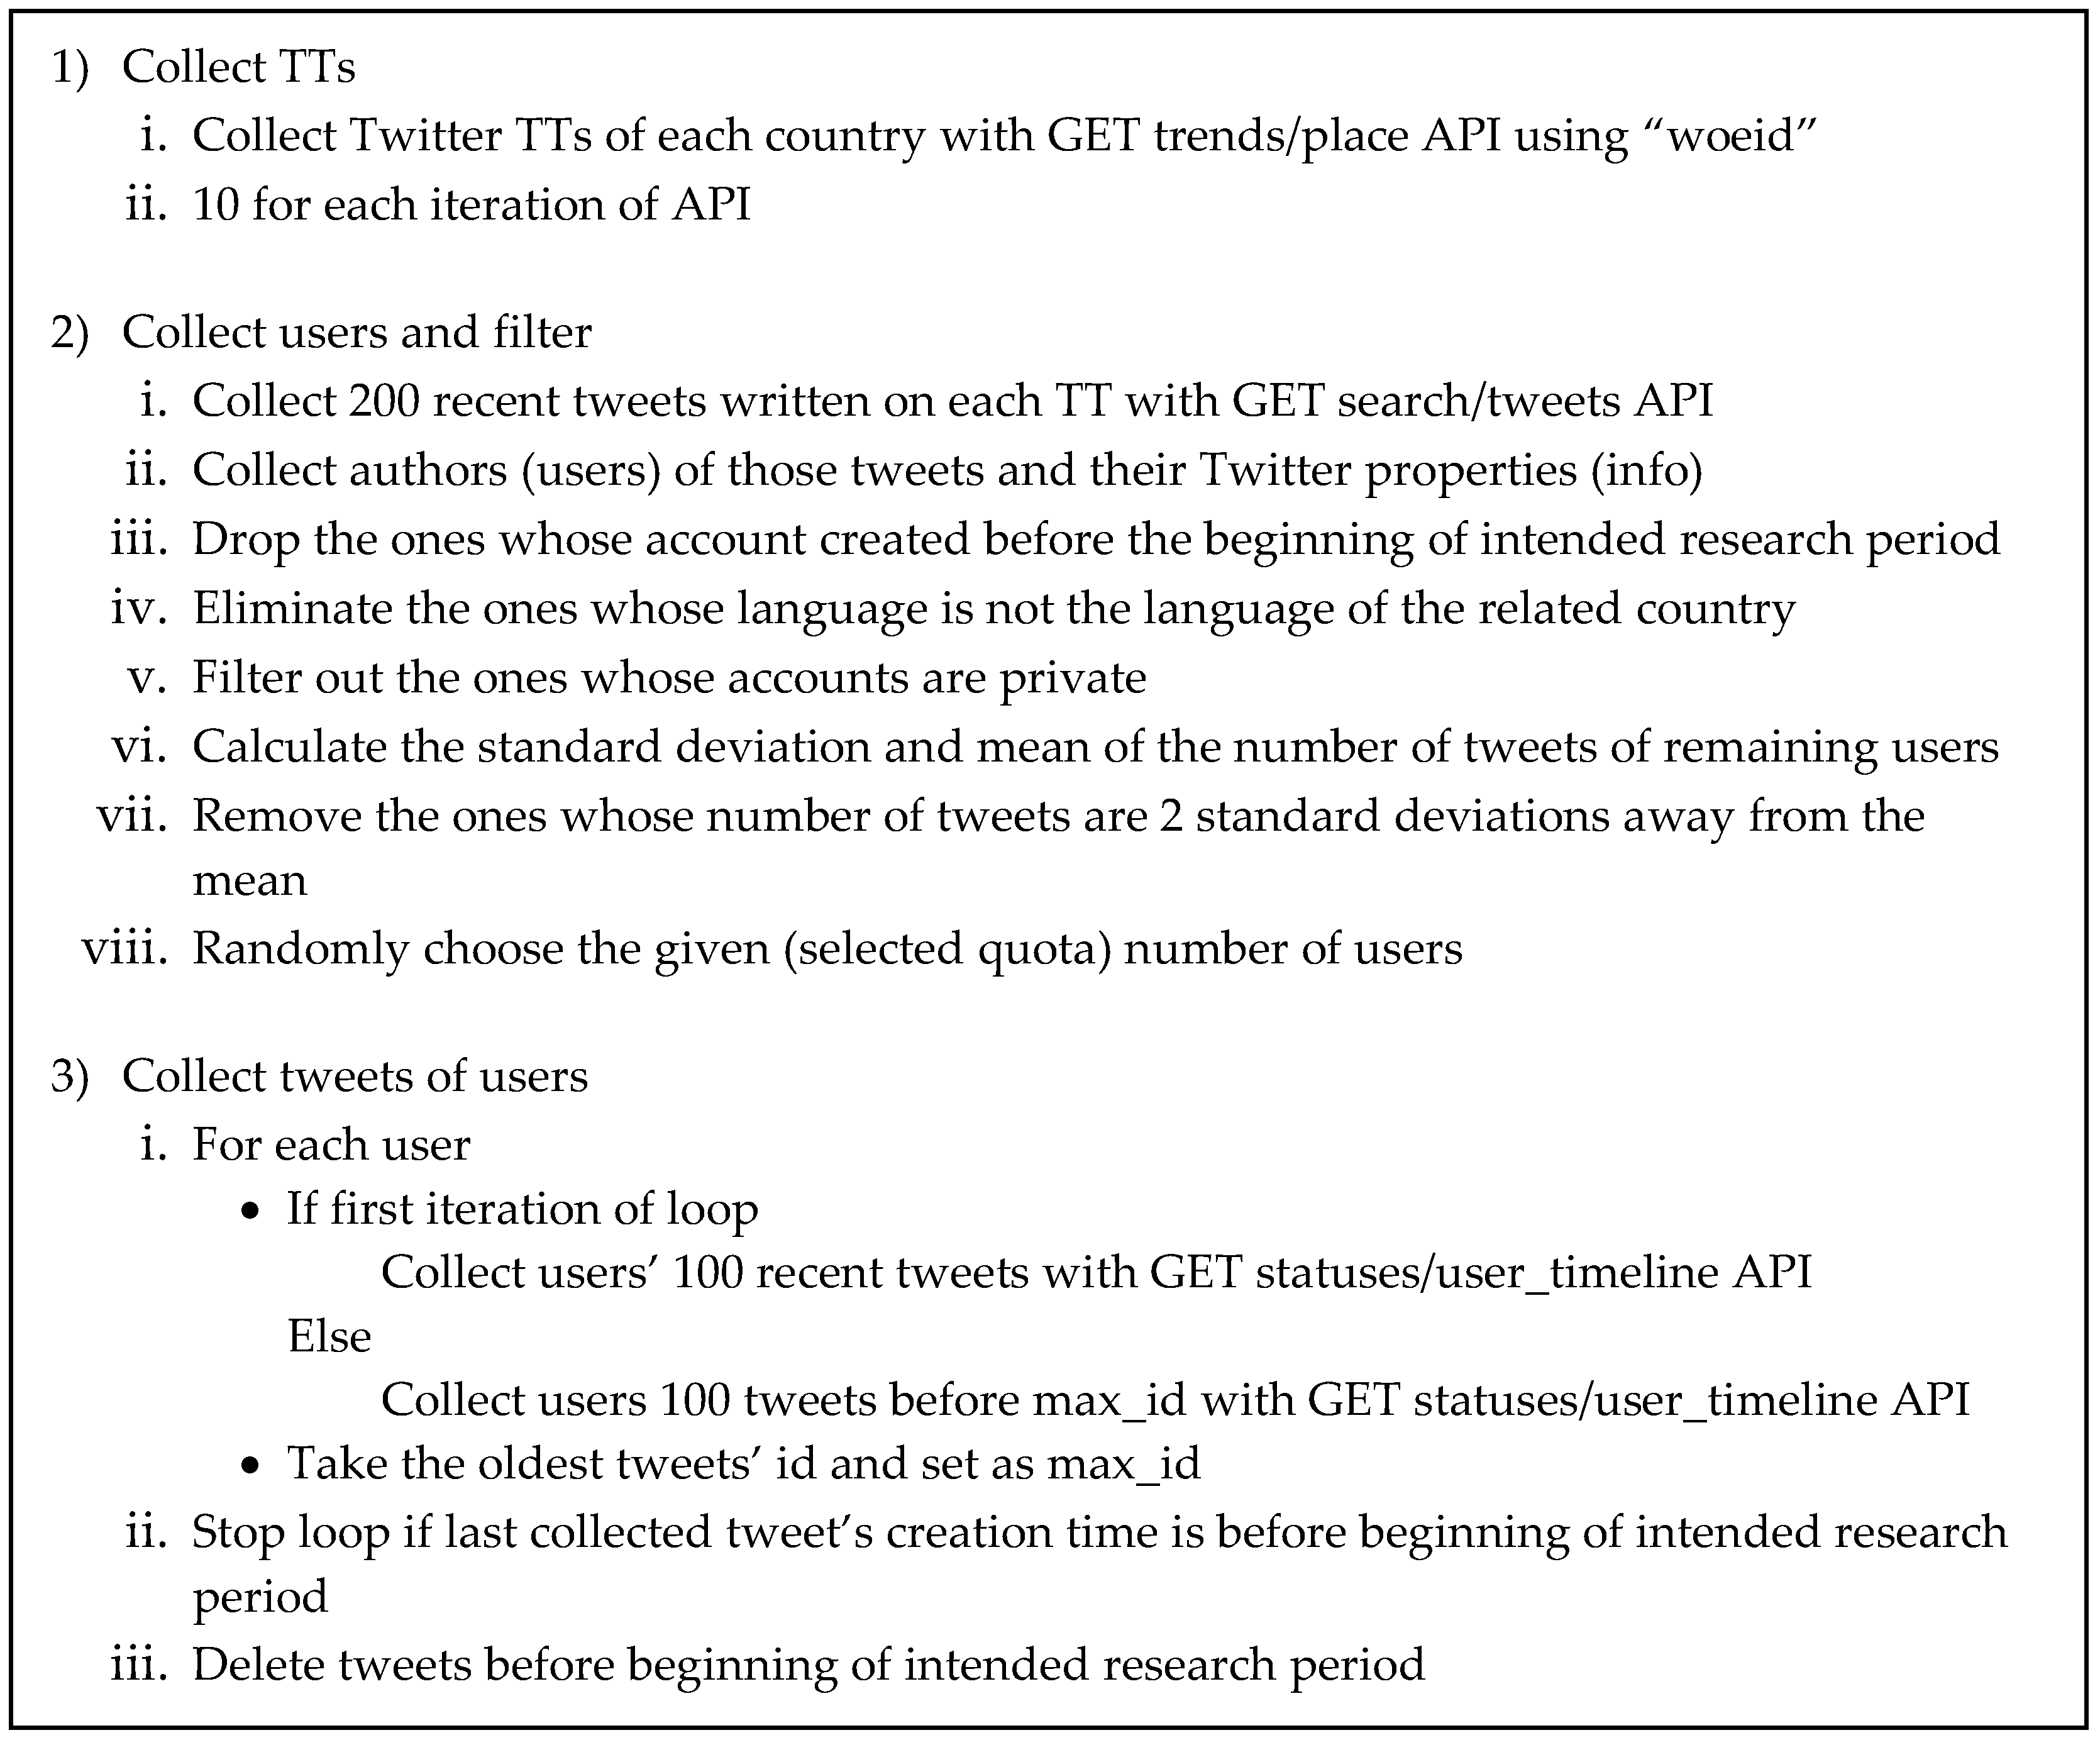
The last phase of the social media data collection part of the framework is collecting users’ tweets. Tweets of the sample users can be gathered by “GET statuses/user_timeline” API. But, since this API is limited to 100 most recent tweets, a back-iterative API which executes with “max_id” option should be applied. In this method, firstly users’ last 100 tweets are collected. Then, the id of the last tweet is taken and it is given to the “GET statuses/user_timeline” API as “max_id” parameter for collecting last 100 tweets before the one whose id is this max_id. Figure 3 summarizes the social media data collection phase of proposed framework in pseudocodes.
4. Implementation and Evaluation of the Framework
4.1. Choosing Countries for Sample and Collecting Tweets
According to the official web site of the European Union (EU), www.europa.eu, the EU is a unique economic and political partnership among 28 European countries that together cover much of the continent. In addition to those 28 member countries, there are seven candidate and two potential candidates. Since the main aim of this study is to draw a happiness map of European citizens with multilingual sentiment analysis framework of Twitter data, the main criteria for choosing a country for the framework are set as follows:
- the country should be open to Twitter usage with no bans or censorship
- there should be only one national language spoken within the country and that language must exist in our sentiment analysis dictionaries.
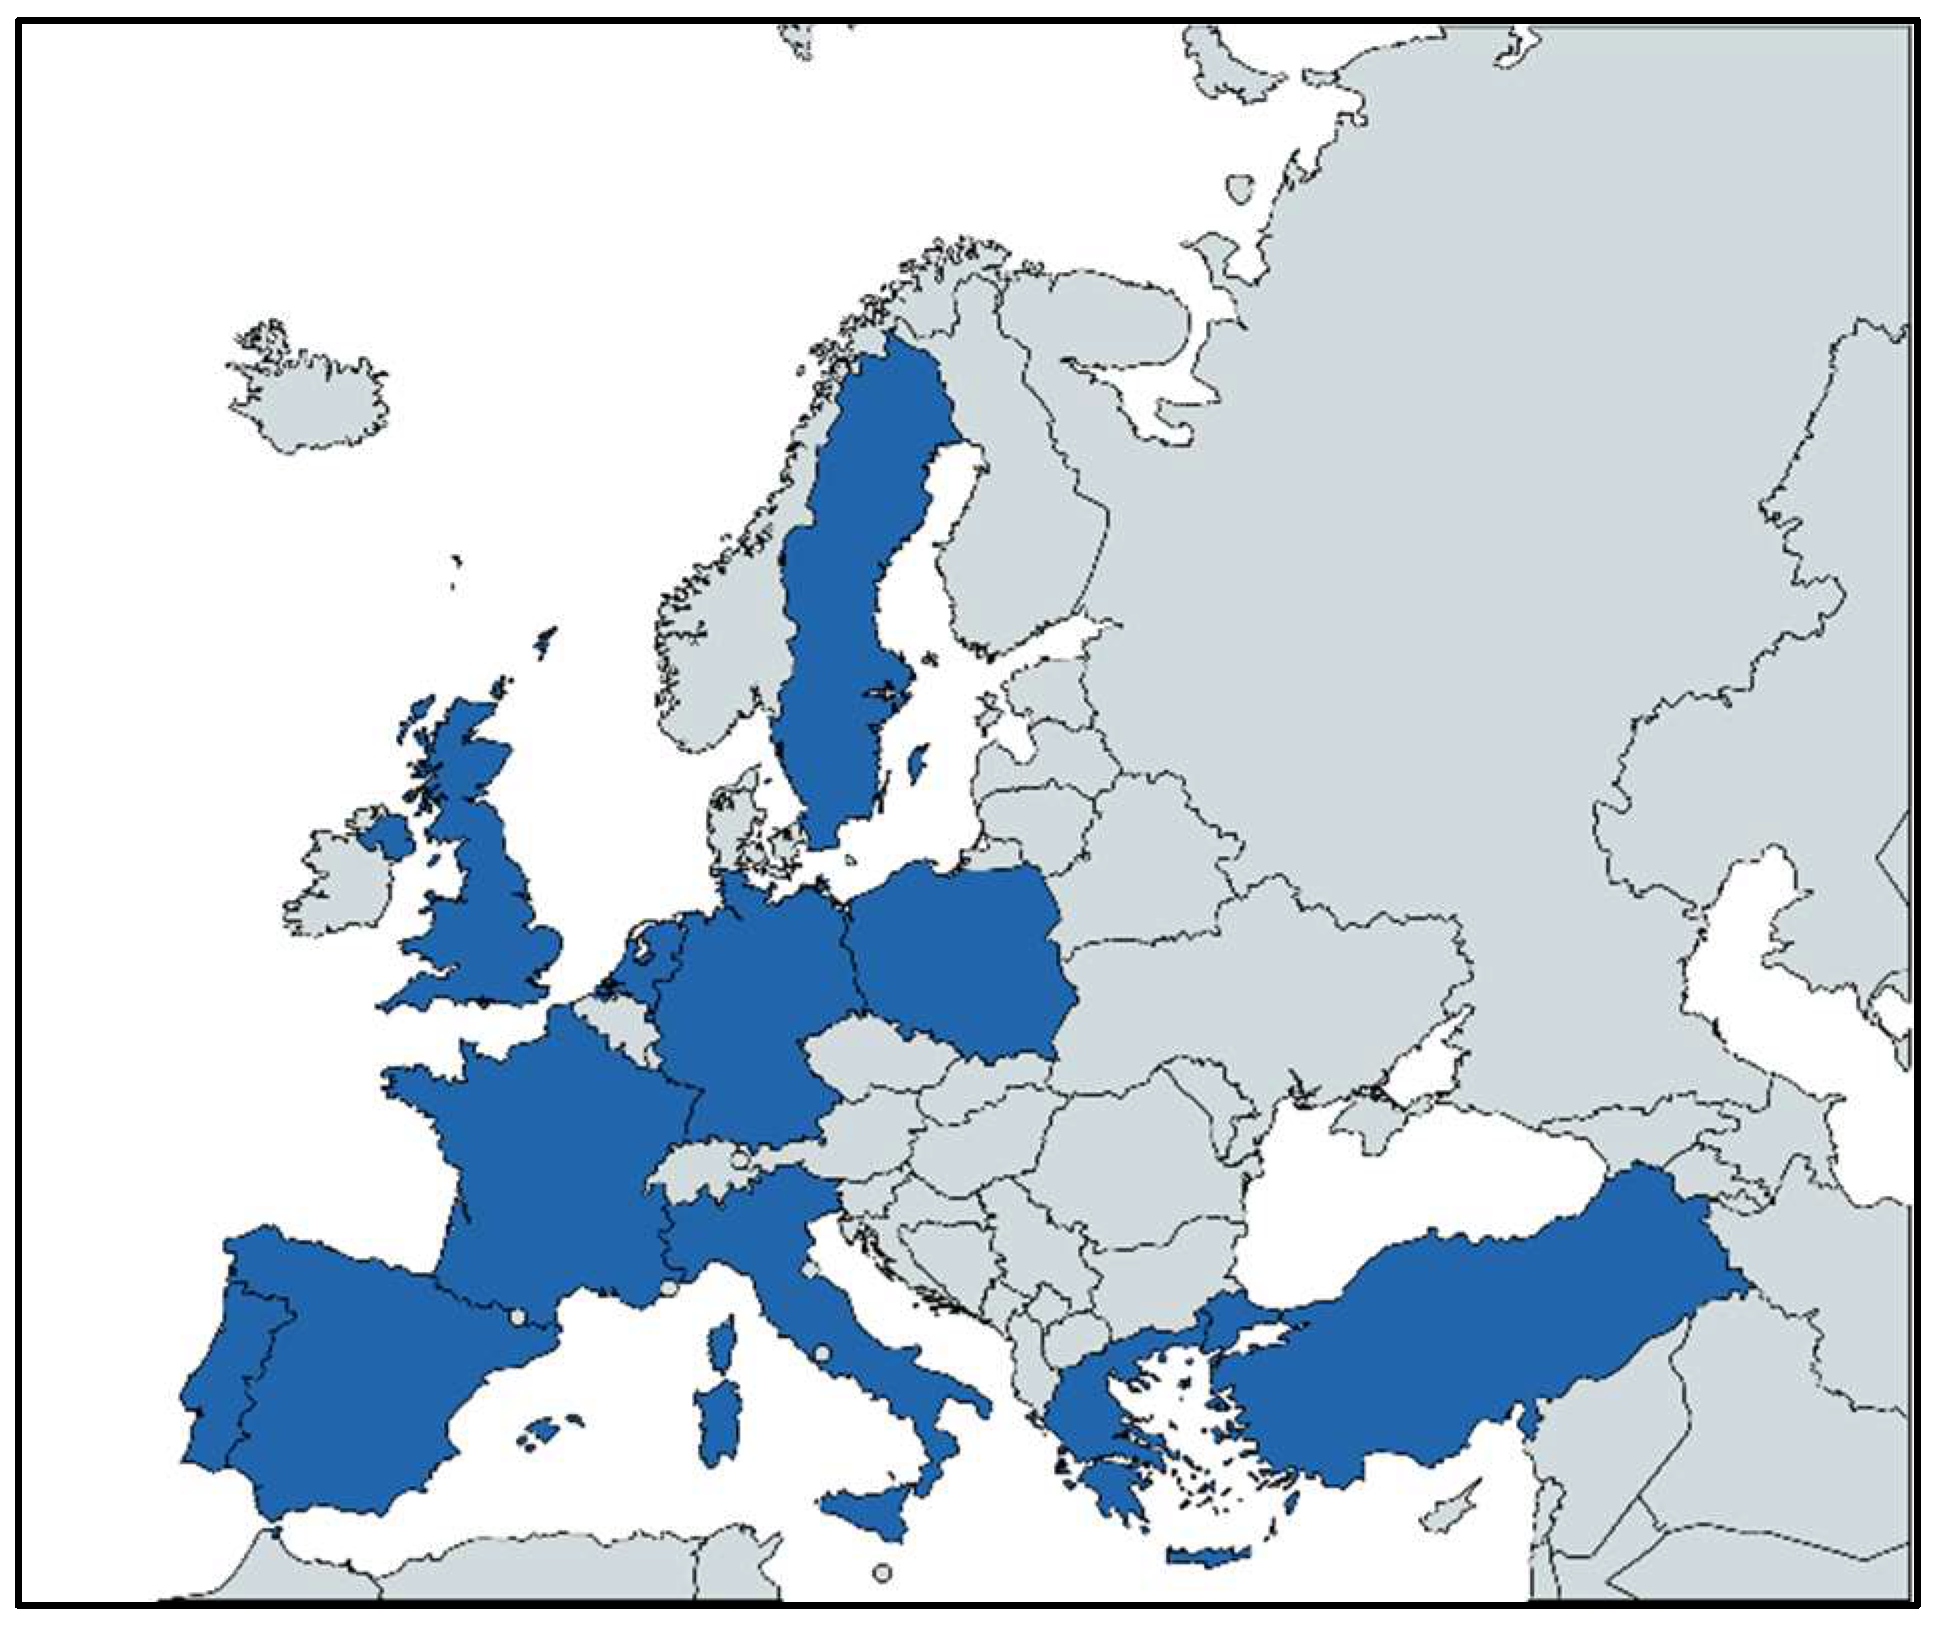
Based on these criteria, the eleven countries are given in Table 1 and Figure 4 were chosen for the study. As it is mentioned in the data collection method, a REST API for tending topics (TT) with geocodes of those countries was executed for a period of time (three weeks to two months, depending on the countries). At the end of the TT API execution for 11 countries representative samples of users (in 1/5000 ratio with respect to populations [74]) were accessed.
As it can be seen in Table 2, there are 38 million people in Poland in which 25 million are internet users. For the ratio of 1/5000, we should access 7644, but, while we accessed 1,161,760 users with 1669 trend topics for about two months execution of the API, only 1.139 are using Polish and created before 2010 and this number is far less than 7644 (1/5000 of the total population).
The situation was the same for Greece, so those two countries were dropped from the sample. Moreover, the ratio of the sample over the total population of the countries is (Total C/Total B) 0.02287% which can be concluded as a generalizable sample ratio. At the end, those tweets of 110,062 sample users were gathered by “GET statuses/user_timeline” API. Since this API is limited to 100 most recent tweets, a back-iterative API which executes with “max_id” option was applied as mentioned in Figure 3. This way, all the tweets of every user were collected from 1 January 2010 00:00 GMT to 31 December 2015 23:59 GMT. The yearly number of tweets per country are listed in Table 3.
To sum up, totally 255,842,103 tweets were collected to perform sentiment analyses for nine countries for a six year period.
4.2. Sentiment Analysis Algorithm and GNH-TD Calculation
After collecting tweets of 110,062 users from nine countries, the proposed sentiment analysis algorithms (Figure 1 and Figure 2) were applied for all tweets. A sample tweet and analysis results are shown in Figure 5.
This tweet was published in United Kingdom at 13 November 2015 about the Paris terrorist attacks. The words “good” has +1 weight in dictionary, but since there is “really” near before it, the weight is increased by algorithm to +2 (booster word). The word phrase “but god” would have positive or negative feeling but in the same sentence there is “clear and concise” words (+1) thus the weight of “but god” was automatically stated as −1. And, “scary” has a weight of −2 but the booster word “incredibly” increased its negative value to −3. Lastly, the emotion :_( has the polarity of −1 in the emoticon dictionary. At a result, the polarity of the tweet stated as +3 and −5. By this methodology all the tweets of the users were calculated and their polarities were stored into database. Then with the GNH-TD algorithm (Figure 2) daily GNH values of all countries were calculated (for 2191 days–6 years).
5. Analysis
The main aim of this study is to state a framework for GNH calculation via social media big data. Thus, proper number of active users and their tweets are calculated with proposed data collection method. Afterwards, the novel sentiment calculation algorithm was applied to more than 250 million tweets. On the other hand, before stating the GNH values of the countries, the validity and reliability of the results and algorithm should be examined. In this perspective, first three research questions were asked and analyzed. The first question is “Is there face validity when the polarities determined by sentiment analysis framework are compared with Stock Market Index and Exchange Rates?” To check face validity of the results, the historical data (from 1 January 2010 to 31 December 2015) of main stock market indices of the countries were collected from Yahoo Finance web site (https://finance.yahoo.com/). Also, Euro-Dollar (eur-usd), Euro-Pound (eur-gbp) and Pound-Dollar (gbp-usd) daily exchanges are collected. Then, bivariate correlations between the daily GNH-TD results, main stock indices and monetary exchanges are examined with Pearson’s Correlation statistical analysis. The results shown in Table 4.
Results showed that all the GNH-TD of countries are significantly correlated with monetary exchanges and stock market indices. The second research question is about convergent validity of the proposed framework: “Is there convergent validity when the GNH results of the sentiment analysis framework and GNH survey results of Organization for Economic Cooperation and Development (OECD) report are compared?” To check this validity, OECD life satisfaction survey results of all countries were gathered from OECD Data Bank (http://stats.oecd.org). Since there are online four year results (2012 to 2015) matching to our time interval, only 36 GNH measures (4 years × 9 countries) were examined again with Pearson’s Correlation Analysis. Results of this analysis shown in Table 5.
Since there is a significant and high correlation between the GNH-TD results and OECD survey report, the convergent validity of the proposed framework is proved. Additionally, this result can be concluded as a replacement of this social media sentiment analysis framework to the OECD survey method for life satisfaction analysis among countries. The third research question is about reliability of the dataset and results: “Is there data reliability when the peaks/troughs of the graphs of sentiment analysis framework are compared with specific dates obtained from news archives?” The common way for finding reliability of the sentiment analysis in literature is that the results are compared with findings from other sources such as news, archives, questionnaires, company secondary data, even manual provided and classified data, etc., but by this backward accuracy checking method, the real power of sentiment analysis cannot be detected. In other words, we cannot claim that our sentiment analysis results are accurate when we check the results with real data, because in this way we probably miss some real events to check. Therefore, a forward methodology for our accuracy check is more appropriate and valuable. In this forward method, first the data from the past are collected and the socially effective days of the countries for the selected time period were stated. For stating those days, the Wikipedia events pages were used (e.g., 2014 in Spain https://en.wiki.ng/wiki/ 2014_in_Spain, 2011 in Turkey https://en.wiki.ng/wiki/2011_in_Turkey). Then the results of the sentiment analysis are checked with this data in terms of how much of the past could be detected. In country level, the reliability of sentiment analysis framework was checked in terms of detecting those effective days. Since there are 2192 days in the chosen time interval and since GNH-TD found an aggregate happiness polarity value for all of those days, a threshold value was needed for determining the socially important days where after would be called as “extraordinary” days. To this respect, threshold value was calculated as “two standard deviations away from mean”. The mean and standard deviation values of all the polarities of 2192 days and Positive and Negative Threshold values for all countries are listed in Table 6.
After examining deeply the days of having negative aggregate polarities below negative threshold or upper positive threshold values, the detection accuracy of the proposed sentiment analysis framework is listed in Table 7.
To sum up, since all the accuracy percentages are bigger than 70% threshold value [76], the reliability of the dataset and proposed GNH-TD framework is proved.
6. Results
The fourth and last research question of the study is about the GNH results of countries for chosen 6 year period: “What are the GNH polarities of European countries in accordance with the proposed Twitter sentiment analysis framework?” In order to answer this question, first of all, the yearly (average) results of the countries are found as in Table 8.
If these results are put in to a gradient color scale from Red (meaning unhappiest) to Green (meaning happiest), the resultant picture (Gradient Color GNH Map of Europe) would be as in Figure 6.
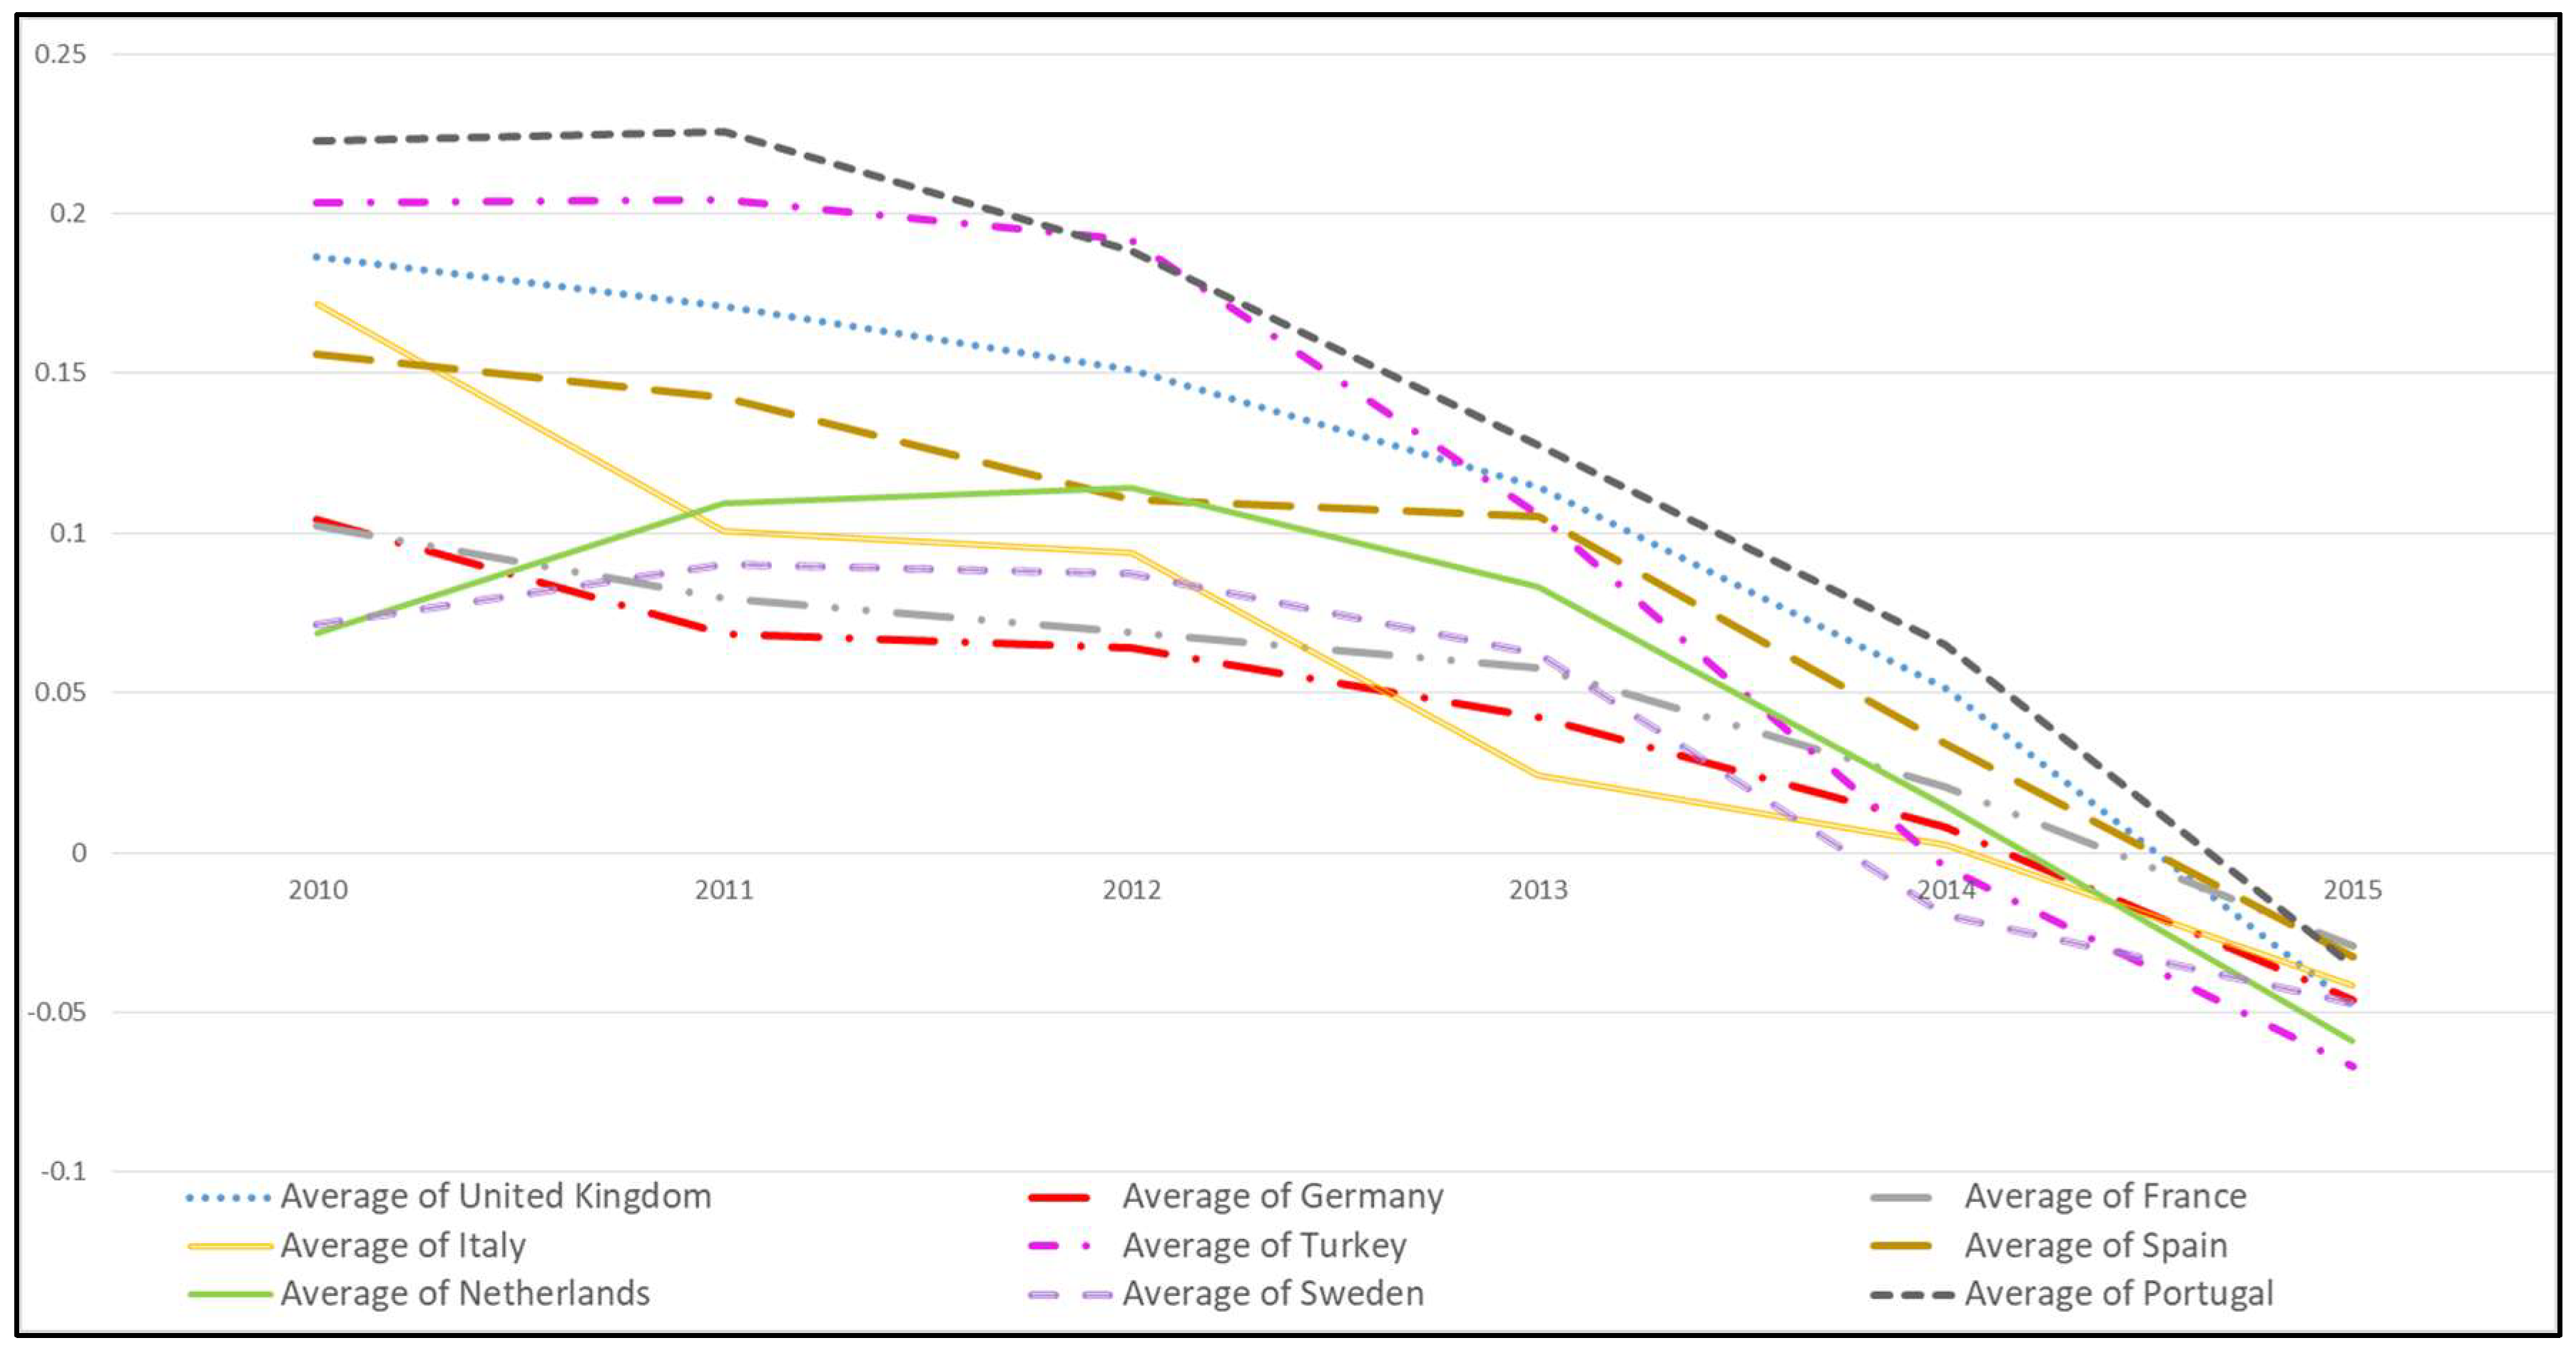
But, this kind of aggregate figures are usually misleading. For avoiding this kind of ambiguous perspective, a detailed and comparable diagram should be designed. In Figure 7, yearly GNH-TD values for all countries are drawn.
This chart shows more detailed results some which can be listed as:
- A negativity trend appears in social media happiness of all countries through the six years period. This result is also approved by OECD Life Satisfaction results of countries, because those values are decreasing also year by year.
- France has changed its positive happiest level from 3rd unhappiest through six years.
- One of the most impressive results of the study, while Turkey starts with second highest (happiest) position in 2010 and in the second position in aggregate results (Table 8); it is the unhappiest country among all at the end of 2015.
6.1. EU Countries Daily Sentiment Analysis
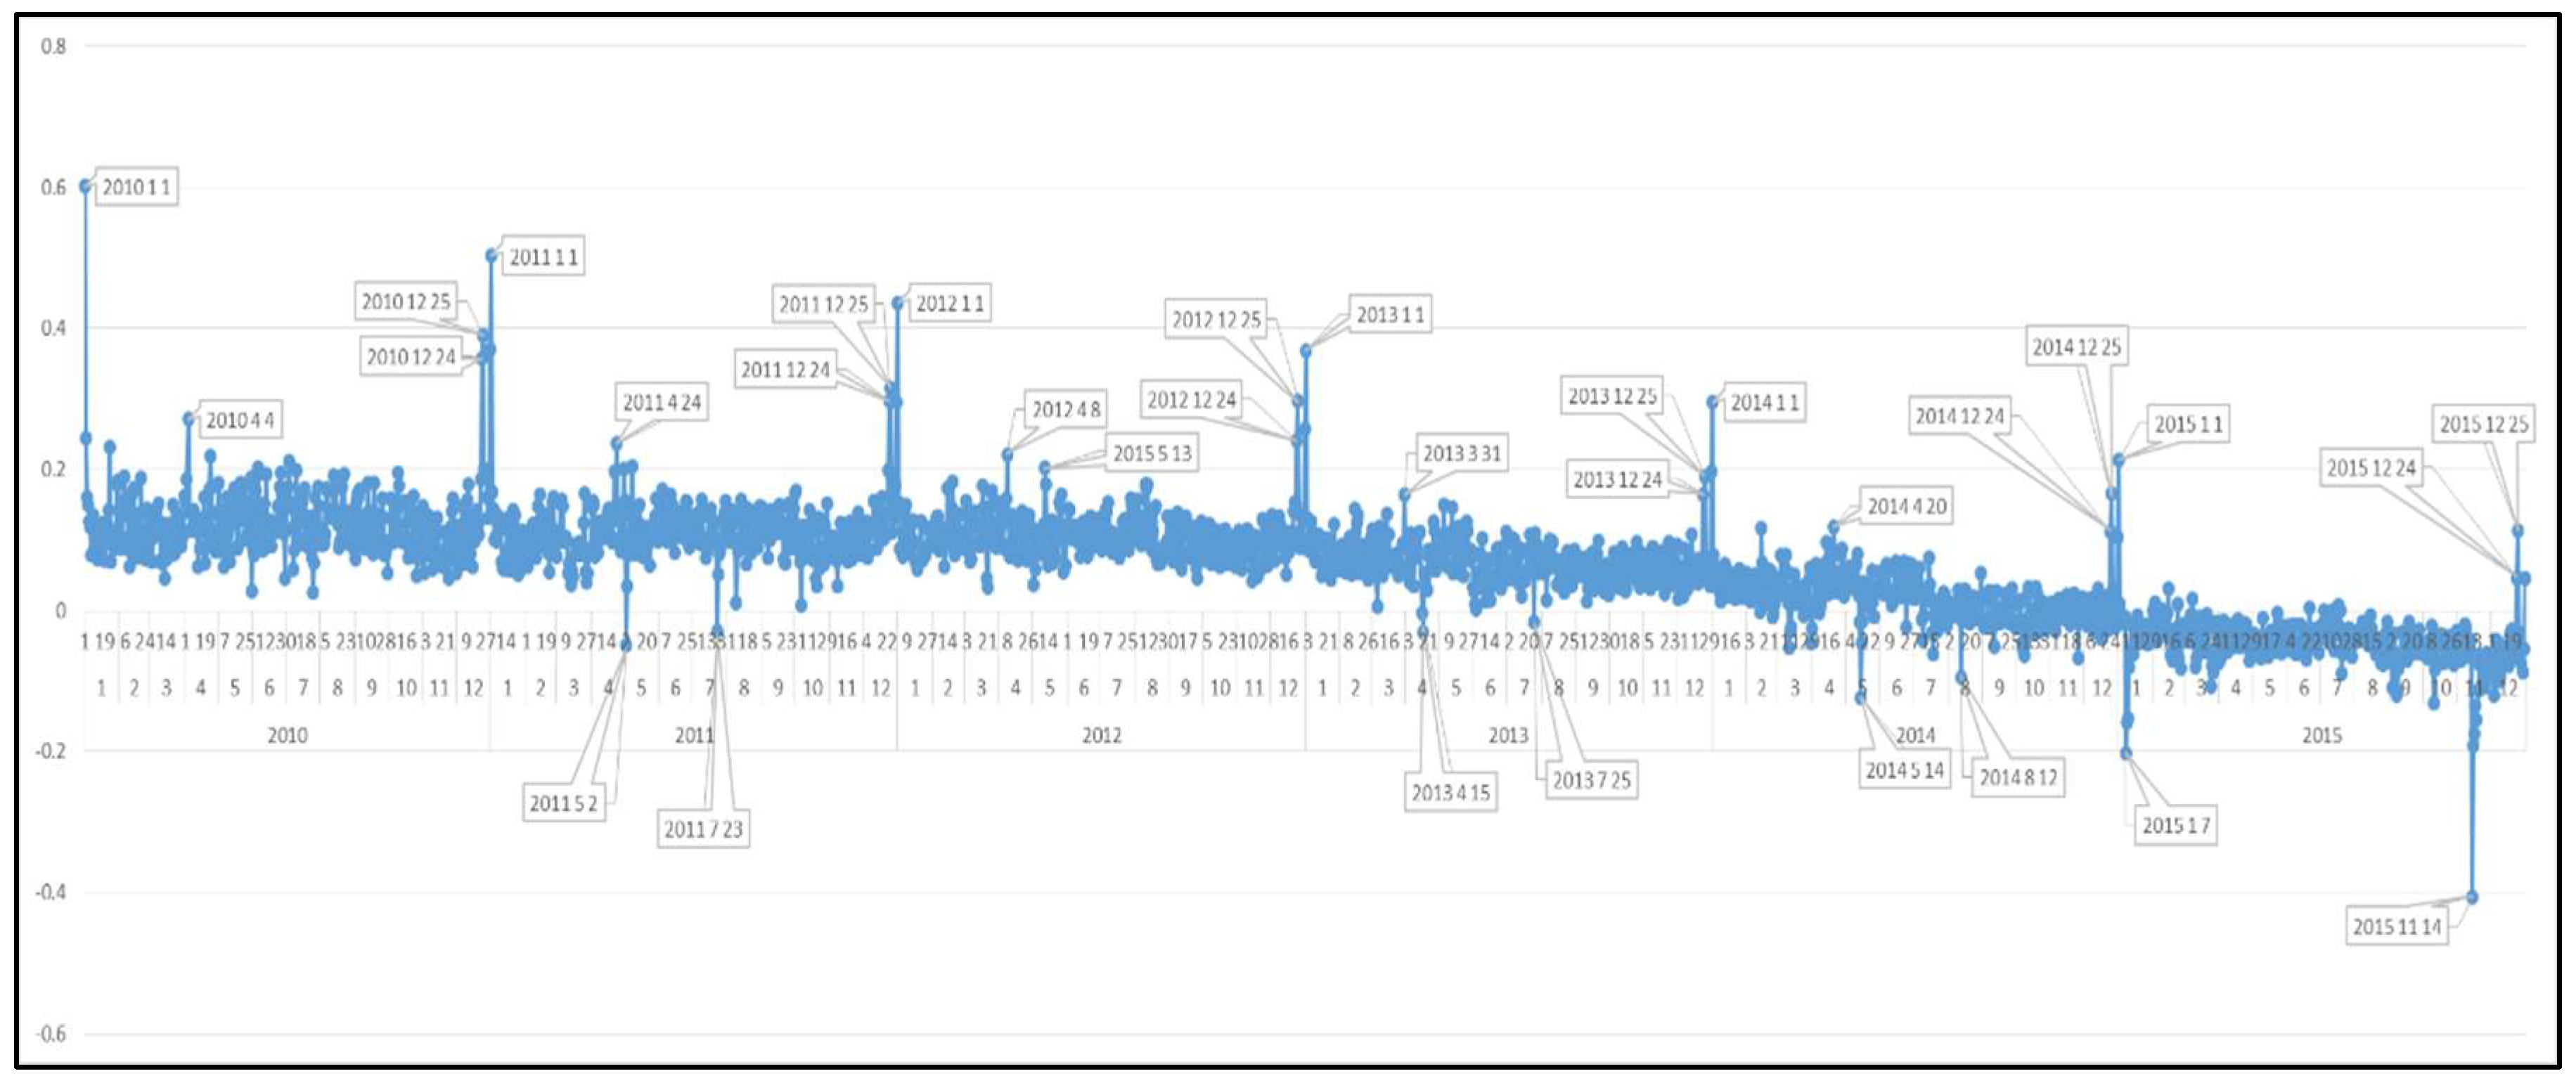
Before analyzing the countries one by one, in order to see the big picture of EU countries the total European daily sentiment results are determined as shown in Figure 8.
At first glance, a steady smooth trend appears from 2010 to the end of 2012 where afterwards a negative tendency arises. When positive peaks of sentiment dates are considered, it is seen that the positive peaks are realized in Christmas Eve (24 December), Christmas Day (25 December) and New Year’s First Day (1 January) for all years. The second positivity repeating event days (for all years) are Easter Days (4 April 2010, 24 April 2011, 8 April 2012, 31 March 2013, 20 April 2014) as an ordinary fact. But, since 2015 can be called as terrorism year which surrounded all the Europe, no Easter celebration appears in the Graph in 2015 April while it is a common fact for all other years. Lastly, a positive peak is shown in 13 May 2012 which is Mother’s Day.
Terrorist attacks and events have a dominance on the graph when the negative sentiment dates are analyzed. For instance, the most negative sentiment of Europe is 14 November 2015 in which terrorist attacks occurred in Paris (causing 137 deaths). Similarly, the Charlie Hebdo assault (7 January 2015) and Workers’ Youth League (AUF)-run summer camp terrorist attack (23 July 2011) are other negative sentiment days. 15 April 2013 is an interesting negative day; in this day there is not any negative event in Europe but a terrorist attack occurred in Boston Marathon in which there were lots of European participants (audiences and marathoners). Also, big accidental disasters (Soma mine explosion in Turkey on 14 May 2014 and train accident in Spain on 25 July 2013) appeared in the graph as most negative days. On the other hand, 12 August 2014 is also one of the unhappiest days as can be seen from the graph. On this day the UEFA Super Cup final match was played between Real Madrid (the most popular club of Spain) and Sevilla (the oldest club of Spain) and Real defeated Sevilla (2-0). It seems that in Europe football fans did not like the victory of Real Madrid. Lastly, 2 May 2011, as another negative day, is the day Osama Bin Laden died. At first glance, this day might be thought to be a positive day for Europe, but the tweets showed that it was a remembrance day for the thousands of innocents killed in the 9.11 event.
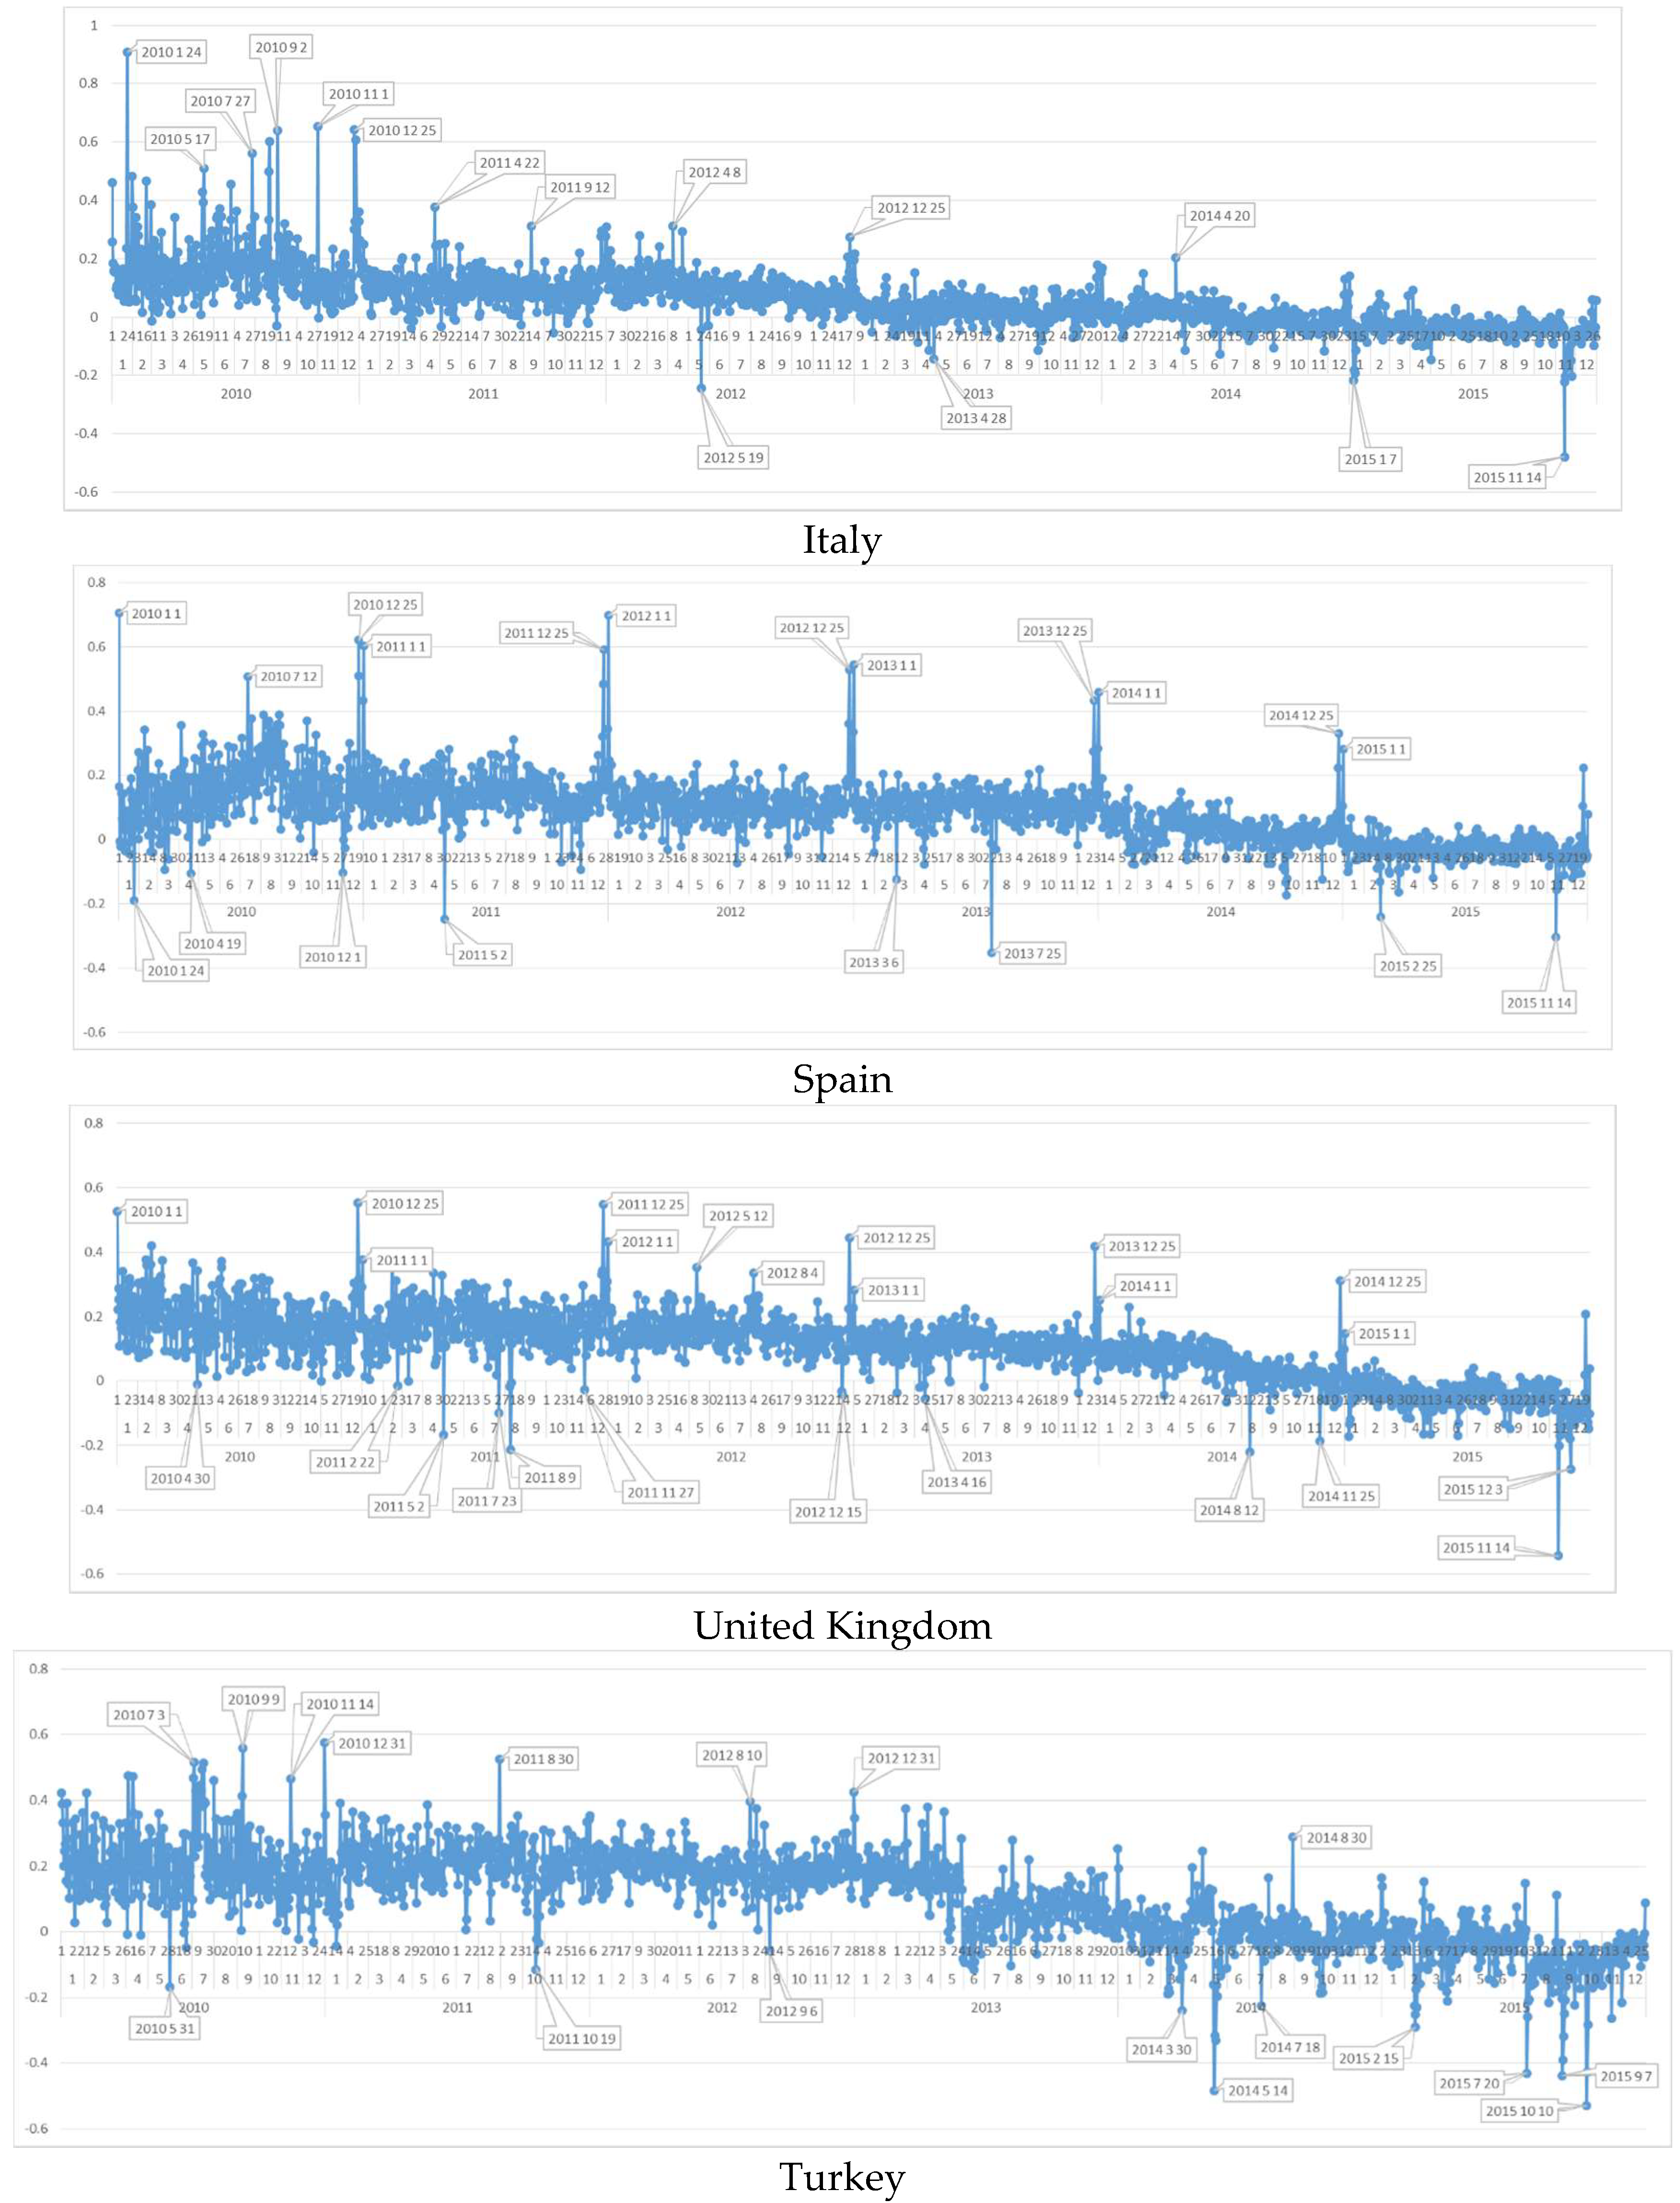
After the general analysis of Europe, the country datasets are graphed (Appendix A) and examined specifically for stating country specific negative and positive peak dates. Findings, discussed in following sections, show that the algorithm is also successful for capturing the country-based social events as it is for EU countries in common.
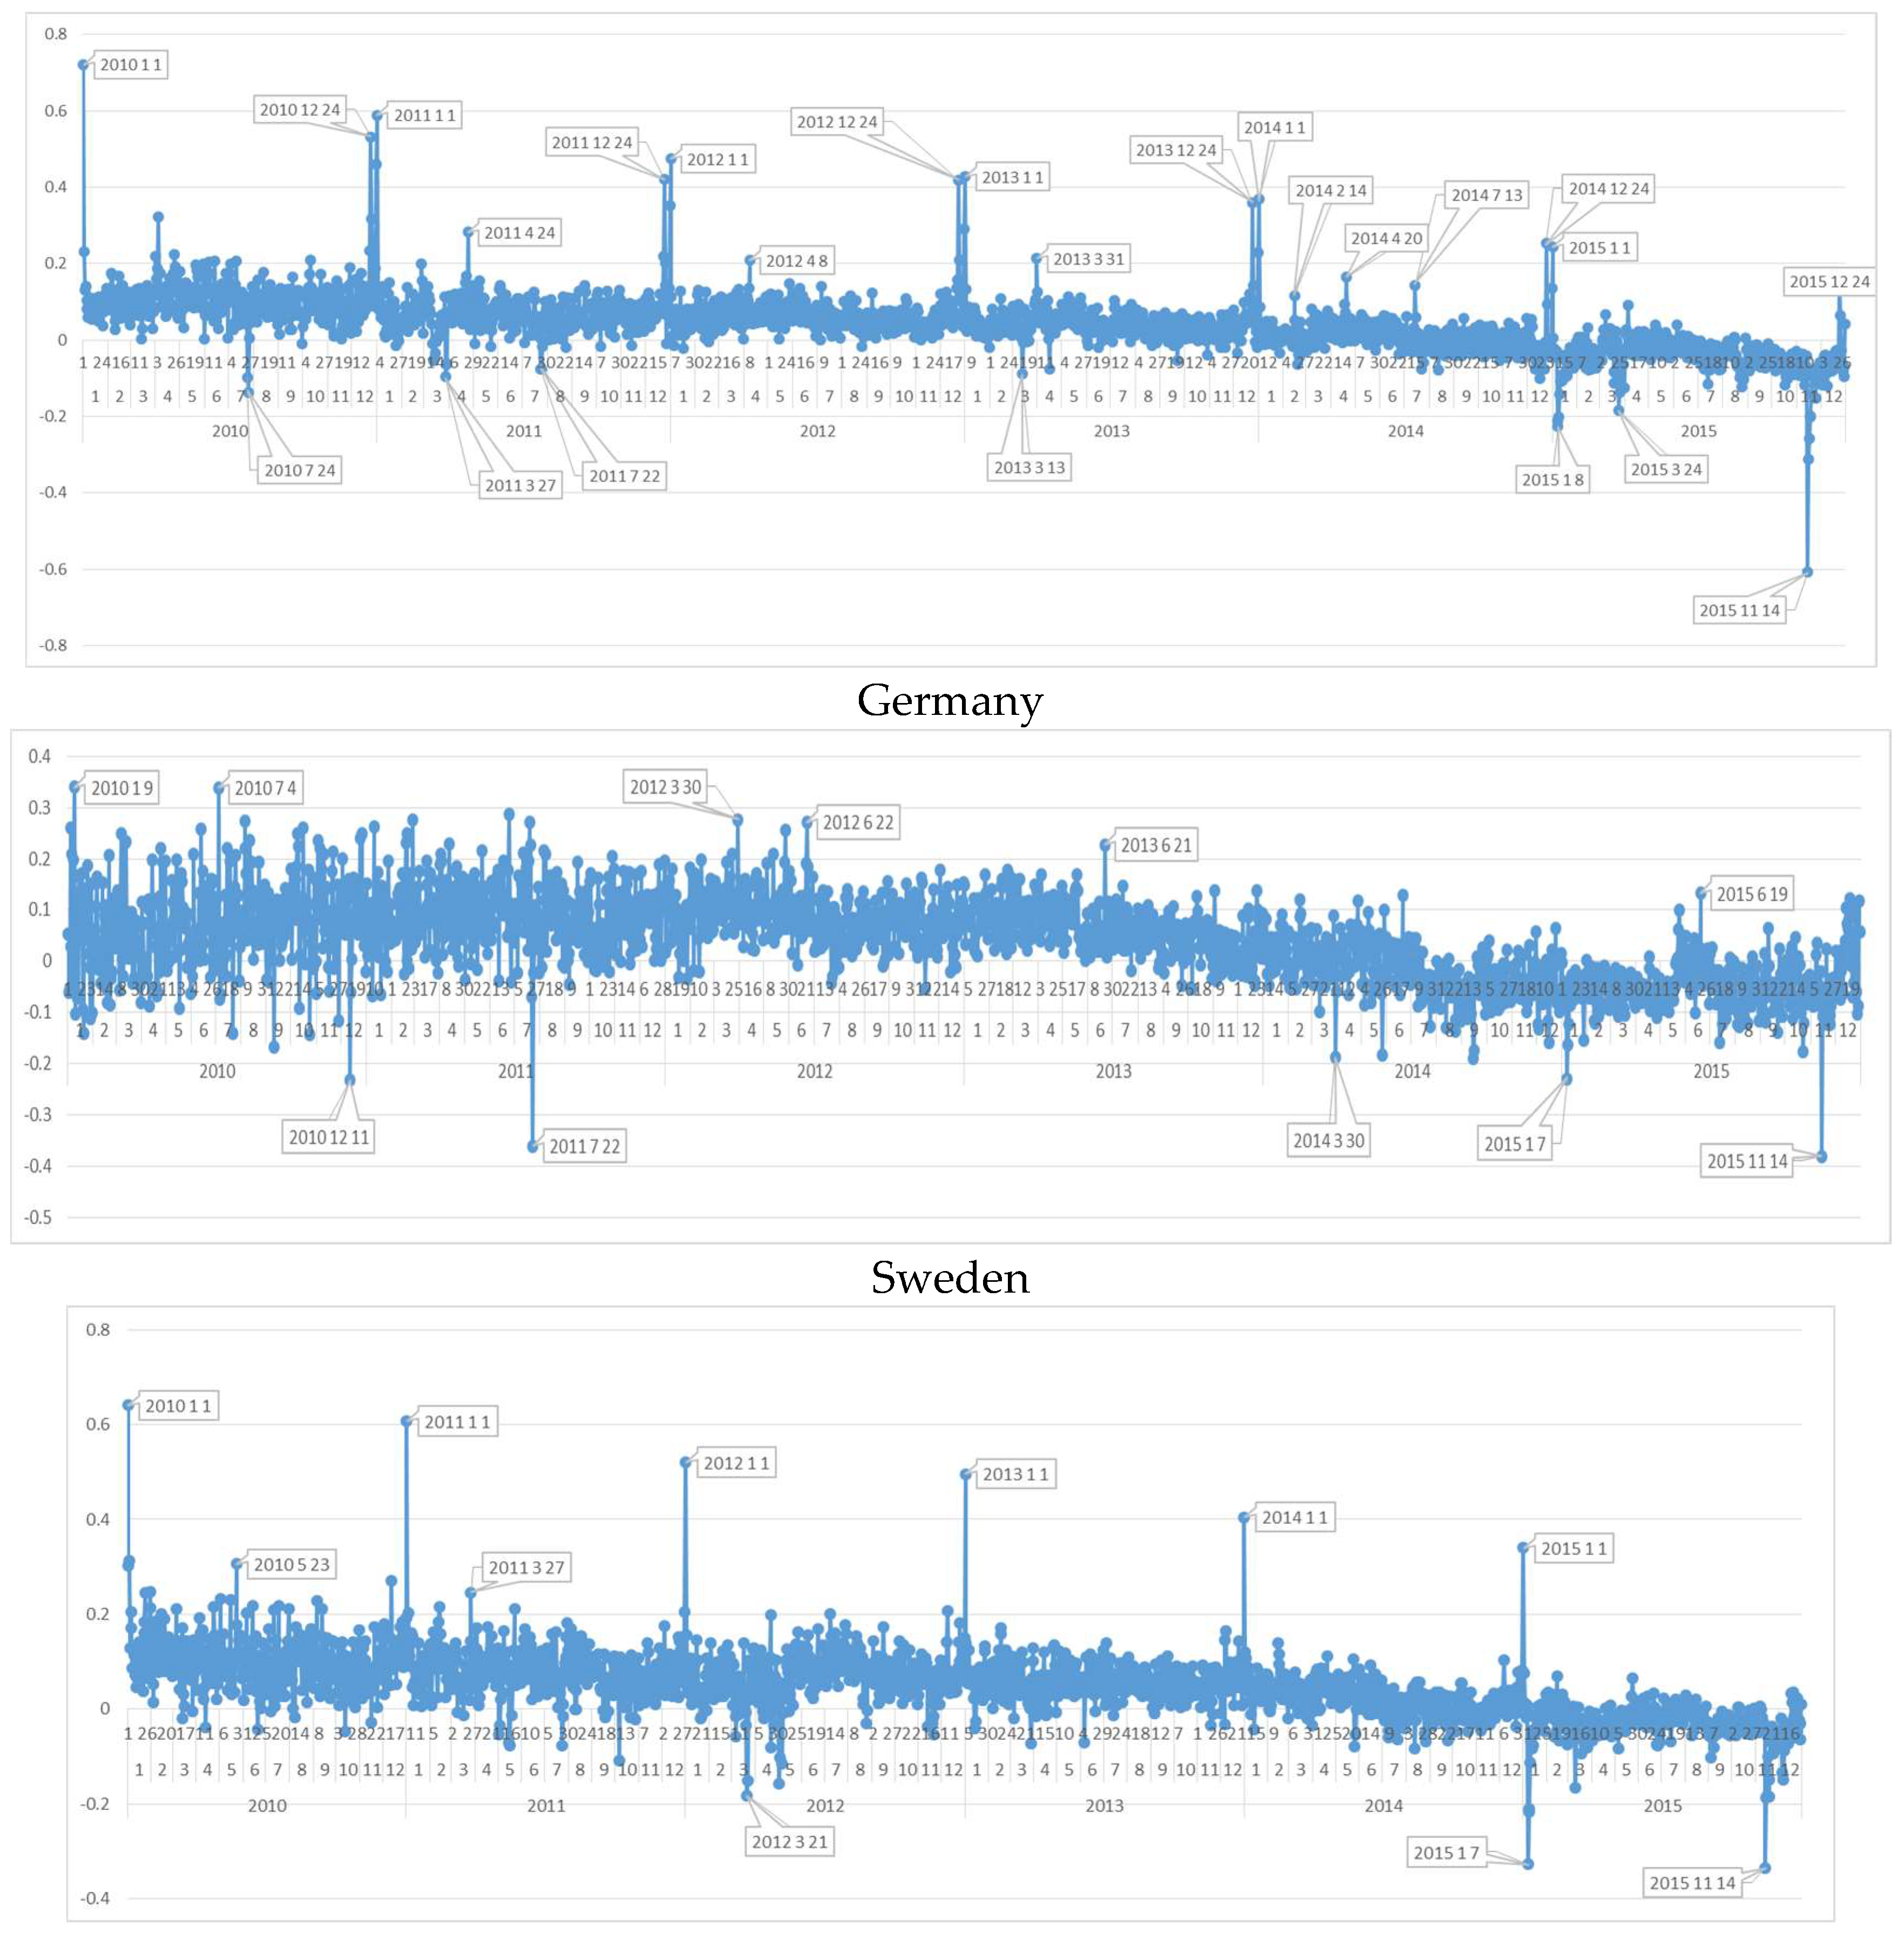
6.2. Daily Sentiment Analysis for Germany
When the German dataset is investigated, 13 July 2014 when the German national football team became world champion in Brazil is found to be one of the happiest days. Also, as a common fact, Saint Valentine’s Day (14 February) appears as one of the happiest days in the scale for all years. When we examine the negative days, interesting results are found. Firstly, as the unhappiest day of 2010, in 24 July, a massive stampede at the 2010 Love Parade in Duisburg killed 21 people and injured dozens (at least 500) more people. This Love Parade disaster affected German society very much and obviously led to a high position in GNH-TD results. Additionally, there are two nearly same degree negative days in 2011. In 27 March 2011, state elections were held in the Baden-Württemberg and Rhineland-Palatinate states. The negativity of the day was due to the fact that while Angela Merkel’s Christian Democrats had 39% and positioned the first, the total of Greens and Social Democrats became more than 40%, thus this result was concluded as “loss of Merkel”.
6.3. Daily Sentiment Analysis for Sweden
The first interesting finding from the Sweden dataset is that Swedish society does not react extraordinarily in social media and there is a smooth waving in their sentiment dataset. They don’t react to 1 January as much as other EU countries and even their national day (6 June) does not appear as extraordinarily positive in the scale when compared to other days. This emotionlessness for National Day of the country is very common for this country. It is a well-known fact that in 2004, the Swedish parliament started the discussions for making this day a public holiday in order to make society more interested in celebrating this day, but even the duration to end up with the decision for making it a public holiday took about one year. But the Midsummer Eve is an extraordinary social event (positive) for this country (e.g., 21 June 2013). As the general happiness tendency analysis, Swedish people has the happiest year in 2012 different from other countries. The negative extraordinary days’ analysis, as expected, showed that Paris attacks in 14 November 2015 has the most negative position in this country too. But, the negativity of 22 July 2011 is more than 4 November 2015 in Sweden where 22 July 2011 is the day of Norway terrorist attacks, and the reason of this high reaction may possibly be due to being a neighbor country of Norway is. As a result, it can be stated that, in Sweden terrorist attacks in Europe have negative effect on society while there is not widely peak positive days such as national days, religious events or sport events in society.
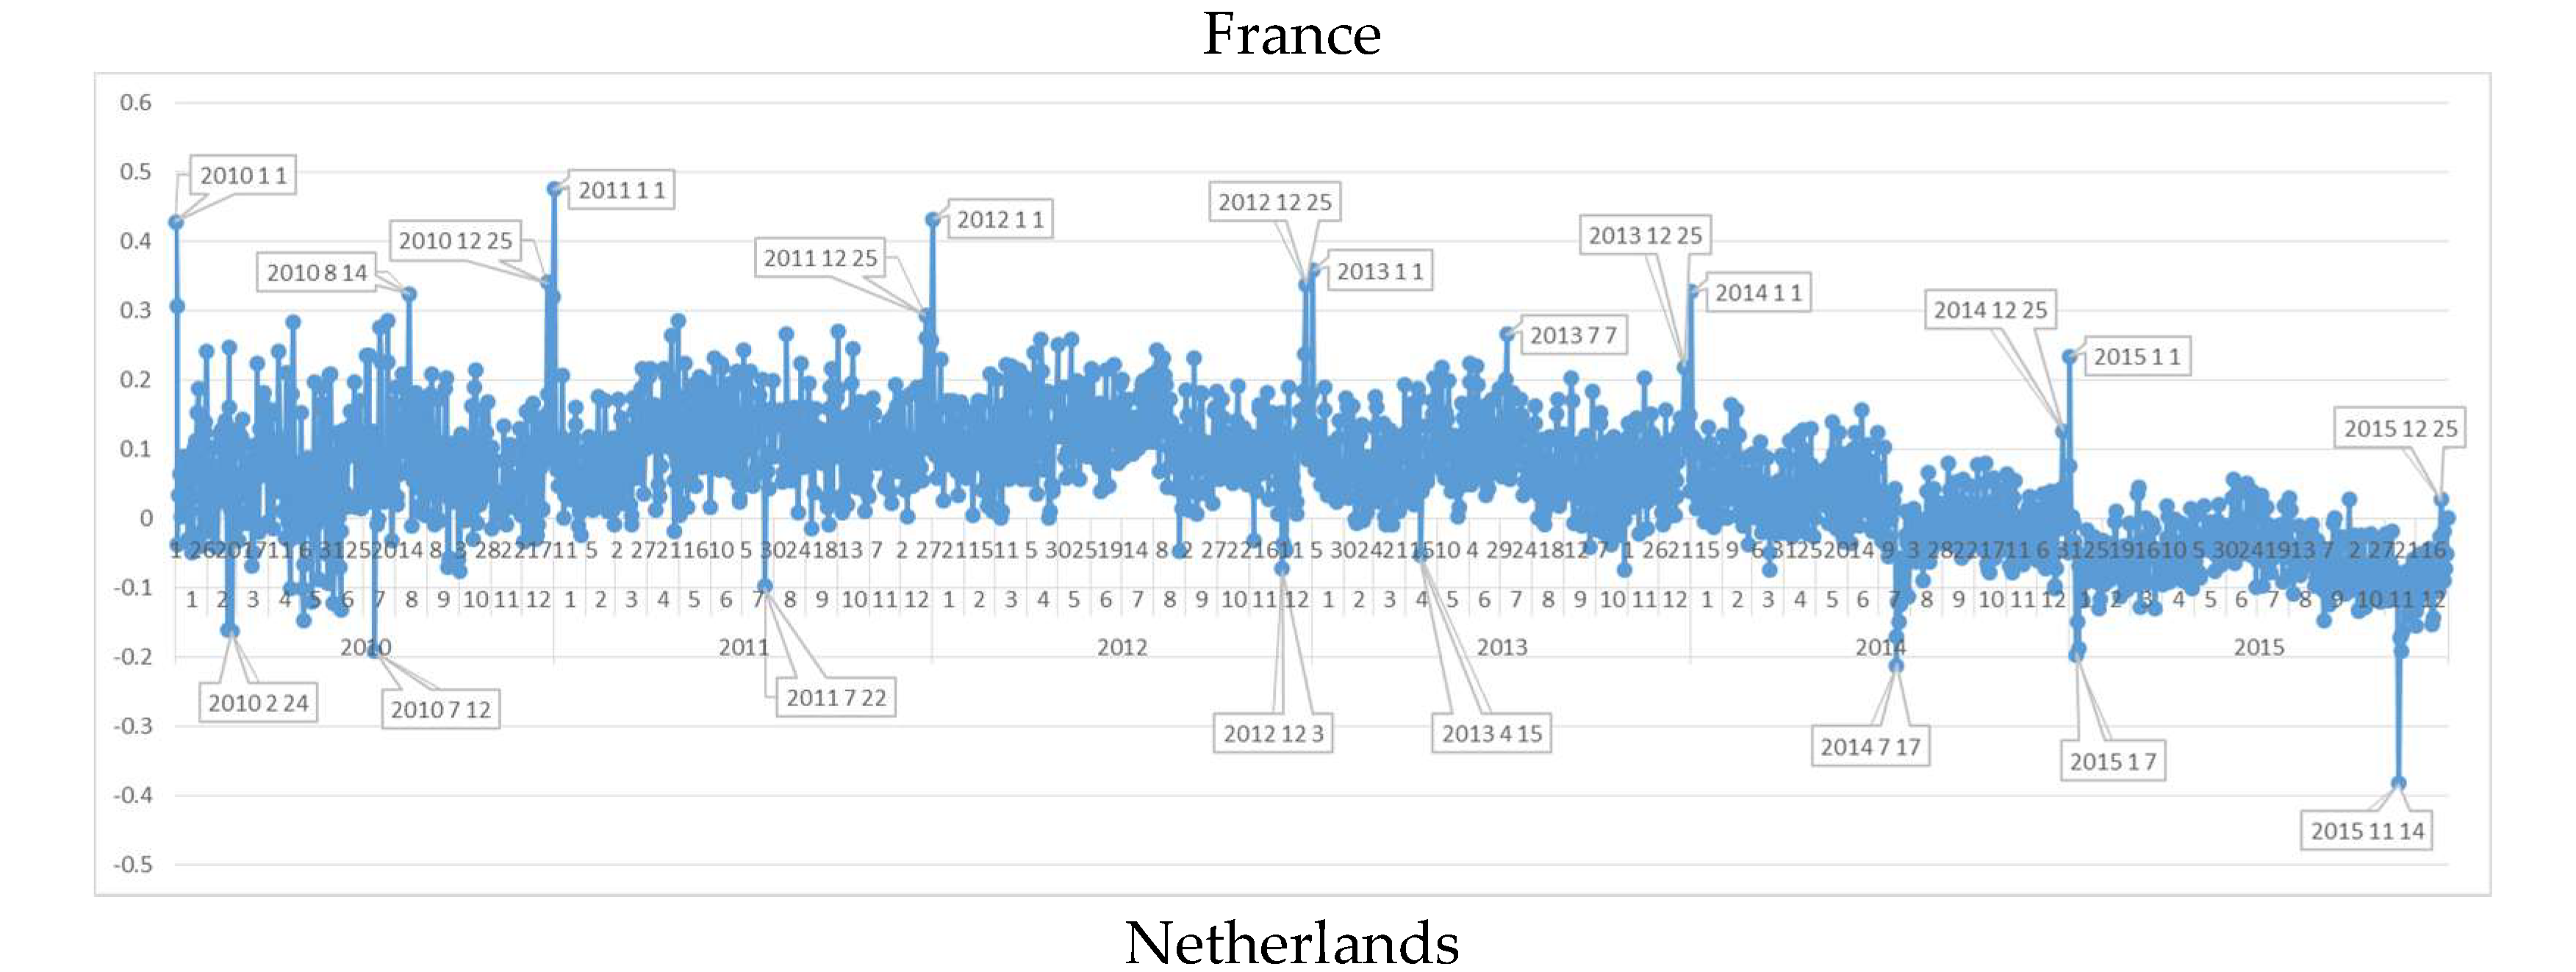
6.4. Daily Sentiment Analysis for France
Daily GNH values of France showed that French people have a big tendency to celebrate New Year in 1 January. It is interesting that French people do not focus on Christmas (24 December) as much as others. This fact shows that in France, 1 January has a meaning of New Year than Christmas. On the other hand, extraordinary positivity of 23 May 2010 showed a celebration of Whit Sunday. Also, 27 March 2011 is the Cantonal Election day in France and it seems the results gladden French people. The negative extraordinary days’ analysis for France show that Paris attacks (4 November 2015) and Charlie Hebdo shooting (7 January 2015) are the unhappiest day of the six year period. Another negative date is in 21 March 2012 where a bombing attack occurred in front of the Indonesian Embassy in Paris after president Sarkozy declares the operation done to arrest the author of the Toulouse murders. To sum up, it is very normal to find out that French society was very unhappy in 2015.
6.5. Daily Sentiment Analysis for The Netherlands
The Netherlands’ sentiment polarities state that 2012 is the happiest year for The Netherlands like Sweden, though a negative tendency of happiness in the six year period. The first negative day period in The Netherlands was clearly on 24 February 2010 on which Queen Beatrix accepted the resignation of the Labor Party minister. On the other hand in the June and August periods a new cabinet formation conversations were being done and positive and negative polarity days occurred depending on the direction of the discussions. On the other hand, in 12 July 2010 there was a negative polarity, and the reason for it was the World Cup defeat of Holland national football team by the Spanish team.
6.6. Daily Sentiment Analysis for Italy
While most of the other countries showed an increase in negativity in 2012, in this country negative flow GNH-TD is smooth for the six year period. On the other hand, while peaks of positive days appear in 2010 in high amount, these peaks immediately disappear after 2011. This can be an indicator for a rapid decrease of happiness in the Italy Report between 2012 and 2016 [77]. Another interesting finding for positive polarities is that, contrary to other EU countries, Italian citizens celebrate Christmas (25 December) instead of New Year (1 January). The negativity on 19 May 2012 is because of Brindisi school bomb event which affected Italian society, who are not very familiar with terrorist attacks as other European countries, very much. At the same time the negative days show that, for all other terrorist attacks, Italy acts alike other European countries and feels unhappy.
6.7. Daily Sentiment Analysis for Spain
In Spain, of course contrary to The Netherlands, in 12 July 2010, the national football team’s victory against The Netherlands shows a positive peak. The negative days of Spain in the chosen time period is surprising since while 14 November 2015 terrorism event has a negative effect on the society the, other terrorist attacks in Europe do not indicate negativism. On the other hand, on 25 July 2013 on which the biggest train accident happened and dozens were killed is one of the negative peaks in Spain.
6.8. Daily Sentiment Analysis for United Kingdom
As still a part of the EU, United Kingdom society showed positive polarities on the Christmas and New Year celebrations, too. All other positive days are about football matches which support the belief about the football focus of this society. When the negative days are analyzed, the unhappiest day of all time interval is 14 November 2015, showing a big abhorrence to terrorism. On the other hand, like happiest days, most of other unhappiest days (e.g., 12 August 2014) are related to football events. Moreover, of course, 9 August 2011, as a domestic negative day, London riots and street fights appeared as one of the unhappiest days of 2011.
6.9. Daily Sentiment Analysis for Turkey
Turkey is the only country that was chosen from the candidate countries pool of the EU. However, the results of this country show the differences of EU citizenship. The positive GNH-TD days of Turkey is very different from the other EU countries. For instance, Turkish society does not celebrate New Year as a peak happy day of the year. Celebrating Christmas was not expected from this Muslim country but they use Gregorian calendar and New Year celebration would not be surprising. However, 15 November 2010 is a religious ceremony in İslamic World (Kurban) and 19 August 2012 has another ceremony (Ramadan); and these days have positive peaks. 30 August 2011 is Turkish national victory day and the positivity of this local celebration day is again natural. The difference of Turkish society from EU countries is seen better in the negativity analysis of Turkish tweets. While 14 November 2015 is the unhappiest day for all other countries, it is not the unhappiest day in Turkey. Turkey has its own peak on 10 October 2015, where there was a terrific terrorist attack in capital city of Turkey (Ankara) resulting with more than 100 deaths and which was not too much considered as negative day by other EU countries. 14 May 2014 was the black day for Turkish citizens because of mine explosion in Soma with more than 200 deaths.
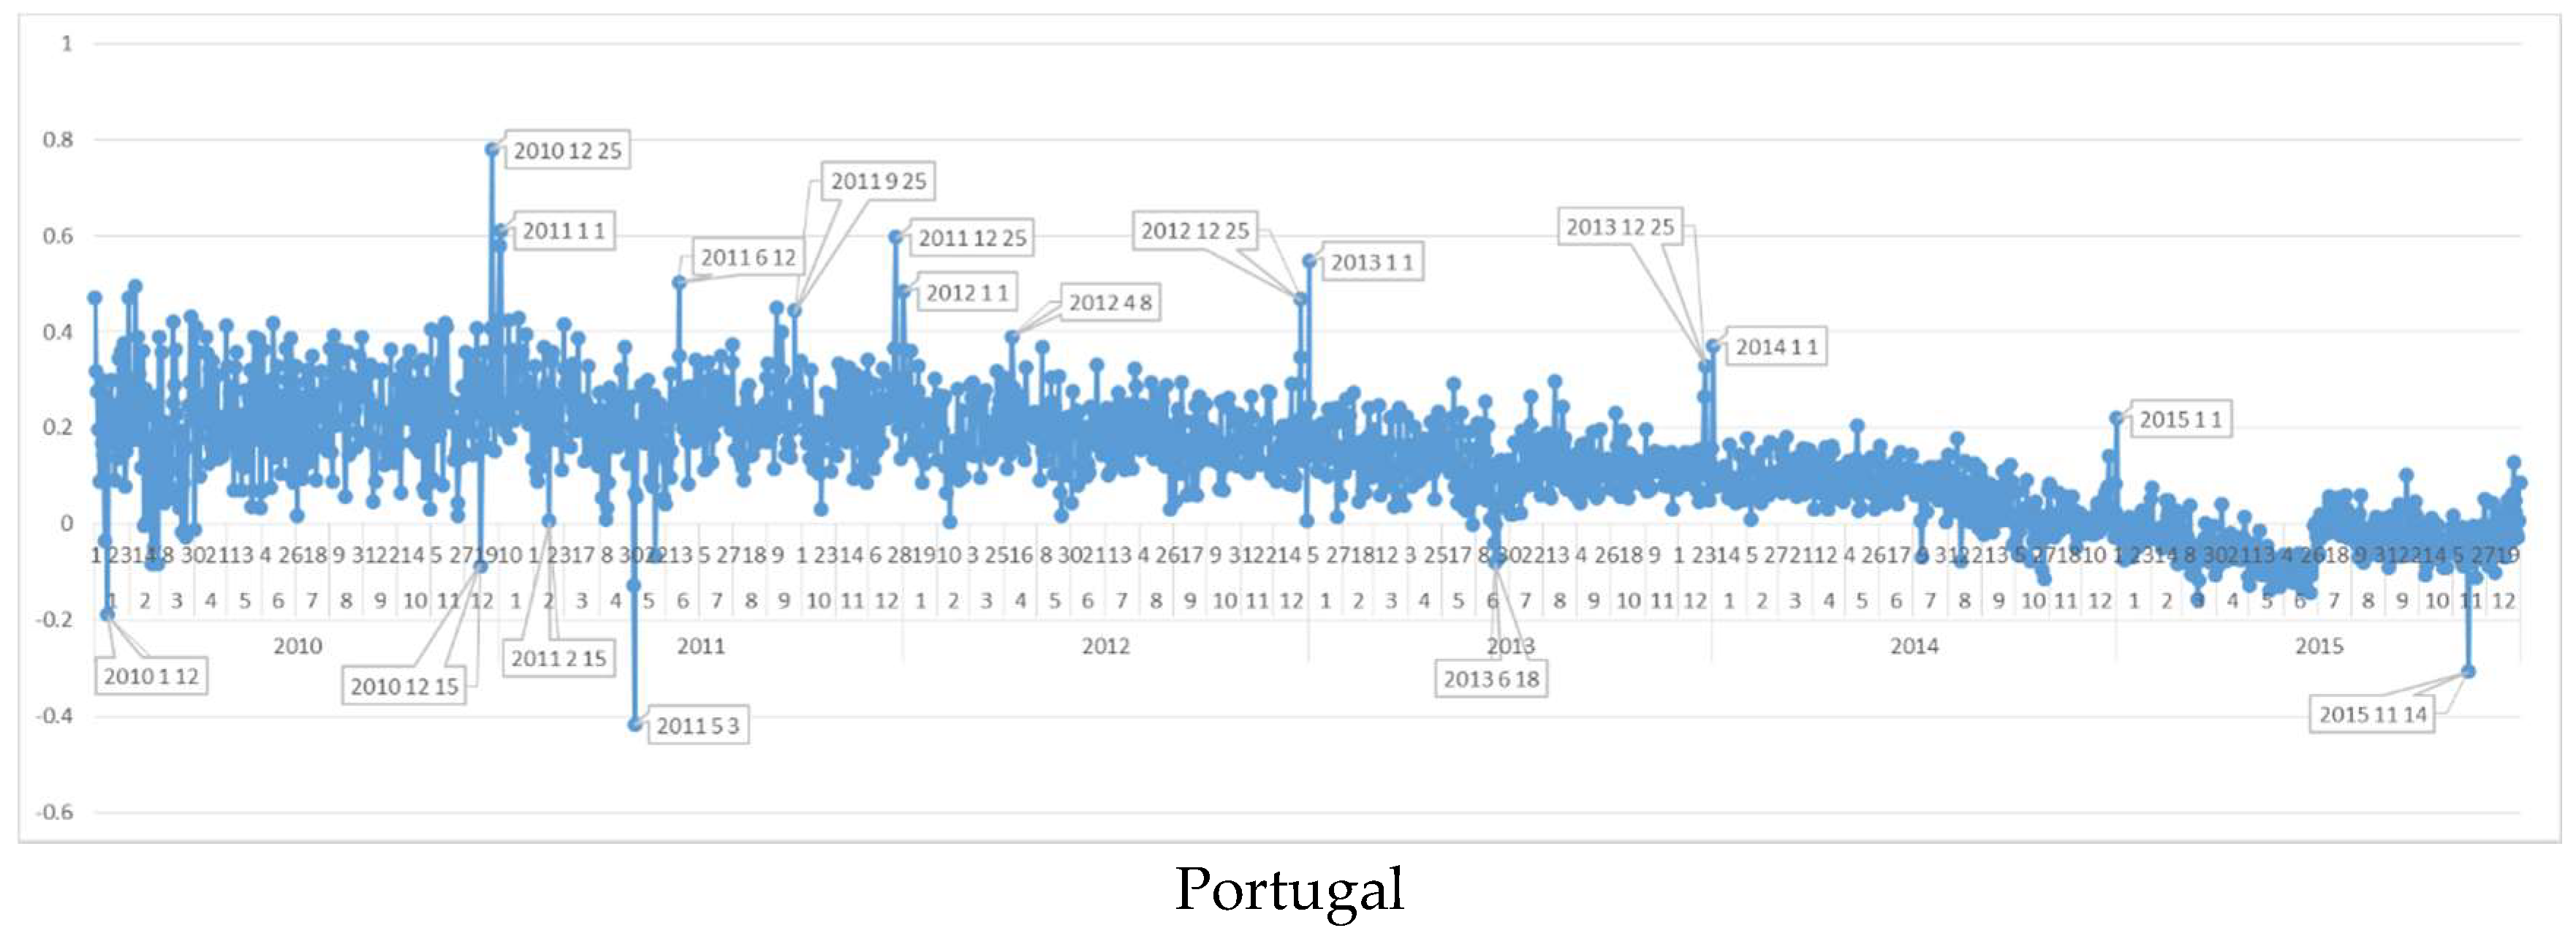
6.10. Daily Sentiment Analysis for Portugal
When the Portugal dataset is analyzed, positive polarities are seen on 10 to 12 June of the years which are about Portugal Day celebrations. The negative polarities shows that as another EU country, Portugal shares the sadness of terrorist attacks. However, the results have a tremendous trough date (3 May 2011) for this country, on which Portugal has reached an agreement with EU and IMF on 78 billion Euro financial rescue package, becoming the third Eurozone country to be bailed out of a sovereign debt crisis. This finding shows that economy is still one of the main factors of GNH for societies.
7. Discussion and Conclusions
This social media big data analysis study is about learning from the past in country levels and detecting exploratory findings in multicultural and multilingual levels. With this perspective, a novel social media big data sentiment analysis framework, which consists of data collection, filtering, sampling and sentiment analysis algorithm, was conducted. In this respect, 11 countries have been chosen from Europe for Gross National Happiness Analysis with Twitter data. After filtering, more than 110,000 active users from nine countries were accessed and their tweets from 1 January 2010 to 31 December 2015 were collected. After validating the algorithm results with convergent and face validity analysis, reliability of the data was checked. Lastly, with this functioning algorithm, GNH results are discussed in general and on country domains. Investigating the results deeply, terrorist attacks and disasters (air crashes etc.) have naturally negative effects on society soul. Also, in Europe countries, society is effected by terrorist attacks not only in their country but also in other countries. This result concludes that in (especially for negative dates) extraordinary situations, there still exists a “European Citizenship” concept. Also, a negative sentiment tendency for all countries has approved over 6 year period, unfortunately. When the proposed social media sentiment analysis framework is compared to alternative approaches, this framework can be found conspicuous with following newly designed features:
- Lastly, it can be stated that comparing to the survey based methodology of GNH calculation by the global institutions (e.g., OECD), time series results (daily, monthly etc.) can be drawn and explained with this proposed framework. Thus this promising framework can contribute the researchers for related specific social psychology studies.
8. Future Study Recommendations
The main contribution of this study is that it is possible to find out societies’ total feelings in daily (even hourly) levels via social media big data analysis. For future studies, it can be recommended that the daily and hourly results of the algorithm might be analyzed in a deeper way with the help of social psychologists in terms of socio-cultural effects. Also, in order to enlarge the scope of cross-cultural analysis, most frequently used words, idioms and emoticons can be examined to detect exploratory differences of societies. Lastly, as known, machine translation of tweets for sentiment analysis is an alternative methodology for multi-lingual sentiment analysis [85]. Thus, as future study, the framework of this study can be integrated with machine translation methodology to determine GNH of countries on a common language.
Author Contributions
This manuscript was made on the process of PhD study. M.C., as a student, was supervised by M.O. during the process. M.C. conceived and designed the framework and performed the data collection. M.C. and M.O. analyzed and discussed the data. M.C. implemented the algorithm and stated the results. M.O. and M.C. wrote the manuscript. M.O. provided relevant information and instructions during the whole progress. All authors have read and approved the final manuscript.
Acknowledgments
This work was supported by Boğaziçi University Research Fund, Grant No. 10600.
Conflicts of Interest
The authors declare no conflict of interest.
Appendix A. Daily Sentiment Polarity Graphs of Countries


References
- Hanna, B.; Kee, K.F.; Robertson, B.W. Positive impacts of social media at work: Job satisfaction, job calling, and Facebook use among co-workers. In Proceedings of the SHS Web of Conferences, Kuala Lumpur, Malaysia, 18–20 September 2016. [Google Scholar]
- Fuchs, C. Social Media: A Critical Introduction; SAGE: Thousand Oaks, CA, USA, 2017. [Google Scholar]
- Lenhart, A. Adults and Social Network Websites; Pew Research Center: Washington, DC, USA, 2009. [Google Scholar]
- Lenhart, A.; Madden, M. Social Networking Websites and Teens: An Overview; Pew Research Center: Washington, DC, USA, 2007. [Google Scholar]
- Lenhart, A. Teens and Social Media: The Use of Social Media Gains a Greater Foothold in Teen Life as They Embrace the Conversational Nature of Interactive Online Media; Pew Internet & American Life Project: Washington, DC, USA, 2007. [Google Scholar]
- Bello-Orgaz, G.; Jung, J.J.; Camacho, D. Social big data: Recent achievements and new challenges. Inf. Fusion 2016, 28, 45–59. [Google Scholar] [CrossRef]
- Quan-Haase, A.; Young, A.L. Uses and gratifications of social media: A comparison of Facebook and instant messaging. Bull. Sci. Technol. Soc. 2010, 30, 350–361. [Google Scholar] [CrossRef]
- Mayr, P.; Weller, K. Think before you collect: Setting up a data collection approach for social media studies. In The SAGE Handbook of Social Media Research Methods; SAGE: Thousand Oaks, CA, USA, 2017; p. 107. [Google Scholar]
- Ellison, N.B.; Steinfield, C.; Lampe, C. The benefits of Facebook “friends”: Social capital and college students’ use of online social network sites. J. Comput. Mediat. Commun. 2007, 12, 1143–1168. [Google Scholar] [CrossRef]
- Abdullah, S.; Murnane, E.L.; Costa, J.M.R.; Choudhury, T. Collective smile: Measuring societal happiness from geolocated images. In Proceedings of the 18th ACM Conference on Computer Supported Cooperative Work & Social Computing, Vancouver, BC, Canada, 14–18 March 2015; ACM: New York, NY, USA, 2015; pp. 361–374. [Google Scholar]
- Bravo-Marquez, F.; Frank, E.; Pfahringer, B. From unlabelled tweets to twitter-specific opinion words. In Proceedings of the 38th International ACM SIGIR Conference on Research and Development in Information Retrieval, Santiago, Chile, 9–13 August 2015; ACM: New York, NY, USA, 2015; pp. 743–746. [Google Scholar]
- Quercia, D.; Ellis, J.; Capra, L.; Crowcroft, J. Tracking gross community happiness from tweets. In Proceedings of the ACM 2012 Conference on Computer Supported Cooperative Work, Seattle, WA, USA, 11–15 February 2012; ACM: New York, NY, USA, 2012; pp. 965–968. [Google Scholar]
- Gutierrez, F.J.; Poblete, B. Sentiment-based user profiles in microblogging platforms. In Proceedings of the 26th ACM Conference on Hypertext & Social Media, Guzelyurt, Northern Cyprus, 1–4 September 2015; ACM: New York, NY, USA, 2015; pp. 23–32. [Google Scholar]
- Beasley, A.; Mason, W. Emotional states vs. Emotional words in social media. In Proceedings of the ACM Web Science Conference, Oxford, UK, 28 June–1 July 2015; ACM: New York, NY, USA, 2015; p. 31. [Google Scholar]
- Saif, H.; He, Y.; Fernandez, M.; Alani, H. Contextual semantics for sentiment analysis of twitter. Inf. Process. Manag. 2016, 52, 5–19. [Google Scholar] [CrossRef]
- Akgül, E.S.; Ertano, C.; Banu, D. Twitter verileri ile duygu analizi. Pamukkale Üniv. Müh. Bilim. Derg. 2016, 22, 106–110. [Google Scholar]
- Kalamatianos, G.; Mallis, D.; Symeonidis, S.; Arampatzis, A. Sentiment analysis of greek tweets and hashtags using a sentiment lexicon. In Proceedings of the 19th Panhellenic Conference on Informatics, Athens, Greece, 1–3 October 2015; ACM: New York, NY, USA, 2015; pp. 63–68. [Google Scholar]
- Yamamoto, Y.; Kumamoto, T.; Nadamoto, A. Role of emoticons for multidimensional sentiment analysis of Twitter. In Proceedings of the 16th International Conference on Information Integration and Web-based Applications & Services, Hanoi, Viet Nam, 4–6 December 2014; ACM: New York, NY, USA, 2014; pp. 107–115. [Google Scholar]
- Yu, Y.; Wang, X. World cup 2014 in the Twitter world: A big data analysis of sentiments in us sports fans’ tweets. Comput. Hum. Behav. 2015, 48, 392–400. [Google Scholar] [CrossRef]
- Poblete, B.; Garcia, R.; Mendoza, M.; Jaimes, A. Do all birds tweet the same?: Characterizing Twitter around the world. In Proceedings of the 20th ACM International Conference on Information and Knowledge Management, Glasgow, UK, 24–28 October 2011; ACM: New York, NY, USA, 2011; pp. 1025–1030. [Google Scholar]
- Wang, C.-J.; Wang, P.-P.; Zhu, J.J.H. Discussing occupy wall street on Twitter: Longitudinal network analysis of equality, emotion, and stability of public discussion. Cyberpsychol. Behav. Soc. Netw. 2013, 16, 679–685. [Google Scholar] [CrossRef] [PubMed]
- Fu, K.-W.; Chan, C.-H. Analyzing online sentiment to predict telephone poll results. Cyberpsychol. Behav. Soc. Netw. 2013, 16, 702–707. [Google Scholar] [CrossRef] [PubMed] [Green Version]
- Correa, J.C.; Camargo, J.E. Ideological consumerism in Colombian elections, 2015: Links between political ideology, Twitter activity, and electoral results. Cyberpsychol. Behav. Soc. Netw. 2017, 20, 37–43. [Google Scholar] [CrossRef] [PubMed]
- Rice, T.W.; Steele, B.J. Subjective well-being and culture across time and space. J. Cross-Cult. Psychol. 2004, 35, 633–647. [Google Scholar] [CrossRef]
- Minkov, M. Nations with more dialectical selves exhibit lower polarization in life quality judgments and social opinions. Cross-Cult. Res. 2009, 43, 230–250. [Google Scholar] [CrossRef]
- Helliwell, J.F.; Barrington-Leigh, C.P.; Harris, A.; Huang, H. International Evidence on the Social Context of Well-Being; National Bureau of Economic Research: Cambridge, MA, USA, 2009. [Google Scholar]
- Diener, E.; Napa-Scollon, C.K.; Oishi, S.; Dzokoto, V.; Suh, E.M. Positivity and the construction of life satisfaction judgments: Global happiness is not the sum of its parts. J. Happiness Stud. 2000, 1, 159–176. [Google Scholar] [CrossRef]
- Angelini, V.; Cavapozzi, D.; Corazzini, L.; Paccagnella, O. Do danes and italians rate life satisfaction in the same way? Using vignettes to correct for individual-specific scale biases. Oxf. Bull. Econ. Stat. 2014, 76, 643–666. [Google Scholar] [CrossRef]
- Exton, C.; Smith, C.; Vandendriessche, D. Comparing Happiness Across the World: Does Culture Matter? OECD Statistics Working Papers; OECD Publishing: Paris, France, 2015. [Google Scholar]
- Braithwaite, S.R.; Giraud-Carrier, C.; West, J.; Barnes, M.D.; Hanson, C.L. Validating machine learning algorithms for Twitter data against established measures of suicidality. JMIR Ment. Health 2016, 3. [Google Scholar] [CrossRef] [PubMed]
- Lv, M.; Li, A.; Liu, T.; Zhu, T. Creating a Chinese suicide dictionary for identifying suicide risk on social media. PeerJ 2015, 3, e1455. [Google Scholar] [CrossRef] [PubMed]
- O’Dea, B.; Wan, S.; Batterham, P.J.; Calear, A.L.; Paris, C.; Christensen, H. Detecting suicidality on Twitter. Internet Interv. 2015, 2, 183–188. [Google Scholar] [CrossRef]
- Coppersmith, G.; Dredze, M.; Harman, C.; Hollingshead, K. From ADHD to SAD: Analyzing the language of mental health on Twitter through self-reported diagnoses. In Proceedings of the 2nd Workshop on Computational Linguistics and Clinical Psychology: From Linguistic Signal to Clinical Reality, Denver, CO, USA, 5 June 2015; pp. 1–10. [Google Scholar]
- Guan, L.; Hao, B.; Cheng, Q.; Yip, P.S.; Zhu, T. Identifying Chinese microblog users with high suicide probability using internet-based profile and linguistic features: Classification model. JMIR Ment. Health 2015, 2. [Google Scholar] [CrossRef] [PubMed]
- Tsugawa, S.; Kikuchi, Y.; Kishino, F.; Nakajima, K.; Itoh, Y.; Ohsaki, H. Recognizing depression from Twitter activity. In Proceedings of the 33rd Annual ACM Conference on Human Factors in Computing Systems, Seoul, Korea, 18–23 April 2015; ACM: New York, NY, USA, 2015; pp. 3187–3196. [Google Scholar]
- Liu, P.; Tov, W.; Kosinski, M.; Stillwell, D.J.; Qiu, L. Do Facebook status updates reflect subjective well-being? Cyberpsychol. Behav. Soc. Netw. 2015, 18, 373–379. [Google Scholar] [CrossRef] [PubMed]
- Park, S.; Kim, I.; Lee, S.W.; Yoo, J.; Jeong, B.; Cha, M. Manifestation of depression and loneliness on social networks: A case study of young adults on Facebook. In Proceedings of the 18th ACM Conference on Computer Supported Cooperative Work & Social Computing, Vancouver, BC, Canada, 14–18 March 2015; ACM: New York, NY, USA, 2015; pp. 557–570. [Google Scholar]
- De Choudhury, M.; Counts, S.; Horvitz, E.J.; Hoff, A. Characterizing and predicting postpartum depression from shared Facebook data. In Proceedings of the 17th ACM Conference on Computer Supported Cooperative Work & Social Computing, Baltimore, MD, USA, 15–19 February 2014; ACM: New York, NY, USA, 2014; pp. 626–638. [Google Scholar]
- Park, S.; Lee, S.W.; Kwak, J.; Cha, M.; Jeong, B. Activities on Facebook reveal the depressive state of users. J. Med. Internet Res. 2013, 15. [Google Scholar] [CrossRef] [PubMed]
- Youyou, W.; Kosinski, M.; Stillwell, D. Computer-based personality judgments are more accurate than those made by humans. Proc. Natl. Acad. Sci. USA 2015, 112, 1036–1040. [Google Scholar] [CrossRef] [PubMed]
- Chancellor, S.; Lin, Z.; Goodman, E.L.; Zerwas, S.; De Choudhury, M. Quantifying and predicting mental illness severity in online pro-eating disorder communities. In Proceedings of the 19th ACM Conference on Computer-Supported Cooperative Work & Social Computing, San Francisco, CA, USA, 27 February–2 March 2016; ACM: New York, NY, USA, 2016; pp. 1171–1184. [Google Scholar]
- Coppersmith, G.; Ngo, K.; Leary, R.; Wood, A. Exploratory analysis of social media prior to a suicide attempt. In Proceedings of the 3rd Workshop on Computational Linguistics and Clinical Psychology: From Linguistic Signal to Clinical Reality, San Diego, CA, USA, 16 June 2016; pp. 106–117. [Google Scholar]
- Burnap, P.; Colombo, W.; Scourfield, J. Machine classification and analysis of suicide-related communication on Twitter. In Proceedings of the 26th ACM Conference on Hypertext & Social Media, Guzelyurt, Northern Cyprus, 1–4 September 2015; ACM: New York, NY, USA, 2015; pp. 75–84. [Google Scholar]
- Coppersmith, G.A.; Harman, C.T.; Dredze, M.H. Measuring Post Traumatic Stress Disorder in Twitter. In Proceedings of the Eighth International AAAI Conference on Weblogs and Social Media, Ann Arbor, MI, USA, 1–4 June 2014. [Google Scholar]
- Huang, X.; Zhang, L.; Chiu, D.; Liu, T.; Li, X.; Zhu, T. Detecting suicidal ideation in Chinese microblogs with psychological lexicons. In Proceedings of the 2014 IEEE 11th International Conference on Ubiquitous Intelligence and Computing and IEEE 11th International Conference on Autonomic and Trusted Computing and IEEE 14th International Conference on Scalable Computing and Communications and Its Associated Workshops (UTC-ATC-ScalCom), Bali, Indonesia, 9–12 December 2014; pp. 844–849. [Google Scholar]
- Ertugrul, A.M.; Onal, I.; Acarturk, C. Does the strength of sentiment matter? A regression based approach on Turkish social media. In Natural Language Processing and Information Systems, Proceedings of the 22nd International Conference on Applications of Natural Language to Information Systems (NLDB 2017), Liège, Belgium, 21–23 June 2017; Frasincar, F., Ittoo, A., Nguyen, L.M., Métais, E., Eds.; Springer International Publishing: Cham, Switzerland, 2017; pp. 149–155. [Google Scholar]
- Wongkoblap, A.; Vadillo, M.A.; Curcin, V. Researching mental health disorders in the era of social media: Systematic review. J. Med. Internet Res. 2017, 19, e228. [Google Scholar] [CrossRef] [PubMed]
- Ferraro, J. The Strategic Project Leader: Mastering Service-Based Project Leadership; CRC Press: Boca Raton, FL, USA, 2007. [Google Scholar]
- Duncan, W.R. A Guide to the Project Management Body of Knowledge; Project Management Institute: Newtown Square, PA, USA, 1996. [Google Scholar]
- Ahmad, K.; Almas, Y. Visualising sentiments in financial texts? In Proceedings of the Ninth International Conference on Information Visualisation, London, UK, 6–8 July 2005; pp. 363–368. [Google Scholar]
- Chaovalit, P.; Zhou, L. Movie review mining: A comparison between supervised and unsupervised classification approaches. In Proceedings of the 38th Annual Hawaii International Conference on System Sciences (HICSS’05), Big Island, HI, USA, 6 January 2005. [Google Scholar]
- Xu, D.J.; Liao, S.S.; Li, Q. Combining empirical experimentation and modeling techniques: A design research approach for personalized mobile advertising applications. Decis. Support Syst. 2008, 44, 710–724. [Google Scholar] [CrossRef]
- Yuan, S.-T. A personalized and integrative comparison-shopping engine and its applications. Decis. Support Syst. 2003, 34, 139–156. [Google Scholar] [CrossRef]
- Jain, G.; Ginwala, A.; Aslandogan, Y.A. An approach to text classification using dimensionality reduction and combination of classifiers. In Proceedings of the 2004 IEEE International Conference on Information Reuse and Integration (IRI 2004), Las Vegas, NV, USA, 8–10 November 2004; pp. 564–569. [Google Scholar]
- Huang, R.; Hansen, J.H. Dialect classification on printed text using perplexity measure and conditional random fields. In Proceedings of the IEEE International Conference on Acoustics, Speech and Signal Processing (ICASSP 2007), Honolulu, HI, USA, 15–20 April 2007; pp. IV-993–IV-996. [Google Scholar]
- Li, N.; Wu, D.D. Using text mining and sentiment analysis for online forums hotspot detection and forecast. Decis. Support Syst. 2010, 48, 354–368. [Google Scholar] [CrossRef]
- Turney, P.D.; Littman, M.L. Measuring praise and criticism: Inference of semantic orientation from association. ACM Trans. Inf. Syst. (TOIS) 2003, 21, 315–346. [Google Scholar] [CrossRef]
- Thelwall, M.; Buckley, K.; Paltoglou, G. Sentiment strength detection for the social web. J. Assoc. Inf. Sci. Technol. 2012, 63, 163–173. [Google Scholar] [CrossRef]
- Thelwall, M.; Buckley, K.; Paltoglou, G.; Cai, D.; Kappas, A. Sentiment strength detection in short informal text. J. Assoc. Inf. Sci. Technol. 2010, 61, 2544–2558. [Google Scholar] [CrossRef]
- Thelwall, M.; Buckley, K. Topic-based sentiment analysis for the social web: The role of mood and issue-related words. J. Assoc. Inf. Sci. Technol. 2013, 64, 1608–1617. [Google Scholar] [CrossRef]
- Vural, A.G.; Cambazoglu, B.B.; Senkul, P.; Tokgoz, Z.O. A framework for sentiment analysis in Turkish: Application to polarity detection of movie reviews in Turkish. In Computer and Information Sciences III; Springer: London, UK, 2013; pp. 437–445. [Google Scholar]
- Kucuktunc, O.; Cambazoglu, B.B.; Weber, I.; Ferhatosmanoglu, H. A large-scale sentiment analysis for yahoo! Answers. In Proceedings of the Fifth ACM International Conference on Web Search and Data Mining, Seattle, WA, USA, 8–12 February 2012; ACM: New York, NY, USA, 2012; pp. 633–642. [Google Scholar]
- Garas, A.; Garcia, D.; Skowron, M.; Schweitzer, F. Emotional persistence in online chatting communities. Sci. Rep. 2012, 2, 402. [Google Scholar] [CrossRef] [PubMed]
- Grigore, M.; Rosenkranz, C. Increasing the willingness to collaborate online: An analysis of sentiment-driven interactions in peer content production. In Proceedings of the Thirty Second International Conference on Information Systems, Shanghai, China, 4–7 December 2011. [Google Scholar]
- Giannopoulos, G.; Weber, I.; Jaimes, A.; Sellis, T. Diversifying user comments on news articles. In Proceedings of the International Conference on Web Information Systems Engineering, Paphos, Cyprus, 28–30 November 2012; Springer: Berlin/Heidelberg, Germany, 2012; pp. 100–113. [Google Scholar]
- Zheludev, I.; Smith, R.; Aste, T. When can social media lead financial markets? Sci. Rep. 2014, 4, 4213. [Google Scholar] [CrossRef] [PubMed] [Green Version]
- Durahim, A.O.; Coşkun, M. #iamhappybecause: Gross national happiness through Twitter analysis and big data. Technol. Forecast. Soc. Chang. 2015, 99, 92–105. [Google Scholar]
- Pfitzner, R.; Garas, A.; Schweitzer, F. Emotional divergence influences information spreading in Twitter. In Proceedings of the Sixth International AAAI Conference on Weblogs and Social Media, Dublin, Ireland, 4–8 June 2012; Volume 12, pp. 2–5. [Google Scholar]
- Rudra, K.; Chakraborty, A.; Ganguly, N.; Ghosh, S. Understanding the usage of idioms in the Twitter Social Network. In Pattern Recognition and Big Data; World Scientific: Singapore, 2017; pp. 767–788. [Google Scholar]
- Priesner, S. Gross national happiness—Bhutan’s vision of development and its challenges. Indig. Universality Soc. Sci. South Asian Response 1999, 2, 212–233. [Google Scholar] [CrossRef]
- Kramer, A.D. An unobtrusive behavioral model of gross national happiness. In Proceedings of the SIGCHI Conference on Human Factors in Computing Systems, Atlanta, GA, USA, 10–15 April 2010; ACM: New York, NY, USA, 2010; pp. 287–290. [Google Scholar]
- Zheng, X.; Han, J.; Sun, A. A survey of location prediction on Twitter. arXiv, 2017; arXiv:preprint/1705.03172. [Google Scholar]
- Vieweg, S.; Hughes, A.L.; Starbird, K.; Palen, L. Microblogging during two natural hazards events: What Twitter may contribute to situational awareness. In Proceedings of the SIGCHI Conference on Human Factors in Computing Systems, Atlanta, GA, USA, 10–15 April 2010; ACM: New York, NY, USA, 2010; pp. 1079–1088. [Google Scholar]
- Krejcie, R.V.; Morgan, D.W. Determining sample size for research activities. Educ. Psychol. Meas. 1970, 30, 607–610. [Google Scholar] [CrossRef]
- Stats, I.L. Number of Internet Users. Available online: http://www.internetlivestats.com/internet-users (accessed on 24 August 2017).
- Rost, B.; Sander, C. Prediction of protein secondary structure at better than 70% accuracy. J. Mol. Boil. 1993, 232, 584–599. [Google Scholar] [CrossRef] [PubMed]
- Helliwell, J.F.; Huang, H.; Wang, S. The Distribution of World Happiness; World Happiness Report; The Earth Institute Columbia University Press: New York, NY, USA, 2016; Volume 8, ISBN 978-0-9968513-3-6. [Google Scholar]
- Tole, A.A. Big data challenges. Database Syst. J. 2013, 4, 31–40. [Google Scholar]
- Nakov, P.; Rosenthal, S.; Kiritchenko, S.; Mohammad, S.M.; Kozareva, Z.; Ritter, A.; Stoyanov, V.; Zhu, X. Developing a successful SemEval task in sentiment analysis of Twitter and other social media texts. Lang. Resour. Eval. 2016, 50, 35–65. [Google Scholar] [CrossRef]
- Nakov, P.; Ritter, A.; Rosenthal, S.; Sebastiani, F.; Stoyanov, V. SemEval-2016 task 4: Sentiment analysis in Twitter. In Proceedings of the 10th International Workshop on Semantic Evaluation (SemEval-2016), San Diego, CA, USA, 16–17 June 2016. [Google Scholar]
- Rosenthal, S.; Farra, N.; Nakov, P. SemEval-2017 task 4: Sentiment analysis in Twitter. In Proceedings of the 11th International Workshop on Semantic Evaluation (SemEval-2017), Vancouver, BC, Canada, 3–4 August 2017. [Google Scholar]
- Giachanou, A.; Crestani, F. Like it or not: A survey of Twitter sentiment analysis methods. ACM Comput. Surv. (CSUR) 2016, 49. [Google Scholar] [CrossRef]
- Pang, B.; Lee, L.; Vaithyanathan, S. Thumbs up? Sentiment classification using machine learning techniques. In Proceedings of the ACL-02 Conference on Empirical Methods in Natural Language Processing, Philadelphia, PA, USA, 6–7 July 2002; Association for Computational Linguistics: Stroudsburg, PA, USA, 2002; Volume 10. [Google Scholar]
- Poria, S.; Cambria, E.; Howard, N.; Huang, G.-B.; Hussain, A. Fusing audio, visual and textual clues for sentiment analysis from multimodal content. Neurocomputing 2016, 174, 50–59. [Google Scholar] [CrossRef]
- Chaturvedi, I.; Cambria, E.; Vilares, D. Lyapunov filtering of objectivity for Spanish sentiment model. In Proceedings of the 2016 International Joint Conference on Neural Networks (IJCNN), Vancouver, BC, Canada, 24–29 July 2016. [Google Scholar]
Figure 1.
Proposed Sentiment Analysis (Polarity Calculation) Algorithm.

Figure 2.
Proposed GNH-TD Calculation Algorithm.
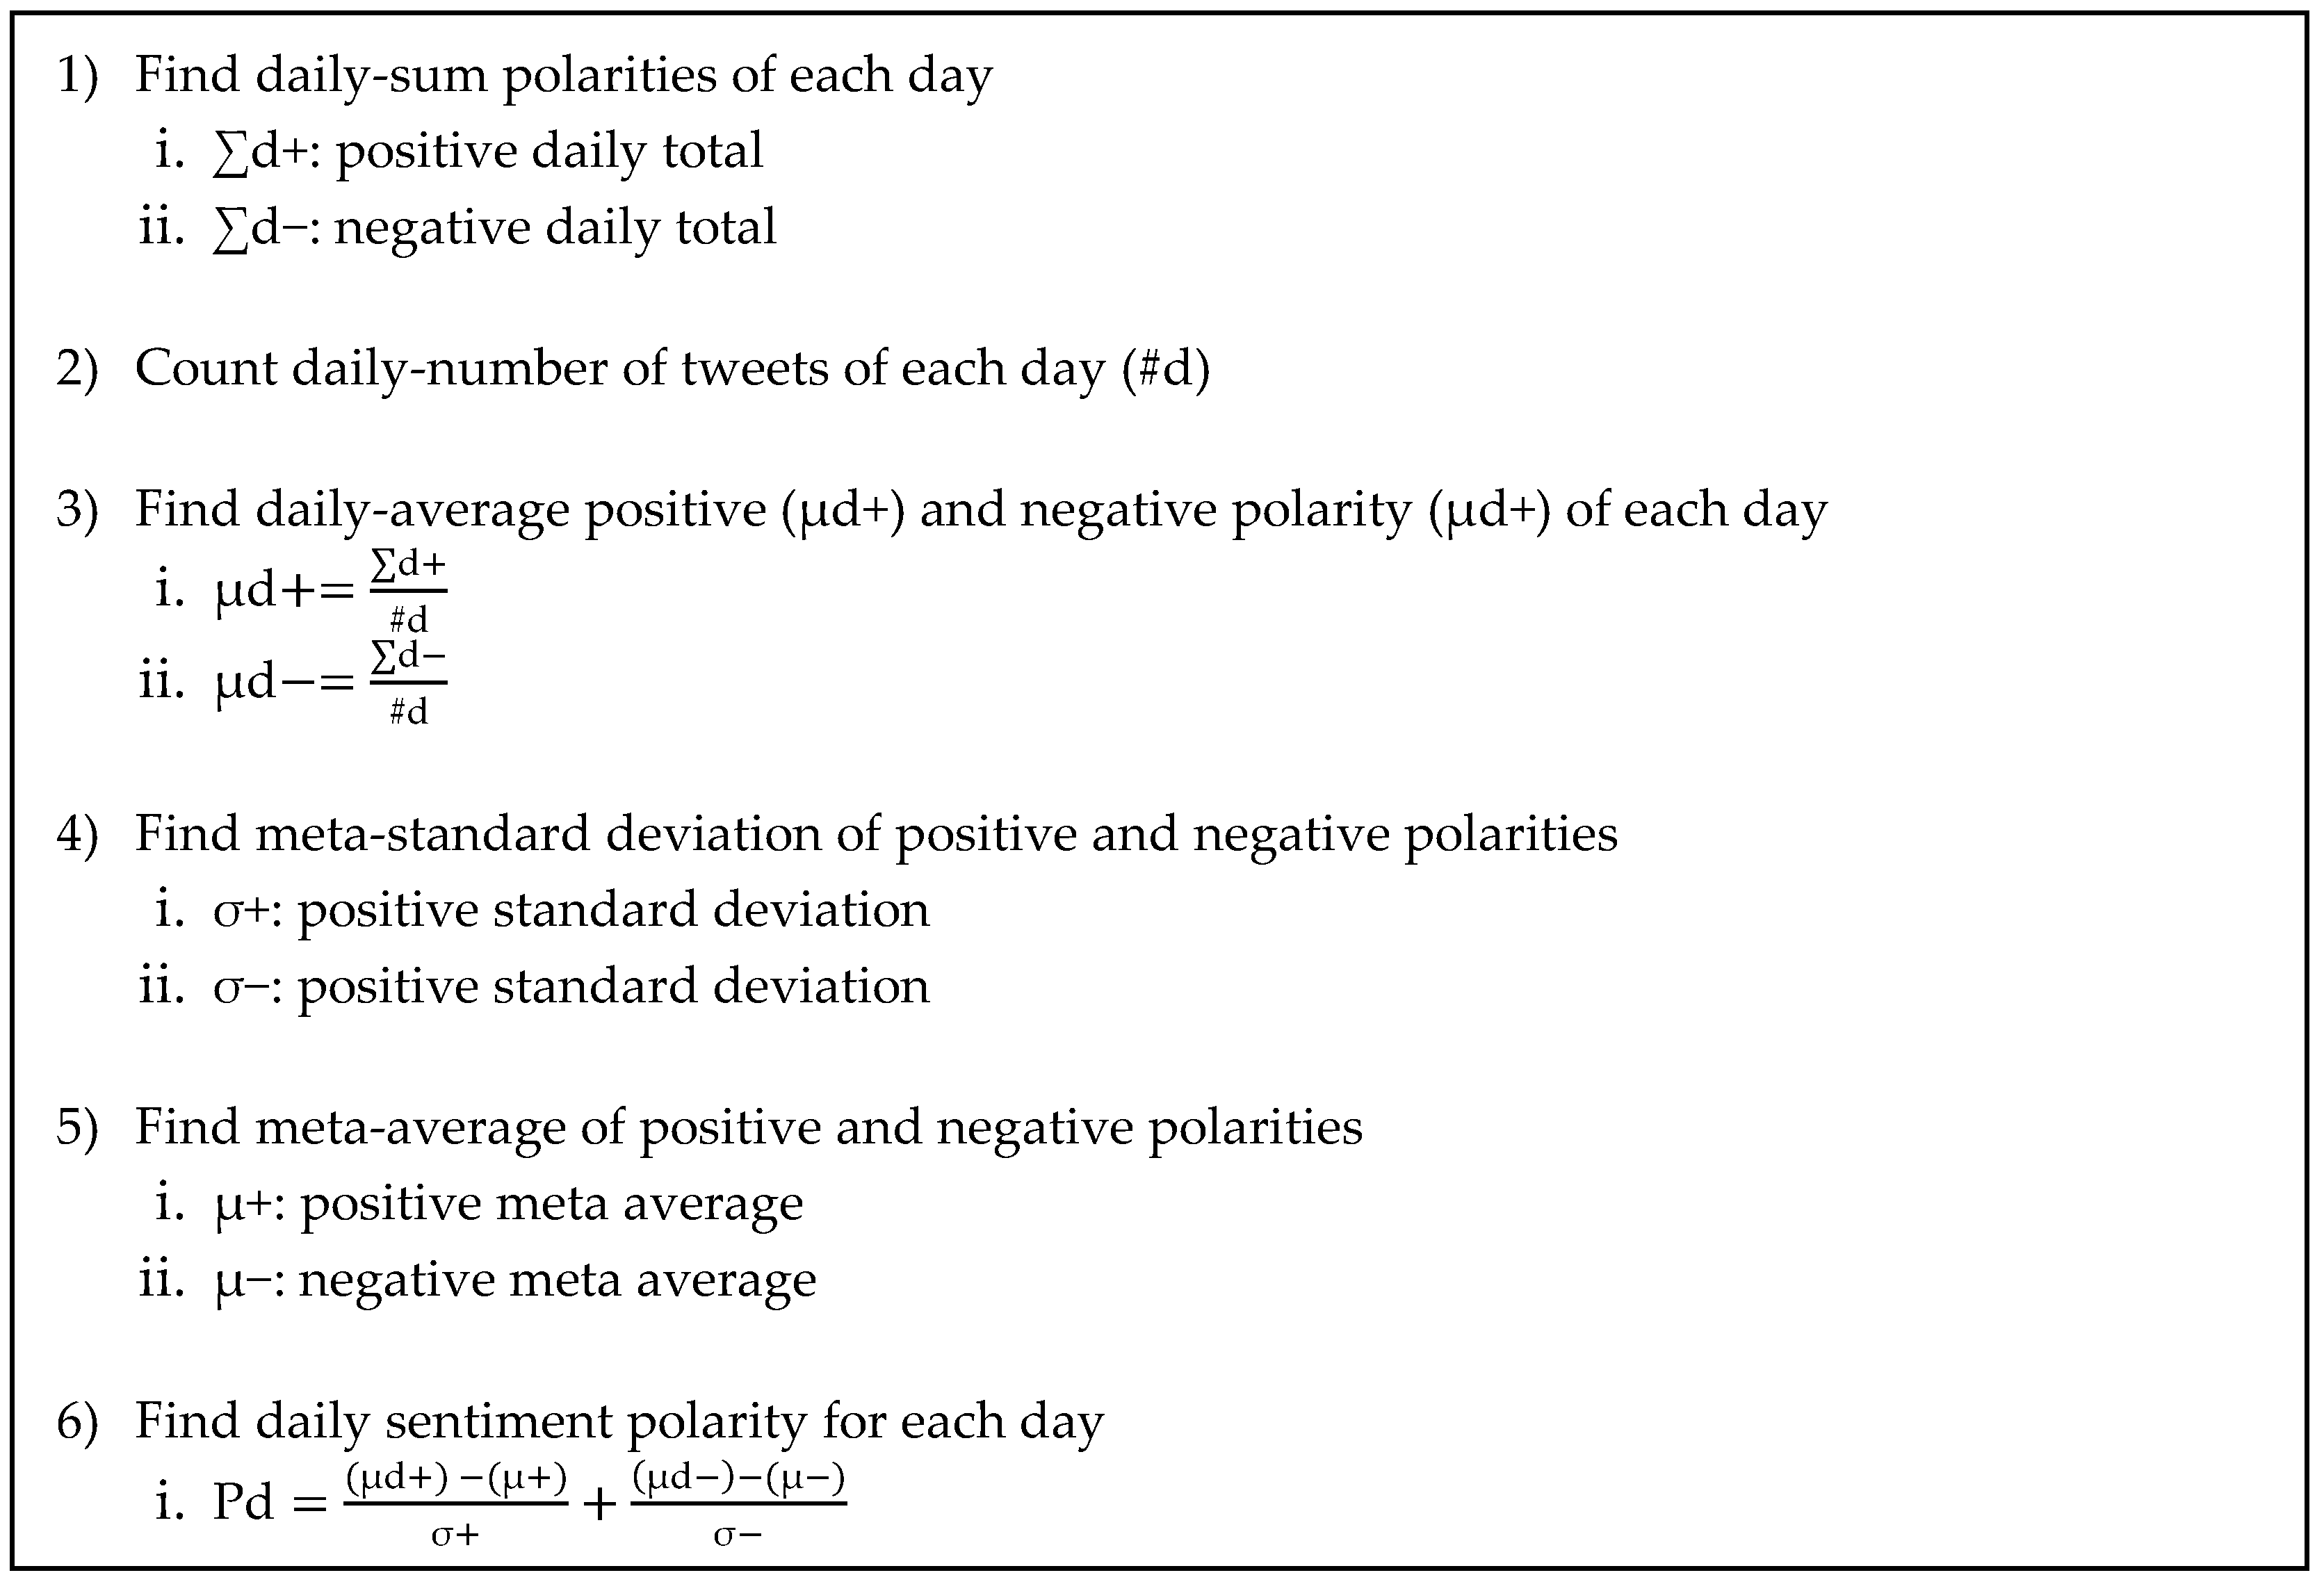
Figure 3.
Social Media Data Collection Methodology.

Figure 4.
The Eleven European Countries chosen for the analysis.

Figure 5.
Sample Sentiment Analysis Report of a Tweet.

Figure 6.
Gradient Color Map of GNH for 9 European Countries between 2010 and 2015 (Red-Unhappy...Green-Happy).
Figure 6.
Gradient Color Map of GNH for 9 European Countries between 2010 and 2015 (Red-Unhappy...Green-Happy).
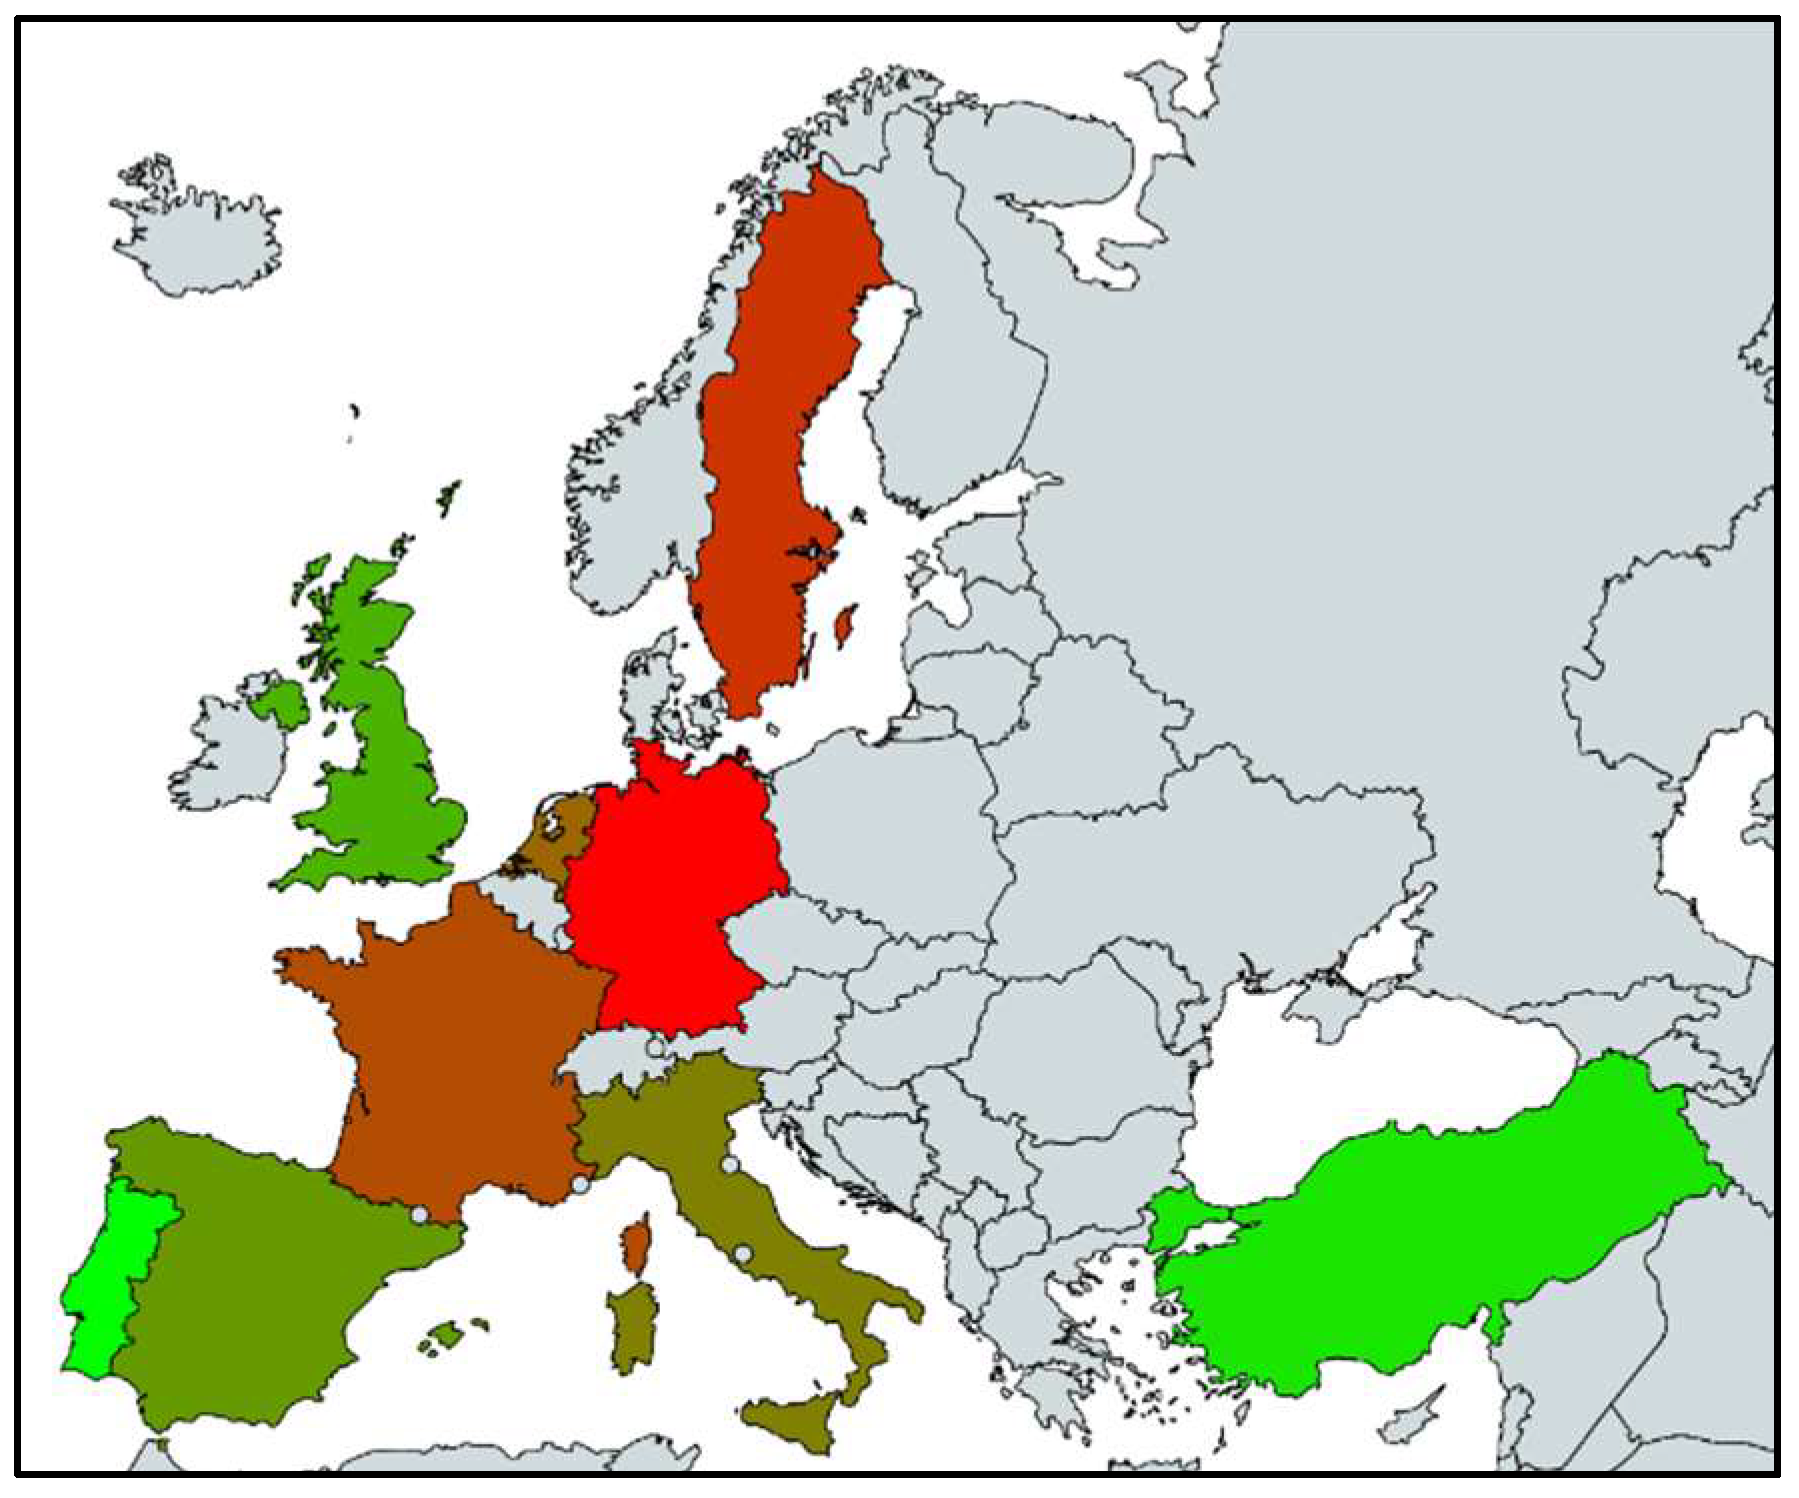
Figure 7.
Yearly Average GNH values of Countries.

Figure 8.
Daily Sentiment Polarities of EU Countries from 2010 to 2015.


Table 1.
The ten European Countries and their main languages chosen for the analysis.
| Country | Language | |
|---|---|---|
| 1 | Germany | German |
| 2 | The Netherlands | Dutch |
| 3 | France | French |
| 4 | Greece | Greek |
| 5 | Italy | Italian |
| 6 | Portugal | Portuguese |
| 7 | Sweden | Swedish |
| 8 | Poland | Polish |
| 9 | Spain | Spanish |
| 10 | Turkey | Turkish |
| 11 | United Kingdom | English |
Table 2.
Sample Frame and Number of Accessed Users.
| Country | Internet Users [75] (A) | Total Country Population [75] (B) | Number of Trend Topics Accessed | Total Accessed Users | Using National Language and Created Before 01/01/2010 (C) | Ratio to Total Population (B)/5000 |
|---|---|---|---|---|---|---|
| Germany | 71,727,551 | 82,652,256 | 1688 | 1,208,375 | 19,868 | 16,530 |
| United Kingdom | 57,075,826 | 63,489,234 | 789 | 119,335 | 15,856 | 12,698 |
| France | 55,429,382 | 64,641,279 | 3750 | 1,679,862 | 15,414 | 12,928 |
| Italy | 36,593,969 | 61,070,224 | 2660 | 1,308,952 | 14,487 | 12,214 |
| Turkey | 35,358,888 | 75,837,020 | 6189 | 1,075,541 | 17,709 | 15,167 |
| Spain | 35,010,273 | 47,066,402 | 1611 | 446,803 | 13,058 | 9413 |
| Poland | 25,666,238 | 38,220,543 | 1669 | 1,161,760 | 1139 | 7644 |
| The Netherlands | 16,143,879 | 16,802,463 | 288 | 194,570 | 5663 | 3360 |
| Sweden | 8,581,261 | 9,631,261 | 1488 | 1,119,278 | 2777 | 1926 |
| Portugal | 7,015,519 | 10,610,304 | 142 | 180,674 | 3370 | 2122 |
| Greece | 6,438,325 | 11,128,404 | 1060 | 792,048 | 721 | 2226 |
| TOTAL | 355,041,111 | 481,149,390 | 21,334 | 9,287,198 | 110,062 | 96,230 |
Table 3.
Yearly number of tweets collected for countries.
| Country | 2010 | 2011 | 2012 | 2013 | 2014 | 2015 |
|---|---|---|---|---|---|---|
| Germany | 1,594,312 | 2,167,848 | 3,446,841 | 5,579,979 | 11,038,771 | 14,500,870 |
| United Kingdom | 264,460 | 696,529 | 1,987,674 | 4,127,235 | 10,243,911 | 26,893,481 |
| France | 442,461 | 976,445 | 2,594,032 | 4,762,945 | 9,608,994 | 19,044,399 |
| Italy | 430,638 | 1,027,982 | 3,371,571 | 5,547,187 | 8,791,952 | 14,411,831 |
| Turkey | 141,592 | 595,032 | 2,162,091 | 5,097,690 | 7,707,706 | 11,430,470 |
| Spain | 174,285 | 626,509 | 1,748,940 | 3,613,995 | 8,966,293 | 25,190,433 |
| The Netherlands | 330,863 | 907,171 | 1,543,801 | 2,384,925 | 4,686,031 | 7,841,054 |
| Sweden | 131,119 | 258,425 | 689,734 | 1,190,342 | 2,031,537 | 2,114,549 |
| Portugal | 116,946 | 250,063 | 390,444 | 840,847 | 2,372,739 | 6,754,129 |
Table 4.
Results of Face Validity Pearson’s Correlation Analysis.
| GNH-TD National Market Index | GNH-TD EUR-USD | GNH-TD GBP-USD | GNH-TD GBP-EUR | ||
|---|---|---|---|---|---|
| Germany | Pearson Correlation | −0.731 ** | 0.498 ** | 0.059 * | 0.589 ** |
| DAX | Sig. (2-tailed) | 0 | 0 | 0.019 | 0 |
| n | 1527 | 1565 | 1565 | 1565 | |
| United Kingdom | Pearson Correlation | −0.603 ** | 0.627 ** | 0.124 ** | 0.714 ** |
| FTSE100 | Sig. (2-tailed) | 0 | 0 | 0 | 0 |
| n | 1514 | 1565 | 1565 | 1565 | |
| France | Pearson Correlation | −0.537 ** | 0.494 ** | 0.079 ** | 0.572 ** |
| CAC40 | Sig. (2-tailed) | 0 | 0 | 0.002 | 0 |
| n | 1537 | 1565 | 1565 | 1565 | |
| Italy | Pearson Correlation | −0.183 ** | 0.417 ** | −0.044 | 0.545 ** |
| FTSEMIB | Sig. (2-tailed) | 0 | 0 | 0.081 | 0 |
| n | 1538 | 1565 | 1565 | 1565 | |
| Turkey | Pearson Correlation | −0.548 ** | 0.506 ** | −0.004 | 0.631 ** |
| BIST100 | Sig. (2-tailed) | 0 | 0 | 0.888 | 0 |
| n | 1511 | 1565 | 1565 | 1565 | |
| Spain | Pearson Correlation | −0.268 ** | 0.503 ** | 0.054 * | 0.597 ** |
| IBEX35 | Sig. (2-tailed) | 0 | 0 | 0.033 | 0 |
| n | 1535 | 1565 | 1565 | 1565 | |
| The Netherlands | Pearson Correlation | −0.687 ** | 0.551 ** | 0.184 ** | 0.584 ** |
| AEX | Sig. (2-tailed) | 0 | 0 | 0 | 0 |
| n | 1537 | 1565 | 1565 | 1565 | |
| Sweden | Pearson Correlation | −0.641 ** | 0.469 ** | 0.056 * | 0.551 ** |
| OMX30 | Sig. (2-tailed) | 0 | 0 | 0.026 | 0 |
| n | 1506 | 1565 | 1565 | 1565 | |
| Portugal | Pearson Correlation | 0.344 ** | 0.585 ** | 0.118 ** | 0.664 ** |
| PSI20 | Sig. (2-tailed) | 0 | 0 | 0 | 0 |
| n | 1440 | 1565 | 1565 | 1565 |
** Correlation is significant at the 0.01 level (2-tailed); * Correlation is significant at the 0.05 level (2-tailed).
Table 5.
Convergent Validity Analysis Results.
| OECD-Better Life Index | GNH-TD | ||
|---|---|---|---|
| OECD-Better Life Index | Pearson Correlation | 1 | 0.854 ** |
| Sig. (2-tailed) | 0.000 | ||
| n | 36 | 36 | |
| GNH-TD | Pearson Correlation | 0.854 ** | 1 |
| Sig. (2-tailed) | 0.000 | ||
| n | 36 | 36 | |
** Correlation is significant at the 0.01 level (2-tailed).
Table 6.
Mean and Standard Deviation of Polarities and Threshold Values.
| Country | Mean (Negative) | Standard Deviation (Negative) | Negative Threshold | Mean (Positive) | Standard Deviation (Positive) | Positive Threshold |
|---|---|---|---|---|---|---|
| Germany | −1.2192 | 0.6364 | <−2.492 | 1.3684 | 0.6307 | >2.6298 |
| United Kingdom | −1.4522 | 0.8271 | <−3.1064 | 1.5253 | 0.7507 | >3.0267 |
| France | −1.4936 | 0.8214 | <−3.1364 | 1.2965 | 0.5799 | >2.4563 |
| Italy | −1.1926 | 0.549 | <−2.2906 | 1.2906 | 0.5678 | >2.4262 |
| Turkey | −1.1579 | 0.5092 | <−2.1763 | 1.2656 | 0.5526 | >2.3708 |
| Spain | −1.4155 | 0.79 | <−2.9955 | 1.6825 | 0.9871 | >3.6567 |
| The Netherlands | −1.3444 | 0.6957 | <−2.7358 | 1.2974 | 0.613 | >2.5234 |
| Sweden | −1.2122 | 0.5478 | <−2.3078 | 1.293 | 0.5725 | >2.438 |
| Portugal | −1.3959 | 0.7635 | <−2.9229 | 1.3422 | 0.6323 | >2.6068 |
Table 7.
Detection Accuracy Results.
| Country | Number of Event Days in Wikipedia Pages | Number of Matching Days from GNH-TD | Detection Accuracy |
|---|---|---|---|
| Germany | 105 | 74 | 70.48% |
| United Kingdom | 121 | 104 | 85.95% |
| France | 137 | 112 | 81.75% |
| Italy | 112 | 83 | 74.11% |
| Turkey | 163 | 146 | 89.57% |
| Spain | 72 | 52 | 72.22% |
| The Netherlands | 84 | 59 | 70.24% |
| Sweden | 69 | 57 | 82.61% |
| Portugal | 58 | 42 | 72.41% |
Table 8.
Yearly Average GNH-TD of Countries for 6 years period.
| Country | Average Sentiment Polarity |
|---|---|
| Germany | 0.040165 |
| Sweden | 0.040715 |
| France | 0.050131 |
| The Netherlands | 0.055155 |
| Italy | 0.058553 |
| Spain | 0.085874 |
| United Kingdom | 0.104333 |
| Turkey | 0.105635 |
| Portugal | 0.132342 |
© 2018 by the authors. Licensee MDPI, Basel, Switzerland. This article is an open access article distributed under the terms and conditions of the Creative Commons Attribution (CC BY) license (http://creativecommons.org/licenses/by/4.0/).
Share and Cite
MDPI and ACS Style
Coşkun, M.; Ozturan, M. #europehappinessmap: A Framework for Multi-Lingual Sentiment Analysis via Social Media Big Data (A Twitter Case Study). Information 2018, 9, 102. https://doi.org/10.3390/info9050102
AMA Style
Coşkun M, Ozturan M. #europehappinessmap: A Framework for Multi-Lingual Sentiment Analysis via Social Media Big Data (A Twitter Case Study). Information. 2018; 9(5):102. https://doi.org/10.3390/info9050102
Chicago/Turabian StyleCoşkun, Mustafa, and Meltem Ozturan. 2018. "#europehappinessmap: A Framework for Multi-Lingual Sentiment Analysis via Social Media Big Data (A Twitter Case Study)" Information 9, no. 5: 102. https://doi.org/10.3390/info9050102
Note that from the first issue of 2016, this journal uses article numbers instead of page numbers. See further details here.