Hybrid Visualization Approach to Show Documents Similarity and Content in a Single View


Departamento de Matemática e Computação, São Paulo State University—UNESP, Presidente Prudente 19060-900, Brazil
*
Author to whom correspondence should be addressed.
Information 2018, 9(6), 129; https://doi.org/10.3390/info9060129
Submission received: 27 February 2018
/
Revised: 16 May 2018
/
Accepted: 17 May 2018
/
Published: 23 May 2018
(This article belongs to the Special Issue Information Technology: New Generations (ITNG 2017))
Abstract
:Multidimensional projection techniques can be employed to project datasets from a higher to a lower dimensional space (e.g., 2D space). These techniques can be used to present the relationships of dataset instances based on distance by grouping or separating clusters of instances in the projected space. Several works have used multidimensional projections to aid in the exploration of document collections. Even though the projection techniques can organize a dataset, the user needs to read each document to understand the cluster generation. Alternatively, techniques such as topic extraction or tag clouds can be employed to present a summary of the document contents. To minimize the exploratory work and to aid in cluster analysis, this work proposes a new hybrid visualization to show both document relationship and content in a single view, employing multidimensional projections to relate documents and tag clouds. We show the effectiveness of the proposed approach in the exploration of two document collections composed by world news.
1. Introduction
Nowadays, a large amount of textual data is produced from distinct sources, and organizing and exploring this amount of data is very difficult. In order to improve the data analysis, computational tools have been proposed, such as data mining and visualization techniques. Some visualization techniques can be employed to present the dataset instances’ similarities in 2D space; thus, the groups are naturally created according to the feature space that describes the dataset. Usually, multidimensional projection techniques [1,2,3] are employed in this visualization process by reducing the dataset dimensionality to two dimensions.
To improve the exploration and analysis based on multidimensional projection techniques, Silva and Eler [4] proposed a hybrid visualization approach to map the instances’ similarities in 2D space, showing clusters of similar instances and presenting an image for each instance to highlight the attributes’ behavior. Further, to aid in understanding the similarity relationship between instances, the previous approach enables the user to differentiate instances from distinct classes that share a common boundary. This paper presents an extension for the previous approach, in which we propose a hybrid visualization approach to map the document similarities in 2D space and to show tag clouds for each document, presenting the key terms of the textual data. The visualization of similarities and key terms in a single view can improve the textual data exploration and aid in understanding the groups’ formation.
The main contribution of this paper is to aid the exploration of textual datasets based on the proposed hybrid visualization approach, which maps the similarities and text content in a unique visualization. This approach uses all dataset attributes to generate the visual representation and show some key terms from textual data; thus, the user can understand key topics of distinct clusters. In addition, the individual tag cloud visualization can aid users in understanding the formation of groups of similar instances and improve the detection of the boundary between distinct groups. We also introduce some interaction mechanisms to improve the user experience during the exploratory process.
This paper is organized as follows. Section 2 presents the theoretical foundation of visualization techniques employed in this work: multidimensional projection and tag clouds. Section 3 presents the hybrid approach proposed in this work. Section 4 presents the exploration and analysis of two textual datasets composed of world news. Section 5 concludes the paper, by summarizing the main achievements and commenting on future works.
2. Background
Visualization is a research area, the main goal of which is to enable exploration, understanding and analysis of datasets through interactive visual explorations [5]. Visualization techniques generate graphical representations to facilitate the user’s comprehension and perception during a dataset exploration [6,7]. This work is based on two visualization techniques: multidimensional projection and tag clouds.
The multidimensional projection technique aims to map the instances’ similarities from the original space to a lower dimensional space. The dataset instances are mapped according to the similarity relationships from the original multidimensional space [1,8,9]. Thus, the groups and neighborhood from the original space are kept in the lower dimensional space; in this work, they are projected in 2D space. Scatter plots are used as graphical representations, but, instead of using two attributes from the dataset, the X and Y positions are computed based on all attributes that are projected to two dimensions [4].
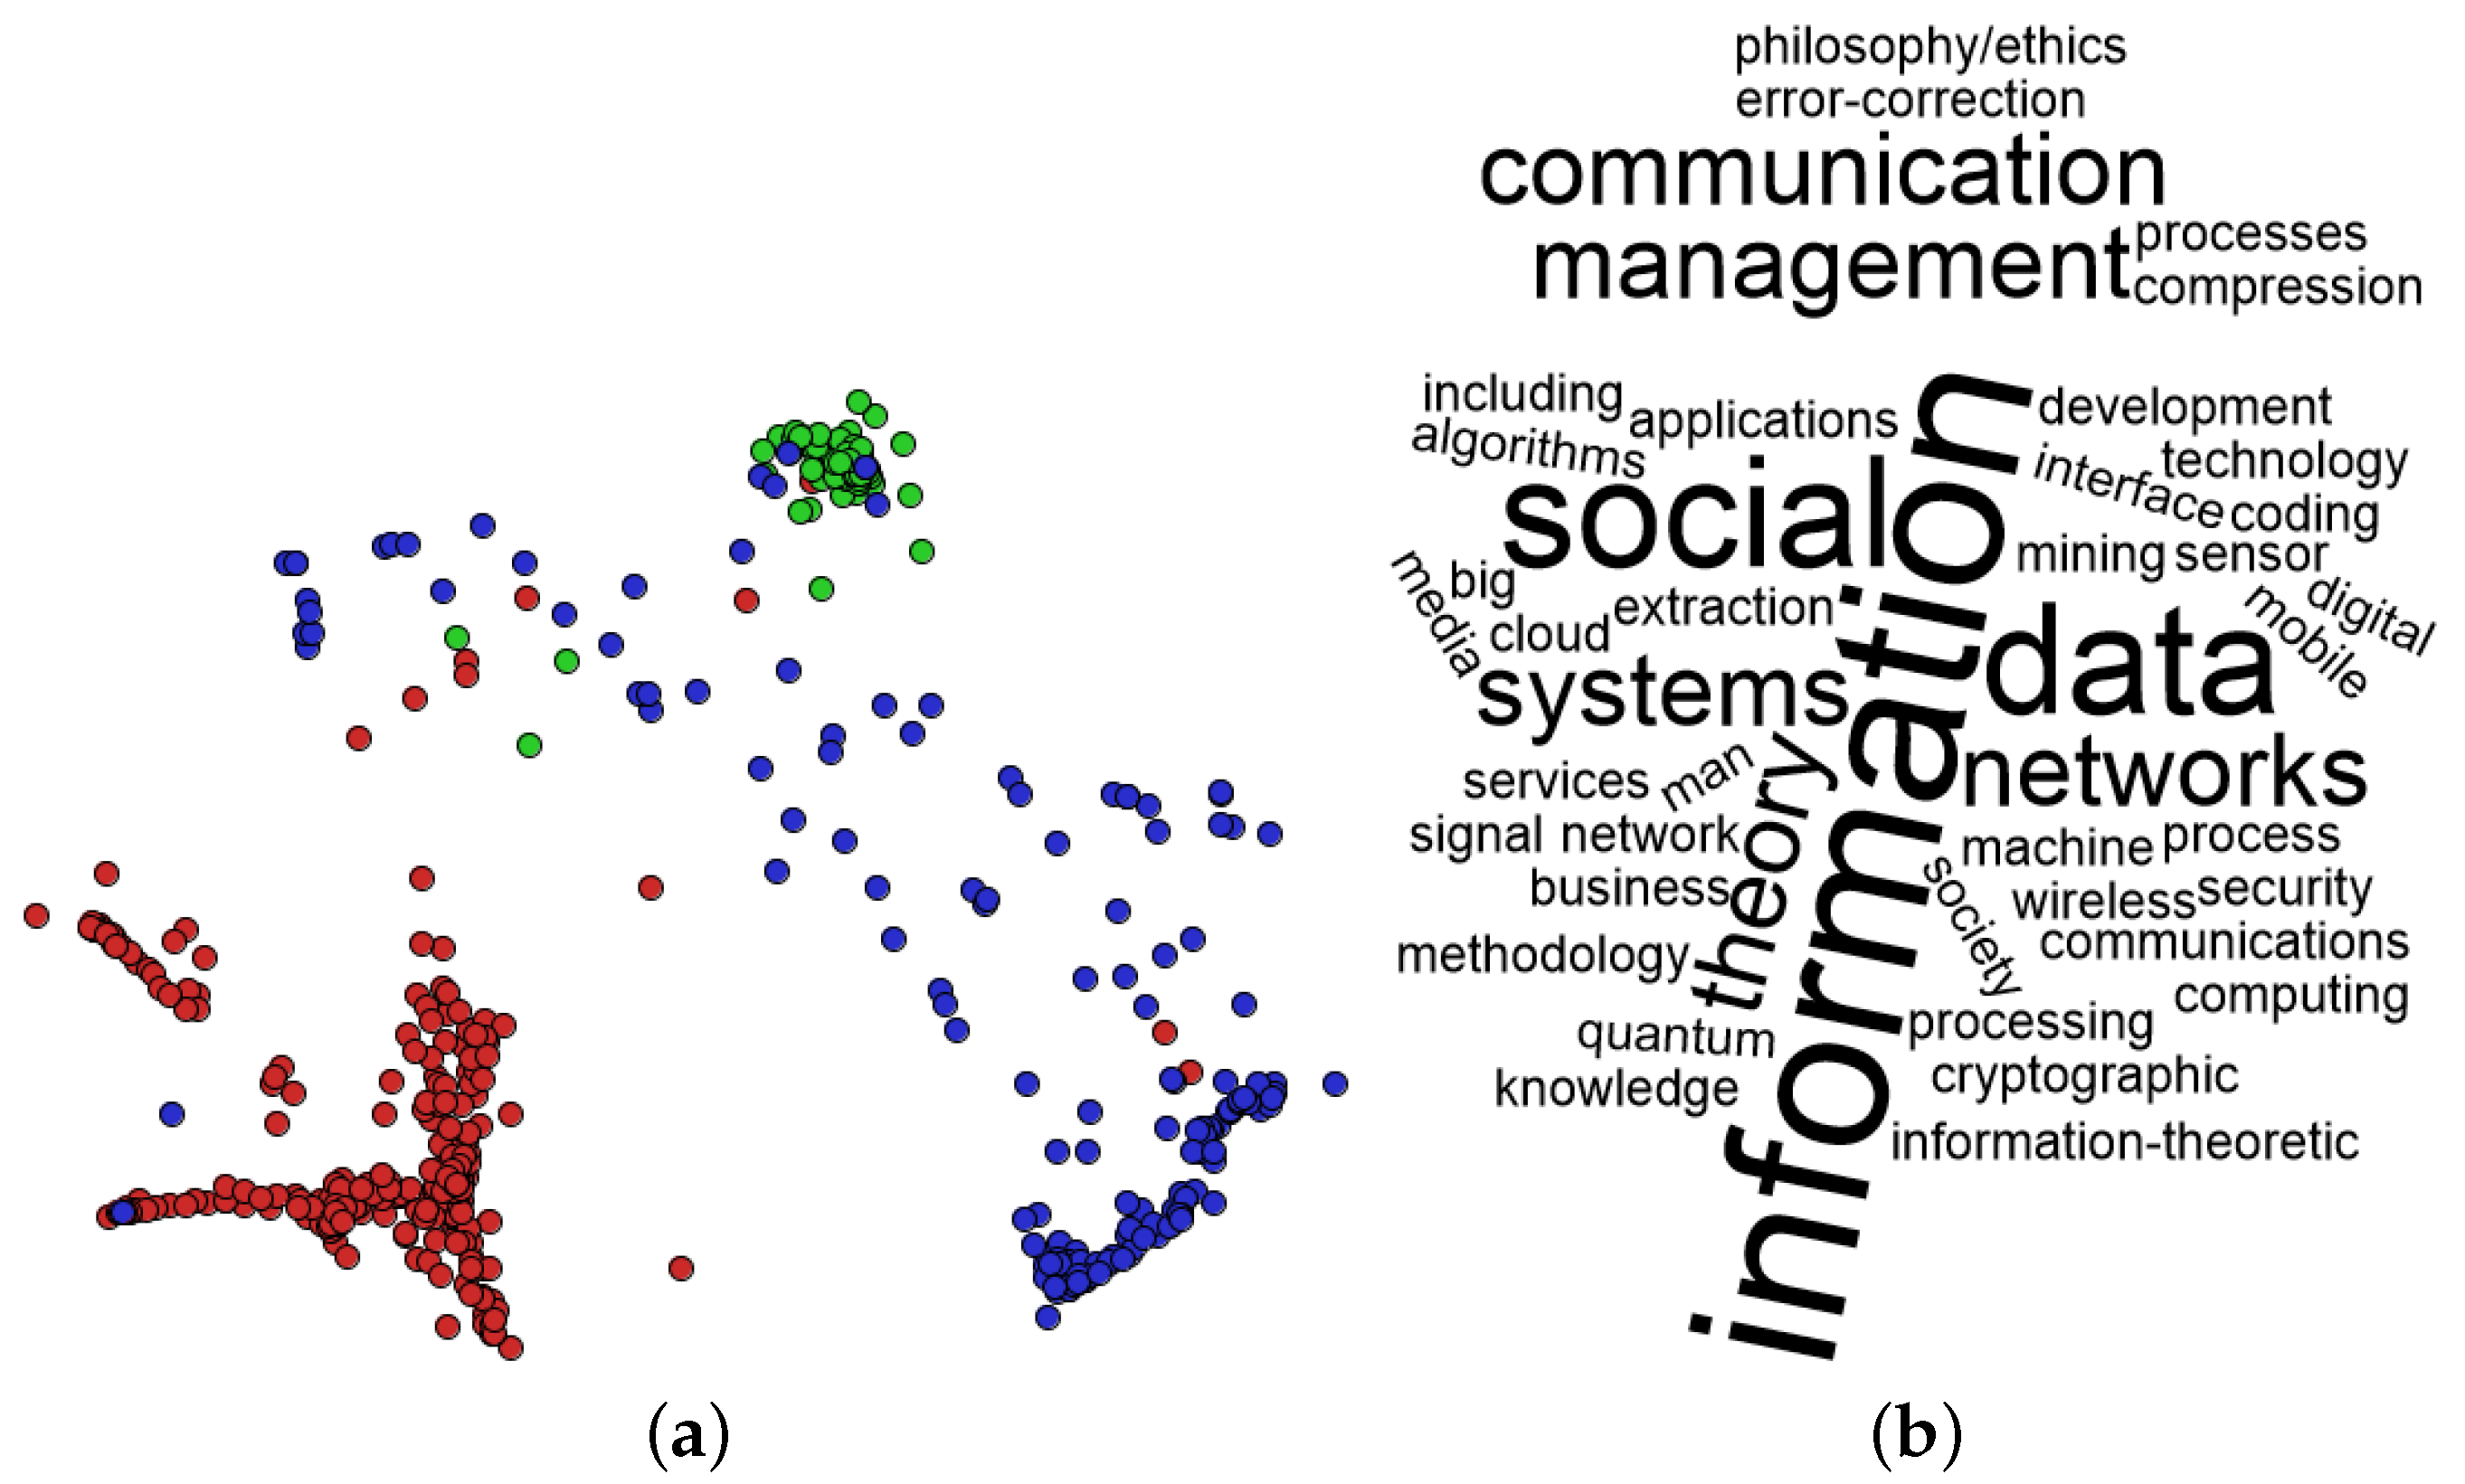
An example of multidimensional projection result is presented in Figure 1a. This is a projection of 574 scientific papers from three areas of artificial intelligence: case-based reasoning, inductive logic programming and information retrieval. Each area was mapped as a distinct color in the scatter plot. Note that similar documents are placed near in 2D space, enabling the dataset exploration based on similarity by analyzing the groups of documents.
Visualization techniques can be used to explore a single document or a collection of documents. In this scenario, tag clouds can be employed to create a graphical representation that contains several words acquired from textual data. These words are shown in distinct sizes according to the frequency with which they appear in textual data. An example of a tag cloud is shown in Figure 1b, in which the main subject areas of the MDPI Information Journal were used. Even though the tag cloud is a very simple technique, one can note the main concepts from a document or a collection, without reading all documents.
Several works have used tag clouds to aid document collection exploration. Burch et al. [10] presented RadCloudto show several documents in a unique tag cloud; Lohman et al. [11] presented ConcentriCloud to organize distinct combinations of several documents under analysis; Chen et al. [12] presented the TagClusters technique to show cluster of works in 2D space.
Similarly to this work, Paulovich et al. [13] presented ProjCloud, which is a technique based on tag clouds computed from clusters of documents generated by a multidimensional projection. ProjCloud is dependent on large polygons so that tag clouds are readable. Thus, the selection of individual instances and clusters only composed of overlapped instances has limitations that may impair the user experience. In this work, we address those limitations by dealing with the individual inspection of documents, as well as the selection of any cluster of documents. In addition, we overcome the overlap problem of the dimensionality reduction and present some interaction mechanisms to aid the exploratory process.
3. Proposed Approach
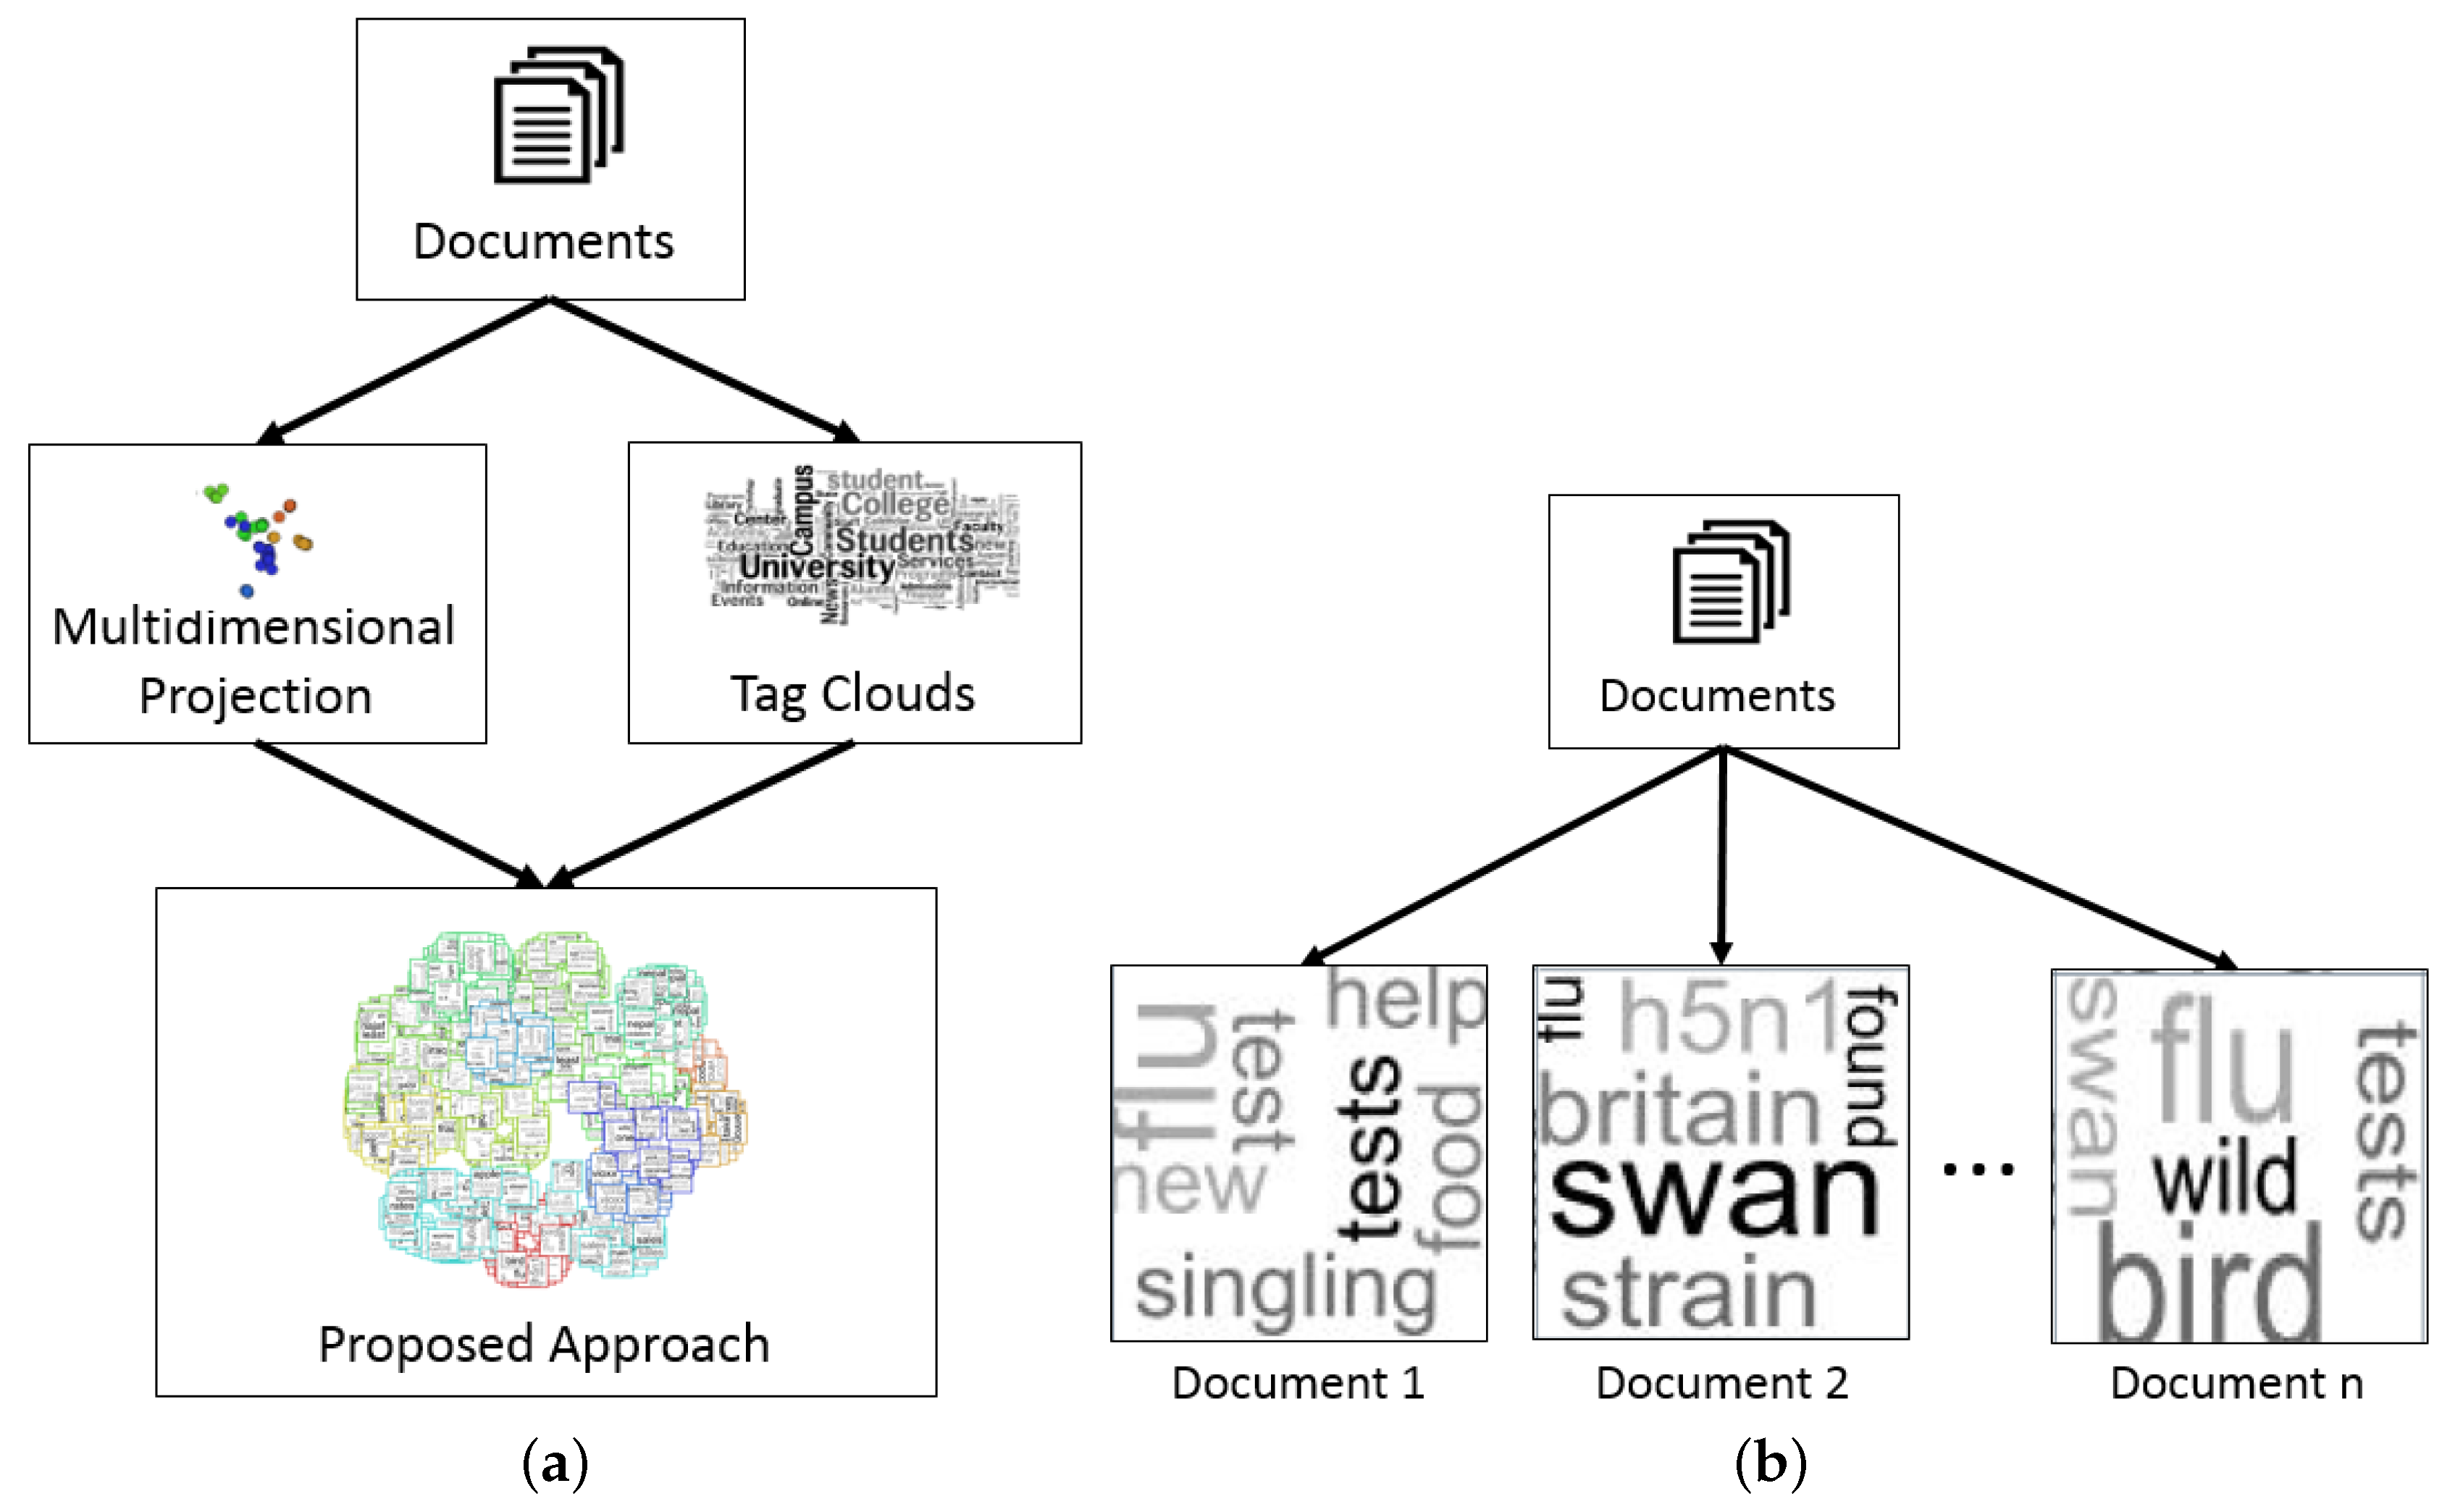
The proposed approach was conceived of to aid the analysis of document collections by creating a graphical representation that mixes multidimensional projection and the tag cloud technique in the same pipeline, as shown in Figure 2a. The multidimensional projection technique is employed to group similar documents in 2D space, revealing the documents that present similar content. The tag cloud technique is employed to show a summary of each document and is used as the visual mark in the graphical representation, as shown in Figure 2b. The tag cloud computed for each document may reveal the main terms from textual data. The proposed approach is described here without specifying either the projection or tag cloud technique, because any technique can be used to place the documents in 2D space, and any technique can be used to generate a tag cloud for each document.
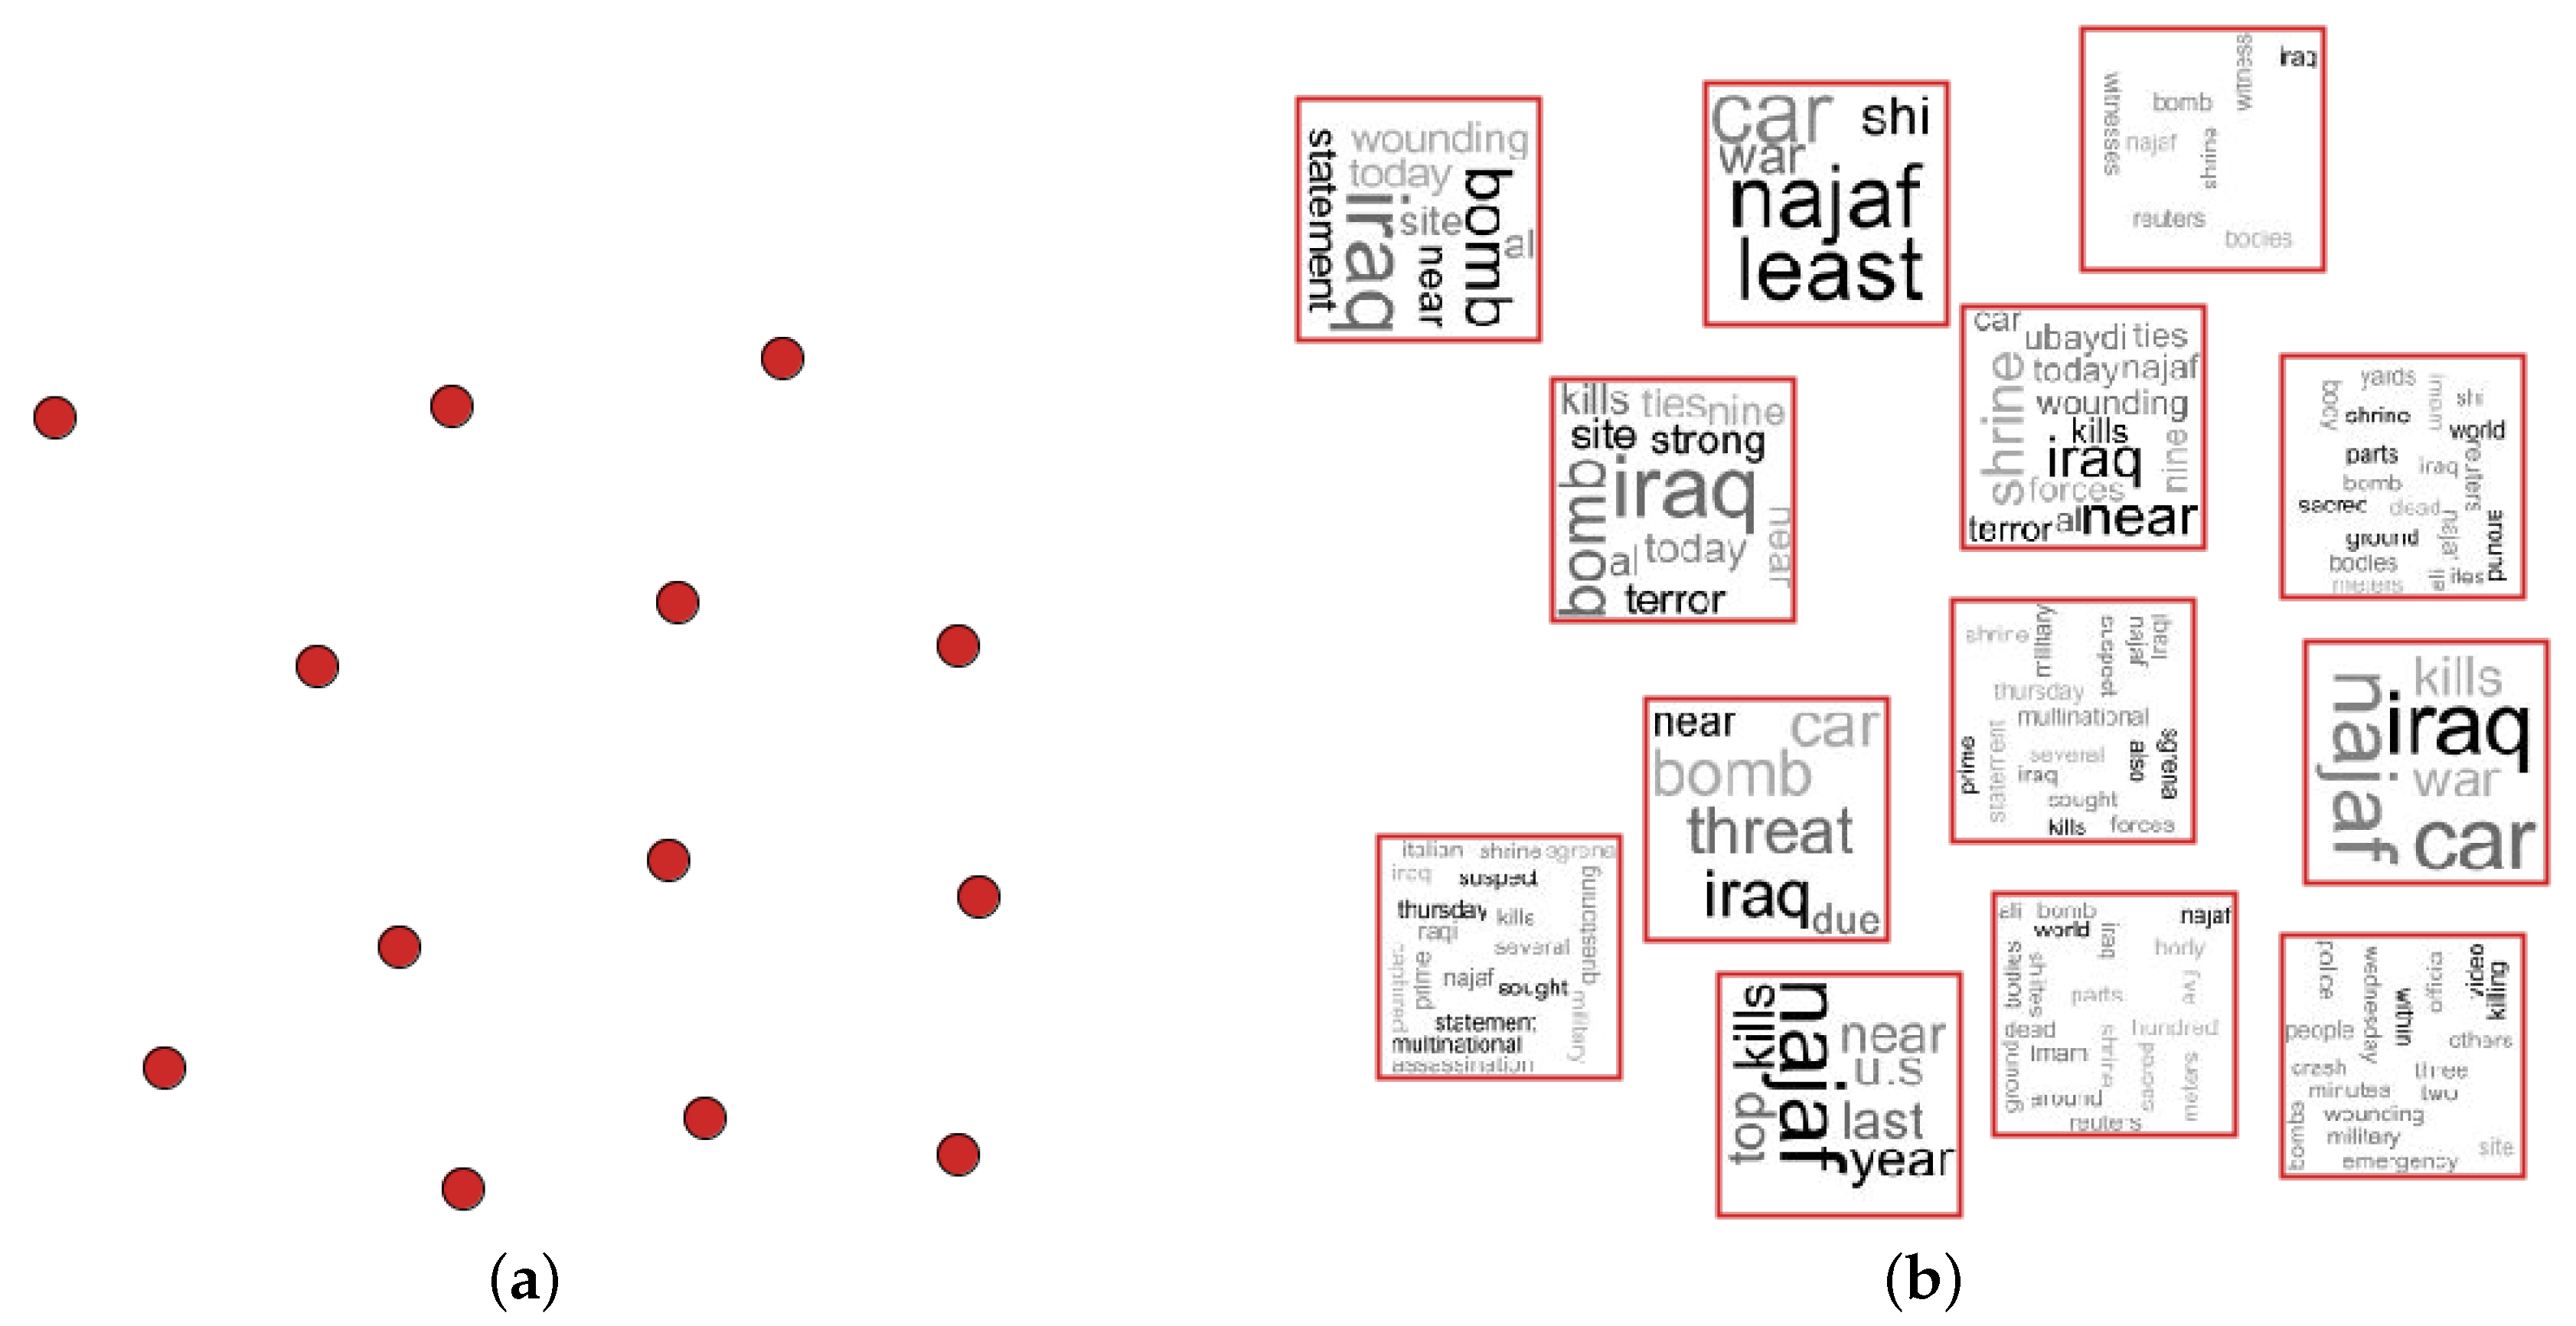
Figure 3 presents an illustrative example in which a document collection is projected in 2D space and the tag cloud images are used as visual marks to show the content of textual data. The analyst can use this visualization to see the document similarities in 2D space, as well as analyze the documents content. This approach can be used to understand why some clusters of documents are generated since the tag cloud shows the most frequent terms. Usually, clusters are generated based on word occurrence in each document. In this example, the group of documents is composed of news related to a bomb attack in Iraq.
The proposed approach is supported by interaction tools to aid the exploratory process and user experience. For example, as shown in Figure 4, the user can view a tag cloud of a document by passing the mouse over a specific point.
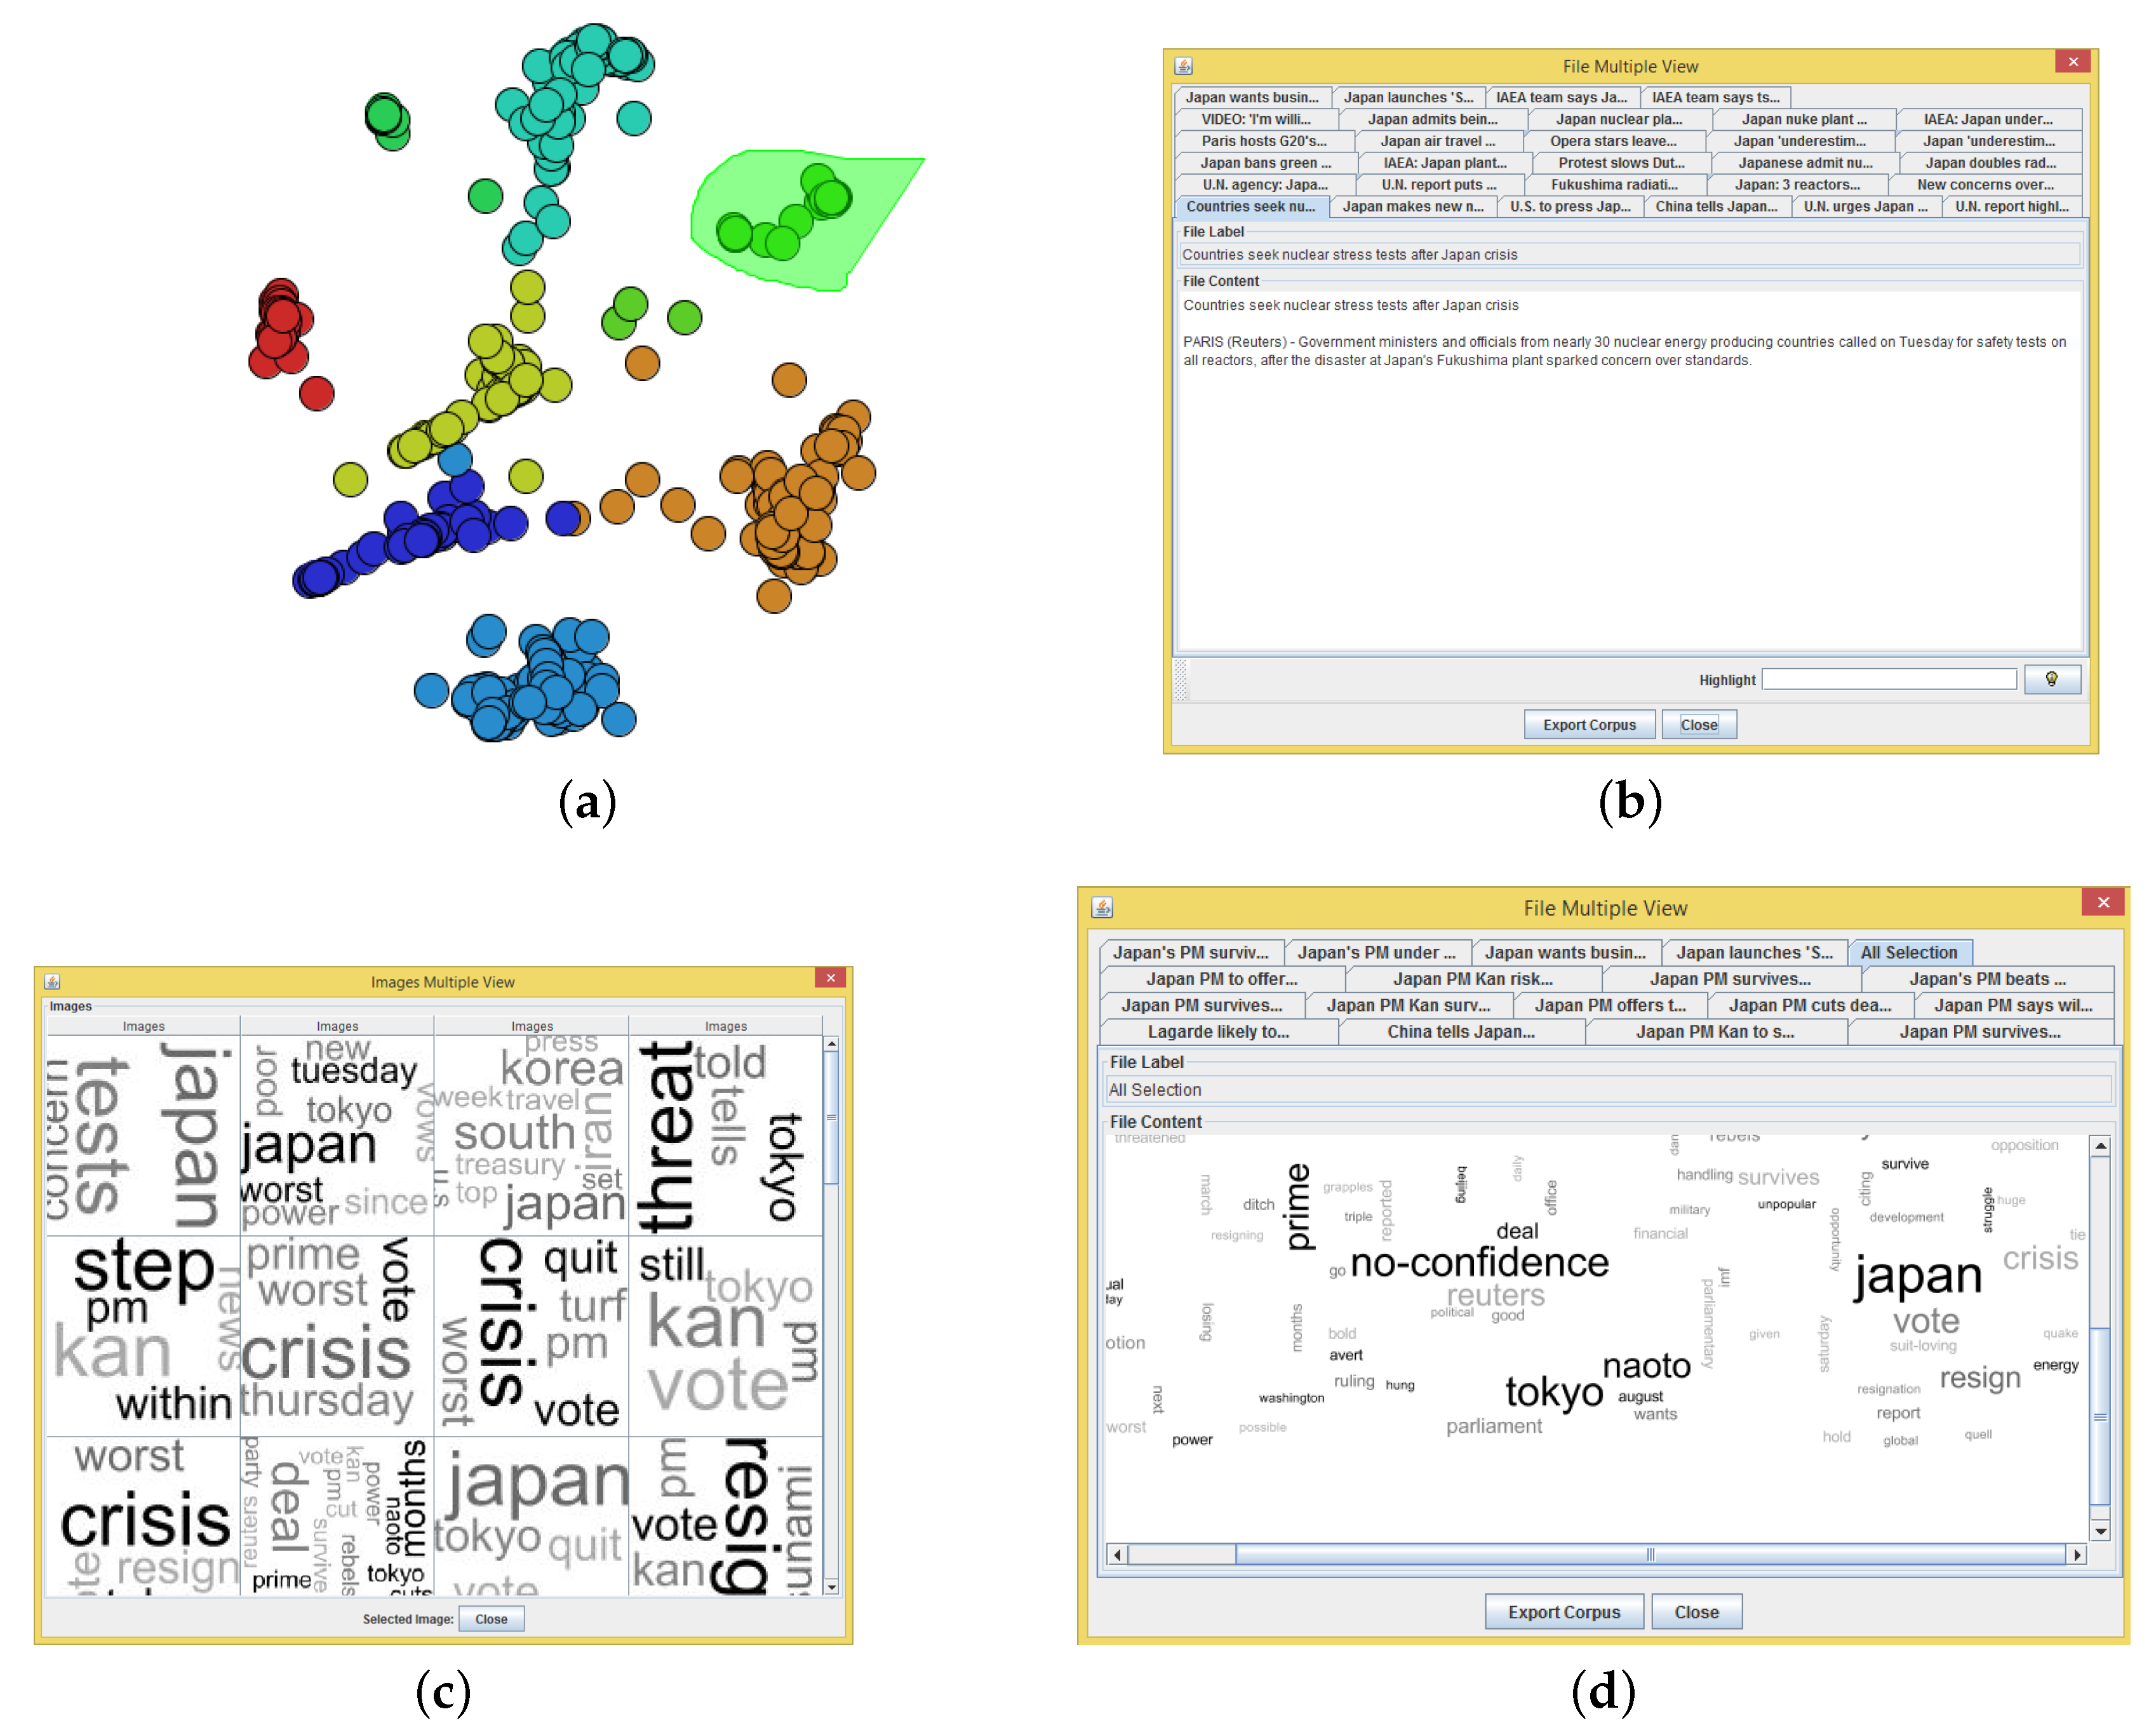
Furthermore, showing the tag clouds as visual marks, the user can select a group of documents (see Figure 5a) to show the textual data (see Figure 5b); the tag cloud of each selected document (see Figure 5c); or a tag cloud computed from textual data of all selected documents (see Figure 5d).
The next section shows examples of this approach in the boundary detection of a dataset.
4. Applications
This section presents applications to show how the proposed approach can be employed to analyze document collections. For that, we used the following document collections of world news:
- NEWS-8: 495 news articles from Reuters, AP, BBC and CNN, divided into eight classes;
- NEWS-13: RSS news from BBC, CNN, Reuters and Associated Press, collected during two days in April 2006. We only used 381 documents, which are divided into 13 classes of news.
The proposed approach allows any multidimensional projection technique to be employed to place the documents in 2D space. However, to achieve better results, a projection technique capable of preserving the relationships between documents in 2D space is always preferred. In the literature, several works presented detailed analysis and comparisons of multidimensional projection techniques [8,14]. Based on those works, we employed the least squares projection (LSP) [8] technique, which is a fast technique proposed for projecting document collections in 2D space. In addition, we used the Eler and Garcia [15] method to find a good threshold to compute the vector space models (i.e., feature spaces or document by term matrix).
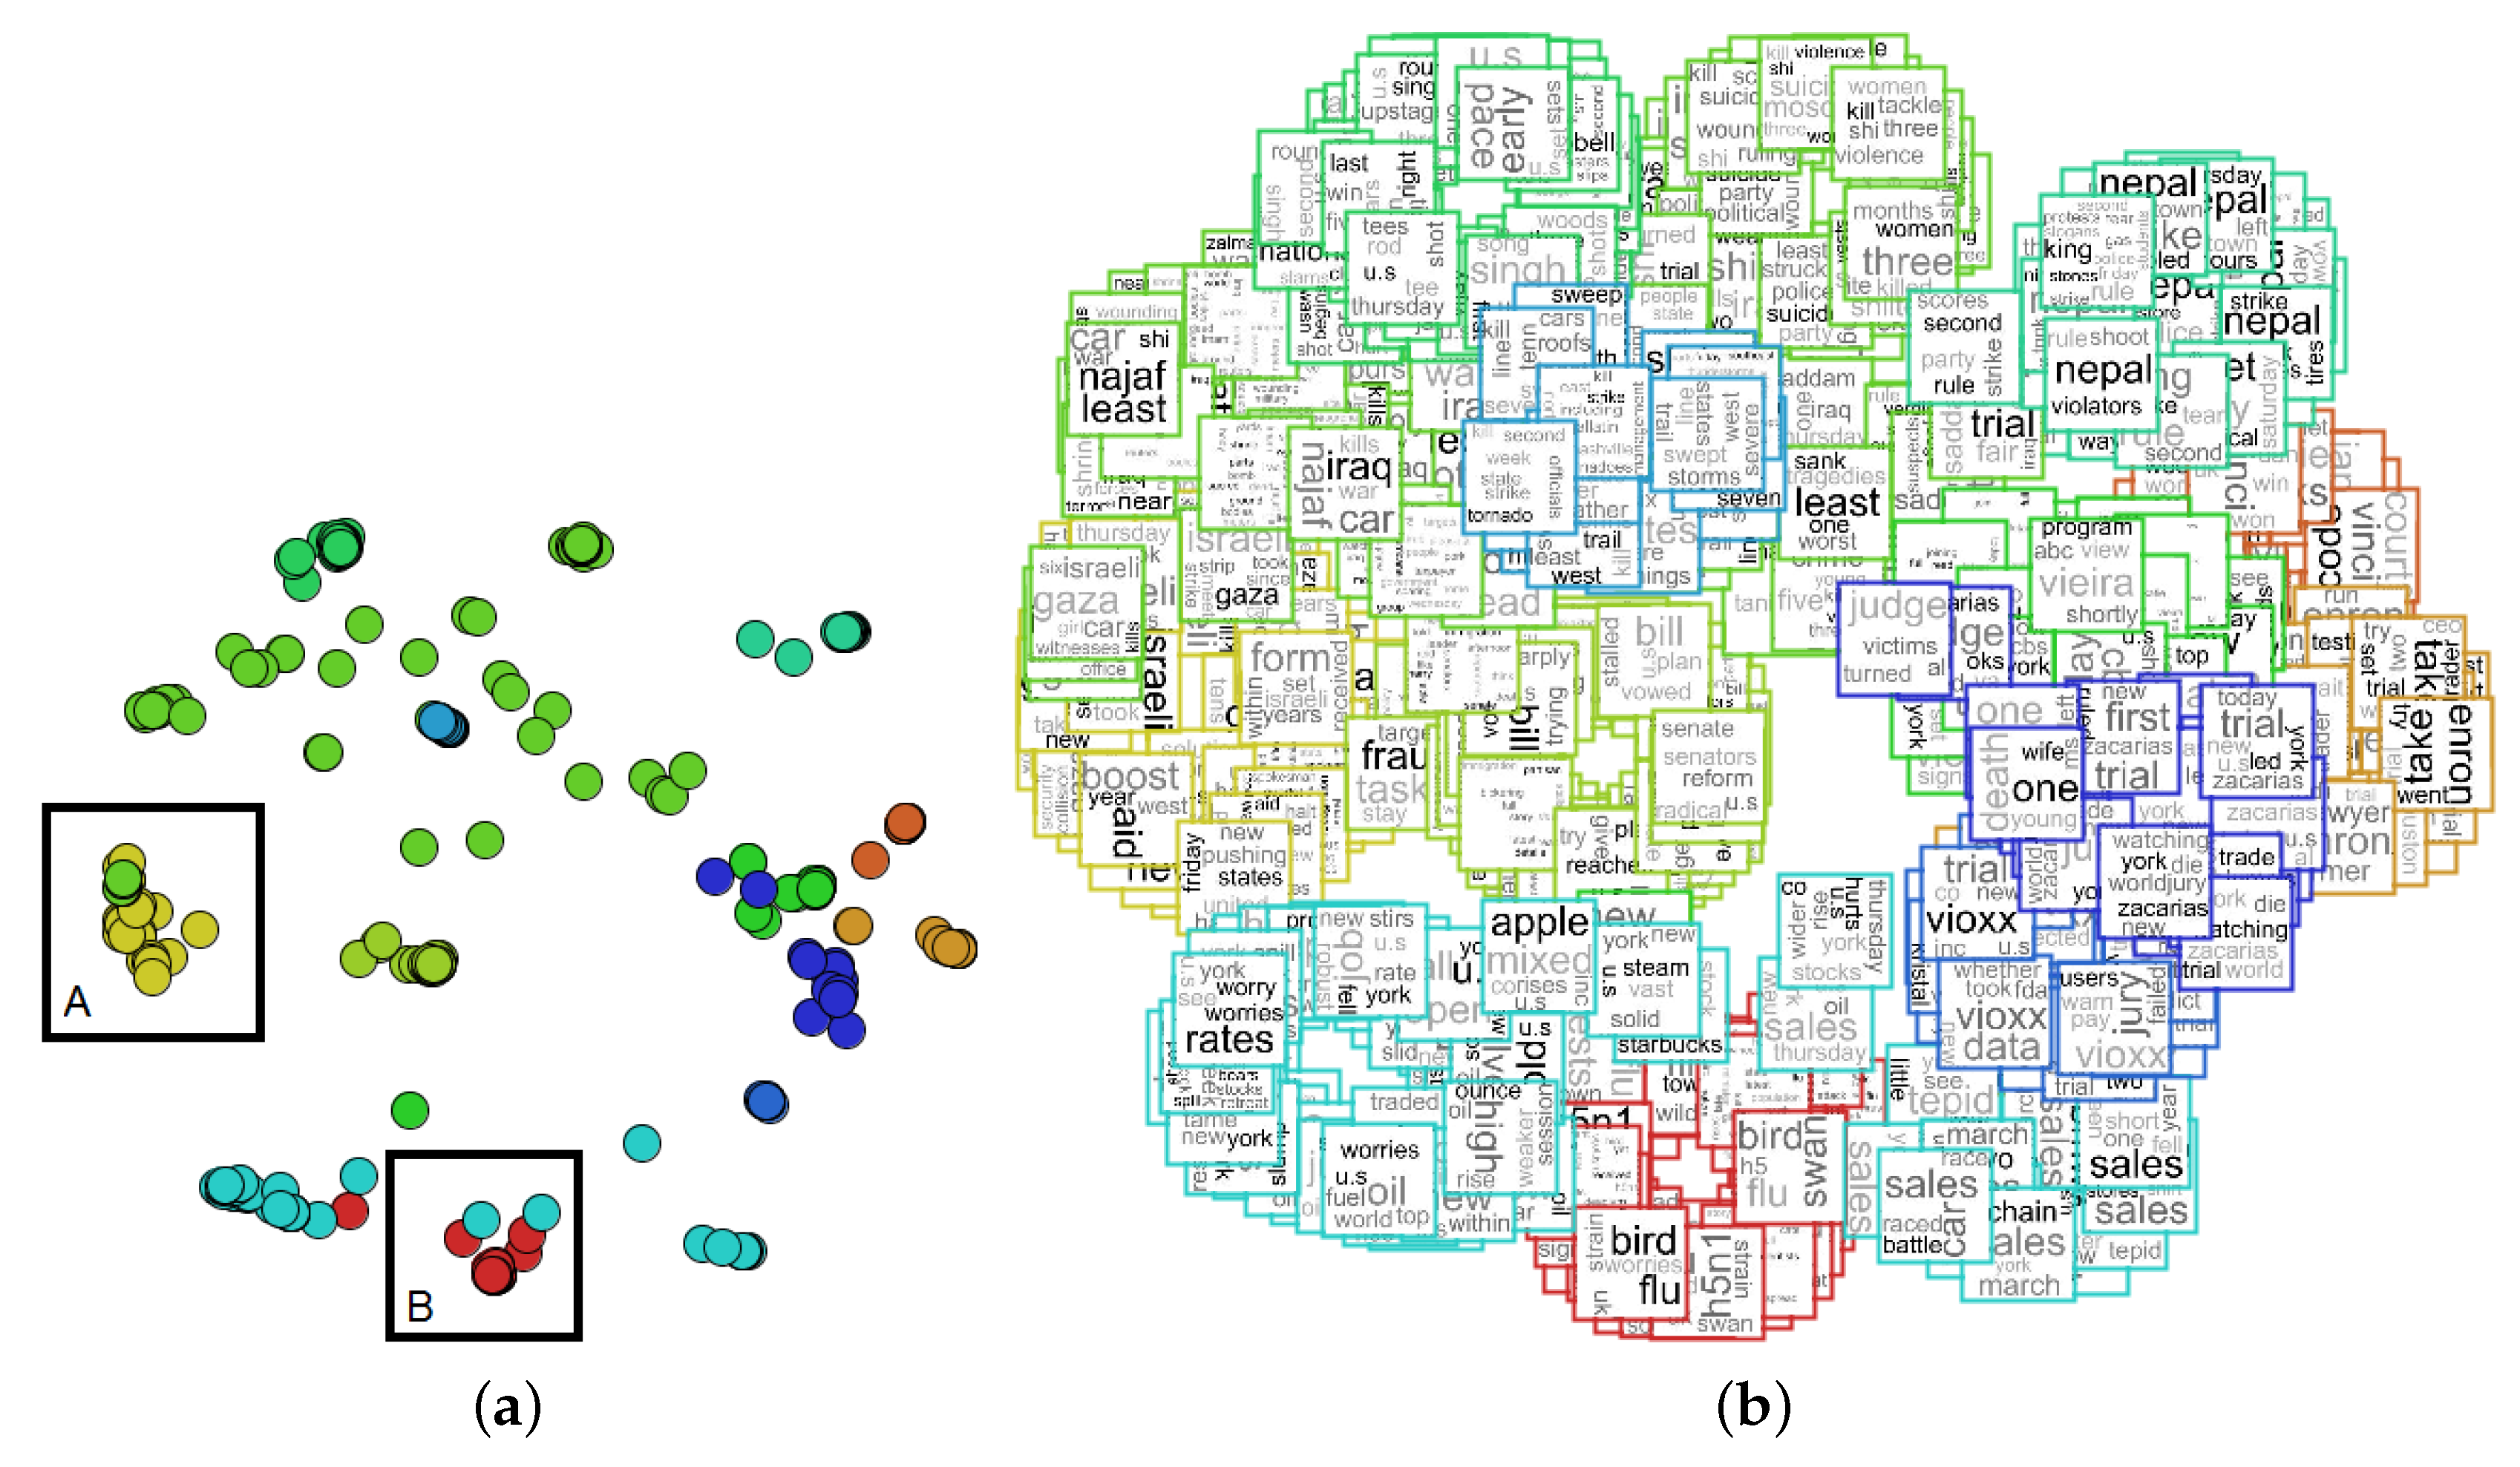
The projection result of the NEWS-13 dataset is presented in Figure 6a. Color information was used to map the class of each news, and two clusters of documents were selected for further inspection. The second step of the proposed approach is to map the tag clouds as the visual mark of each document: the visual mark is an image or icon to represent each dataset instance. In Figure 6b, the result of the proposed approach is presented, showing a tag cloud for each document.
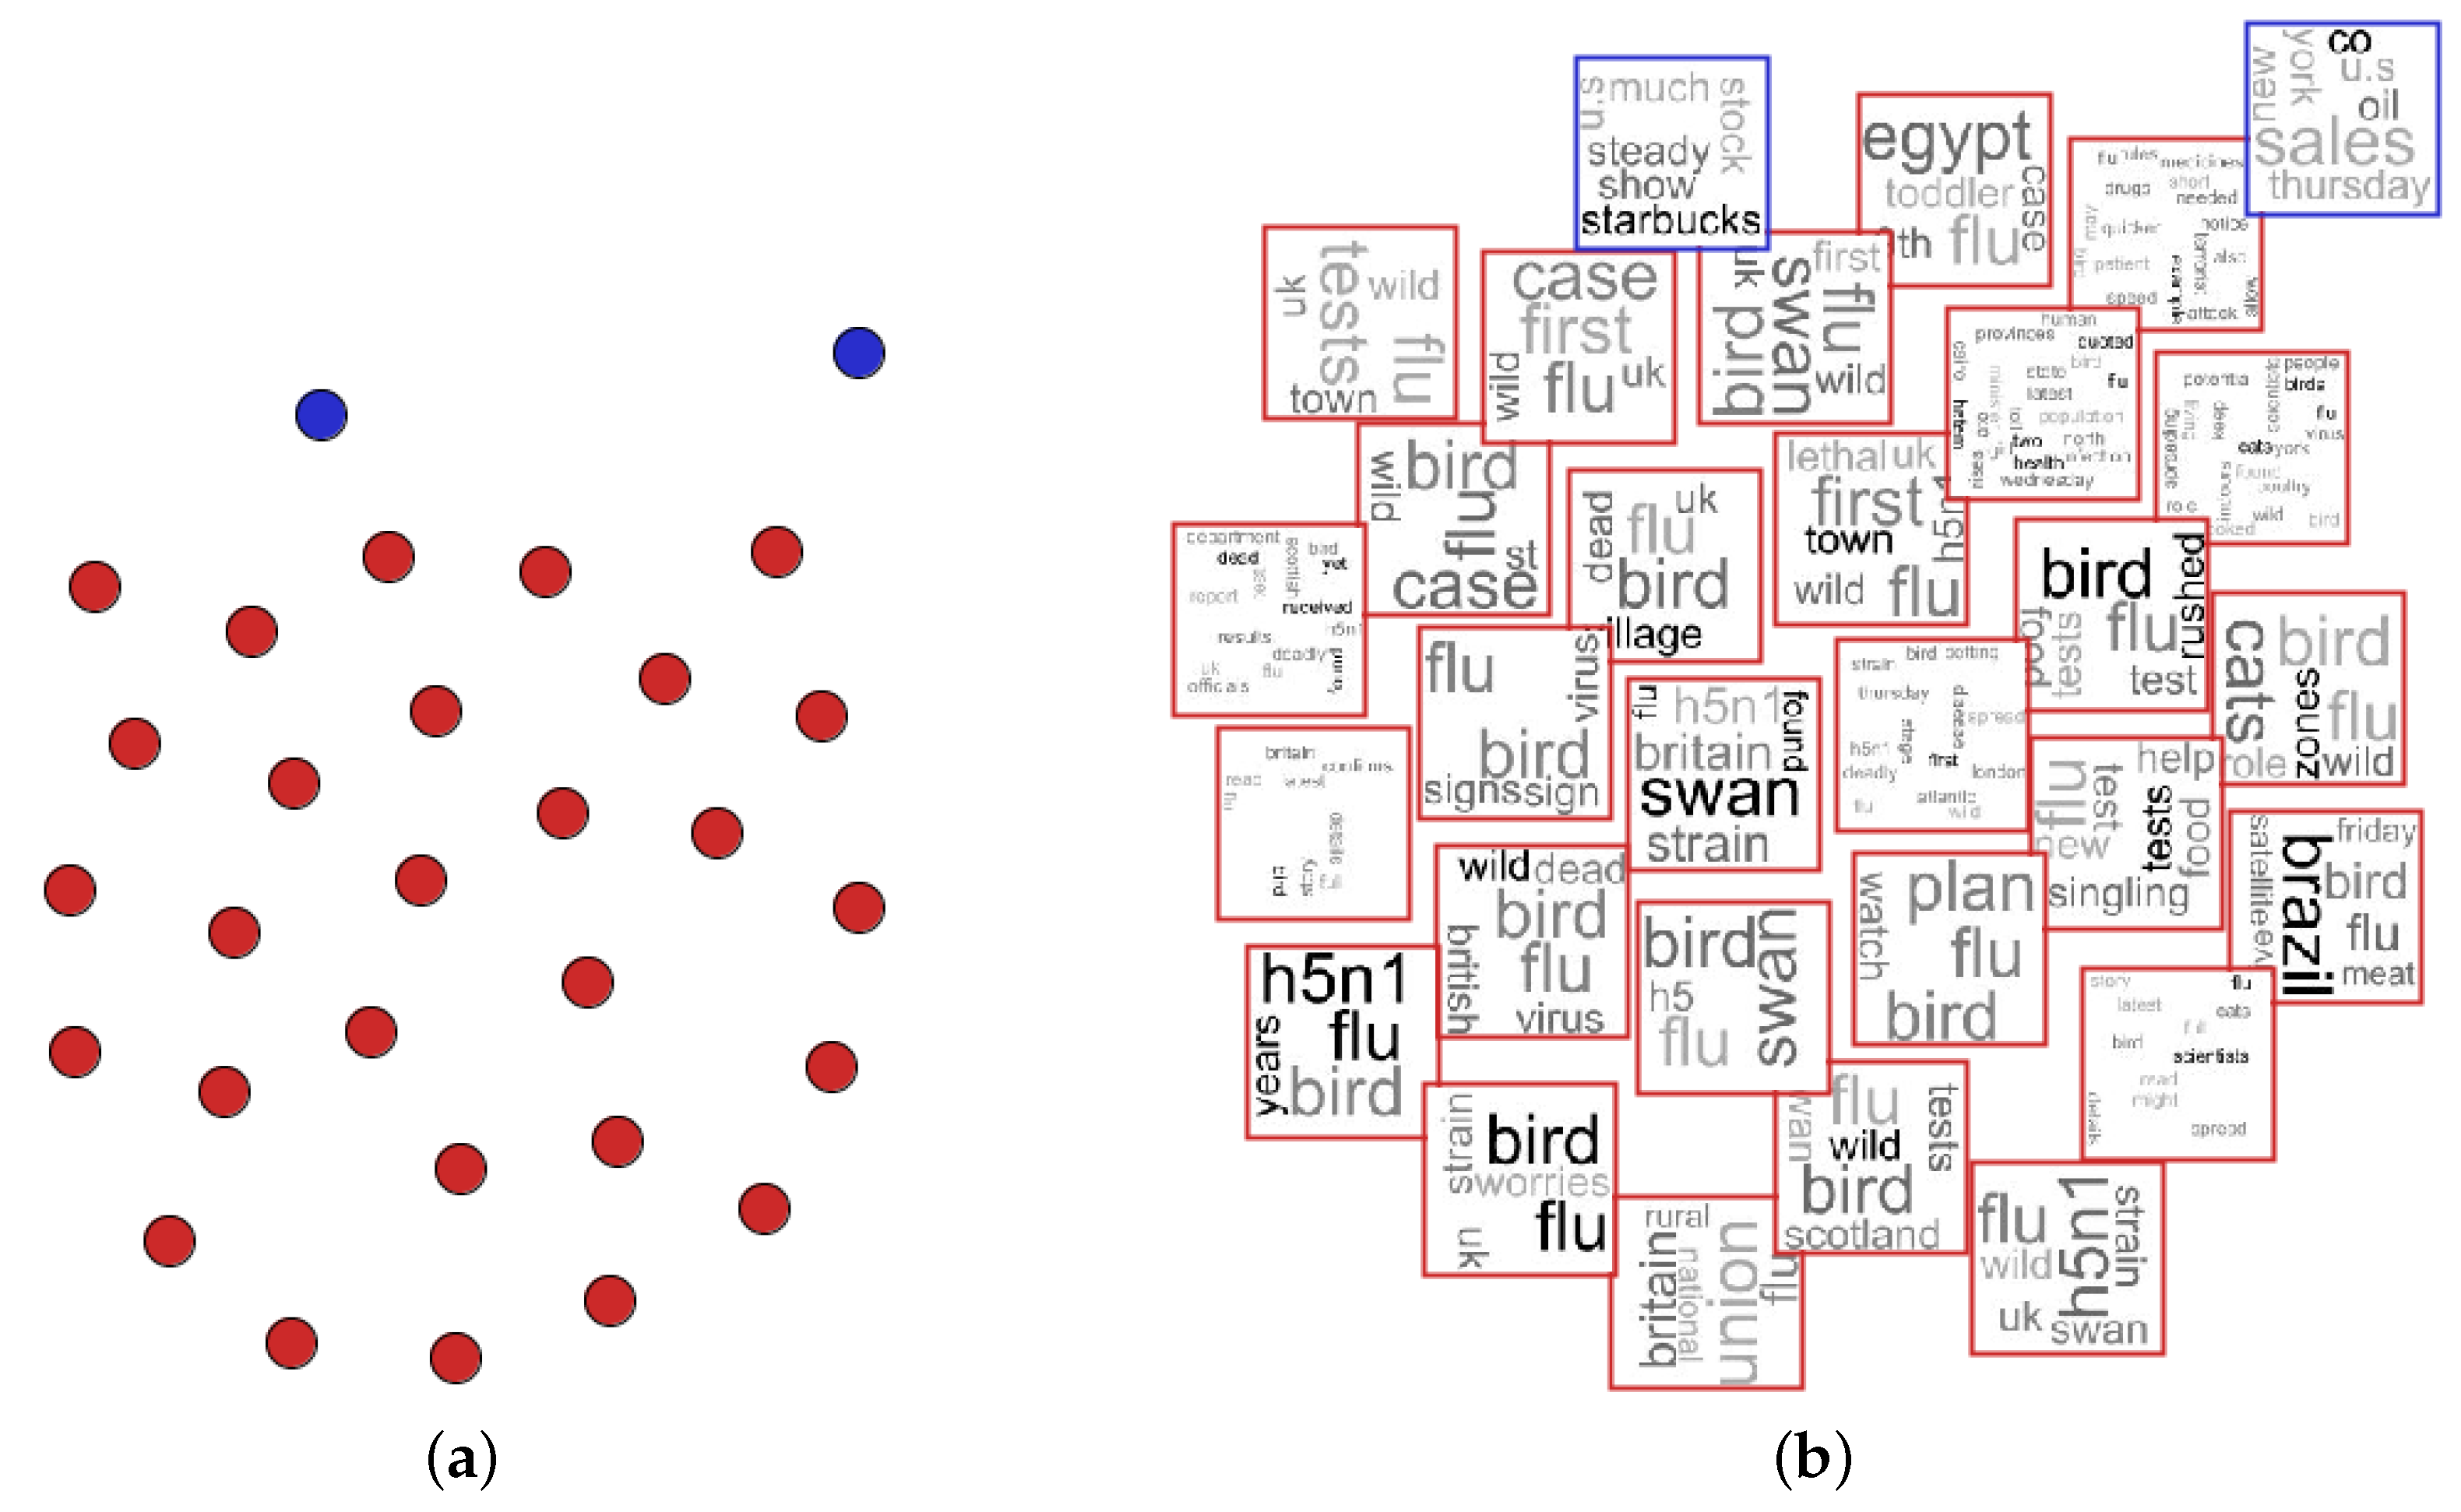
As one can note, the user needs to explore the graphical representation with interaction tools, such as zoom, filter or selection. Figure 7 shows the zoom operation performed in “Selection B” from Figure 6a. Note that this selection could also be performed on the graphical representation presented in Figure 6b. In this example, our approach is used to enable the analysis of document similarity and content, where mixing in a unique visualization is the main contribution of this paper. Figure 7a shows the zoom of the projection, and Figure 7b shows the tag clouds for each document, showing the cluster content.
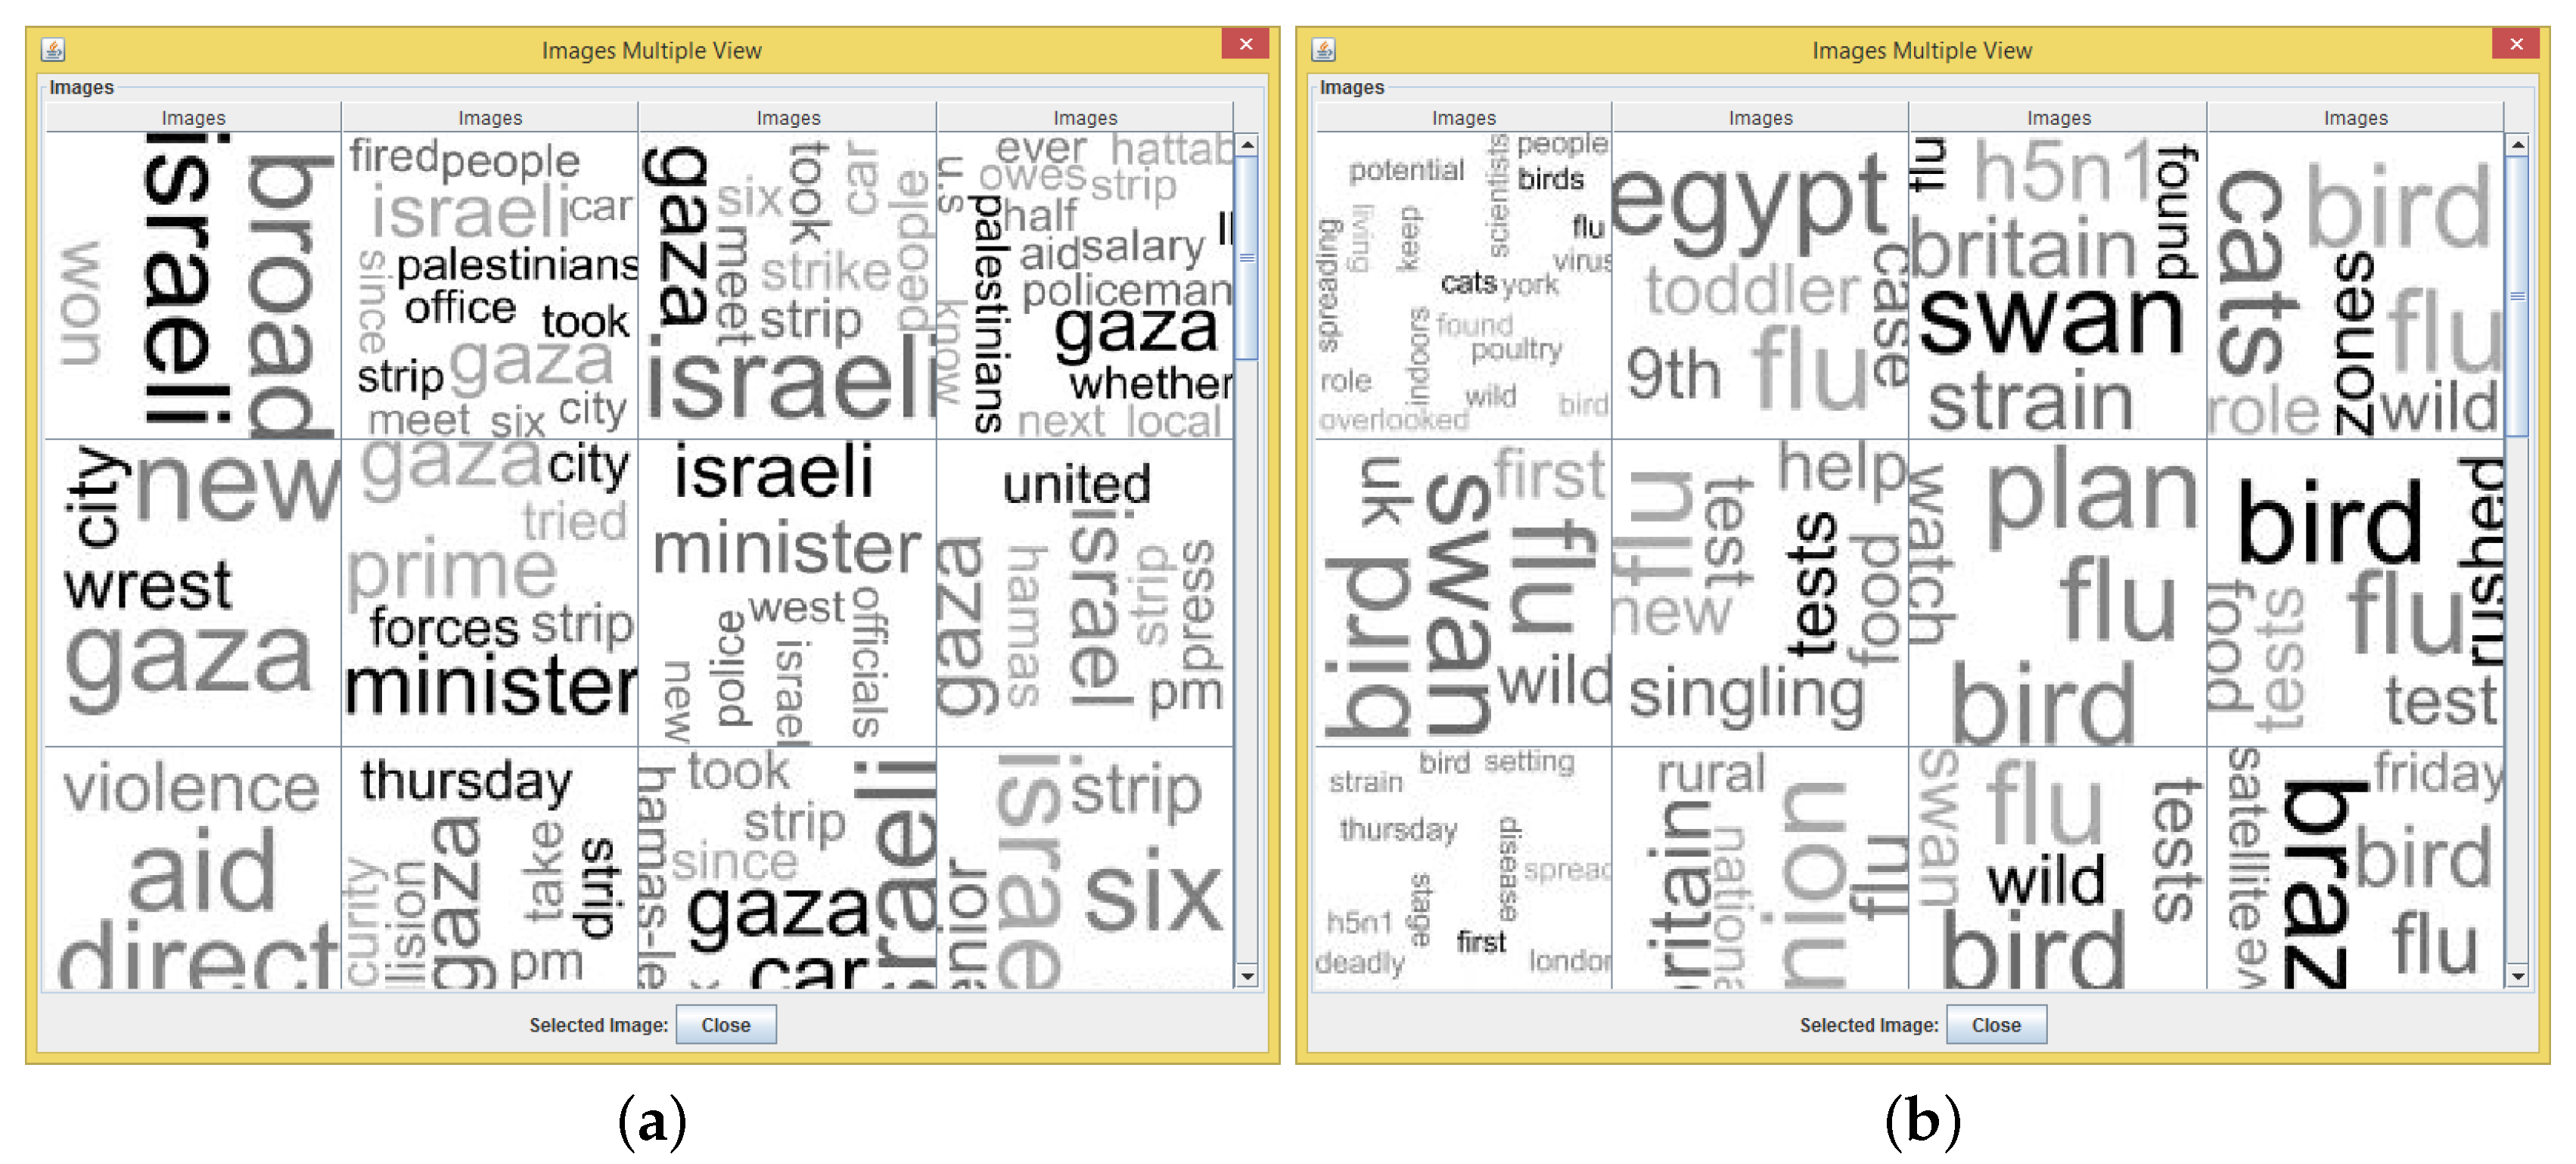
Besides using the zoom operation, the user can also view the tag clouds of a selected cluster. Figure 8 shows the view content (tag clouds) for two selections performed in the projection presented in Figure 6a. The “Selection A” content is presented in Figure 8a, which shows content related to “Israeli aircraft fired by missiles on a car carrying Palestinian militants in southern Gaza”. The “Selection B” content is presented in Figure 8b, which shows content related to “Bird flu and h5n1 tests confirmed on a dead swan”.
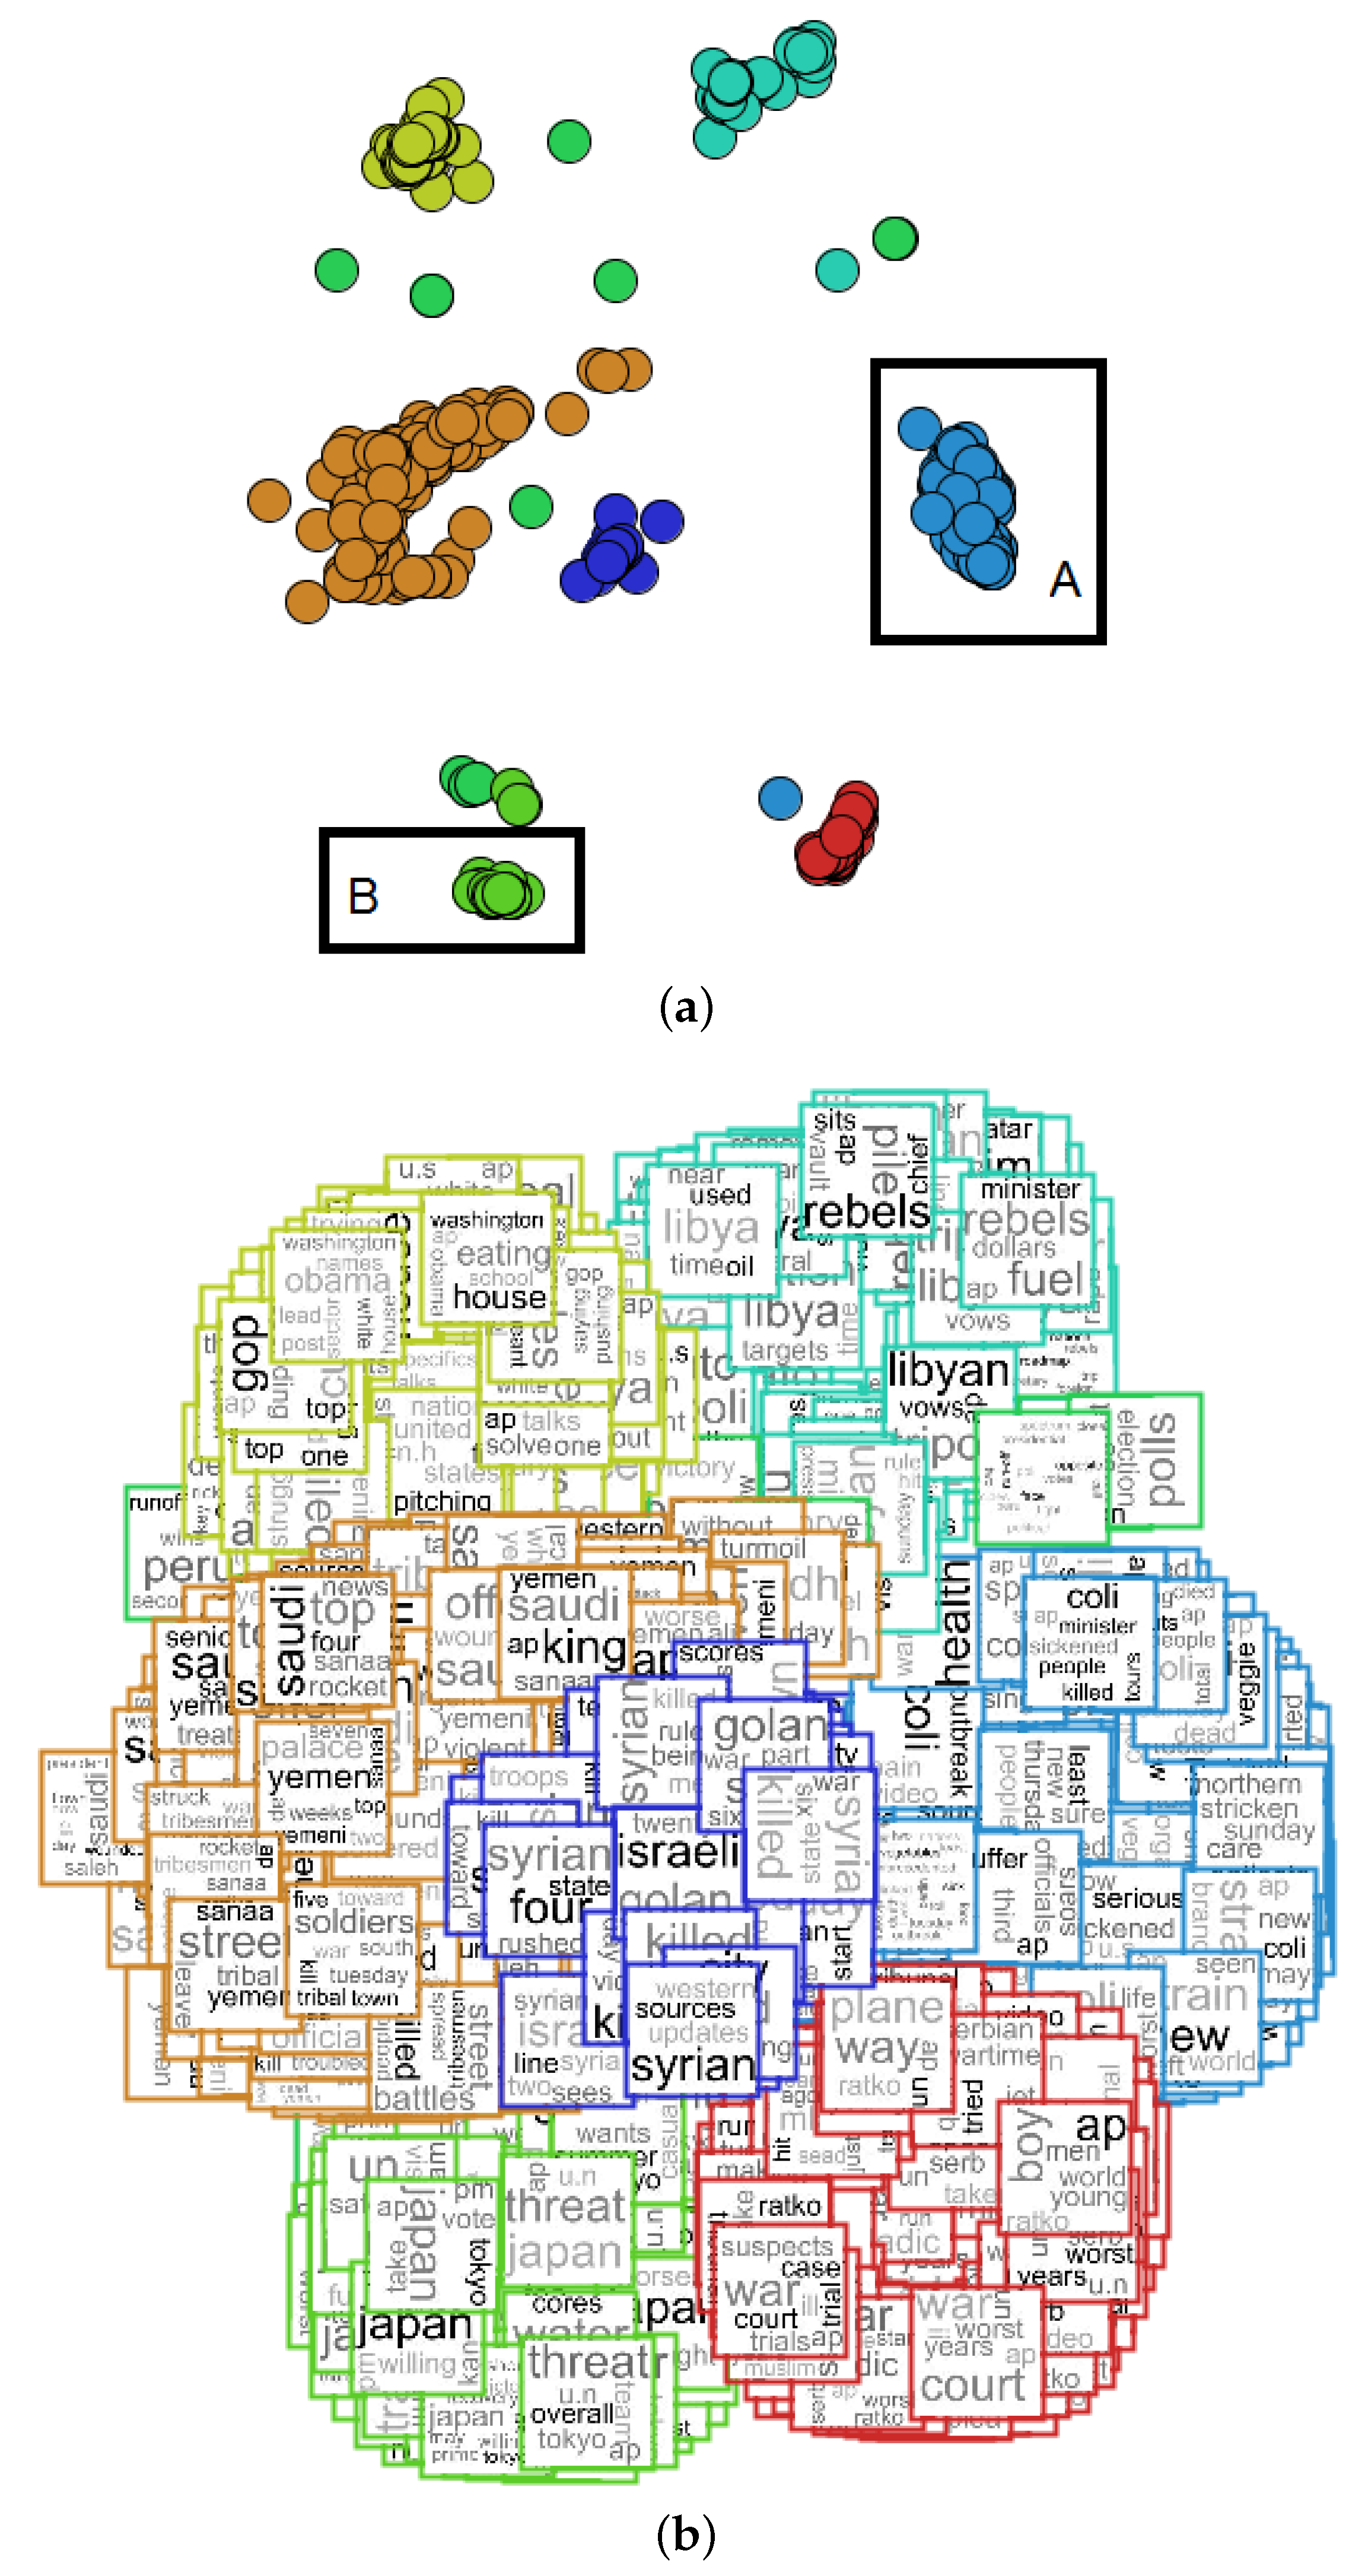
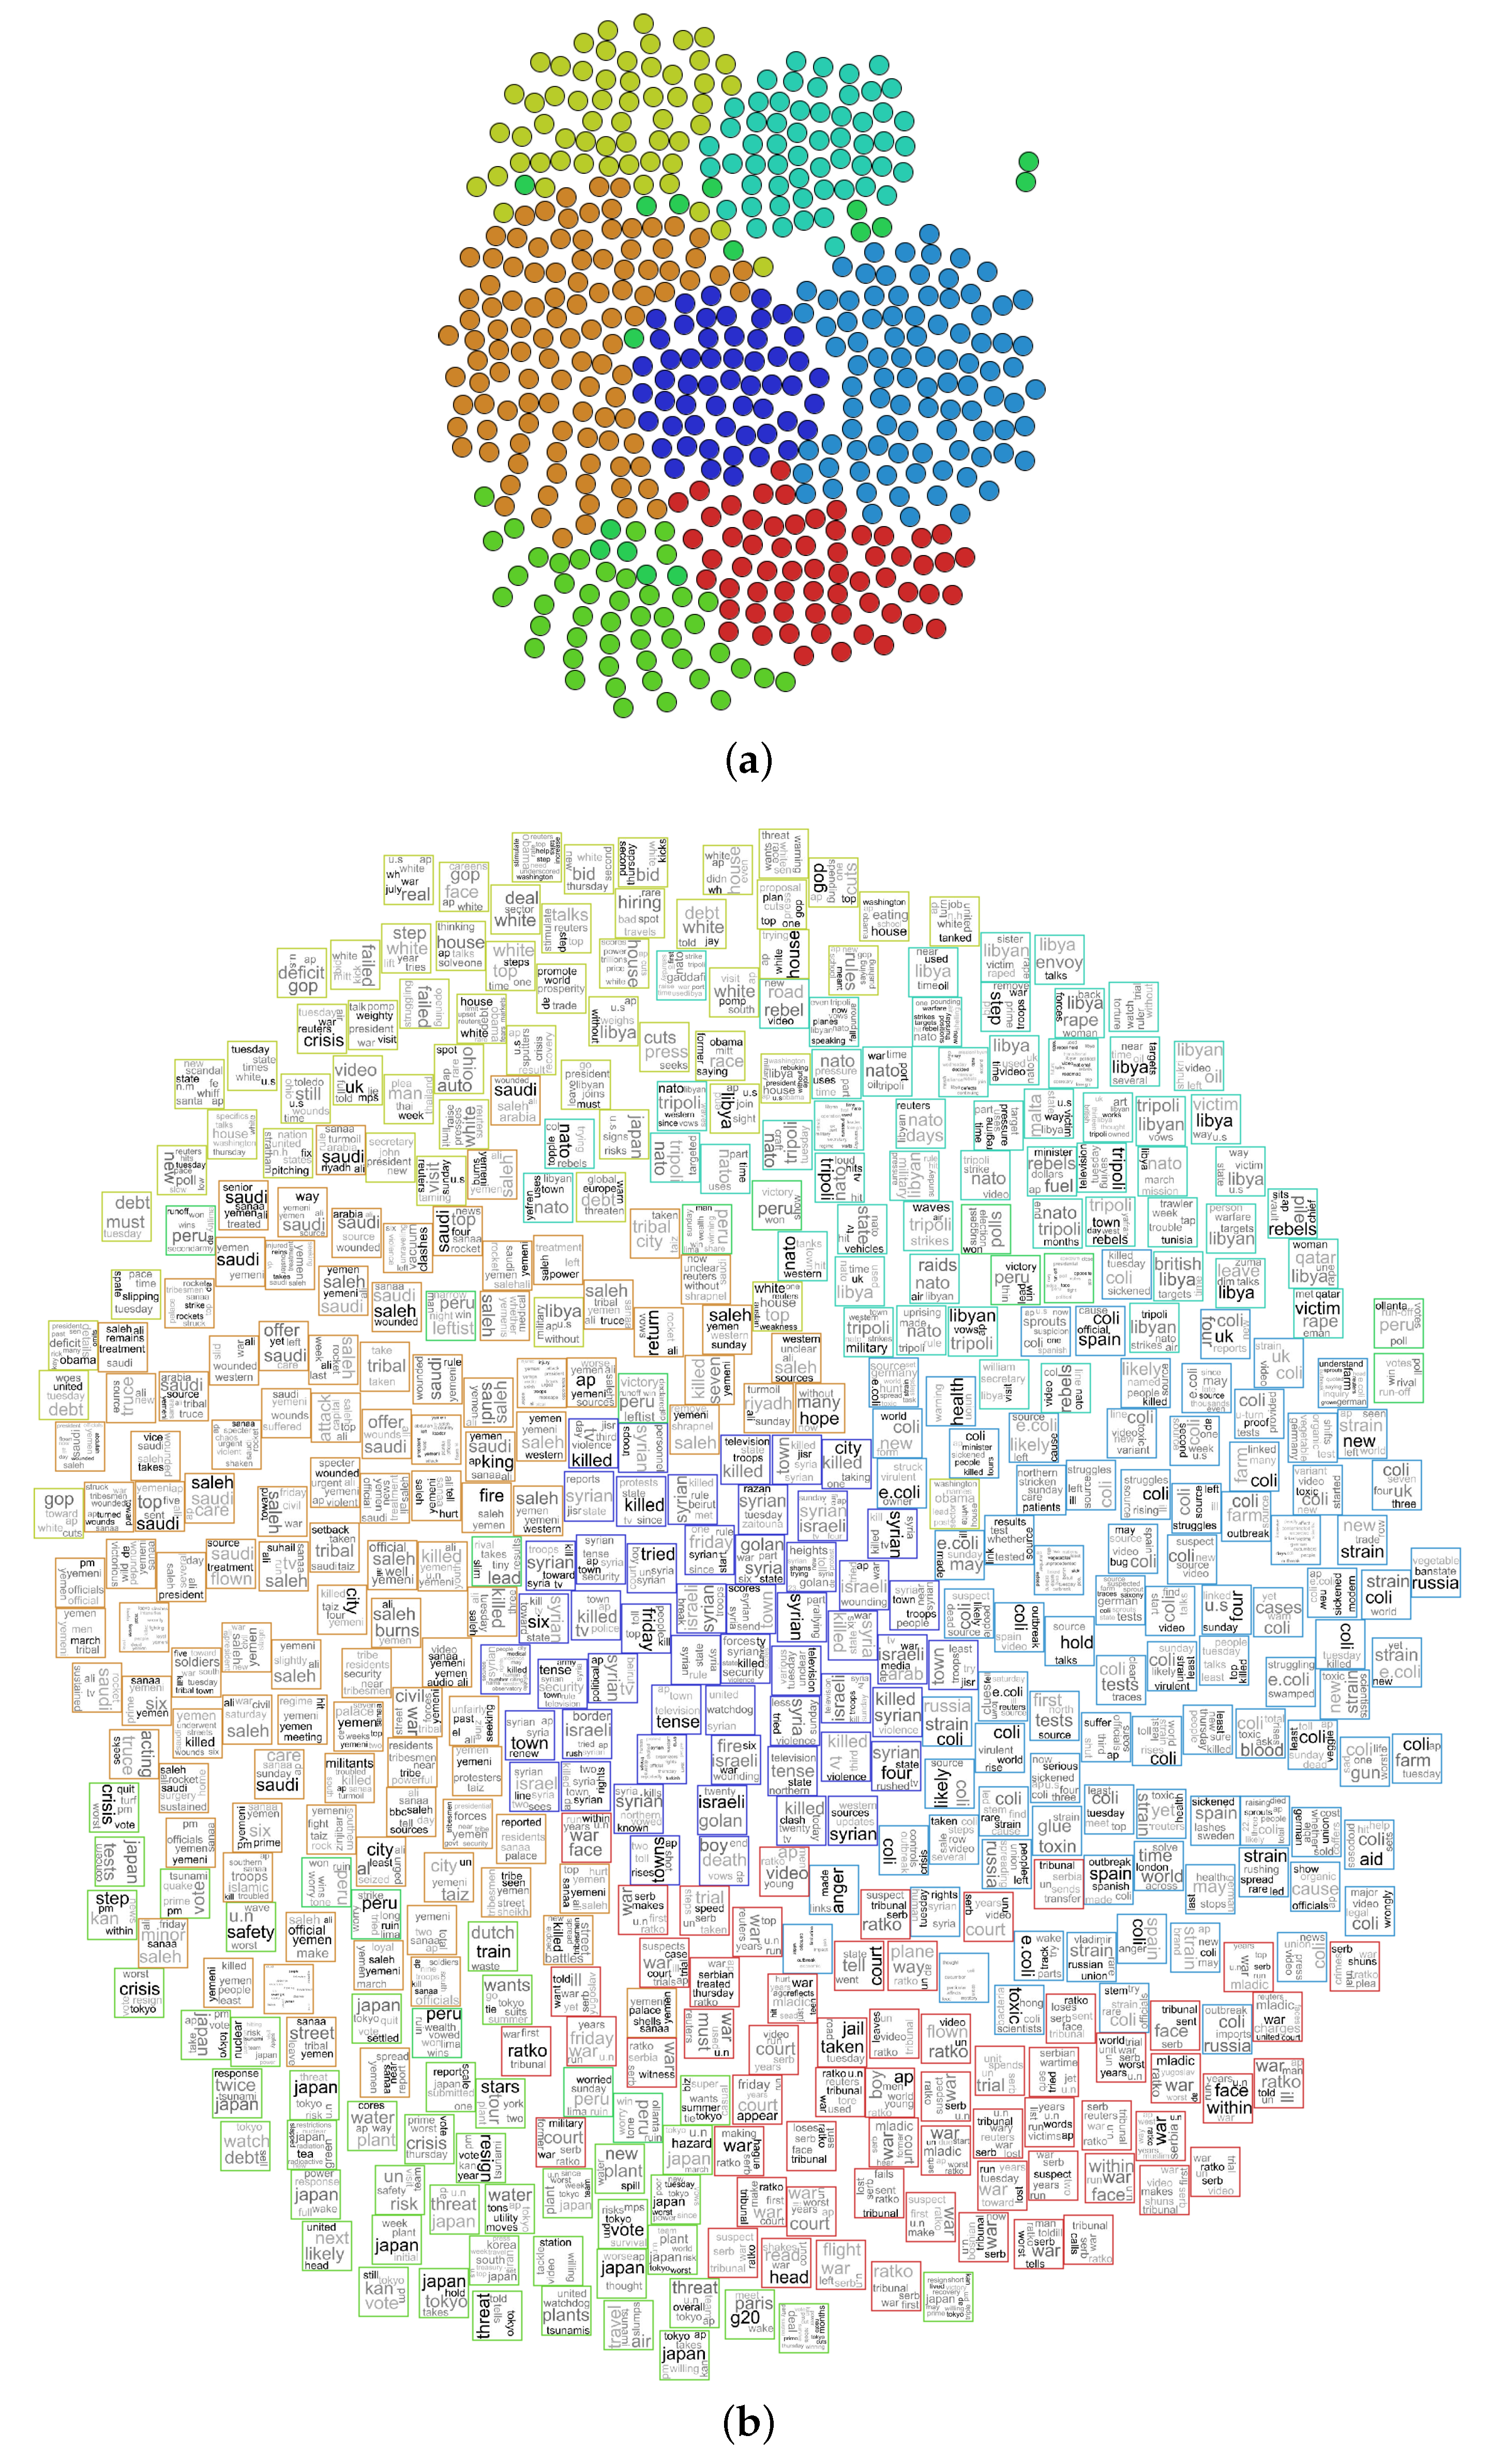
We also applied the proposed approach to explore the NEWS-8 dataset, showing a similar exploration process to that applied to NEWS-13. First, the projection of the dataset places each document in 2D space to map the document similarities, as shown in Figure 9a. After that, the tag clouds are mapped as the visual mark of each instance, as shown in Figure 9b.
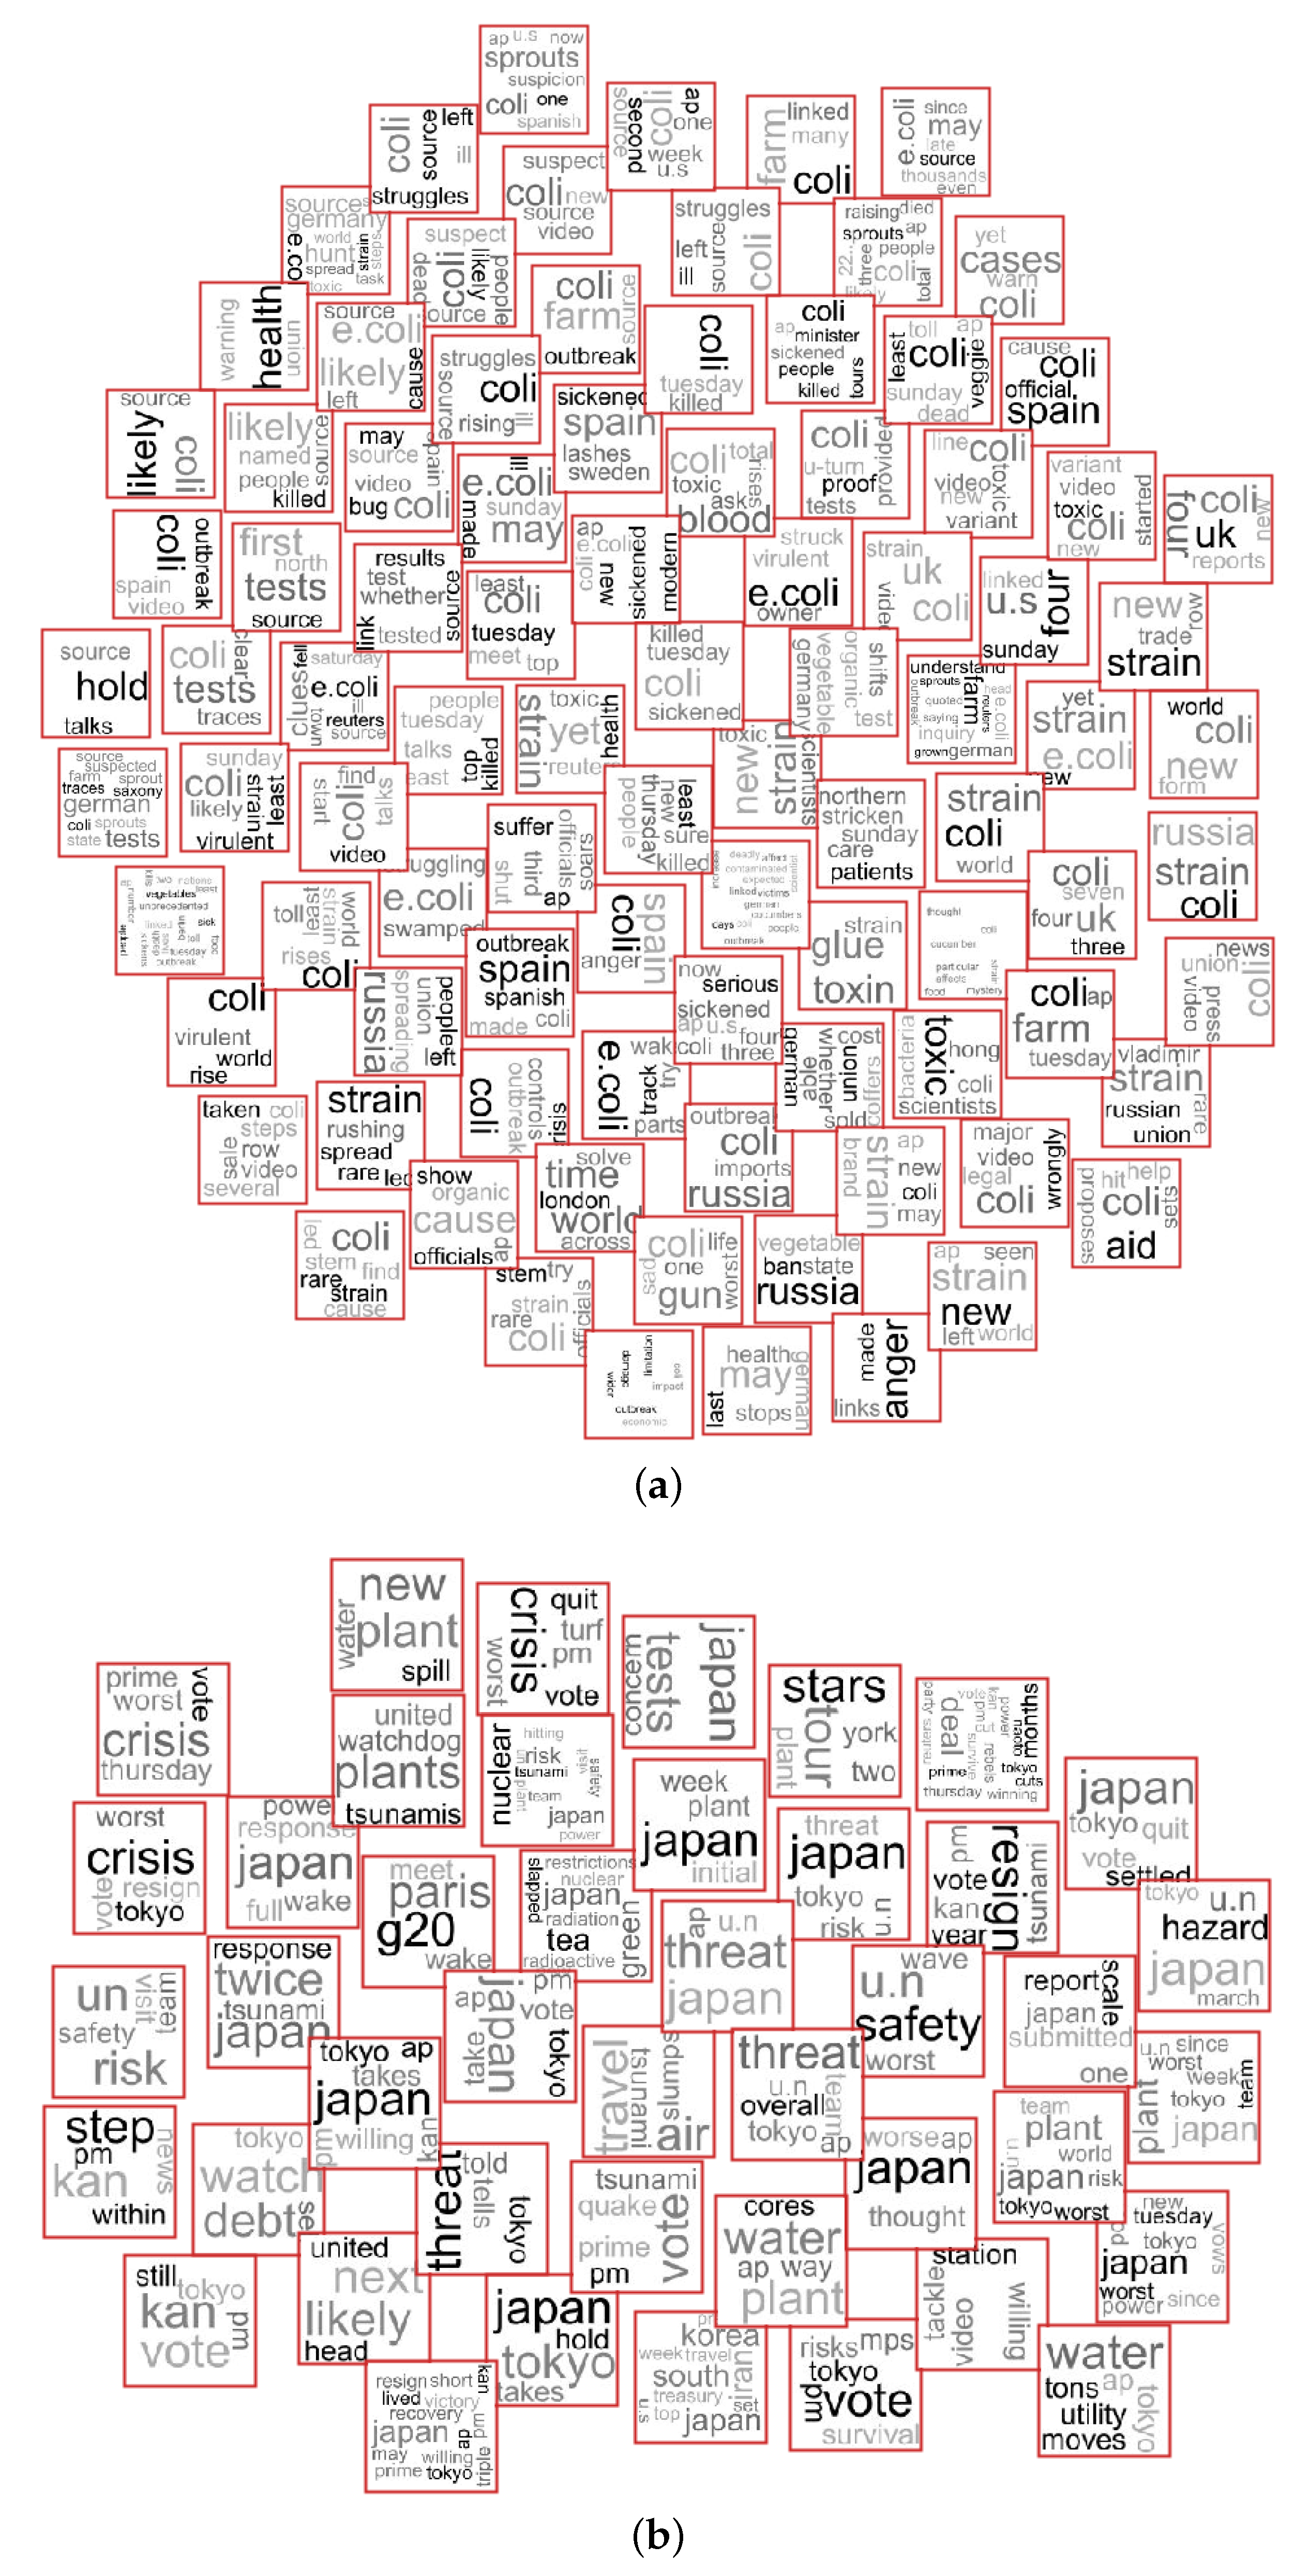
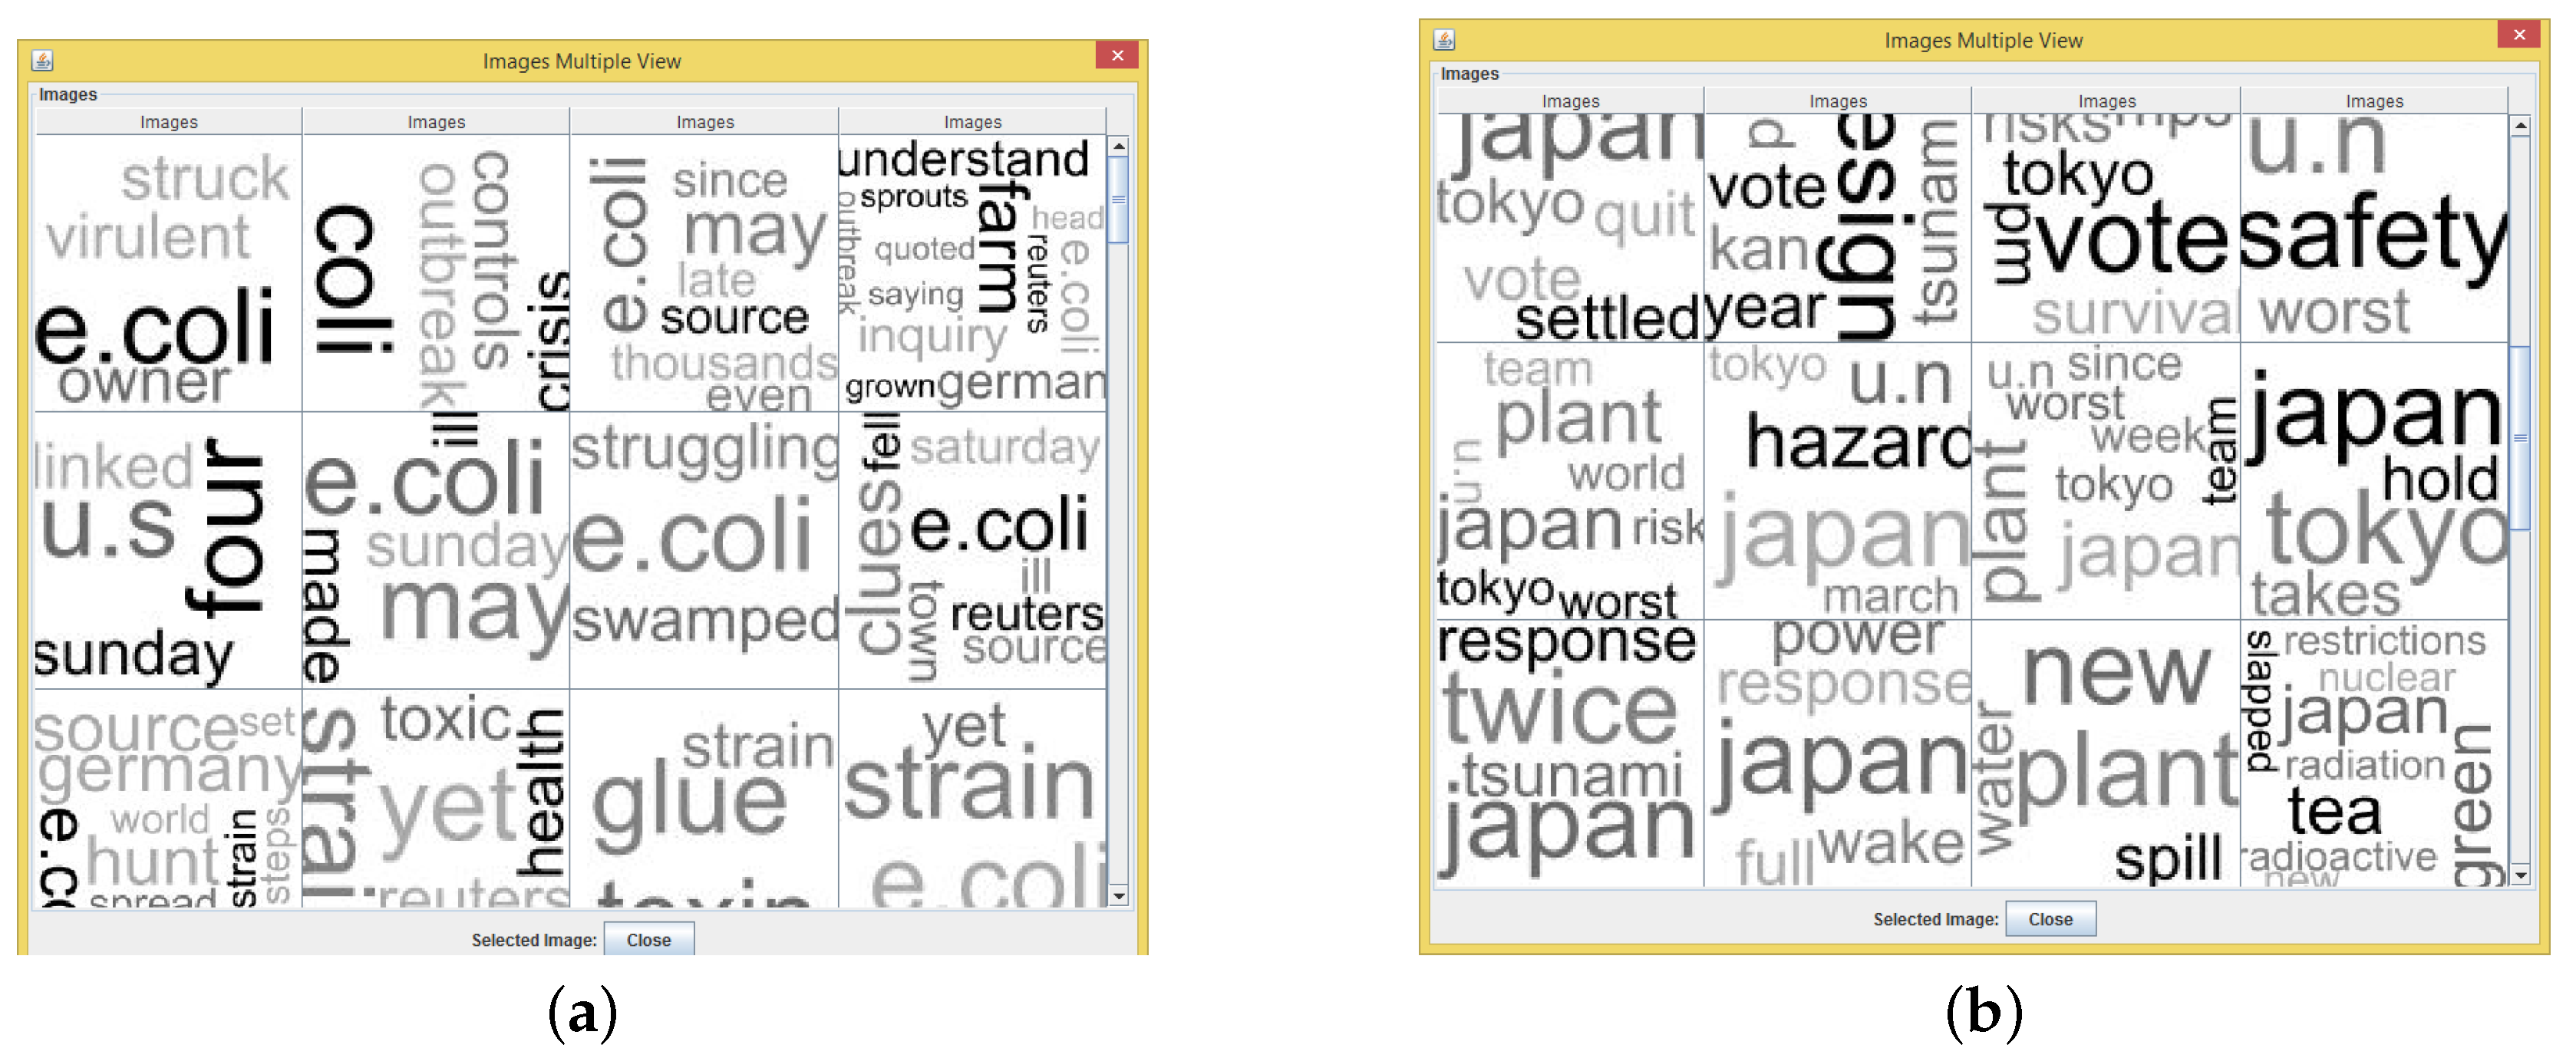
We performed detailed analysis in two clusters from the graphical representation presented in Figure 9a. The proposed approach is employed to show the document similarities and content, as presented in Figure 10. The “Selection A” mapping is presented in Figure 10a and the “Selection B” in Figure 10b. In addition, the content of “Selection A” is presented in Figure 11a, which is related to “European regions infected with e.coli”; and the content of “Selection B” is presented in Figure 11a, showing the main topic related to “the nuclear accident in Fukushima, Japan”.
As presented in these applications, the user can use the proposed approach to note the document similarities and contents. Furthermore, our approach can be used to aid in the comprehension of cluster formation. For instance, as presented in Figure 10, both clusters are generated because the documents have a similar occurrence of the same words. In addition, instances’ relationship can also be analyzed by looking at the word frequency of similar instances.
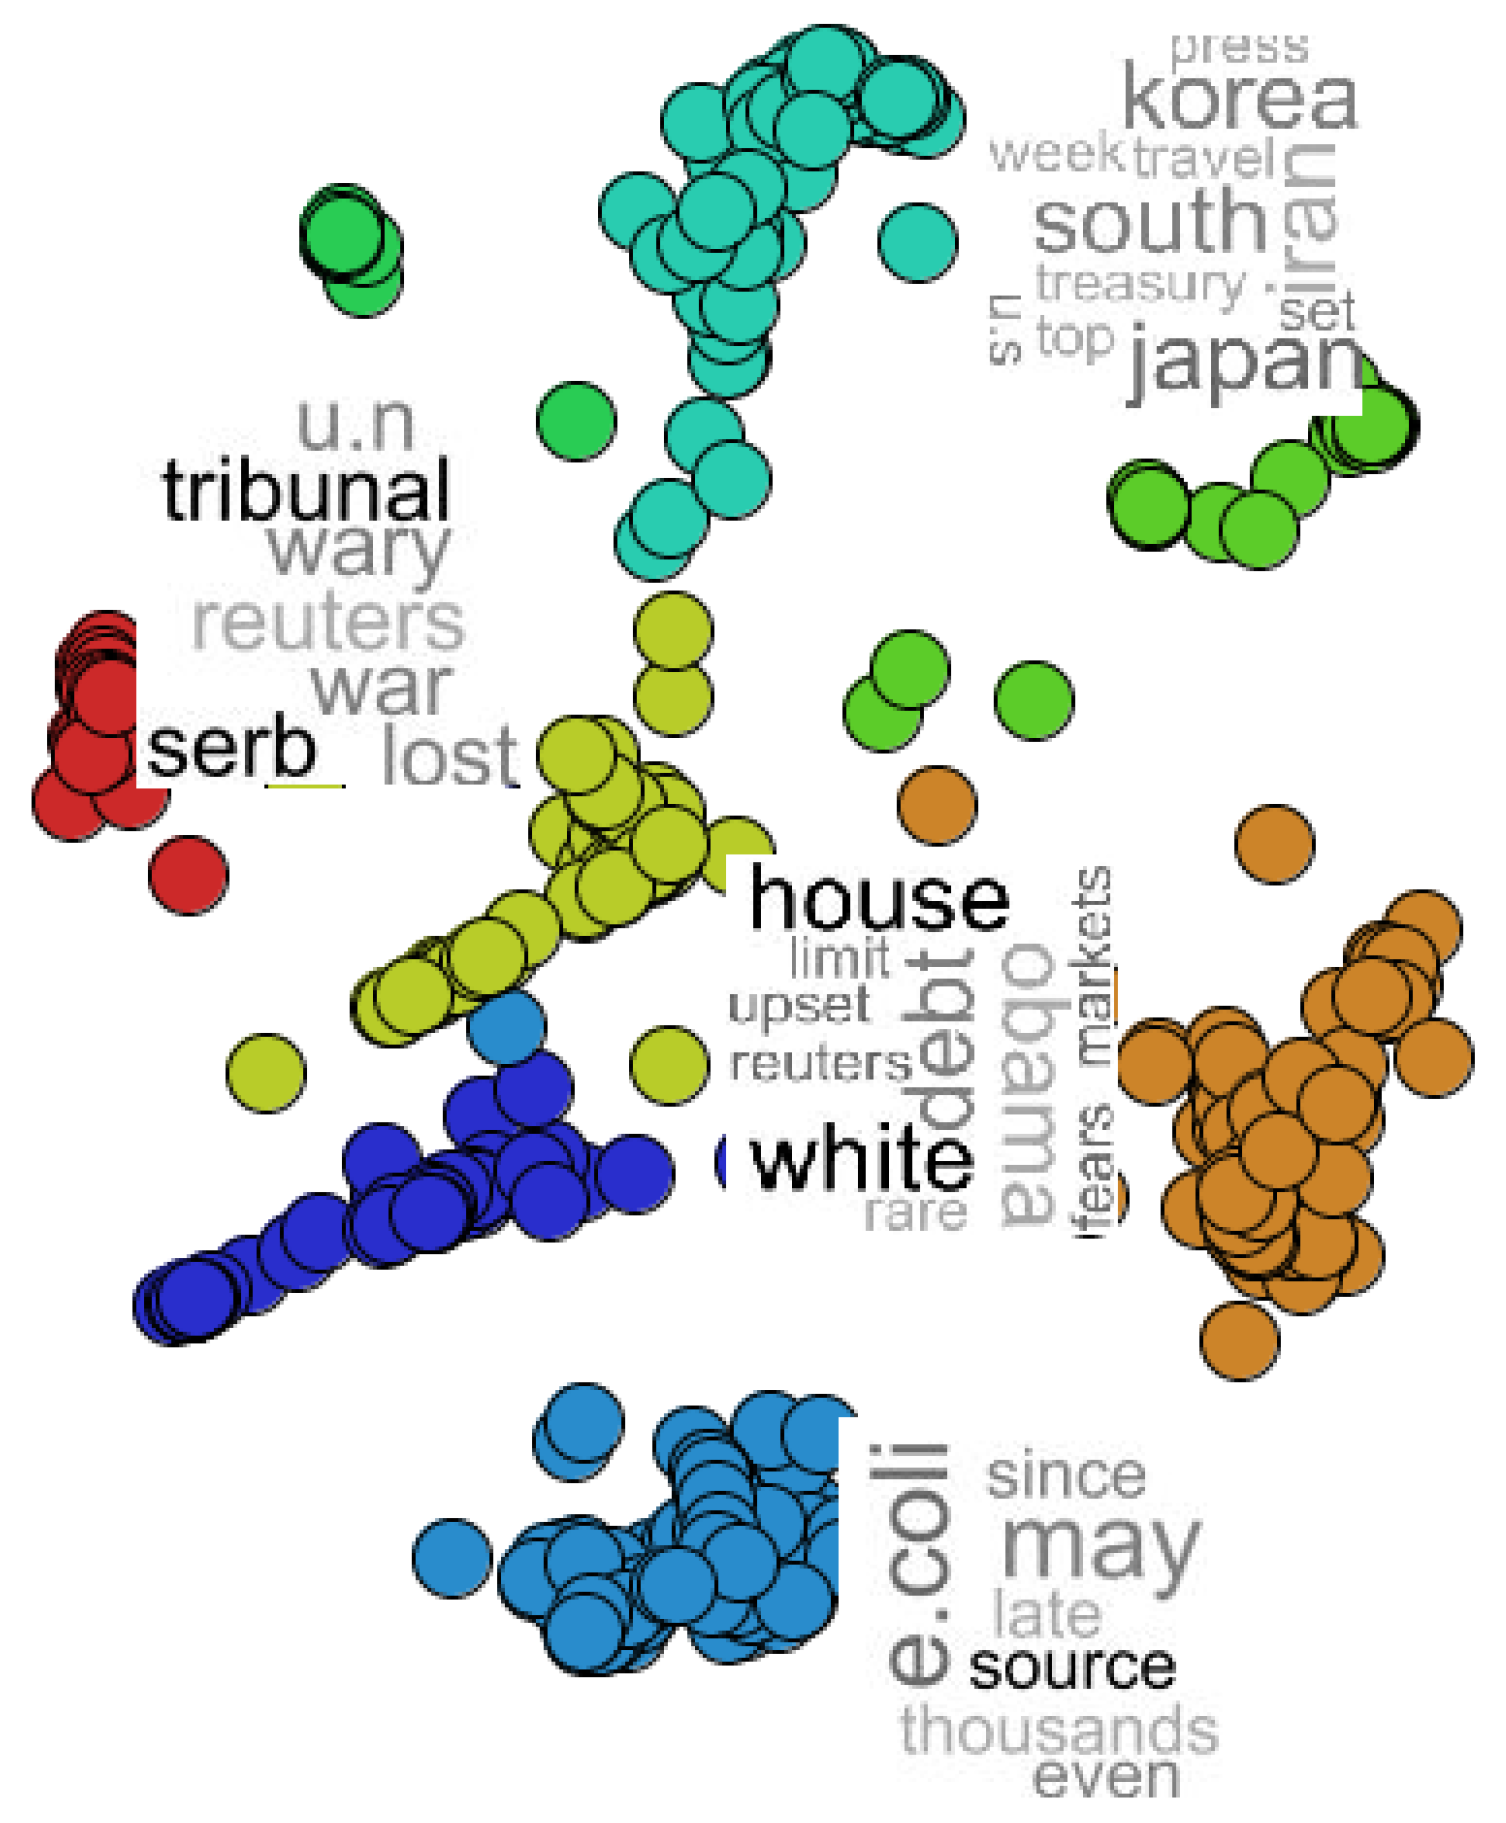
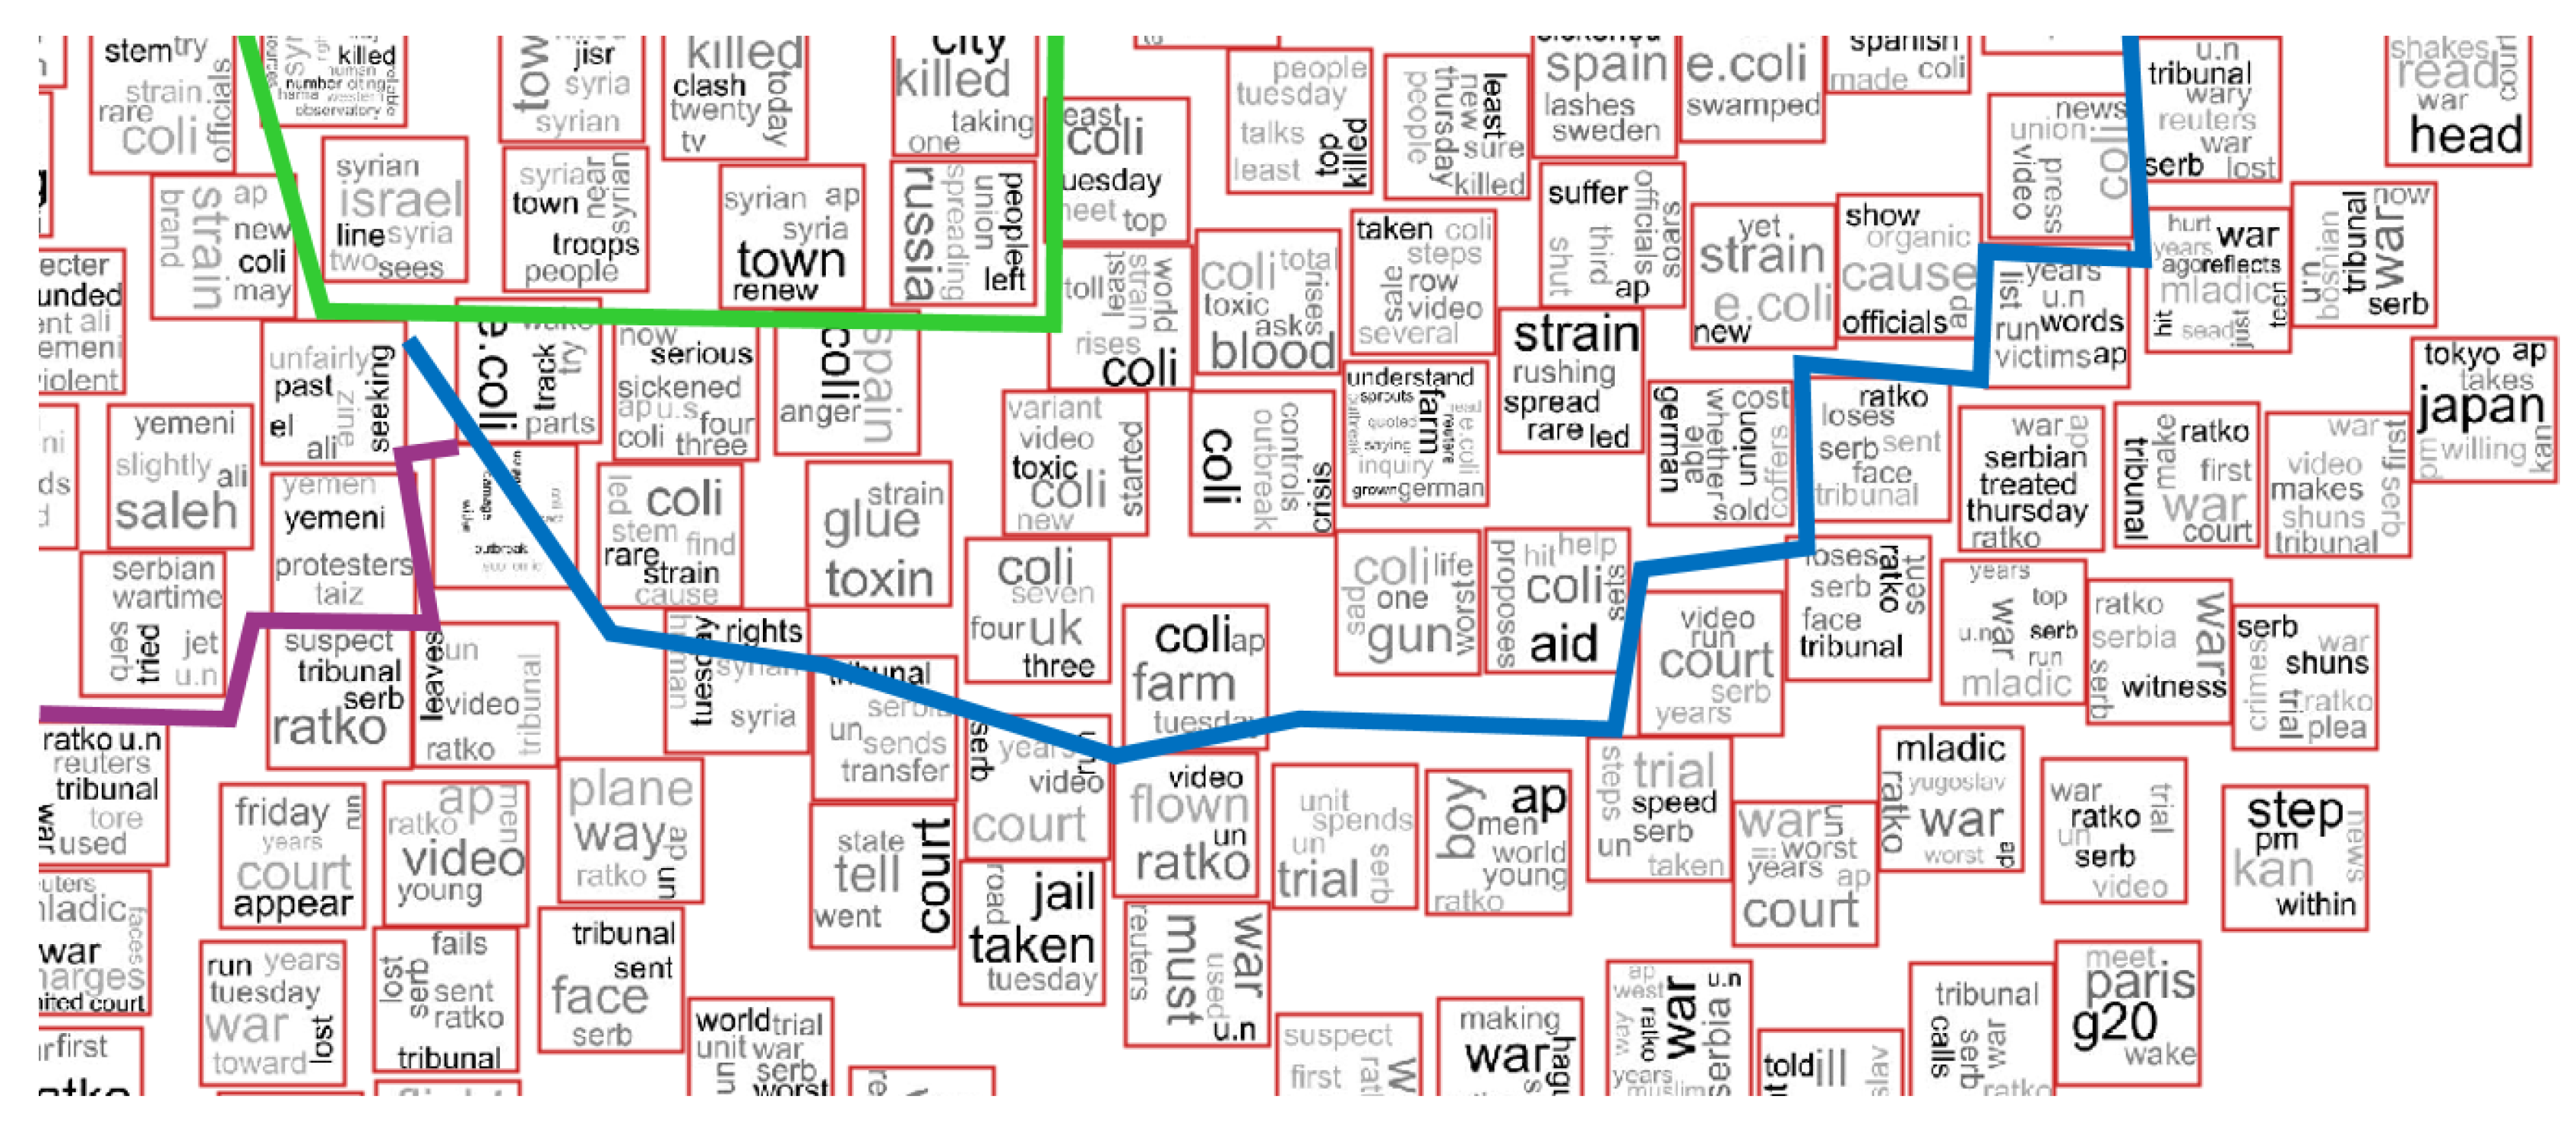
The proposed approach can also be valuable in explaining the similarities’ computation among documents presented in the analyzed dataset, that is intra-cluster comprehension can be performed by looking at the tag clouds generated for each instance. Usually, when a projection is generated, some clusters of documents can be projected close to each other. When exploring a labeled dataset, the frontier between each cluster is easily noted; however, most datasets are unlabeled. Part of the NEWS-8 dataset is presented in Figure 12, in which we omitted the class information to show how it is difficult to note the frontier between clusters. Based on the individual inspection, the user can perceive the frontier between clusters. In this example, we draw lines to show the frontier between each cluster. This example shows that an individual analysis can provide advantages in cluster analysis when compared with a global approach, which only shows the tag cloud computed for the entire cluster.
A problem of multidimensional projection techniques is the overlap among markers when the graphical representation is generated. Even though the user can zoom in to the projected space, overlapping still remains. To overcome this problem, our tool provides some overlap removal techniques presented in the literature; they are ProjSnippet [16], Prism [17], VPSC [18], and RWordle [19]. These techniques can remove the image overlap and preserve the similarity between documents. For example, as shown in Figure 13, we employed the RWordle technique to remove the markers overlapping for those projections presented in Figure 9. Thus, without markers overlapping, the user can easily navigate through the projection.
5. Conclusions and Future Works
We presented a hybrid visualization technique to aid in organization, exploration and analysis of document collections. The proposed technique organizes a document collection by placing together similar documents in 2D space. The exploration and analysis process is also improved with tools and graphical representations for displaying documents’ content. For that, the proposed approach used a multidimensional projection technique to show document similarities in 2D space. Additionally, a tag cloud technique was employed to show the document content in the same graphical representation: the tag cloud of each document was presented as the visual mark in the graphical representation; thus, in a single view, the user could perceive the relationships and content of the whole collection.
In the applications, we used two datasets of world news to show the effectiveness of the proposed approach. In addition, to aid in the exploratory process, the proposed approach was valuable in aiding in the comprehension of clusters’ formation, that is the approach could be used to show why some cluster of documents were generated and why some documents were similar. This similarity explanation can be performed by looking at the words’ occurrence presented in the tag cloud of each document.
Overlapping is the main limitation of multidimensional projection techniques, and it is unavoidable when large datasets are visualized. To overcome this issue, we used overlap removal techniques and interaction mechanisms such as zoom and selection. However, in future works, we will consider using hierarchical visualization approaches, which can minimize the number of images presented in the graphical representation.
Author Contributions
A.L.D.A. and L.F.S. conceived of the proposed approach and aided in the exploratory analysis. D.M.E. is the advisor of A.L.D.A. and L.F.S., and he conceived of the proposed approach, performed the applications and wrote the paper.
Funding
This research was funded by São Paulo Research Foundation (FAPESP) Grant #2013/03452-0.
Acknowledgments
The authors acknowledge the financial support of the Brazilian financial agency São Paulo Research Foundation (FAPESP) Grant #2013/03452-0, the National Counsel of Technological and Scientific Development (CNPq) and Coordenação de Aperfeiçoamento de Pessoal de Nível Superior (CAPES).
Conflicts of Interest
The authors declare no conflict of interest.
References
- Tejada, E.; Minghim, R.; Nonato, L.G. On Improved Projection Techniques to Support Visual Exploration of Multidimensional Data Sets. Inf. Visual. 2003, 2, 218–231. [Google Scholar] [CrossRef]
- Eler, D.M.; Almeida, A.; Teixeira, J.; Pola, I.; Pola, F.; Dias, M.; Olivete, C. Feature Space Unidimensional Projections for Scatterplots. Colloq. Exactarum 2017, 9, 58–68. [Google Scholar] [CrossRef]
- Eler, D.M.; Grosa, D.; Pola, I.; Garcia, R.; Correia, R.; Teixeira, J. Analysis of Document Pre-Processing Effects in Text and Opinion Mining. Information 2018, 9, 100. [Google Scholar] [CrossRef]
- Silva, L.F.; Eler, D.M. Visual Approach to Boundary Detection of Clusters Projected in 2D Space. In Proceedings of the 14th International Conference on Information Technology: New Generations (ITNG 2017), Las Vegas, NV, USA, 10–12 April 2017; Advances in Intelligent Systems and Computing. Springer International Publishing: Cham, Switzerland, 2017; pp. 849–854. [Google Scholar]
- Card, S.; Mackinlay, J.; Shneiderman, B. Readings in Information Visualization: Using Vision to Think; Interactive Technologies Series; Morgan Kaufmann Publishers: Burlington, MA, USA, 1999. [Google Scholar]
- Ware, C. Information Visualization: Perception for Design; Interactive Technologies; Elsevier Science: New York, NY, USA, 2012. [Google Scholar]
- De Oliveira, M.; Levkowitz, H. From visual data exploration to visual data mining: A survey. IEEE Trans. Visual. Comput. Graph. 2003, 9, 378–394. [Google Scholar] [CrossRef]
- Paulovich, F.V.; Nonato, L.G.; Minghim, R.; Levkowitz, H. Least square projection: A fast high-precision multidimensional projection technique and its application to document mapping. IEEE Trans. Visual. Comput. Graph. 2008, 14, 564–575. [Google Scholar] [CrossRef] [PubMed]
- Paulovich, F.V.; Oliveira, M.C.F.; Minghim, R. The projection explorer: A flexible tool for projection-based multidimensional visualization. In Proceedings of the SIBGRAPI 2007 XX Brazilian Symposium on Computer Graphics and Image Processing, Minas Gerais, Brazil, 7–10 October 2007; pp. 27–36. [Google Scholar]
- Burch, M.; Lohmann, S.; Beck, F.; Rodriguez, N.; Di Silvestro, L.; Weiskopf, D. RadCloud: Visualizing Multiple Texts with Merged Word Clouds. In Proceedings of the 2014 18th International Conference on Information Visualisation (IV), Paris, France, 16–18 July 2014; pp. 108–113. [Google Scholar]
- Lohmann, S.; Heimerl, F.; Bopp, F.; Burch, M.; Ertl, T. Concentri Cloud: Word Cloud Visualization for Multiple Text Documents. In Proceedings of the 2015 19th International Conference on Information Visualisation, Barcelona, Spain, 21–24 July 2015; pp. 114–120. [Google Scholar]
- Chen, Y.X.; Santamaría, R.; Butz, A.; Therón, R. TagClusters: Semantic Aggregation of Collaborative Tags beyond TagClouds. In Proceedings of the 10th International Symposium on Smart Graphics, Salamanca, Spain, 28–30 May 2009; Butz, A., Fisher, B., Christie, M., Krüger, A., Olivier, P., Therón, R., Eds.; Springer: Berlin/Heidelberg, Germany, 2009; pp. 56–67. [Google Scholar]
- Paulovich, F.V.; Toledo, F.M.B.; Telles, G.P.; Minghim, R.; Nonato, L.G. Semantic Wordification of Document Collections. Comput. Graph. Forum 2012, 31, 1145–1153. [Google Scholar] [CrossRef]
- Eler, D.M.; Teixeira, J.B.M.; Macanha, P.A.; Garcia, R.E. Simplified Stress and Simplified Silhouette Coefficient to a Faster Quality Evaluation of Multidimensional Projection Techniques and Feature Spaces. In Proceedings of the International Conference on Information Visualization, Barcelona, Spain, 21–24 July 2015; IEEE Computer Society: New York, NY, USA, 2015; pp. 133–139. [Google Scholar]
- Eler, D.M.; Garcia, R.E. Using Otsu’s Threshold Selection Method for Eliminating Terms in Vector Space Model Computation. In Proceedings of the International Conference on Information Visualization, London, UK, 16–18 July 2013; IEEE Computer Society: New York, NY, USA, 2013; pp. 220–226. [Google Scholar]
- G-Nieto, E.; Roman, F.S.; Pagliosa, P.; Casaca, W.; Helou, E.S. Similarity Preserving Snippet-Based Visualization of Web Search Results. IEEE Trans. Visual. Comput. Graph. 2014, 20, 457–470. [Google Scholar] [CrossRef] [PubMed]
- Gansner, E.R.; Hu, Y. Efficient, Proximity-Preserving Node Overlap Removal. J. Graph. Algorithms Appl. 2010, 14, 53–74. [Google Scholar] [CrossRef]
- Dwyer, T.; Marriott, K.; Stuckey, P.J. Fast Node Overlap Removal. In Proceedings of the 13th International Conference on Graph Drawing, Limerick, Ireland, 12–14 July 2005; pp. 153–164. [Google Scholar]
- Strobelt, M.; Spicker, M.; Stoffel, A.; Keim, D.; Deussen, O. Rolled-out Wordles: A Heuristic Method for Overlap Removal of 2D Data Representatives. Comput. Graph. Forum 2012, 31, 1135–1144. [Google Scholar] [CrossRef]
Figure 1.
Example of visualization techniques: (a) a graphical representation generated with a multidimensional projection technique from a textual dataset of scientific papers; and (b) a graphical representation generated with tag cloud technique.
Figure 1.
Example of visualization techniques: (a) a graphical representation generated with a multidimensional projection technique from a textual dataset of scientific papers; and (b) a graphical representation generated with tag cloud technique.

Figure 2.
Proposed approach: (a) the complete process and (b) the detailed process of computing tag clouds for each document.
Figure 2.
Proposed approach: (a) the complete process and (b) the detailed process of computing tag clouds for each document.

Figure 3.
Example of application: (a) a 2D projection of a document collection and (b) the tag cloud images mapped as visual marks.
Figure 3.
Example of application: (a) a 2D projection of a document collection and (b) the tag cloud images mapped as visual marks.

Figure 4.
Interaction tool: the tag cloud of a document is shown when passing the mouse over a point.
Figure 4.
Interaction tool: the tag cloud of a document is shown when passing the mouse over a point.

Figure 5.
Interaction tools: (a) selection of a group o documents; (b) the content of each document is shown in a separated view; (c) the tag cloud of each document is shown in a separated view; (d) a tag cloud build from the selection (all selected documents) is shown in a separated view.
Figure 5.
Interaction tools: (a) selection of a group o documents; (b) the content of each document is shown in a separated view; (c) the tag cloud of each document is shown in a separated view; (d) a tag cloud build from the selection (all selected documents) is shown in a separated view.

Figure 6.
Analysis of the NEWS-13 dataset: (a) a 2D projection of the document collection and (b) the tag cloud of each document as a visual mark.
Figure 6.
Analysis of the NEWS-13 dataset: (a) a 2D projection of the document collection and (b) the tag cloud of each document as a visual mark.

Figure 7.
Analysis of the NEWS-13 dataset: (a) zoom in of Selection B from Figure 6 and (b) the tag cloud mapping from (a).
Figure 7.
Analysis of the NEWS-13 dataset: (a) zoom in of Selection B from Figure 6 and (b) the tag cloud mapping from (a).

Figure 8.
Analysis of the NEWS-13 dataset: (a) some tag clouds from Selection A from Figure 6 and (b) some tag clouds from Selection B from Figure 6.

Figure 9.
Analysis of the NEWS-8 dataset: (a) a 2D projection of the document collection and (b) the tag cloud of each document as a visual mark.
Figure 9.
Analysis of the NEWS-8 dataset: (a) a 2D projection of the document collection and (b) the tag cloud of each document as a visual mark.

Figure 10.
Analysis of the NEWS-8 dataset: (a) zoom in of Selection A from Figure 9 and (b) zoom in of Selection B from Figure 9.

Figure 11.
Analysis of the NEWS-8 dataset: (a) some tag clouds from Selection A from Figure 6 and (b) some tag clouds from Selection B from Figure 6.

Figure 12.
Frontier identification based on individual inspection of the tag clouds computed for each instance.
Figure 12.
Frontier identification based on individual inspection of the tag clouds computed for each instance.

Figure 13.
Overlap removal technique applied in the projection of the NEWS-8 dataset presented in Figure 9. The RWordletechnique removed the overlapping of points (a) and images (b).
Figure 13.
Overlap removal technique applied in the projection of the NEWS-8 dataset presented in Figure 9. The RWordletechnique removed the overlapping of points (a) and images (b).

© 2018 by the authors. Licensee MDPI, Basel, Switzerland. This article is an open access article distributed under the terms and conditions of the Creative Commons Attribution (CC BY) license (http://creativecommons.org/licenses/by/4.0/).
Share and Cite
MDPI and ACS Style
Andreotti, A.L.D.; Silva, L.F.; Eler, D.M. Hybrid Visualization Approach to Show Documents Similarity and Content in a Single View. Information 2018, 9, 129. https://doi.org/10.3390/info9060129
AMA Style
Andreotti ALD, Silva LF, Eler DM. Hybrid Visualization Approach to Show Documents Similarity and Content in a Single View. Information. 2018; 9(6):129. https://doi.org/10.3390/info9060129
Chicago/Turabian StyleAndreotti, Andre Luiz Dias, Lenon Fachiano Silva, and Danilo Medeiros Eler. 2018. "Hybrid Visualization Approach to Show Documents Similarity and Content in a Single View" Information 9, no. 6: 129. https://doi.org/10.3390/info9060129
Note that from the first issue of 2016, this journal uses article numbers instead of page numbers. See further details here.