Hadoop Cluster Deployment: A Methodological Approach
by
 , , and
Ronaldo Celso Messias Correia
1, 
Gabriel Spadon
2 ,
,
Pedro Henrique De Andrade Gomes
1,
Danilo Medeiros Eler
1,*,
Rogério Eduardo Garcia
1 and
Celso Olivete Junior
1 1
Departamento de Matematica e Computação, Sao Paulo State University—UNESP, Presidente Prudente 19060-900, Brazil
2
Instituto de Ciencias Matematicas e Computacao, University of Sao Paulo—USP, Sao Carlos 13566-590, Brazil
*
Author to whom correspondence should be addressed.
Information 2018, 9(6), 131; https://doi.org/10.3390/info9060131
Submission received: 27 February 2018
/
Revised: 24 May 2018
/
Accepted: 25 May 2018
/
Published: 29 May 2018
(This article belongs to the Special Issue Information Technology: New Generations (ITNG 2017))
Abstract
:For a long time, data has been treated as a general problem because it just represents fractions of an event without any relevant purpose. However, the last decade has been just about information and how to get it. Seeking meaning in data and trying to solve scalability problems, many frameworks have been developed to improve data storage and its analysis. As a framework, Hadoop was presented as a powerful tool to deal with large amounts of data. However, it still causes doubts about how to deal with its deployment and if there is any reliable method to compare the performance of distinct Hadoop clusters. This paper presents a methodology based on benchmark analysis to guide the Hadoop cluster deployment. The experiments employed The Apache Hadoop and the Hadoop distributions of Cloudera, Hortonworks, and MapR, analyzing the architectures on local and on clouding—using centralized and geographically distributed servers. The results show the methodology can be dynamically applied on a reliable comparison among different architectures. Additionally, the study suggests that the knowledge acquired can be used to improve the data analysis process by understanding the Hadoop architecture.
1. Introduction
Big Data is an abstract concept that tends to be generalized in a framework through methods and paradigms of data generation, collection, and analysis. It is also responsible for dealing with high scalability, reliability and fault tolerance on a large number of data [1]. Furthermore, Big Data offers a solid foundation to solve socio-economic, socio-political, health and national security problems through data analysis [2,3].
Much has been written about Big Data problems and its solutions, challenges about software development, system deployment, network infrastructure and data collection have been kept in focus throughout the years [4]. There are several Big Data applications due to the high data generation rate caused by continuous improvements in the data science area [5], mostly influenced by the digital expansion and the global access to technology. In those Big Data applications, Hadoop MapReduce and Hadoop Distributed File System (HDFS) have been used in commercial solutions and in research areas [4]—the first one supports data analytical processing, and the second one performs a distributed file-block storage [6].
However, an examination of the factors that impact the data distribution is necessary. Some arguments were formalized by Khalid, Afzal and Aftab [7] and Souza et al. [8], but none of them introduced the methodology to choose the computational model—for the purposes of this paper, the terms “computational architecture” and “computational model” are not distinguished. Thus, following the reasoning set forth by the mentioned authors, we hypothesized that the process of choosing a computational model to implement Hadoop can be methodologically defined.
The literature review showed that the distributed Hadoop has been implemented, but there were neither discussion nor questions addressing how to implement it for a given scenario or which is the most preferred model for that. This work stands alone from the benchmark tools introduced by the literature [9,10,11,12]. Each tool aims to increase the server load and its stress, but they do not introduce a methodology to apply the tool and evaluate it.
Souza et al. [13] presented a study using the Hadoop framework as a learning tool—students were invited to use complex data, system architectures, network infrastructure, trending technologies, and algorithms to create evaluation scenarios, in order to define metrics and use the obtained results on benchmark analysis. Difficulties observed during hands sections on Hadoop planning are addressed in this work. We propose a methodology to support the Hadoop cluster usage suitable to performance assessment. Focusing on improving the cluster planning process, we introduced a step-by-step approach to guide the cluster deployment. In addition, we used the computing time of all architectures as a measurement to obtain evidence that the proposed methodology has achieved good results.
The Hadoop file system is based on the Hadoop Distributed File System (HDFS) and performs its work using distributed computing provided by MapReduce. The proposed methodology addresses the implementation of Hadoop in alternative computational models, allowing studies, proposals and analyzes supported by the search for the best performance and processing power of the model. We applied the proposed methodology to guide the cluster deployments and to analyze such architecture through benchmark tests both on local and on clouding—using centralized servers as well as locally and geographically distributed. Both the methodology, its application and results obtained are presented in this paper.
This paper is organized as follows: Section 2 presents a brief list of related works; Section 3 presents the computational architecture and a brief description of relevant server layouts found in the literature, and an overview of Hadoop; Section 4 presents steps and results to guide the cluster planning process introducing the application of our methodology; Section 5 illustrates one application of the proposed methodology; Section 6 presents the final remarks.
2. Related Works
The Hadoop framework have been used in many studies, ranging from inquiries to database for Hadoop, to distributed applications developed for MapReduce environment and to centralized architecture to Big Data systems. Studies on data analytics using a Hadoop framework focus on MapReduce scalability and data similarity.
Henrique and Kaster [14] and Rocha and Senger [15] presented solutions to data similarity on complex data and data scalability on MapReduce applied through cluster simulation. For the simulation, Rocha and Senger [15] used MapReduce Over Sim-Grim (MRSG) software on a local cluster of 32 nodes. The main goal of both studies was the data, since none of them applied the tests on different Hadoop architectures.
Another study emphasized the centralized model, searching for better configurations to enhance the framework performance at lower costs. Khalid, Afzal and Aftab [7] performed benchmark tests with two computational models: centralized and distributed; the authors did not explain details about the architecture, but Souza et al. [8] discuss the distributed model implemented using both local and geographical distribution.
Khalid and Hammad’s [16] research focused on balancing, scalability, performance and fault-tolerance on Hadoop clusters with structured data—the same used by Khalid, Afzal and Aftab [7] who researched in a centralized model.
Through the Hadoop, data can be stored and analyzed in environments that offer performance and huge storage space. Many kinds of data cannot be stored on a single personal computer or server. However, data stored on Hadoop are organized into blocks and distributed across the architecture. Consequently, more data can be stored and processed in distinct nodes by the framework.
The reviewed literature showed that the distributed Hadoop has been implemented and there were neither discussion nor questions addressing how to implement for a given scenario or which is the most indicated model for that. This work consists in a methodological approach to support Hadoop cluster planning, and it is apart from the benchmark tools introduced by the literature [9,10,11,12]. Each tool aims to increase the server load and its stress, but they do not introduce any methodology to apply the tool and evaluate it.
The reviewed literature addresses benchmark tools [9,10,11,12]. Each tool aims to increase the server load and its stress, but they do not introduce a methodology to apply the tool and evaluate it. The reviewed literature showed that the distributed Hadoop has been implemented using no methodology. There were neither discussion nor questions addressing how to set up a distributed Hadoop system for a given scenario or the pros and cons of the configurations that are most indicated.
3. Computing Architecture and Hadoop Server Roles
Hadoop can be used over several distributed computing architectures. To provide a context for the application, we chose to present a hierarchical view considering the main implementation of a Hadoop system role, as described in the following.
According to Coulouris, Dollimore and Kindberg [17], a distributed system is the one whose components are located on computers connected to a network and each system node communicates with each other node, coordinating actions by exchanging messages through network interfaces. The distributed model neither shares memory, storage nor clock. The nodes are independent, but they work for a common result. Furthermore, centralized computing is not divided at all. All resources are centralized on a single server, which can be a server or a client to others servers.
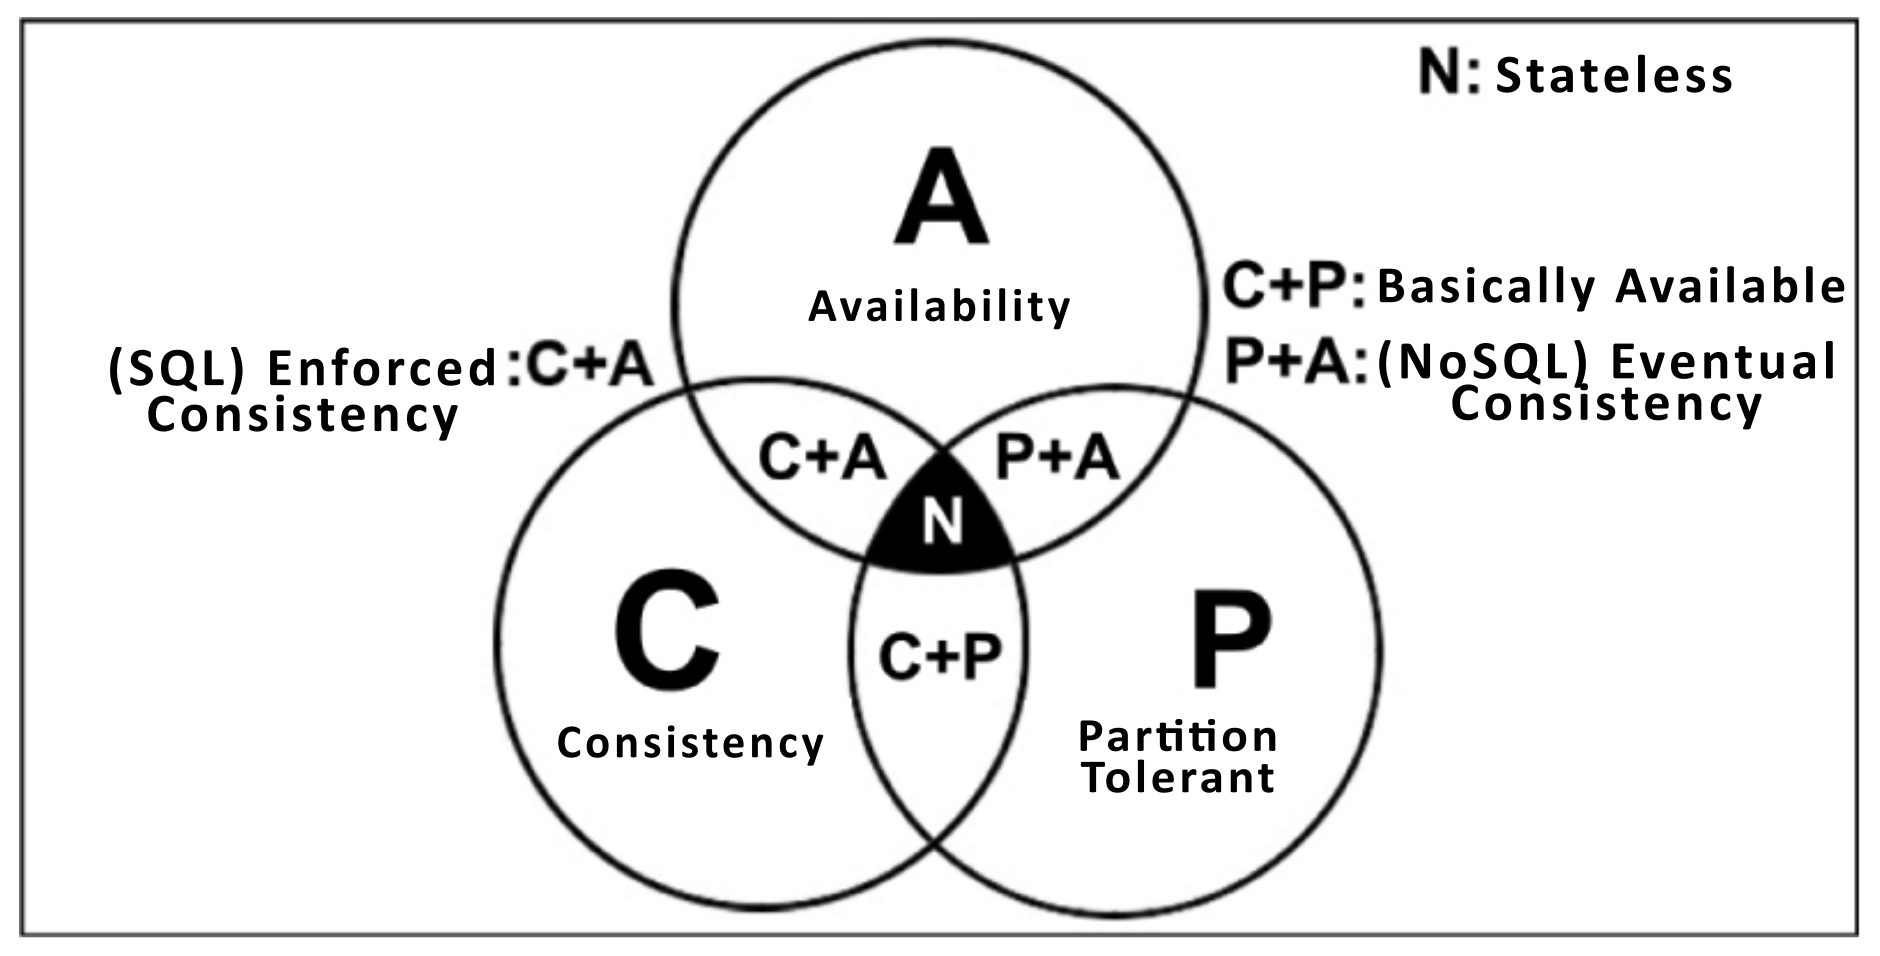
It is possible to compare the distributed system with the Brewer’s Theorem [18], creating a link between the database system and the server environment. To a certain extent, flexibility, availability, and performance are supported by the structure proposed by the theorem, which defines three related characteristics in a database system. As a comparison, we cannot generalize the notation because the theorem is just a reference used to visualize the computational architecture process.
The Brewer’s Theorem is shown in a Venn Diagram as the CAP characteristics named as Consistency, Availability and Partition Tolerance (see Figure 1). The diagram has the intention of showing that no system can simultaneously guarantee the three characteristics and still keep the data reliably. Therefore, this explains the decentralization of the computer system and solidifies the no relational database (NoSQL) [19]. It supports the huge amounts of non-structured data generated daily [20]. For this reason, the CAP could be applied over a distributed system scenario additionally with the characteristics proposed by Coulouris, Dollimore and Kindberg [17] and then it could be transported to a server environment.
The Hadoop framework can even be deployed on a single server (scale-up) or on a set of servers (scale-out), representing centralized and distributed systems, respectively. As the framework is used to solve problems related to data scalability, it is common to find servers deployed on a set of services, sharing resources in order to achieve a common processing goal. Considering those observed facts, we discuss the roles inside the Hadoop ecosystem in the following.
Hadoop Framework
The Apache Hadoop is a framework developed in Java, aiming at the processing of a large amount of data [22]. It was designed to solve data scalability and heterogeneous data analysis problems. The proposed solution depends on a stable model for extensive processing tasks, which cannot be entirely performed on a database system. The idea behind Hadoop is sustained by storage and data processing in the same environment [14].
The Hadoop storage method is one of its most attractive characteristics: the mechanism can be used to store files larger than the capacity of a single hard drive. The Hadoop breaks a file into blocks and redundantly spreads the blocks through the architecture [23]. There is no server in the architecture that has all file blocks; they just store fractions of a file. Besides, another attractive characteristic is the parallel data processing on each grid node performed with MapReduce technology [6].
The capability of storing files larger than a hard drive is a common need when working with complex and extensive information, like storing huge raw data files, e.g., dumps of historical data from databases, etc. Studies based on single node analytical methods are usual, but the MapReduce has a widespread collection of several computational representations [24].
When Hadoop is deployed on a grid or cluster, the information has more than one copy stored on different servers, increasing the data availability. In this scenario, when a server is down, the first server that has the needed information replies the master request [25].
According to Rocha and Kaster [15], the Hadoop was developed to solve complex problems that require distributed storage to allocate all data related to a given problem. Additionally, it is used to solve problems that demand a substantial power processing to handle vast amounts of data. Moreover, it is known that Hadoop could be deployed using a single server or using multiple servers working together.
Making use of distribution, Hadoop implements Client-Server with Master-Slave model—with centralization, the master and slave roles are on the same server sharing all resources. However, Hadoop grid or Hadoop cluster are commonly used to refer distributed Hadoop, and they are not dissociated.
In addition, each grid node hosts a standalone framework managed by the master, and each node controls a distinct group of assigned roles. According to Hadoop Server Roles—HSR (Figure 2), the master hosts the NameNode and the JobTracker/MapReduce, as well as the slaves, that hosts the DataNode/HDFS and the TaskTracker/MapReduce. Hadoop can work with multiples DataNode and TaskTracker on different slaves, as well as SecondaryNameNode, but just one DataNode and TaksTracker on the master server. In order to summarize, a singular brief description is presented in the following.
- JobTracker: divide and distribute problems to TaskTracker;
- TaskTracker: solves small problems;
- DataNode: stores the file blocks;
- NameNode: manages the connections, requests and stores in memory the file block list that contains the paths of each block of each stored file;
- Secondary NameNode: perform assistance executing scheduled maintaining task to the grid.
The Hadoop framework architecture was planned to be independent regarding integrity, availability and scalability problems. The idea is to focus on the problem (in order to propose a solution), not on the environment planning. In other words, the Hadoop framework takes from the administrator the responsibility of taking care of problems related to distributed and parallel computing by guaranteeing the fault tolerance, data scalability and load balancing [14]. However, some configuration is needed and there are points to be managed in order to accomplish it. Such points are addressed by the methodological approach step by step (each step focusing on specific points), presented in the following.
4. Proposed Methodology
The proposed methodology aims to help the deployment of the most suitable architecture to the Hadoop cluster. Thus, the methodology makes use of benchmark tests, performing comparisons with reliable cluster groups, in which each cluster group is a benchmark milestone, created from an already deployed server.
As explained in previous sections, there are several conditions to be considered before choosing the cluster architecture. It is necessary to evaluate the performance of each possibility in the same way to make a reliable choice based on the benchmark results. For that, it is crucial to cause the same load and stress in each architecture as well as to perform metrical analysis on the results.
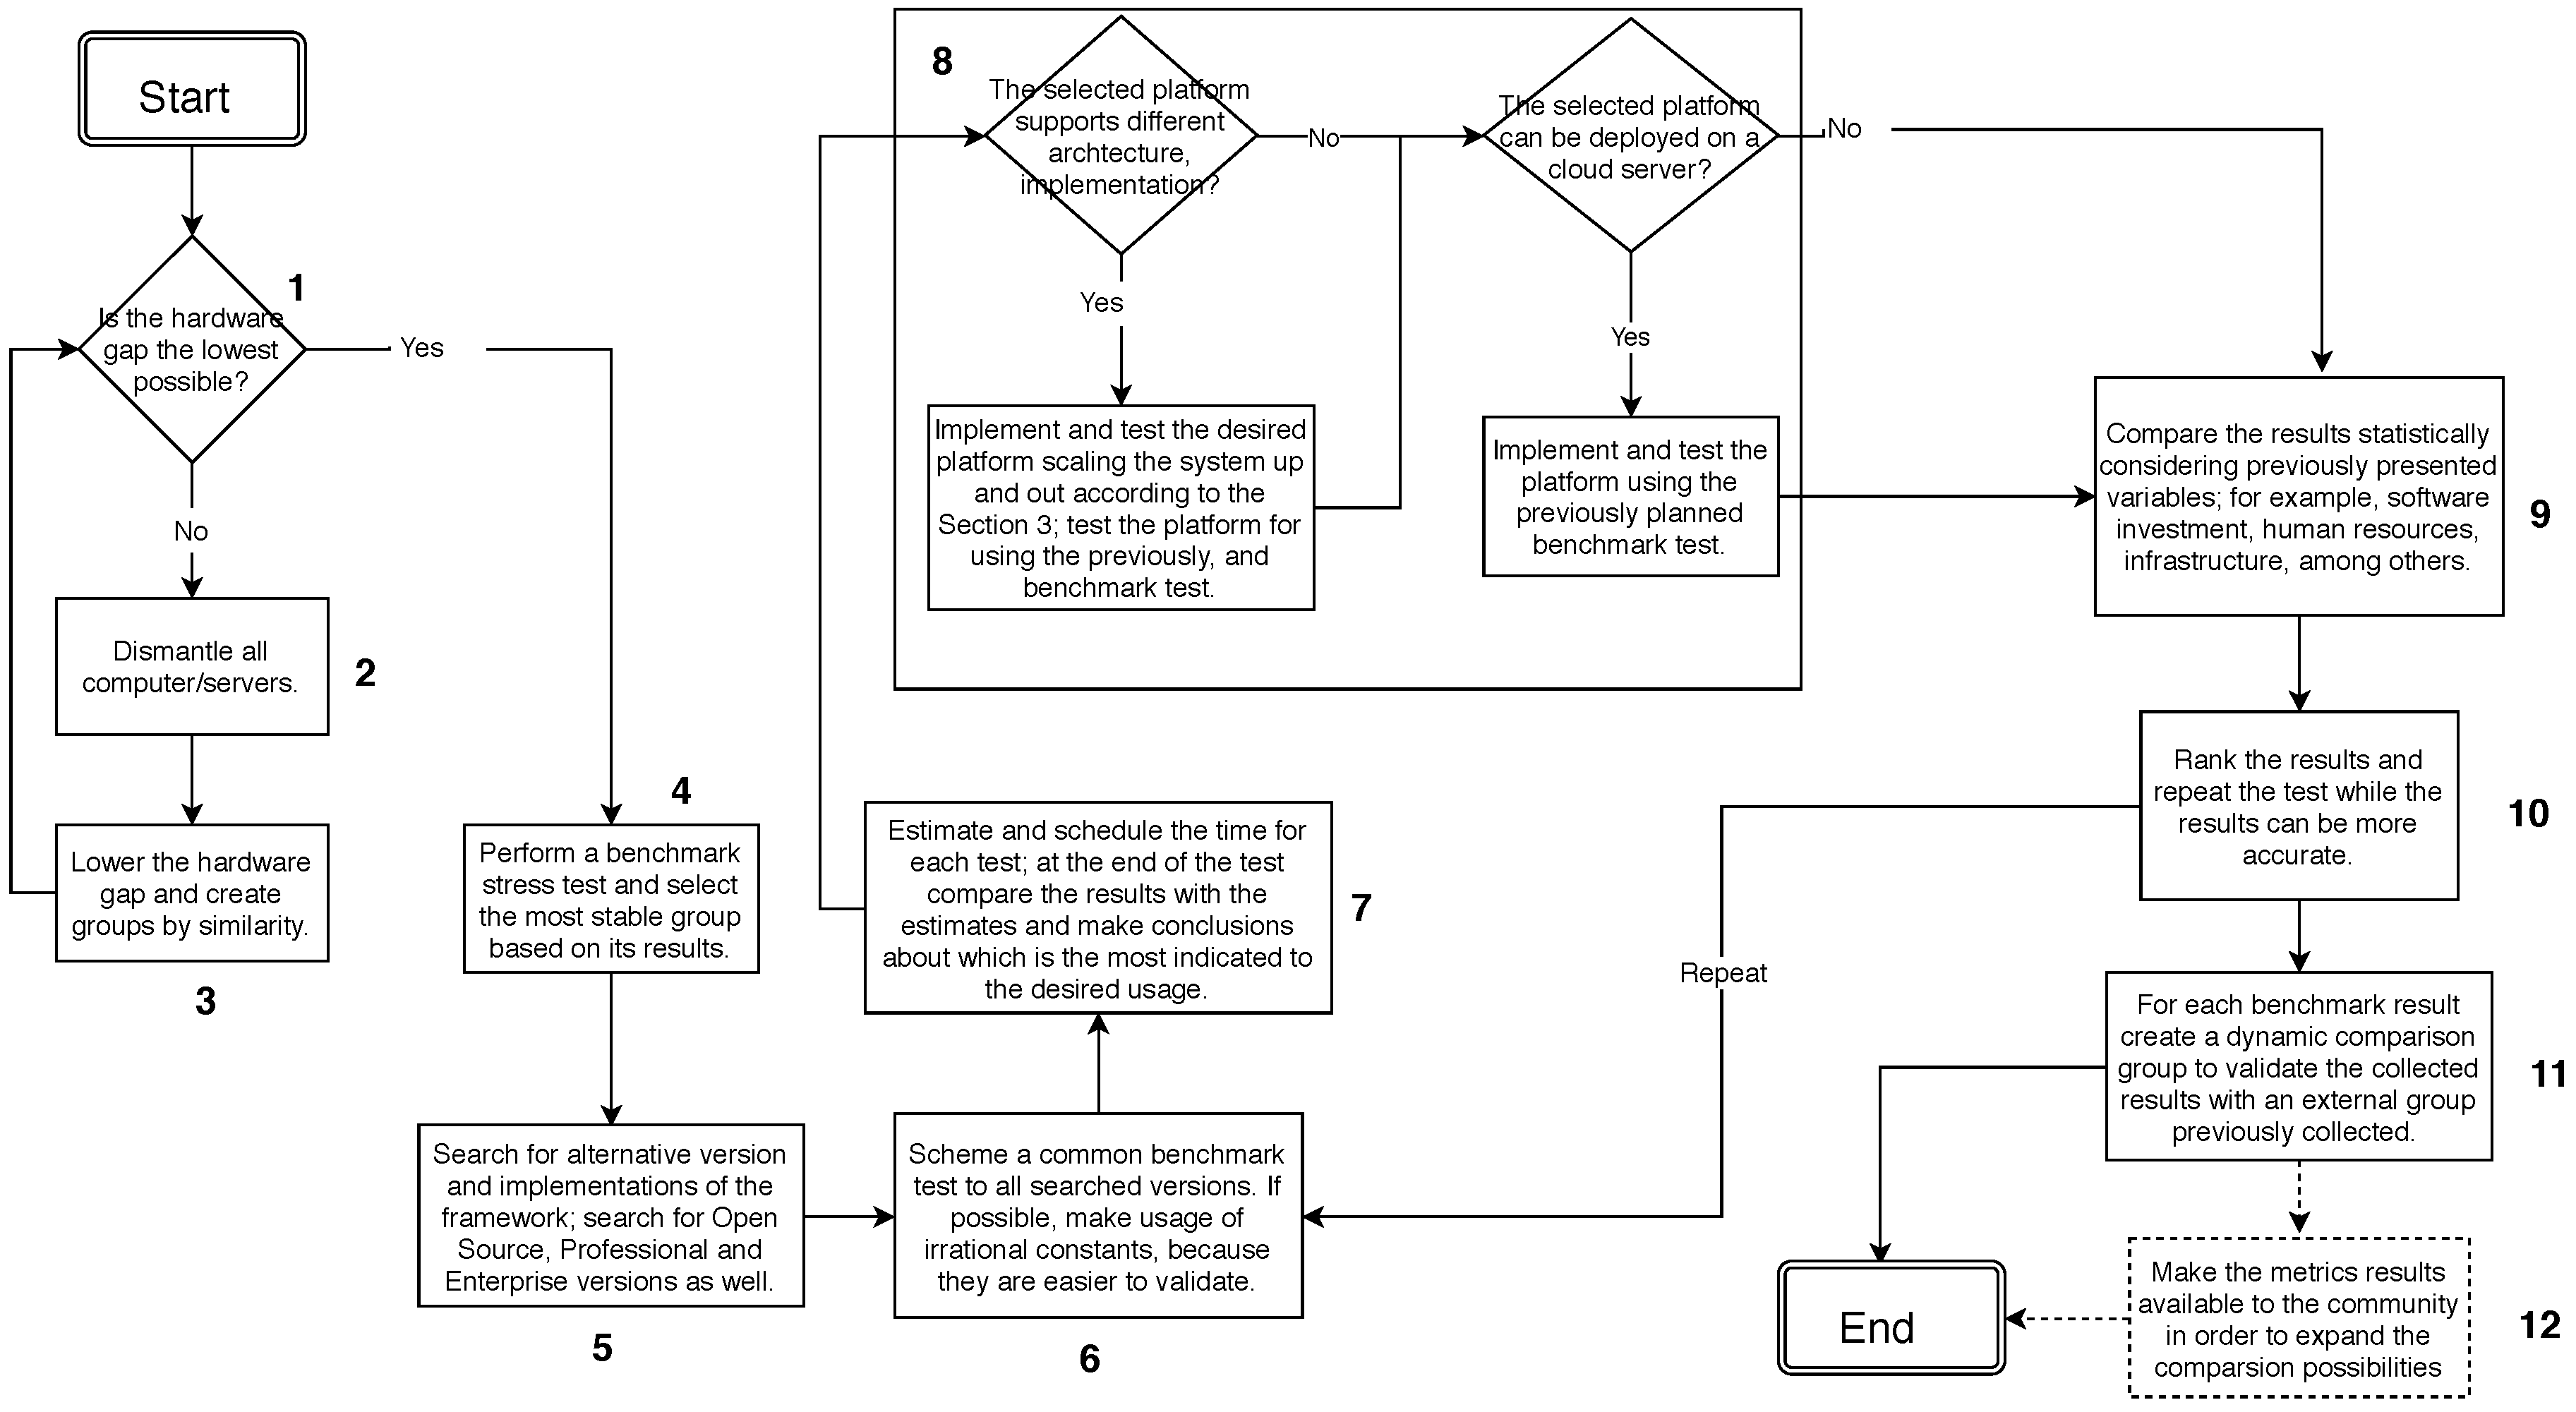
To clarify the discussion, we present a step-by-step description of our metrics, methodology and its results. To exemplify the process, a diagram is illustrated in Figure 3, without considering any specific application, but to demonstrate the decision-making process.
Initially, it is necessary to check if the hardware gap between available computers is as small as possible (see Step 1). If not, it is necessary to disassemble the machines and reassemble them in order to reduce the gap until the condition in Step 1 is satisfied (see Step 2). These initial steps are intended to create groups of computers with similar hardware (see Step 3). If there is more than one group with similar hardware, where each group is similar to other computers in the same group and unlike any other group, we will evaluate each group as a single instance. After that, stress tests will be performed for each group for information on processor and hard drive overheating. Stress tests are run using Tera Sort, which allows you to make use of all processor cores to sort a file of numbers into terabytes, stored on the hard drive. With the results of each distribution, it is proposed to analyze each group with all the others. At this point we should select the most efficient in all tests, and if there is any doubt about the efficiency, the stress test should be redone (see Step 4).
When the stress test is complete, it is important to retest different distributions, such as Open Source, Enterprise, and Professional ones. Each distribution has its own modifications in the Hadoop core and, for scalability purposes, they can act differently while the server is stressed (Step 5). The Hadoop has more than one version and each one performs differently in a server; for instance, Hadoop MapReduce (present in early versions of Apache Hadoop) has centralized management of task execution capabilities while Hadoop YARN (present from Apache Hadoop 2.0) distributes resource management and scheduling/monitoring the execution of tasks in separated modules, which makes it faster at runtime than Hadoop MapReduce.
Equivalent to the cluster nodes evaluation, the computing architecture will be tested with a benchmark that will be compared with a similar cluster using the same computing architecture. The difference is on the benchmark test, once we already tested processing time, core capability and the hard drives, at this step we test the processing time in memory considering the network impact (see Steps 6 and 7). To do so, we make use of the approximation of irrational number like Pi, Euler’s number, golden ratio, among others. Basically, the approximation can be made in memory and it is easy to be validated. The same can be done in a vector of numbers stored in the memory and sorted by a MapReduce algorithm.
After selecting the cluster nodes, it is necessary to guarantee the lowest CPU time to achieve a better platform for data storage and analysis. Thus, we test different computing architectures for the cluster adding network interference as another variable (see Step 8). To perform that interference, we made network attacks to our nodes using Distributed Denial of Service (DDoS), making some nodes, or all nodes, fail during the test. With the node failures, the Hadoop should reach the next node with the requested information, impacting the processing time and sometimes will cause the abortion of the job, because the information requested is not available. The information about the attacks does not need to be stored; at this time, we just need to attack all nodes in the same way and for each architecture store determine the time needed to finish the requested job.
At the end of the analysis, there should be sufficient information to make a choice about the machines to be used, the distribution of Hadoop and its computing architecture (see Steps 9 to 11). To validate the obtained results, the collected information should be compared to other similar clusters. In order to create a benchmark milestone, the collected results should be available to others which will build its own cluster (see Step 12).
To illustrate the usage of this methodology, the next section presents its appliance and the decisions made to build our own cluster.
5. Methodology Appliance
This section illustrates the methodology applied in one scenario inside UNESP research laboratory. To start the analysis, we used 30 tower computers granted by the computer science department (DMC) of UNESP. The available hardware was not uniform, requiring disassembling of all the computers to separate the common hardware and allocating on new computers. As a result, we got different homogeneous processing architecture, half AMD and the other half Intel, with a stress test by a Tera Sort benchmark we decided to use the Intel architecture because they do not overheat as easy as AMD.
Subsequently, we proceeded with research about the distribution of Cloudera—available at http://www.cloudera.com/, Hortonworks—available at http://hortonworks.com/—and MapR—available at https://www.mapr.com/—of the Hadoop 2.4.0 from April 2014. We are sure that they are all excellent and complete platforms, but each one behaved differently on our computers. To quantify the difference between the distributions, we set our computers as a virtual server and, at next, we quantified the processing time of each alternative.
To analyze the distribution results and others in the following, the benchmark chosen method was the Pi estimator with exponential growth, as shown in Table 1. The two input variables (i.e., mapping and sample number) started, respectively, with two and 10 units. For each 100 looping counts, we increased the exponential factor until it reached 512 mapping, and one billion samples.
According to the test preparation, we estimate about 36 h to complete the benchmark in each distribution where all tests occurred individually. For each test, the output is not considered, we just take into account the time, because time is the central point to fit performance and usage need to the same cluster. In addition, the output is a result of the conceptual study and not of the implementation (Section 2).
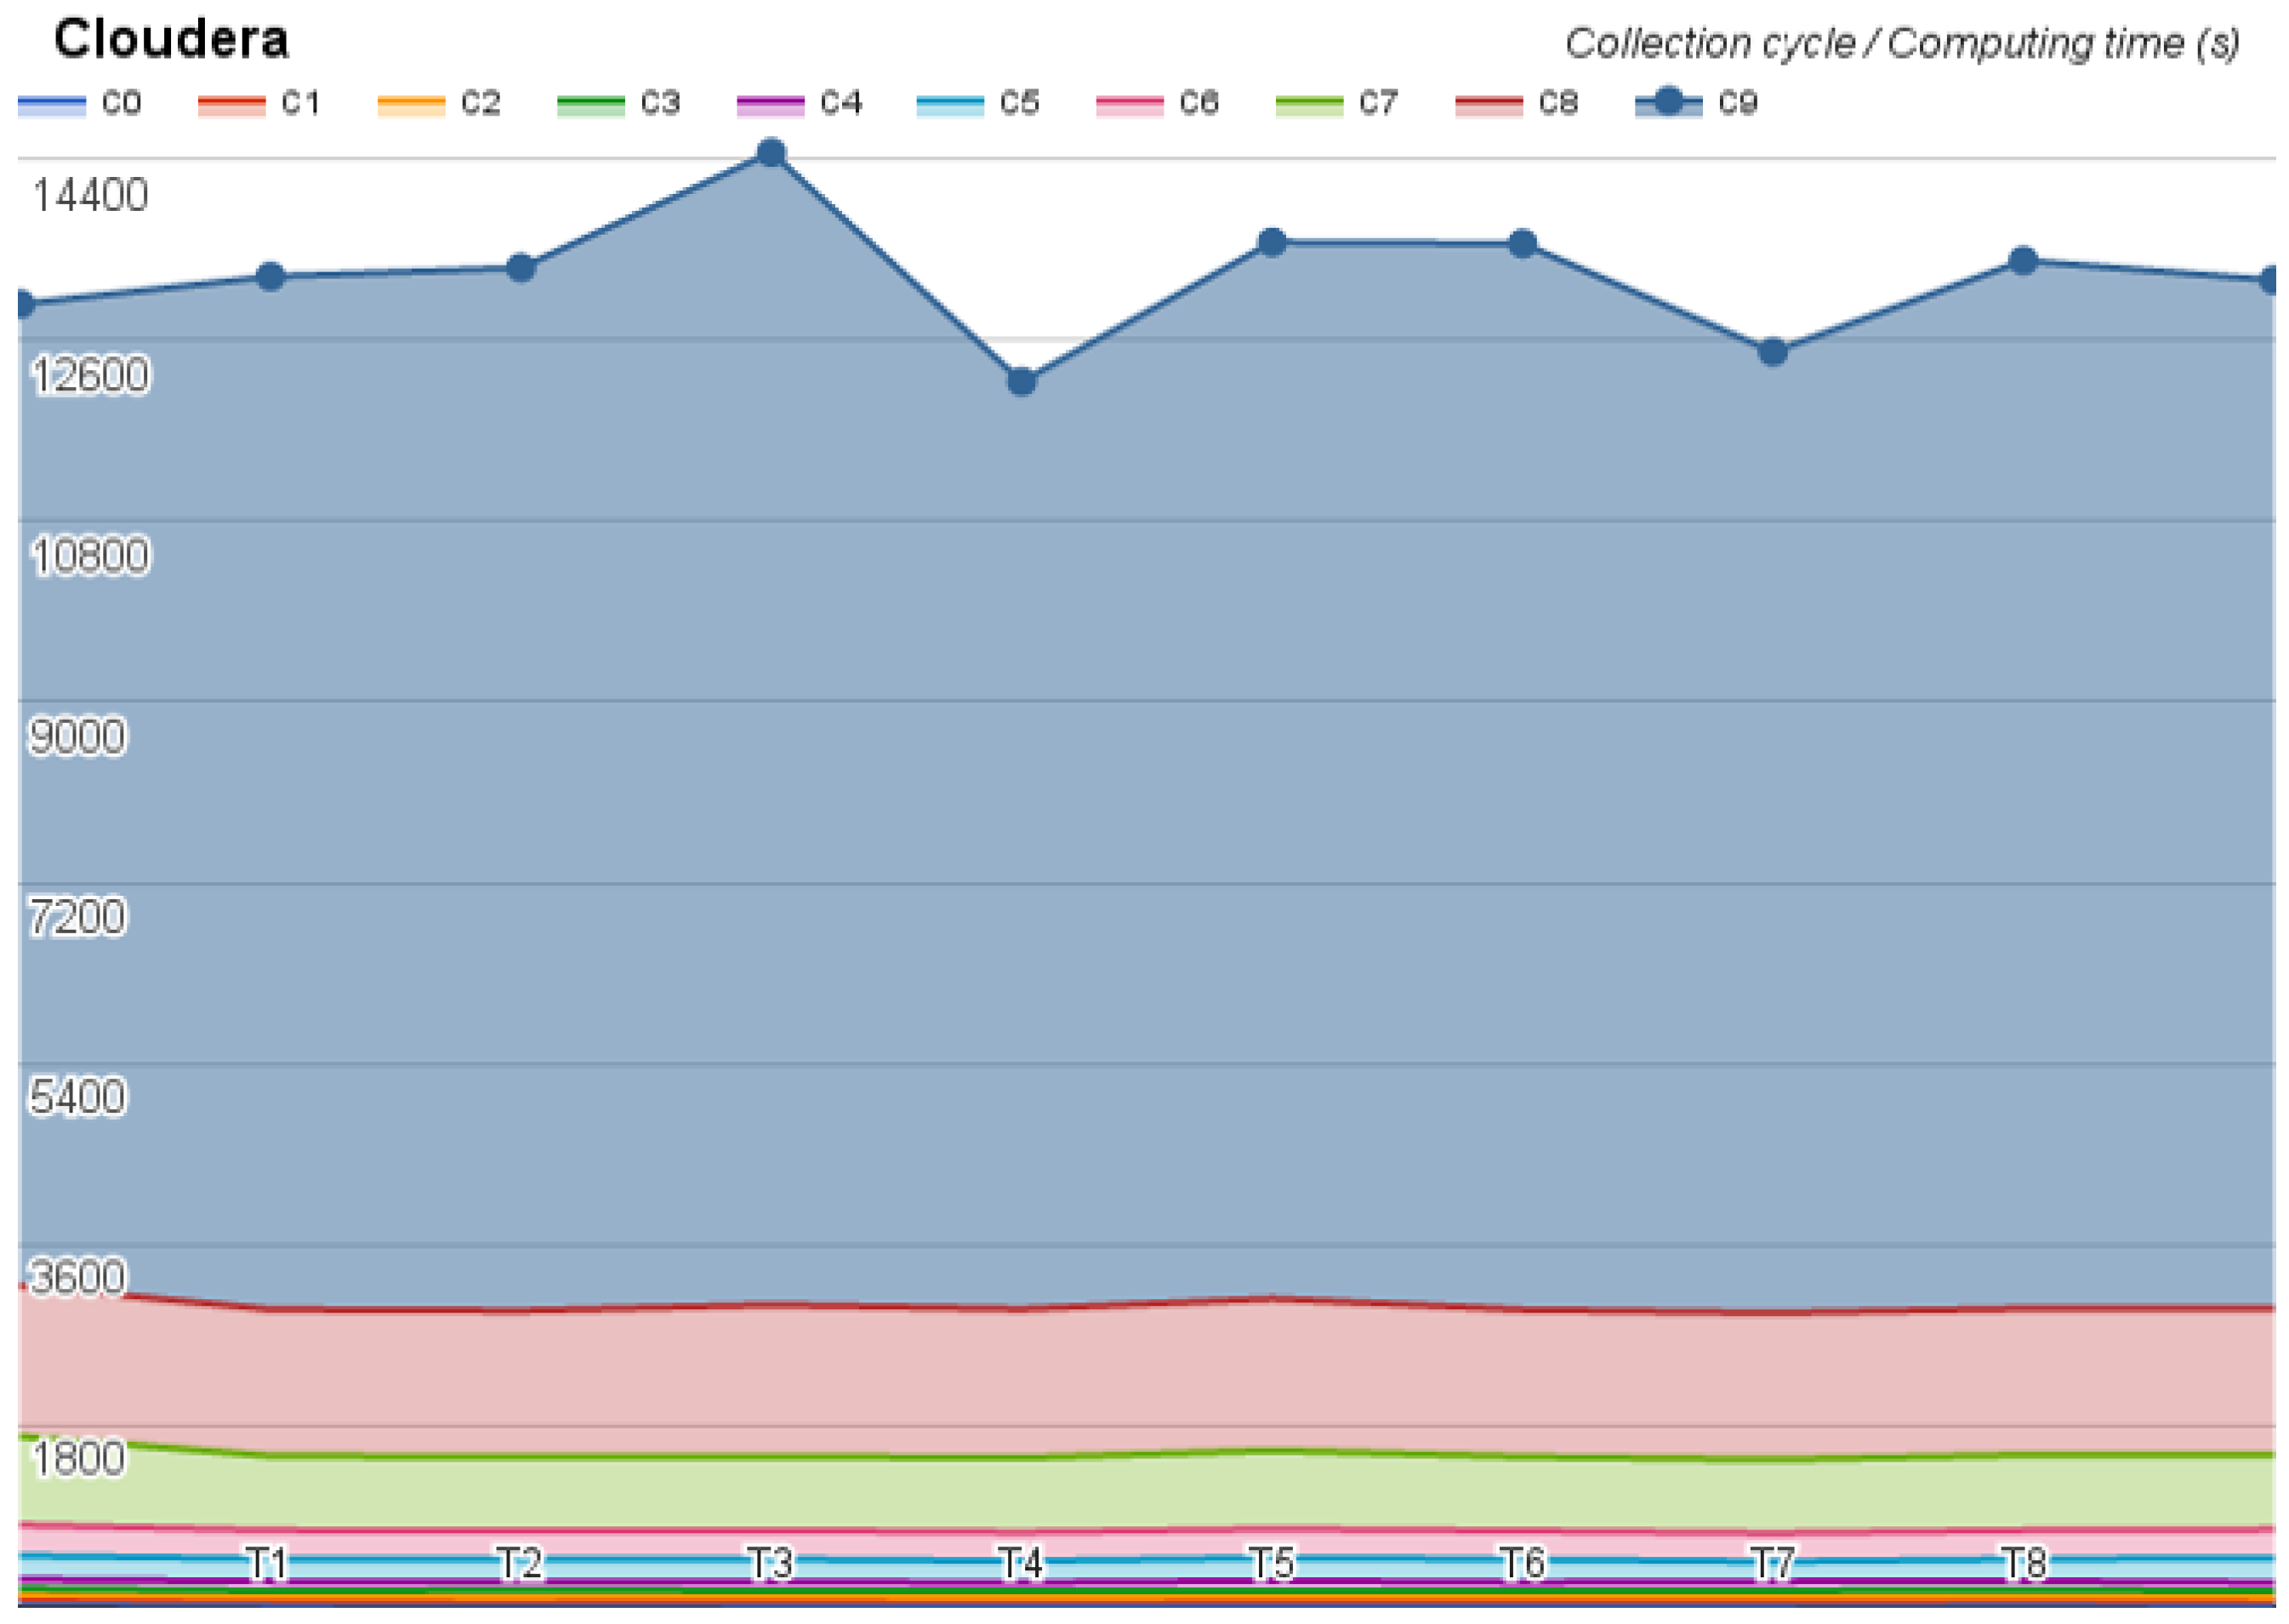
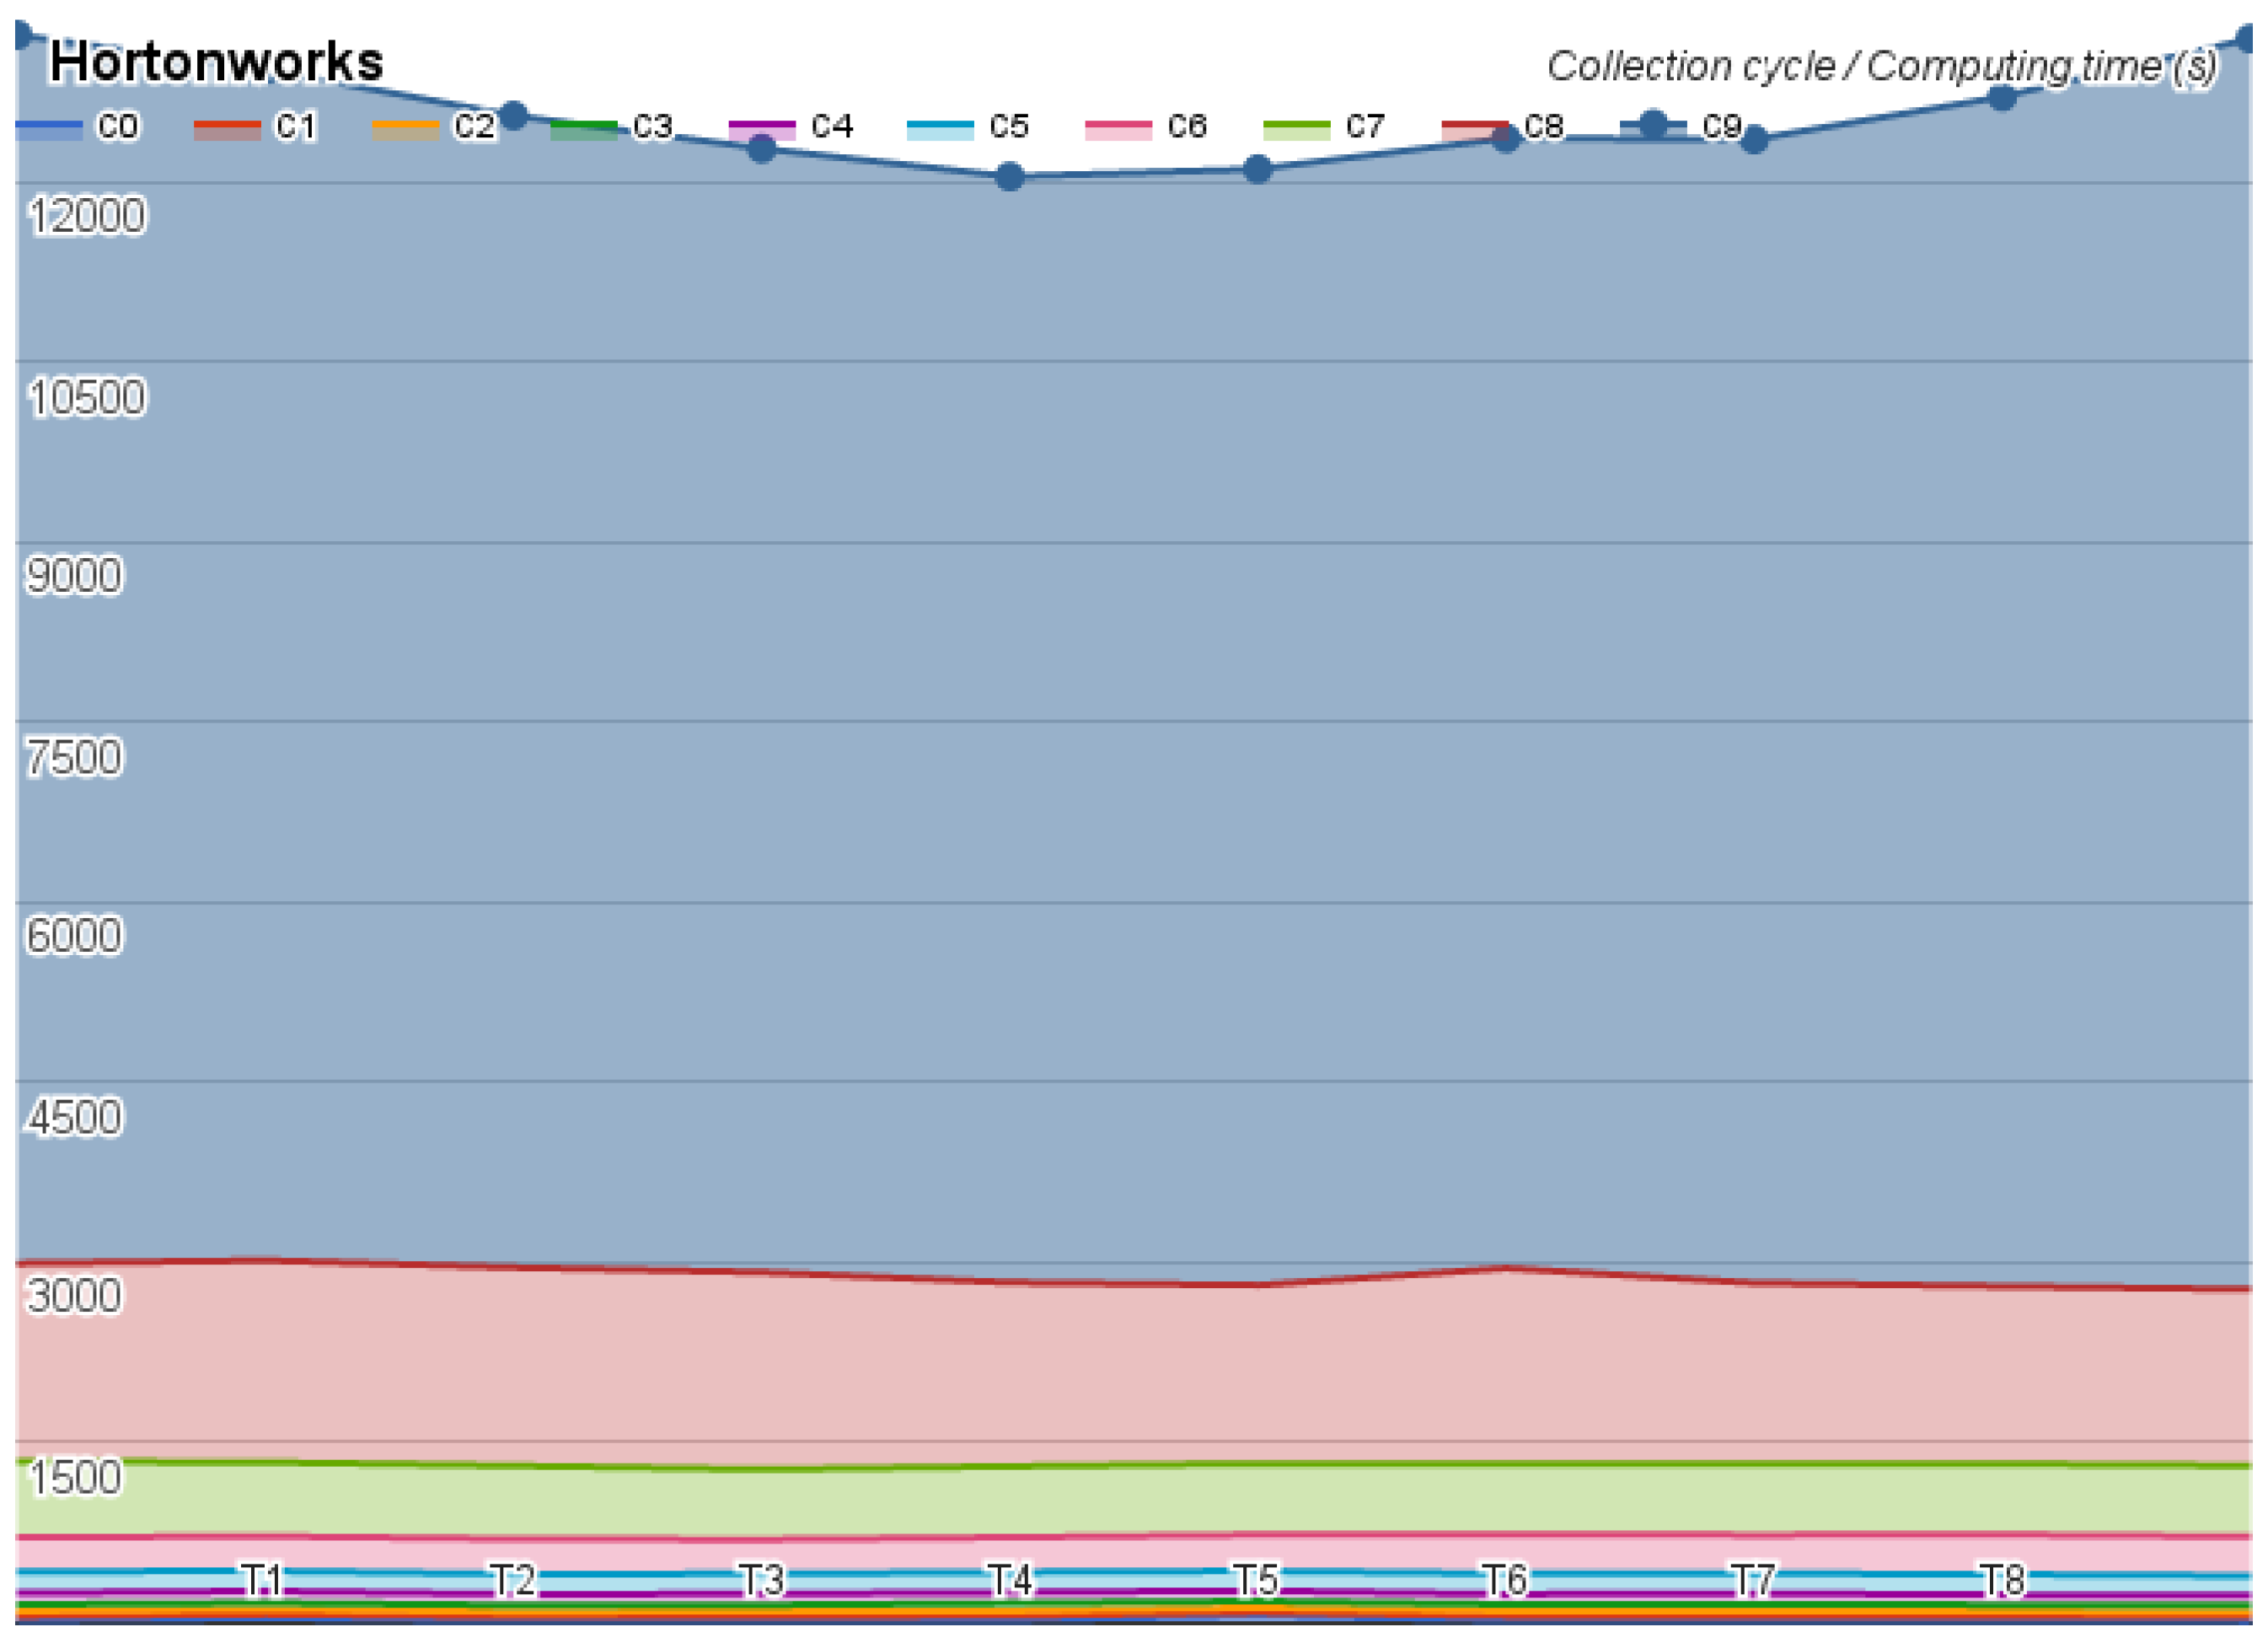
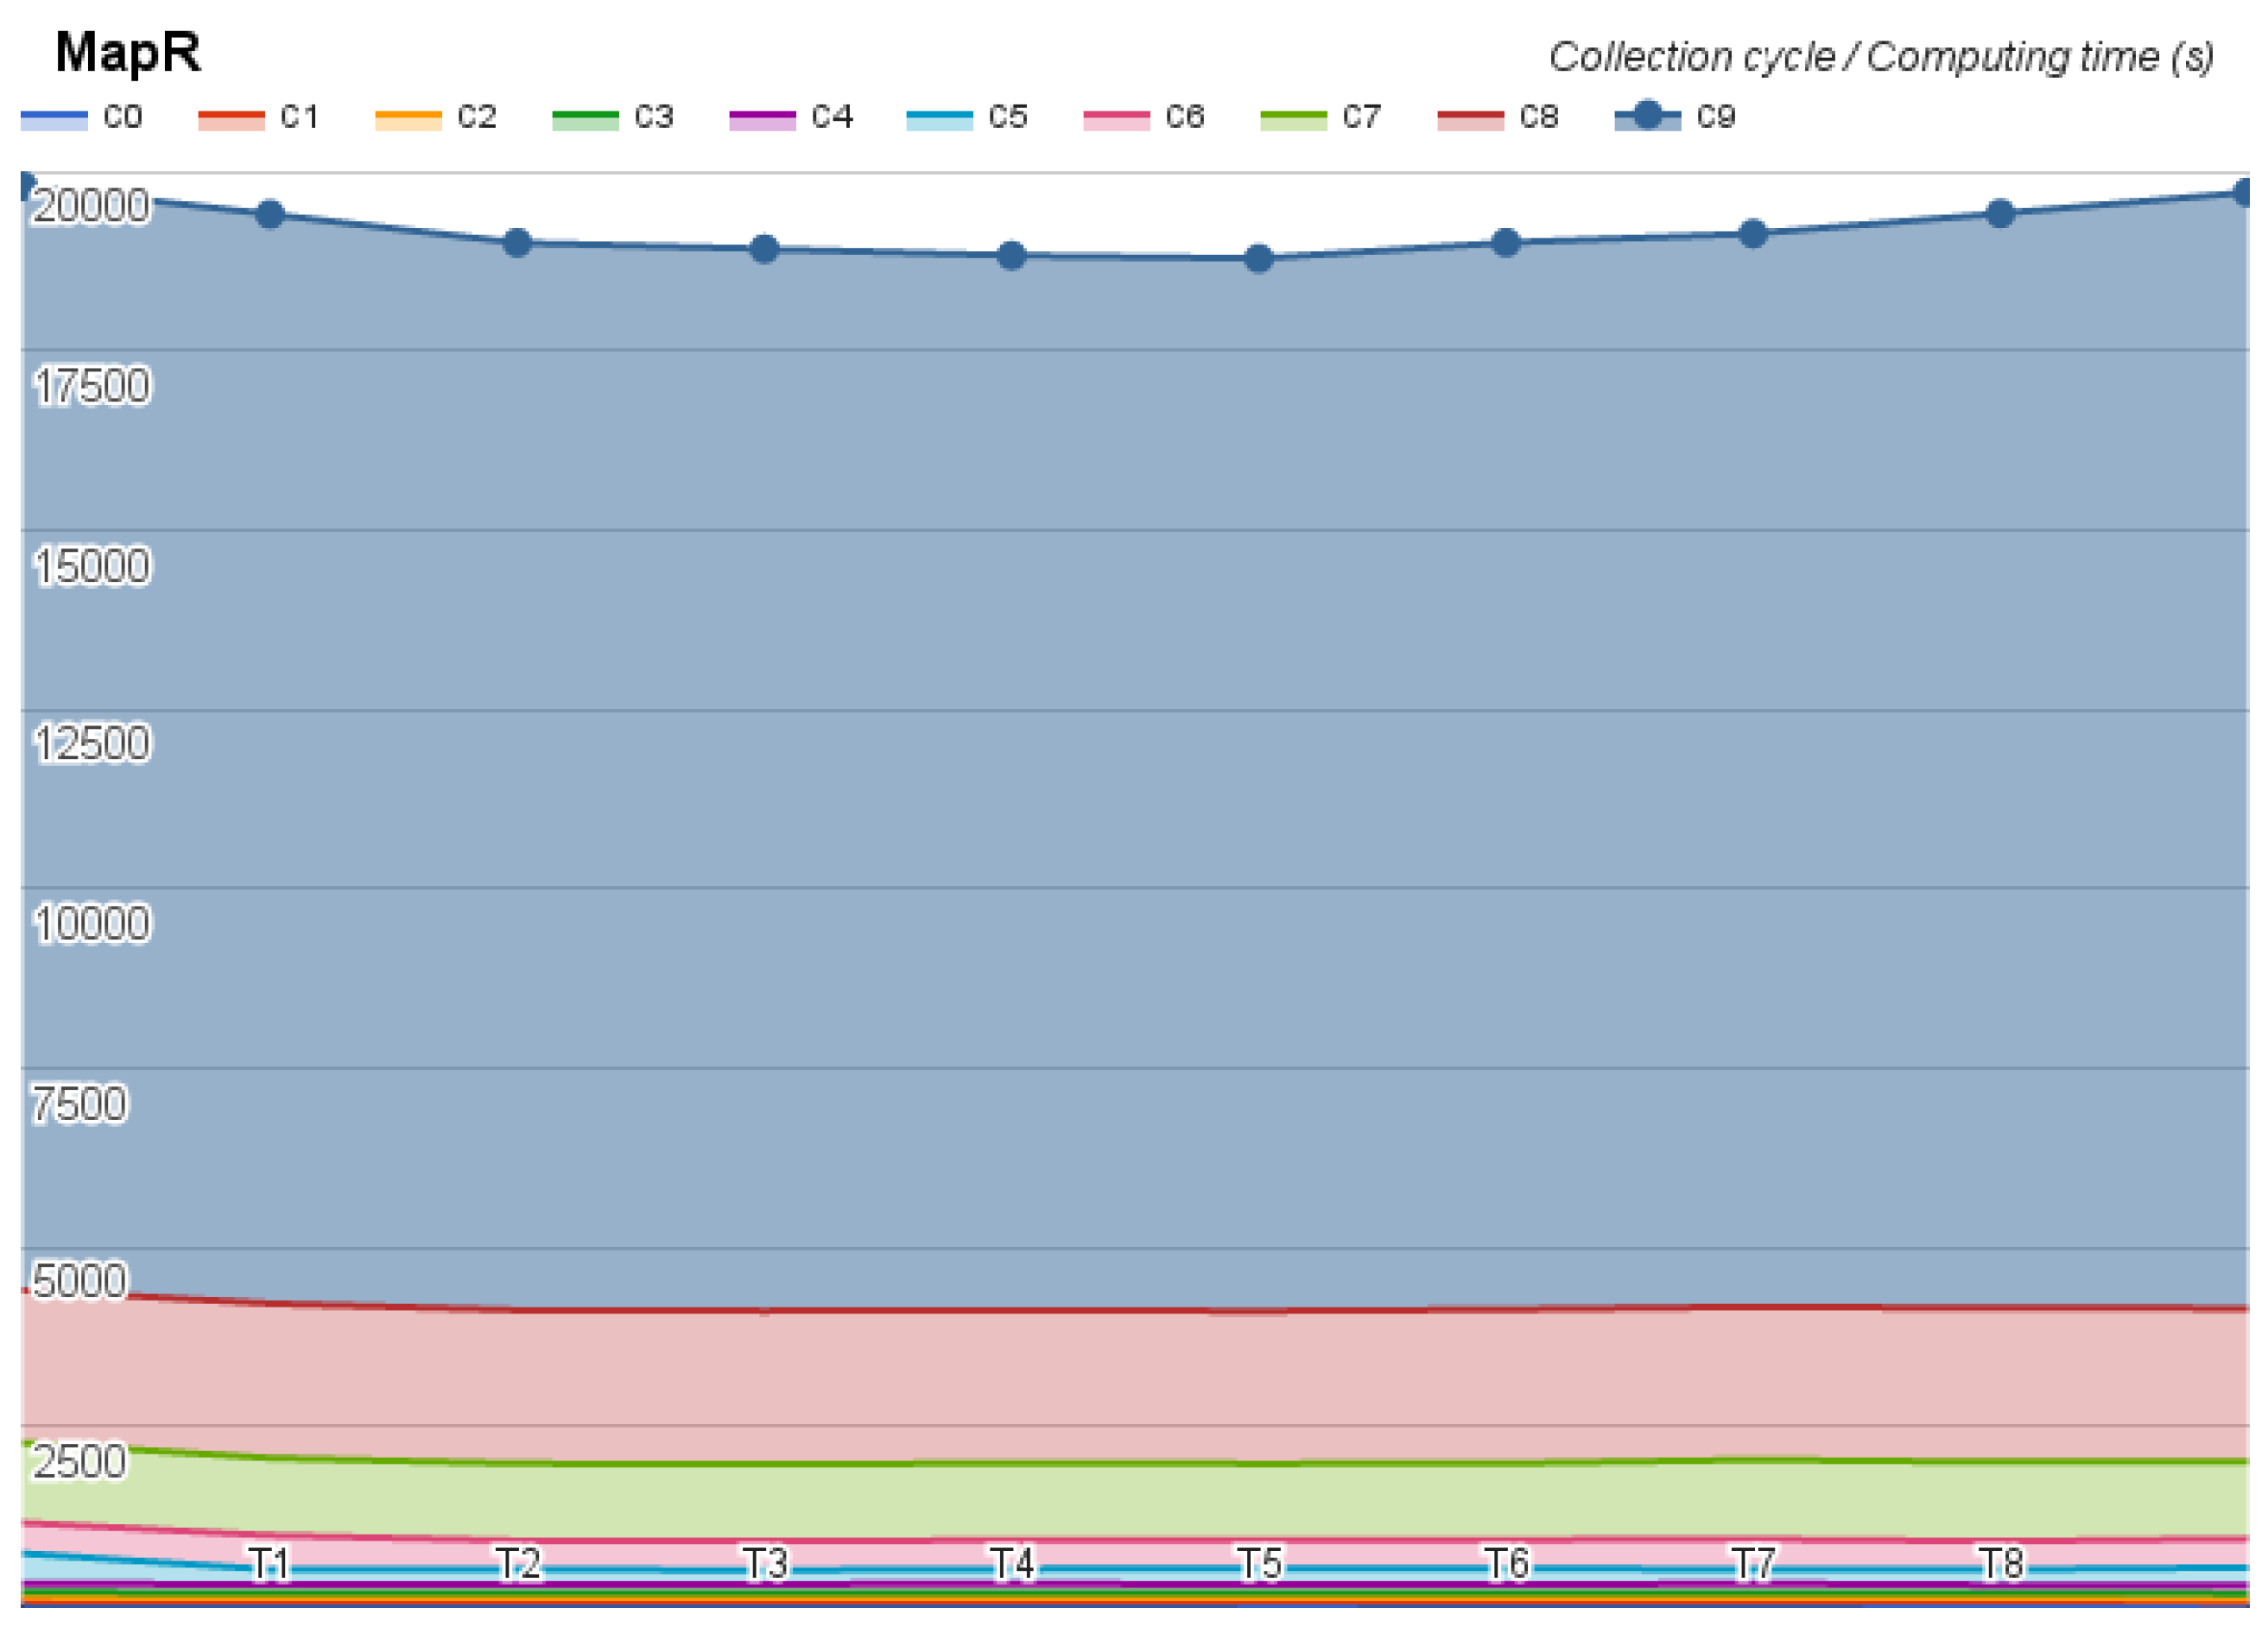
The first test was on the Hortonworks, which took 34 h and did not present any error. The second test was on the MapR, which took 53 h and returned one error message, omitted almost 24 results, kept on looping on two tests, and aborted the Pi estimator at the last step of the test. The last test was on Cloudera, whose test took 36 h and did not present any error, but revealed an interesting time oscillation. The benchmark results were divided by collection cycle and they are depicted in Figure 4, Figure 5 and Figure 6.
For a complete side-by-side analysis, we execute the same test in the Apache Hadoop, whose results are detailed in Table 2.
Analyzing the results, we conclude that among the different platforms of data management, the usage of Apache Hadoop is faster than others. Principally because it took less than 30 h to complete the tasks without a single error. In a superficial analysis, we can list some possibilities of why this happened: the network, tasks starvation and deadlock, the computing infrastructure, as well as the distribution and scalability of data. Considering the results, we decided to use it on our computers as the Apache Hadoop.
As previously explained, there is a limit for centralization. The closer this limit is, the higher is the financial cost. For our servers, the centralization limit was two real cores, eight gigs of ram and one terabyte of storage using RAID. To expand this model we used distribution, which requires high numbers of servers and these numbers and many other factors characterize performance gain, processing power, storage space and data availability. Consequently, the investment in local servers can be expensive and the financial cost is a common barrier to its usage. For instance, in our experiments, it was necessary to acclimatize our laboratory and invest in power supplies.
Cloud servers are an interesting alternative to perform acceptable results, in order to suit the need of Hadoop usage. To quantify the cloud server performance on benchmark tests, we deployed on a cloud server a few servers to test the centralization, the local and geographical distribution. It is important to know that most of cloud servers are centralized on blade servers on different data centers. In this case, it is clear that the centralization limit of a cloud server is much higher than what we have in our laboratory. Therefore, a single centralized server can have more processor cores, memory and storage in our cluster.
The first analysis on the cloud was on the distributed (scaled-out) server. On the master, we had two cores, two gigs of ram and SSD storage; on the six slaves, we had one core, one gig of ram and SSD storage. We deployed the Apache Hadoop on the cloud cluster and we executed the same benchmark test as before, the results are detailed in Table 3.
The second analysis on the cloud was on the centralized (scaled-up) server. At the master/slave server, we had eight cores, eight gigs of ram and SSD storage. We deployed the Apache Hadoop on a single node and we executed the benchmark test as shown in Table 4.
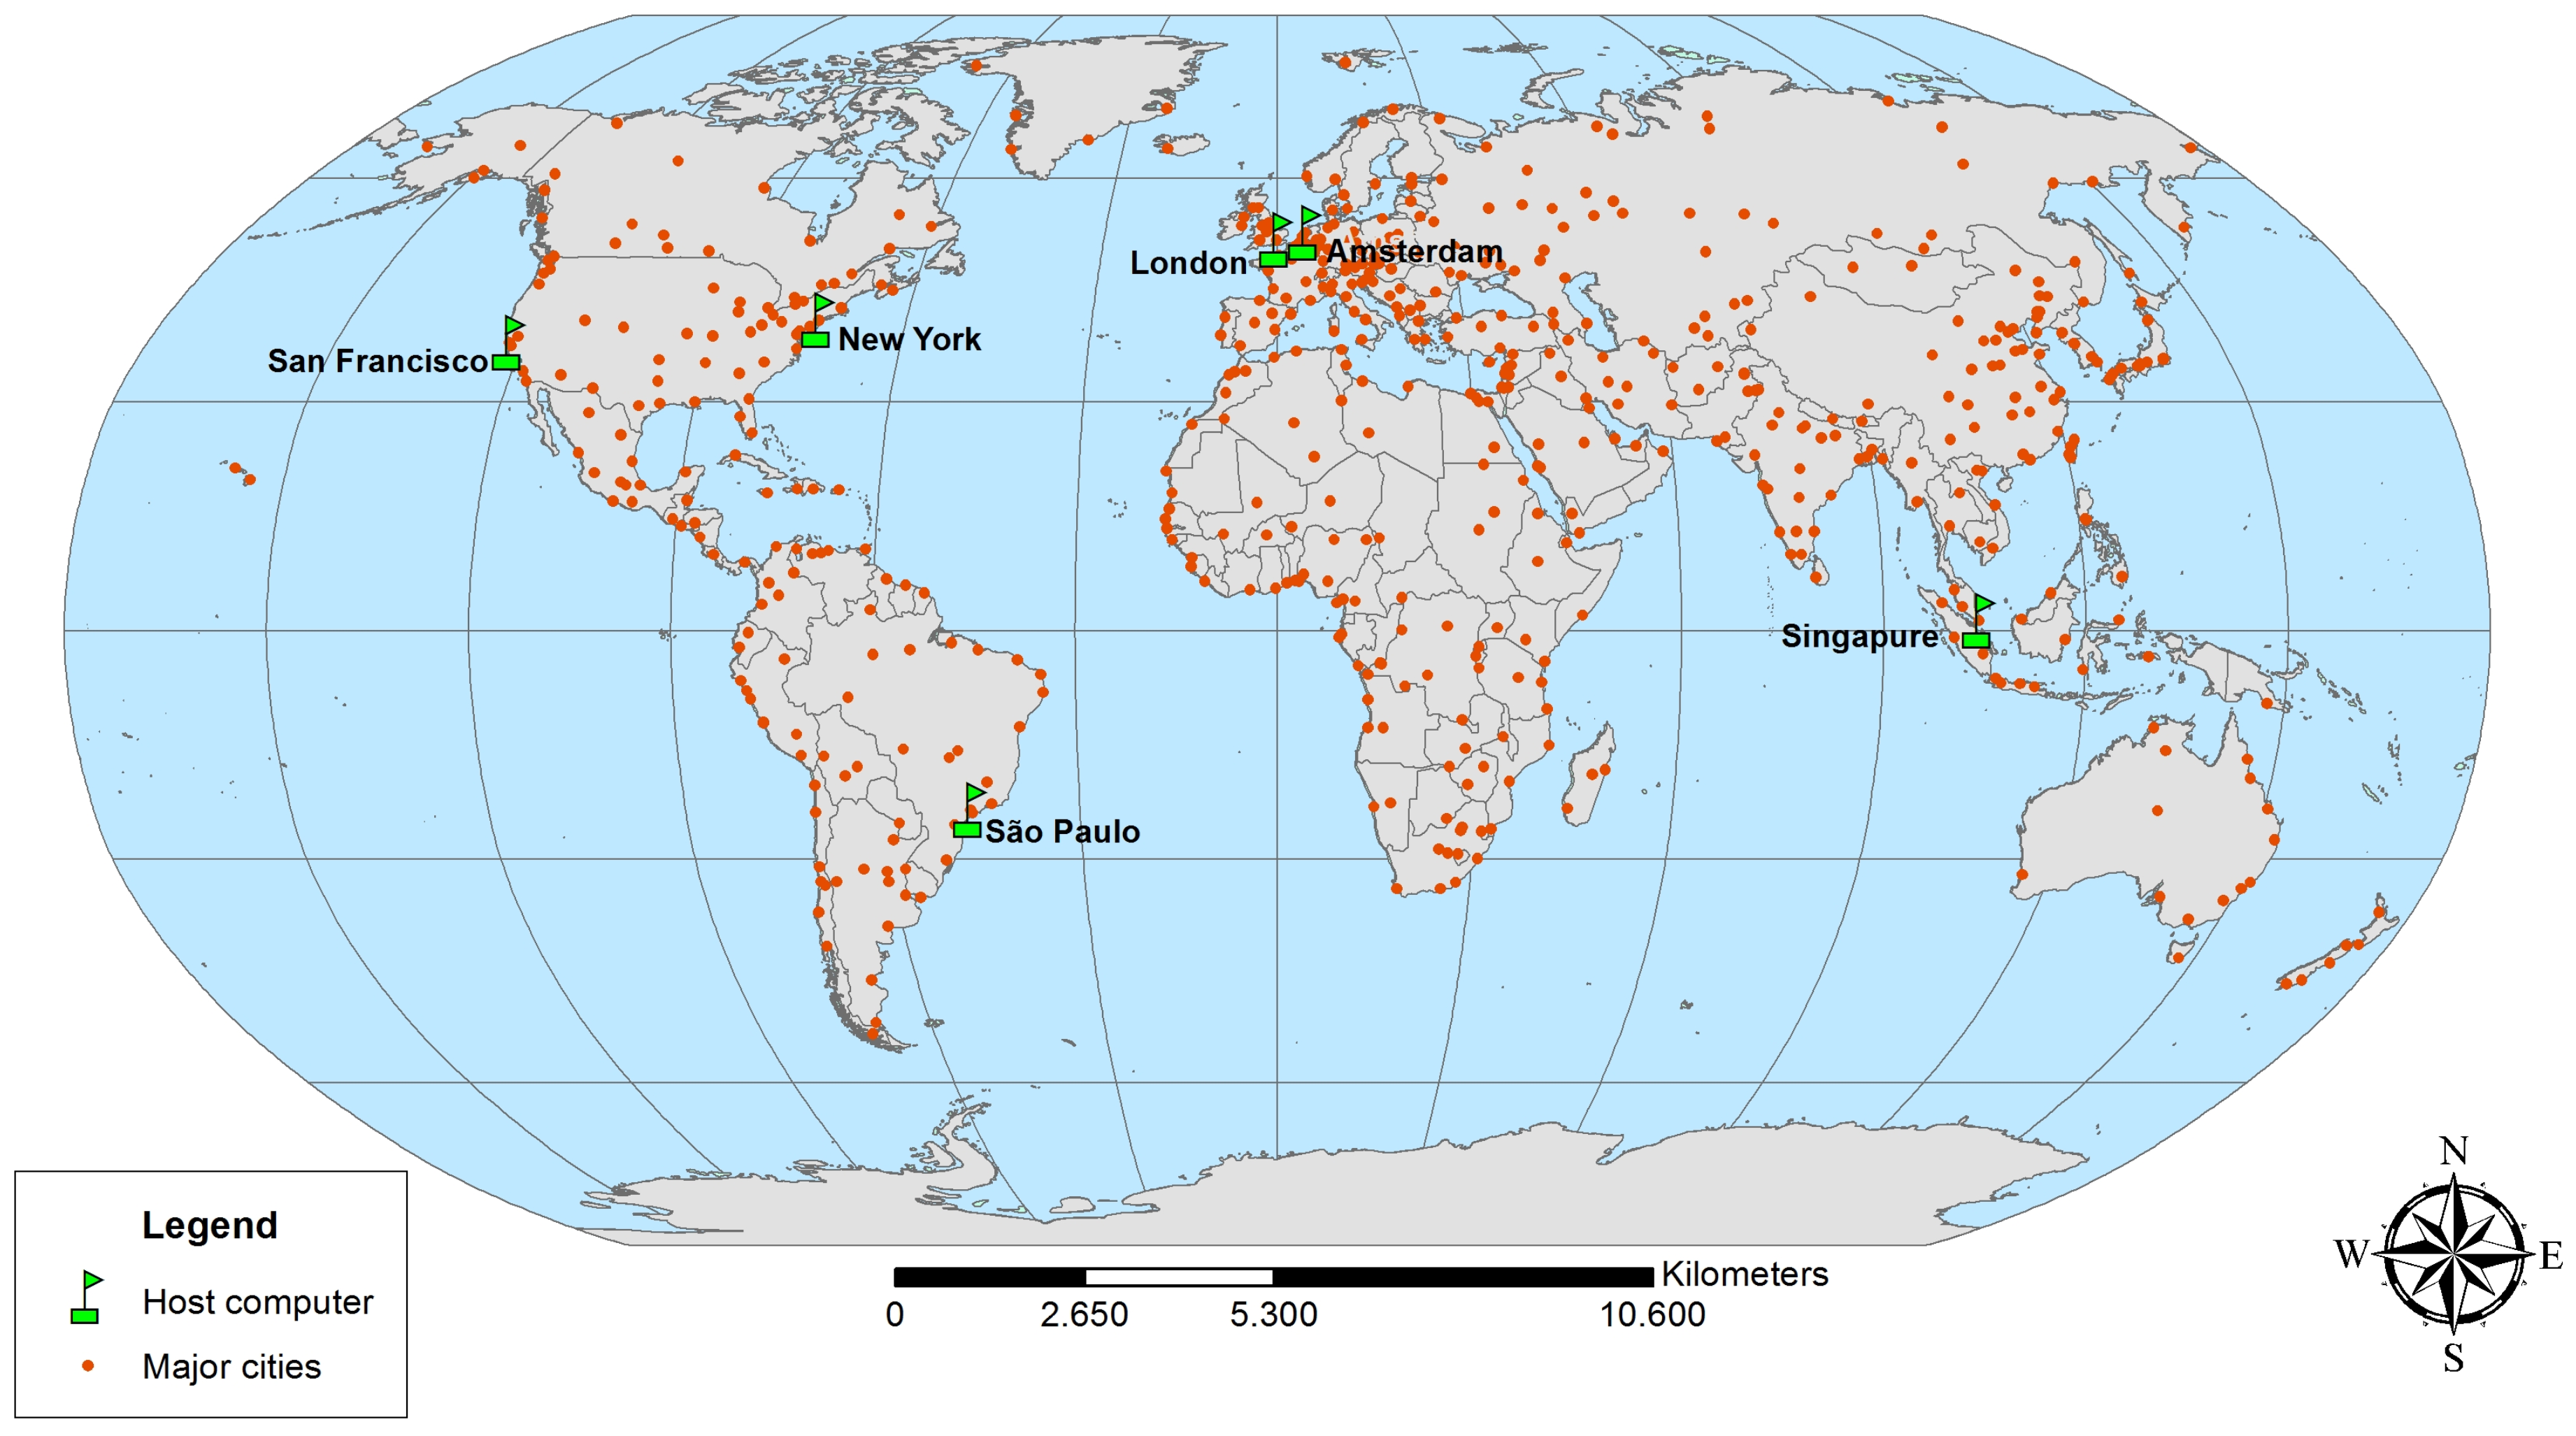
At last, we analyze the geographical distribution model to quantify the network interference on one data center to multiple data centers interacting over the internet. We use the same configuration as the distributed cloud server, but we share the servers in different data centers in the world. The server distribution can be seen in Figure 7 and the results of the test are detailed in the Table 5.
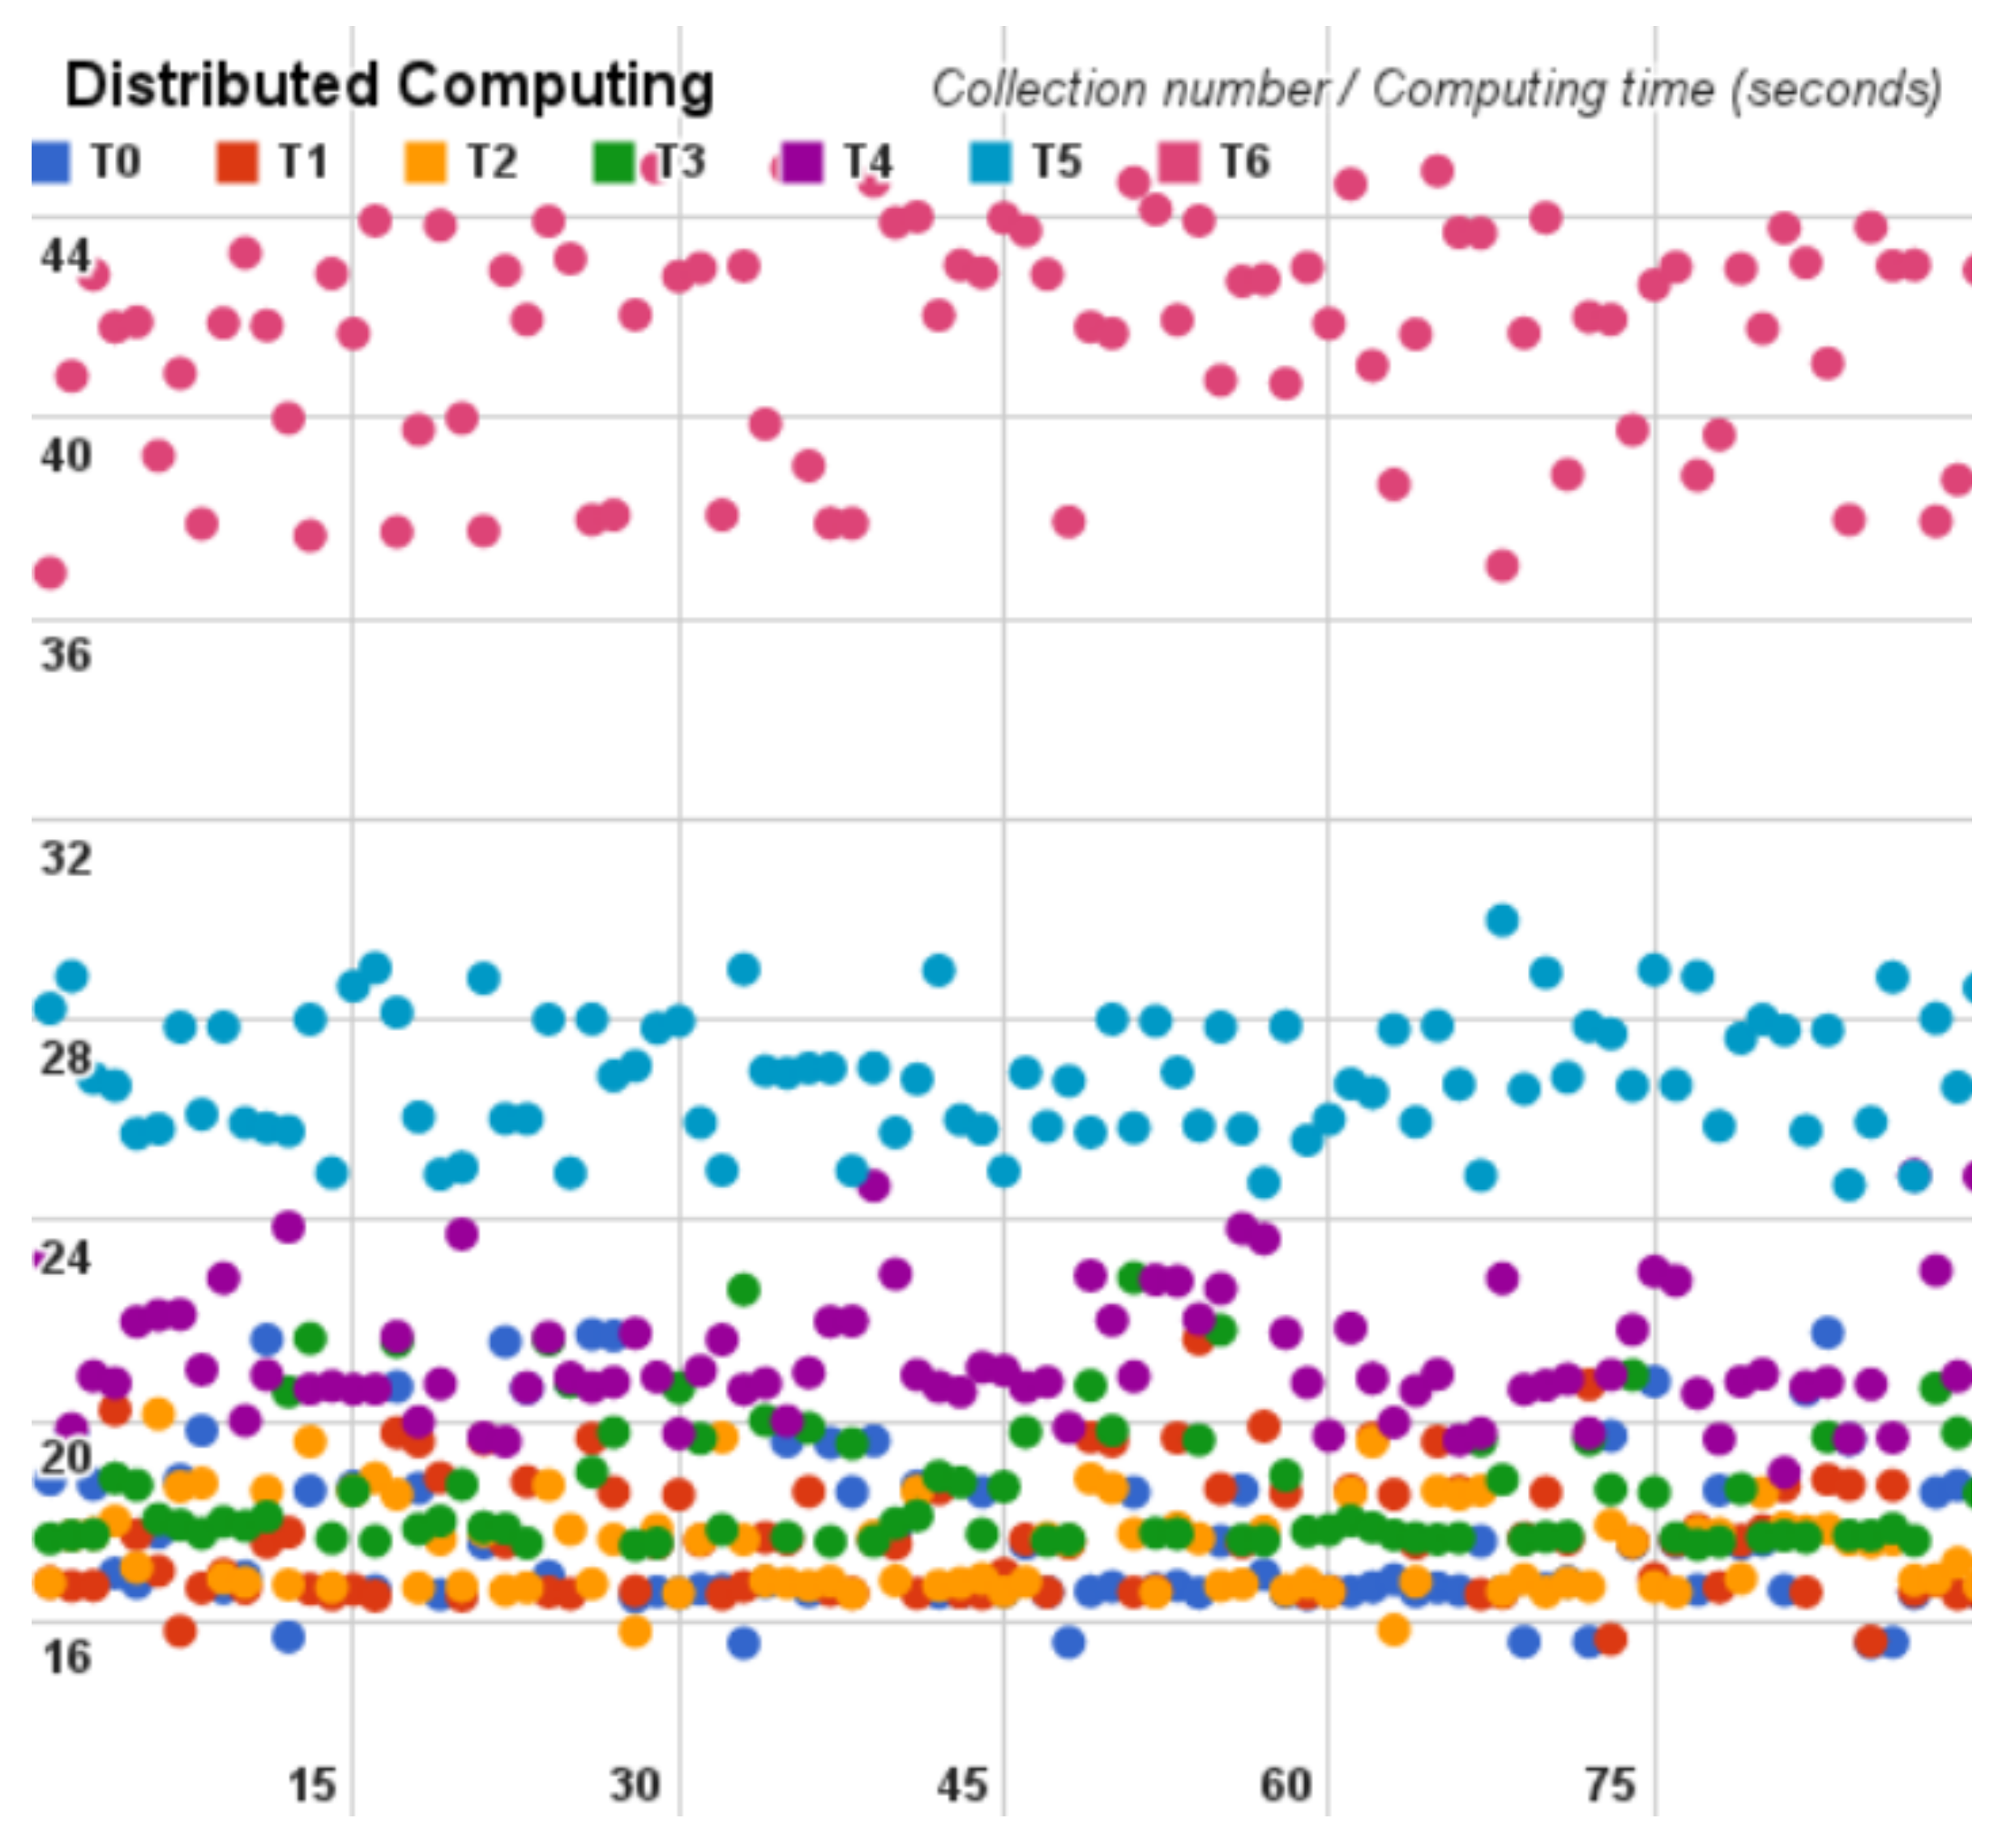
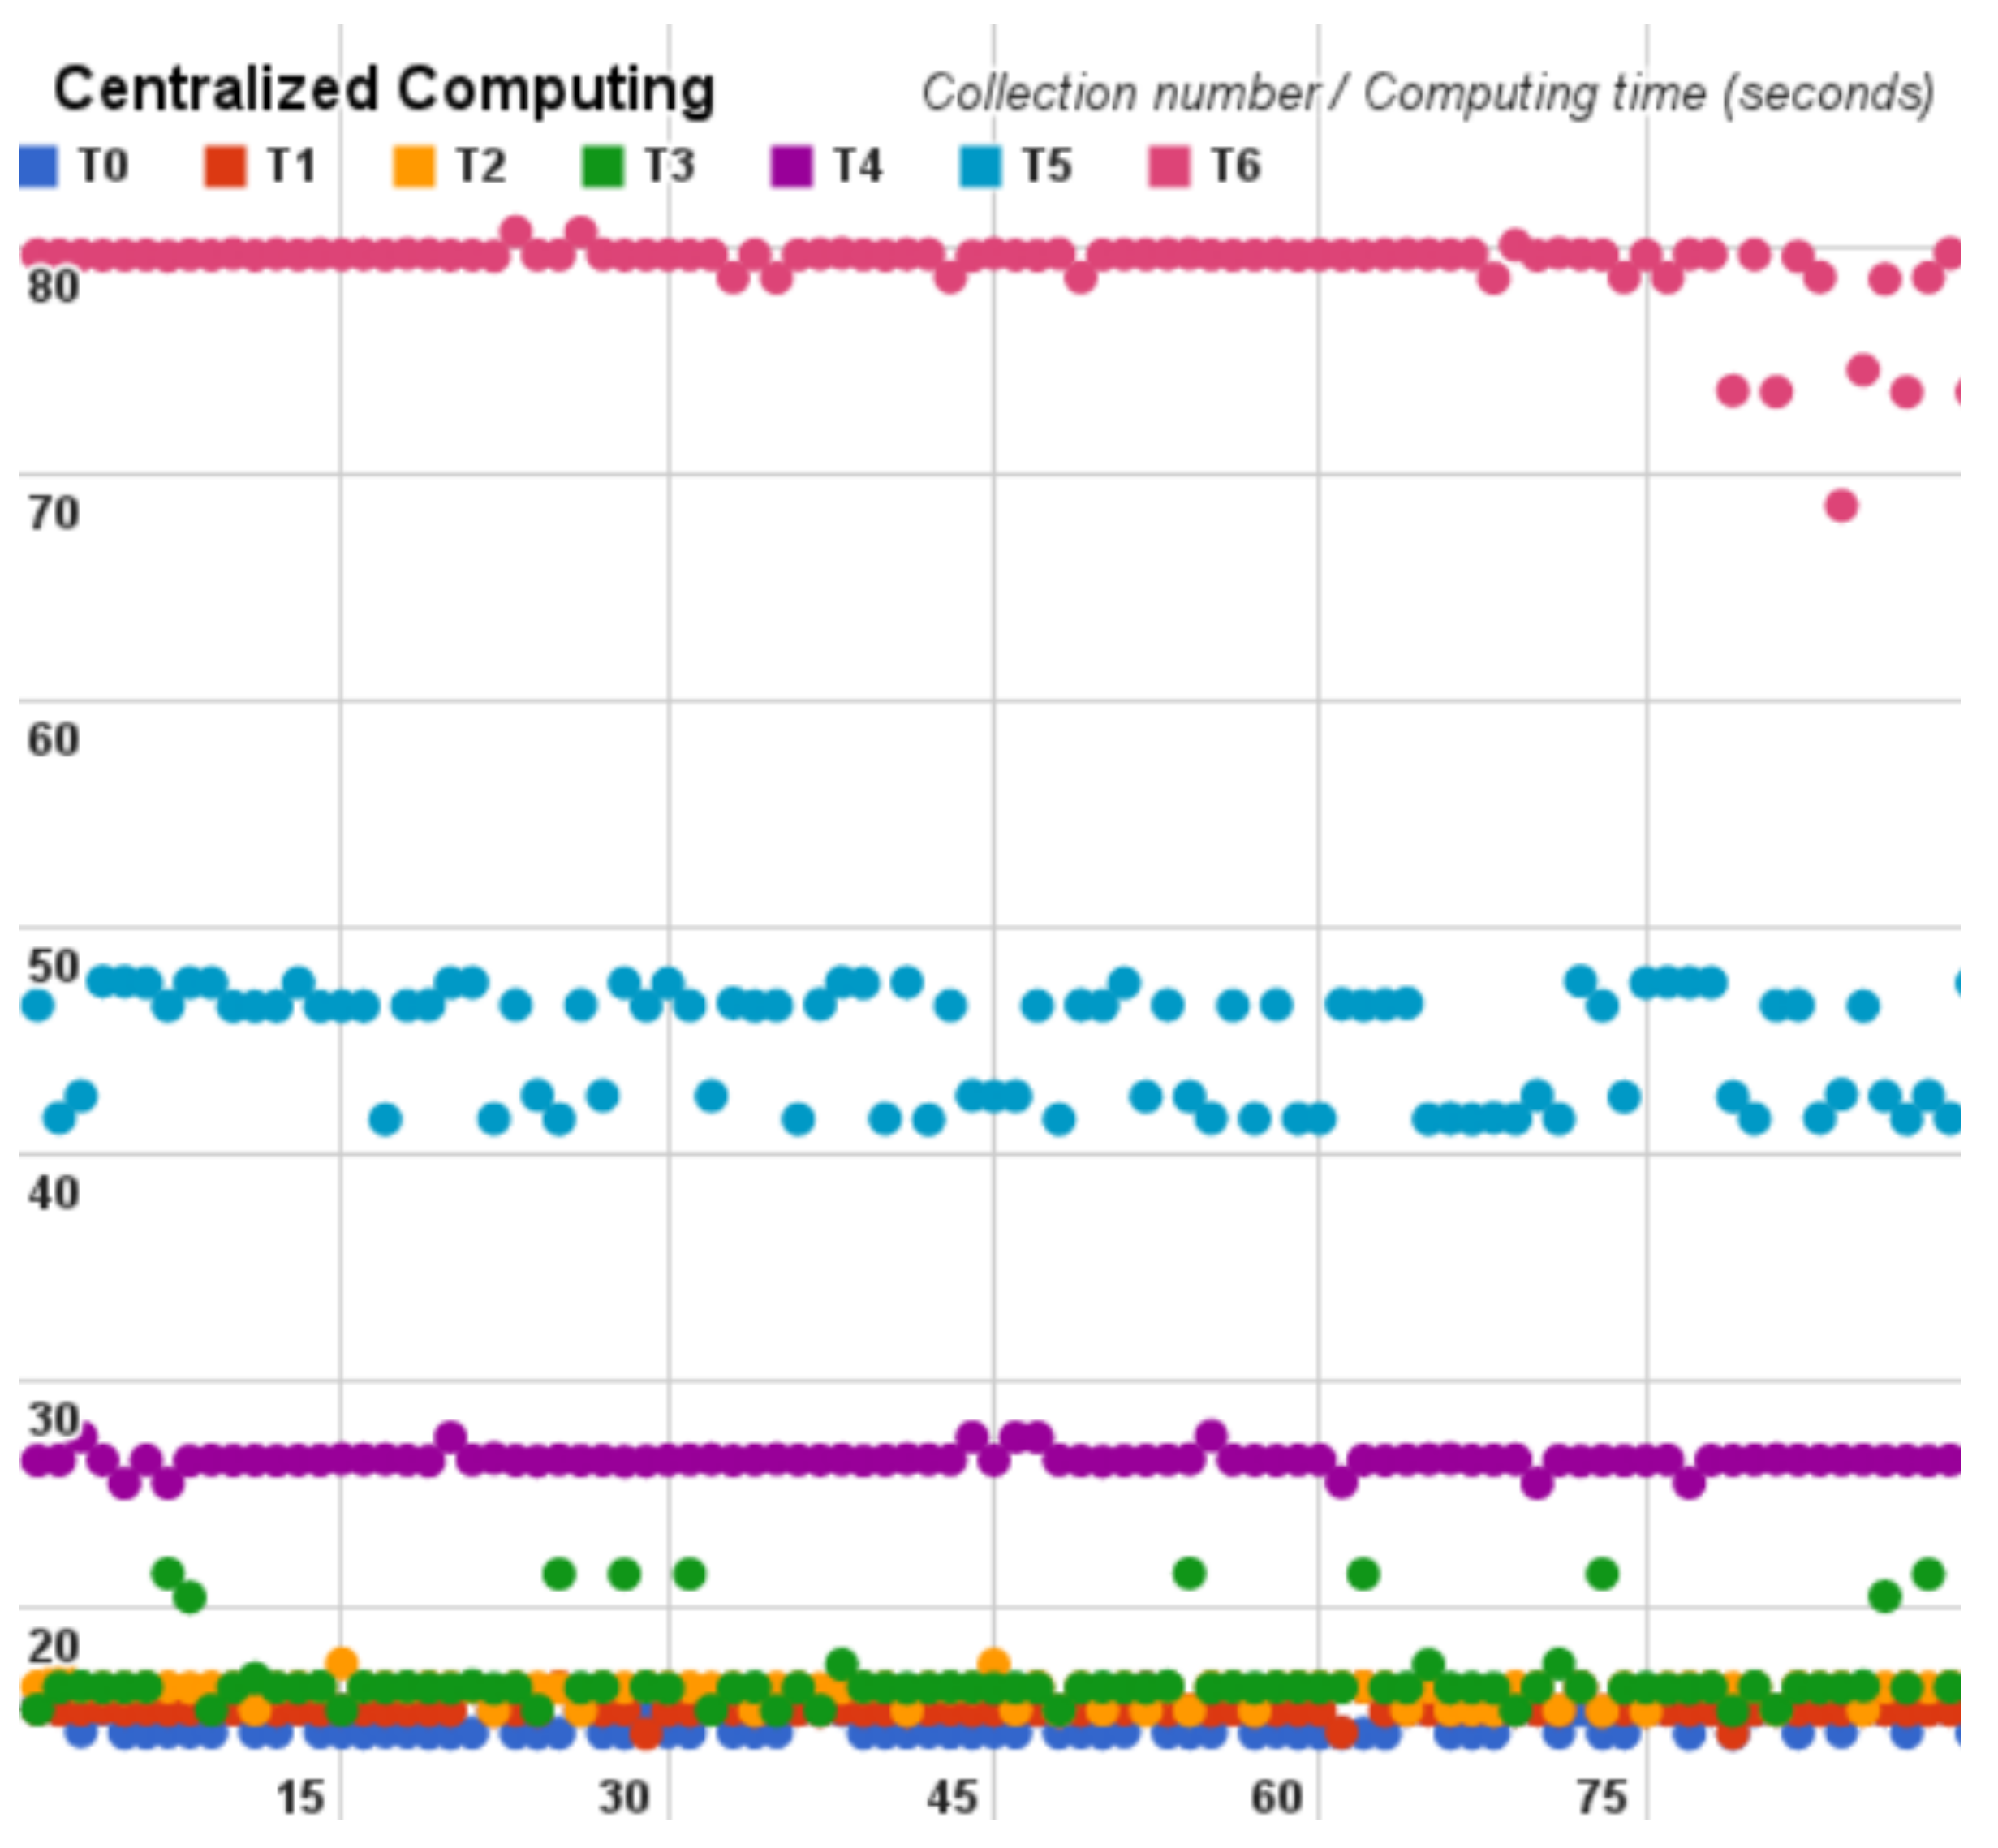
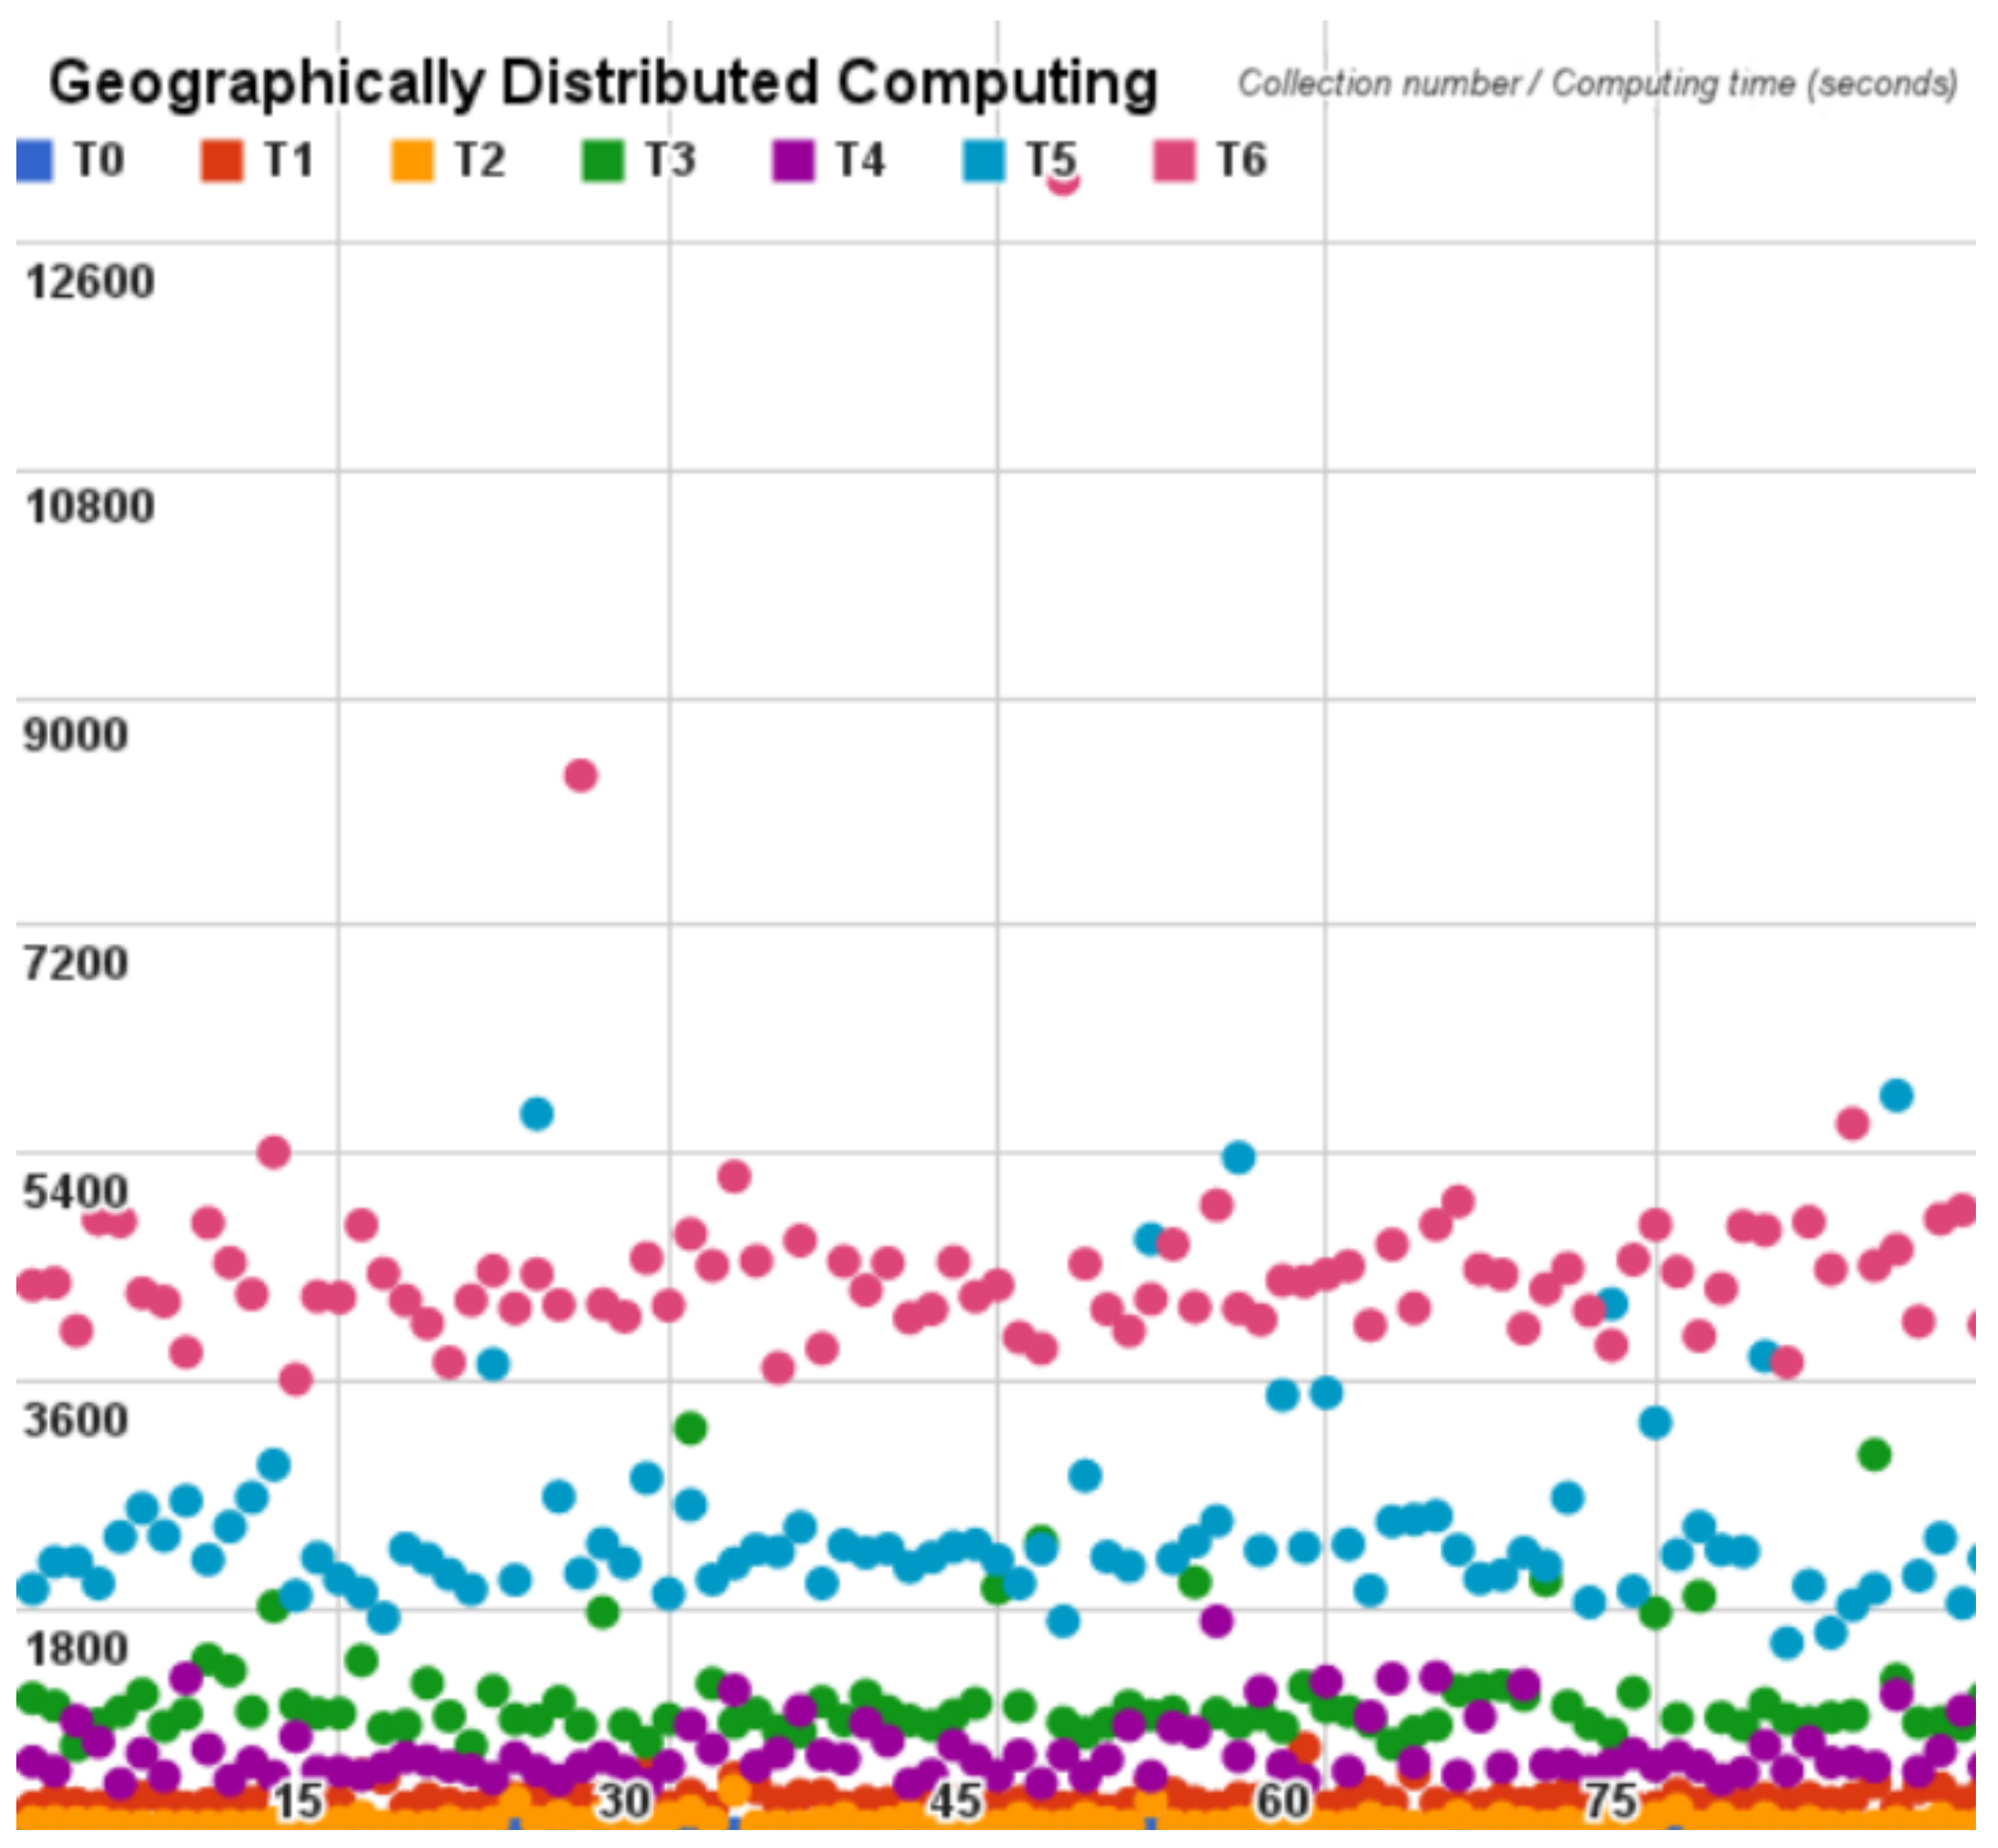
Following, for each cloud benchmark we plot the time spent on each Pi estimator cycle on dispersion graphs, that are depicted hereinafter in Figure 8, Figure 9 and Figure 10.
According to the cycles of each analysis, from Table 3, Table 4 and Table 5, we observed that the distributed model and the centralized model obtained similar values, alternating between which is faster. On the other hand, the geographically distributed model provided the worst times in all cycles.
It is possible to observe that the last cycle of each analysis had a much higher standard deviation and variance than the other cycles. This occurs because the number of samples increases in each cycle by the network interference.
Additionally, the centralized results show an almost continuous processing time in 80 seconds. Subsequently the distributed result shows us the timing difference in each cycle and considering the timing variation the highest processing time is almost half of the centralized model. Finally, the geographically distributed model shows us the network interference into the Hadoop; in this model we were only able to compute results until the cycle number six (T6). On the other cycles, the exit rate of the program was so high that it prevented execution of the test, presenting the internet as a harmful medium.
Considering our methodology, at the end of the tests we collected sufficient data to speculate about investment in local or cloud server. Not only to decide, but to create a dynamic comparison method for planning clusters in local or cloud servers, as we performed. Besides, the benchmark results can be used to support reliable comparison among different architectures. The main point of the methodology is the hardware gap; it must be as low as possible during the test to get better results.
Considering our initial cluster and the analyzed cloud server, in our case, the investment could be reverted to a highly scalable cloud server that could deploy more slaves as needed, not demanding investment in local infrastructure. On performance, the distribution is still the answer because the parallel processing, the distributed storage, as well as the higher processing time, is more efficient with scaled-out servers.
6. Conclusions
In this paper we present a methodology based on benchmark analysis to guide the Hadoop cluster planning, supporting commercial and academic usage on data analytics. We hypothesize that the process of choosing a computational model to implement Hadoop can be methodologically enacted. According to the proposed methodology, for each step of benchmark analysis, the user needs to define time metrics across a reliable test method, to collect data from each testing, and perform statistical analysis in all results to create a dynamic comparison group. The results are used to adjust the framework in order to obtain better Hadoop configuration models.
The main goal of this paper is not only to evaluate the system performance as a methodology, but also to perform analyses that will be used to deploy the most suitable server to supply the performance needed. However, when the methodology is applied, it is required to consider (apart from the methodology) the investment, human resources and the available infrastructure, because the result will be different for each scenario.
Besides the benchmark result, the user can interact directly with the system and the hardware, and this is always important to understand a real system and how it works. The method helps to connect the researcher with different distributions and architecture models of an application, directly contributing to decisions about local and cloud investment.
We developed our methodology while performing two similar studies in different applications, applying it in all research in development at “Laboratório de Computação Aplicada” (LaPesCA). Our evaluation consisted in confronting the results of each common application in different scaling methods at local and in the cloud. We decided to perform it as a methodology because it has a strong influence on completed research made by us and by others in our research laboratory.
Currently, we have research works in development, each one applying our proposed methodology to create dynamic results to a computational model using different datasets. For example, for computational models, we have conducted three studies: one based on a database system for Hadoop; another for a virtualized database system; and, the third, focusing on the availability of non-relational databases. In addition, using the chosen computational model, we handle datasets collected from Twitter and data related to Ebola. As future research, we reserve the possibility of presenting an analysis of Ebola information after the global disease is eradicated.
Author Contributions
G.S., P.H.D.A.G. and R.C.M.C. conceived the proposed methodology and designed the experiments; Gabriel Spadon performed the experiments and wrote the paper; D.M.E. and R.E.G. analyzed the results, revised the experiments, and wrote the paper; C.O.J. revised the experiments and the paper.
Acknowledgments
The authors thanks to the Department of Mathematics and Computer Science (DMC) at “Faculdade de Ciências e Tecnologia, UNESP—Universidade Estadual Paulista” by the resources granted to this research.
Conflicts of Interest
The founding sponsors had no role in the design of the study; in the collection, analyses, or interpretation of data; in the writing of the manuscript, and in the decision to publish the results.
References
- Sagiroglu, S.; Sinanc, D. Big data: A review. In Proceedings of the 2013 International Conference on Collaboration Technologies and Systems (CTS), San Diego, CA, USA, 20–24 May 2013; pp. 42–47. [Google Scholar]
- LaValle, S.; Lesser, E.; Shockley, R.; Hopkins, M.S.; Kruschwitz, N. Big data, analytics and the path from insights to value. MIT Sloan Manag. Rev. 2013, 52, 21. [Google Scholar]
- Daniel, B.K. Reimaging Research Methodology as Data Science. Big Data Cogn. Comput. 2018, 2, 4. [Google Scholar] [CrossRef]
- Müller, M.U.; Rosenbach, M.; Schulz, T. Living by the Numbers: Big Data Knows What Your Future Holds; Spiegel Online: Hamburg, Germany, 2013; p. 17. [Google Scholar]
- Katal, A.; Wazid, M.; Goudar, R. Big data: Issues, challenges, tools and Good practices. In Proceedings of the 2013 Sixth International Conference on Contemporary Computing (IC3), Noida, India, 8–10 August 2013; pp. 404–409. [Google Scholar]
- Shvachko, K.; Kuang, H.; Radia, S.; Chansler, R. The Hadoop Distributed File System. In Proceedings of the 2010 IEEE 26th Symposium on Mass Storage Systems and Technologies (MSST), Incline Village, NV, USA, 3–7 May 2010; pp. 1–10. [Google Scholar]
- Appuswamy, R.; Gkantsidis, C.; Narayanan, D.; Hodson, O.; Rowstron, A. Scale-up vs. Scale-out for Hadoop: Time to rethink? In Proceedings of the 4th Annual Symposium on Cloud Computing, Santa Clara, CA, USA, 1–3 October 2013; p. 20. [Google Scholar]
- Souza, G.S.; Correia, R.C.M.; Garcia, R.E.; Olivete, C. Simulation and analysis applied on virtualization to build Hadoop clusters. In Proceedings of the 2015 10th Iberian Conference on Information Systems and Technologies (CISTI), Aveiro, Portugal, 17–20 June 2015. [Google Scholar]
- Gattiker, A.; Gebara, F.H.; Hofstee, H.P.; Hayes, J.; Hylick, A. Big Data text-oriented benchmark creation for Hadoop. IBM J. Res. Dev. 2013, 57, 10–11. [Google Scholar] [CrossRef]
- Saletore, V.A.; Krishnan, K.; Viswanathan, V.; Tolentino, M.E. HcBench: Methodology, development, and characterization of a customer usage representative big data/Hadoop benchmark. In Proceedings of the 2013 IEEE International Symposium on Workload Characterization (IISWC), Portland, OR, USA, 22–24 September 2013; pp. 77–86. [Google Scholar]
- Huang, S.; Huang, J.; Dai, J.; Xie, T.; Huang, B. The HiBench benchmark suite: Characterization of the MapReduce-based data analysis. In New Frontiers in Information and Software as Services; Springer: Berlin, Germany, 2011; pp. 209–228. [Google Scholar]
- Huang, S.; Huang, J.; Liu, Y.; Yi, L.; Dai, J. Hibench: A representative and comprehensive hadoop benchmark suite. In Proceedings of the ICDE Workshops, Long Beach, CA, USA, 5 March 2010. [Google Scholar]
- Correia, R.C.M.; Souza, G.S.; Eler, D.M.; Olivete, C.; Garcia, R.E. Teaching Distributed Systems Using Hadoop. In Proceedings of the 15th International Conference on Information Technology—New Generations, Las Vegas, NV, USA, 16–18 April 2018; pp. 355–362. [Google Scholar]
- Henrique, G.J.; Kaster, D.D.S. Consultas por Similaridade em Big Data: Alternativas e Soluções; Technical Report; Faculdade Estadual de Londrina: Londrina, Brazil, 2013. [Google Scholar]
- Rocha, F.D.G.; Senger, H.S. Análise de Escalabilidade de Aplicações Hadoop/MapReduce por meio de Simulação. Master’s Thesis, Universidade Federal de São Carlos, São Carlos, Brazil, 2013. [Google Scholar]
- Khalid, A.; Afzal, H.; Aftab, S. Balancing scalability, performance and fault tolerance for structured data (BSPF). In Proceedings of the 16th International Conference on Advanced Communication Technology, Pyeongchang, Korea, 16–19 February 2014; pp. 725–732. [Google Scholar]
- Coulouris, G.F.; Dollimore, J.; Kindberg, T. Distributed Systems: Concepts and Design; Pearson Education: New York, NY, USA, 2005. [Google Scholar]
- Fox, A.; Brewer, E. Harvest, yield, and scalable tolerant systems. In Proceedings of the Seventh Workshop on Hot Topics in Operating Systems, Rio Rico, AZ, USA, 30 March 1999; pp. 174–178. [Google Scholar]
- Brewer, E.A. Towards robust distributed systems. In Proceedings of the ACM Symposium on Principles of Distributed Computing, Portland, OR, USA, 16–19 July 2000; Volume 7. [Google Scholar]
- Pritchett, D. Base: An acid alternative. Queue 2008, 6, 48–55. [Google Scholar] [CrossRef]
- Brewer, E. CAP twelve years later: How the “rules” have changed. Computer 2012, 45, 23–29. [Google Scholar] [CrossRef]
- Hadoop, A. Apache Hadoop. Available online: http://hadoop.apache.org (accessed on 7 March 2018).
- Goldman, A.; Kon, F.; Junior, F.P.; Polato, I.; de Fátima Pereira, R. Apache Hadoop: Conceitos teóricos e práticos, evoluçao e novas possibilidades. In Proceedings of the XXXI Jornadas de Atualizaçoes em Informatica, Curitiba, Brazil, 16–19 July 2012; pp. 88–136. [Google Scholar]
- Quick, L.; Wilkinson, P.; Hardcastle, D. Using Pregel-like Large Scale Graph Processing Frameworks for Social Network Analysis. In Proceedings of the 2012 IEEE/ACM International Conference on Advances in Social Networks Analysis and Mining, Istanbul, Turkey, 26–29 August 2012; pp. 457–463. [Google Scholar]
- Borthakur, D. The hadoop distributed file system: Architecture and design. Hadoop Proj. Webs. 2007, 11, 21. [Google Scholar]
Figure 1.
Brewer’s Theorem—Based on [21].
Figure 1.
Brewer’s Theorem—Based on [21].

Figure 2.
Hadoop Server Roles (HSR).

Figure 3.
Methodology as a flowchart.

Figure 4.
Cloudera benchmark time (seconds) distribution.

Figure 5.
Hortonworks benchmark time (seconds) distribution.

Figure 6.
MapR benchmark time (seconds) distribution.

Figure 7.
Hosts distribution—extracted from [8].
Figure 7.
Hosts distribution—extracted from [8].

Figure 8.
Distributed architecture as a dispersion variance.

Figure 9.
Centralized architecture as a dispersion variance.

Figure 10.
Geographic architecture as a dispersion variance.


Table 1.
Variables growth. The break in the table indicates the linear growth of the exponent.
| Cycle | T0 | T1 | T2 | T3 | T4 | … | T8 | T9 |
| Maps | … | |||||||
| Samples | … |
Table 2.
Apache Hadoop benchmark results (seconds).
| Cycle | Mean (μ) | Standard Deviation | Variance () |
|---|---|---|---|
| T0 | 51.60 | 1.60 | 1.70 |
| T1 | 51.70 | 1.20 | 0.90 |
| T2 | 49.60 | 0.90 | 0.80 |
| T3 | 48.60 | 1.30 | 0.30 |
| T4 | 50.40 | 1.20 | 0.00 |
| T5 | 56.50 | 1.20 | 0.00 |
| T6 | 73.20 | 2.20 | 0.60 |
| T7 | 85.40 | 0.50 | 0.20 |
| T8 | 110.30 | 2.10 | 0.08 |
| T9 | 1098.70 | 6.30 | 0.70 |
Table 3.
Distributed cloud server results (seconds).
| Cycle | Mean (μ) | Standard Deviation (σ) | Variance () |
|---|---|---|---|
| T0 | 16.86 | 1.64 | 2.71 |
| T1 | 17.57 | 1.24 | 1.55 |
| T2 | 17.58 | 0.90 | 0.81 |
| T3 | 17.94 | 1.31 | 1.72 |
| T4 | 20.88 | 1.29 | 1.67 |
| T5 | 26.82 | 1.27 | 1.63 |
| T6 | 41.97 | 2.24 | 5.05 |
| T7 | 293.73 | 5.48 | 30.00 |
| T8 | 568.81 | 9.91 | 98.28 |
| T9 | 6316.61 | 97.29 | 9465.80 |
Table 4.
Centralized cloud server results (seconds).
| Cycle | Mean (μ) | Standard Deviation (σ) | Variance () |
|---|---|---|---|
| T0 | 14.49 | 0.47 | 0.22 |
| T1 | 15.46 | 0.30 | 0.09 |
| T2 | 16.46 | 0.48 | 0.23 |
| T3 | 16.47 | 1.60 | 2.57 |
| T4 | 26.50 | 0.35 | 0.12 |
| T5 | 46.54 | 2.51 | 6.30 |
| T6 | 79.68 | 1.77 | 3.15 |
| T7 | 109.20 | 2.74 | 7.49 |
| T8 | 203.97 | 3.10 | 9.58 |
| T9 | 1766.34 | 16.59 | 275.25 |
Table 5.
Geographically distributed cloud server results (seconds).
| Cycle | Mean (μ) | Standard Deviation (σ) | Variance () |
|---|---|---|---|
| T0 | 39.23 | 4.93 | 24.32 |
| T1 | 291.50 | 78.44 | 6152.84 |
| T2 | 125.43 | 47.62 | 2267.97 |
| T3 | 986.29 | 434.80 | 189,055.37 |
| T4 | 601.16 | 243.69 | 59,389.66 |
| T5 | 2260.01 | 790.81 | 625,395.16 |
| T6 | 4390.56 | 1070.37 | 1,145,706.50 |
© 2018 by the authors. Licensee MDPI, Basel, Switzerland. This article is an open access article distributed under the terms and conditions of the Creative Commons Attribution (CC BY) license (http://creativecommons.org/licenses/by/4.0/).
Share and Cite
MDPI and ACS Style
Correia, R.C.M.; Spadon, G.; De Andrade Gomes, P.H.; Eler, D.M.; Garcia, R.E.; Olivete Junior, C. Hadoop Cluster Deployment: A Methodological Approach. Information 2018, 9, 131. https://doi.org/10.3390/info9060131
AMA Style
Correia RCM, Spadon G, De Andrade Gomes PH, Eler DM, Garcia RE, Olivete Junior C. Hadoop Cluster Deployment: A Methodological Approach. Information. 2018; 9(6):131. https://doi.org/10.3390/info9060131
Chicago/Turabian StyleCorreia, Ronaldo Celso Messias, Gabriel Spadon, Pedro Henrique De Andrade Gomes, Danilo Medeiros Eler, Rogério Eduardo Garcia, and Celso Olivete Junior. 2018. "Hadoop Cluster Deployment: A Methodological Approach" Information 9, no. 6: 131. https://doi.org/10.3390/info9060131
Note that from the first issue of 2016, this journal uses article numbers instead of page numbers. See further details here.