A Deploying Method for Predicting the Size and Optimizing the Location of an Electric Vehicle Charging Stations


1
School of Civil Engineering, Suzhou University of Science and Technology, 1701 Binhe Road, New District, Suzhou 215011, China
2
Civil and Environmental Engineering, University of Wisconsin, Madison, WI 53706, USA
*
Author to whom correspondence should be addressed.
Information 2018, 9(7), 170; https://doi.org/10.3390/info9070170
Submission received: 10 June 2018
/
Revised: 11 July 2018
/
Accepted: 11 July 2018
/
Published: 13 July 2018
(This article belongs to the Section Information Applications)
Abstract
:With the depletion of oil resources and the aggravation of environmental pollution, electric vehicles have a growing future and will be more popular as the main force of new energy consumption. They have attracted greater attention from various countries. The sizing and location problem for charging stations has been a hot point of global research, and these issues are important for government planning for electric vehicles. In this paper, we first built a BASS model to predict the total number of electric vehicles and calculate the size of charging stations in the coming years. Moreover, we also developed a queuing model to optimize the location of charging stations and solved this issue by using the exhaustion method, which regards minimum cost as the objective function. After that, the model was tested using data from a city in China. The results show that the model in this paper is good at predicting the number of electric vehicles in the coming years and calculating the size of charging stations. At the same time, it can also optimize the distribution of charging stations and make them more balanceable. Thus, this model is beneficial for the government in planning the development of electric vehicles in the future.
1. Introduction
With the depletion of oil resources and the aggravation of environmental pollution, electric vehicles as the main force of the new energy consumption revolution has attracted greater attention from various countries [1]. Vigorously developing electric vehicles can speed up the replacement of fuel and reduce vehicle exhaust emissions. Improving the charging infrastructure system is essential for the mass implementation of electric vehicles [2,3]. Distributed charging stations are an important way to supplement the energy of electric vehicles, which can affect the daily life of electric vehicle drivers. Their sizes and locations would also have an important influence on the application of electric vehicles. Therefore, in a section of traffic, detailed requirements and conditions need to be considered for developing the programming of a charging station, for example, the traffic convenience, service radius, requirements of safety, price of land, and municipal planning. In the section of the power system, some conditions also need to be considered, like the allowed capacity of the distribution network, and line running demand, etc.
The introduction of electric vehicles, as a public transport tool in the future, would influence human travel behaviors and patterns. Although many people could choose to charge electric vehicles in their home, there are still a great deal of public charging stations in certain regions. Thus, electric vehicles could also bring new challenges, such as vehicle recharging and management. It is already understood that there must be sufficient charging stations before introducing a certain number of electric vehicles. In China, the government has invested a large amount of money in building the infrastructures for charging stations [4]. Many planning models have been developed in papers that aims to make the layout of electric charging stations better [5]. Therefore, contemporary charging stations are paramount for the imminent organization of large-scale electric vehicles systems.
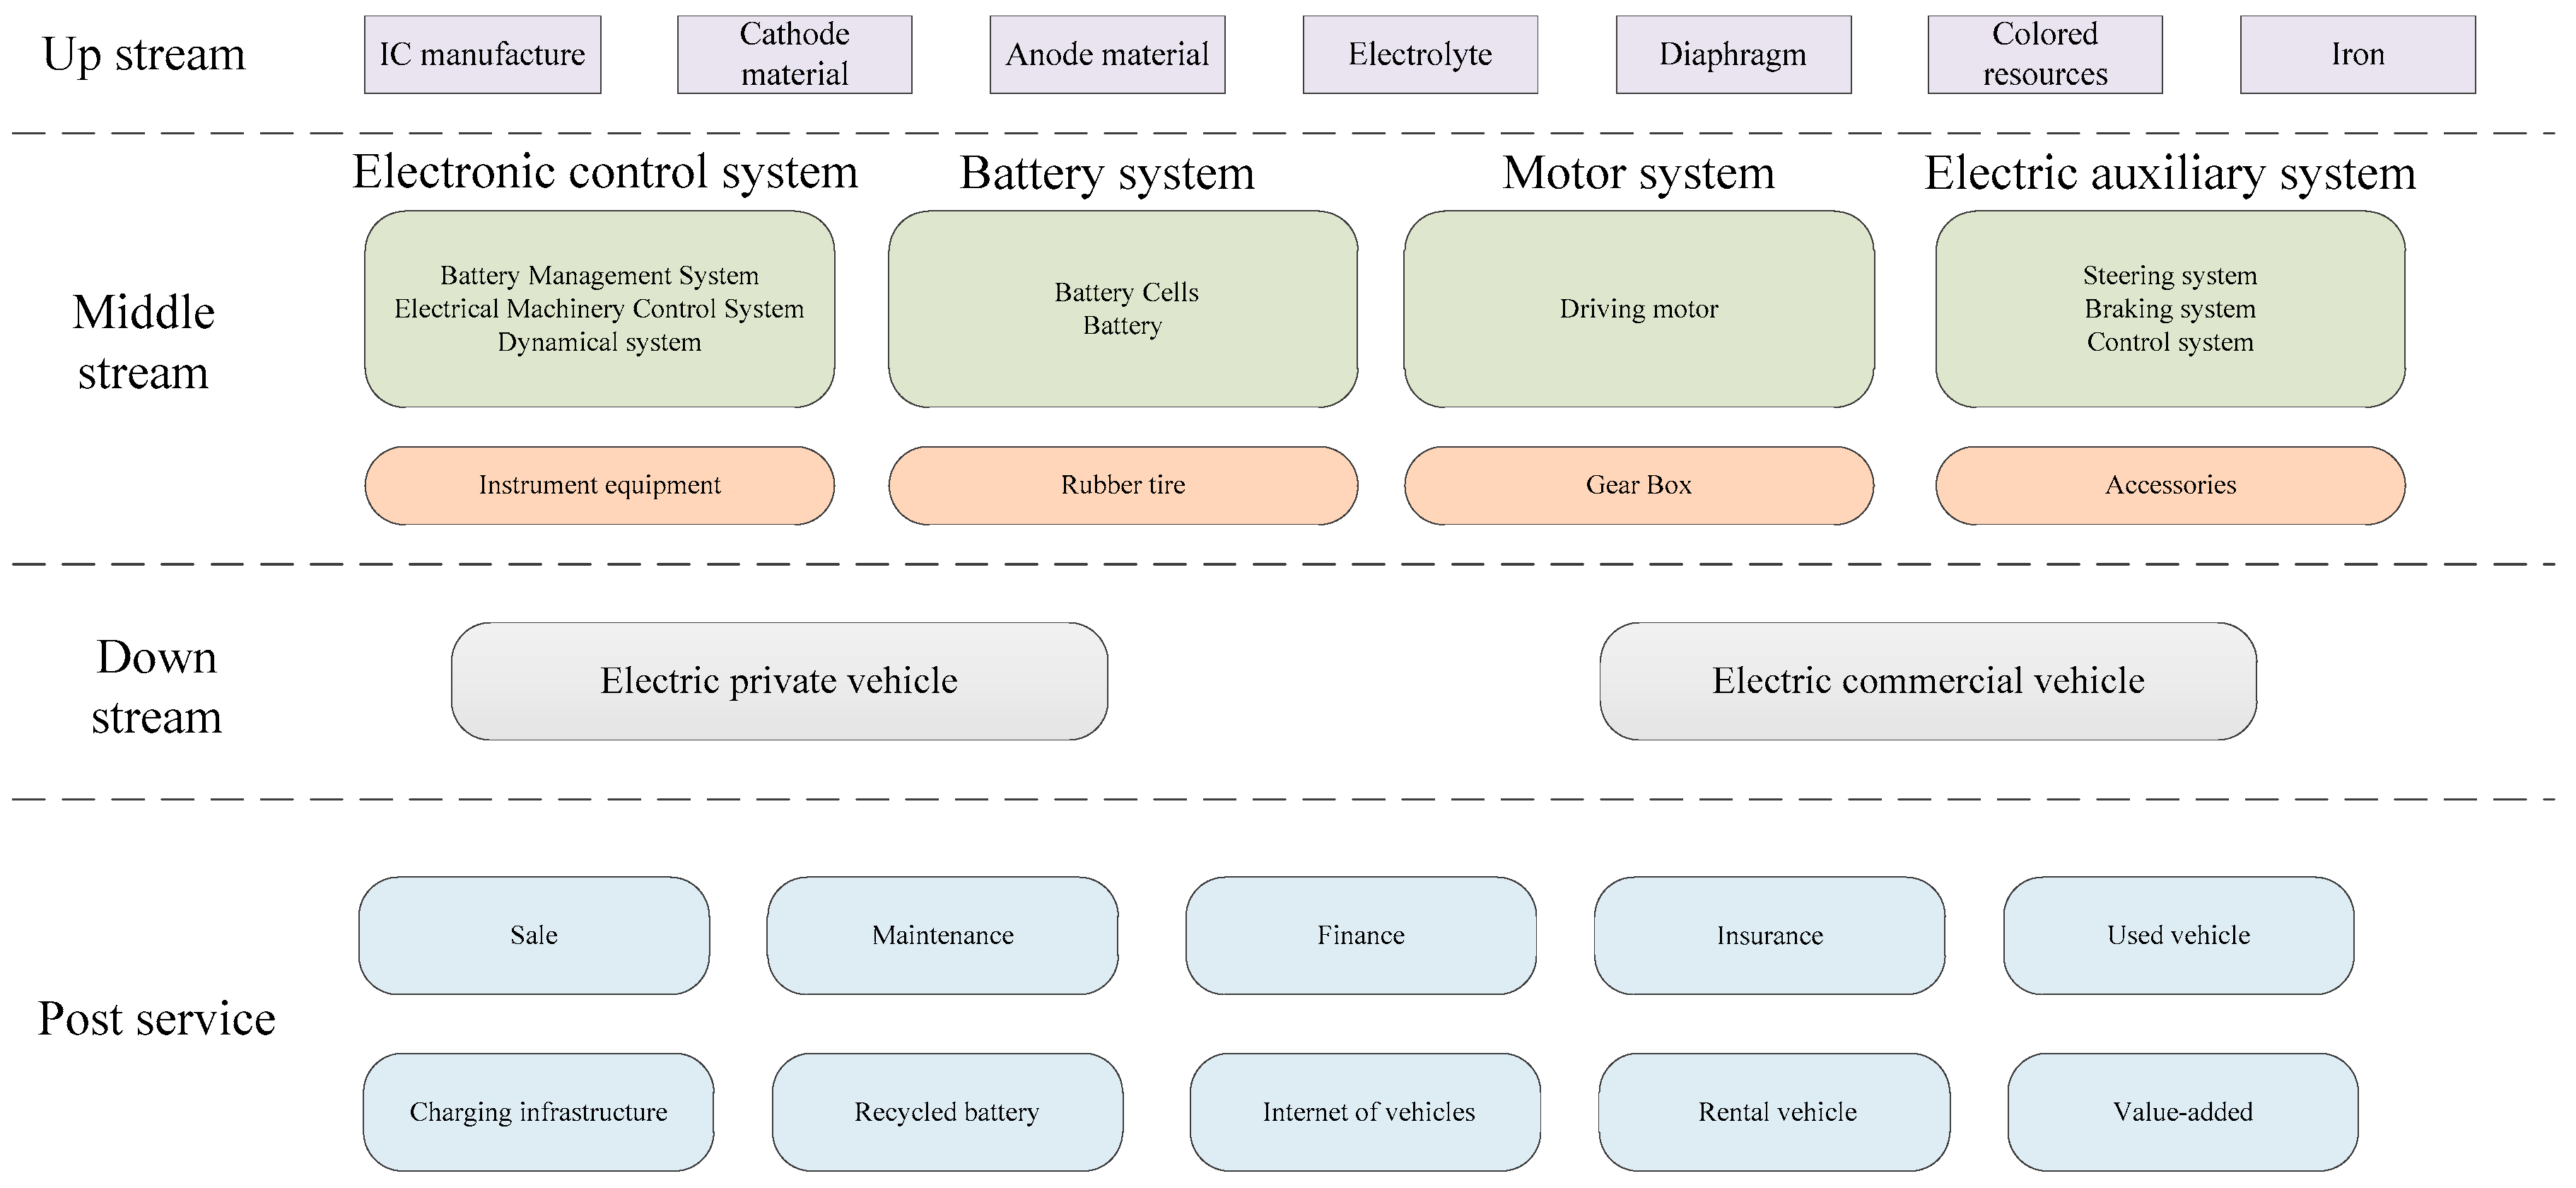
The development of electric vehicles needs the favorable support of each link in the industrial chain. As shown in Figure 1, the electric vehicle has achieved a breakthrough in the upstream, middle stream, and downstream aspects of the chain. The support of the post service is the most important chain in realizing industrialization. In the post service industry chain, charging infrastructures and electric vehicle battery recycling become very important. If the charging infrastructures cannot be developed well, the electric vehicles will not have the health circulation to be promoted.
This paper develops a new method to program the size and location of charging stations synchronously, which is combined by predicting the size of charging stations and optimizing the locations of charging stations in different years. This paper uses BASS to predict the penetration of electric vehicles and the number of charging stations needed in different years. Then, according to the queuing theory, the optimal model for the locations of the charging stations is proposed, which is to minimize the total cost of electric vehicle charging stations considering the capacity of charging stations and other constraints. Moreover, the enumeration method is used to solve this model.
This paper is arranged as follows. In Section 2, the related works about the development of electric vehicles and charging stations are discussed. In Section 3, we build the model to calculate the expected amounts of charging stations in the coming years and develop the theory to planning the distribution of the charging stations. In Section 4, we test the accuracy of the model built in Section 2. In Section 5, we discuss our conclusions.
2. Related Works
At present, there is much research all over the world on charging station programming. In the future, with the development of electric vehicles, charging stations are one important infrastructure that will accommodate more electric vehicles [6]. Researchers in the world have written many works about the advantages and disadvantages of charging stations, for example minimizing the charging time and optimizing the energy management and the capacity of electric grids [7,8,9]. The United States and Japan have also committed large efforts in the development of electric vehicles, and the governments have funded electric vehicles and charging infrastructures [10,11]. A charging station could offer an electric vehicle more than 100 kW, which can finish a charge in 20 min. The capacity of each charging station is 36 kW/h. Thus, a charging station can simultaneously supply 10 electric vehicles and ensure they have a power of 1000 kW [12].
Researchers have written a number of works regarding the influence of promoting charging stations. Shukla and Wang [13,14] have done research about the influence of the government on public charging infrastructures. In those two papers, it was written that the deployment of charging infrastructures could allocate public resources more efficiently. A related method and framework to deploy the charging stations of electric vehicles considering travel range constraints was also proposed. Mu proposed a spatial-temporal model to calculate the influence of electric vehicles on electric grids, considering the various strategies of transportation and OD of vehicles [15]. Wang [16] analyzes the impact of electric vehicle interconnection from different aspects and proposes that the impact of the charging load on the power grid can be divided into two categories: local and wide area. Shojaabadi [17] studied the variable factors and concluded that electric vehicles had negative effects on system load and voltage. Fazelpour [18] studied the impact of large-scale access of electric vehicles on the voltage stability of weak nodes in the electric grid. It is proposed that charging stations should avoid the weak nodes built in the electric grid and avoid charging during the peak load period.
With the development of electric vehicles, some researchers also surveyed the power grids for their capacity to support the promotion of electric vehicles. Alhelou proposed a new scheme to provide necessary primary reserve from electric vehicles by using a multi-agent control of each individual vehicle [19]. Alhelou also adopted model-based fault detection and isolation (FDI) techniques, which is built based on an unknown input observer (UIO), which is robust for systems with unknown inputs [20,21]. Makdisie presented smart grid infrastructure issues and integrated solar PV-sourced electricity in the smart grid [22].
For optimizing the charging station, some researchers also pay attention to the location and the size of the charging stations [5,23,24]. The existing research about planning the charging stations is based on the global urban program. Mehar [25] developed a method to solve the optimal problem of finding locations for charging stations. Lam [26] used a greedy algorithm to optimize the location of charging stations, considering the coverage and capacity of charging stations. In determining the number of charging stations in the residential district, the imbalance of electric vehicle distribution and the minimum charging distance must be considered. Jia [27] calculated the charging station in a certain area. He also did research about the programming process of the development of charging stations. Considering the effect of the electric vehicle load on the distribution network, an optimal distribution model of the charging station that is based on the simulated annealing algorithm was established. Yan [28] researched the selection of charging stations in a certain area and calculated the size in different cities. The method proposed in the paper can determine two types of fast charging stations and the type selection of the charging station. Dong [29] developed a model based on the charging location problems. This paper also analyzed the influence of various charging stations on increasing the miles of electric vehicles, which is solved by a genetic algorithm (GA) using real data from Seattle. Gonzalez [30] first analyzed the temporal and spatial behavior of electric vehicles and then, according to the behaviors of electric vehicles, this paper concludes the hotspots of demand for charging stations. Liu [31] developed a mathematical model for a multistage distribution network expansion programming, which identifies the optimal location and size of electric vehicles. This model can allocate the power of charging stations well, and it is also helpful in reducing the number of electric charging stations. Amarjit [32] thought it necessary to increase the number of electric vehicle charging stations and deploy the optimal number of charging stations to balance the power. In this paper, a formal framework has been proposed to satisfy the demands of the increasing number of electric vehicles. Sadeghi-Barzani [33] proposed a mixed-integer non-linear (MINLP) optimization approach to optimize the size and location of electric vehicle charging stations. This method considers various factors to improve the accuracy of this model, for example, the electric vehicle energy loss, and station development cost, etc. Chen [34] also investigated the optimal location of the electric vehicles. To solve this problem, he first developed the optimal model for the located problem of charging stations and then developed an improved genetic algorithm to solve this model. Ge [35] proposed a model to solve the sizing and locating problem for charging stations of electric vehicles based on grid partition, which is also solved by the genetic algorithm. Suganya [36] developed two modes of random distribution and centralized distribution, which considers the electric vehicle charging load. It is pointed out that the system will display different voltage characteristics when the electric vehicle charging load is connected to different nodes.
According to previous lectures, it is known that promoting the development of charging stations is of great significance to drivers and the government. The power grid is basic for charging stations, and it can decide how many charging stations are in a certain region and how they are distributed to meet power requirements and the requirements of electric vehicles. There are some researchers who study this issue. The above literature has made a contribution to solving the problem of the locations and the number of electric vehicle charging stations. However, the selection of the charging station locations and the prediction of demand for the charging stations are important factors in their development of this crucial infrastructure. This is ignored by many scholars, especially for the long-term program of one city. However, these documents have almost only been used to plan the distribution of charging stations once. They have not planned this continuously in different years, which is very important for the sustained development of one city. The purpose of this paper is to provide a more reasonable prediction of the number of charging stations and to optimize the locations of the charging stations in different years based on minimizing the total cost of the charging infrastructures.
3. Model
3.1. Predicting the Amount of Electric Vehicle Charging Stations Based on BASS
The development of electric vehicles is classified into two different groups. The first is controlled by the government (e.g., taxi, post vehicle, bus, etc.) The other one is guided by the market (e.g., private car). We will predict the amount of electric vehicles guided by the market and the amount of their charging stations based on BASS [37].
3.1.1. Predicting the Amount of Electric Vehicles
The BASS model is based on the assumption that there is no repeating buyer, which means it only considers the first buying behavior and considers each customer as the basic unit. It is assumed that the number of buyers can directly reflect the sales volume of the products. It is believed that, in the BASS model, the decision of some customers to adopt a new product has no relation with other individuals in the social circle. Although these customers have an interactive relationship with others, they will not consider the new product because of the pressure from the people who have connection with them. However, there are also people who are not this. In contrast, their decision to buy a new product is affected by the people who have relationship with them. The possibility of making this decision is related with the amount of people who have bought the new product. According to the analysis, if a customer had not bought a new product at a certain time, the probability of buying the new product at this time is a linear function with the number of current buyers (i.e., the people who have bought the new product). The mathematical equation is used to express the model as follows
In the equation, is the cumulative amount of consumption until time T. is the cumulative amount of consumption until time T − 1. m is the maximum potential in the market. p is the coefficient of innovation, which represents the number of people who buy products affected by other consumers. q is the coefficient of imitation, which represents the number of people who buy products affected by the Internet and others’ decisions.
3.1.2. The Demand Calculation for Electric Vehicle Charging Stations
● Calculation of the daily charging times of electric vehicles
The number of charging times per day for an electric vehicle is calculated by Equation (2).
In Equation (2), is the actual charging time of an electric vehicle per day, is the annual average mileage of an electric vehicle in km, is the number of driving days per year of an electric vehicles, and is the driving range of an electric vehicle battery in km. According to the current battery technology level, 120 km is desirable.
● Calculation of charging demand power of an electric vehicle
In order to forecast the demand of the charging stations, we first need to determine and quantify various influencing factors of electric vehicle charging stations. Then, the relationship between the quantitative factors and the mathematic model, based on the prediction of vehicle penetration, must be established. Finally, we found a reasonable size for an electric vehicle charging station.
The demand forecasting model for the charging station is
In Equation (3), X is the demand of electric vehicles for charging power (in ). M is the correction factor, with a size between 0 and 1. Q is the predicted amounts of electric vehicles. P is the power of a single electric vehicle in . N is the charging time of an electric vehicle per day.
3.2. The Optimal Location of Electric Vehicle Charging Stations
3.2.1. The Model of the Location of Charging Stations
The charging operation process of electric vehicles can be regarded as a queuing service system, in which the customers are the electric vehicles with electrical demand and the charging and switching infrastructure are equivalent to the service station. When an electric vehicle arrives at a charging station, if there are no free charging stations available, queuing and waiting behavior will be required. In the queuing model of charging operation, the demand of an electric vehicle is random [38,39]. Because of the time of charging operation and the time of electric vehicles going in and going out, the total service time can be simulated according to the negative exponential distribution (parameters are ), which is satisfied with the rule of first arrival first service and the rule of the waiting system. Thus, queuing theory can be used in the work of programming the charging stations.
According the queuing model [40], the equation of equilibrium for the power system of electric vehicles can be developed
In Equation (4), is the possibility that n electric vehicles accept charging services. s is the number of charging stations. The number of electric vehicles that accepted service of charge are n. The average arriving rate for each charging station is , which can be calculated using Equation (5)
In Equation (5), the power consumption is . The average distance travelled by the electric vehicle each day is . is the penetration of electric vehicles in region m. The average battery capacity of an electric vehicle is q. The average working time of a charging station is t. is the average service rate of the charging stations, which can be calculated using Equation (6)
In Equation (6), is the time for an electric vehicle entering and leaving one charging station. is the charging time.
By solving Equation (6), the state probability of the charging system can be developed as Equation (7)
In Equation (7), the parameters are as follows.
The service efficiency of the charging station is , calculated by
The utilization ratio of the charging station is , calculated by
The waiting queue length is and the average queue length is , which are calculated as follows.
The time an electric vehicle is in the charging system and the waiting time are and , respectively. They are calculated as follows.
In the charging system, the greater the number of charging stations, the better the service efficiency is. However, the number of charging stations cannot increase exponentially. Thus, it is important to optimize the deployment of charging stations.
In this paper, the optimization objective is to minimize the sum of the waiting time cost of electric vehicles and the operating costs of the charging station, and the queuing model is established based on the queuing system theory. This is shown in Equation (12)
In Equation (12), is the average total cost per unit of time generated by the facility for the charging stations, is the average time cost (including equipment maintenance costs, depreciation costs, labor costs, etc.) for one charging station, and is the average time cost (including power consumption, energy costs, travel value, etc.) of a single electric vehicle.
If s is the number of charging stations, then
According to the queuing theory, it can be determined that the optimal number of charging stations () is when the sum of the waiting time cost of the electric vehicle and the annual average operation cost of the charging station is at the minimum amount.
The deployment of a charging station should strike a balance between construction costs and transportation costs [41,42]. Centralized charging stations are attached to substation construction. The number may be considered as a fixed number, and the less the battery changing stations in the city (assuming uniform distribution), the greater the total distance from the battery changing station to the charging station. Thus, with increasing the cost of road transport, the cost of building the corresponding battery changing station is reduced. If the number of battery changing stations increases, the result is the opposite. Therefore, a balance must be achieved to determine the appropriate number of charging stations in the city that will meet the needs of the charging electric vehicles.
The paper establishes the model as follows.
Subject to
is the operating cost, calculated as follows.
is the transportation cost.
In the equation,
is the set of demand areas,
is the set of substation locations,
is the set of points for power stations,
is the size of the substations,
is the electricity demand in the demand area,
is the distance from the demand point (m) to the candidate site (n),
is the distance from the candidate site (n) to the centralized charging station (k), and
is the economic transport coefficient.
In the constraint conditions, Equation (15) shows that all electric vehicles in the demand area m can only accept the services of nearby sites within a certain period of time.
Equation (16) indicates that electric vehicles can be served only when the substation is built at the candidate site n.
Equation (17) shows that only one substation can be built at a candidate station site.
In Equation (18), if the size of the substation at the candidate site n is s, then it is 1, otherwise, it is 0.
In Equation (19), if substation k is selected as a centralized charging station for candidate site n, then it is 1, otherwise, it is 0.
In Equation (20), if the demand area m chooses to accept service at the candidate site n, it is 1, otherwise, it is 0.
3.2.2. Solution for an Optimal Model
The above optimal model belongs to the 0-1 programming problem. 0-1 programming is a special form of integer programming. Its decision variables can only be expressed as 0 or 1. In this paper, it means whether or not to choose the site. The combination of the possible values of all variables can be calculated and, the optimal solution is selected. This method is named the exhaustion method [43] (or the enumeration method). It is needed to be calculated as , and the number of calculations will increase exponentially with the increase of n. The algorithm becomes unrealistic when n is too large. In practice, the major method of solving the programming is the implicit enumeration method.
In this paper, the implicit enumeration method is used to solve the optimization function, and the following improvements have been made.
- For the primary scheme, in this paper, we first checked the municipal traffic restrictions and the grid constraint separately. If a constraint condition is not satisfied, there is no need to check the following constraints.
- If a feasible solution is found through the search, a filter condition is added immediately. If the object function value is less than that of the feasible solution, there is no need to compare the following constraints, and the search is continued directly.
The flow chat is shown as Figure 2.
4. Case Study
4.1. General Situation of the Case
The basic planning steps for a charging station are based on the research results of ordinary gas stations, substations, and distributed power sources. The first step is the primary selection for the location of charging stations, which needs to consider two related factors: the municipal traffic and the power grid in the planned city. This is offered by the government in this paper. The next step is to develop an optimal model to determine the location of the charging stations. In this paper, we proposed an optimal model that minimizes the cost of charging stations.
In this paper, a city in China is selected as the research region. The municipal planning, vehicle penetration, power grid programming, and other needed data are known. In the optimal location of the charging station, 2030 is regarded as the programming year, which means that we will optimize the distribution of charging stations in 2020, 2025, and 2030.
4.1.1. Electric Vehicle Penetration and the Primary Location of Charging Stations
In this paper, the following table shows the GDP and vehicle penetration in the area to be planned, which is presented in Table 1.
Based on the main factors affecting the location of electric vehicle charging stations, the primary locations were selected. The main parameters are shown in the Table 2, which includes the number of candidate locations, geodetic coordinates, vehicle flow, land price, and the ratio of entering stations. The geodetic coordinates are switched with geographic coordinates in the coordinates we defined.
4.1.2. General Situation of the Distribution Network
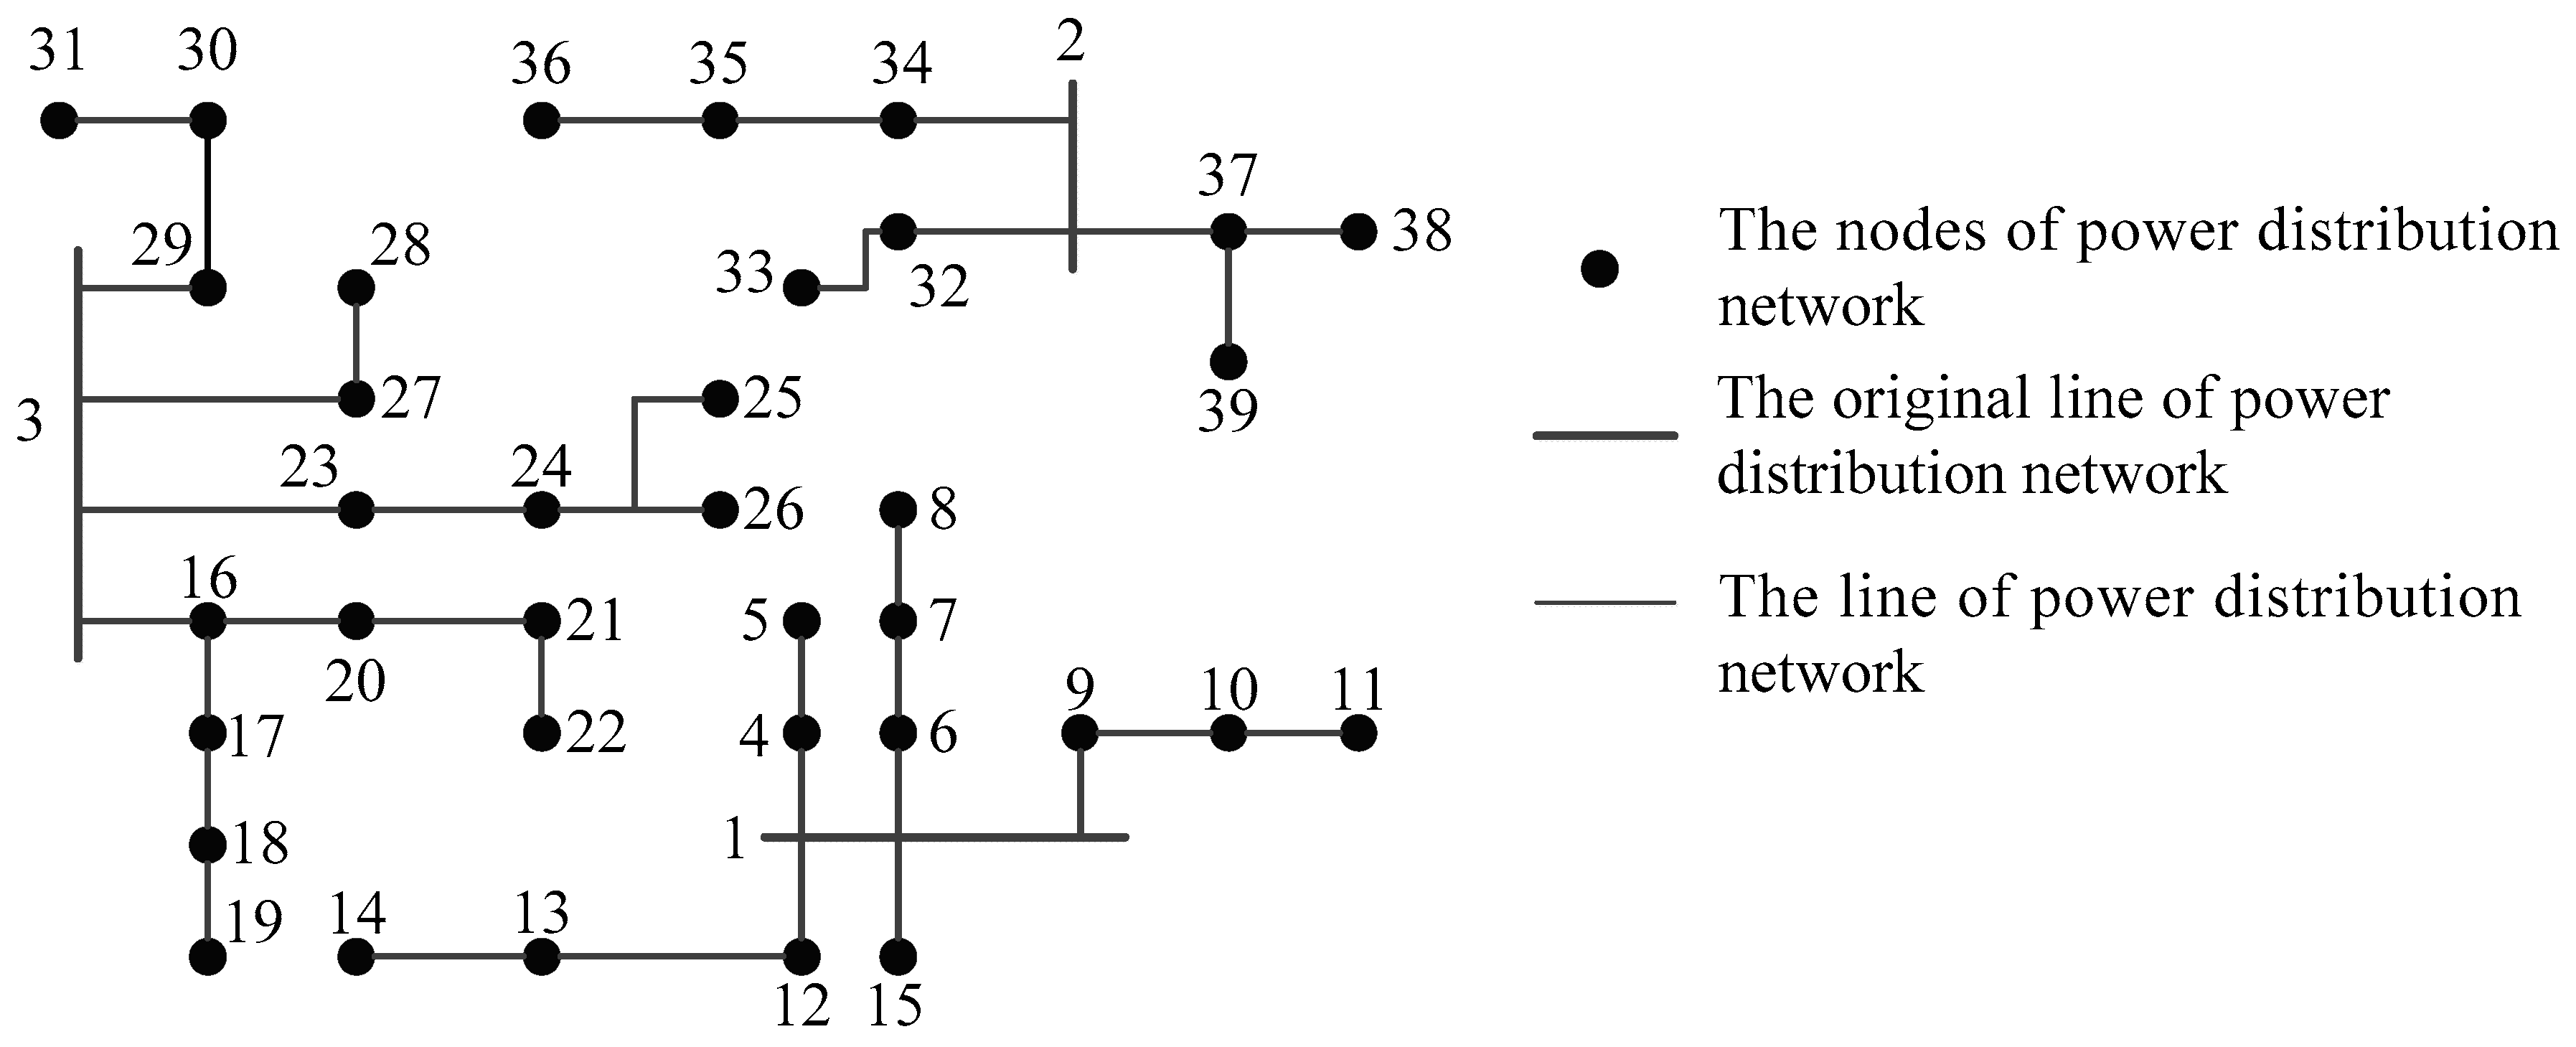
This paper simplifies the original power distribution network, which include three power stations and 39 points. The details are shown in Table 3, Table 4 and Table 5.
The detailed nodes of the power distribution network are shown in Figure 3. The black points represent the nodes of the power distribution network. Each of them can be connected with charging stations. The bold stripes are the original lines of the power distribution network. In general, there are only a few of them, which are connected with power companies. The pinstripes are the lines of the power distribution network, which aim to make connections between each node of the power distribution network.
In the table, as the connection lines in the system generally use an open loop operation mode, the contact point in the simplification process will not have a significant impact on the objective function value of the optimal location model.
4.2. Predicting the Amount of Electric Vehicle Charging Stations
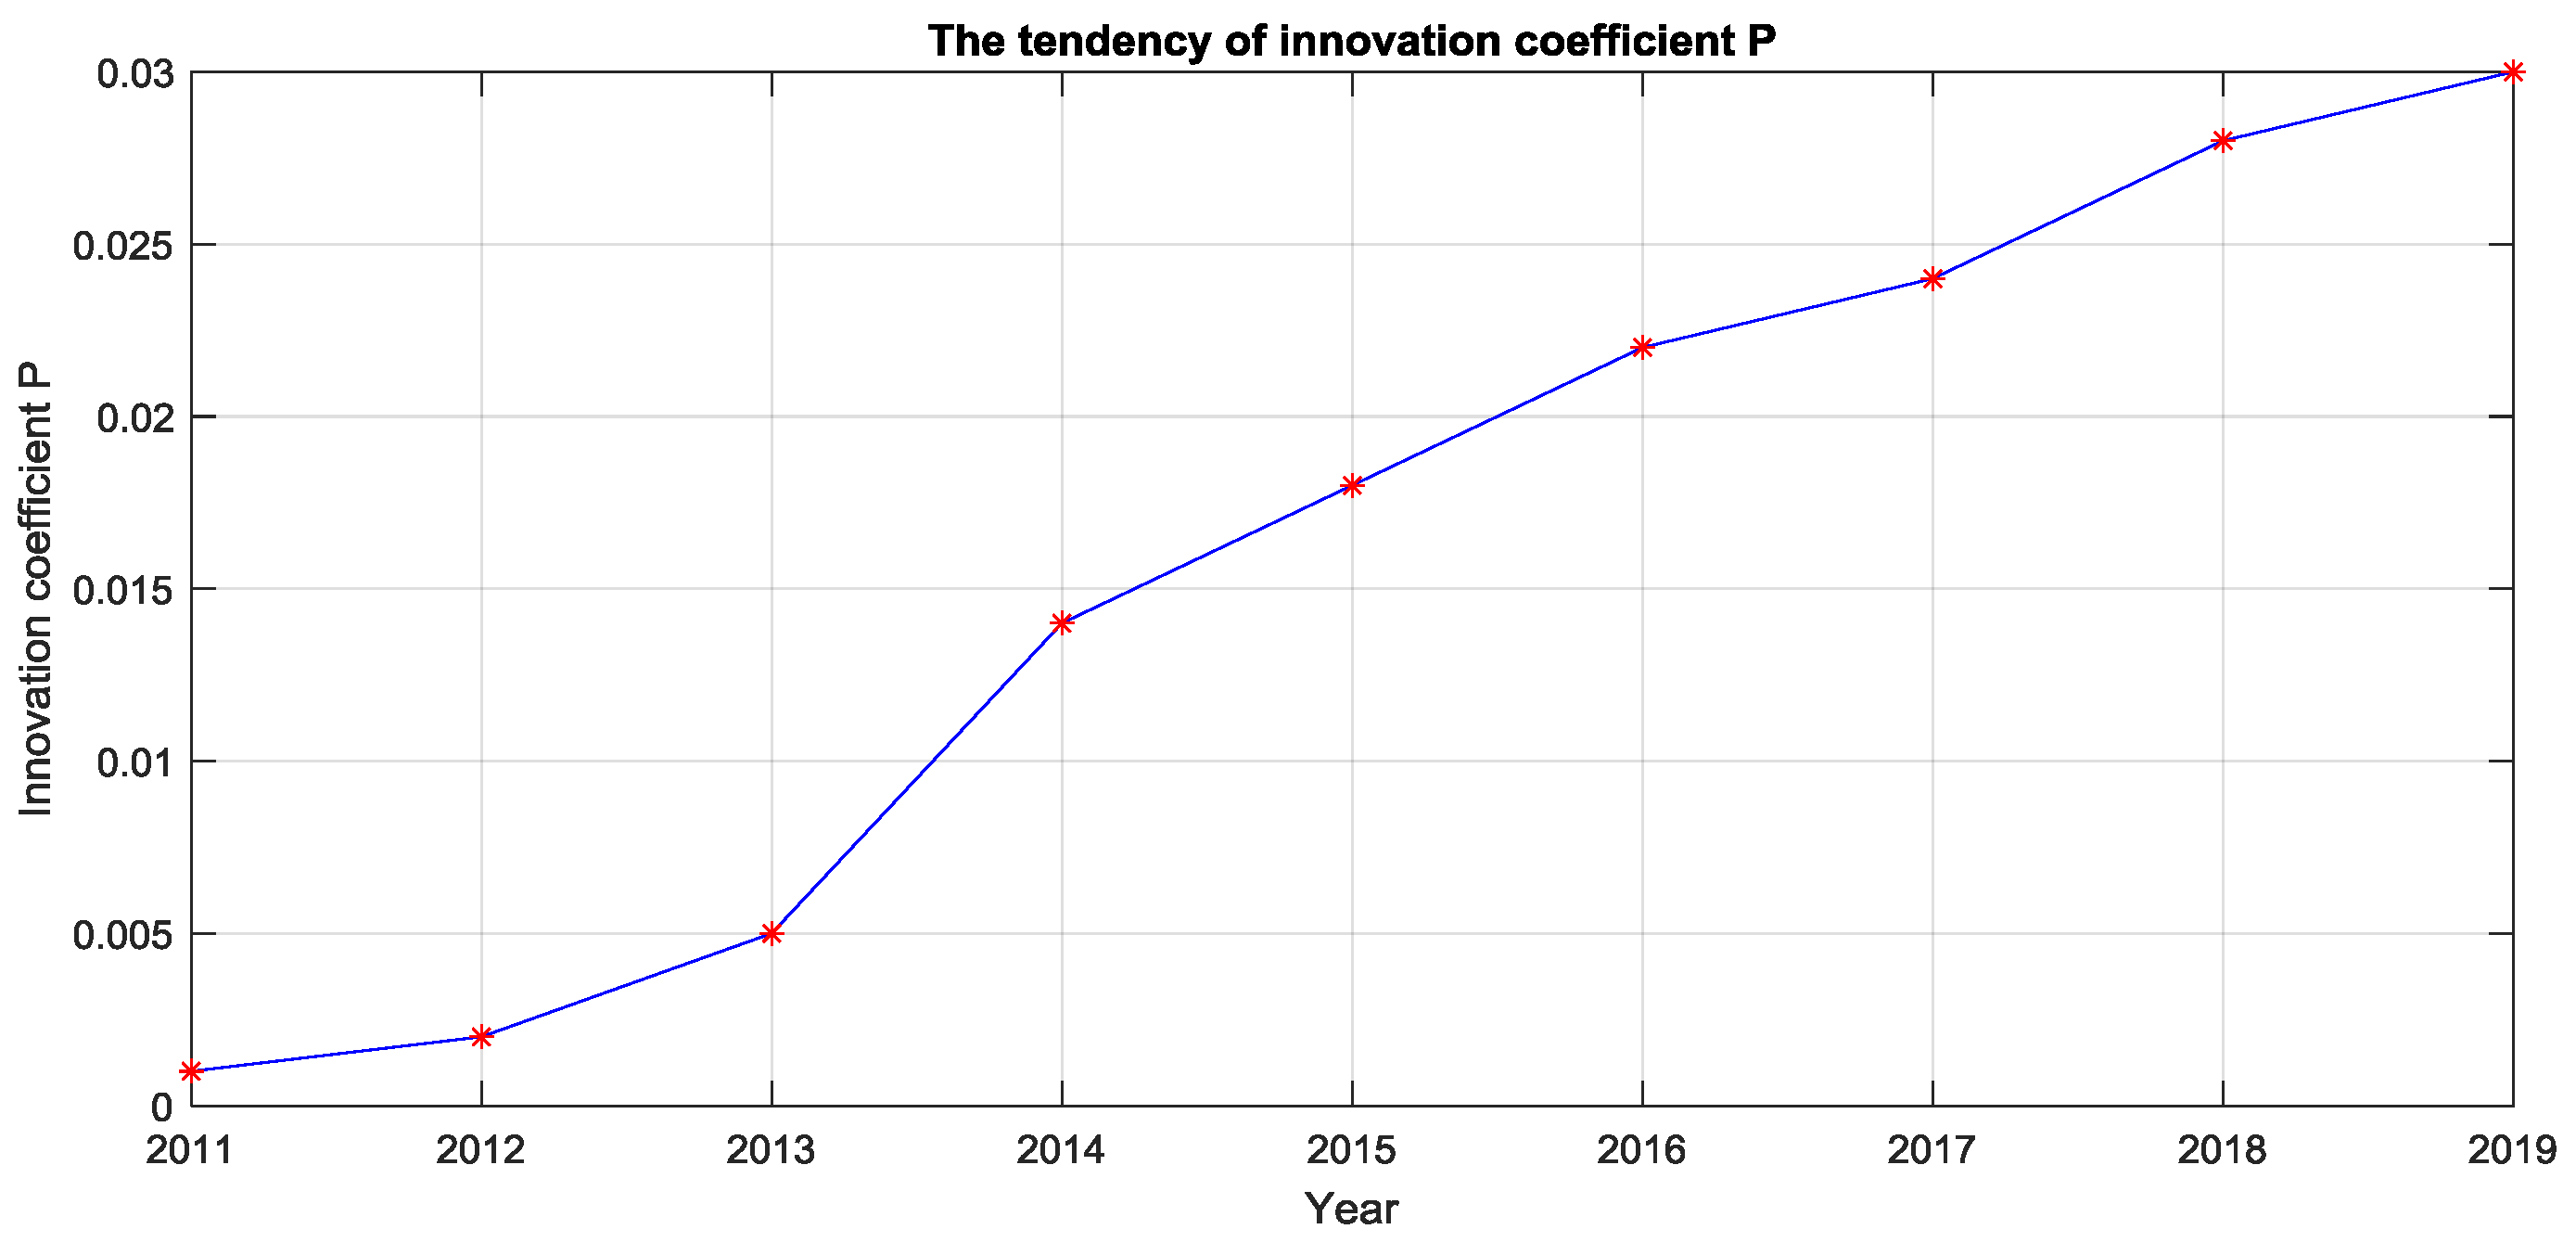
4.2.1. Estimation of the Innovation Coefficient p (or the External Influence Coefficient)
The innovation coefficient (p) reflects the number of electric vehicle buyers. p is within 1.0, and a value closer to 1 means that the consumer will accept the electric vehicle once it is produced. In addition, the innovation coefficient will also be affected by the degree of perfection of the electric vehicles. Because electric vehicles have just been promoted in China, they have less sales. However, the tendency of sales for electric vehicles is to simulate that of other products. Combined with the BASS model to predict the sales of new products, the value of p is taken to be between 0.01–0.03. Combined with the development of electric vehicles in China, this article sets p as shown in Figure 4.
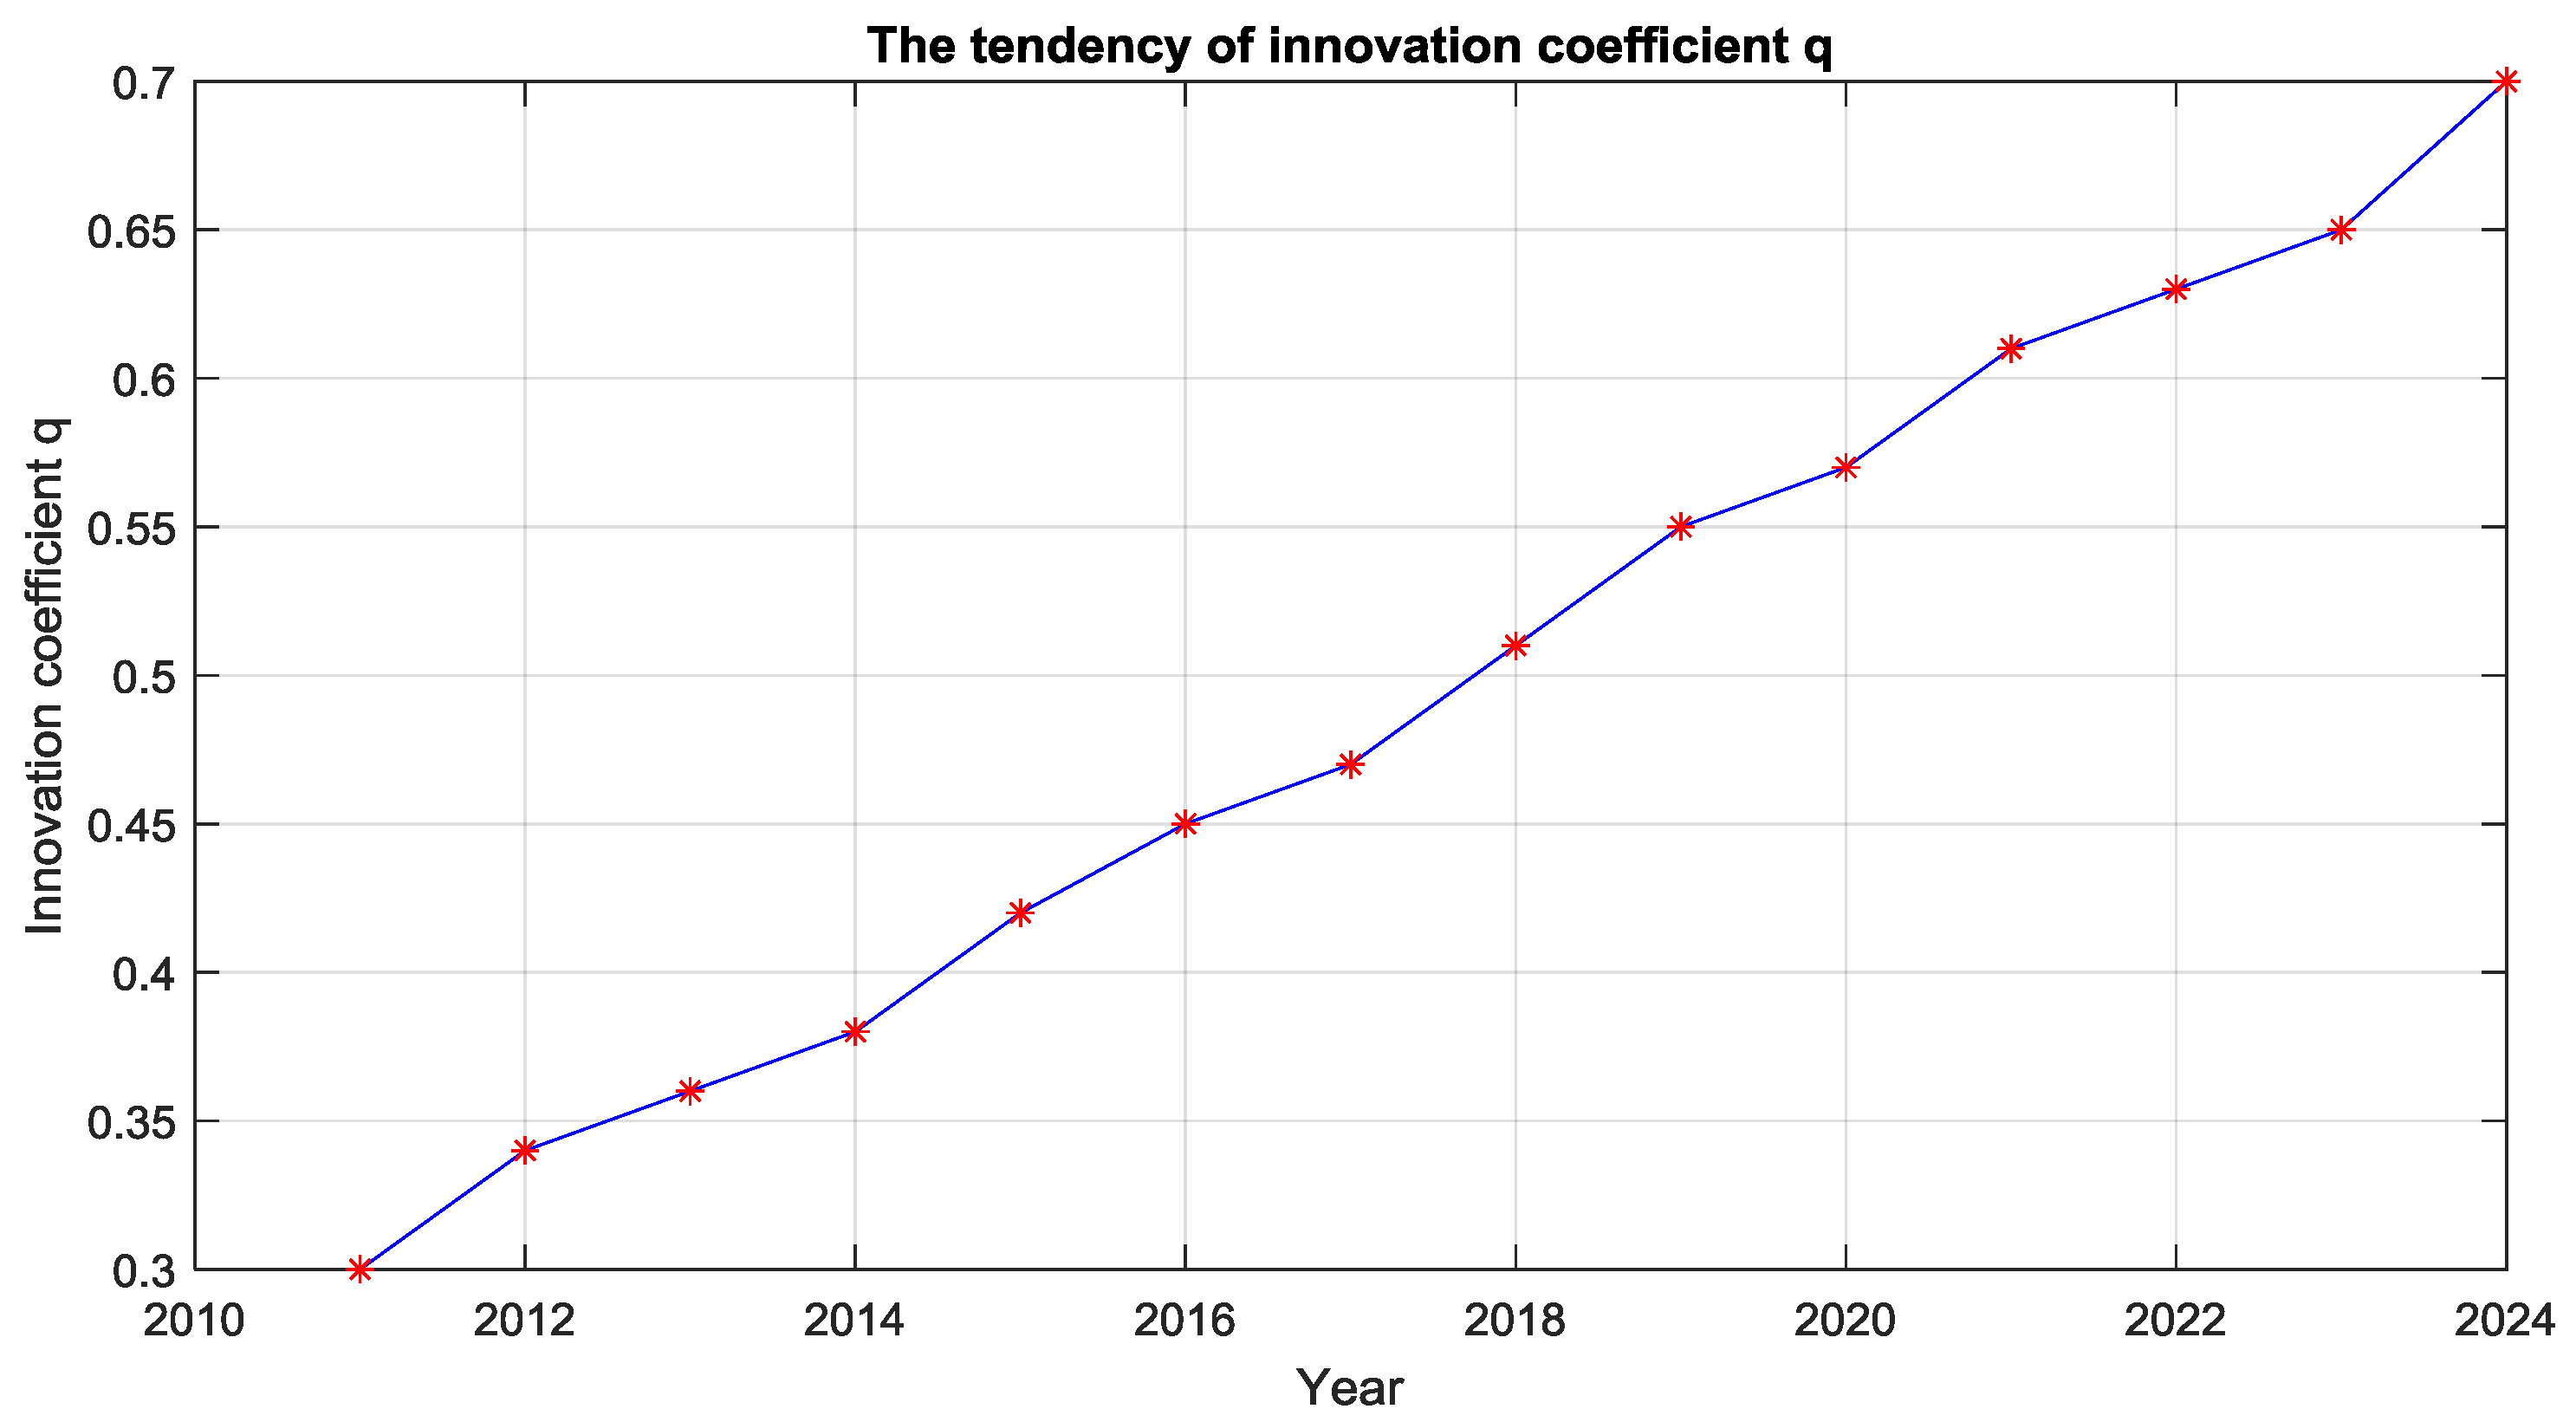
4.2.2. Estimation of the Imitation Coefficient q (or the Internal Influence Coefficient)
Buyers who like the brand of a product are not only affected by the promotion of the new product but also by other consumers’ feedback on the performance of the new product. The imitation coefficient (q) can represent the number of buyers of these electric vehicles, and q is also within 0-1 programming. The closer 1 it is, the faster the spread speed of potential customers of electric vehicles. According to other goods’ models, the range of q is almost in the range of 0.3–0.7. According to the development of electric vehicles in China, this paper assumes that q is 0.3 in 2011. With the gradual progress of industrialization of electric vehicles, q will increase gradually. In this paper, the setting of the imitation coefficient is shown in Figure 5.
4.2.3. Prediction Results
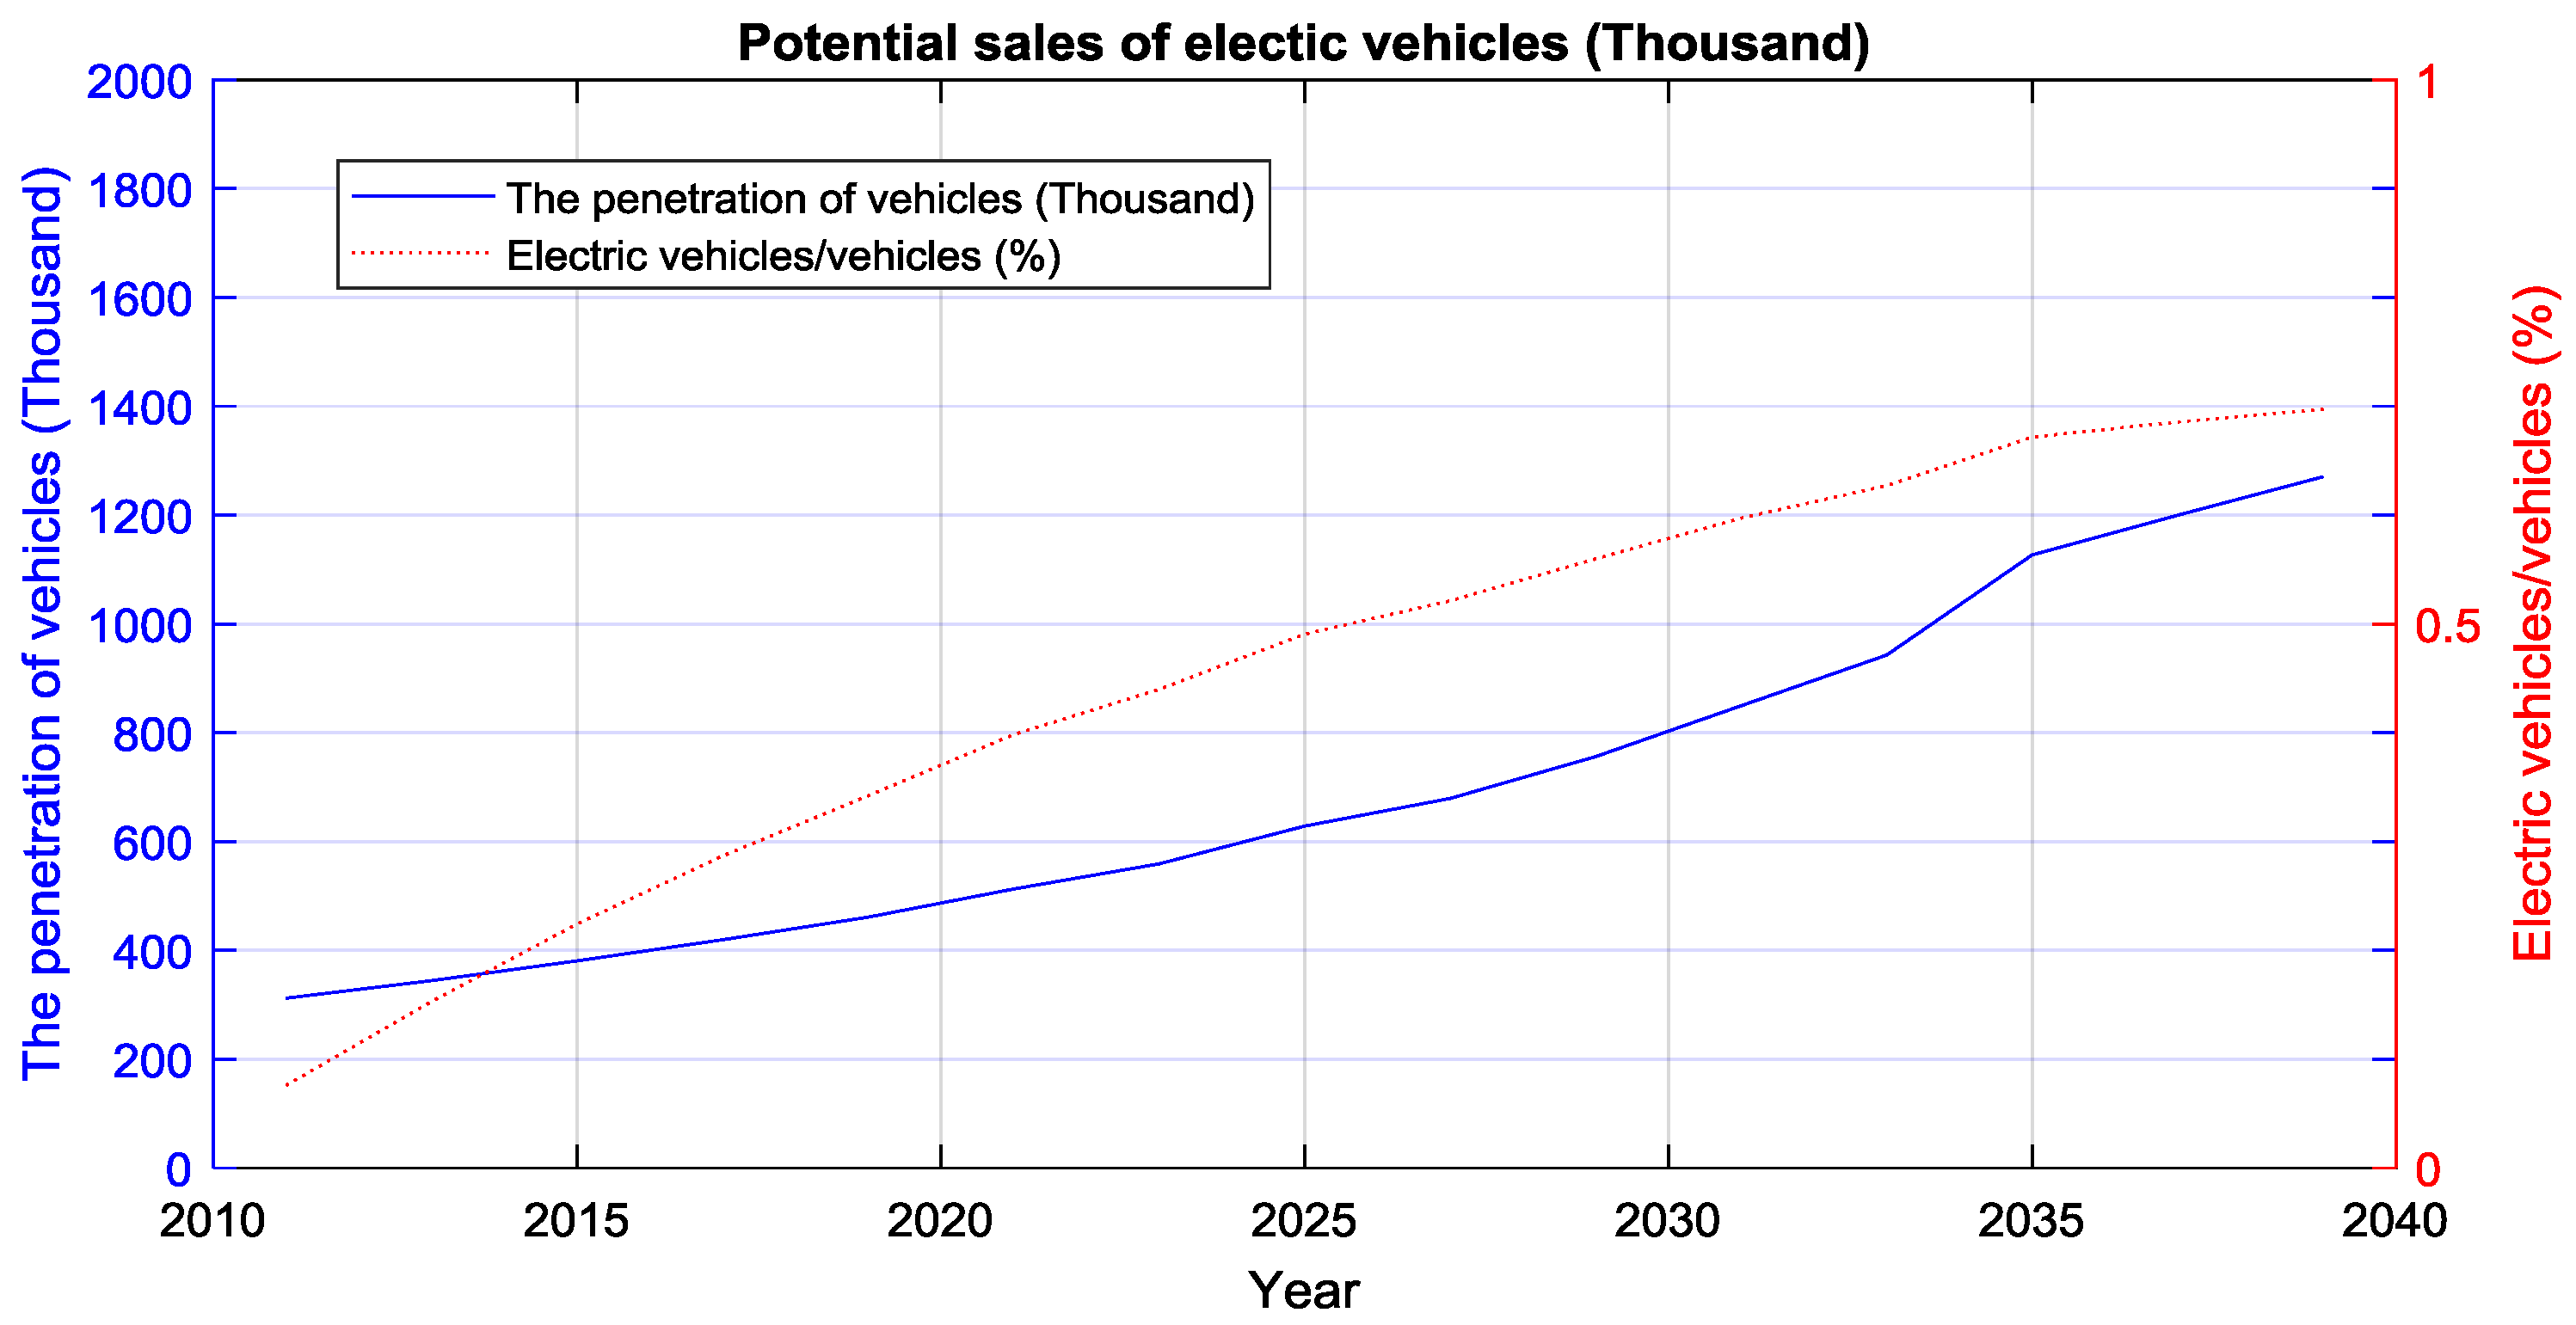
Most vehicle consumers have a desire to buy or rent electric vehicles. However, it is not true that all people who want to buy electric vehicles will buy them. Thus, in this paper, we consider the difference between buying interest and buying behavior. It is assumed that the number of potential consumers in electric vehicles accounts for 0.8 of the number of sales in vehicles, which means that 80% of people who buy vehicles will buy electric vehicles. The potential sales of electric vehicles are presented in Figure 6.
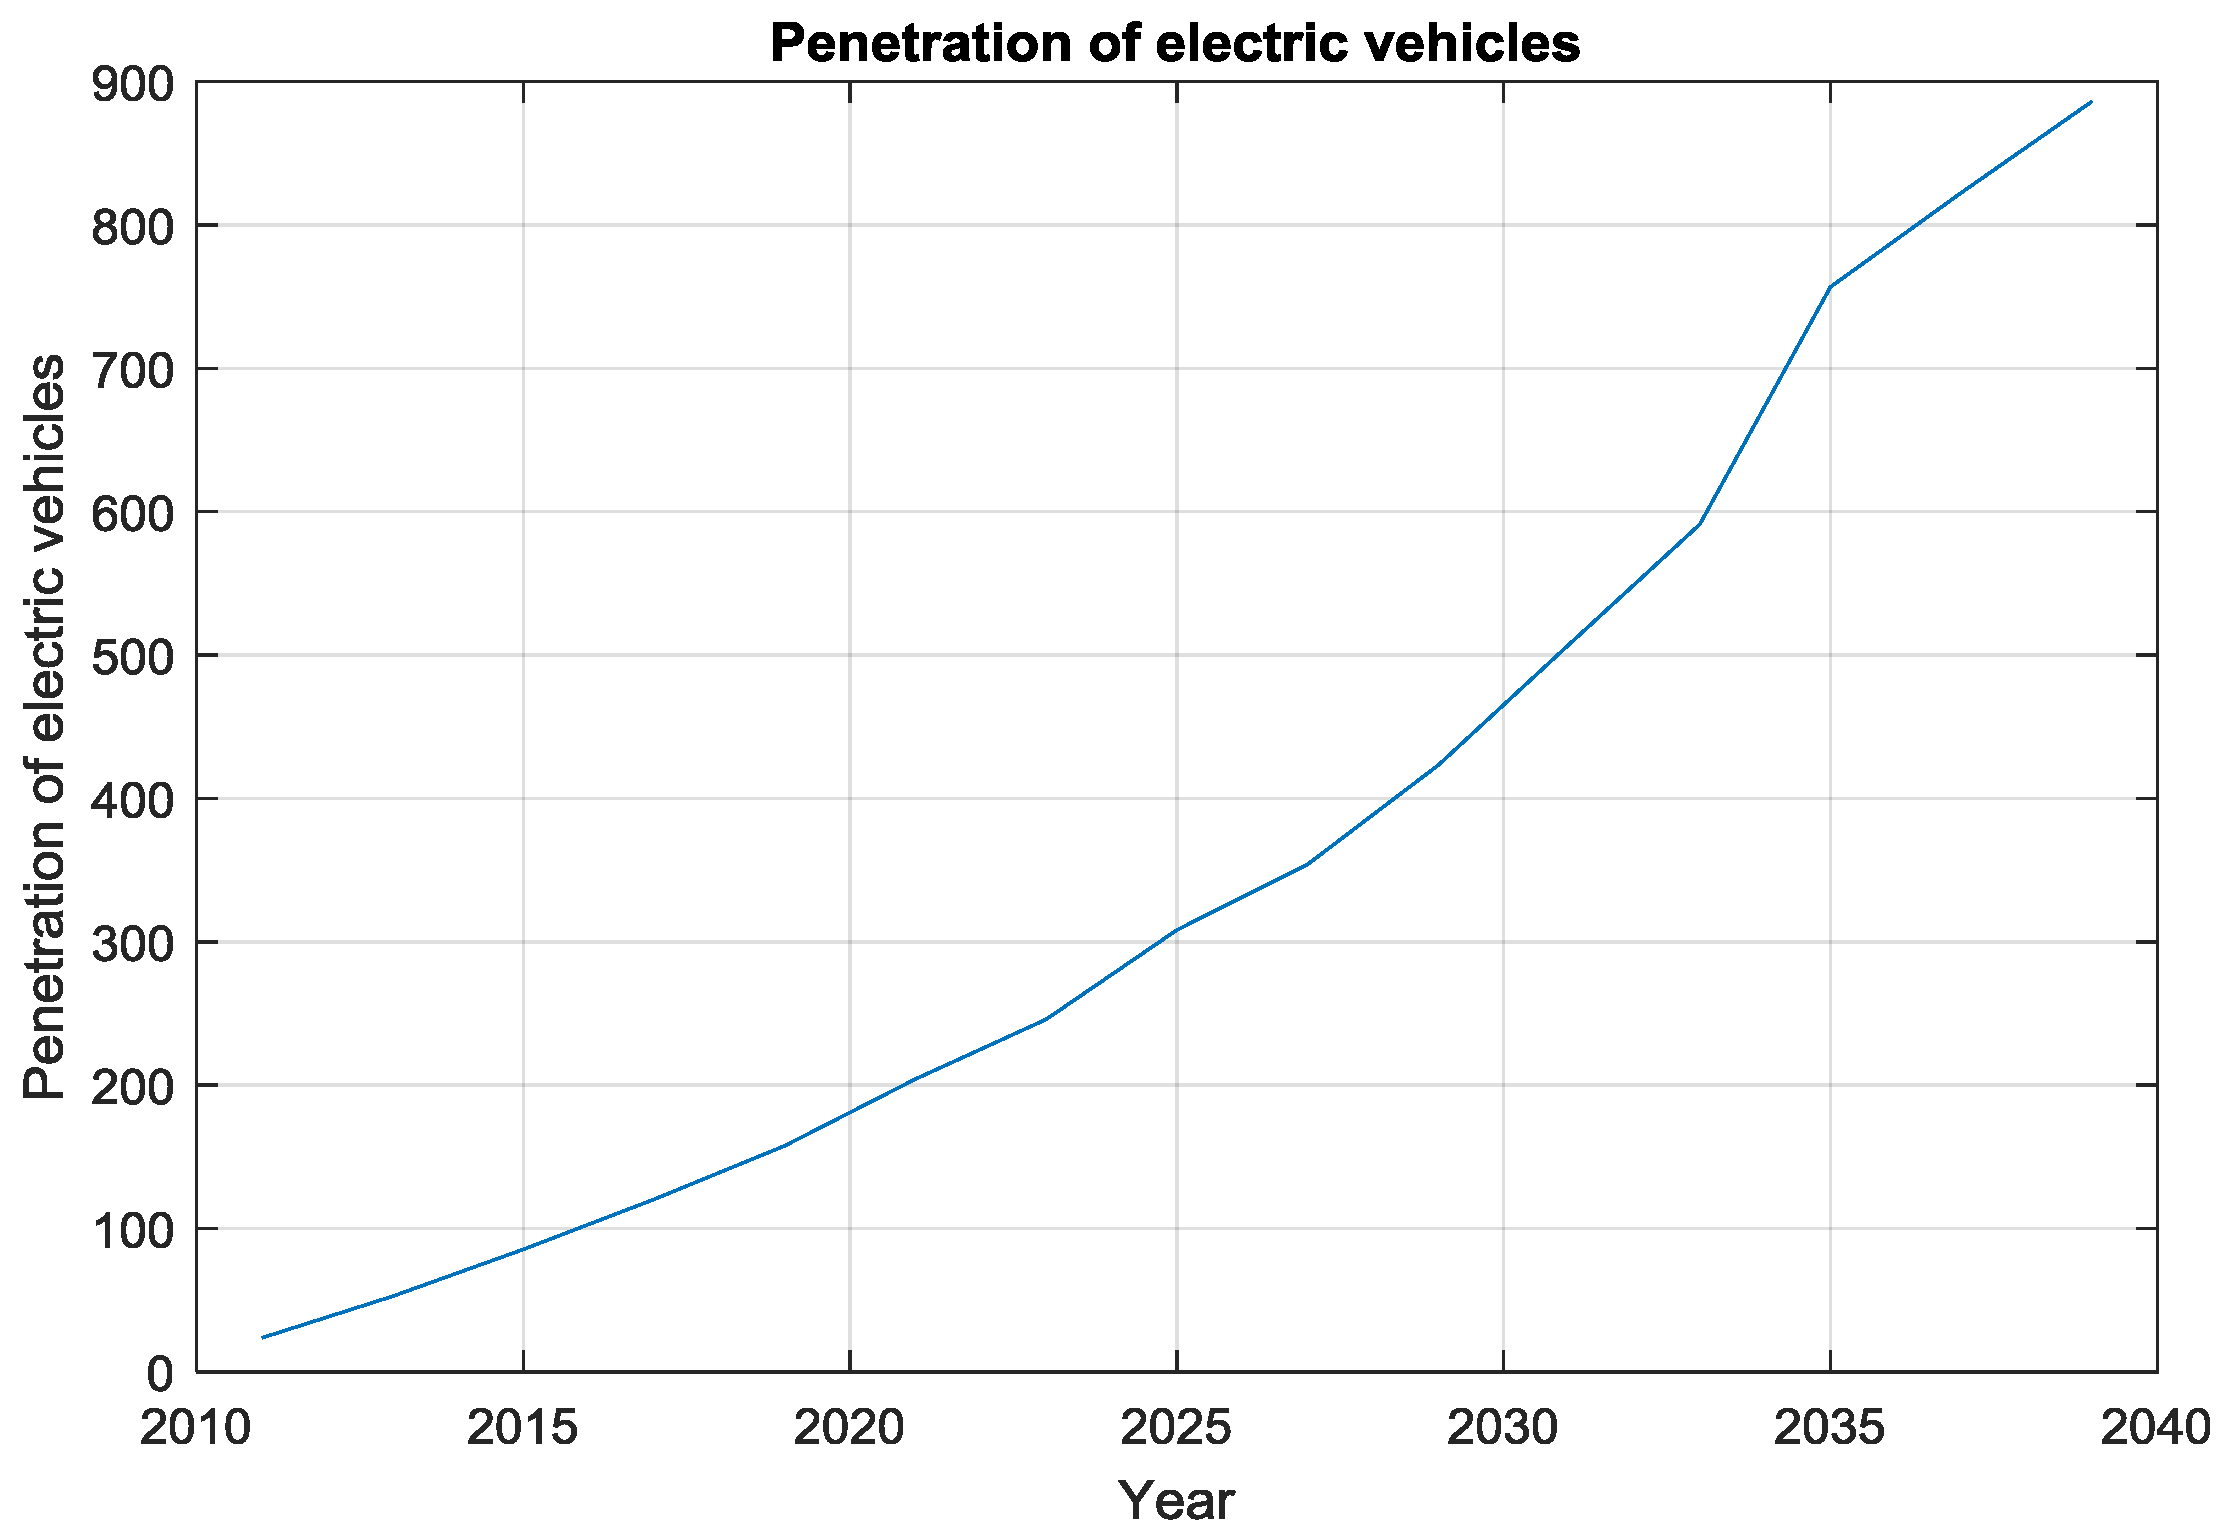
In this figure, the ratio of electric vehicles slightly increased from 2010 to 2040, which means that the ratio of electric vehicles to total vehicles increased slightly. Between 2035 and 2040, the tendency of the ratio of electric vehicles to increase is slow because, in those years, the increasing rate of sales of the vehicles is reduced. The predictions of the penetration of electric vehicles are shown in Figure 7.
During those years, in this city, the penetration of electric vehicles will increase observably. In 2040, it reaches more than 800,000. Between 2020 and 2035, the penetration of electric vehicles increases especially fast. After 2035, the speed of growth will decrease. It is possible that, after 2035, the number of people who need vehicles will decline.
According to Equations (2) and (3), the amount of charging power needed by electric vehicles can be calculated. The M, P, and N are 0.5, 30 (), and 0.5 (times per day), respectively. The result is shown in Table 6.
The owners of electric vehicles often have charging packages at home. Thus, not all the electric vehicles need a charging station. Therefore, it is necessary to introduce the index M to this model.
4.2.4. The Results Compared with Actual Data
In order to verify the accuracy of the predicting model on the penetration of electric vehicles, the results calculated by the model in this paper are compared to the real data from the local government. The compared results between actual data and predicted data are shown in Table 7.
According to this city’s development reports from 2011 to 2015, the actual data of penetration of electric vehicles can be obtained. Comparing the actual data with the data calculated by the model in this paper, the differences between them are about 1% during 2014 and 2015. Thus, the model we have developed in this paper can predict the penetration of electric vehicles exactly.
4.3. The Optimal Location of Charging Stations
4.3.1. The Results of the Optimal Location of Charging Stations
This article assumes that each electric vehicle has the same battery type and quantity. According to the document “Specification for the Automotive Power Battery Industry”, issued by the new national standard and the Ministry of Industry and Information Technology in March 2015, the entire battery capacity can be set to 80 kWh. Based on the current basic data of electric vehicles, the average energy consumption per hundred kilometers can be set to 17 kWh, and the average daily mileage is about 200 km. At the same time, in the studied case, this article found that the average daily working time of the charging stations is 12 h in this city.
According to the national standardization guidance document, with reference to the municipal planning in the urban area, the classification of the charging stations is outlined in Table 8.
Simultaneously, we set up the time cost data of the single charging station, as shown in Table 9.
According queuing theory, the average time for electric vehicle users to get in and out of stations is about 10 min, while the time to accept the service can be set to 5 min. At the same time, according to the impact of power consumption and other factors, we assume that the average time cost of electric vehicles to accept the service is = 200 yuan/h.
According to the method in this paper, in 2020, we will first build four charging stations. In 2025, nine charging stations will be made. In 2030, 11 will be made. The optimal location for the electric vehicle charging station is shown in the following table. The building cost in 2020 is Yuan. Other detailed information is shown in Table 10.
The building cost in 2025 is Yuan, and the detailed information is shown in Table 11.
The building cost in 2025 is Yuan, and the detailed information is shown in Table 12.
4.3.2. The Results Compared with the Plan of the Government
In order to verify the accuracy of the optimal results, we compared the results calculated by the model in this paper with the plan of the government. We obtained the real data from the local government regarding their plans for building the charging stations. The primary plan is shown in Table 13.
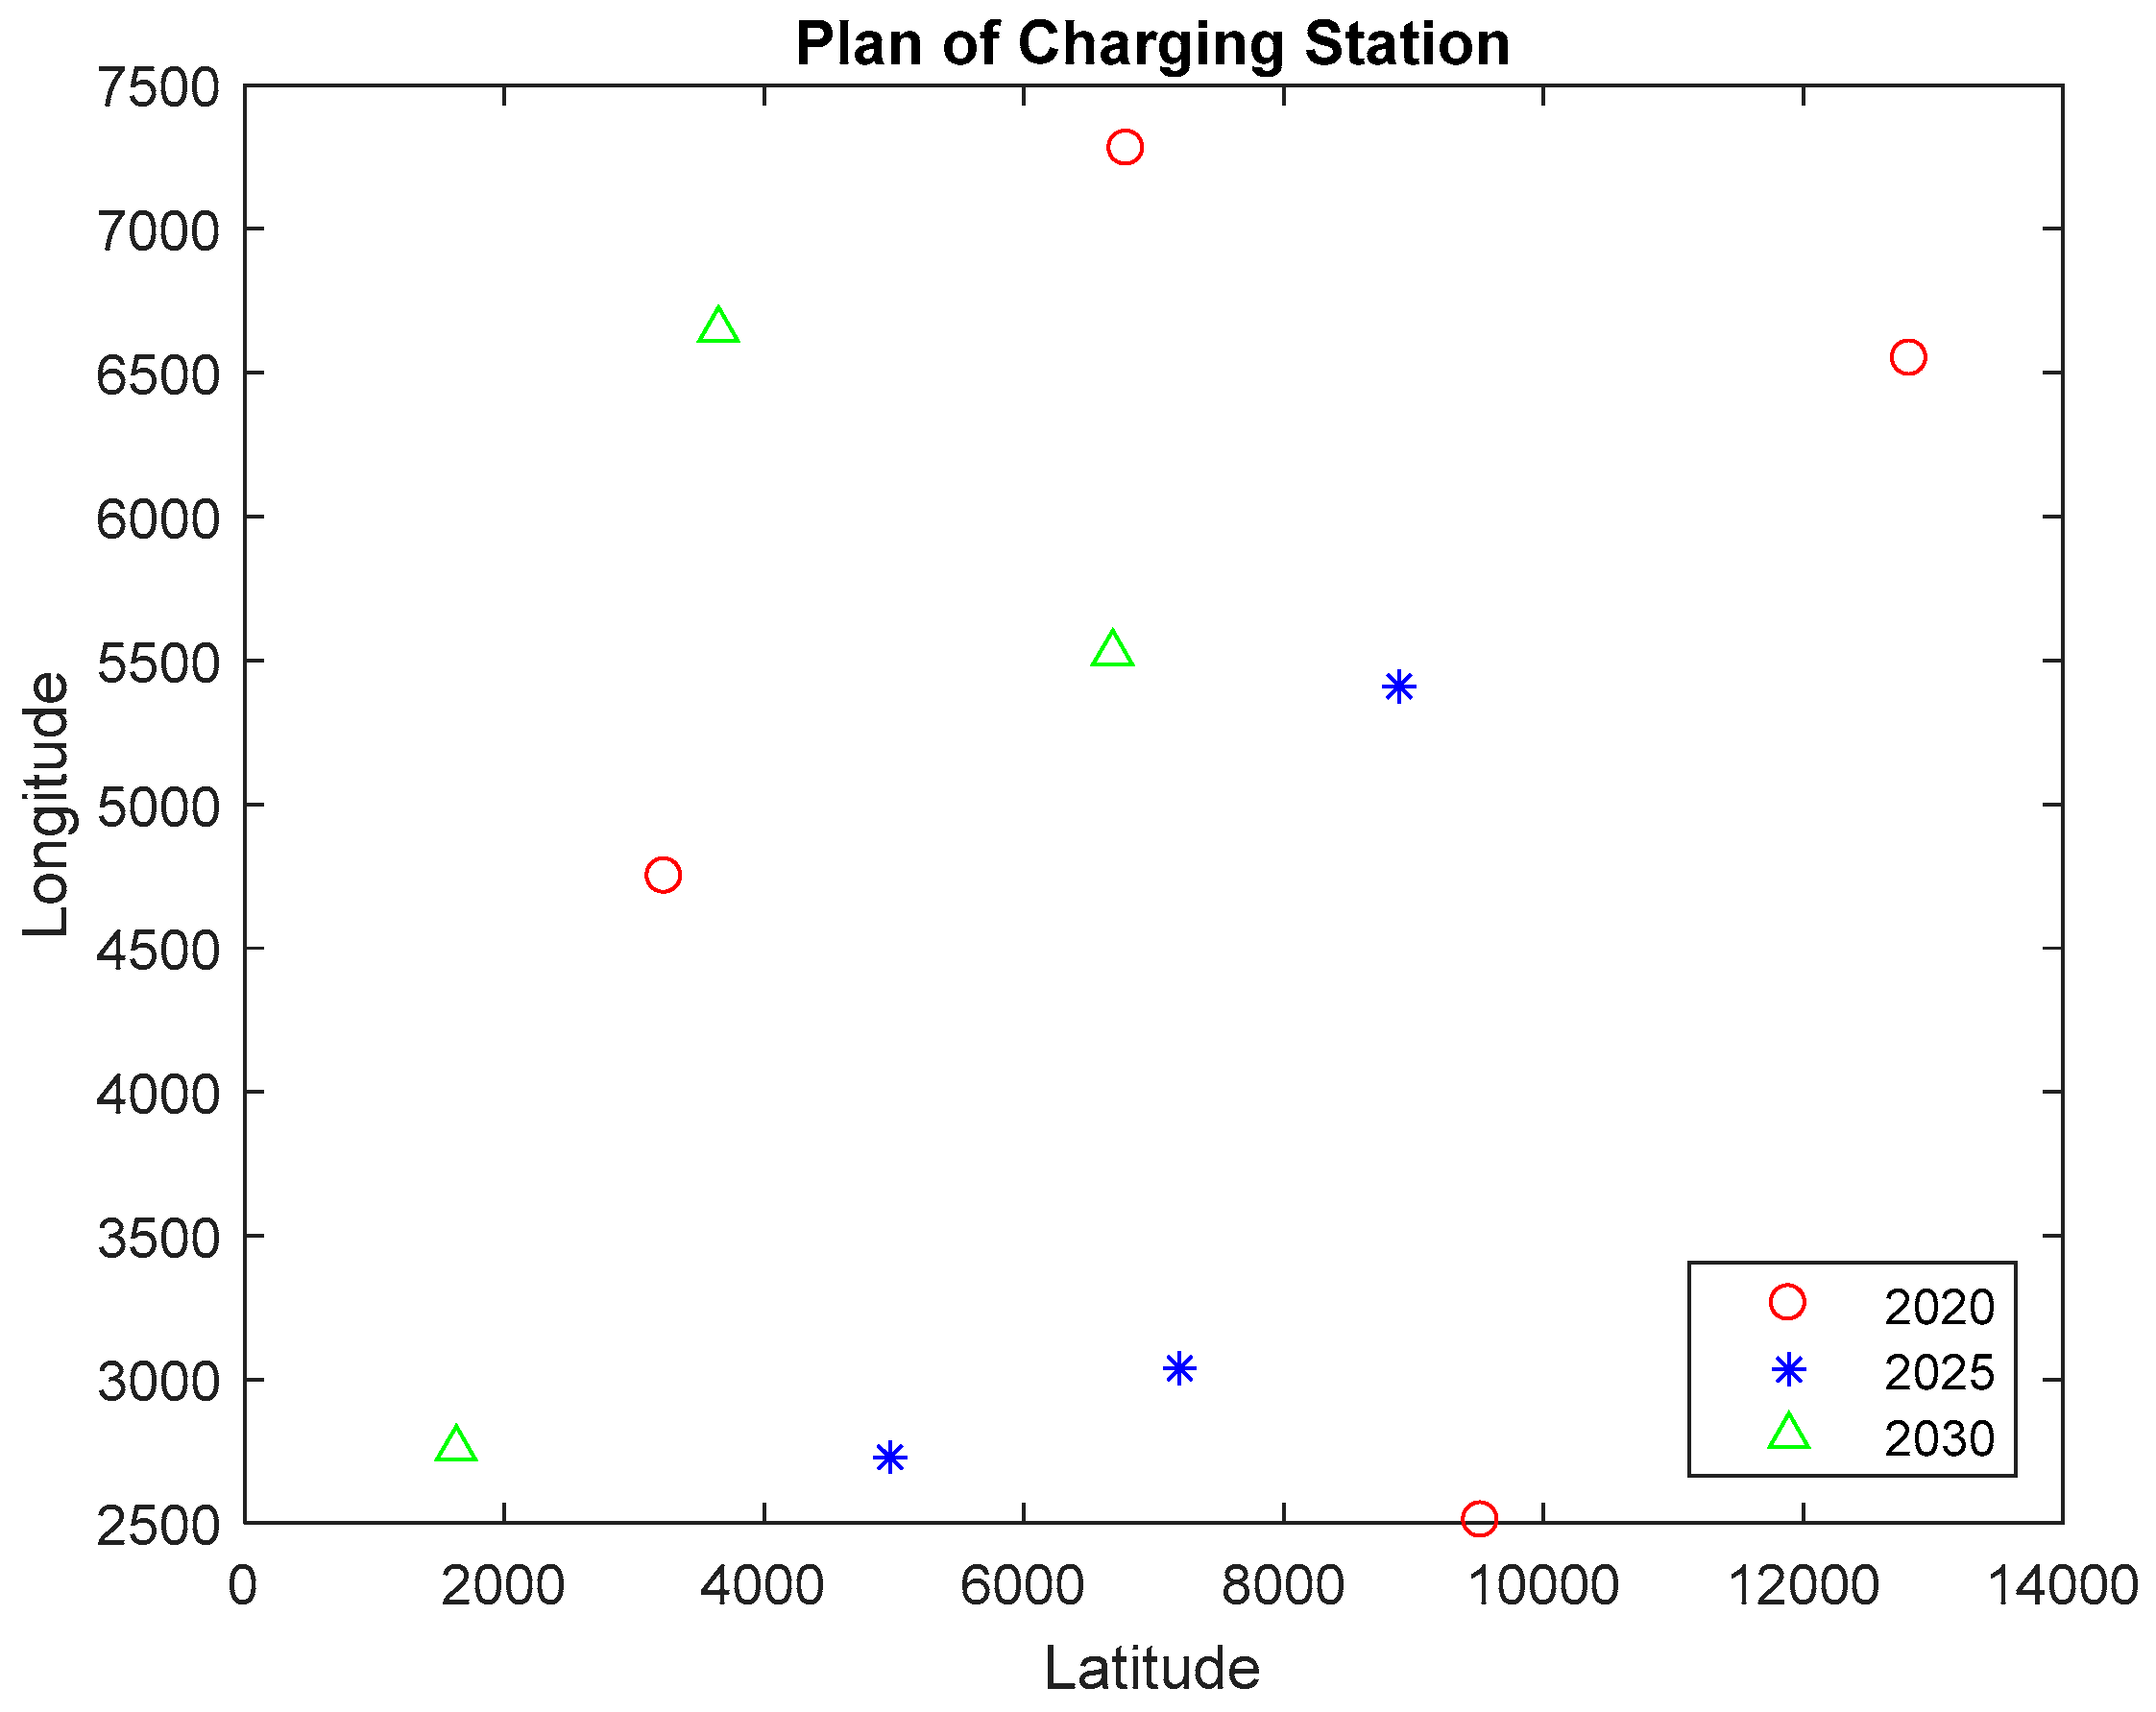
Compared with the method described in this paper, the plan of the government has a reduced utilization ratio in most of the planning points. Only No. 1 and No. 9 in 2030, adopted by the government, have a higher utilization ratio than the method we have developed. The optimal locations of the charging stations are presented in Figure 8.
In this figure, the red points are the charging stations to be built in 2020. The blue points are to be built in 2025. The green points are to be built in 2030. According to previous tables about the details of the charging stations, the utilization ratios are from 30 to 50%, which is a high level for each charging station. It also keeps the balance for the charging stations. There are no significantly lower utilization ratios and no significantly higher utilization ratios, which means that it is not possible that all drivers of electric vehicles swarm into one or two charging stations while other charging stations are vacant.
5. Conclusions
In this paper, a new idea is proposed to plan charging stations in a certain city. First, we built a model based on BASS to predict the penetration of electric vehicles and the demand of charging stations in the coming years, which is based on the economically developed rules. In the BASS model, we assume that the number of buyers can directly reflect consumption. According to the BASS model, the number of buyers can be influenced by the people who have bought a new product and by information from the Internet and the judgement of other people. In this model, the innovation coefficient p and the imitation coefficient q can be calculated using historical data in this city. Moreover, according to the prediction of electric vehicles, we developed a queuing model to optimize the distribution of the charging stations. In this work, we calculated the size of the charging stations and their locations. This model regarded the minimum cost, including transportation cost and operation cost, as the objective function. We also found some factors as constraints, like the capacity of the vehicles, the load of charging stations, and the load of the power grid.
Compared with real data from the government, the predicted results are relatively accurate. The difference between real data and predicted data on the penetration of electric vehicles is about 1% for 2014 and 2015. Thus, the power demand for electric vehicles is reliably calculated. The utilization ratios calculated by the method in this paper are better than the plan of government. At the same time, it also keeps the balance for charging stations, as there are no significantly lower utilization ratios and no significantly higher utilization ratios, which can reduce the costs for users and operation bureaus.
The deployment of electric vehicles is very important for cities in the future, and the optimal size and location of charging stations are the foundation for this program. In future work, we plan to develop a complex method to optimize the locations of the charging stations. Perhaps we can introduce machine learning and big data into this work as it is profitable for various cities to have different programs according to their specific conditions.
Author Contributions
Methodology, L.Z.; Writing–original draft, J.M.
Funding
This research was funded by Natural Foundation of Jiangsu Province (BK20151201 & BK20160357), Industrial technology innovation projects of Suzhou (SS201525), Ministry of Housing and Urban-Rural Development of the People’s Republic of China (NO. 2015-K5-027 and 2013-K5-27), the Construction System of Jiangsu Province (NO. 2014ZD86), Suzhou University of Science and Technology Youth Fund (NO. XKQ201403 and XKQ201508).
Acknowledgments
The authors would like to convey their appreciation and gratitude to the anonymous reviewers. Their remarks and suggestions were extremely insightful and enabled us to improve the quality of this manuscript.
Conflicts of Interest
The authors declare no conflict of interest.
References
- Yagcitekin, B.; Uzunoglu, M.; Karakas, A. A new deployment method for electric vehicle charging infrastructure. Turk. J. Electr. Eng. Comput. Sci. 2015, 24, 1292–1305. [Google Scholar] [CrossRef]
- Hatton, C.E.; Beella, S.K.; Brezet, J.C.; Wijnia, Y. Charging Stations for Urban Settings the design of a product platform for electric vehicle infrastructure in Dutch cities. World Electr. Veh. J. 2009, 3, 1–13. [Google Scholar] [CrossRef]
- Sweda, T.; Klabjan, D. An agent-based decision support system for electric vehicle charging infrastructure deployment. In Proceedings of the 2011 IEEE Vehicle Power and Propulsion Conference, Chicago, IL, USA, 6–9 September 2011. [Google Scholar]
- Li, Z.; Ouyang, M. The pricing of charging for electric vehicles in China—Dilemma and solution. Energy 2011, 36, 5765–5778. [Google Scholar] [CrossRef]
- Wang, H.; Huang, Q.; Zhang, C.; Xia, A. A novel approach for the layout of electric vehicle charging station. In Proceedings of the 2010 IEEE International Conference on Apperceiving Computing and Intelligence Analysis Proceeding, Chengdu, China, 17–19 December 2010. [Google Scholar]
- Nansai, K.; Tohno, S.; Kono, M.; Kasahara, M.; Moriguchi, Y. Life-cycle analysis of charging infrastructure for electric vehicles. Appl. Energy 2001, 70, 251–265. [Google Scholar] [CrossRef]
- Schroeder, A.; Traber, T. The economics of fast charging infrastructure for electric vehicles. Energy Policy 2012, 43, 136–144. [Google Scholar] [CrossRef]
- Anegawa, T. Desirable Characteristics of Public Quick Charger; Tokyo Electric Power Company: Tokyo, Japan, 2011. [Google Scholar]
- Chen, Z.; Xiong, R.; Wang, K.; Jiao, B. Optimal energy management strategy of a plug-in hybrid electric vehicle based on a particle swarm optimization algorithm. Energies 2015, 8, 3661–3678. [Google Scholar] [CrossRef]
- Åhman, M. Government policy and the development of electric vehicles in japan. Energy Policy 2006, 34, 433–443. [Google Scholar] [CrossRef]
- Skerlos, S.J.; Winebrake, J.J. T argeting plug-in hybrid electric vehicle policies to increase social benefits. Energy Policy 2010, 38, 705–708. [Google Scholar] [CrossRef]
- Schey, S.L.; Smart, J.G.; Scoffield, D.R. A first look at the impact of electric vehicle charging on the electric grid in the EV project. World Electr. Veh. J. 2012, 5, 667–678. [Google Scholar] [CrossRef]
- Shukla, A.; Pekny, J.; Venkatasubramanian, V. An optimization framework for cost effective design of refueling station infrastructure for alternative fuel vehicles. Comput. Chem. Eng. 2011, 35, 1431–1438. [Google Scholar] [CrossRef]
- Wang, Y.W. An optimal location choice model for recreation-oriented scooter recharge stations. Transp. Res. Part D Transp. Environ. 2007, 12, 231–237. [Google Scholar] [CrossRef]
- Mu, Y.; Wu, J.; Jenkins, N.; Jia, H.; Wang, C. A spatial–temporal model for grid impact analysis of plug-in electric vehicles. Appl. Energy 2014, 114, 456–465. [Google Scholar] [CrossRef]
- Wang, Z.; Huang, B.; Xu, Y.; Li, W. Optimization of Series Hybrid Electric Vehicle Operational Parameters by Simulated Annealing Algorithm. In Proceedings of the 2007 IEEE International Conference on Control and Automation, Guangzhou, China, 30 May–1 June 2007; pp. 1536–1541. [Google Scholar]
- Shojaabadi, S.; Abapour, S.; Abapour, M.; Nahavandi, A. Optimal planning of plug-in hybrid electric vehicle charging station in distribution network considering demand response programs and uncertainties. IET Gener. Transm. Distrib. 2016, 10, 3330–3340. [Google Scholar] [CrossRef]
- Mendoza, C.C.; Quintero, A.M.; Santamaria, F.; Alarcon, J.A. Methodology to manage electric vehicles charging in real-time. IEEE Lat. Am. Trans. 2016, 14, 782–791. [Google Scholar] [CrossRef]
- Alhelou, H.S.H.; Golshan, M.E.H.; Fini, M.H. Multi agent electric vehicle control based primary frequency support for future smart micro-grid. In Proceedings of the 2015 Smart Grid Conference (SGC), Tehran, Iran, 22–23 December 2015; pp. 22–27. [Google Scholar]
- Alhelou, H.H.; Golshan, M.E.H. Hierarchical plug-in EV control based on primary frequency response in interconnected smart grid. In Proceedings of the 2016 24th Iranian Conference on Electrical Engineering, Shiraz, Iran, 10–12 May 2016; pp. 561–566. [Google Scholar]
- Alhelou, H.H.; Golshan, M.H.; Askari-Marnani, J. Robust sensor fault detection and isolation scheme for interconnected smart power systems in presence of RER and EVs using unknown input observer. Int. J. Electr. Power Energy Syst. 2018, 99, 682–694. [Google Scholar] [CrossRef]
- Makdisie, C.; Haidar, B.; Alhelou, H.H. An Optimal Photovoltaic Conversion System for Future Smart Grids. In Handbook of Research on Power and Energy System Optimization; IGI Global: Hershey, PA, USA, 2018; pp. 601–657. [Google Scholar]
- Wei, L.; Zhang, Z.; Zhang, D.; Leung, S.C.H. A simulated annealing algorithm for the capacitated vehicle routing problem with two-dimensional loading constraints. Eur. J. Oper. Res. 2018, 265, 843–859. [Google Scholar] [CrossRef]
- Lee, B.J.; Lee, S.; Im, D.Y.; Kim, H.J.; Park, G.L.; Lee, J. Tour and charging scheduler development based on simulated annealing for electric vehicles. Commun. Comput. Inf. Sci. 2012, 353, 189–194. [Google Scholar]
- Mehar, S.; Senouci, S.M. An optimization location scheme for electric charging stations. In Proceedings of the 2013 International Conference on Smart Communications in Network Technologies (SaCoNeT), Paris, France, 17–19 June 2013; Volume 01, pp. 1–5. [Google Scholar]
- Lam, A.Y.S.; Leung, Y.W.; Chu, X. Electric vehicle charging station placement: Formulation, complexity, and solutions. IEEE Trans. Smart Grid 2017, 5, 2846–2856. [Google Scholar] [CrossRef]
- Jia, H.P.; Liu, S.G.; Xie, S.L.; Huang, S.L.; Pei, S.T. The location model of the electric vehicle charging station based on simulated annealing algorithm. Adv. Mater. Res. 2013, 805–806, 1895–1899. [Google Scholar] [CrossRef]
- Yan, T.; Qiu, X.; Liu, Y.; Tang, K.; Wan, C. Optimal planning of electric vehicle charging station based on psosa algorithm. Electr. Meas. Instrum. 2017, 133, 70–78. [Google Scholar]
- Dong, J.; Liu, C.; Lin, Z. Charging infrastructure planning for promoting battery electric vehicles: An activity-based approach using multiday travel data. Transp. Res. Part C 2014, 38, 44–55. [Google Scholar] [CrossRef]
- Gonzalez, J.; Alvaro, R.; Gamallo, C.; Fuentes, M.; Fraile-Ardanuy, J.; Knapen, L.; Janssens, D. Determining electric vehicle charging point locations considering drivers’ daily activities. Procedia Comput. Sci. 2014, 32, 647–654. [Google Scholar] [CrossRef]
- Liu, Z.; Wen, F.; Ledwich, G. Optimal planning of electric-vehicle charging stations in distribution systems. IEEE Trans. Power Deliv. 2013, 28, 102–110. [Google Scholar] [CrossRef]
- Datta, A.; Ledbetter, B.K.; Rahman, M.A. Optimal Deployment of Charging Stations for Electric Vehicles: A Formal Approach. In Proceedings of the 2017 IEEE 37th International Conference on Distributed Computing Systems Workshops (ICDCSW), Atlanta, GA, USA, 5–8 June 2017; pp. 83–90. [Google Scholar]
- Sadeghi-Barzani, P.; Rajabi-Ghahnavieh, A.; Kazemi-Karegar, H. Optimal fast charging station placing and sizing. Appl. Energy 2014, 125, 289–299. [Google Scholar] [CrossRef]
- Chen, S.; Shi, Y.; Chen, X.; Qi, F. Optimal location of electric vehicle charging stations using genetic algorithm. In Proceedings of the 2015 IEEE 17th Asia-Pacific Network Operations and Management Symposium (APNOMS), Busan, South Korea, 19–21 August 2015; pp. 372–375. [Google Scholar]
- Ge, S.; Feng, L.; Liu, H. The planning of electric vehicle charging station based on grid partition method. In Proceedings of the 2011 IEEE International Conference on Electrical and Control Engineering, Yichang, China, 16–18 September 2011; pp. 2726–2730. [Google Scholar]
- Suganya, S.; Charles Raja, S.; Venkatesh, P. Smart management of distinct plug-in hybrid electric vehicle charging stations considering mobility pattern and site characteristics. Int. J. Energy Res. 2017, 41, 2268–2281. [Google Scholar] [CrossRef]
- Dodds, W. An application of the Bass model in long-term new product forecasting. J. Mark. Res. 1973, 10, 308–311. [Google Scholar] [CrossRef]
- Chunyang, W.U.; Canbing, L.I.; Li, D.U.; Cao, Y. A method for electric vehicle charging infrastructure planning. Autom. Electr. Power Syst. 2010, 34, 36–39. [Google Scholar]
- Tian, L.; Shi, S.; Zhuo, J. A statistical model for charging power demand of electric vehicles. Power Syst. Technol. 2010, 34, 126–130. [Google Scholar]
- Lui, F.T. An equilibrium queuing model of bribery. J. Political Econ. 1985, 93, 760–781. [Google Scholar] [CrossRef]
- Zhenhua, S. Research on Parameter Estimation of BASS Model. J. Shanxi Inst. Econ. Manag. 2009, 17, 51–53. [Google Scholar]
- Becker, T.A.; Tenderich, B.; Sidhu, I. Electric Vehicles in the United States: A New Model with Forecasts to 2030; Center for Entrepreneurship and Technology, University of California: Berkeley, CA, USA, 2009. [Google Scholar]
- Romero, R.; Monticelli, A. A zero-one implicit enumeration method for optimizing investments in transmission expansion planning. IEEE Trans. Power Syst. 1994, 9, 1385–1391. [Google Scholar] [CrossRef]
Figure 1.
Industry chain of electric vehicles.

Figure 2.
Flow chart detailing the programming of the charging station.

Figure 3.
Nodes of the power distribution network.

Figure 4.
Innovation coefficient (p).

Figure 5.
Coefficient of imitation (q).

Figure 6.
Potential sales of electric vehicles.

Figure 7.
Penetration of electric vehicles.

Figure 8.
The optimal location of charging stations in 2020, 2025, and 2030.


Table 1.
The general situation for the GDP and the penetration of vehicles.
| Year | GDP (Yuan) | Penetration of Private Vehicles (in Thousands) | Penetration of All Vehicles (in Thousands) |
|---|---|---|---|
| 1995 | 724 | 2.942 | 8.763 |
| 1996 | 932 | 3.570 | 10.759 |
| 1997 | 1089 | 4.762 | 13.562 |
| 1998 | 1176 | 5.987 | 18.363 |
| 1999 | 1253 | 7.857 | 21.762 |
| 2000 | 1371 | 10.876 | 29.472 |
| 2001 | 1512 | 12.384 | 37.762 |
| 2002 | 1670 | 19.786 | 48.342 |
| 2003 | 1848 | 26.786 | 56.234 |
| 2004 | 2232 | 35.834 | 71.492 |
| 2005 | 2850 | 45.734 | 93.234 |
| 2006 | 3292 | 56.590 | 109.838 |
| 2007 | 3823 | 67.987 | 138.662 |
| 2008 | 4452 | 76.379 | 176.587 |
| 2009 | 5148 | 89.432 | 232.759 |
| 2010 | 5743 | 114.258 | 283.789 |
Table 2.
The general situation of the candidate locations.
| Candidate Location Number | Geodetic Coordinates | Vehicle Flow (Thousand/Day) | Land Price (Yuan/m2) | Ratio of Entering Stations (%) | |
|---|---|---|---|---|---|
| X (meter) | Y (meter) | ||||
| 1 | 9520 | 2510 | 18.190 | 6800 | 0.018 |
| 2 | 7200 | 3040 | 22.780 | 6800 | 0.016 |
| 3 | 4970 | 2730 | 15.130 | 4700 | 0.019 |
| 4 | 1630 | 2760 | 10.200 | 3500 | 0.028 |
| 5 | 12,820 | 6550 | 11.050 | 3200 | 0.023 |
| 6 | 8890 | 5410 | 18.360 | 6100 | 0.029 |
| 7 | 6790 | 7280 | 13.090 | 4300 | 0.025 |
| 8 | 3650 | 6650 | 11.730 | 2800 | 0.031 |
| 9 | 3235 | 4749 | 11.050 | 3500 | 0.023 |
| 10 | 6683 | 5527 | 18.360 | 4300 | 0.019 |
| 11 | 5954 | 8497 | 13.090 | 2800 | 0.025 |
Table 3.
The general situation of the power stations.
| Number of Node | KVA (in MVA) | Geodetic Coordinates | |
|---|---|---|---|
| X (meter) | Y (meter) | ||
| 1 | 2*50 | 7747 | 2266 |
| 2 | 2*31.5 | 9600 | 7252 |
| 3 | 2*40 | 3734 | 4635 |
Table 4.
The loading data of the nodes.
| Node Number | Active Power (km) | Reactive Power | Node Number | Active Power | Reactive Power |
|---|---|---|---|---|---|
| 4 | 550 | 500 | 22 | 428 | 179 |
| 5 | 600 | 370 | 23 | 298 | 217 |
| 6 | 840 | 769 | 24 | 428 | 179 |
| 7 | 910 | 787 | 25 | 478 | 412 |
| 8 | 349 | 234 | 26 | 100 | 80 |
| 9 | 873 | 549 | 27 | 140 | 123 |
| 10 | 523 | 783 | 28 | 397 | 238 |
| 11 | 739 | 472 | 29 | 534 | 340 |
| 12 | 234 | 123 | 30 | 342 | 298 |
| 13 | 432 | 238 | 31 | 298 | 217 |
| 14 | 532 | 423 | 32 | 297 | 232 |
| 15 | 297 | 232 | 33 | 534 | 340 |
| 15 | 534 | 340 | 34 | 342 | 298 |
| 17 | 342 | 298 | 35 | 298 | 217 |
| 18 | 298 | 217 | 36 | 428 | 179 |
| 19 | 428 | 179 | 37 | 478 | 412 |
| 20 | 478 | 412 | 38 | 450 | 313 |
| 21 | 732 | 539 | 39 | 298 | 179 |
Table 5.
The impedance and limitation of electric currents.
| Line | Impedance (Ω) | Reactance (Ω) | dBμA (A) | Line | Impedance (Ω) | Reactance (Ω) | dBμA (A) |
|---|---|---|---|---|---|---|---|
| (1,4) | 0.1357 | 0.0724 | 445 | (21,22) | 0.2377 | 0.1236 | 380 |
| (4,5) | 0.1357 | 0.0724 | 445 | (3,23) | 0.0783 | 0.0392 | 445 |
| (1,6) | 0.1357 | 0.0724 | 445 | (23,24) | 0.6591 | 0.3164 | 380 |
| (6,7) | 0.1357 | 0.0724 | 445 | (24,25) | 0.1999 | 0.1000 | 380 |
| (7,8) | 0.0970 | 0.0517 | 380 | (24,26) | 0.7871 | 0.4093 | 380 |
| (1,9) | 0.1357 | 0.0724 | 510 | (3,27) | 0.1465 | 0.0762 | 445 |
| (9,10) | 0.1357 | 0.0724 | 510 | (27,28) | 0.2377 | 0.1141 | 380 |
| (10,11) | 0.0970 | 0.0517 | 380 | (3,29) | 0.0783 | 0.0376 | 445 |
| (1,12) | 0.1323 | 0.0647 | 510 | (29,30) | 0.6591 | 0.3427 | 380 |
| (12,13) | 0.2200 | 0.1080 | 445 | (30,31) | 0.1999 | 0.1000 | 380 |
| (13,14) | 0.1630 | 0.3076 | 380 | (2,32) | 0.7871 | 0.3778 | 380 |
| (1,15) | 0.1483 | 0.0771 | 510 | (32,33) | 0.1037 | 0.0539 | 380 |
| (3,16) | 0.1037 | 0.0539 | 510 | (2,34) | 0.1978 | 0.0950 | 380 |
| (16,17) | 0.1978 | 0.0989 | 445 | (34,35) | 0.0862 | 0.0448 | 380 |
| (17,18) | 0.0862 | 0.0448 | 380 | (35,36) | 0.1674 | 0.0804 | 380 |
| (18,19) | 0.1674 | 0.0804 | 380 | (2,37) | 0.2492 | 0.1296 | 445 |
| (3,20) | 0.2492 | 0.1246 | 445 | (37,38) | 0.1999 | 0.1000 | 445 |
| (20,21) | 0.1465 | 0.0703 | 380 | (37,39) | 0.7871 | 0.3936 | 445 |
Table 6.
Needed charging power of electric vehicles.
| Name | 2020 | 2025 | 2030 | 2035 | 2040 |
|---|---|---|---|---|---|
| EV penetration based on predicted data (in thousands) | 177.6925302 | 308.2462423 | 473.2200311 | 756.7969461 | 946.1633827 |
| Needed charging power () | 1332.694 | 2311.847 | 3549.15 | 5675.977 | 7096.225 |
Table 7.
The compared results between actual data and predicted data.
| Name | 2011 | 2012 | 2013 | 2014 | 2015 |
|---|---|---|---|---|---|
| EV penetration based on actual data (in thousands) | 23.529304 | 37.844535 | 52.14545 | 68.133245 | 84.224534 |
| EV penetration based on predicted data (in thousands) | 23.703124 | 38.039423 | 52.698231 | 68.93842 | 85.402853 |
| Errors (%) | 0.007387 | 0.00515 | 0.010601 | 0.011818 | 0.01399 |
Table 8.
Level specifications of charging stations.
| Rank | Number of Superchargers | Covered Area (m2) |
|---|---|---|
| 1 | >25 | 900 |
| 2 | 15–25 | 450 |
| 3 | 8–14 | 280 |
| 4 | <8 | 160 |
Table 9.
Time cost for a single charging station (in RMB/h).
| Operating Cost | Depreciation Cost | Human Cost | Total Cost |
|---|---|---|---|
| 15 | 50.5 | 7.5 | 73 |
Table 10.
Plan for charging stations in 2020.
| Time (year) | Candidate Charging Stations | Connected Number of Nodes | Utilization Ratio |
|---|---|---|---|
| 2020 | 1 | 10 | 41.5% |
| 2020 | 5 | 38 | 30.45% |
| 2020 | 9 | 3 | 44.47% |
| 2020 | 7 | 2 | 42.05% |
Table 11.
Plan for the charging station.
| Time (year) | Candidate Charging Stations | Connected Number of Nodes | Utilization Ratio |
|---|---|---|---|
| 2025 | 2 | 1 | 43.5% |
| 2025 | 3 | 1 | 30.4% |
| 2025 | 6 | 39 | 45.8% |
Table 12.
Plan for the charging station.
| Time (year) | Candidate Charging Stations | Connected Number of Nodes | Utilization Ratio |
|---|---|---|---|
| 2030 | 4 | 32 | 38.3% |
| 2030 | 8 | 25 | 40.2% |
| 2020 | 10 | 16 | 36.5% |
Table 13.
Plan of the government for the charging stations.
| Time (year) | Candidate Charging Stations | Connected Number of Nodes | Utilization Ratio |
|---|---|---|---|
| 2020 | 3 | 1 | 37.5% |
| 2020 | 4 | 32 | 30.4% |
| 2020 | 5 | 38 | 38.8% |
| 2020 | 7 | 2 | 32.4% |
| 2025 | 6 | 39 | 41.5% |
| 2025 | 8 | 25 | 33.4% |
| 2025 | 10 | 16 | 40.8% |
| 2025 | 11 | 5 | 38% |
| 2030 | 1 | 1 | 38.3% |
| 2030 | 2 | 10 | 40.2% |
| 2030 | 9 | 3 | 37.5% |
© 2018 by the authors. Licensee MDPI, Basel, Switzerland. This article is an open access article distributed under the terms and conditions of the Creative Commons Attribution (CC BY) license (http://creativecommons.org/licenses/by/4.0/).
Share and Cite
MDPI and ACS Style
Ma, J.; Zhang, L. A Deploying Method for Predicting the Size and Optimizing the Location of an Electric Vehicle Charging Stations. Information 2018, 9, 170. https://doi.org/10.3390/info9070170
AMA Style
Ma J, Zhang L. A Deploying Method for Predicting the Size and Optimizing the Location of an Electric Vehicle Charging Stations. Information. 2018; 9(7):170. https://doi.org/10.3390/info9070170
Chicago/Turabian StyleMa, Jian, and Liyan Zhang. 2018. "A Deploying Method for Predicting the Size and Optimizing the Location of an Electric Vehicle Charging Stations" Information 9, no. 7: 170. https://doi.org/10.3390/info9070170
Note that from the first issue of 2016, this journal uses article numbers instead of page numbers. See further details here.