Article

A Study of a Health Resources Management Platform Integrating Neural Networks and DSS Telemedicine for Homecare Assistance

1
Dyrecta Lab srl, Vescovo Simplicio 45, 70014 Conversano (BA), Italy
2
Assistenza Socio Sanitaria S.C.S.P.A.-Villa Puricelli, Piazza Puricelli 2, 21020 Bodio Lomnago (VA), Italy
*
Author to whom correspondence should be addressed.
Information 2018, 9(7), 176; https://doi.org/10.3390/info9070176
Submission received: 20 June 2018 / Revised: 6 July 2018 / Accepted: 6 July 2018 / Published: 19 July 2018
(This article belongs to the Special Issue eHealth and Artificial Intelligence)

Abstract

:
The proposed paper is related to a case of study of an e-health telemedicine system oriented on homecare assistance and suitable for de-hospitalization processes. The proposed platform is able to transfer efficiently the patient analyses from home to a control room of a clinic, thus potentially reducing costs and providing high-quality assistance services. The goal is to propose an innovative resources management platform (RMP) integrating an innovative homecare decision support system (DSS) based on a multilayer perceptron (MLP) artificial neural network (ANN). The study is oriented in predictive diagnostics by proposing an RMP integrating a KNIME (Konstanz Information Miner) MLP-ANN workflow experimented on blood pressure systolic values. The workflow elaborates real data transmitted via the cloud by medical smart sensors and provides a prediction of the patient status. The innovative RMP-DSS is then structured to enable three main control levels. The first one is a real-time alerting condition triggered when real-time values exceed a threshold. The second one concerns preventative action based on the analysis of historical patient data, and the third one involves alerting due to patient status prediction. The proposed study combines the management of processes with DSS outputs, thus optimizing the homecare assistance activities.

1. Introduction

The reengineering of homecare assistance processes represents an important issue about de-hospitalization. In this direction, resources management platforms (RMPs) could support and optimize the management of nurse and doctor activities, thus reducing unnecessary costs. A good way to manage homecare activities and patient analyses is to design a platform embedding the typical customer relationship management (CRM), enterprise resource planning (ERP), and business process modelling (BPM) facilities, and an innovative decision support system (DSS). The idea is to improve a basic RMP platform through the gain of knowledge provided by a DSS based on data-mining techniques. The knowledge of other important outputs such as key performance indicators (KPIs), scores of the human resources associated with the homecare assistance processes, and other dashboards can furthermore improve resource management and the quality of the patient assistance. In particular, a tailored telemedicine network could facilitate patient control by means of a control room connected in the cloud with smart sensors used by patients at home. The management of nurses can be optimized by analyzing before critical cases such as chronic cases, historical physiological data, and predictive results about patient status emerge. This paper presents a case study, thus providing a feasibility study of a tailored RMP-DSS platform suitable for the management of de-hospitalization processes.
The paper is structured as follows:
  • Description of the background concerning tools useful for the RMP-DSS design;
  • Design and development of homecare telemedicine architecture and the integrated RMP-DSS system;
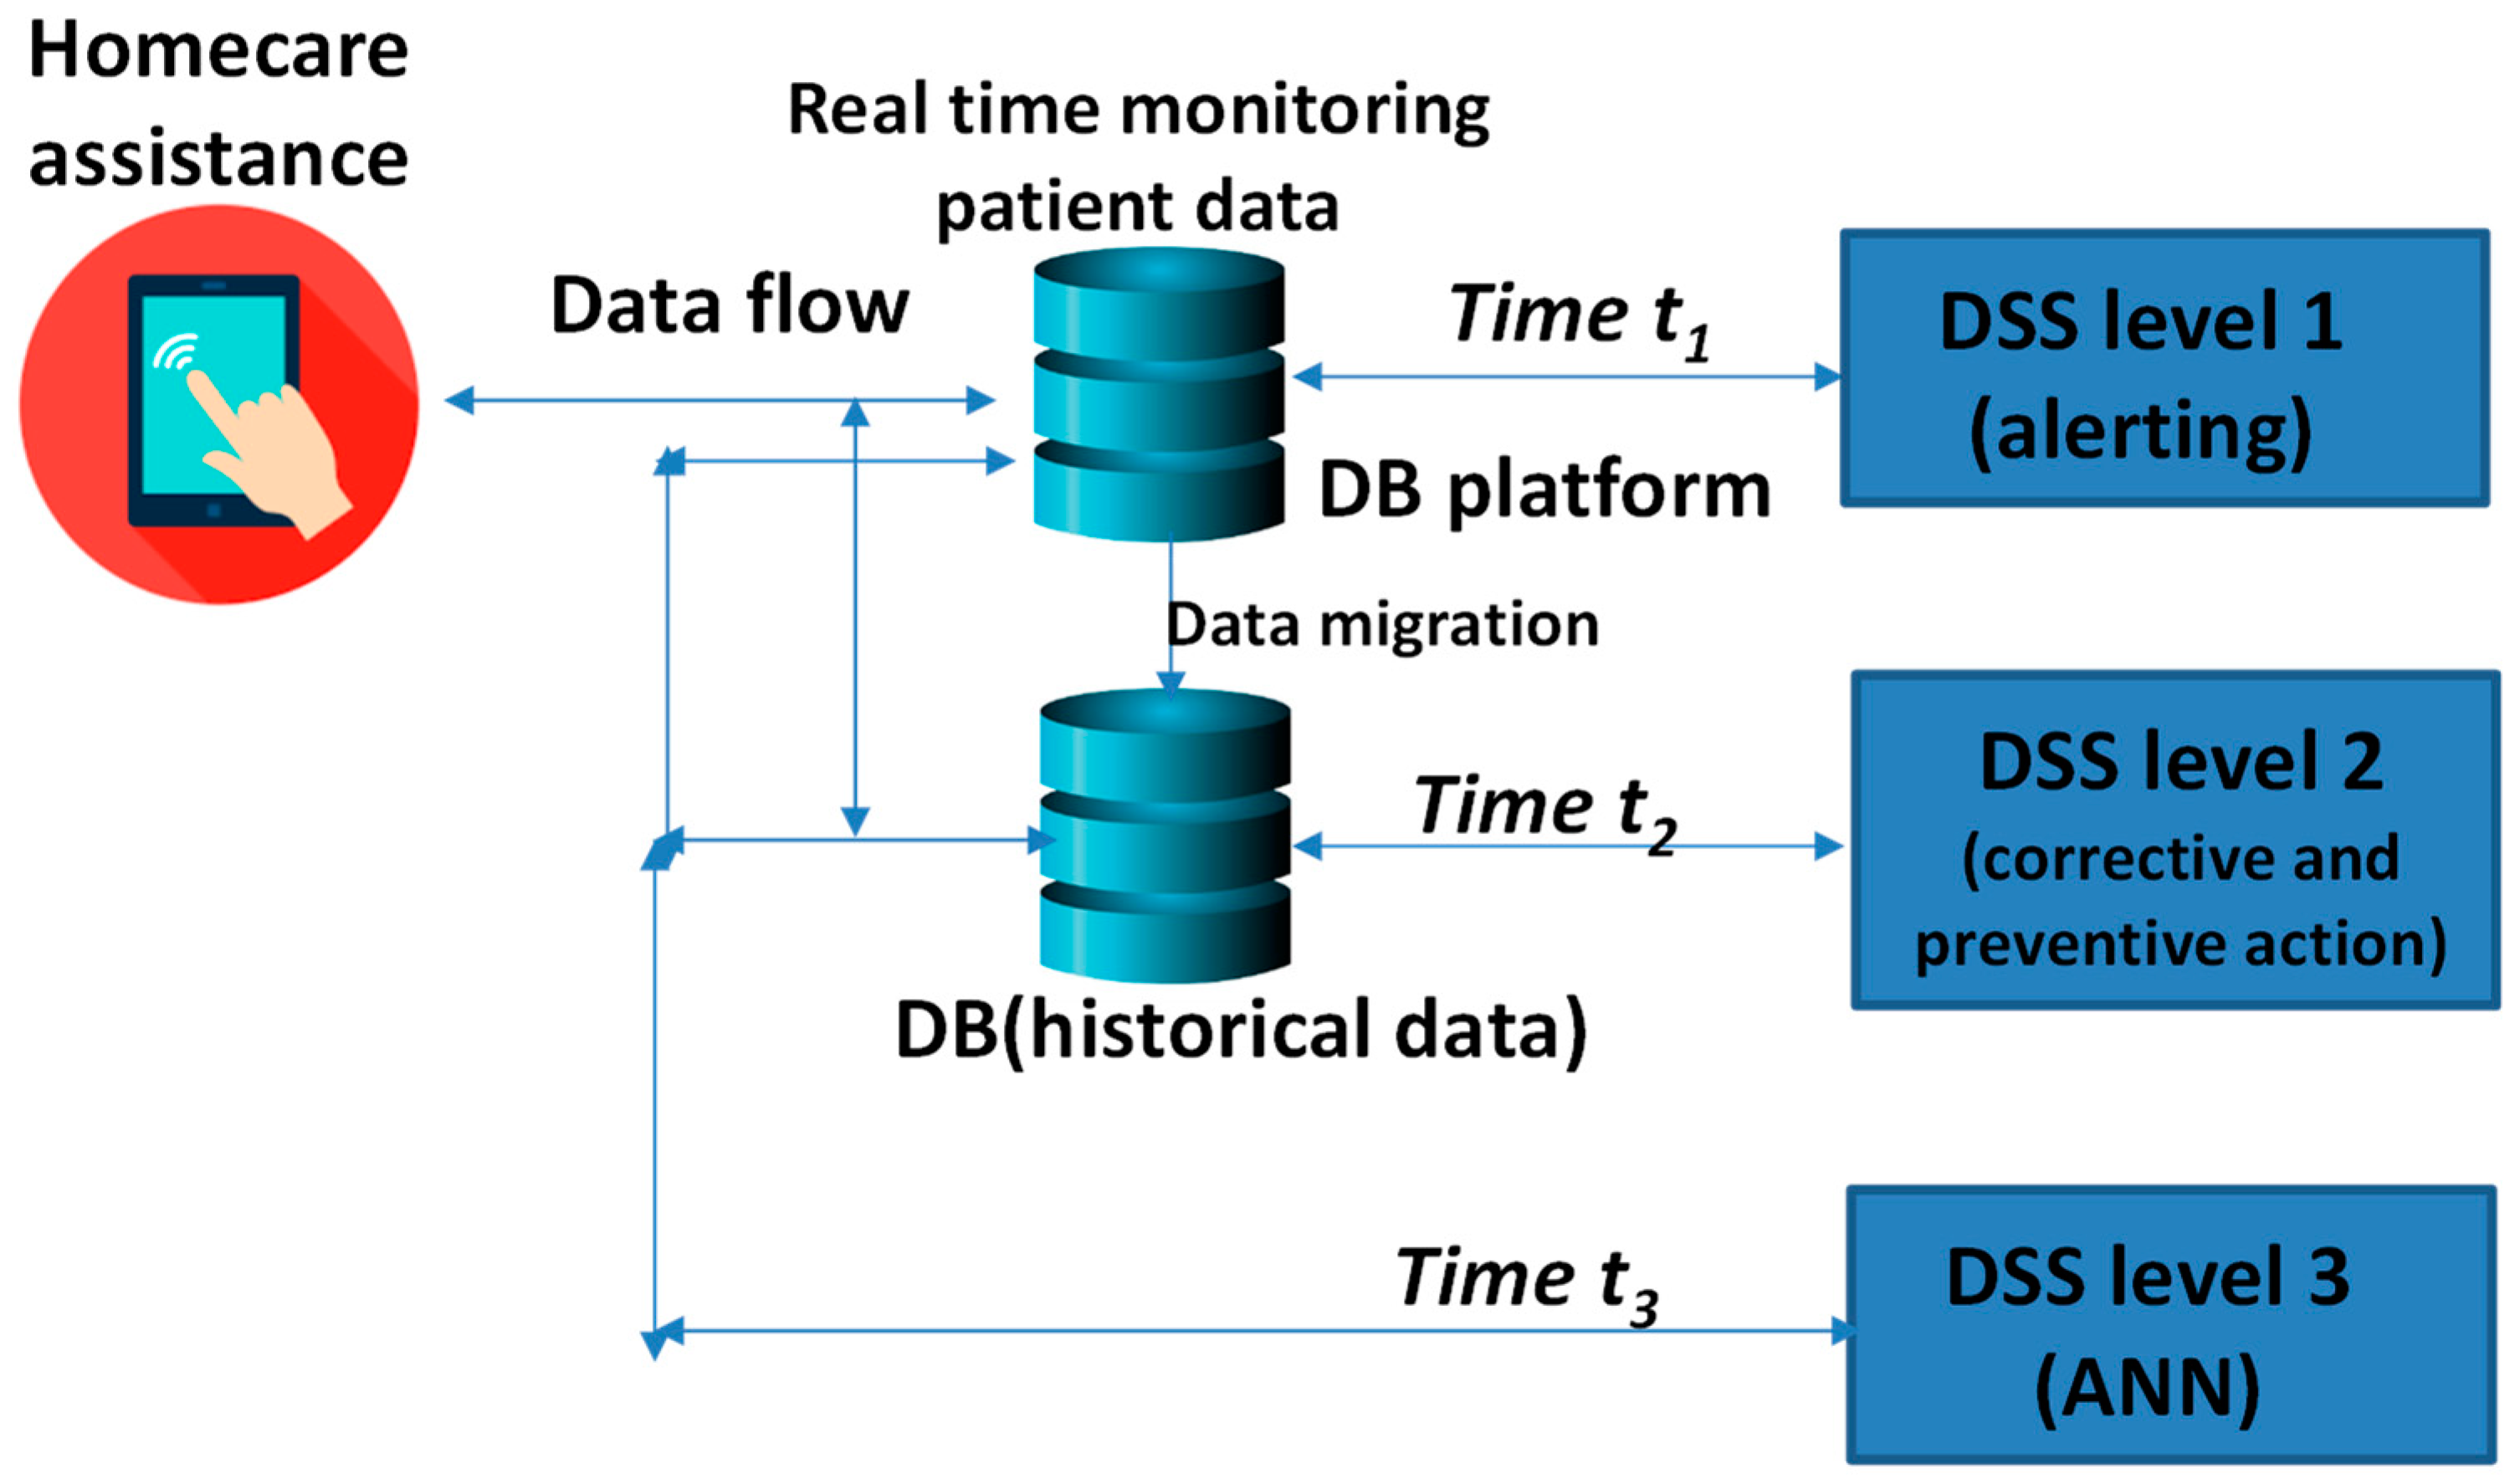
  • Design and development of the innovative multi-level DSS system;
  • Design, development, and testing of a multilayer perceptron (MLP) artificial neural network (ANN) able to predict patient status about high-pressure and hypertension conditions;
  • Definition of correct procedures suited for MLP ANN data processing;
  • Discussions and conclusions.

1.1. Background: Tools and Specifications Useful for RMP-DSS Design

Some researchers [1] have analyzed CRM as a tool suitable for the evaluation of organizational performance in the health industry. The CRM model is composed of important components such as top management information, information technology tools, and organizational procedures—all basic elements useful for resource management of a clinic. The main goals of a CRM health platform are patient and employee satisfaction [1], which can be achieved by an efficient resource management platform. Other studies have validated the use of CRM more specifically for healthcare services embedding DSS tools [2,3]. Moreover, information digitization is increasingly important in the healthcare area, where it is possible to map different working activities by diagrams having different functions and roles such as health-related behavior prevention, diagnosis, and therapy [4]. In DSS healthcare, data mining could provide an added value for the enrichment of the knowledge base of the healthcare system, diagnosis support, home-based rehabilitation, optimal management of healthcare processes, optimization of the quality of services, correct allocation of material and non-material resources, turnover prediction, and definition of new performance indicators based on artificial intelligence algorithms [5,6,7,8,9,10,11,12,13]. In healthcare systems, an interesting topic is homecare assistance by telemedicine [14,15,16], allowing home assistance through the use of appropriate certified devices connected to the cloud and able to transmit patient measurements from home to an external structure behaving as a control room. In this direction, ANN could predict patient physiological status [17], could be applied for predictive medicine [18], and for the prediction of heart problems [19], suggesting ANN as a good approach to predict patient health status in DSS. In particular, ANN applied in other applications exhibited high performances [20], specifically MLP-ANN provided a good match between experimental and predicted results [21], and good flexibility concerning predictive maintenance and big data analytics [22].
Examples of data-mining engines implementing ANN could be based on graphical user interfaces (GUIs) creating objects connected by workflow (Orange Canvas, Rapid Miner, Weka, KNIME Studio [23,24]). Other data-mining applications that can be integrated into backend and frontend platforms are Keras, TensorFlow, and Theano [25,26]. A versatile open source tool is KNIME Studio [22,23,24], which can be easily adapted to the information systems used in the clinics. This last tool contains different objects behaving as connectors compatible with different database technologies including big data and objects able to execute MLP-ANN algorithms.

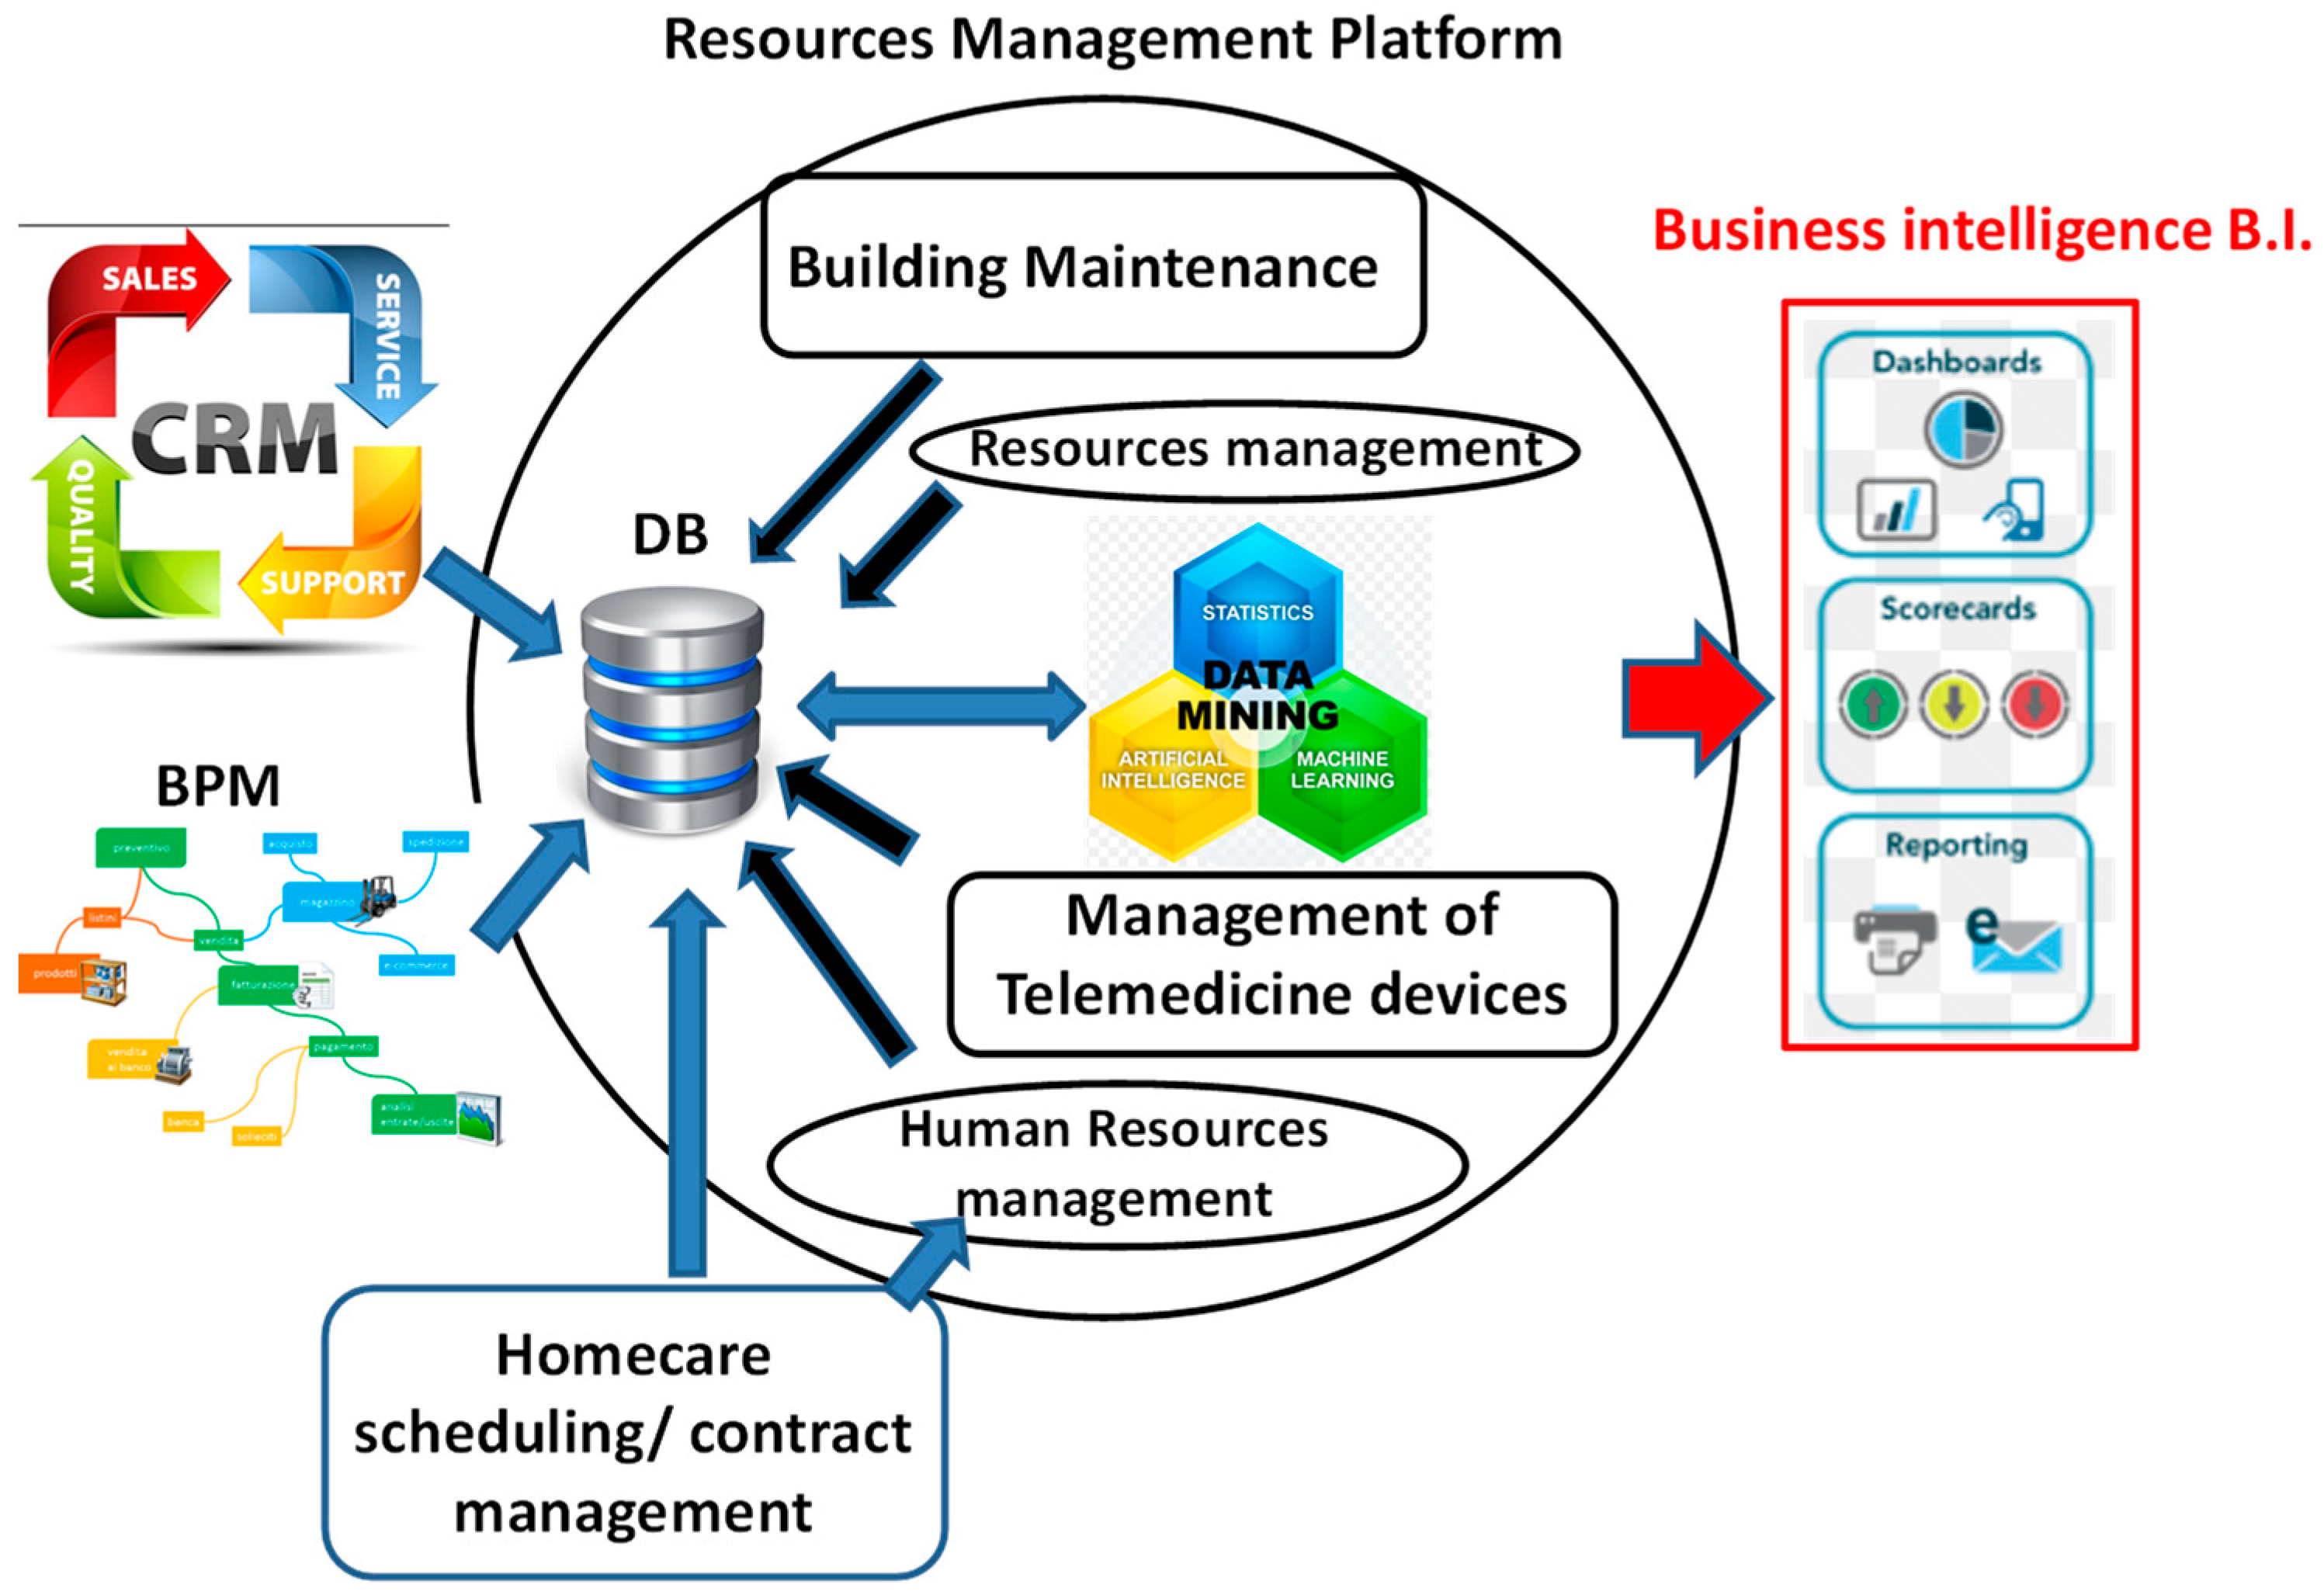
1.2. RMP-DSS Main Features

The main requirements and tools found to be state-of-the-art are formulated in the architecture of Figure 1, summarizing the platform specifications and the complete scenario of resource management.
Below are listed the main specifications of the innovative RPM-DSS prototype system listed as modules:
  • CRM module: this module is useful for the optimization of business intelligence (BI) plans by profiling patients and following management activities.
  • Homecare module: a digital sign system is implemented to speed up homecare activities and visit scheduling.
  • Telemedicine module: some certified medical devices are tested on patients at home; the experimental devices are an ECG (electrocardiogram) device, a spirometer, an infrared thermometer, a pulse oximeter, a device for hematological analysis, a monitoring device of multiple parameters, and a sphygmomanometer device.
  • Building maintenance management module: this module is integrated into the resource management platform and is suitable to plan the maintenance of the building structure thus reducing maintenance costs and increasing comfort of the clinic.
  • Human resources management module: this module is able to allocate human resources by means of a dynamic scheduler indicating activities; the scheduler takes into account the patient profiling and the performance of the companies’ operators provided by scorecards; this module is also adopted for logistics of nurses and operators.
  • Management module for other resources different from human resources (materials, energy, etc.).
  • Database (DB) system: different MySQL database systems are implemented to collect data from multiple modules and from medical devices; this DB system is interfaced with the data-mining engine.
  • Data-mining engine (ANN): this module is implemented and tested by reading the data of the DB system; neural networks are applied to predict patient status.

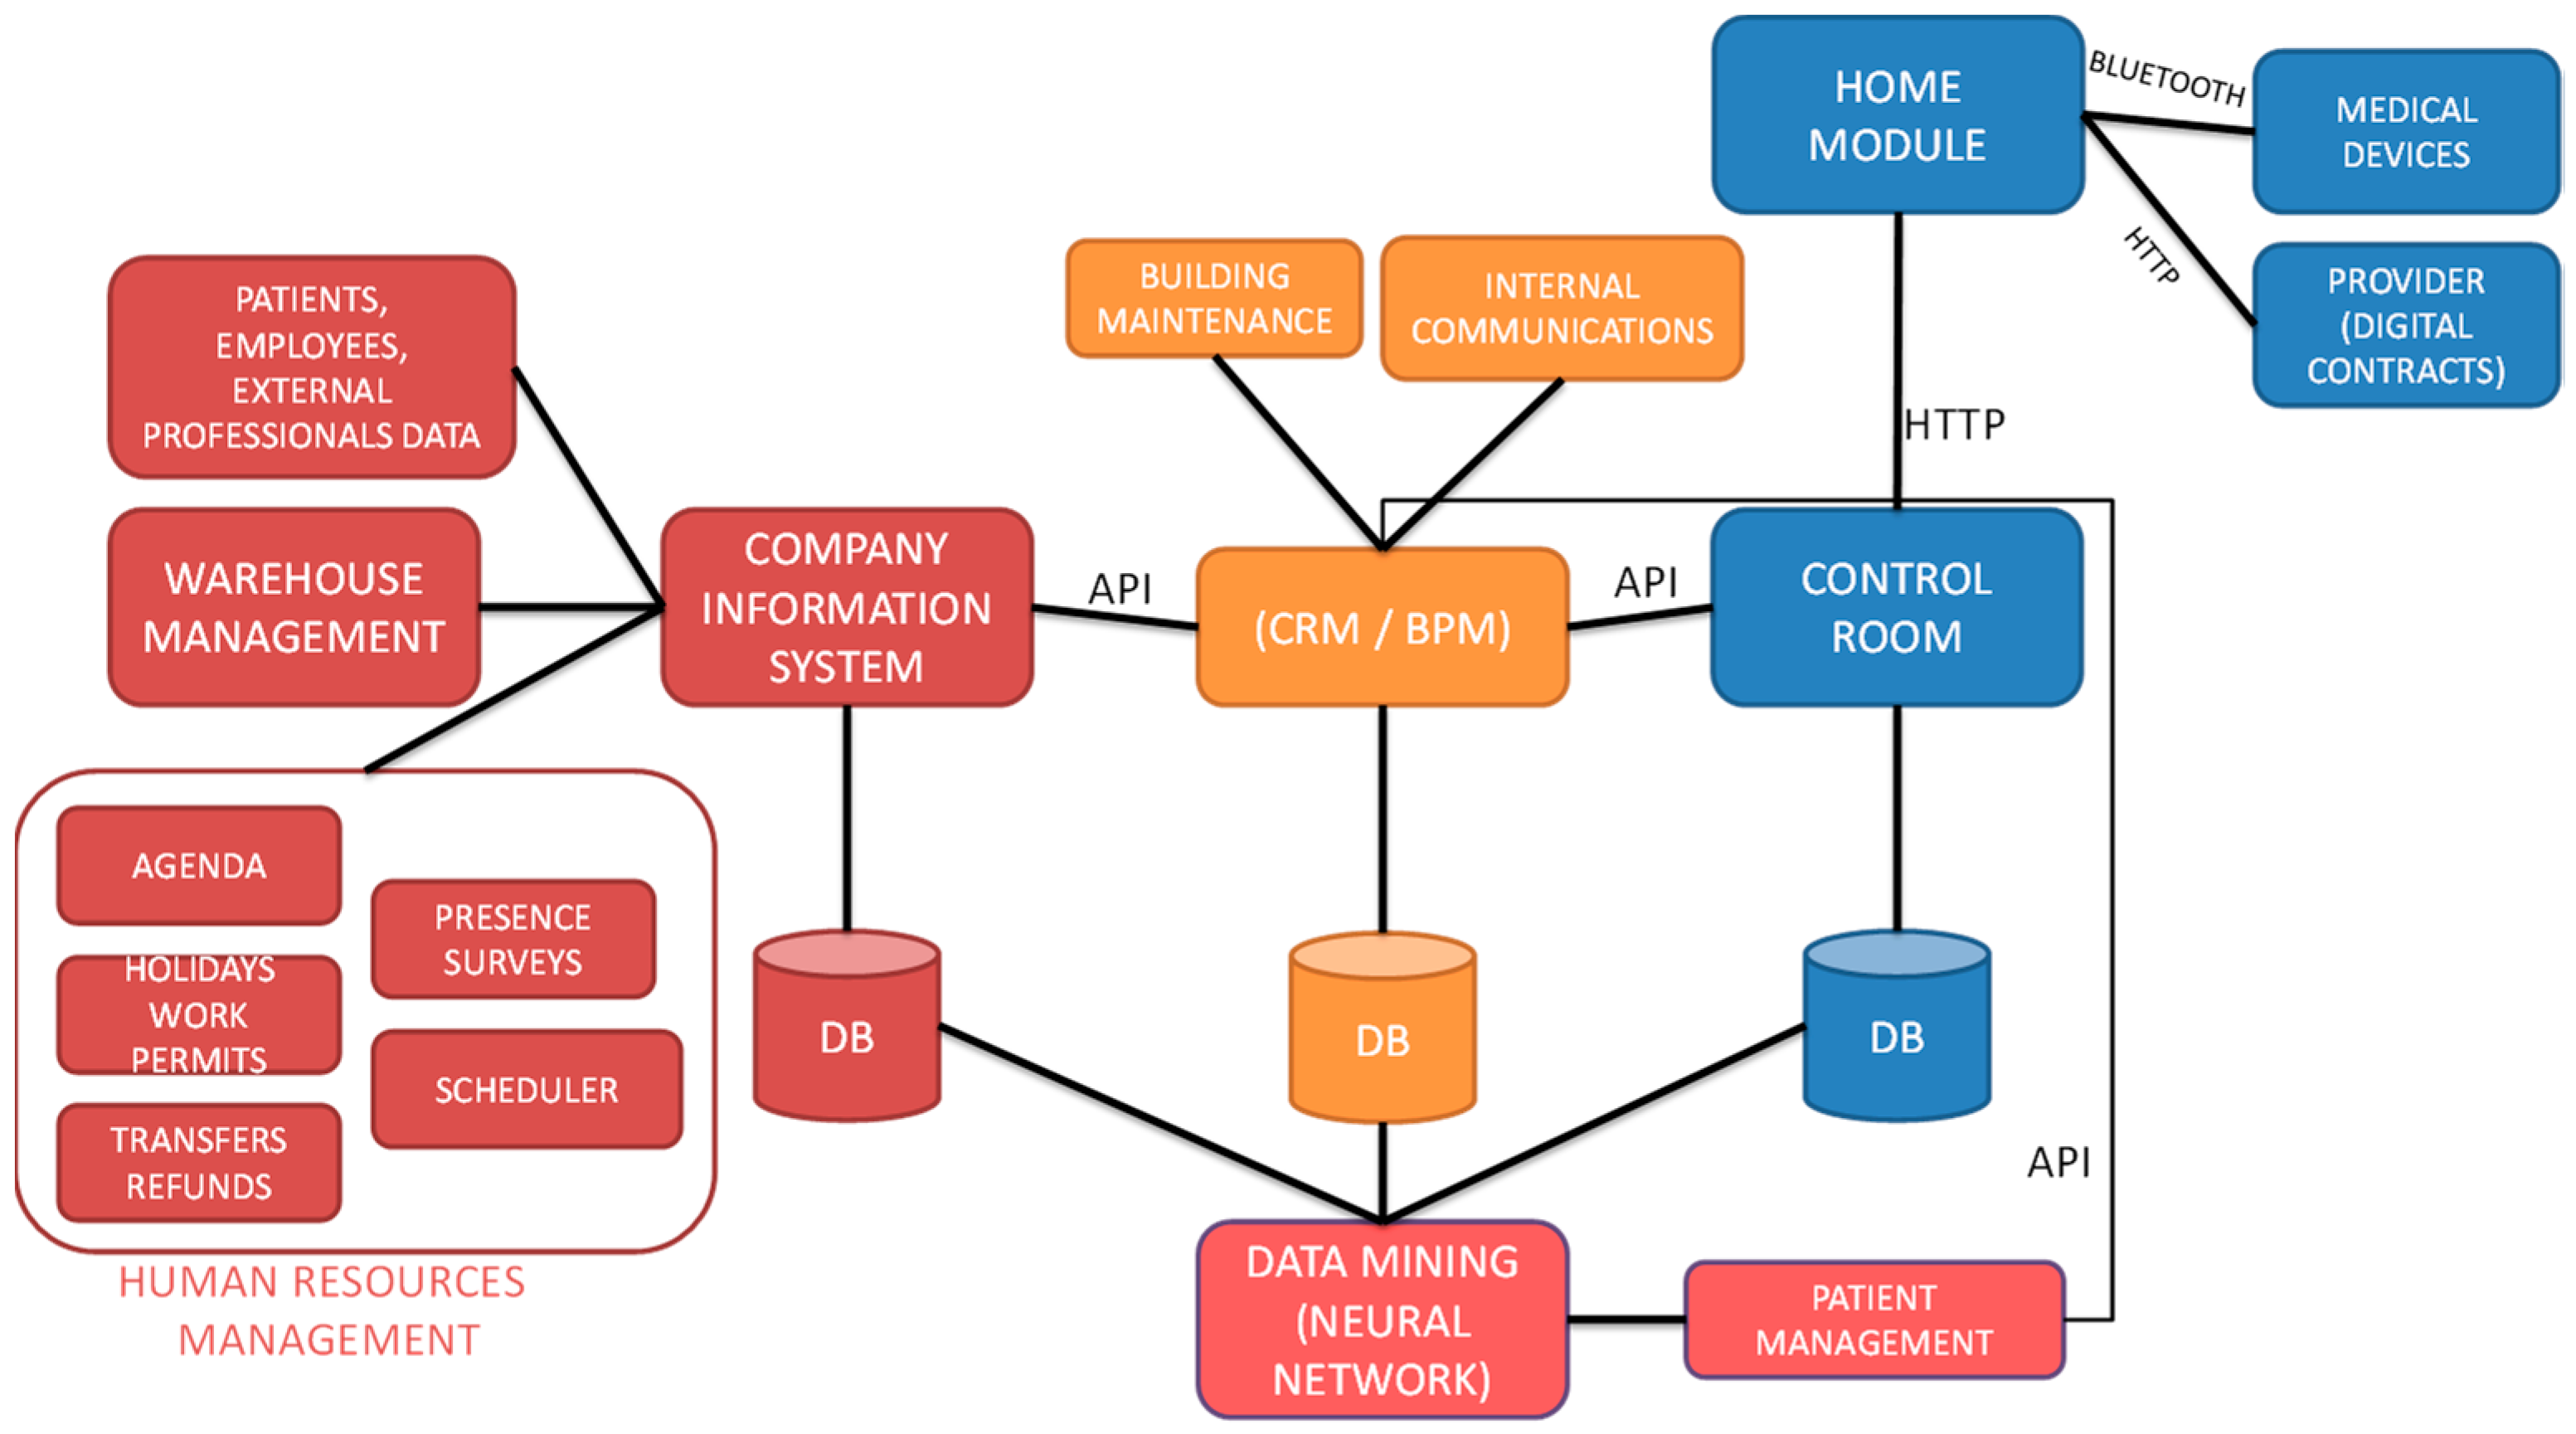
1.3. System Overview: Telemedicine Architecture Integrating RPM-DSS

The proposed telemedicine architecture of Figure 2 integrates the RMP-DSS features listed in Section 1.2. It represents the evolution of the system architecture studied in Reference [14]. The telemedicine platform proposed in Reference [14] was related to a control room able to read, in real-time, sensor data measuring physiological data of patients at home and transmitting to the cloud. The researchers focused their attention on hematology and oncology experimentation; the system referred to a basic telemedicine control panel without the implementation of RPM and data-mining DSS facilities. Figure 2 follows this basic architecture, where the RPM-DSS platform supports the management of all the services involving patients and human resources in the clinic building and at home. It is clear from the data flow of Figure 2 that all BPM (business process modelling) and CRM functionalities can be involved in the process management. The management of the activities could include internal and external diagnostic services, external consulting, and other services. The proposed RPM-DSS platform is able to work in a point-to-multipoint network. Each “home point” of the network behaves as a hub transmitting patient physiological data and receiving other data (i.e., a bidirectional communication system). The backend system is tailored in order to manage different “home points” as for a capillary de-hospitalization network, by associating a table for each monitored patient, who is identified by an ID number. The control room platform visualizes the real-time physiological data of each patient and other information such as his historical data and their health status predictions. A multi-level alerting system will activate RPM processes specifically related to the homecare assistance activities. The proposed architecture also allows for communication by video communication and chat. All the features of the proposed RPM-DSS system are listed in Table 1, in comparison with the platform functionalities developed in Reference [14], thus proving that the prototype platform is innovative.
The main disadvantage of the proposed prototype system is the complexity of managing tickets, which are enabled automatically by the DSS engine. As this topic is under investigation, the study of the automatic rearrangement of the visit scheduler as a function of predicted results is presented.

2. Materials and Methods

In this section are described the main tools and frameworks adopted for the development of the prototype platform. For the implementation of Android and iOS mobile applications on tablets, which collect data from medical devices, the study adopted the Firemonkey framework with Delphi XE10 as an integrated development environment (IDE). The control room applied the Codeigniter framework and Sublime Text as an IDE. The MySQL database (DB backend system) was implemented by means PyCharm and PhpMyAdmin tools. The CRM integrating the business process modeling (BPM) functionalities was developed using a Django (Python) platform and PyCharm/Eclipse and Oxygen/PyDev IDE. A Tablet Rugged IP68 type with Android and connected via Bluetooth and WiFi modality was used for data transmission linking medical devices. The function of the tablet interface was to transmit medical data (compatibly with HL7 in Appendix C and ethernet standard protocols) to a graphic panel of a control room, where the data could be analyzed in real time by a doctor or a specialist. Concerning a unified modeling language (UML2), different design layouts were developed using the open source tool UMLet 14.2. KNIME Analytics Platform version 3.5.3 was the tool used for the implementation of the workflow of MLP-ANN [21,22,27] oriented on health status prediction. The MLP is a feed-forward artificial neural network model that maps sets of input physiological data of patients onto a set of appropriate output related to health status prediction. The MLP network consists of multiple layers of nodes in a structured graph, with each layer fully connected to other layers. Except for the input nodes, each node was a neuron to process having a nonlinear activation function. The MLP approach adopts back propagation for training the network. For the training of the MLP, the neural network model (learner of the model) applied the efficient RProp algorithm [28,29] suitable for the multilayer feed-forward networks defined in [21,22]: RProp performs a local adaptation of the weight-updates according to the behavior of the error function. For plotting the analyzed MLP dataset, the “Chart Style Series” of the graphical dashboard of RapidMiner Studio Version 8.2 was used. The experimental dataset was increased by adding pseudo-random values (low value variations) in the first 56 records and in the last 56 records of the dataset input table, for a total of 168 records. This addition was important in order to create a self-learning ANN, which initially had only few data available. The KNIME workflow was executed by a laptop having the following characteristics: Intel(R) Core(TM) i3-403U CPU, 1.9 GHz, 8 GB RAM, 64 bit operating system. The error bars used for data post-processing were plotted by means of the Excel error bar function.

3. RPM-DSS Prototype: Design and Implementation

In this section, the results concerning the design and the implementation of the RPM-DSS platform are discussed.

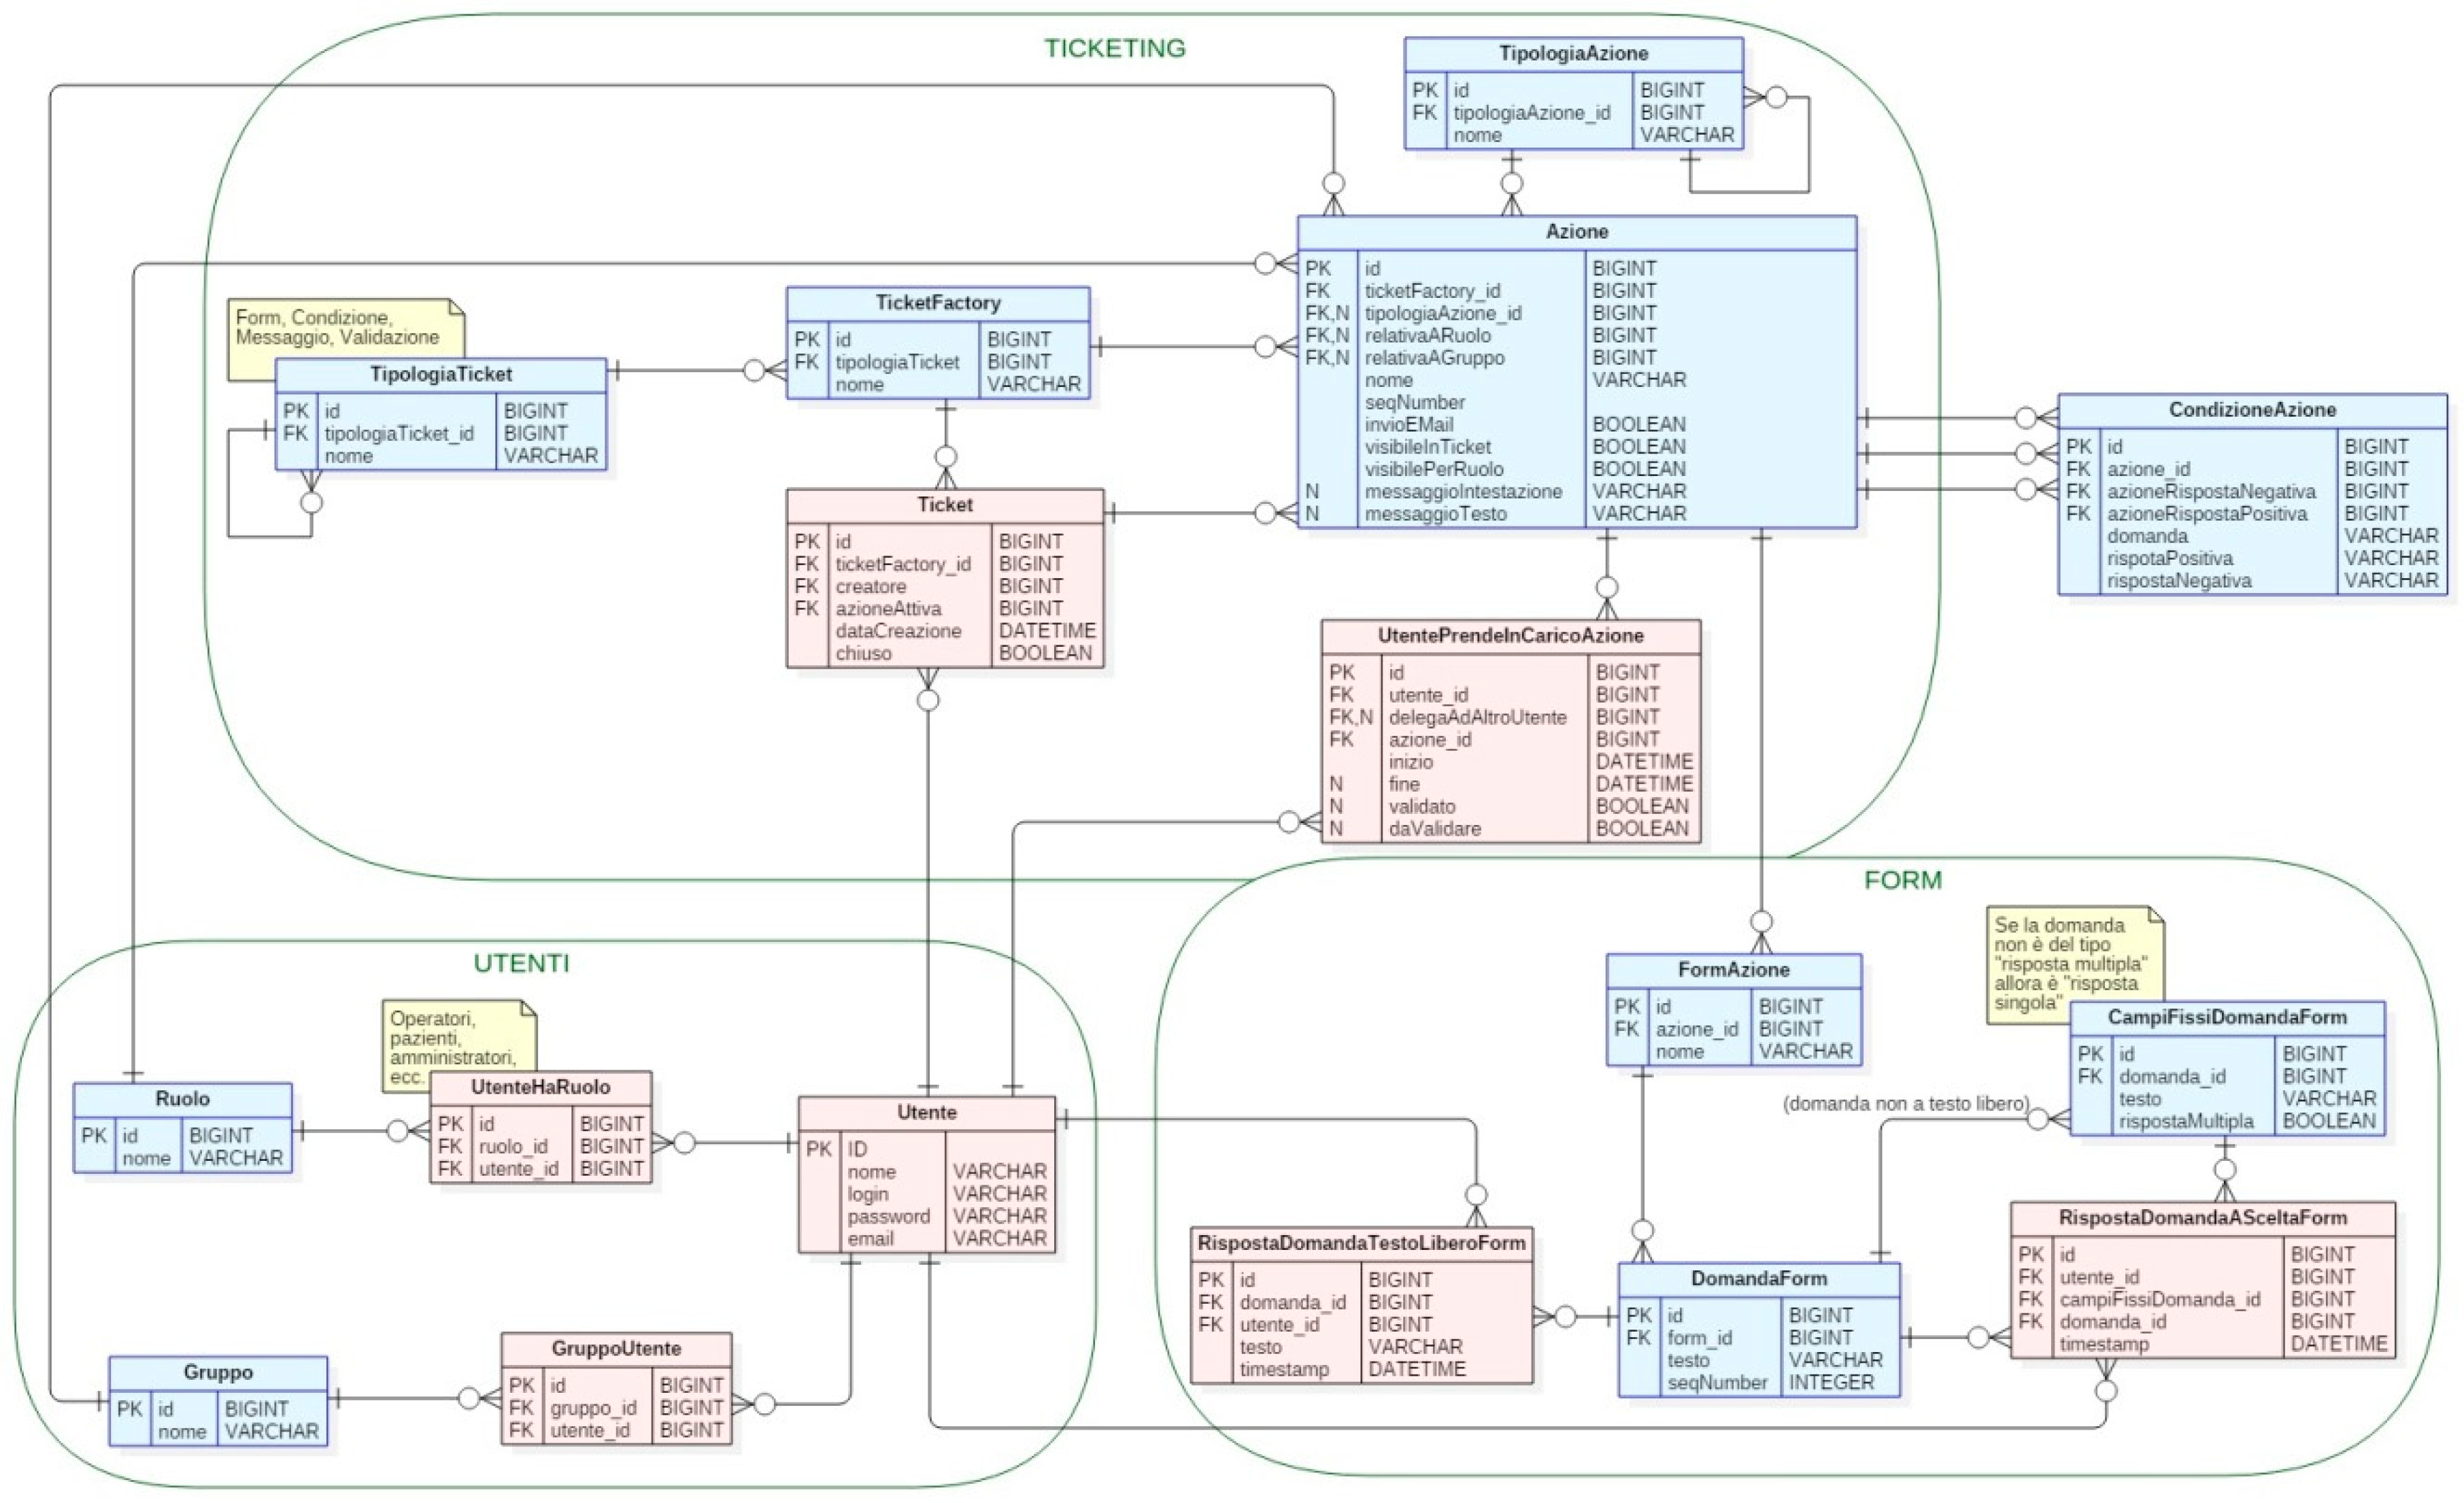
3.1. BPM and CRM Design: Basic Platform for Resources Management

All processes, documents, and messages are managed by the proposed RPM integrating CRM and BPM features. The RPM is based on the concept of process managed by a ticket. Ticket means a set of ordered actions executable sequentially and in parallel with the possibility of conditional jumps from one action to another one. An action is any atomic operation necessary to carry out a process, such as filling out a form, answering a question, selecting an article, etc. Each ticket will then be assigned to a specific actor or group of actors in order to make it operational. By this approach, it is possible to create models of tickets by designing their structure. Tickets mapped in the system are grouped into categories in a multilevel tree, so it is possible to easily manage a large number of ticket templates. Each ticket model is characterized by a particular protocol. The following attributes are common to all tickets:
  • user ticket creator;
  • operator who manages the ticket;
  • ticket expiration date;
  • list of operators/actors;
  • ticket roles and access;
  • traceability of the information taking into account historical communications of the ticket;
  • traceability of the activities performed during the execution of the ticket.
The database of the platform is split into two databases based on the MySQL relational database management system (RDBMS). A database is used for storing the data related to the ticketing, and therefore, is dedicated to the management of the various business processes, while the second one is used by the telemedicine web application in order to store patient information and their physiological data. The two databases are synchronized through a synchronization component that allows to orchestrate all the available functionalities. In Appendix A are reported more details concerning the databases, showing the entity-association diagram of the ticketing service. In Figure 3, a block diagram representing all the functionalities of the designed RPM-DSS is illustrated. In this diagram, it is clear how the data-mining engine is interconnected with the company information system; patient data are processed by neural network algorithm, thus providing more information about patient status evolution. The data processed by the neural network will optimize the visits scheduling and the assistance service. The data flow of Figure 3 embeds other process management such as human resources, warehouse, internal communications, and building maintenance.

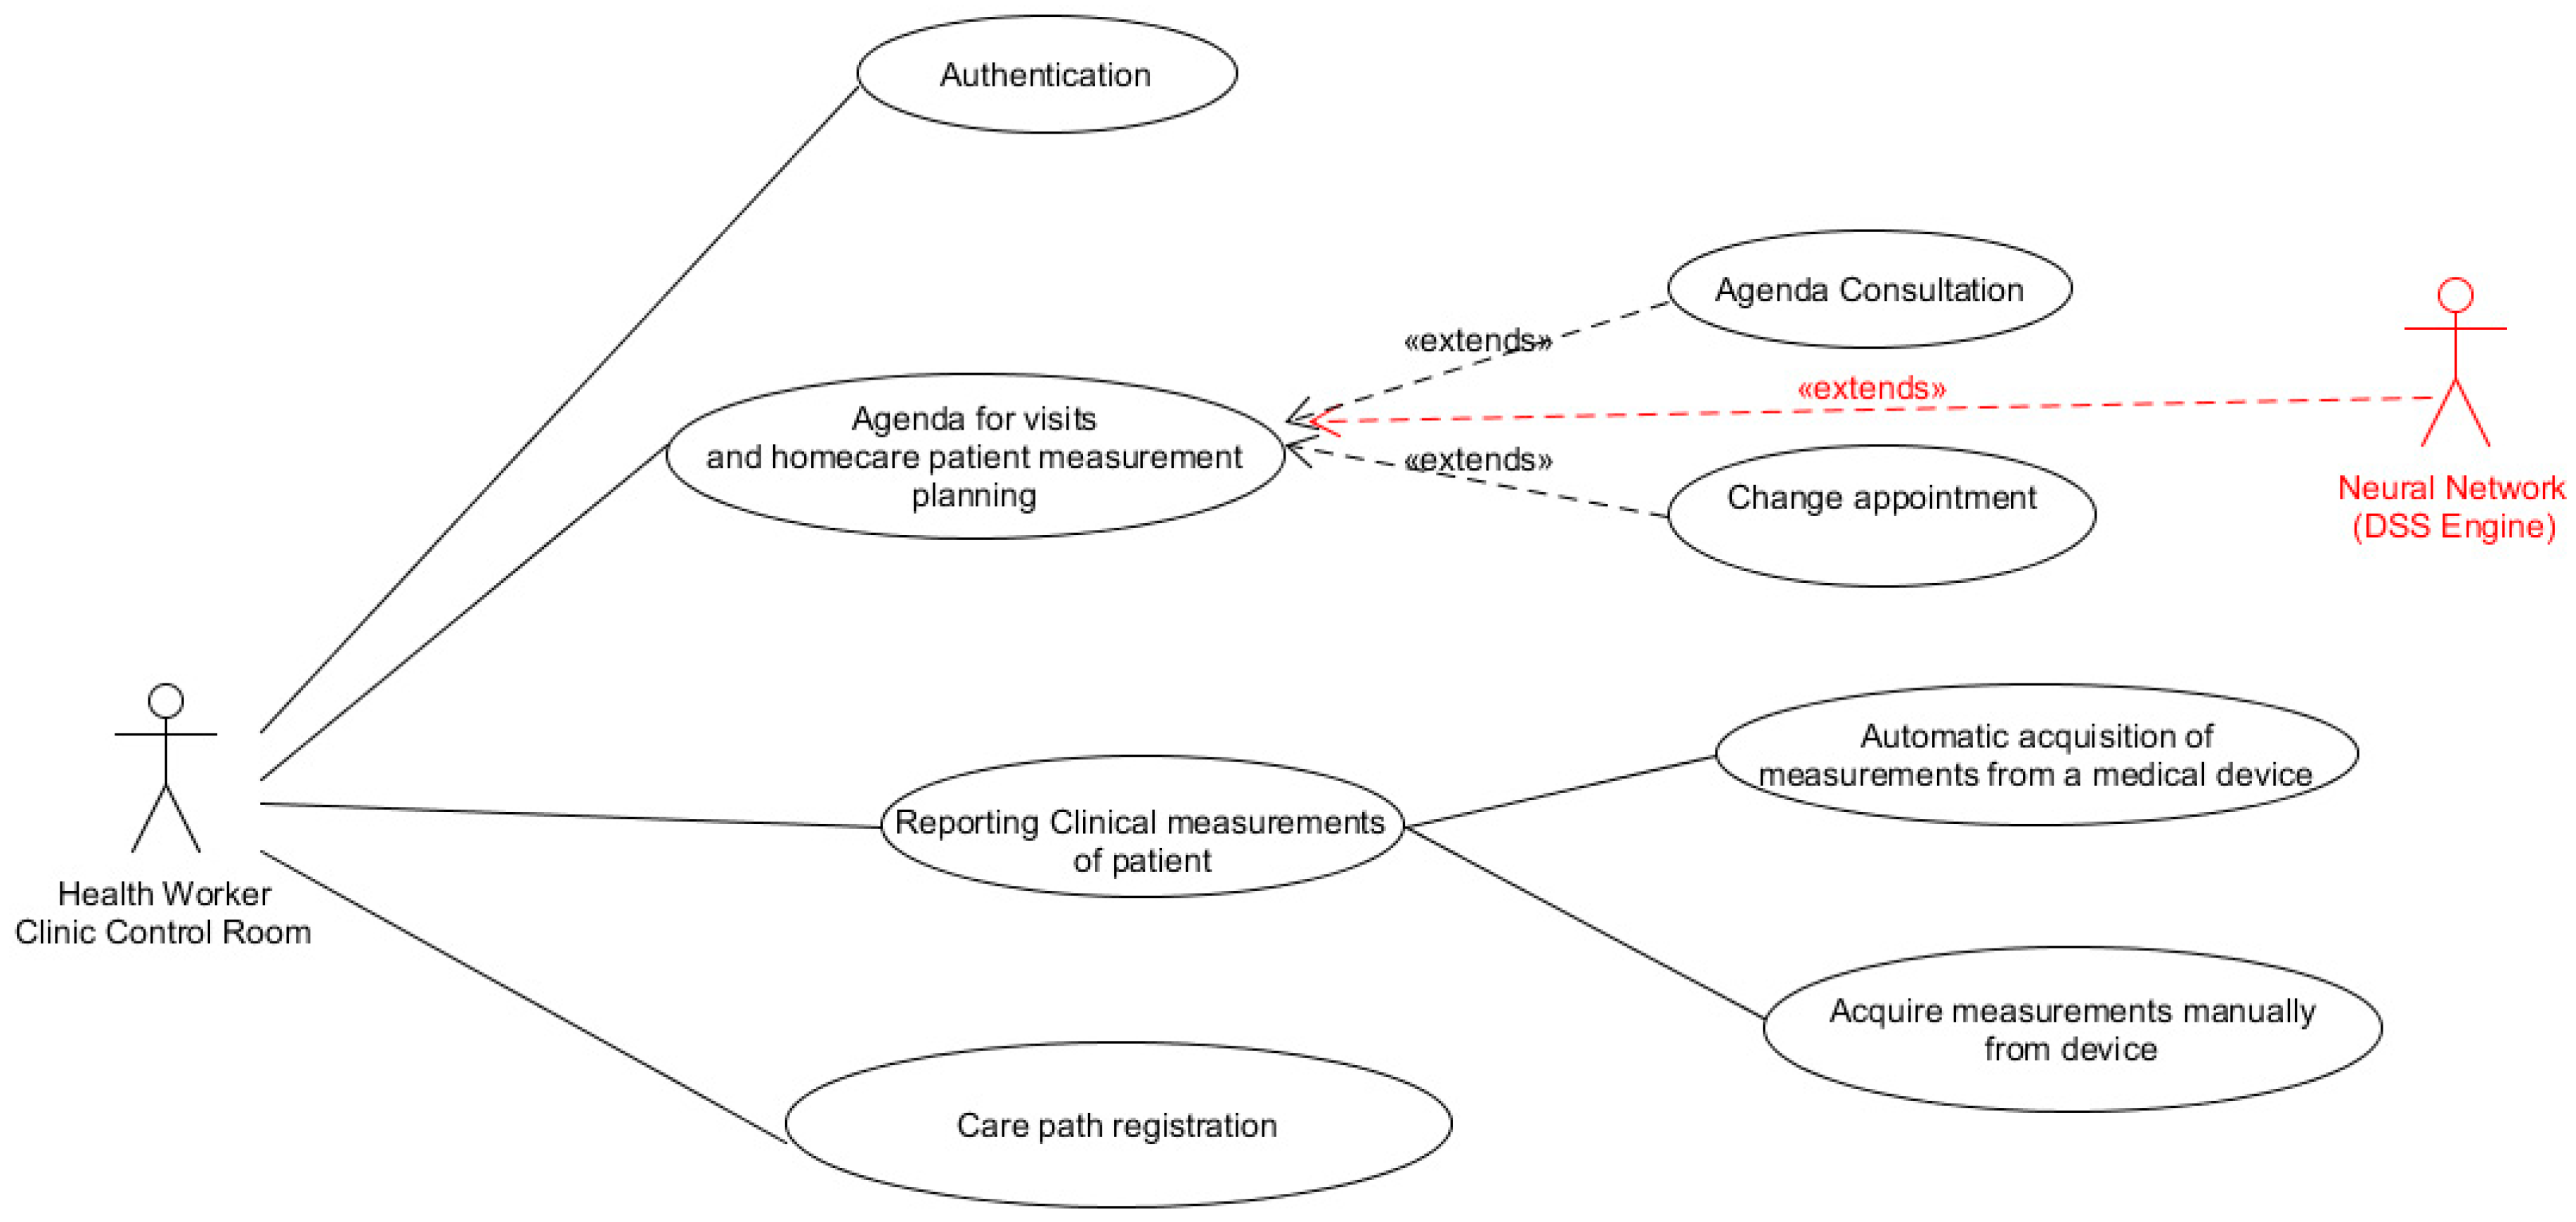
3.2. Artificial Intelligence Engine: Integration in the Homecare Assistance Platform and Health Patient Predictive Maintenance

The integration of the data-mining engine (i.e., DSS engine implementing MLP ANN) and its execution processes and accesses are described by the UML (unified modeling language) diagrams of Figure 4 and Figure 5, indicating the following main actors of the prototype system:
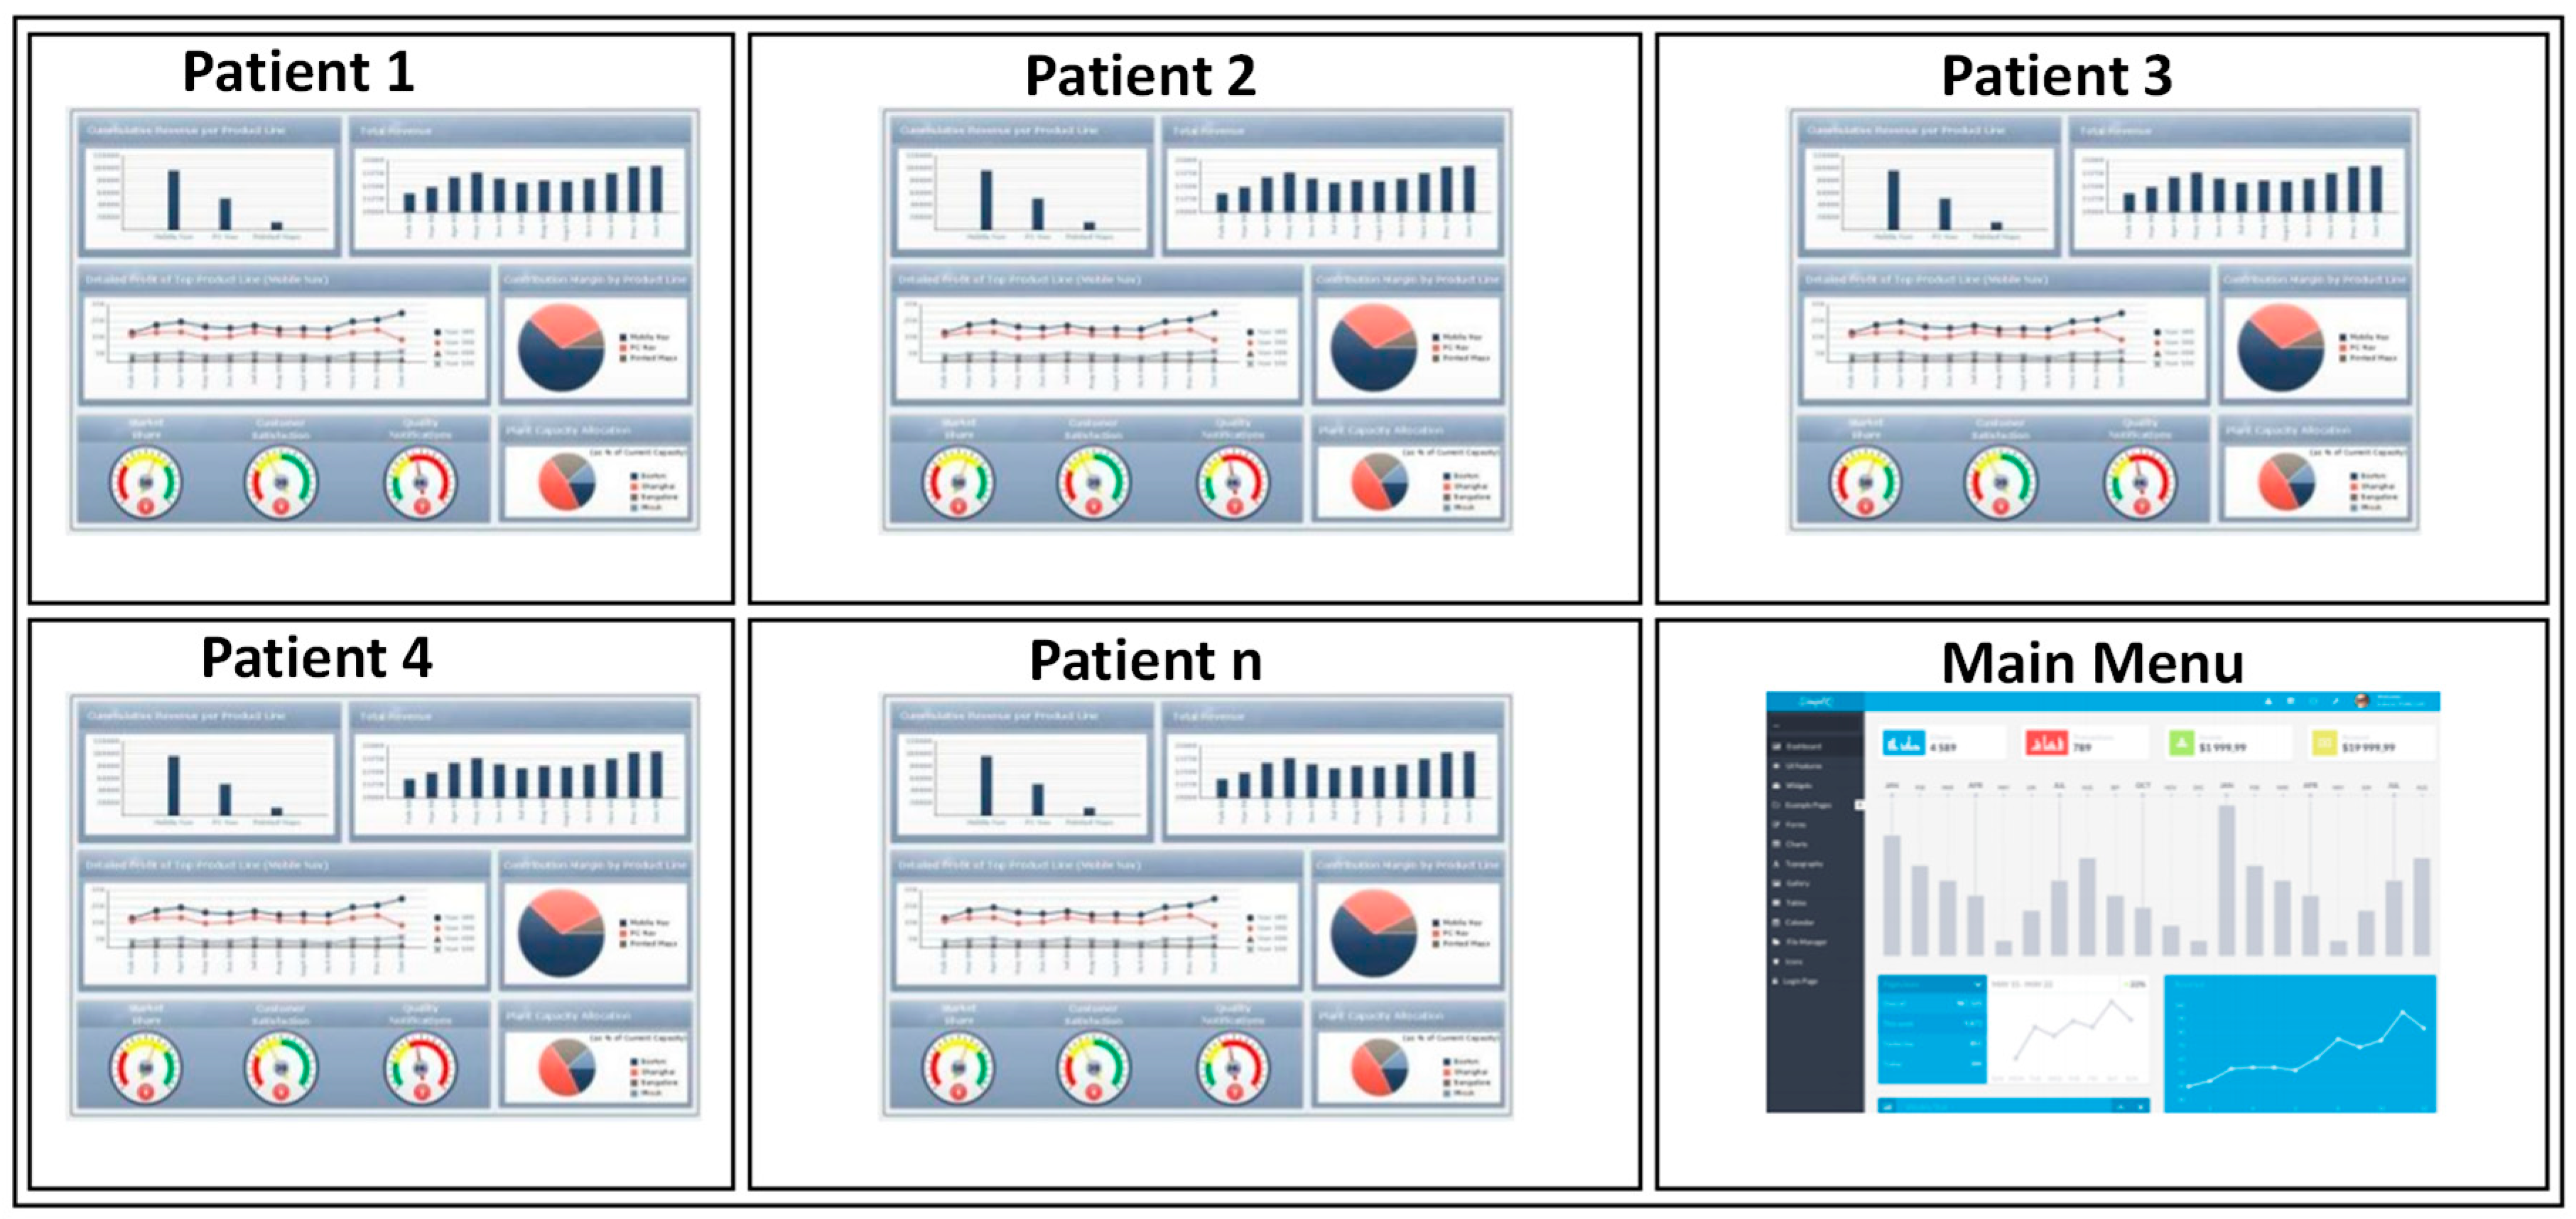
  • Health Worker: the worker of the control room of the clinic which controls all patient data;
  • Patient: patient at home;
  • Health Operator: nurse or other homecare assistance operator;
  • Neural Network: main actor of the DSS engine, which is an ANN engine able to predict patient status by processing historical and testing data.
The function of the Health Worker (see Figure 4) is to read real-time patient data and to execute the DSS engine which will process data stored in a MySQL system according to the generation of automatic alerts. The Health Worker can plan or modify the visit agenda of the Health Operators, basing their decision on the outputs generated by the DSS. The patient will transmit physiological data by a mobile app interfaced with a backend system; this mobile app can also connect operators to the system with the purpose of supervising activities. The data sent by the mobile app are stored in the MySQL database and then processed by the DSS engine. Possible trends or individual anomalous values are automatically detected by the system, which alerts the medical staff of the clinic (Control Room).
According to human resources management processes, the Health Worker can access the visits planning agenda by checking the DSS outputs and patient alert signals (see Figure 5). Moreover, they can plan the patient measurements and analyze their care path. The visits agenda can vary dynamically, being modified by the control room operator. The new visit will be traced by a structured ticket. Finally, this actor can visualize reports related to automatic or manual measurement acquisition of medical devices managed by the patients or by the Health Operators.
Figure 6 illustrates a complete UML diagram indicating all the features of the RMP-DSS prototype system. In this architecture, it is possible to better distinguish the telemedicine features from those of the RPM, being the DSS, the data-mining engine, and digital contracts the linking of all the features.

3.3. Sensors Integration for Telemedicine Homecare Control Panel System and DSS System

The architecture in Figure 2 illustrates the studied telemedicine architecture allowing remote assistance by means of a server connected to a tablet behaving as a router. The patients are assisted at home by means of medical devices connected to the same tablet and able to transmit data to a cloud system by means of a properly designed backend interface. Each cluster of medical devices is associated with a patient located in a house and identified by an ID. The single patient could use alone the devices or can be assisted. The control room panel also has the functionality to collect all the performed measurements into the DB prototype system. The tablet can be adopted also for a videoconference function, thus improving a bidirectional data flow from patient to clinic. The red dashed lines in Figure 2 indicate the regions concerning the implemented prototype architecture. The proposed design shows that patient data can travel to different locations, and can be controlled by a control panel able to control also other departments of the clinic, external rooms, or others specialist locations. This system could support the internal logistics of the clinic and activate different cross services. The backend platform interface is also able to store measured data into the DB system. The records of the DB are related to the patient being monitored. Moreover, by means of the control room interface, it is possible to manage the patient’s information and access the display of historical data as:
  • data related to the last 12 h;
  • data related to the last 24 h;
  • data relating to the whole period of monitoring or for periods defined by the doctor.
Through the general menu it is also possible to:
  • add a new patient;
  • associate to a patient an identification code (id number);
  • manage the tablet connectivity.
Figure 7 illustrates the layout of the developed control room panel. The realized web interface is able to select the patient and the related tablet enabled for the measurements (the tablet is identified by an ID code), and the “Synoptic” command provides, as output, real-time graphs of the connected devices (the sampling time can be set to 5 s, 10 s, 1 min, 10 min, and 1 h). During the real-time patient monitoring, the panel will switch on an alert in the case of an exceeded threshold. This real-time alerting represents the first level of the DSS system (DSS level 1).
The control room panel of Figure 7 is linked to different medical devices associated with each patient being monitored. In Table 2 are reported some tested medical devices.
In Appendix D is reported an example of a procedure validating sensor measurements in a homecare assistance activity.
The data of the MySQL DB of the platform can be migrated into another DB system able to collect historical patient data of multiple patients. This last system can be big data such as the Cassandra DB. The collection of several types of data is important for the learning of the ANN algorithms; more data will enable the model to learn efficiently by decreasing the prediction error. Figure 8 illustrates the complete DSS architecture structured in three main levels. This scheme follows architecture studied in predictive maintenance approaches adopted in other application fields concerning prediction of machine break-down [30]. The DSS level 1 consists of the alerting process provided by the real-time monitoring of the patient through the control room panel allowed by the real-time monitoring function. This level uses the MySQL DB of the prototype platform. The observation of many alert conditions of level 1 induces the system to enable DSS level 2, having the function to correct the visits planning for a preventative action by avoiding critical situations. The DSS level 2 works with the DB of the platform. Finally, DSS level 3 is based on an MLP-ANN algorithm having the function to predict patient health status by processing historical data and real-time ones. The DSS level 3 can utilize data of the DB platform or big data system containing massive historical physiological data. The data migration from the DB of the platform to the big data platform is managed by cron (php script) which periodically updates the patient data bank.

3.4. Experimental Dataset and MLP ANN Predictive Results

The experimental physiological dataset is made by different attributes such as heart rate (HR), mean arterial pressure (MAP), systolic (SYS) (mmHg), and diastolic (DIA) (mmHg) signals, concerning measurements performed during two months (measurements acquired in different 36 days for a total of 168 records for each attribute). We observe that the MAP is the average blood pressure in a cardiac cycle, and it represents the average pressure imposed on the patient’s arterial walls. Map can be estimated using this formula: map = diastolic pressure + (1/3) × pulse pressure. In Figure 9 are illustrated graphically the attributes of the experimental dataset.
Concerning systolic and diastolic blood pressure, Table 3 was obtained from the American Heart Association and shows the categories of hypertension for adults above 18 years old. This table is useful for the determination of the risk thresholds of the DSS.
The experimentation focused on systolic values by applying the KNIME workflow of Figure 10. The proposed workflow is suited for data pre-processing and data processing implementing an MLP ANN algorithm. Different objects, named nodes, are connected in order to execute the training and the testing phases. Below are described the function of each object:
  • Input node (node 1): the input data are loaded in the local repository in order to be pre-processed by means of an Excel Reader (XLS) node by a MySQL DB connector, or by a Phyton Source Node connecting the Cassandra big data system.
  • Normalizer (node 2): this node normalizes the values of the numeric columns of the systolic values; the normalization represents the data pre-processing necessary to equilibrate data on an unique scale, thus reducing data dispersion and errors during the followed data process.
  • Partitioning (node 3): the input table is split into two partitions (i.e., row-wise), e.g., train and test data. The two partitions are available at the two output ports.
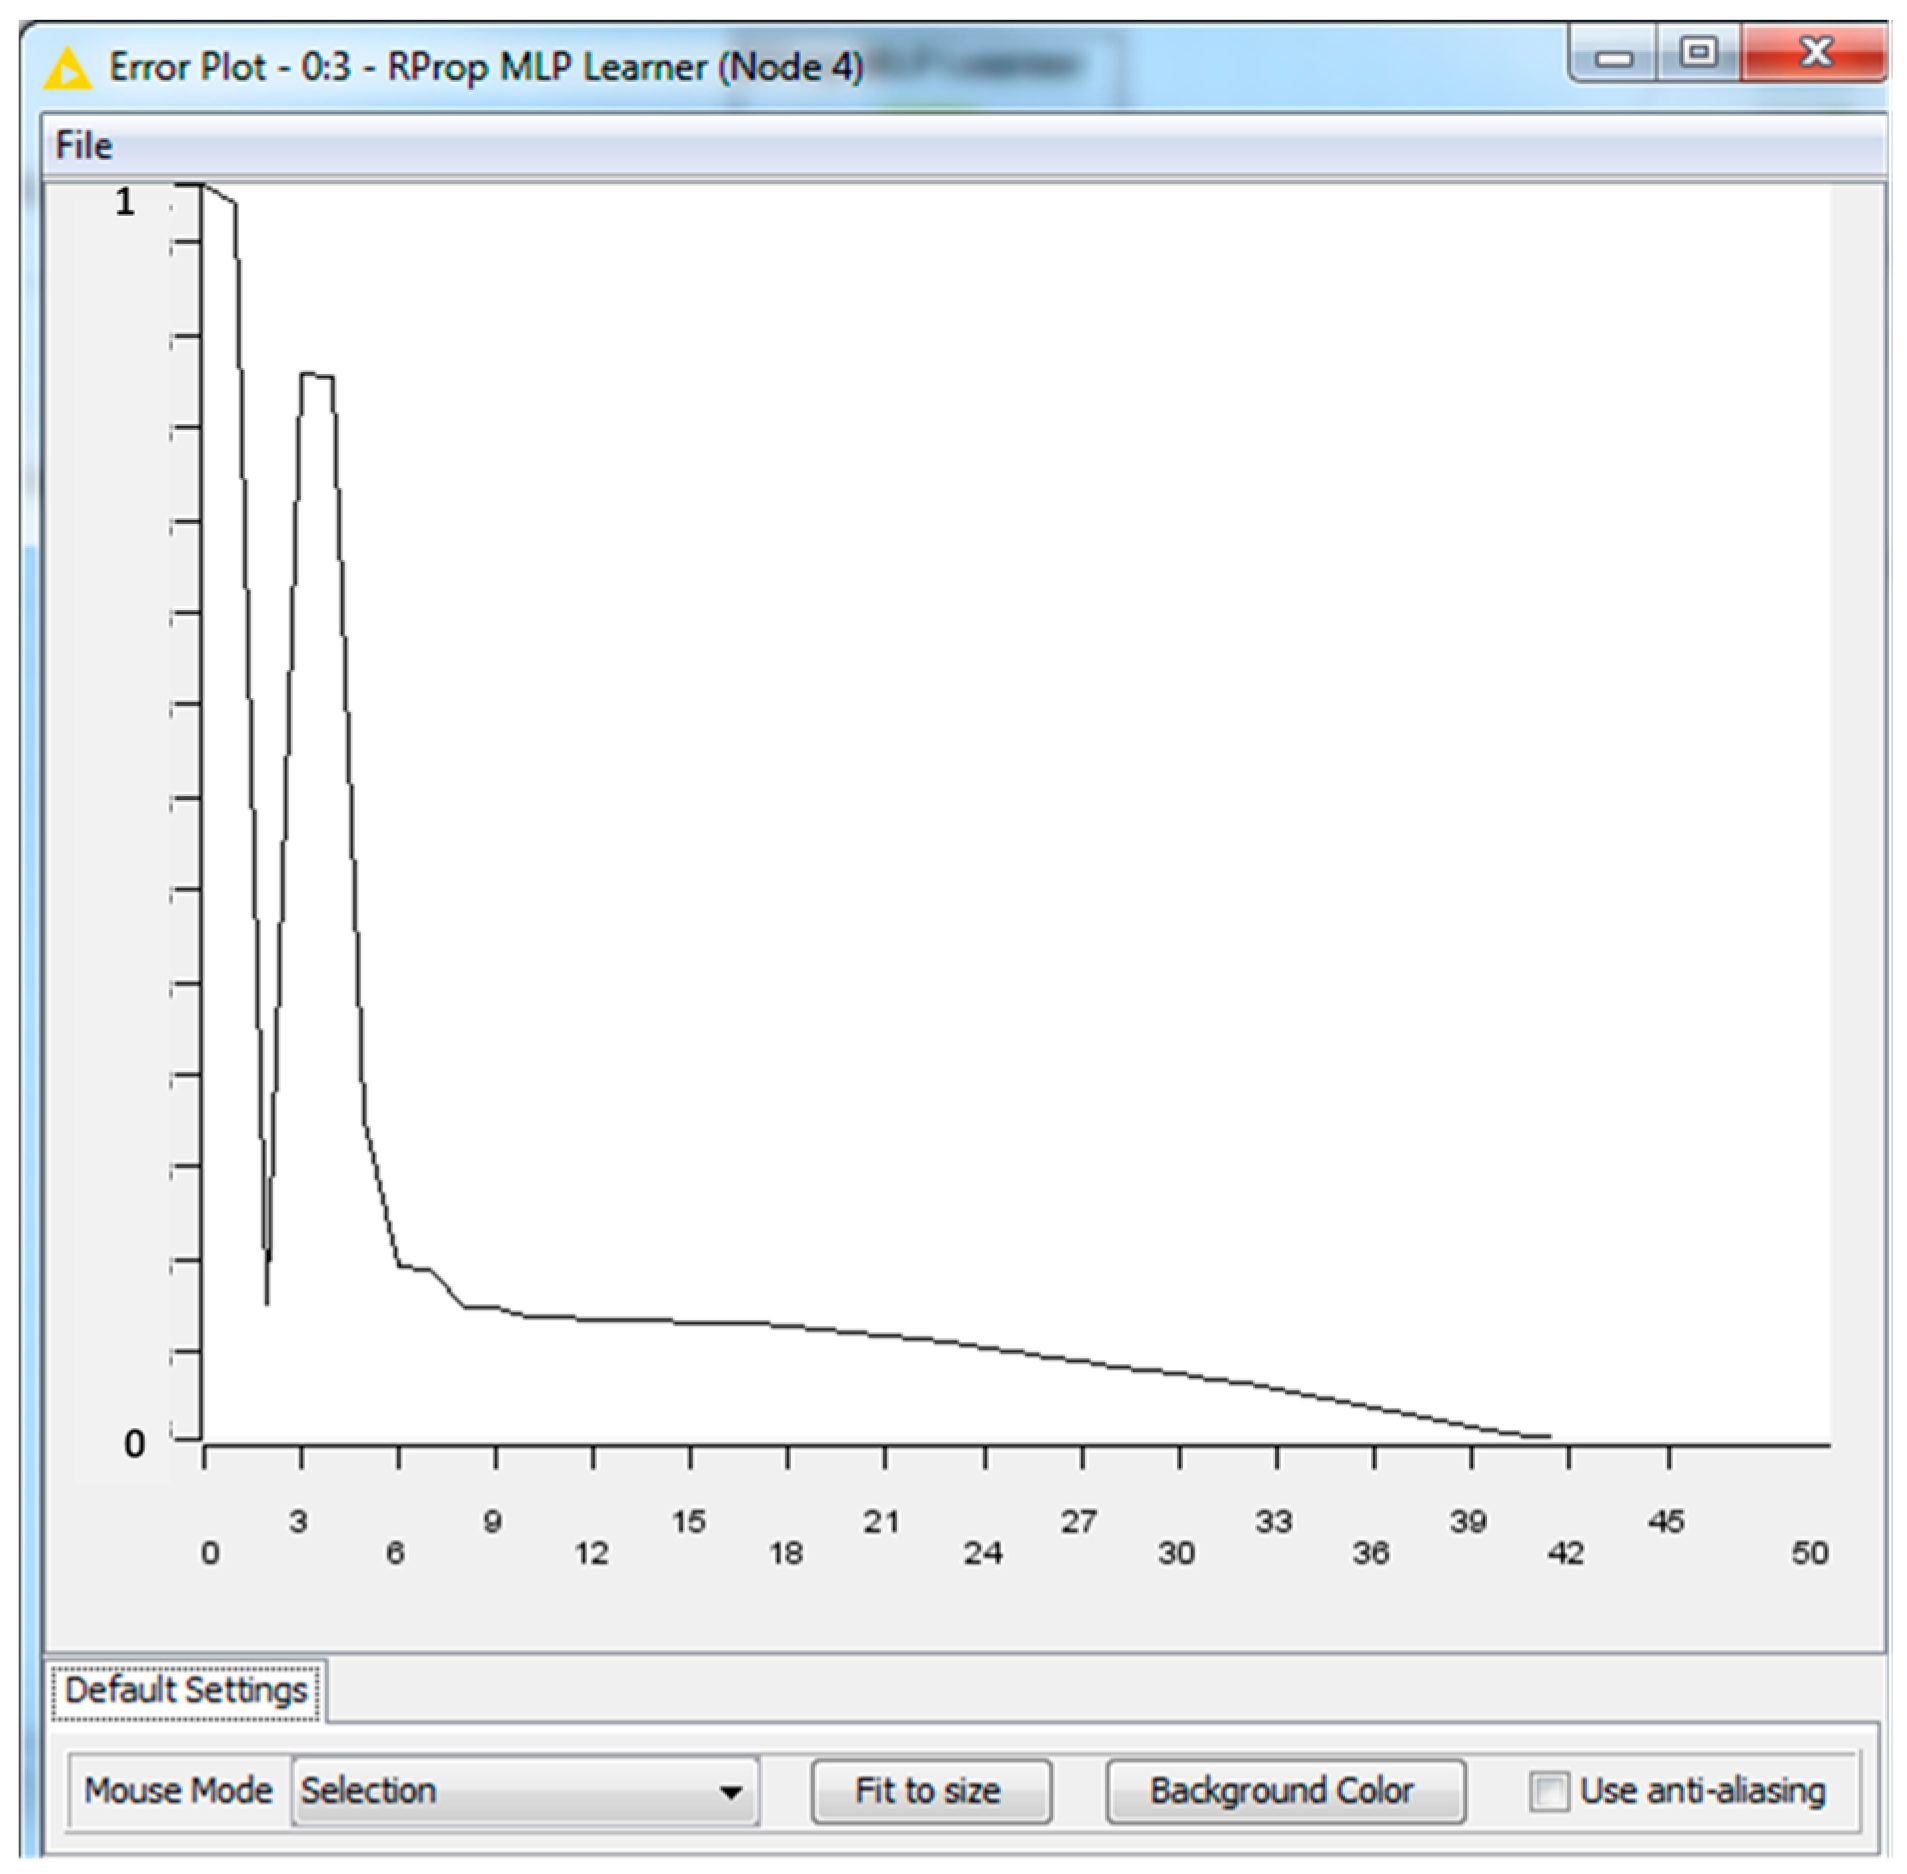
  • RProp MLP Learner (node 4): RProp performs a local adaptation of the weight-updates according to the behavior of the error function.
  • Multilayer Perceptron Predictor (node 5): this node processed by MLP algorithm the training and testing datasets provided by the first partition and the second partition of node 3, respectively.
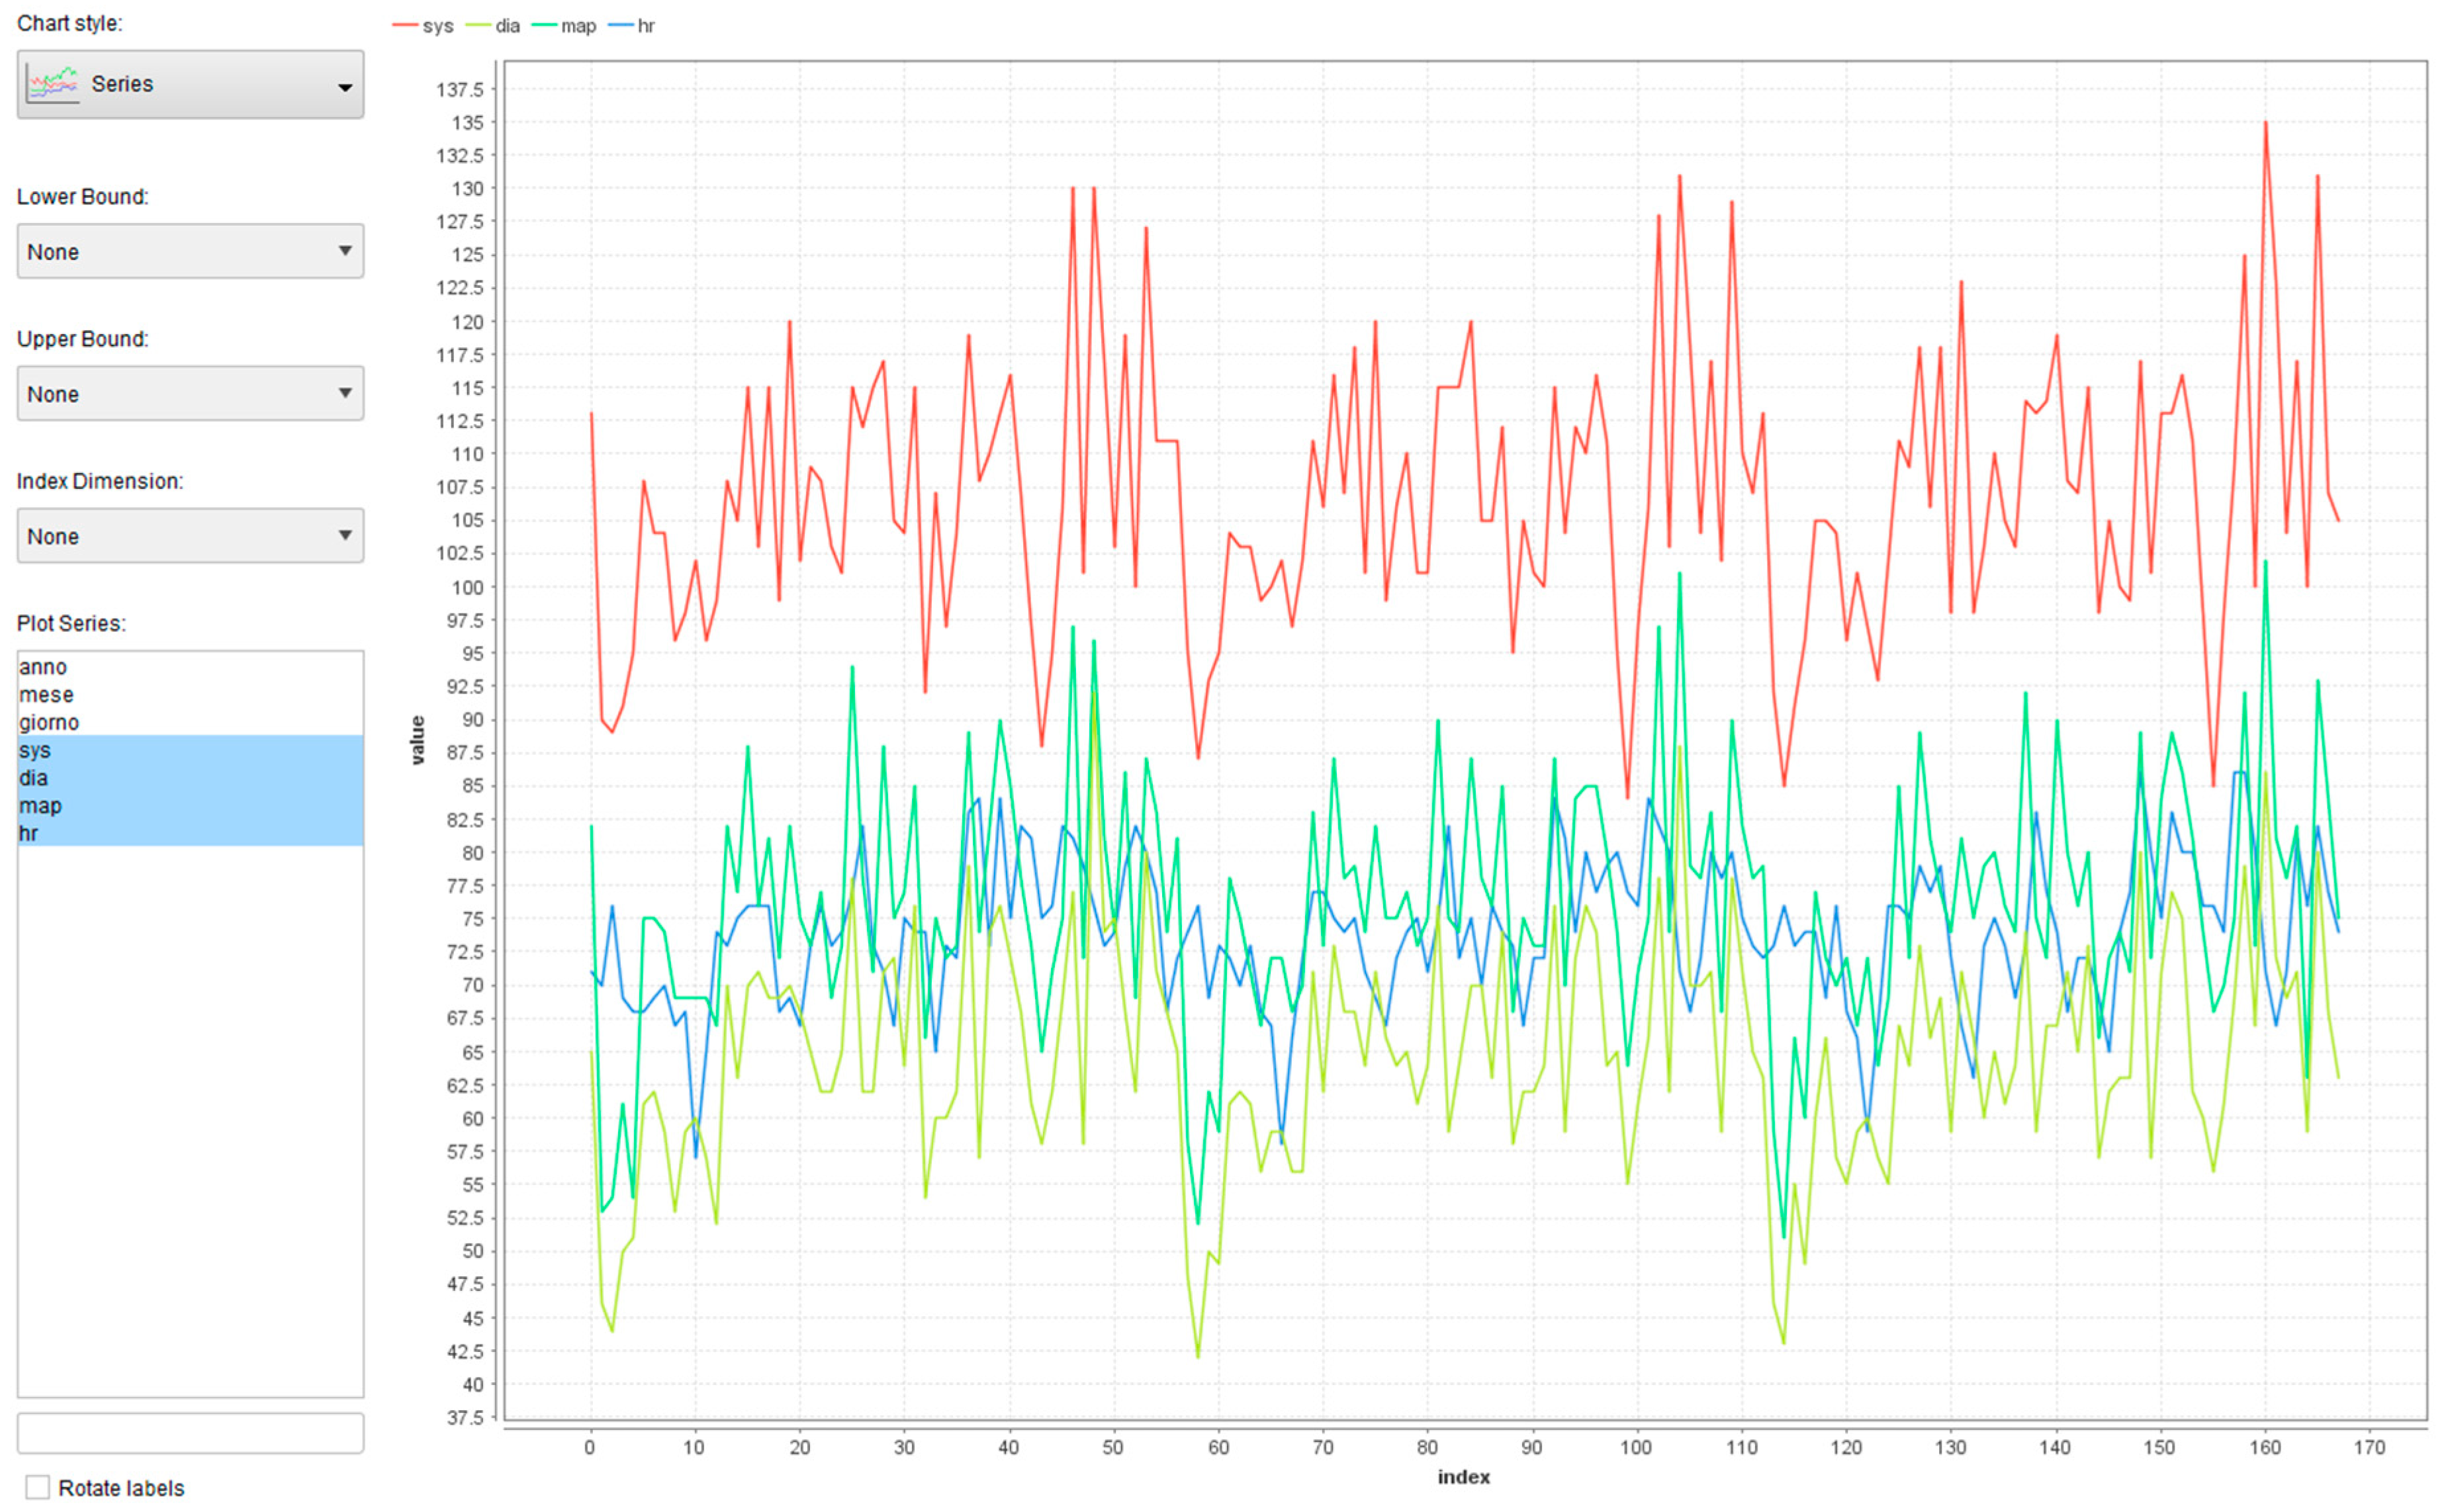
  • Line Plot (JavaScript): this node allows to plot graphically output results, such as real values and predicted ones.
  • Numeric Sorer (node 7): this node computes certain statistics between the a numeric column’s values (ri) and predicted (pi) values; it computes R² = 1 − SSres/SStot = 1 − Σ(pi − ri)²/Σ(ri − 1/n*Σri)², mean absolute error (1/n*Σ|pi − ri|), mean squared error (1/n*Σ(pi − ri)²), root mean squared error (sqrt(1/n*Σ(pi − ri)²)), and mean signed difference (1/n*Σ(pi − ri)).
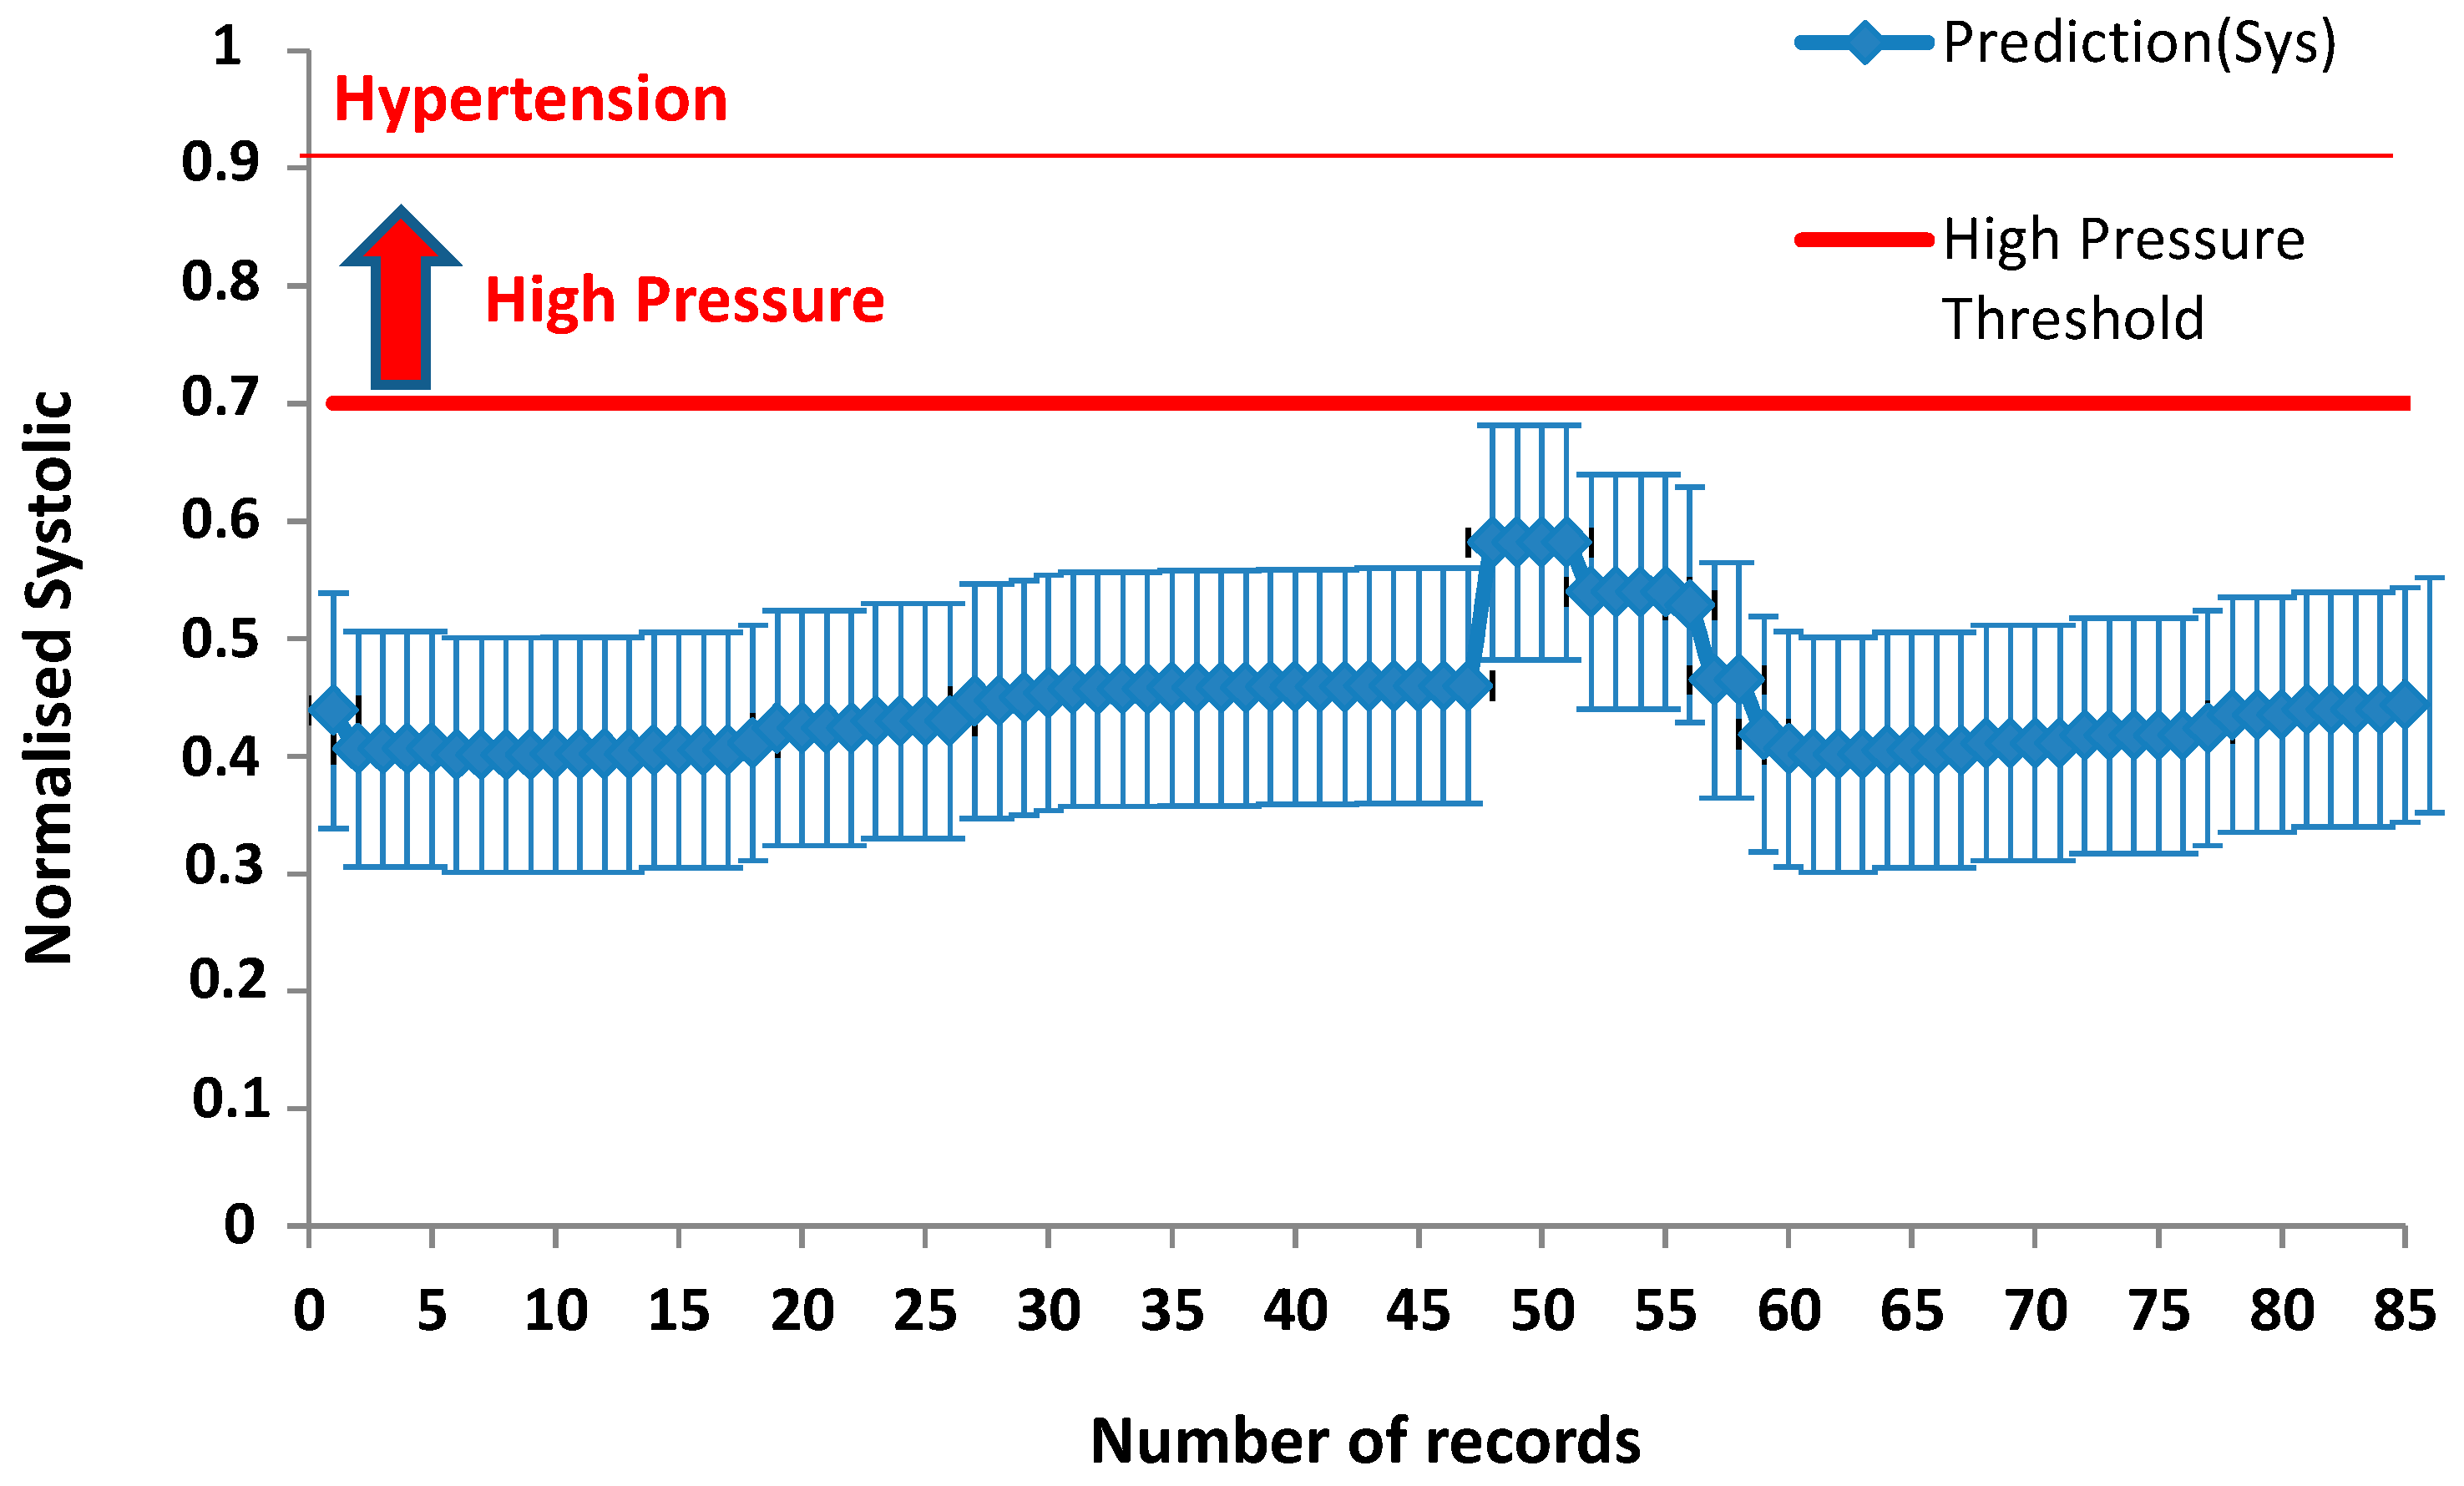
  • Excel Writer (XLS): this node exports in an Excel file the output results allowing to further process data, for example by adding error bars (data post-processing).
Only two seconds are necessary for the data processing of the workflow of Figure 10 and about 6 s for the reporting performed by node 6. Figure 11 illustrates the output of the Multi Layer Perceptron Predictor node obtained by the following best parameter settings: first partition of 80 (absolute value), 6 hidden layers, 50 as maximum number of iterations, 10 hidden neurons per layer, linear sampling. The choice of the parameters is provided by the analysis of the mean absolute error reported in Figure 12 versus different parameters, finding the minimum value of 0.138. We observe that, taking into account the total number of 168 records to process, a good compromise is to set the first partitioning to 80 as an absolute number of rows. All 80 rows entered into the first table will be processed by the Learner node (node 4), enabling the training process of the model, while the second table (second partition) contains the remaining rows which will be processed for the testing process. Below are reported more details about the meaning of the parameters of Figure 12:
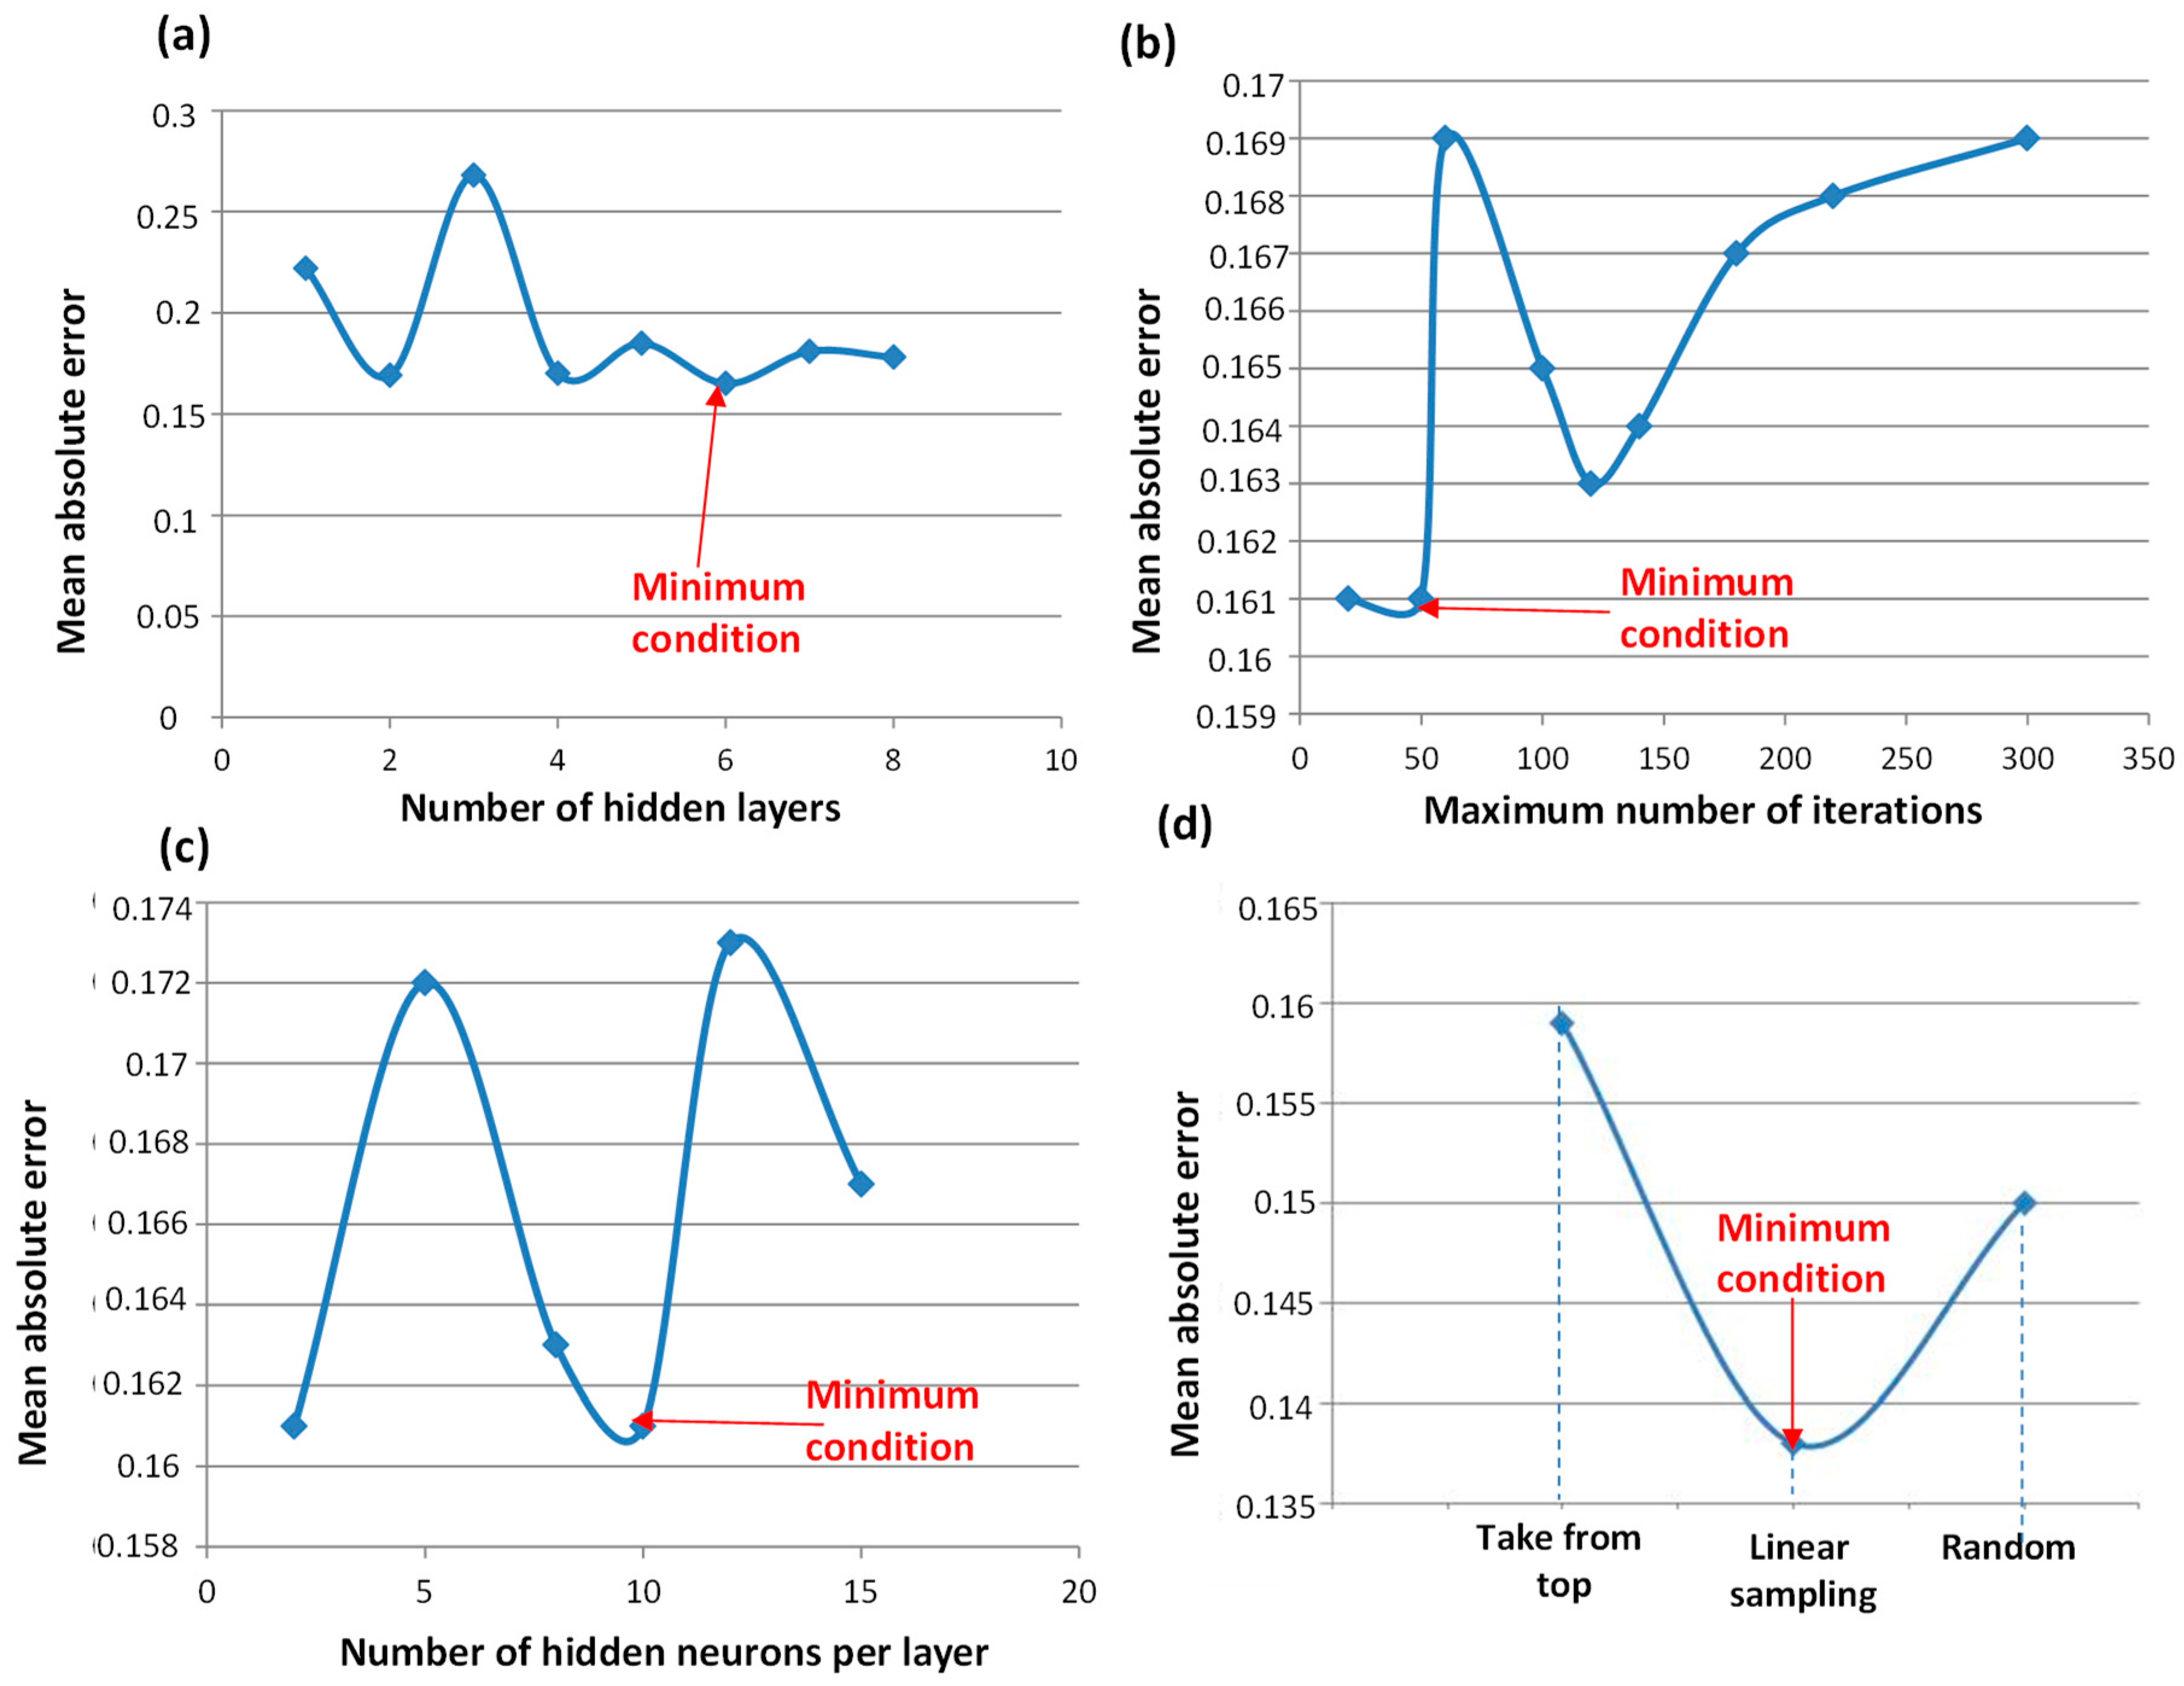
  • Take from top (partitioning): this mode puts the top-most rows into the first output table and the remainder in the second table.
  • Linear sampling (partitioning): this mode always includes the first and the last row and selects the remaining rows linearly over the whole table.
  • Draw randomly (partitioning): random sampling of all rows.
  • Number of hidden layers (RProp MLP Learner): number of hidden layers in the architecture of the neural network.
  • Maximum number of iterations (RProp MLP Learner): number of learning iterations.
  • Number of hidden neurons per layer (RProp MLP Learner): number of neurons contained in each hidden layer.
The procedure used for the parameter setting follows the same order as Figure 12a–d. It is fixed before the number of the hidden layers providing the minimum error, then it is fixed for the maximum number of iterations at minimum condition, successively it is set to the number of hidden neurons per layer, and finally the partitioning of sampling approach. In order to analyze better the error plot behavior during the iteration process, Appendix B displays the error plot trend for each iteration before the 50 iterations by observing that the error decreases drastically after only nine iterations. In order to read correctly the predicted results as reported in Figure 11, error bars having an amplitude of ± 0.138 equal to the calculated mean absolute error are presented (the total error bar amplitude is 0.276). By observing the high-pressure threshold and the predicted results it is clear that there are no risks for the monitored patient about high-pressure or hypertension conditions. If the error bars remain during the MLP-ANN calculation below the high-pressure threshold line, the DSS level 3 will not activate the alerting condition. For the opposite, if the error bars overcome the high-pressure and hypertension thresholds for a certain number of records, it will enable the alert condition, thus activating in the RPM-DSS the emergency assistance ticket concerning a request for an urgent analysis to be performed in the clinic, further supervision of a nurse, etc.
Systolic dashboards similar to Figure 11 can be achieved for different patients transmitting data in the RPM-DSS database of the clinic. Other predicted results could be related to all the parameters indicated in Table 2. The goal of the proposed experimentation is to provide a key reading of the predicted results specifically for blood-pressure monitoring. The same approach can be adopted to read other physiological data, such as heart rate data values.
Figure 12 shows the procedure to select the best parameter settings of the KNIME workflow of Figure 10. The same procedure is based on the step-by-step mean absolute error evaluation, and can be adopted also in the case of bigger experimental datasets. The dashboards of Figure 12 support to understand the reliability of the results and to evaluate if an alerting signal is false or true. The choice of the ANN-MLP approach is also validated by observing preliminary results indicating that error bar amplitude decreases with an increase in the number of samples in the training dataset.

4. Discussion

European scenarios in telemedicine refers to COM(2008)689 of the European Commission [31] and several member states, such as Sweden and Spain, have already integrated telemedicine services using different approaches in their national health systems. The Italian Ministry of Health also receipts agreements about telemedicine application with regional governments according to “TELEMEDICINA Linee di indirizzo nazionali” approved in 2012 [32], that specifies system classifications, actors, technology components, organization models, training, costs, performances, and ethical aspects. In this direction, the paper propones enabling technologies to implement the transition from organization models based on specializations to process management approaches [32] improved by patient status prediction by means of multilayer perceptron MLP-ANN and several other DSS tools supporting the management of new organizational models. Specifically, the DSS alerting level 1 (time t1) is always active and provides real-time monitoring of the overcoming condition of the threshold. For repeated alerting conditions checked during a day, a health operator can be urgently sent to a home. The alerting conditions checked in a week can enable the alerting condition of the DSS level 2 (time t2). In this case, a preventive procedure is applied by adding or anticipating visits in the previously scheduled agenda. Historical physiological data can be processed for health prediction (DSS level 3 at time t3t2) by also modifying the scheduling of visits.
The DSS level 3 works by executing the KNIME workflow of Figure 9 characterized by the following main phases typical of an ANN-MLP data processing:
(a)
Data input phase: by means of a cron activates the prediction by reading patient data from a database; the cron automatizes the prediction process;
(b)
Data pre-processing phase: input data are pre-processed and properly partitioned into training and testing branches;
(c)
Data processing: the system is learned and tested;
(d)
Output: the outputs results are plotted.
As shown in Figure 10, the parameter setting is performed partially in the data pre-processing phase (setting the size of the first partition and the sampling typology) and partially in the training object (maximum number of iterations, number of hidden layers, number of hidden neurons per layer, and random seed). In the analyzed case, in order to increase the training dataset of real-patient data, other 112 pseudo-random values characterized by low value variations are used. This is necessary when the historical data are few, especially at the beginning of the self-learning process. The self-learning process will be optimized when the training dataset is substantial. An element which could mislead the prediction is the presence of possibly wrong data. In this last case, it is necessary to previously filter input data in order to not consider wrong iterations and wrong predicted results having a good false accuracy. All the proposed architectures and design layouts of the RPM-DSS proposed in this paper have been implemented. The RPM-DSS platform has been tested by managing different tickets of the homecare assistance process, and by proving the correct operation of the whole prototype platform. The procedure discussed in the previous section about the parameter setting for the best algorithm performance could be adopted also for the processing of other physiological data. By defining threshold lines in predictive diagnostics, it is possible also to trace anomalous blood pressure trends by analyzing if the new measured values are checked many times over threshold values. The proposed data information system has been tested for different sensors connected to a single tablet behaving as a router. Different sensors and tablets can realize a capillary network suitable for de-hospitalization processes and for big data analytics. For a capillary network, KNIME workflows can be directly connected to an ESB (enterprise service bus) by a web service connection [22] or directly to a Cassandra big data system by means of a proper connector [33] or by means a python script executing data migration in a local repository. Each patient is identified by an ID number and by an ID of the tablet recognized by the backend system. The control room platform visualizes for each patient a page containing their real-time data, historical, data and predicted ones (see Figure 13). By combining the analyses of different predicted physiological data, it is possible to find correlations, thus defining accurate risk maps associated with each patient.

5. Conclusions

By means of results achieved in a research project, the paper proves how to integrate a multi-level telemedicine DSS system for homecare assistance into a theoretical RPM platform having CRM and BPM functionalities. The proposed telemedicine communication system is based on web cloud communication able to manage different medical devices measuring data from patients at home. The realized system integrates telemedicine features into a DSS engine that analyzes the information contained in a database by means of a dashboard plotting real-time patient values and MLP-ANN algorithms. The DSS controls automatically the overcoming of thresholds values for real-time data and evaluates risk conditions activating alerts and assistance processes. The proposed RPM-DSS platform is suitable for homecare assistance management oriented on predictive diagnosis. A full UML design of the RMP-DSS is presented, defining all the features and actors involved in the system. The design is completed by the architectures of RMP, of the multi-level DSS, of the telemedicine network, and of the KNIME workflow implementing MLP-ANN predictive approaches on real-patient data. A parametric approach used for the optimization of the prediction accuracy proves that it is possible to integrate efficiently predictive algorithms in an RPM-based platform, by providing a methodology to analyze blood pressure predicted results. The experimentation has been performed on a patient monitored at home by a sensor detecting systolic values. The prototypal RPM-DSS e-health platform has been constructed starting to a previous homecare platform implementation integrating only the DSS level 1 [14]. The prototype is a versatile and flexible platform able to operate in the cloud, connecting a lot of patients and data in a big data system. The focus of the proposed research is in the design and development of the DSS system integrated in a resource management platform, and in the design and development of the MLP-ANN KNIME workflow, which can be easily adapted to other RPM frameworks involving different application fields. The platform is unique in its application scenario and could be adopted also for the development of cross services including other functionalities such as pill reminding, video consulting with external doctors, and linking with electronic patient records. The proposed study combines the mapping of process managements with DSS outputs, thus optimizing the assistance activities and services. The DSS experimentation on different patients by correlating different physiological data such as heart rate is under investigation.

Author Contributions

Conceptualization, A.G. and A.M.; Methodology, V.M. and A.M.; Software, V.M., D.C., E.D.F. and A.M.; Validation, A.M.; Formal Analysis, N.S.; Investigation, A.G., M.D.M. and A.M.; Resources, N.S., M.D.M.; Data Curation, A.M.; Writing-Original Draft Preparation, A.M.; Supervision, A.G. and M.D.M.; Project Administration, A.G., M.D.M. and N.S.

Funding

This research received no external funding.

Acknowledgments

The work has been developed in the frameworks of the projects: “Piattaforma B.I. intelligente di management risorse e di monitoraggio costi di assistenza sanitaria: ‘Healthcare Assistance Platform: Management and Resources Allocation’ [B.I. platform oriented on intelligent management of resources and on monitoring health care costs ‘Healthcare Assistance Platform: Management and Resources Allocation’]”. Authors gratefully thanks the researchers: V. Calati, D. Carella, A. Colonna, R. Cosmo, G. Fanelli, R. Guglielmi, A. Leogrande, A. Lombardi, A. Lorusso, N. Malfettone, F. S. Massari, G. Meuli, L. Pellicani, R. Porfido, D. Suma, F. Tarulli, and E. Valenzano.

Conflicts of Interest

The authors declare no conflict of interest.

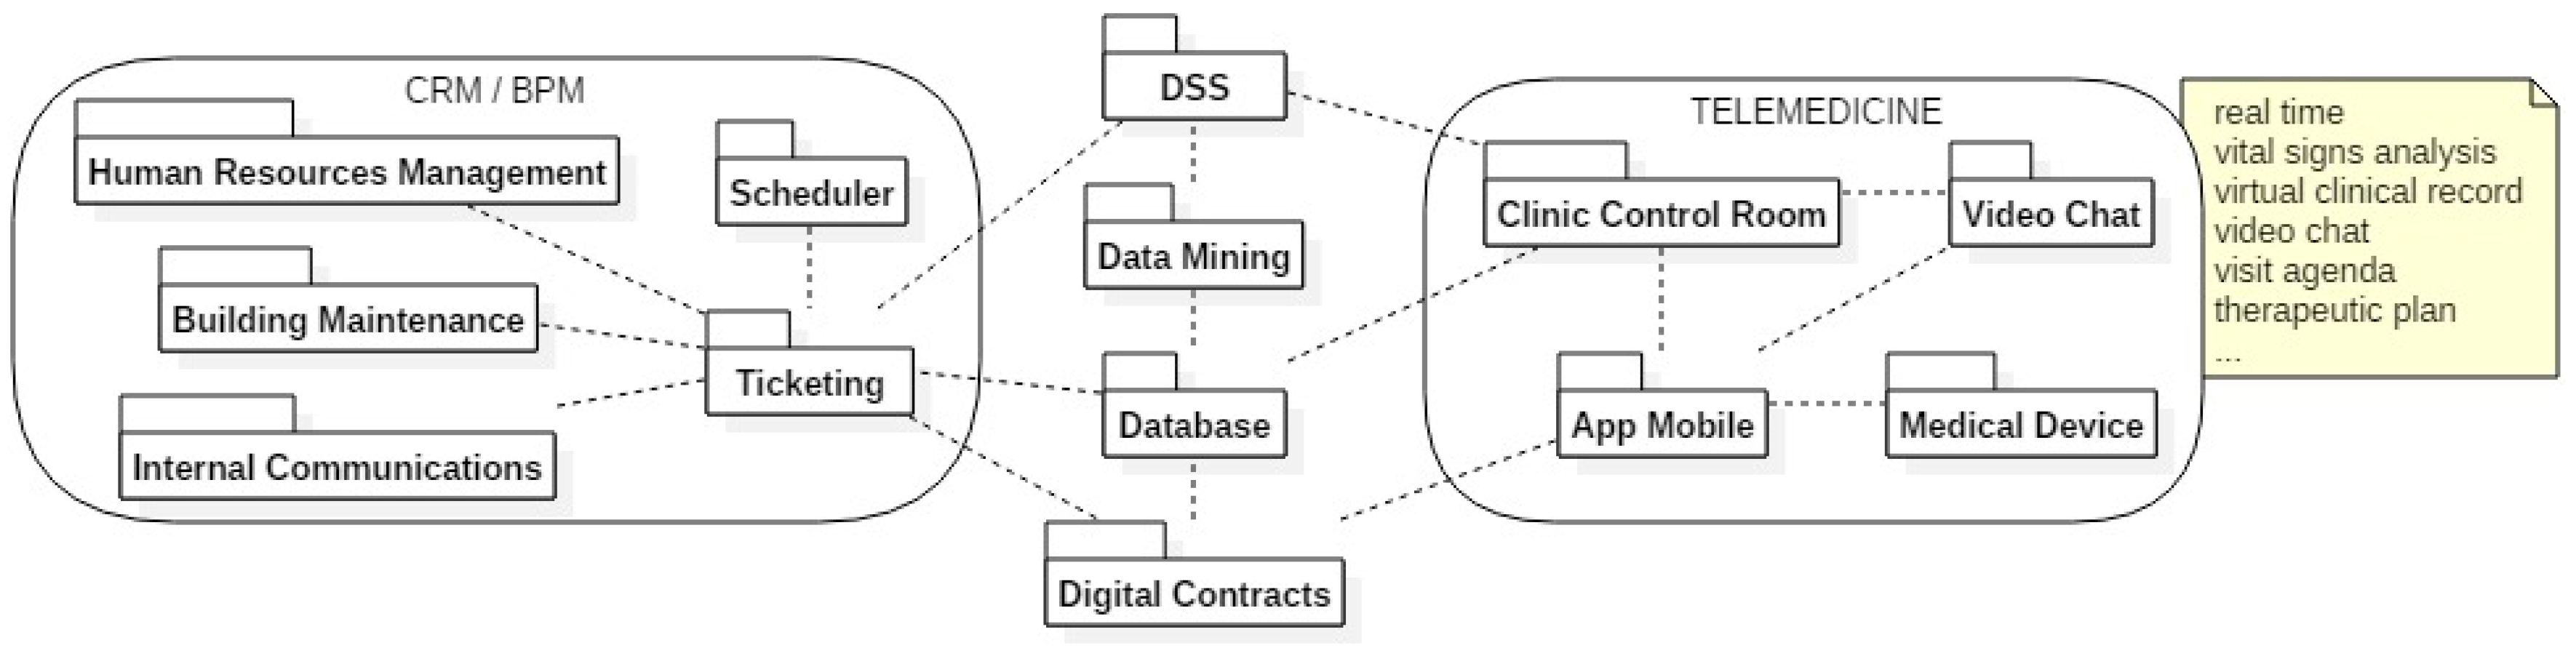
Appendix A. Diagram of the Implemented RPM-DSS Features

In Figure A1 reported below is illustrated the entity-associations diagram of the ticketing service.
Figure A1. Entity-association diagram of the ticketing service.
Information 09 00176 g0a1

Appendix B. Error Plot of the ANN-MLP Approcah

In Figure A2 reported below is illustrated the Error Plot of the node 4 related the RProp MLP Learner.
Figure A2. Error trend versus iterations.
Information 09 00176 g0a2

Appendix C. HL7 Protocol

Actually the study is also focused on the integration of the data protocol in the HL7 standard [34]. HL7 is a standardized text communication protocol between the clinic and medical storage systems. The HL7 domain therefore includes clinical and administrative health data. In this context it is important that the devices operate through this data protocol so that they can be “integrated” with the electronic patient record. More details about this topic are illustrated. In the figure reported below is illustrated an example of modeling of the HL7 protocol in the clinical field according to the functional architecture shown in Figure 2.
Figure A3. HL7 as communication protocol.
Information 09 00176 g0a3

Appendix D. Example of Procedure Validating Sensor Measurements

The health worker who assists the patient from home will be appropriately trained about the instrumentation and the devices that he will use for the analysis. Before acquiring the measures on the patient, he has to follow a specific procedure. Before starting a measurement he must check if the reference values, that define the range of validity of the medical device, have already been acquired; if these reference values are not acquired, he will have to proceed with the system calibration. The calibration process can be summarized as follow: the operator performs a test on a known sample and then defines the delta error from the detected measurements, and the margin of error correlated to the device accuracy (resolution). After the calibration process the Health operator can perform the measurement. He will repeat the measures if the first results are “anomalous”. The final measure will be transmitted to the laboratory staff who will then decide to validate the analysis. Laboratory personnel may decide to calibrate the instrument several times in a day, if deemed necessary.

References

  1. Naimah, A.; Habidin, N.F.; Jamaludin, N.H.; Khaidir, N.A.; Shazali, N.A. Customer relationship management and organizational performance in Malaysian healthcare industry. Int. J. Adv. Res. Technol. 2013, 2, 1–5. [Google Scholar]
  2. Chahal, H. Two component customer relationship management model for healthcare services. Manag. Serv. Qual. 2010, 20, 343–365. [Google Scholar] [CrossRef]
  3. Hsu, C.; Hsu, P.; Chiu, C. Customer relationship management in healthcare service—An integrated DSS framework for patient loyalty. In New Advances in Intelligent Decision Technologies. Studies in Computational Intelligence, 1st ed.; Nakamatsu, K., Phillips-Wren, G., Jain, L.C., Howlett, R.J., Eds.; Springer: Berlin/Heidelberg, Germany, 2009; Volume 199, pp. 509–517. ISBN 978-3-642-00908-2. [Google Scholar]
  4. Digital and Disrupted: All Change for Healthcare. ROLAND BERGER GMBH. 2016. Available online: https://www.rolandberger.com/de/Publications/pub_digital_and_disrupted_all_change_for_healthcare.html?country=null (accessed on 25 May 2018).
  5. Li, J.-S.; Yu, H.-Y.; Zhang, X.-G. Data mining in hospital information system. In New Fundamental Technologies in Data Mining, 1st ed.; Funatsu, K., Ed.; InTech: Rijeka, Croatia, 2011; Volume 1, pp. 143–172. ISBN 978-953-307-547-1. [Google Scholar]
  6. Goodwin, L.; VanDyne, M.; Lin, S. Data mining issues and opportunities for building nursing knowledge. J. Biomed. Inf. 2003, 36, 379–388. [Google Scholar] [CrossRef]
  7. Belacel, N.; Boulassel, M.R. Multicriteria fuzzy assignment method: A useful tool to assist medical diagnosis. Artif. Intell. Med. 2001, 21, 201–207. [Google Scholar] [CrossRef]
  8. Demšar, J.; Zupan, B.; Aoki, N.; Wall, M.J.; Granchi, T.H.; Beck, J.R. Feature mining and predictive model construction from severe trauma patient’s data. Int. J. Med. Inf. 2001, 63, 41–50. [Google Scholar] [CrossRef]
  9. Kusiak, A.; Dixon, B.; Shah, S. Predicting survival time for kidney dialysis patients: A data mining approach. Comp. Biol. Med. 2005, 35, 311–327. [Google Scholar] [CrossRef] [PubMed]
  10. Yu, H.; Li, J.; Han, X. Data mining analysis of inpatient fees in hospital information system. In Proceedings of the IEEE International Symposium on IT in Medicine & Education ITME2009, Jinan, China, 14–16 August 2009. [Google Scholar]
  11. Morando, M.; Ponte, S.; Ferrara, E.; Dellepiane, S. Definition of motion and biophysical indicators for home-based rehabilitation through serious games. Information 2018, 9, 105. [Google Scholar] [CrossRef]
  12. Chae, Y.M.; Kim, H.S.; Tark, K.C.; Park, H.J.; Ho, S.H. Analysis of healthcare quality indicator using data mining and decision support system. Exp. Sys. Appl. 2003, 24, 167–172. [Google Scholar] [CrossRef]
  13. Ozcan, Y.A. Quantitative Methods in Health Care Management, 2nd ed.; Josey-Bass: California, CA, USA, 2009; pp. 10–44. ISBN -13. [Google Scholar]
  14. Galiano, A.; Massaro, A.; Boussahel, B.; Barbuzzi, D.; Tarulli, F.; Pellicani, L.; Renna, L.; Guarini, A.; De Tullio, G.; Nardelli, G.; et al. Improvements in haematology for home health assistance and monitoring by a web based communication system. In Proceedings of the IEEE International Symposium on Medical Measurements and Applications, Benevento, Italy, 15–18 May 2016. [Google Scholar]
  15. Matlani, P.; Londhe, N.D. A cloud computing based telemedicine service. In Proceedings of the Point-of-Care Healthcare Technologies (PHT), Bangalore, India, 16–18 January 2013. [Google Scholar]
  16. Hsieh, J.; Hsu, M.W. A cloud computing based 12—Lead ECG telemedicine service. BMC Med. Inf. Dec. Mak. 2012, 12, 1–12. [Google Scholar] [CrossRef] [PubMed]
  17. Ghavami, P.; Kapur, K. Artificial neural network-enabled prognostics for patient health management. In Proceedings of the Prognostics and Health Management (PHM), Denver, CO, USA, 18–21 June 2012. [Google Scholar]
  18. Grossi, E. Artificial Neural Networks and Predictive Medicine: A Revolutionary Paradigm Shift. In Artificial Neural Networks—Methodological Advances and Biomedical Applications, 1st ed.; Suzuki, K., Ed.; InTech: Rijeka, Croatia, 2011; Volume 1, pp. 130–150. ISBN 978-953-307-243-2. [Google Scholar]
  19. Adhikari, N.C.D. Prevention of heart problem using artificial intelligence. Int. J. Artif. Intell Appl. 2018, 9, 21–35. [Google Scholar] [CrossRef]
  20. Massaro, A.; Maritati, V.; Galiano, A. Data Mining model performance of sales predictive algorithms based on RapidMiner workflows. Int. J. Comp. Sci. Inf. Technol. 2018, 10, 39–56. [Google Scholar] [CrossRef]
  21. Massaro, A.; Galiano, A.; Meuli, G. Overview and application of enabling technologies oriented on energy routing monitoring, on network installation and on predictive maintenance. Int. J. Artif. Intell Appl. 2018, 9, 1–20. [Google Scholar] [CrossRef]
  22. Massaro, A.; Maritati, V.; Galiano, A.; Birardi, V.; Pellicani, L. ESB platform integrating KNIME data mining tool oriented on Industry 4.0 based on artificial neural network predictive maintenance. Int. J. Artif. Intell Appl. 2018, 9, 1–17. [Google Scholar] [CrossRef]
  23. Wimmer, H.; Powell, L.M. A comparison of open source tools for data science. J. Inf. Syst. Appl. Res. 2016, 9, 4–12. [Google Scholar]
  24. Al-Khoder, A.; Harmouch, H. Evaluating four of the most popular open source and free data mining tools. Int. J. Acad. Scient. Res. 2015, 3, 13–23. [Google Scholar]
  25. Gulli, A.; Pal, S. Deep Learning with KERAS—Implement Neural Networks with Keras on Theano and Tensor Flow; Packt Publishing: Birmingham, UK, 2017; ISBN 978-1-78712-842-2. [Google Scholar]
  26. Kovalev, V.; Kalinovsky, A.; Kovalev, S. Deep Learning with Theano, Torch, Caffe, TensorFlow, and deeplearning4j: Which one is the best in speed and accuracy? In Proceedings of the XIII International Conference on Pattern Recognition and Information Processing, Minsk, Belarus, 3–5 October 2016; pp. 99–103. [Google Scholar]
  27. Al-Shayea, Q.K. Artificial neural networks in medical diagnosis. Int. J. Comp. Sci. Issue 2011, 8, 150–154. [Google Scholar]
  28. Braun, H. A direct adaptive method for faster backpropagation learning: The RPROP algorithm. In Proceedings of the IEEE International Conference on Neural Networks, San Francisco, CA, USA, 28 March–1 April 1993. [Google Scholar]
  29. Igel, C.; Toussaint, M.; Weishui, W. RProp using the natural gradient. In Trends and Applications in Constructive Approximation; Mache, D.H., Szabados, J., de Bruin, M.G., Eds.; Birkhäuser: Basel, Switzerland, 2005; Volume 151, pp. 259–272. ISBN 978-3-7643-7124-1. [Google Scholar]
  30. Bastos, P.; Lopes, I.; Pires, L. Application of data mining in a maintenance system for failure prediction. In Safety, Reliability and Risk Analysis: Beyond the Horizon; Steenbergen, R., Van Gelder, P.H.A.J.M., Miraglia, S., Vrouwenvelder, T., Eds.; Taylor & Francis Group: London, UK, 2014; pp. 933–940. ISBN 978-1-138-00123-7. [Google Scholar]
  31. Communication from the Commission to the European Parliament, the Council, the European Economic and Social Committee and the Committee of the Regions on Telemedicine for the Benefit of Patients, Healthcare Systems and Society. Available online: https://ec.europa.eu/transparency/regdoc/rep/1/2008/EN/1-2008-689-EN-F1-1.pdf (accessed on 19 June 2018).
  32. Telemedicina—Linee di Indirizzo Nazionali (Approved by Italian Superior Council of Helath, 10 July 2012). Available online: http://www.salute.gov.it/imgs/C_17_pubblicazioni_2129_allegato.pdf (accessed on 19 June 2018).
  33. Cassandra: JDBC Driver Download. Available online: https://www.cdata.com/drivers/cassandra/download/jdbc/ (accessed on 25 May 2018).
  34. HL7 Health Level Seven International. Available online: http://www.hl7.org/implement/standards/product_section.cfm?section=1 (accessed on 19 June 2018).
Figure 1. Simplified architecture of a resource management platform integrating a data-mining engine (artificial neural network (ANN) and decision support system (DSS)).
Information 09 00176 g001
Figure 2. Architecture of the telemedicine platform: patients’ data flow as an evolution of the architecture proposed in Reference [14] (the red, dashed line embeds the developed prototype system).
Information 09 00176 g002
Figure 3. Information workflow of the information system associated with the architecture of Figure 1.
Information 09 00176 g003
Figure 4. UML (unified modeling language) functional layout representing all the actors involved in the prototype architecture system.
Information 09 00176 g004
Figure 5. UML functional layout concerning interactions between the Health Worker and control room platform interface.
Information 09 00176 g005
Figure 6. The features exposed by the RMP-DSS platform.
Information 09 00176 g006
Figure 7. Control room panel layout: DSS level 1.
Information 09 00176 g007
Figure 8. Control room: architecture of the multilevel DSS system (t1 < t2t3).
Information 09 00176 g008
Figure 9. RapidMiner dashboard: experimental dataset.
Information 09 00176 g009
Figure 10. KNIME (Konstanz Information Miner): MLP graphical user interface (GUI) neural network for the prediction of the health status of a patient.
Information 09 00176 g010
Figure 11. KNIME MLP prediction results of systolic values.
Information 09 00176 g011
Figure 12. Choice of the parameters performing the lower mean absolute error: mean absolute error versus number of hidden layers (a); versus maximum number of iterations (b); versus number of hidden neurons per layer (c); and versus different sampling approach for the partitioning (d).
Information 09 00176 g012
Figure 13. Example of monitoring different patient data.
Information 09 00176 g013
Table 1. Features and advantages of the RPM-DSS and system proposed in Reference [14].
FunctionalitiesProposed RPM-DSS SystemSystem Proposed in Reference [14]
Real-time monitoring (smart-sensor data)
Control panel room linked to patients at home (point to multi-point connection)
Wireless sensor (patient data)
Bidirectional communication systemx
High number of supported sensorsx
Video chatx
DSS multi-levelx
Patient status prediction (MLP-ANN)x
DSS supporting BPM and visits schedulingx
BPM integrationx
CRM integrationx
Connection with a big data systemx
Mobile device behaving as a routerx
Predisposition for cross servicesx
Table 2. Medical devices implemented for homecare assistance.
DeviceFunctionalityConnectivity
Pulse oximeterBlood oxygen saturation, pedometer, heartbeatBluetooth
ECG mobileOne channel ECGBluetooth
SpirometerRespiratory functionBluetooth
SphygmomanometerBlood pressure, heartbeatBluetooth
Infrared thermometerBody temperature °CBluetooth
Device of multiple parametersHeartbeat, external and internal body temperature, SpO2, NIBP, 5-channel ECGEthernet/WiFi
Hematological deviceHematological analysisEthernet
Table 3. Systolic and diastolic blood pressure risk classification.
CategorySystolic (mmHg)Diastolic (mmHg)
Hypotension<90<60
Normal90–11960–79
Stage 1 hypertension130–13980–89
Stage 2 hypertension>140>90
Hypertensive crisis≥180≥120

