
An SVM Framework for Malignant Melanoma Detection Based on Optimized HOG Features

1
Department of Mathematics and Computer Science, Faculty of Science, Sohag University, 82524 Sohag, Egypt
2
Institute for Information Technology and Communications, Otto-von-Guericke-University Magdeburg, P.O. Box 4120, 39016 Magdeburg, Germany
Computation 2017, 5(1), 4; https://doi.org/10.3390/computation5010004
Submission received: 19 September 2016
/
Revised: 8 December 2016
/
Accepted: 15 December 2016
/
Published: 1 January 2017
(This article belongs to the Section Computational Biology)
Abstract
:Early detection of skin cancer through improved techniques and innovative technologies has the greatest potential for significantly reducing both morbidity and mortality associated with this disease. In this paper, an effective framework of a CAD (Computer-Aided Diagnosis) system for melanoma skin cancer is developed mainly by application of an SVM (Support Vector Machine) model on an optimized set of HOG (Histogram of Oriented Gradient) based descriptors of skin lesions. Experimental results obtained by applying the presented methodology on a large, publicly accessible dataset of dermoscopy images demonstrate that the proposed framework is a strong contender for the state-of-the-art alternatives by achieving high levels of sensitivity, specificity, and accuracy (98.21%, 96.43% and 97.32%, respectively), without sacrificing computational soundness.
1. Introduction
The National Cancer Institute (NCI) reported that melanoma is the most common form of cancer in adults ages 25 to 29. Moreover, it is estimated that there will be 76,380 new cases of melanoma and 10,130 deaths in 2016 [1]. Although melanoma, the most deadly type of skin cancer, is the fourth most common cancer and accounts for only 4% of all skin cancers, it is particularly responsible for the most deaths of all skin cancers, with nearly 9000 people dying from it each year. It has been further pointed out that approximately over 80% of all skin cancer related deaths are accounted for by melanoma. It is therefore vital that melanoma be diagnosed and treated as early as possible in order to be cured successfully. On the other hand, if the melanoma is not treated quickly and removed timely, it penetrates, and, like some other cancers, can grow deeper into the skin and spread to other parts of the body. The consequences of a late diagnosis of melanoma are very significant in terms of personal health, medical procedures and costs.
The Skin Cancer Foundation (SCF) recently reported that melanoma is the most serious form of skin cancer because it is more likely to spread to other parts of the body. Once melanoma spreads beyond the skin to other parts of the body, it becomes hard to treat. However, early detection saves lives. Research shows that when melanoma is recognized and treated in its early stages, it is nearly 100% curable. Without early treatment, the cancer can advance, spread and be fatal. Today, it is well documented that there is seemingly every reason to believe that melanoma cells originate from the presence of melanocytes in any body part. Therefore, it might seem beyond mere chance that melanocytes are the precursors of melanoma. It is a well-known fact that excessive sunlight exposure is a well-known risk factor for melanoma and generally environmental exposure of skin to ultraviolet (UV) radiation (e.g., UV-A and -B radiation) provides a strong determinant of melanoma risk, which increases substantially with prolonged exposure and more intense exposure.
Epiluminescence Microscopy (ELM), also known as dermoscopy or dermatoscopy [2], which is currently used to supplement the traditional clinical diagnosis is a noninvasive, in vivo clinical examination technique in which oil immersion and optical magnification are used to make the epidermis translucent and to allow the visual examination of sub surface structures of the skin. However, for experienced users, ELM is viewed as more accurate than clinical examination for the diagnosis of melanoma in pigmented skin lesions. Despite the detection rate of melanoma from dermoscopy being significantly higher than that achieved from unaided observation, the diagnostic accuracy of dermoscopy depends in large part on the training of the dermatologist.
Differential diagnosis of melanoma from melanocytic nevi is not straightforward and is often considered as particularly clinically challenging for skin cancer specialists, especially in the early stages. Even when using dermoscopy for diagnosis, the accuracy of melanoma diagnosis by expert dermatologists [3] is estimated to be within no more than 75%–84%, which is still considered to be rather far from satisfaction for diagnostic purposes. This greatly motivates the recent growing interest in diagnostics techniques for computer-assisted analysis of lesion images, which can instead be efficiently and effectively applied.
Despite the fundamental fact that no computer or machine has yet achieved human intelligence, relatively simple computer vision algorithms can be used to efficiently extract different types of pertinent information (such as texture features) from the image data in a robust and reliable manner, which might not be discernible by human vision. Perusal of the general clinical literature reveals that numerous algorithms and methodologies have been proposed by medical researchers and clinicians for the classification of malignant lesions using dermoscopy images. Some highly prevailing examples of these methodologies are the Pattern Analysis [4], ABCD rule [5], Menzies method [6], and 7-point checklist [7]. Most of the proposed techniques require automatic segmentation processes that turn out to be severely ill-posed and thus extremely challenging, due to the great diversity of tumor intensities, the ambiguity of boundaries between tumors and surrounding normal skin tissues, and the irregularity of the highly varying structure of the tumour cells, where dermoscopy views of histological tissues show structures mostly arranged in a variety of patterns.
A computer-vision based system, commonly called a computer aided diagnosis (CAD) system, for diagnosis or prognosis of skin cancer (e.g., melanoma) usually involves three major steps: (i) preprocessing and lesion segmentation; (ii) feature extraction and selection; and (iii) lesion classification. The only prerequisite of the first step is the acquisition of the skin lesion image. The patients can capture images of their skin lesions using smart phone cameras. The task of preprocessing relates to the noise filtering such as removal of salt-and-pepper noise and image enhancement. Afterwards, lesion segmentation is applied. During this step, the main aim is the precise separation of the skin lesion from the surrounding healthy skin in order to isolate only the region of interest (ROI).
During the step of feature extraction, a set of relevant dermoscopic features similar to those visually recognized by expert dermatologists such as asymmetry, border irregularity, color, differential structures, etc. is determined and extracted from the segmented lesion region to accurately characterize a melanoma lesion. Due to its low computational and implementation complexities, the diagnostic algorithm using the ABCD rule of dermoscopy is widely employed for efficient feature extraction in numerous computer-aided melanoma detection systems. Moreover, the ABCD rule based algorithm proved to be very much effective due to its comparative advantage in the plethora of a wide range of promising features extracted from a melanoma lesion. Finally, the features extracted from skin lesions are fed into the feature classification module in order to classify skin lesions into one of two distinct categories: cancerous or benign, by simply comparing the feature parameters with the predefined thresholds.
The remainder of the paper is structured as follows. The subsequent section presents previous work related to the paper subject. The general framework and details of the proposed approach are given in Section 3. Then, in Section 4, the experiments and evaluation results are reported and discussed. Finally, some conclusion remarks and possible future research directions are given in Section 5.
2. Related Work
In recent years, the incidence of skin cancer cases has continued to escalate rapidly and the condition now affects millions of people worldwide, mainly due to the prolonged exposure to harmful ultraviolet radiation. Over the past two decades or so, many researchers in the fields of computer vision and medical image analysis have been attracted to develop high performance automatic techniques for skin cancer detection from dermoscopic images [8,9]. Accurate skin lesion segmentation plays a crucial role in automated early skin cancer detection and diagnosis systems. For the segmentation of skin lesions presented in dermoscopic images, there are three major approaches: namely, manual, semi-automatic, and fully automatic boundary based methods. Examination of the relevant literature on medical image segmentation suggests that a combination of fundamental low-level image attributes such as color, texture, shape, etc. provides a robust set of visual features for fully automatic skin lesion segmentation.
There is an abundance of literature that details a wide range of image segmentation approaches and methodologies including, but not limited to, methods employing histogram thresholding [10,11], clustering [12,13], active contours [14,15], edge detection [16,17], graph theory [18], and probabilistic modeling [19,20]. Successful application of these methods, either individually or in combination, is expected to achieve optimum segmentation accuracy while maintaining the robustness to noise [21,22]. The features aforementioned have been extensively used in a wide variety of both very early and recent approaches for medical image segmentation [23,24].
In [10], a color space analysis and a global histogram thresholding based method for automatic border detection in dermoscopy image analysis is proposed, where a competitive performance in detecting the borders of melanoma lesions has been achieved. Also related, but in a slightly different vein, is [24]. In this work, a methodological approach to the classification of dermoscopy images is proposed, where a Euclidean distance transform based technique for the extraction of color and texture features is employed to split a given dermoscopy image into a series of clinically relevant regions. The most common approach to identifying the physical characteristics of melanoma is a rule referred to as ABCD skin cancer. As mentioned earlier, due to its effectiveness and simplicity, the ABCD rule is used by most computer-assisted diagnosis systems to classify melanomas. The findings suggest that, among all the physical characteristics of melanoma (i.e., asymmetry, border irregularity, color, and diameter), asymmetry is the most prominent for the clinical diagnosis of skin lesions [5]. In a similar vein, a number of research works have been conducted with a focus on quantifying asymmetry in skin lesions. For instance, in [25], Ng et al. use fuzzy borders as well as geometrical measurements of skin lesions (e.g., symmetric distance and circularity) to determine the asymmetry of skin lesion. Another related work is [26], where the circularity index is introduced as a measure of border irregularity in dermoscopy images to classify skin lesions. An elaborated overview of the most important implementations of advanced computer vision systems available in the literature for skin lesions characterization is provided in [23]. Moreover, as a key part of this work, the authors have presented a detailed comparison of the performance of multiple classifiers specifically developed for skin lesion diagnosis.
3. Proposed Methodology
In this section, the proposed approach for melanoma skin cancer detection is described. A brief conceptual block diagram of the approach is illustrated in Figure 1. As schematically illustrated in the figure, the general framework of our proposed approach works as follows. As an initial step, the skin lesion region that is suspected to be a melanoma lesion is first segmented from the surrounding healthy skin, by applying adaptive thresholding and morphological operations. Then, a set of low-dimensional HOG-based texture features is extracted from the skin lesion region. Thereafter, a one-dimensional vector representation is formed from the extracted features and fed into an SVM classifier for skin lesion classification. The SVM classifier is trained on a dataset comprised of both melanoma and other benign skin lesion images taken from different patients. Finally, the trained SVM model is used to classify each previously unseen skin lesion in a dermatoscopic image as a benign or malignant lesion. The details of each part of our method are described in the remainder of this section.
3.1. Skin Lesion Segmentation
As stated earlier, the main purpose of the first step in computer-aided diagnosis of melanoma is the isolation of the skin lesion (i.e., lesion region of interest) from the surrounding healthy skin. Due to the limitations of capturing devices and/or improper environmental illumination conditions, acquired images are likely to suffer from poor contrast and high noise levels [27]. Therefore, it is necessary to enhance the image contrast and reduce the noise levels to increase image quality. Generally, the principal objective of image enhancement is to modify attributes of a given image so that it can be more suitable for subsequent tasks of segmentation and feature extraction. In primary image processing, images are often preprocessed by filtering techniques such as smoothing, edge enhancement, noise reduction, binarization, etc.
For the current task, due to extraneous artifacts such as skin lines, air bubbles and hair that appear in almost every image, dermoscopy images are obligatorily enhanced by filtering the noise occurring during intrusion of small hairs, scars in the human skin. This process is twofold. The first step is a simple 2D smoothing filter. This is achieved by smoothing the histogram of the input image using the band pass filtering to detect the spike regions in the histogram. The second one is connected with dark and thick hairs that need to be unpainted before the following processes of segmentation and local feature extraction. Moreover, the preprocessing involves the image resizing and contrast and brightness adjustment to compensate the non-uniform illumination in input images. To do this, histogram equalization as a contrast enhancement technique based on a histogram of the image is applied. There are various contrast enhancement techniques proposed as an extension of the traditional histogram equalization such as power constrained contrast enhancement, dynamic range compression, color model conversion, gamma correction and channel division methodologies.
For segmentation of skin lesions in the input image, our approach involves iterative automatic thresholding and masking operations, which are applied to the enhanced skin lesion images. The procedure begins with applying the standard Otsu method [28] for automatic thresholding segmentation for each of R, G and B channel in the input image. Then, binary masks are generated for the detected structures of each color channel and a majority logic function is applied to individual color channels to produce a preliminary segmented lesion mask. It is important to emphasize that the three-channel masking procedure is used here to improve the overall segmentation quality. The application of the segmentation procedure is likely to result in a segmented image with very small blobs which are not the skin lesions, commonly called an over-segmented image. To cope with this problem, a common solution is to employ morphological area-opening [29] on the over-segmented image, which is used for choosing markers to avoid over-segmentation. Finally, the final segmented region that contains only the skin lesion can be determined by smoothing the binary image using an iterative median filter procedure with a series of gradually decreasing filter sizes (i.e., 7 × 7, 5 × 5 and 3 × 3).
Moreover, in order to avoid detecting extremely small non skin lesions and to prevent confusing isolated artifacts with objects of interest, we take extra precautions by applying two further filters in order to guarantee that it corresponds to the skin lesion of interest. First, an adaptive morphological open-close filter is iteratively applied to the resulting binary image to erase objects that are too small from the binary image, while maintaining the shape and size of large objects. This filter is preferentially realized by a cascade of erosion and dilation operations, using locally adaptive structuring elements.
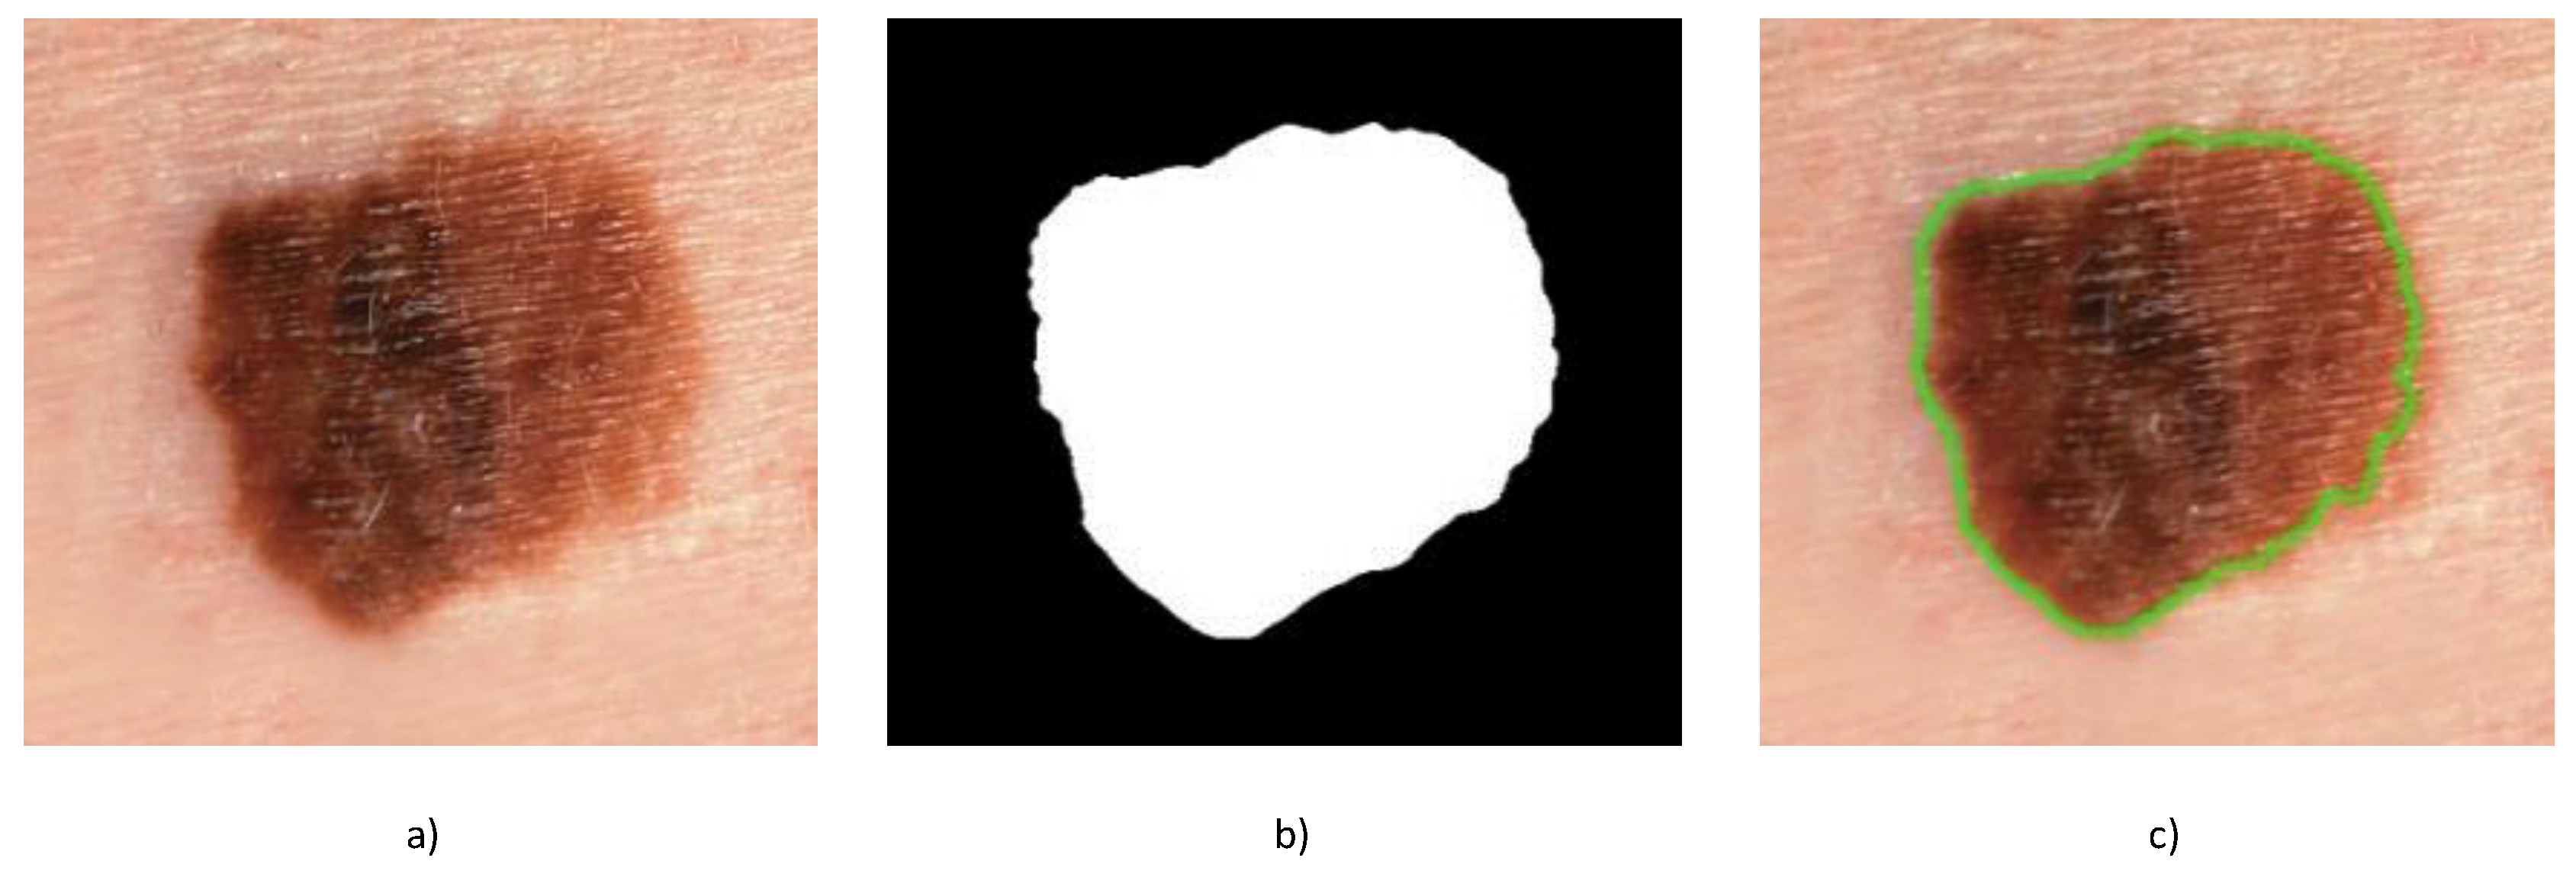
As a second filter, the so-called size filter is employed to remove objects that are less than a specified size. Once applying the size filter, almost all spurious objects with a size less than 5% of the image size are removed from the binary image. However, after filtering out all unwanted image elements and isolated artifacts, all of the contours are identified by applying a modified Canny edge detector [30] to the image to extract high contrast contours with edges having particular “preferred” orientations. Assuming that the skin lesion of interest represents the largest contour, it is easily extracted and isolated as the contour having the largest area (see Figure 2). As is obvious from the figure, the proposed approach is capable of producing very precise segmentation of the skin lesion from the surrounding healthy skin.
3.2. Feature Extraction
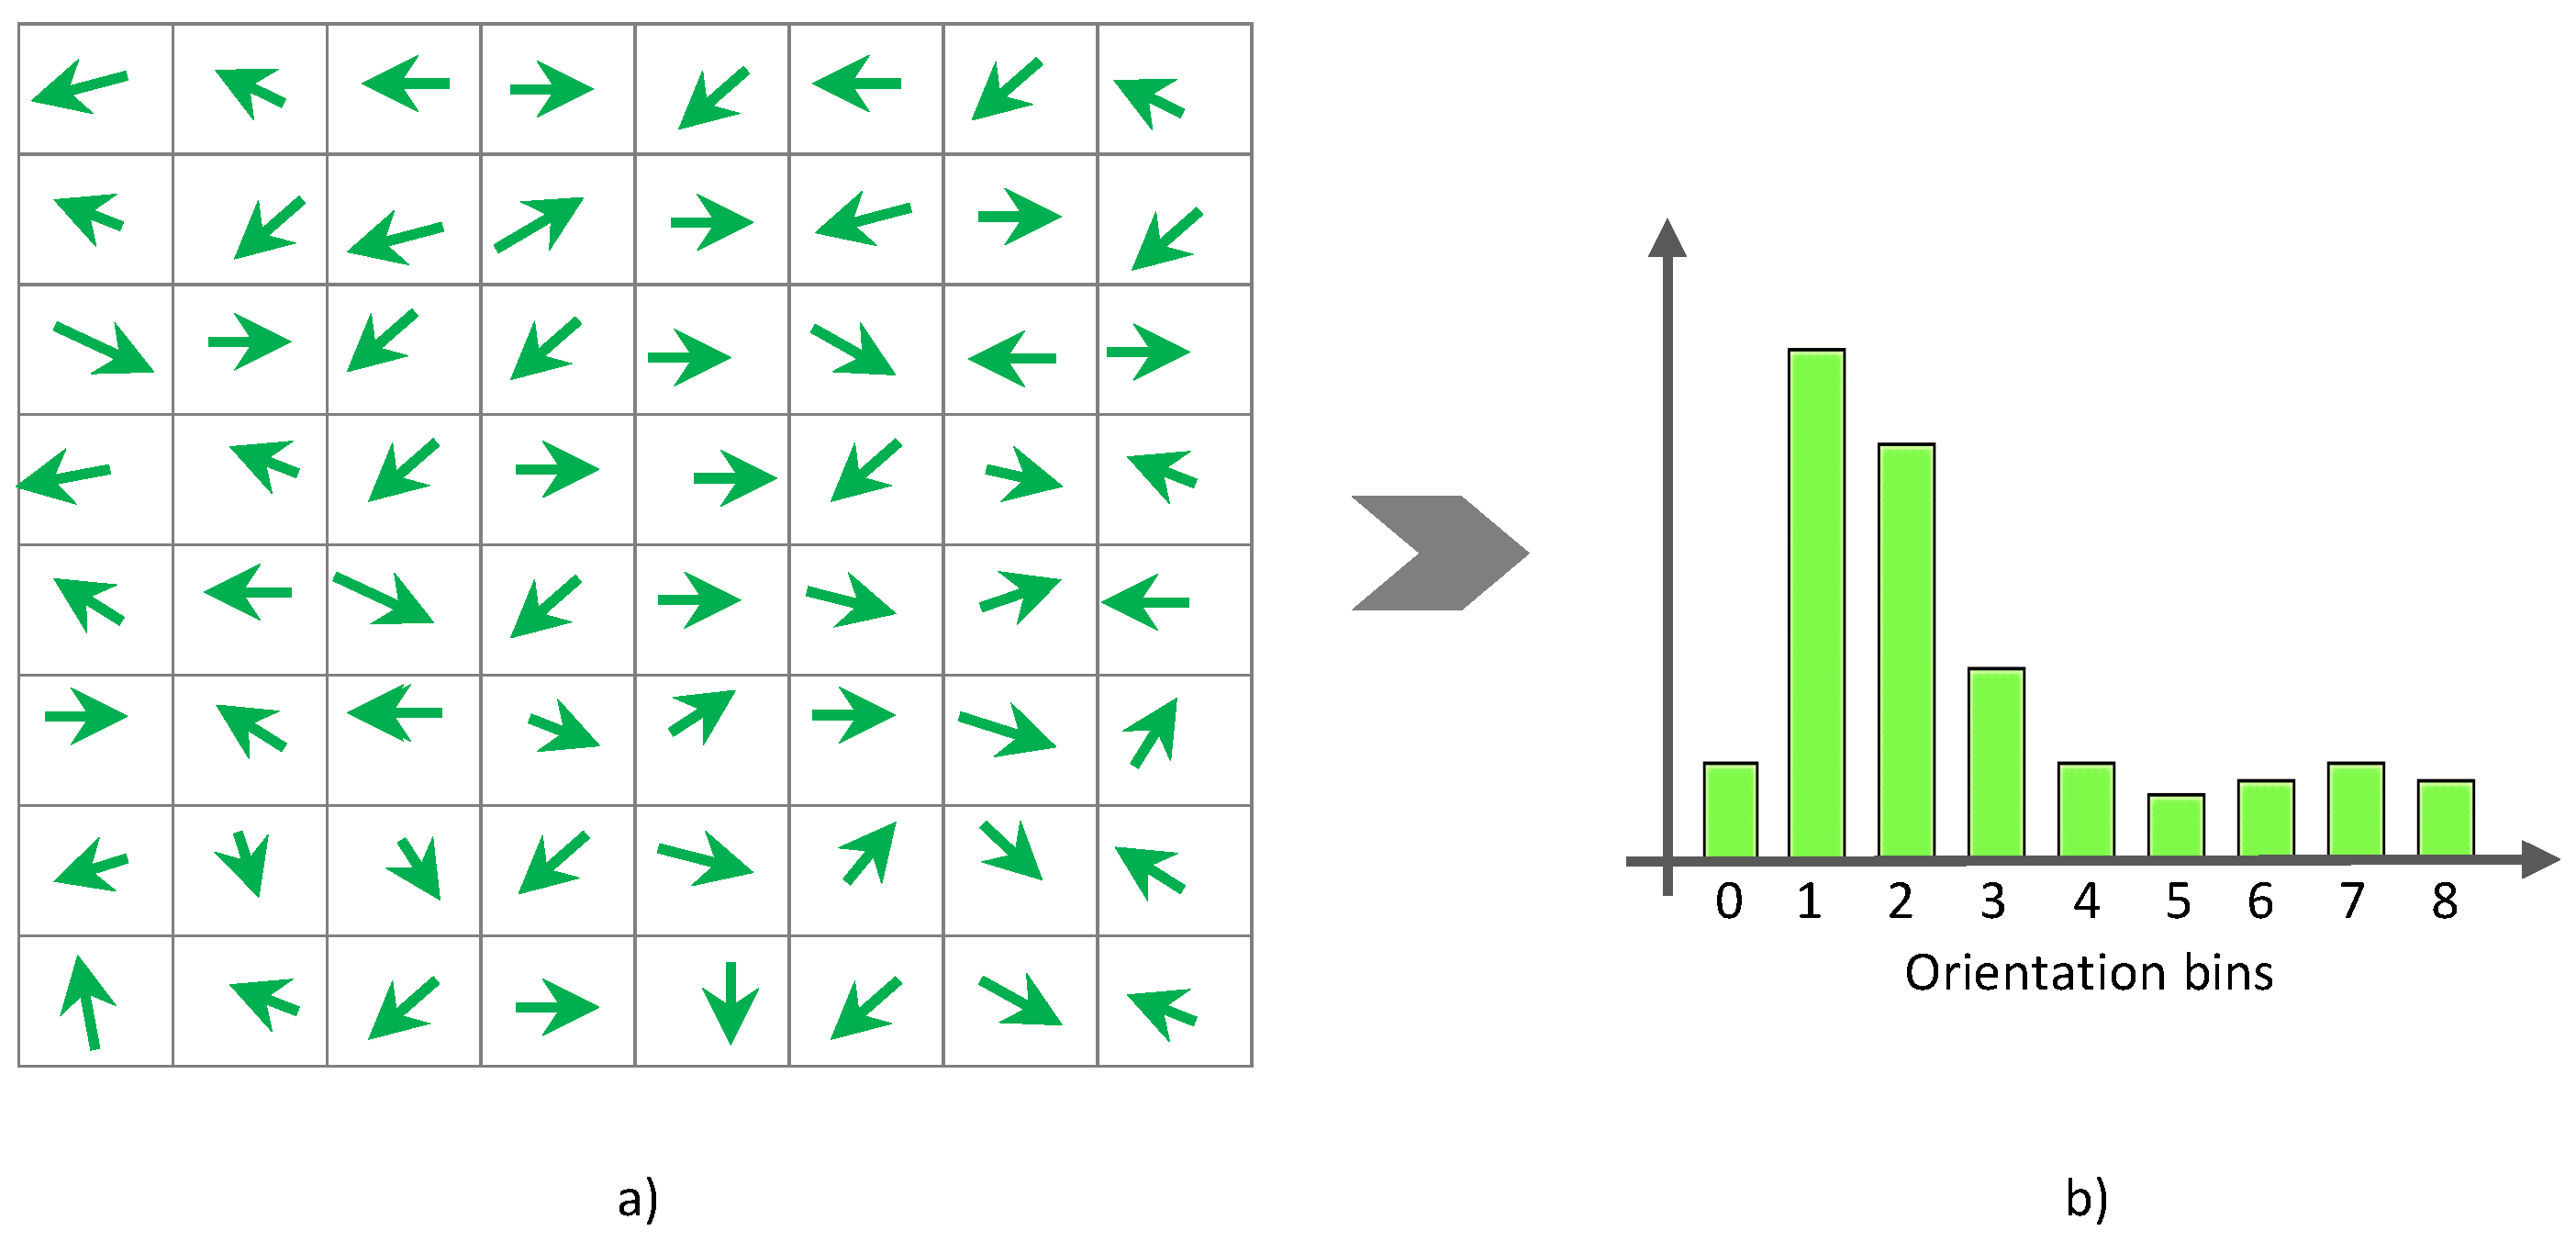
Due to their robustness to varying illumination and local geometric transformations and simplicity in implementation, HOG [31] features have been widely adopted (and are still being adopted) by many successful object detectors such as faces, pedestrians, and vehicles. Broadly speaking, HOG are constructed typically by imitating the visual information processing in the brain, and their features have proven to be an effective way of describing local object appearances and shapes by their distribution of intensity gradients or edge directions. In this section, we explain how to extract the local HOG features from the skin lesion region. In the process of HOG feature extraction, these features are computed by taking orientation histograms of edge intensity in a local lesion region. For realizing this purpose, two computation units are locally defined, namely cell and block. Typically, the cell size is 8 × 8 pixels, and each block contains 2 × 2 cells (i.e., 16 × 16 pixels) for each HOG feature. Since the HOG detector depends on the window overlap principle by default, the HOG blocks typically overlap such that each cell contributes more than once to the final feature descriptor. Adjacent neighboring blocks overlap by eight pixels both horizontally and vertically.
To extract HOG features, we compute orientations of local image gradient at each pixel located at coordinate . To realize this goal, we first need to calculate the magnitude and direction , which are mathematically formulated as follows:
where and are the first-order Gaussian derivatives of the image patch luminance I in the x- and y-directions, respectively, which are computed for scale parameter σ as follows:
where * denotes 2D discrete convolution. Then, we discretize γ into a fixed number of gradient orientation bins (e.g., nine bins). For every pixel in the orientation image, a histogram of orientations is constructed over a cell (i.e., local spatial window) such that each pixel in the cell votes for a gradient orientation bin with a vote proportional to the gradient magnitude ρ at that pixel (see Figure 3). More formally, the weight of each pixel denoted by α can be computed as follows:
where b is the bin to which γ belongs and n indicates the total number of bins. For reducing aliasing, we increment both values of two neighboring bins as
The weighted votes are then accumulated into orientation bins over local spatial regions, so called cells. In this work, we use normalized histograms as feature descriptors to represent a skin lesion object or texture. In fulfillment of this purpose, we construct a normalized histogram for each block by combining all histograms belonging to that block that consists of four cells. The normalization process is formulated as follows:
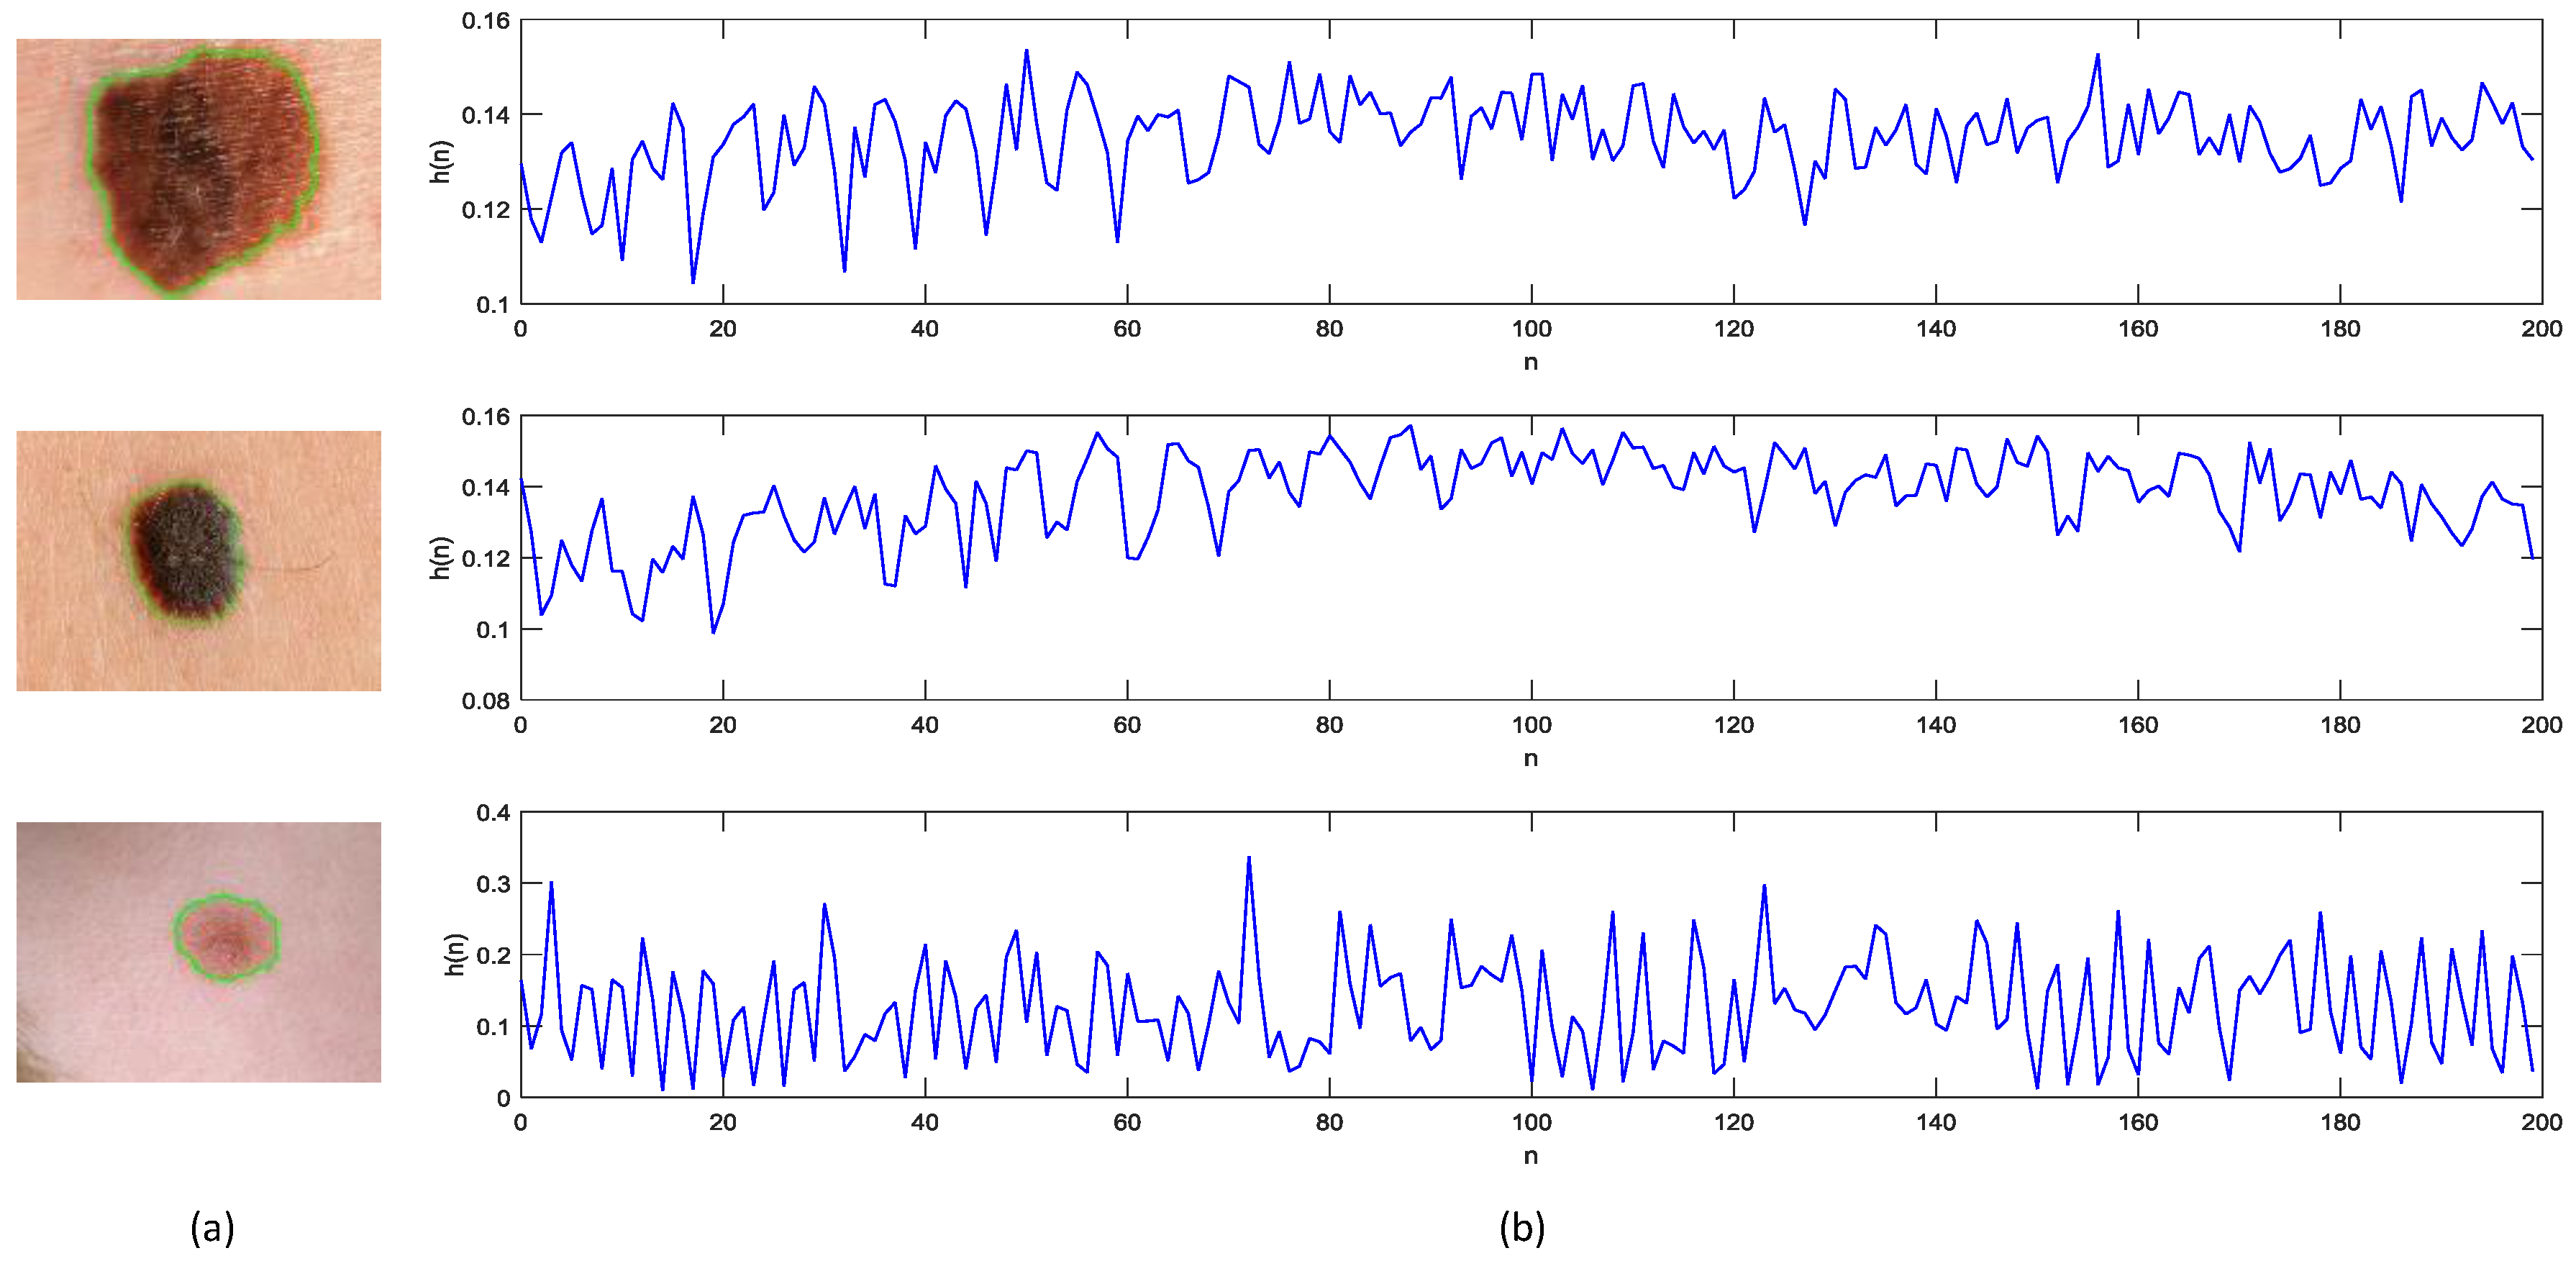
where i indicates the vector index running from 1 to 36 (4 cells × 9 bins), is a vector corresponding to a combined histogram for a given block, 36, and ε is a small positive constant used to avoid division by zero. Figure 4 shows sample 2D plots for the HOG-based descriptor of the features extracted from three segmented skin lesions, where, from top to bottom, the first two dermoscopy images contain malignant melanoma, while the last one contains benign lesions. As suggested by the figure, the general curve behavior of HOG-based descriptors for the skin lesions containing malignant melanoma is remarkably similar in both shape and magnitude.
3.3. Skin Lesion Classification
In this section, we describe details of the feature classification module that we employed in our automatic skin lesion malignance detection system to yield the final detection results. The main purpose of the classification module is to classify a given pigmented skin lesion into one of the two classes (melanoma versus non melanoma lesions), depending on the features extracted from the given skin lesion. The classification module is primarily based on the availability of a set of previously labeled or classified skin lesions. In this case, this set of pigmented skin lesions is termed the training set and the resulting learning strategy is supervised learning.
For the automatic classification of pigmented skin lesions, there are numerous reliable classification methods [32,33,34,35,36] developed in literature with the aid of learning algorithms, such as Naïve Bayesian (NB), k-Nearest Neighbor (k-NN), Support Vector Machines (SVMs), Neural Networks (NNs), Conditional Random Fields (CRFs), etc. In this work, the current task of skin lesion detection is formulated as a typical binary classification problem, where there are two classes for skin lesions, and the ultimate goal is to assign an appropriate diagnostic class label (malignant melanoma or benign pigmented) to each skin lesion in dermatoscopic images.
There are numerous supervised learning algorithms [37,38,39] by which a skin lesion malignance detector can be trained. Due to its outstanding generalization capability and reputation of being a highly accurate paradigm, an SVM classier [40] is employed in the current detection framework. As a very effective method for universal purpose pattern recognition, SVM has been proposed by Vapnik [41,42], which is characterized by a substantial resistance to overfitting, a long-standing and inherent problem for several supervised learning algorithms (e.g., neural networks and decision trees). This great feature of SVM is principally attributable to the fact that SVM employs the structural risk minimization principle rather than the empirical risk minimization principle, which minimizes the upper bound on the generalization error.
Originally, the standard SVMs were designed for dichotomic classification problems (i.e., binary classification problems with two classes). Thus, the ultimate objective of the SVM learning is to find the optimal dichotomic hyperplane that can maximize the margin (the largest separation) of two classes. In the pursuit of this objective, on each side of this hyperplane, two parallel hyperplanes are constructed. Then, SVM attempts to find the separating hyperplane that maximizes the distance between the two parallel hyperplanes. Intuitively, a good separation is accomplished by the hyperplane having the largest distance (see Figure 5). Hence, the larger the margin, the lower the generalization error of the classifier. More formally, let be a training dataset. Coretes and Vapnik stated in their paper [43] that this problem is best addressed by allowing some examples to violate the margin constraints. These potential violations are formulated using some positive slack variables and a penalty parameter that penalize the margin violations. Thus, the optimal separating hyperplane is determined by solving the following Quadratic Programming (QP) problem:
subject to
Geometrically, is a vector going through the center and is perpendicular to the separating hyperplane. The offset parameter is added to allow the margin to increase, and to not force the hyperplane to pass through the origin that restricts the solution. For computational purposes, it is more convenient to solve SVM in its dual formulation. This can be accomplished by forming the Lagrangian and then optimizing over the Lagrange multiplier α. The resulting decision function has weight vector . The instances with are called support vectors, as they uniquely define the maximum margin hyperplane. In the presented approach, two classes of skin lesions are created. An SVM classifier with the radial basis function (RBF) kernel and default parameters is trained using the local features extracted from the skin lesion images in the training dataset. An advantage of using an RBF kernel over the other kernels, such as the linear kernel, is that it restricts training data to lie in specified boundaries. Another advantage is that it has fewer numerical difficulties. Finally, in the test phase, a test unseen skin lesion sample is given to the trained SVM model for classification, based on the extracted local features.
4. Simulations and Results Analysis
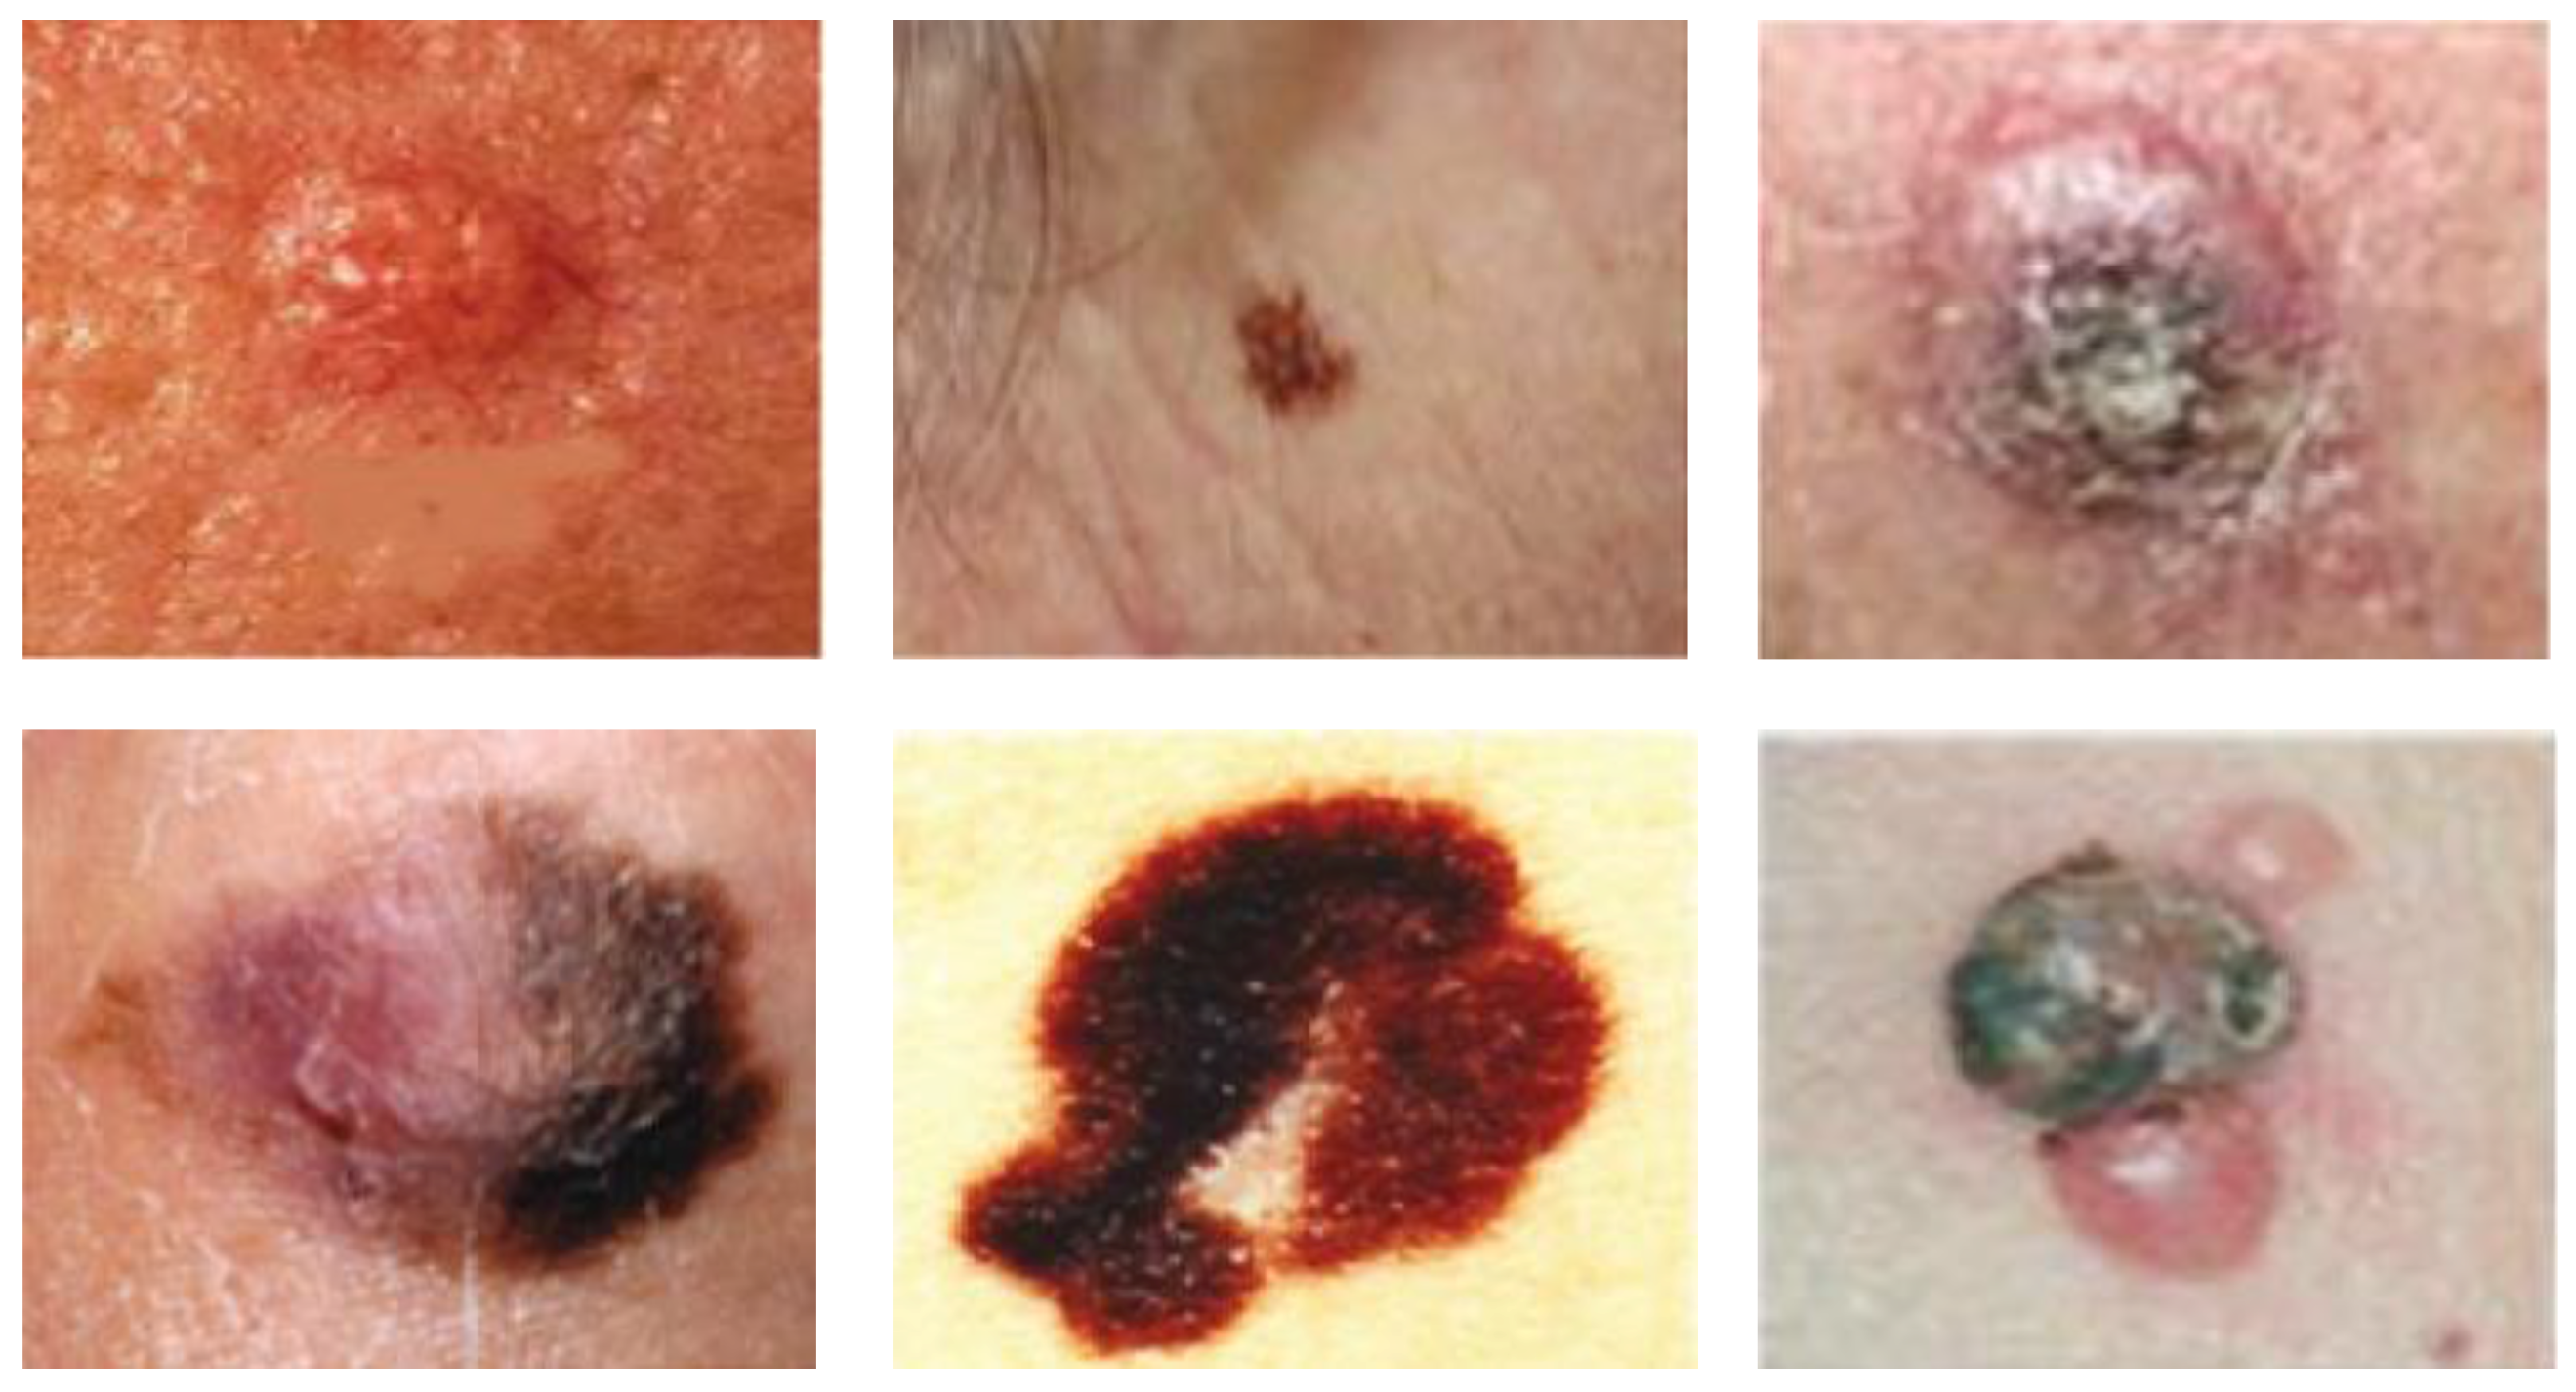
In this section, the simulation results are presented in order to demonstrate the performance of our proposed detector of malignant melanoma. To evaluate the performance of our detection system, several experiments have been carried out on a relatively large dataset consisting of a total of 224 digital dermoscopy images acquired from atlases of dermoscopy and collected from various medical sites (http://www2.fc.up.pt/addi and http://www.dermoscopic.blogspot.com). All of the images in the collection are provided in high resolution JPEG format and RGB color space, exhibiting a 24-bit color depth with a spatial resolution ranging from approximately 689 × 554 down to 352 × 240. The diagnosis distribution of the cases is as follows: 112 of them are benign nevus and the rest of the images are malignant melanoma cases. All samples of the cases were obtained by biopsy or excision and diagnosed by histopathology. Figure 6 presents a sample of skin lesions of melanoma from the used data.
In terms of validation, in this work, our proposed method is evaluated using k-fold cross validation and the leave-one-patient-out technique in order to assess thoroughly the achieved performance. In fulfillment of this purpose, the image samples are randomly divided into two independent subsets, i.e., the training set and the test set. For four-fold cross-validation, as a rule, three-fourths of all the images are used for learning (or training) the SVM model and the remaining one-fourth of images are used for testing purposes. The procedure is repeated several times such that each image instance is used exactly once for testing in the end. A key point worthy of mentioning here is that the leave-one-out technique has the potential to be an efficient and reliable validation procedure for small datasets.
Another important point deemed worthy of highlighting is that, for HOG features computation, the extracted region of skin lesion is converted to the grayscale image level and resized to 64 × 64 pixels, as it proved to perform best in our experiments. Note that the HOG features are not only invariant to changes in illuminations or shadowing, but also nearly invariant against translations and rotations if the translations or rotations are much smaller than that of the local spatial and orientation bin sizes. Hence, they have proved to be robust, fast, and applicable to numerous detection and classification tasks.
For performance evaluation, the results obtained by the proposed technique are quantitatively assessed in terms of three commonly used performance indices, namely, sensitivity (SN), specificity (SP) and accuracy (AC). The three indices are defined as follows. Sensitivity (also called true positive rate or recall) generally measures the proportion of positives that are correctly identified as such (e.g., the percentage of samples that are correctly identified as having the disease). Briefly, sensitivity refers to the ability to positively identify the case with melanoma, i.e.,
Specificity (also called true negative rate) is the likelihood that a non-diseased patient has a negative test result, i.e.,
In other words, the specificity of a test refers to how well a test identifies patients who do not have a disease. In general, accuracy is the probability that a randomly chosen instance (positive or negative, relevant or irrelevant) will be correct. More specifically, accuracy is the probability that the diagnostic test yields the correct determination, i.e., it is estimated as follows:
where:
- TP (True Positives) = correctly classified positive cases,
- TN (True Negative) = correctly classified negative cases,
- FP (False Positives) = incorrectly classified negative cases,
- FN (False Negative) = incorrectly classified positive cases.
Table 1 shows the results of sensitivity, specificity, and accuracy of the proposed system for melanoma detection.
The data reported in the above table merit the following interesting observations. The first most remarkable result is that the proposed method achieves values of 98.21%, 96.43% and 97.32% for overall sensitivity, specificity, and accuracy, respectively, which are quite encouraging and comparable with those of other recent contemporary methods. Recall that, generally, intuition suggests that high values of evaluation indices (i.e., sensitivity, specificity, and accuracy) and low computational demands lead to the feasibility of the application of the proposed approach in real time. On a closer inspection of the results in the above table, one can clearly see that the vast majority of cases of malignant melanoma are correctly diagnosed with quite a high accuracy rate, while, only in two cases, benign lesions are misdiagnosed as malignant melanoma. Moreover, it should be emphasised that it is an experimentally established fact that the extracted local HOG features not only have a great potential to promote the quantitative discrimination between normal skin and melanoma, but they also turn out to be quite robust to various types of melanoma skin cancer. In general, we conclude that the experimental results show supporting evidence that the proposed framework is useful for improving the performance of the early detection of melanoma skin cancer, without sacrificing its real-time guarantees.
In order to quantify the performance of the proposed approach, an experimental comparison of our method to several state-of-the-art baselines [44,45] is provided. A summary of this comparison is presented in Table 2. In light of this comparison, it is pointed out that the proposed method is competitive with existing state-of-the-art methods, while maintaining desired real-time performance. It is worthwhile to mention that the first method [44] has been tested for a total of only 20 samples, whereas the other method [45] has been tested for a total of 102 samples. In addition, they have used similar experimental setups. Thus, the comparison seems to be meaningful. As a final point, in this work, all of the algorithms were implemented in Microsoft Visual Studio 2013 with OpenCV Vision Library version 3.0 for the graphical processing functions. All tests and evaluations were performed on a PC with an Intel(R) Core(TM) i7 CPU - 3.07 GHz processor, 4GB RAM, running a Windows 7 Professional 64-bit operating system. As it might be expected, the testing results show that the presented detection system performs stably, achieving near real-time performance on image sizes of VGA () due to the use of optimized algorithmic implementations in OpenCV library in combination with custom C++ functions.
5. Conclusions
In this paper, we have proposed an effective framework of a CAD system for melanoma skin cancer mainly by application of an SVM model on an optimized set of HOG-based descriptors of skin lesions. Evaluations on a large dataset of dermoscopic images have demonstrated that the proposed framework exhibits superior performance over two recent state-of-the-art alternatives in terms of performance indices of sensitivity, specificity and accuracy by achieving 98.21%, 96.43%, and 97.32%, respectively, without losing real-time compliance. Directions for future work will be two-fold. On one hand, we intend to further expand the approach to allow the SVM classifier to recognize several different types of melanoma cells. On the other hand, we will explore the potential of combining both color and texture features for melanoma classification.
Acknowledgments
This research was supported by the Transregional Collaborative Research Center SFB/TRR 62 “Companion Technology for Cognitive Technical Systems” funded by the German Research Foundation (DFG). I would also like to give special thanks to anonymous reviewers for their insightful comments and constructive suggestions to improve the quality of the paper.
Conflicts of Interest
The author declares no conflict of interest.
References
- Sloot, S.; Rashid, O.; Sarnaik, A.; Zager, J. Developments in Intralesional Therapy for Metastatic Melanoma. Cancer Control 2016, 23, 12–20. [Google Scholar] [PubMed]
- Vestergaard, M.; Macaskill, P.; Holt, P.; Menzies, S. Dermoscopy compared with naked eye examination for the diagnosis of primary melanoma: A meta-analysis of studies performed in a clinical setting. Br. J. Dermatol. 2008, 159, 669–676. [Google Scholar] [CrossRef] [PubMed]
- Argenziano, G.; Soyer, H.P.; Chimenti, S.; Talamini, R.; Corona, R.; Sera, F.; Binder, M.; Cerroni, L.; De Rosa, G.; Ferrara, G.; et al. Dermoscopy of pigmented skin lesions: Results of a consensus meeting via the Internet. J. Acad. Dermatol. 2003, 48, 679–693. [Google Scholar] [CrossRef] [PubMed]
- Pehamberger, H.; Steiner, A.; Wolff, K. In vivo epiluminescence microscopy of pigmented skin lesions. I. Pattern analysis of pigmented skin lesions. J. Am. Acad. Dermatol. 1987, 17, 571–583. [Google Scholar] [CrossRef]
- Stolz, W.; Riemann, A.; Cognetta, A. ABCD rule of dermatoscopy: A new practical method for early recognition of malignant melanoma. Eur. J. Dermatol. 1994, 4, 521–527. [Google Scholar]
- Menzies, S.W. A Method for the diagnosis of primary cutaneous melanoma using surface microscopy. Dermatol. Clin. 2001, 19, 299–305. [Google Scholar] [CrossRef]
- Argenziano, G.; Fabbrocini, G.; Carli, P.; De Giorgi, V.; Sammarco, E.; Delfino, M. Epiluminescence microscopy for the diagnosis of doubtful melanocytic skin lesions. Comparison of the ABCD rule of dermatoscopy and a new 7-point checklist based on pattern analysis. Arch. Dermatol. 1998, 134, 1563–1570. [Google Scholar] [CrossRef] [PubMed] [Green Version]
- Masood, A.; Al-Jumaily, A.A. Computer aided diagnostic support system for skin cancer: A review of techniques and algorithms. Int. J. Biomed. Imaging 2013, 2013, 1–22. [Google Scholar] [CrossRef] [PubMed]
- Korotkov, K. Automatic Change Detection in Multiple Skin Lesions. Ph.D. Thesis, Universitat de Girona, Girona, Spain, 2014. [Google Scholar]
- Garnavi, R. Computer-Aided Diagnosis of Melanoma. Ph.D Thesis, University of Melbourne, Melbourne, Australia, 2011. [Google Scholar]
- Celebi, M.E.; Wen, Q.; Hwang, S.; Iyatomi, H.; Schaefer, G. Lesion border detection in dermoscopy images using ensembles of thresholding methods. Skin Res. Technol. 2013, 19, e252–e258. [Google Scholar] [CrossRef] [PubMed]
- Zhou, H.; Schaefer, G.; Sadka, A.H.; Celebi, M.E. Anisotropic mean shift based fuzzy c-means segmentation of dermoscopy images. IEEE J. Sel. Top. Signal Proc. 2009, 3, 26–34. [Google Scholar] [CrossRef] [Green Version]
- Schmid, P. Segmentation of digitized dermatoscopic images by two-dimensional color clustering. IEEE Trans. Med. Imaging 1999, 18, 164–171. [Google Scholar] [CrossRef] [PubMed]
- Zhou, H.; Li, X.; Schaefer, G.; Celebi, M.E.; Miller, P. Mean shift based gradient vector flow for image segmentation. Comput. Vis. Image Underst. 2013, 117, 1004–1016. [Google Scholar] [CrossRef] [Green Version]
- Erkol, B.; Moss, R.H.; Stanley, R.J.; Stoecker, W.V.; Hvatum, E. Automatic lesion boundary detection in dermoscopy images using gradient vector flow snakes. Skin Res. Technol. 2005, 11, 17–26. [Google Scholar] [CrossRef] [PubMed]
- Abbas, Q.; Celebi, M.E.; García, I.F.; Rashid, M. Lesion border detection in dermoscopy images using dynamic programming. Skin Res. Technol. 2011, 17, 91–100. [Google Scholar] [CrossRef] [PubMed]
- Rajab, M.I.; Woolfson, M.S.; Morgan, S.P. Application of region-based segmentation and neural network edge detection to skin lesions. Comput. Med. Imaging Graph. 2004, 28, 61–68. [Google Scholar] [CrossRef]
- Yuan, X.; Situ, N.; Zouridakis, G. A narrow band graph partitioning method for skin lesion segmentation. Pattern Recognit. 2009, 42, 1017–1028. [Google Scholar] [CrossRef]
- Wong, A.; Scharcanski, J.; Fieguth, P. Automatic skin lesion segmentation via iterative stochastic region merging. IEEE Trans. Inform. Technol. Biomed. 2011, 15, 929–936. [Google Scholar] [CrossRef] [PubMed]
- Celebi, M.E.; Kingravi, H.A.; Iyatomi, H.; Alp Aslandogan, Y.; Stoecker, W.V.; Moss, R.H.; Malters, J.M.; Grichnik, J.M.; Marghoob, A.A.; Rabinovitz, H.S.; et al. Border detection in dermoscopy images using statistical region merging. Skin Res. Technol. 2008, 14, 347–353. [Google Scholar] [CrossRef] [PubMed]
- Celebi, M.E.; Wen, Q.; Iyatomi, H.; Shimizu, K.; Zhou, H.; Schaefer, G. A state-of-the-art survey on lesion border detection in dermoscopy images. Dermoscopy Image Anal. 2015. [Google Scholar] [CrossRef]
- Celebi, M.E.; Schaefer, G.; Iyatomi, H.; Stoecker, W.V. Lesion border detection in dermoscopy images. Comput. Med. Imaging Graph. 2009, 33, 148–153. [Google Scholar] [CrossRef] [PubMed]
- Maglogiannis, I.; Doukas, C. Overview of advanced computer vision systems for skin lesions characterization. IEEE Trans. Inform. Technol. Biomed. 2009, 13, 721–733. [Google Scholar] [CrossRef] [PubMed]
- Celebi, M.; Kingravi, H.A.; Uddin, B.; Iyatomi, H.; Aslandogan, Y.A.; Stoecker, W.V.; Moss, R.H. A methodological approach to the classification of dermoscopy images. Comput. Med. Imaging Graph. 2007, 31, 362–373. [Google Scholar] [CrossRef] [PubMed]
- Ng, V.; Fung, B.; Lee, T. Determining the asymmetry of skin lesion with fuzzy borders. Comput. Biol. Med. 2005, 35, 103–120. [Google Scholar] [CrossRef] [PubMed]
- She, Z.; Liu, Y.; Damatoa, A. Combination of features from skin pattern and ABCD analysis for lesion classification. Skin Res. Technol. 2007, 13, 25–33. [Google Scholar] [CrossRef] [PubMed]
- Bakheet, S.; Al-Hamadi, A. A hybrid cascade approach for human skin segmentation. Br. J. Math. Comput. Sci. 2016, 17, 1–18. [Google Scholar] [CrossRef]
- Otsu, N. A threshold selection method from gray-level histograms. IEEE Trans. Syst. Man Cybern. 1979, 9, 62–66. [Google Scholar] [CrossRef]
- Vincent, L. Morphological Area Opening and Closing for Grayscale Images. In Processing NATO Shape in Picture Workshop; Springer: Driebergen, The Netherlands, 1992; Volume 126, pp. 197–208. [Google Scholar]
- Canny, J. A computational approach to edge detection. IEEE Trans. Pattern Anal. Mach. Intell. 1986, PAMI-8, 679–698. [Google Scholar] [CrossRef]
- Dalal, N.; Triggs, B. Histograms of oriented gradients for human detection. IEEE Conf. Comput. Vis. Pattern Recognit. 2005, 1, 886–893. [Google Scholar]
- Sadek, S.; Al-Hamadi, A.; Michaelis, B.; Sayed, U. Human action recognition: A novel scheme using fuzzy log-polar histogram and temporal self-similarity. EURASIP J. Adv. Signal Proc. 2011, 1, 1–9. [Google Scholar]
- Sadek, S.; Al-Hamadi, A.; Michaelis, B.; Sayed, U. An SVM approach for activity recognition based on chord-length-function shape features. In Proceedings of the IEEE International Conference on Image Processing (ICIP’12), Orlando, FL, USA, 30 September–3 October 2012; pp. 767–770.
- Bakheet, S.; Al-Hamadi, A. A discriminative framework for action recognition using f-HOL Features. Information 2016, 7, 68. [Google Scholar] [CrossRef]
- Sadek, S.; Al-Hamadi, A.; Michaelis, B.; Sayed, U. Human Action Recognition via Affine Moment Invariants. In Proceedings of the 21st International Conference on Pattern Recognition (ICPR’12), Tsukuba, Japan, 11–15 November 2012; pp. 218–221.
- Sadek, S.; Al-Hamadi, A.; Michaelis, B. Toward Real-World Activity Recognition: An SVM Based System Using Fuzzy Directional Features. WSEAS Trans. Inform. Sci. App. 2013, 10, 116–127. [Google Scholar]
- Sadek, S.; Al-Hamadi, A.; Michaelis, B.; Sayed, U. Towards Robust Human Action Retrieval in Video. In Proceedings of the British Machine Vision Conference (BMVC’10), Aberystwyth, UK, 31 August–3 September 2010.
- Sadek, S.; Al-Hamadi, A.; Michaelis, B.; Sayed, U. Human Activity Recognition: A Scheme Using Multiple Cues. In Advances in Visual Computing, Proceedings of the International Symposium on Visual Computing (ISVC’10), Las Vegas, NV, USA, 29 November–1 December 2010; Springer: Berlin/Heidelberg, Germany, 2010; Volume 6454, pp. 574–583. [Google Scholar]
- Sadek, S.; Al-Hamadi, A.; Elmezain, M.; Michaelis, B.; Sayed, U. Human Activity Recognition Using Temporal Shape Moments. In Proceedings of the IEEE International Symposium on Signal Processing and Information Technology (ISSPIT’10), Luxor, Egypt, 15–18 December 2010; pp. 79–84.
- Sumithra, R.; Suhil, M.; Guru, D.S. Segmentation and Classification of Skin Lesions for Disease Diagnosis. Proc. Comput. Sci. 2015, 45, 76–85. [Google Scholar] [CrossRef]
- Vapnik, V.N. The Nature of Statistical Learning Theory; Springer: New York, NY, USA, 1995. [Google Scholar]
- Vapnik, V.N. An overview of statistical learning theory. IEEE Trans. Neural Netw. 1999, 10, 988–999. [Google Scholar] [CrossRef] [PubMed]
- Cortes, C.; Vapnik, V. Support-vector networks. Mach. Learn. 1995, 20, 1–20. [Google Scholar] [CrossRef]
- Elgamal, M. Automatic Skin Cancer Images Classification. Int. J. Adv. Comput. Sci. Appl. 2013, 4, 1–8. [Google Scholar] [CrossRef]
- Sheha, M.A.; Mabrouk, M.S.; Sharawy, A. Automatic detection of melanoma skin cancer using texture analysis. Int. J. Comput. Appl. 2012, 42, 22–26. [Google Scholar]
Figure 1.
A general block diagram of computerized melanoma skin cancer detection.
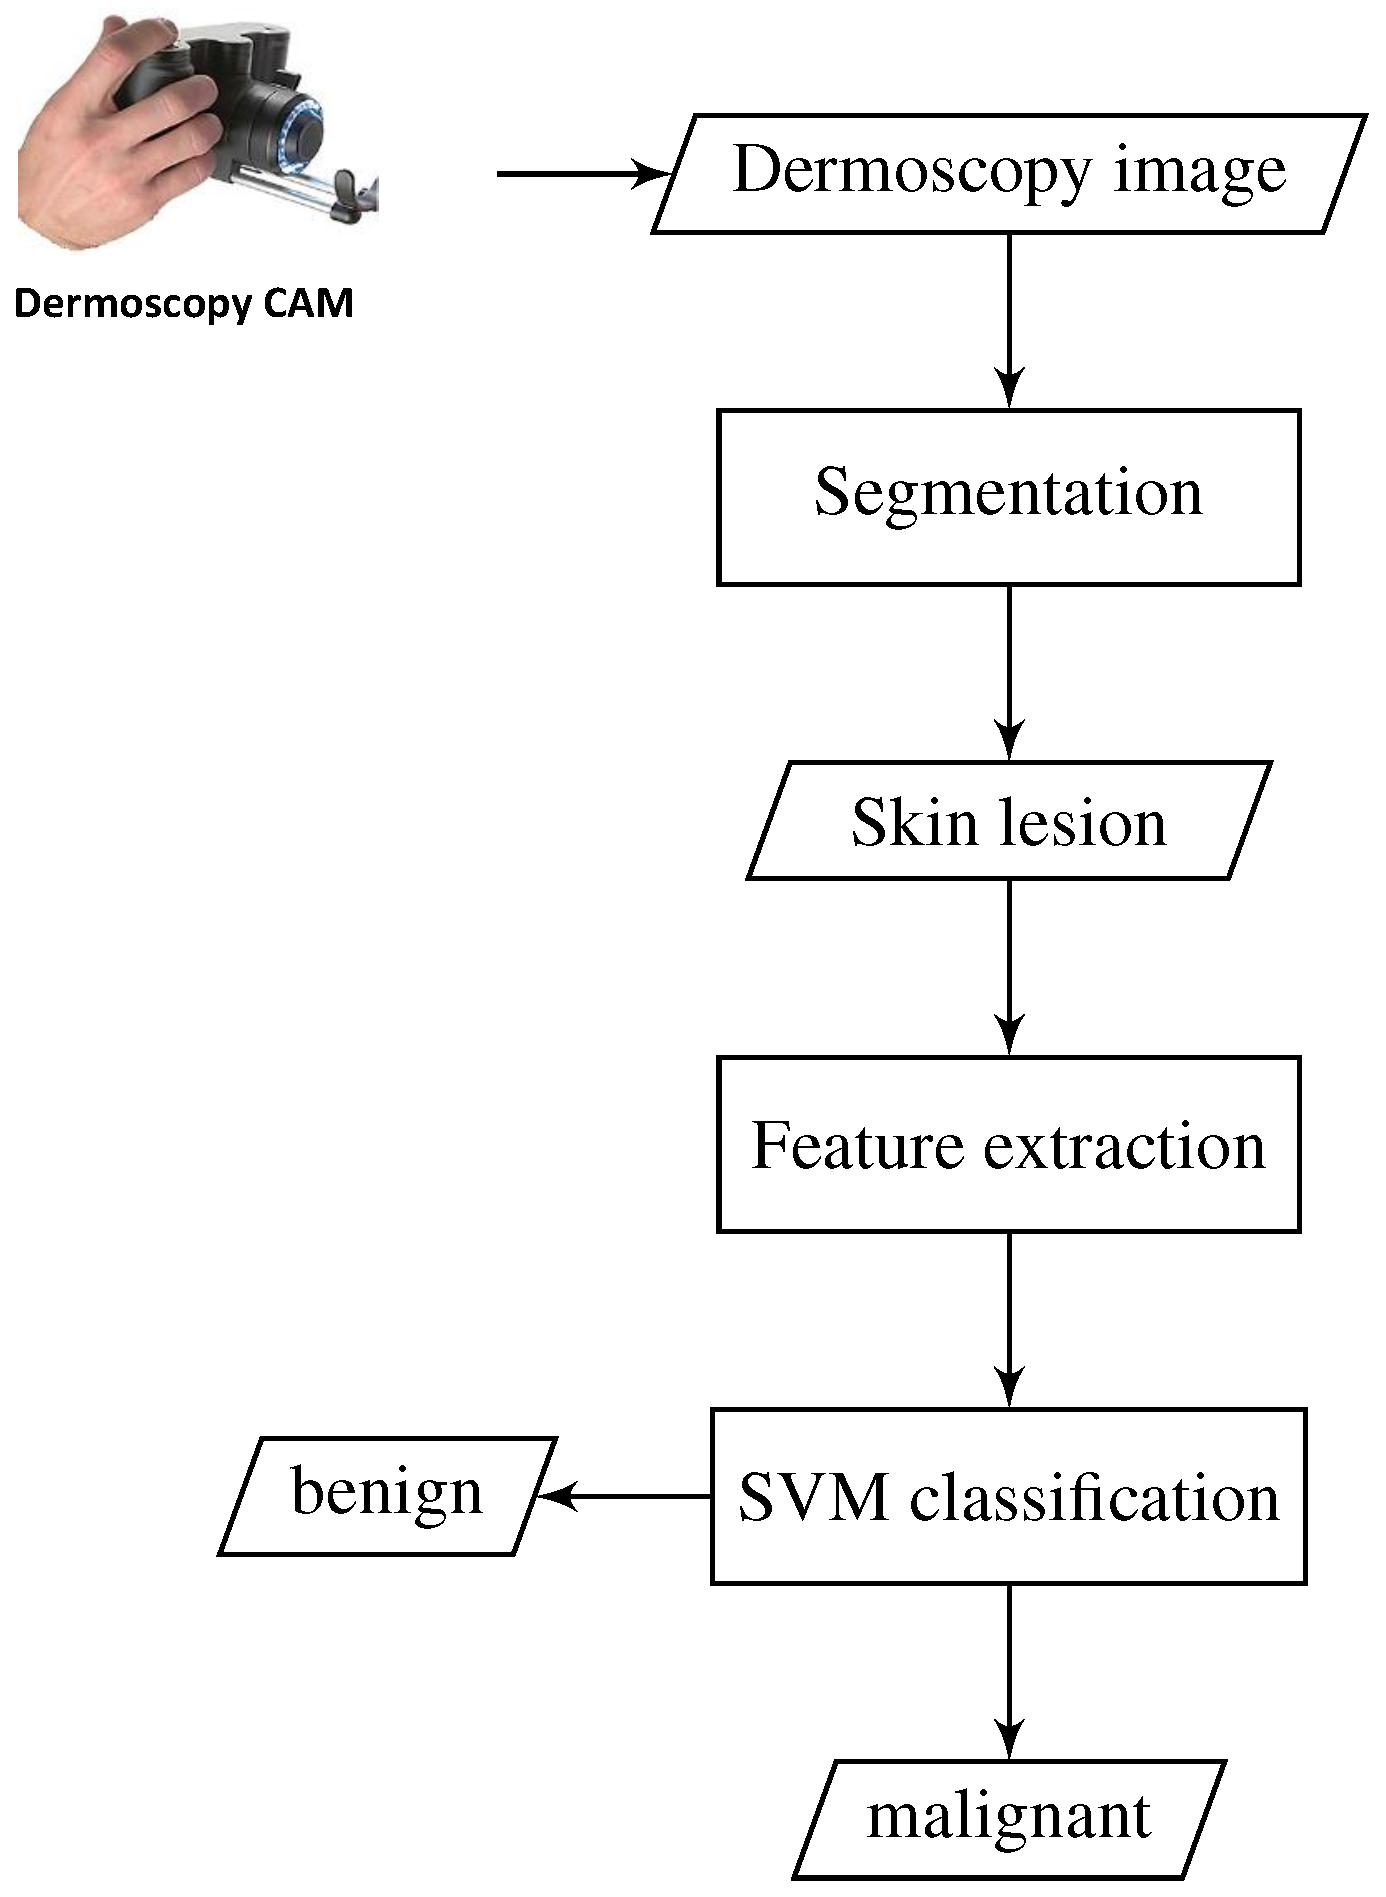
Figure 2.
Segmentation of skin lesion: (a) original RGB image; (b) binary mask; (c) traced skin lesion, where the lesion boundary is drawn in green overlaid on the original image.
Figure 2.
Segmentation of skin lesion: (a) original RGB image; (b) binary mask; (c) traced skin lesion, where the lesion boundary is drawn in green overlaid on the original image.

Figure 3.
Gradient orientation voting: (a) cell gradient field; (b) a voting space of nine bins.

Figure 4.
Sample 2D plots for the HOG based descriptor of the features extracted from three segmented skin lesion images: (a) original skin lesion image; (b) HOG-based descriptor; from top to bottom, the first two dermoscopy images contain malignant melanoma, while the last one contains benign lesions.

Figure 5.
Generalized optimal separating hyperplane.
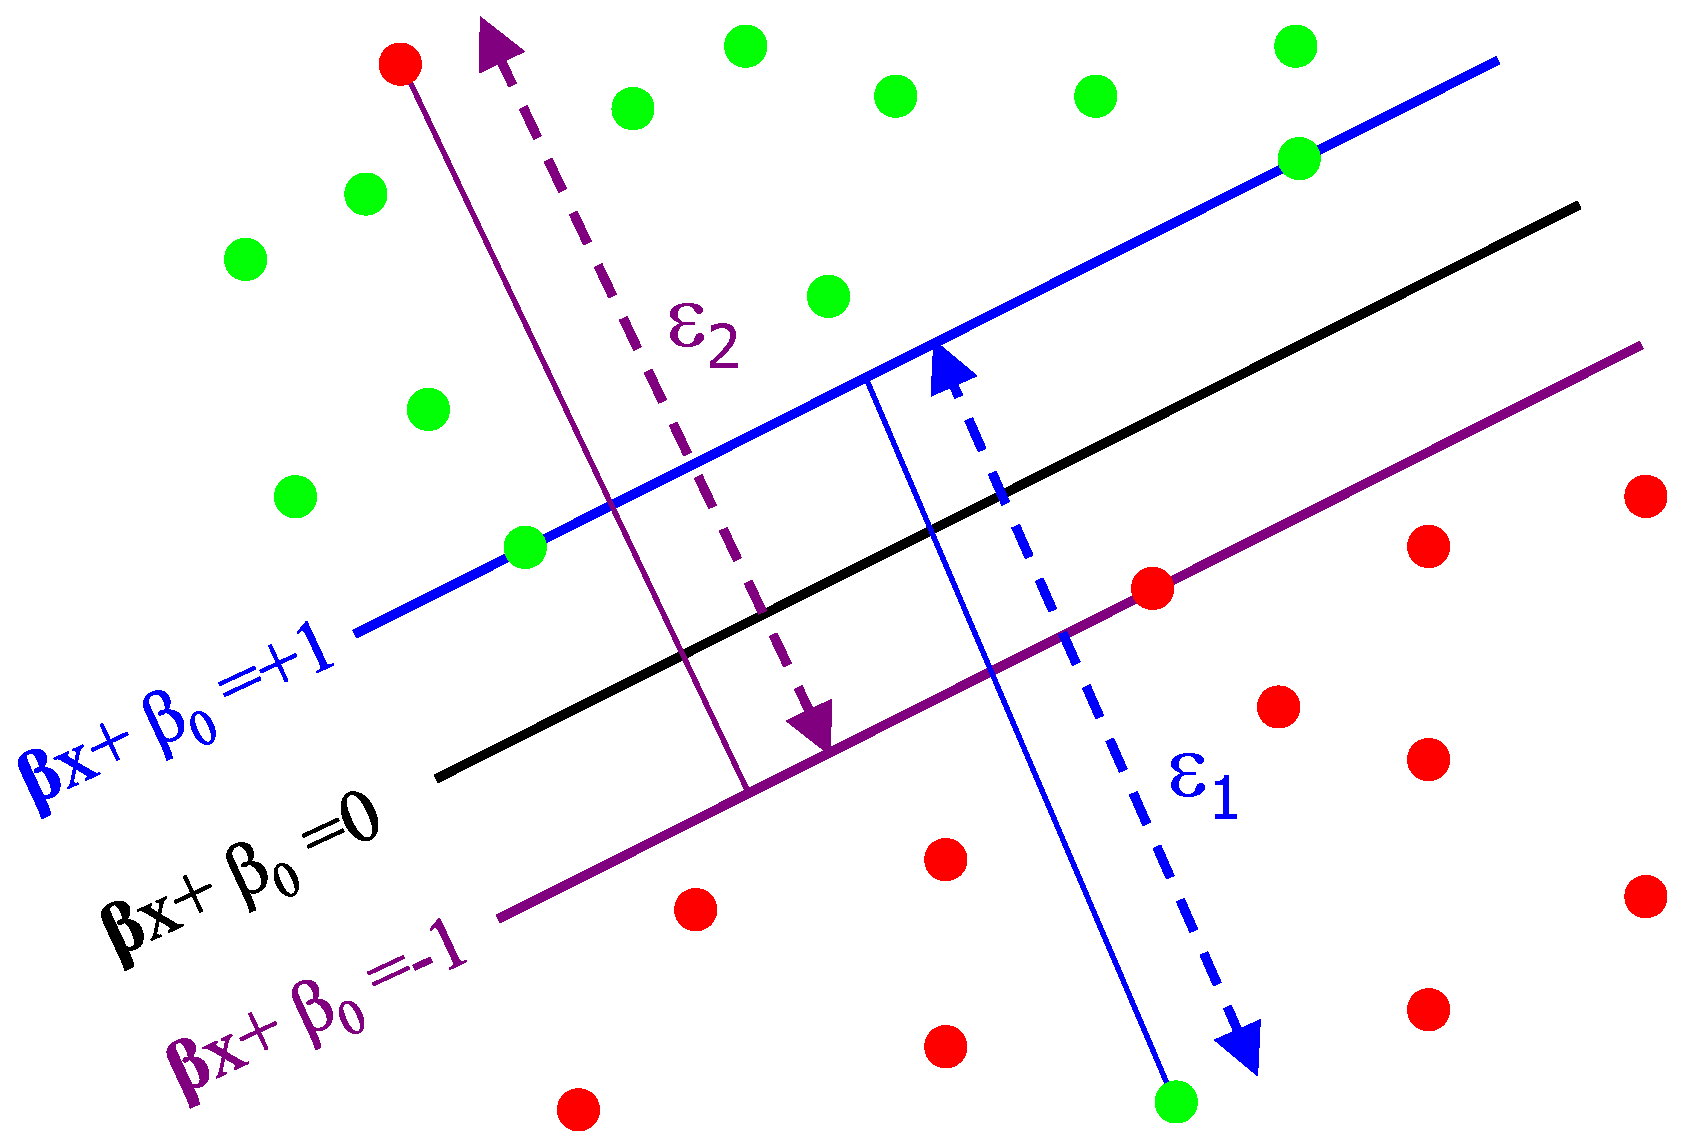
Figure 6.
A sample of skin lesions of melanoma from the used data.


Table 1.
Results of sensitivity (SN), specificity (SP), and accuracy (AC) for the proposed system for melanoma detection.
| TP | TN | FP | FN | SN (%) | SP (%) | AC (%) |
|---|---|---|---|---|---|---|
| 55 | 54 | 2 | 1 | 98.21 | 96.43 | 97.32 |
© 2017 by the author. Licensee MDPI, Basel, Switzerland. This article is an open access article distributed under the terms and conditions of the Creative Commons Attribution (CC BY) license ( http://creativecommons.org/licenses/by/4.0/).
Share and Cite
MDPI and ACS Style
Bakheet, S. An SVM Framework for Malignant Melanoma Detection Based on Optimized HOG Features. Computation 2017, 5, 4. https://doi.org/10.3390/computation5010004
AMA Style
Bakheet S. An SVM Framework for Malignant Melanoma Detection Based on Optimized HOG Features. Computation. 2017; 5(1):4. https://doi.org/10.3390/computation5010004
Chicago/Turabian StyleBakheet, Samy. 2017. "An SVM Framework for Malignant Melanoma Detection Based on Optimized HOG Features" Computation 5, no. 1: 4. https://doi.org/10.3390/computation5010004
Note that from the first issue of 2016, this journal uses article numbers instead of page numbers. See further details here.