Optimal Data-Driven Estimation of Generalized Markov State Models for Non-Equilibrium Dynamics


1
Department of Mathematics and Computer Science, Freie Universität Berlin, 14195 Berlin, Germany
2
Zuse Institute Berlin, 14195 Berlin, Germany
*
Author to whom correspondence should be addressed.
Computation 2018, 6(1), 22; https://doi.org/10.3390/computation6010022
Submission received: 12 January 2018
/
Revised: 15 February 2018
/
Accepted: 23 February 2018
/
Published: 26 February 2018
(This article belongs to the Special Issue Computation in Molecular Modeling)
Abstract
:There are multiple ways in which a stochastic system can be out of statistical equilibrium. It might be subject to time-varying forcing; or be in a transient phase on its way towards equilibrium; it might even be in equilibrium without us noticing it, due to insufficient observations; and it even might be a system failing to admit an equilibrium distribution at all. We review some of the approaches that model the effective statistical behavior of equilibrium and non-equilibrium dynamical systems, and show that both cases can be considered under the unified framework of optimal low-rank approximation of so-called transfer operators. Particular attention is given to the connection between these methods, Markov state models, and the concept of metastability, further to the estimation of such reduced order models from finite simulation data. All these topics bear an important role in, e.g., molecular dynamics, where Markov state models are often and successfully utilized, and which is the main motivating application in this paper. We illustrate our considerations by numerical examples.
1. Introduction
Metastable molecular systems under non-equilibrium conditions have recently attracted increasing interest. Examples include systems that evolve under an external force, such as a pulling force generated by an optical tweezer or an atomic force microscope, an electrostatic force across a biomembrane that drives ion through a channel protein, or the periodically changing force generated by a spectroscopic electromagnetic field. Such non-equilibrium conditions can be built into molecular dynamics (MD) simulations in order to probe their effects on the molecule. Despite the relevance of non-equilibrium effects, reliable tools for the quantitative description of non-equilibrium phenomena like the conformational dynamics of a molecular system under external forcing are still lacking.
In this paper, we say that a process is in “equilibrium”, if it is statistically reversible with respect to its equilibrium distribution (see Table 1). For MD simulations under equilibrium conditions, reliable analysis tools have been developed. For example, Markov state models (MSMs) allow for an accurate description of the transitions between the main conformations of the molecular system under investigation. MSMs for equilibrium MD have been well developed and established over the past decade in theory [1,2], applications (see the recent book [3] for an overview), and software implementations [4,5]. The principal idea of equilibrium MSMs is to approximate the long-timescale and stationary properties of the MD system by a reduced Markovian dynamics over a finite number of (macro-)states, i.e., in discrete state space. These states represent or at least separate the dominant metastable sets of the system, i.e., sets in which typical MD trajectories stay substantially longer than the system needs for a transition to another such set [1,6].
Equilibrium Markovian processes are associated with real-valued eigenvalues and eigenfunctions in their propagators—a property that methods for the approximation of equilibrium dynamics are built upon. For example, the approximation error of MSMs and their slowest relaxation timescales can be expressed in terms of how well the state space discretization approximates the dominant eigenfunctions [7,8]. This has been formulated in the variational approach for conformation dynamics (VAC), or Rayleigh–Ritz method, which provides an optimization method to systematically search for best MSMs or other models of the equilibrium dynamics [9,10]. Perron-Cluster Cluster Analysis (PCCA) [11,12] identify the metastable states of a molecule by conducting a spectral clustering in the space spanned by the dominant eigenfunctions. Additionally, equilibrium MSMs are the foundation of analyzing multi-ensemble simulations that help to sample the rare events [13,14].
In the non-equilibrium setting the above tools break down or are not defined. The purpose of the present paper is to summarize and reconcile recently developed methods for the description of non-equilibrium processes, and to merge them with their equilibrium counterparts into a unified framework. Note that there are different possibilities to deviate from the “equilibrium” situation, and this makes the term “non-equilibrium” ambiguous. To avoid confusion, we consider one of the following cases when referring to the non-equilibrium setting (again, see Table 1 on terminology).
- (i)
- Time-inhomogeneous dynamics, e.g., the system feels a time-dependent external force, for instance due to an electromagnetic field or force probing.
- (ii)
- Time-homogeneous non-reversible dynamics, i.e., where the governing laws of the system do not change in time, but the system does not obey detailed balance, and, additionally we might want to consider the system in a non-stationary regime.
- (iii)
- Reversible dynamics but non-stationary data, i.e., the system possesses a stationary distribution with respect to which it is in detailed balance, but the empirical distribution of the available data did not converge to this stationary distribution.
Even though we consider genuinely stochastic systems here, the algorithm of Section 5 can be used for deterministic systems as well—and indeed it is, see Remark 2 and references therein.
Note that with regard to the considered dynamics (i)–(iii) represent cases with decreasing generality. For (i), time-dependent external fields act on the system, such that the energy landscape depends on time, i.e., the main wells of the energy landscape can move in time. That is, there may no longer be time-independent metastable sets in which the dynamics stays for long periods of time before exiting. Instead, the potentially metastable sets will move in state space. Generally, moving “metastable” sets cannot be considered metastable anymore. However, the so-called coherent sets, which have been studied for non-autonomous flow fields in fluid dynamics [15,16], permit to give a meaning to the concept of metastability [17]. For (iii), the full theory of equilibrium Markov state modeling is at one’s disposal, but one needs to estimate certain required quantities from non-equilibrium data [18]. Case (ii) seems the most elusive, due to the fact that on the one hand it could be handled by the time-inhomogeneous approach, but on the other hand it is a time-homogeneous system and some structural properties could be carried over from the reversible equilibrium case that are out of reach for a time-inhomogeneous analysis. For instance, if the dynamics shows cyclic behavior, it admits structures that are well captured by tools from the analysis of time-homogeneous dynamical systems (e.g., Floquet theory and Poincaré sections [19,20]), and a more general view as in (i) might miss them; however, cyclic behavior is not present in reversible systems, such that the tools from (iii) are doomed to failure in this respect. In order to avoid confusion, however, it should be emphasized that the three cases distinguished above do not suffice to clarify the discussion about the definition of equilibrium or non-equilibrium, e.g., see the literature on non-equilibrium steady state systems [21,22].
Apart from MSMs the literature on kinetic lumping schemes offers several other techniques for finding a coarse-grained descriptions of systems [23,24,25]. These techniques are, however, not built on the intuition of metastable behavior in state space. What we consider here can be seen in connection to optimal prediction in the sense of the Mori–Zwanzig formalism [26,27,28,29], but we will try to choose the observables of the system such that projecting the dynamics on these keeps certain properties intact without including memory terms.
In what follows, we will review and unify some of the theoretical and also data-driven algorithmic approaches that attempt to model the effective statistical behavior of non-equilibrium systems. To this end, a MSM—or, more precisely, a generalized MSM—is sought, i.e., a possibly small matrix T that carries the properties of the actual system that are of physical relevance. In the equilibrium case, for example, this includes the slowest timescales on which the system relaxes towards equilibrium (Section 2). The difference of generalized to standard MSMs is that we do not strictly require the former to be interpretable in terms of transition probabilities between some regions of the state space (Section 3), however usually there is a strong connection between the matrix entries and metastable sets. While heavily building upon recent results for MSMs of nonstationary MD [17] and a nonequilibrium generalization of the variational principle [30], we will focus on a slightly different characteristic of the approximate model, namely its “propagation error”. It turns out that this notion permits a straightforward generalization from equilibrium (reversible) to all our non-equilibrium cases (Section 4), and even retain the physical intuition behind true MSMs through the concept of coherent sets. We will show in Section 5 how these considerations can be carried over to the case when only a finite amount of simulation data is available. The above non-equilibrium cases (ii)–(iii) can be then given as specific instances of the construction (Section 6). The theory is illustrated with examples throughout the text. Bringing the formerly known equilibrium and time-inhomogeneous concepts into a unified framework (Section 3 and Section 4) can be seen as the main contribution of this paper, together with the novel application of this framework to time-homogeneous non-equilibrium systems relying on non-stationary data (Section 6).
We note in advance that in course of the (generalized) Markov state modeling we will consider different instances of approximations to a certain linear operator mapping some space to itself (and sometimes to a different one). On the one hand, there will be a projected operator , where with a projection having a k-dimensional range . On the other hand, we will consider the restriction of the projected operator to this k-dimensional subspace, i.e., , also called -restriction of , which has a matrix representation (with respect to some chosen basis of ) that we will denote by .
2. Studying Dynamics with Functions
2.1. Transfer Operators
In what follows, and denote probability and expectation conditioned on the event . Furthermore, is a stochastic process defined on a state space . For instance, we can think of being the solution of the stochastic differential equation
describing diffusion in the potential energy landscape given by W. Here, is the non-dimensionalized inverse temperature, and is a standard Wiener process (Brownian motion). The transition density function of a time-homogeneous stochastic process is defined by
That is, is the conditional probability density of given that . We also write to indicate that has density .
With the aid of the transition density function, we will now define transfer operators, i.e., the action of the process on functions of the state. Note, however, that the transition density is in general not known explicitly, and thus we will need data-based approximations to estimate it. We assume that there is a unique stationary density , such that is stationary with respect to ; that is, it satisfies and
Let now f be a probability density over , a probability density with respect to (meaning that is to be interpreted as a physical density), and g a scalar function of the state (an “observable”). We define the following transfer operators, for a given lag time :
- (a)
- The Perron–Frobenius operator (also called propagator),evolves probability distributions.
- (b)
- The Perron–Frobenius operator with respect to the equilibrium density (also called transfer operator, simply),evolves densities with respect to .
- (c)
- The Koopman operatorevolves observables.
We denote by the space (equivalence class) of q-integrable functions with respect to the Lebesgue measure. denotes the same space of function, now integrable with respect to the weight function . All our transfer operators are well-defined non-expanding operators on the following Hilbert spaces: , , and [31,32,33]. The equilibrium density satisfies , that is, is an eigenfunction of with associated eigenvalue . The definition of relies on , we have
thus translates into , where is the constant one function on .
2.2. Reversible Equilibrium Dynamics and Spectral Decomposition
An important structural property of many systems used to model molecular dynamics is reversibility. Reversibility means that the process is statistically indistinguishable from its time-reversed counterpart, and it can be described by the detailed balance condition
The process generated by (1) is reversible and ergodic, i.e., it has a unique positive equilibrium density, given by , under mild conditions on the potential W [34,35]. The subsequent considerations hold for all reversible and ergodic (with respect to a unique positive invariant density) stochastic processes, and are not limited to the class of systems given by (1). Ref. [1] discusses a variety of stochastic dynamical systems that have been considered in this context. Furthermore, if is a continuous function in both its arguments for , then all the transfer operators above are compact, which we also assume from now on. This implies that they have a discrete eigen- and singular spectrum (the latter meaning it has a discrete set of singular values). For instance, the process generated by (1) has continuous transition density function under mild growth and regularity assumptions on the potential W.
As a result of the detailed balance condition, the Koopman operator and the Perron–Frobenius operator with respect to the equilibrium density become identical and we obtain
i.e., all the transfer operators become self-adjoint on the respective Hilbert spaces from above. Here, denotes the natural scalar products on the weighted space , i.e., ; the associated norm is denoted by . Due to the self-adjointness, the eigenvalues of and are real-valued and the eigenfunctions form an orthogonal basis with respect to and , respectively.
Ergodicity implies that the dominant eigenvalue is the only eigenvalue with absolute value 1 and we can thus order the eigenvalues so that
The eigenfunction of corresponding to is the constant function . Let be the normalized eigenfunctions of , i.e., , where denotes the Kronecker-delta. Then any function can be written in terms of the eigenfunctions as . Applying thus results in
For more details, we refer to [33] and references therein.
For some , we call the k dominant eigenvalues of the dominant spectrum of , i.e.,
Usually, k is chosen in such a way that there is a spectral gap after , i.e., . The (implied) time scales on which the associated dominant eigenfunctions decay are given by
If is a semigroup of operators (which is the case for every time-homogeneous process, as, e.g., the transfer operator associated with (1)), then there are with such that holds. Assuming there is a spectral gap, the dominant time scales satisfy . These are the time scales of the slow dynamical processes, also called rare events, which are of primary interest in applications. The other, fast processes are regarded as fluctuations around the relative equilibria (or metastable states) between which the relevant slow processes travel.
3. Markov State Models for Reversible Systems in Equilibrium
In the following, we will fix a lag time , and drop the superscript from the transfer operators for clarity of notation.
3.1. Preliminaries on Equilibrium Markov State Models
Generally, in the equilibrium case, a generalized MSM (GMSM) is any matrix , , that approximates the k dominant time scales of , i.e., its dominant eigenvalues;
It is natural to ask for some structural properties of to be reproduced by , such as:
- is a positive operator ⟷ all entries of are non-negative;
- is probability-preserving ⟷ each column sum of is 1.
These two properties together make to a stochastic matrix, and in this case is usually called a MSM. We shall use the term Generalized MSM for a matrix that violates these requirements but still approximates the dominant spectral components of the underlying operator. Another structural property that one would usually ask for is to have apart from the time scales/eigenvalues also some approximation of the associated eigenvectors of , as these are the dynamic observables related to the slow dynamics. This is incorporated in the general approach, which we discuss next.
The question is now how to obtain a GMSM for a given . To connect these objects, a natural and popular approach is to obtain the reduced model via projection. To this end, let be a projection onto a -dimensional subspace . The GMSM is then defined by the projected transfer operator
and can now be taken as the matrix representation of the -restriction of the projected operator with respect to a chosen basis of .
Is there a “best” choice for the projection? If we also ask for perfect approximation of the time scales, i.e., , the requirement of parsimony—such that the model size is minimal, i.e., —leaves us with a unique choice for , namely the space spanned by the dominant (normalized) eigenfunctions of , . This follows from the so-called variational principle (or Rayleigh–Ritz method) [9,10]. In fact, it makes a stronger claim: every projection to a k-dimensional space yields a GMSM which underestimates the dominant time scales, i.e., , ; and equality holds only for the projections on the eigenspaces.
Note that the discussion about the time scales (equivalently, the eigenvalues) involves only the range of the projection, the space . However, there are multiple ways to project on the space . It turns out, that the -orthogonal projection given by
is superior to all of them, if we consider a stronger condition than simply reproducing the dominant time scales. This condition is the requirement of minimal propagation error, and it will be central to our generalization of GMSMs for non-equilibrium, or even time-inhomogeneous systems. Let us define the best k-dimensional approximation to , i.e., the best projection , as the rank-k operator satisfying
where denotes the induced operator norm for operators mapping to itself. The induced norm of an operator is defined by , where and are the norms on the spaces and , respectively.
Equivalently, (11) can be viewed as a result stating that is the k-dimensional approximation of yielding the smallest (worst-case) error in density propagation:
where means that minimizes the function h, possibly subject to constraints that are listed under arg min.
To summarize, the best GMSM (9) in terms of (11) (or, equivalently, (12)) is given by the projection (10). This follows from the self-adjointness of and the Eckard–Young theorem; details can be found in [30] and in Appendix A. Caution is needed however, when interpreting as the propagation of a given probability density f. The projection to the dominant eigenspace in general does not respect positivity (i.e., ), thus loses its probabilistic meaning. This is the price to pay for the perfectly reproduced dominant time scales. We can retain a physical interpretation of a MSM if we accept that the dominant time scales will be slightly off, as we discuss in the next section.
3.2. Metastable Sets
There is theoretical evidence [1] that the more pronounced the metastable behavior of system is (in the sense that the size of the time scale gap is large), the more constant the dominant eigenfunctions are on the metastable sets , given the lag time with respect to which the transfer operator is taken satisfies . Assuming such a situation, the eigenfunctions of can approximately be combined from the characteristic functions over the metastable sets, i.e., with the abbreviation it holds that
where the are components of the linear combination, such that the are orthonormal. Using the “approximate eigenfunctions” defined in (13), the modified projection
defines a new MSM . Since , also , and thus we have . This implies [36], Lemma 3.5 that also their dominant eigenvalues, hence time scales are close. Further, we have that in the basis the matrix representation of the -restriction of the operator has the entries
where denotes the probability measure that arises if has distribution (restricted to ). That is, has the transition probabilities between the metastable sets as entries, giving a direct physical interpretation of the MSM. Note, however, that for this approximation to reproduce the dominant time scales well, i.e., to have , , we need a strong separation of time scales in the sense that has to hold, and the lag time needs to be chosen sufficiently large [7].
3.3. Example: Stationary Diffusion in Double-Well Potential
Let us consider the diffusion (1) in the potential landscape with ; cf. Figure 1 (left). With the lag time we approximate the Perron–Frobenius operator and compute its eigenvector at the eigenvalue . Then, we compute the transfer operator with respect to the stationary distribution , and its dominant eigenvalues and corresponding eigenvectors (Figure 1, right). While , we have , hence we have a clear time scale separation, , cf. (7).
Thus, we expect a rank-2 MSM to recover the dominant time scales very well. Indeed, choosing and gives , and we obtain by (15) that
This is a stochastic matrix with eigenvalues and , i.e., yielding an approximate time scale .
4. Markov State Models for Time-Inhomogeneous Systems
As all our non-equilibrium cases will be special instances of the most general, time-inhomogeneous case, we consider this next.
4.1. Minimal Propagation Error by Projections
4.1.1. Conceptual Changes
The above approach to Markov state modeling is relying on the existence of an stationary distribution and reversibility. In the case of a time-inhomogeneous system there will not be, in general, any stationary distribution . Additionally, we are lacking physical meaning, since it is unclear with respect to which ensemble the dynamical fluctuations should be described. From a mathematical perspective there is a problem as well, since the construction relies on the reversibility of the underlying system, which gives the self-adjointness of the operator with respect to the weighted scalar product . Time-inhomogeneous systems are not reversible in general.
Additionally to these structural properties, we might need to depart from some conceptional ones as well. As time-inhomogeneity usually stems from an external forcing that might not be present or known for all times, we need a description of the system on a finite time interval. This disrupts the concept of dominant time scales as they are considered in equilibrium systems, because there it relies on self-similarity of observing an eigenmode over and over for arbitrary large times. It also forces us to re-visit the concept of metastability for two reasons. First, many definitions of metastability rely on statistics under the assumption that we observe the system for infinitely long times. Second, as an external forcing may theoretically arbitrarily distort the energy landscape, it is a priori unclear what could be a metastable set.
As a remedy, we aim at another property when trying to reproduce the effective behavior of the full system by a reduced model; this will be minimizing the propagation error, as in (12). Remarkably, this will also allow for a physical interpretation through so-called coherent sets; analogous to metastable sets in the equilibrium case.
A prototypical time-inhomogeneous system can be given by
where the potential W now depends explicitly on time t. In this case, a lag time is not sufficient to parametrize the statistical evolution of the system, because we need to know when we start the evolution. Thus, transition density functions need two time parameters, e.g., denotes the distribution of conditional to . Similarly, the transfer operators are parametrized by two times as well, e.g., propagates probability densities from initial time s to final time t (alternatively, from initial time s for lag time ). To simplify notation, we will settle for some initial and final times, and drop these two time parameters, as they stay fixed.
4.1.2. Adapted Transfer Operators
Let us observe the system from initial time to final time , such that its distribution at initial time is given by . Then, if denotes the propagator of the system from to , then we can express the final distribution at time by . As the transfer operator in equilibrium case was naturally mapping to itself (because was invariant), here it is natural to consider the transfer operator mapping densities (functions) with respect to to densities with respect to . Thus, we define the transfer operator by
which is the non-equilibrium analogue to (4). This operator naturally retains some properties of the equilibrium transfer operator [37]:
- , encoding the property that is mapped to by the propagator .
- is positive and integral-preserving, thus .
- Its adjoint is the Koopman operator , .
4.1.3. An Optimal Non-Stationary GMSM
As already mentioned above, it is not straightforward how to address the problem of Markov state modeling in this time-inhomogeneous case via descriptions involving time scales or metastability. Instead, our strategy will be to search for a rank-k projection of the transfer operator with minimal propagation error, to be described below.
The main point is now that due to the non-stationarity the domain (where maps from) and range (where maps to) of the transfer operator are different spaces, hence it is natural to choose different rank-k subspaces as domain and range of too. In fact, it is necessary to choose domain and range differently, since has a different meaning than . Thus, we will search for projectors and on different k-dimensional subspaces and , respectively, such that the reduced operator
has essentially optimal propagation error. In quantitative terms, we seek to solve the optimization problem
where denotes the induced operator norm of operators mapping to .
As an implication of the Eckart–Young theorem [38] Theorem 4.4.7, the solution of (19) can explicitly be given through singular value decomposition of ; yielding the variational approach for Markov processes (VAMP) [30]. More precisely, the k largest singular values of have right and left singular vectors satisfying , respectively, i.e., . Choosing
solves (19), see Appendix A.
4.2. Coherent Sets
Similarly to the reversible equilibrium case with pronounced metastability in Section 3.2, it is also possible in the time-inhomogeneous case to give our GMSM (18) from Section 4.1 a physical interpretation—under some circumstances.
In the reversible equilibrium situation, recall from (13) that in the case of sufficient time scale separation the eigenfunctions are almost constant on metastable sets. In the time-inhomogeneous situation, considered now, we have just shown that the role played before by the eigenfunctions is taken by left- and right singular functions. Thus, let us assume for now that there are two collections of sets, at initial time, and at final time, such that
holds with appropriate scalars and , where we used the abbreviation and . That means, dominant right singular functions are almost constant on the sets , and dominant left singular functions are almost constant on the sets . In analogy to (14), we modify the projections from (20) to by using and instead of and , respectively, and define the modified GMSM by . An analogous computation to (15) yields for the matrix representation of the restriction with respect to the bases and that
In other words, the entries of contain the transition probabilities from the sets (at initial time) into the sets (at final time). Thus, has the physical interpretation of a MSM, with the only difference to the reversible stationary situation being that the “metastable” sets at initial and final time are different. This can be seen as a natural reaction to the fact that in the time-inhomogeneous case the dynamical environment (e.g., the potential energy landscape governing the dynamics of a molecule) can change in time.
It remains to discuss when does (21) actually hold true. It is comprehensively discussed in [17] that a sufficient condition for (21) is if
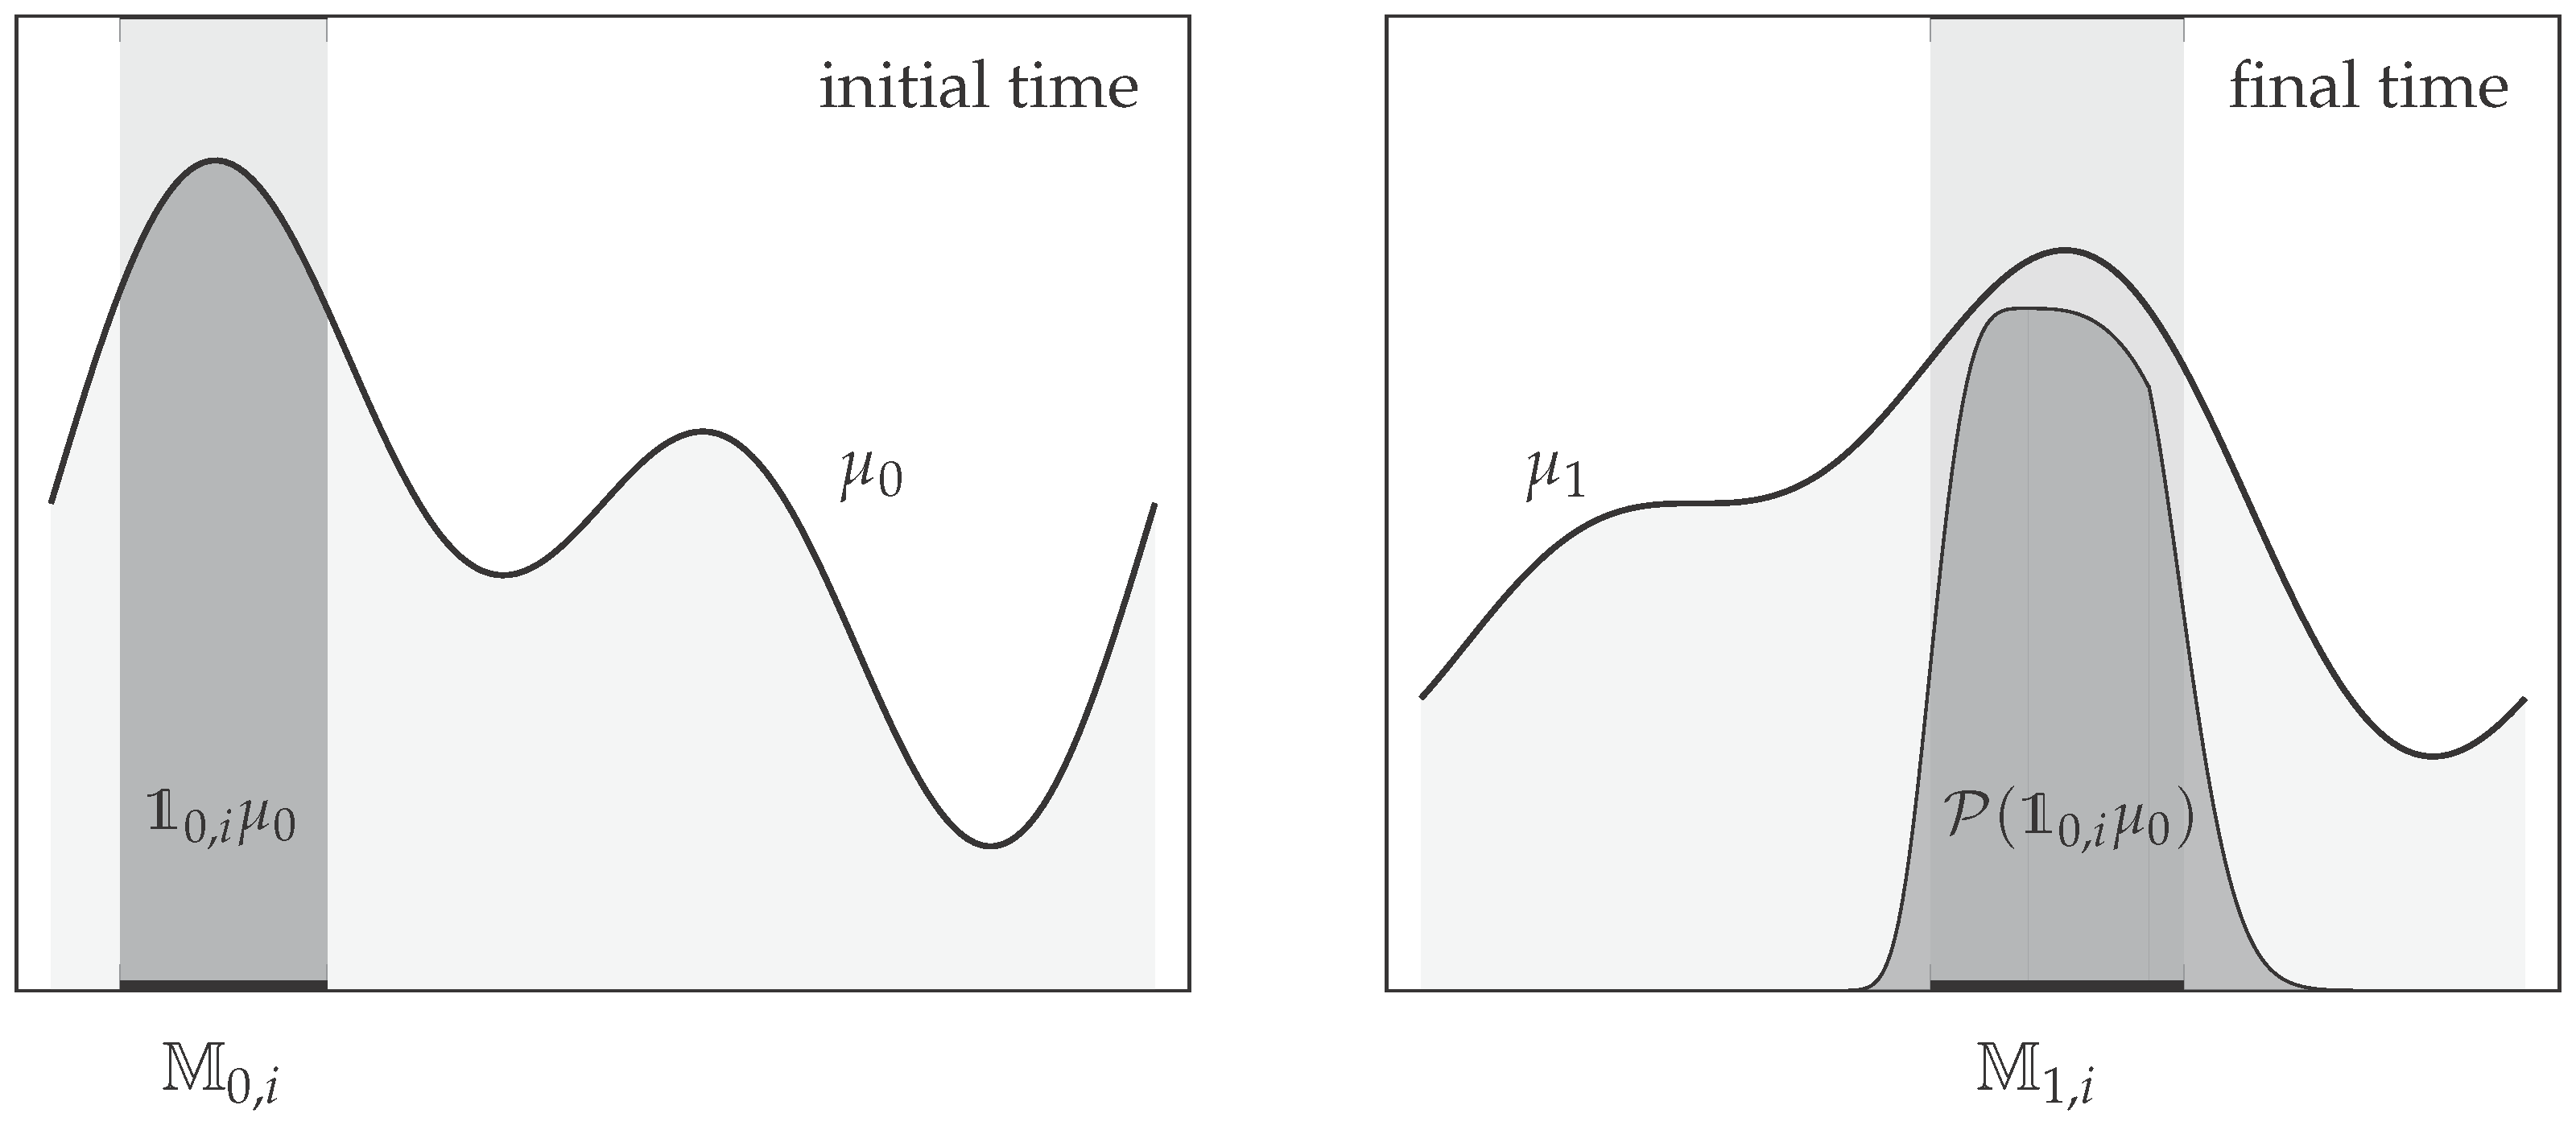
holds for . Equation (23) says that if the process starts in , it ends up at final time with high probability in , and that if the process ended up in at final time, in started with high probability in ; see Figure 2. This can be seen as a generalization of the metastability condition from Section 3.2 that allows for an efficient low-rank Markov modeling in the time-homogeneous case. The pairs of sets are called coherent (set) pair, and they have been shown to be very effective tools identifying time-dependent regions in non-autonomous flow fields that do not mix with their surrounding (this is, effectively, what (23) says), e.g., moving vortices in atmospheric and oceanographic applications [15,16,39,40]. More details on the generalization of the concept of metastability by coherent sets, and on subsequent Markov state modeling can be found in [17].
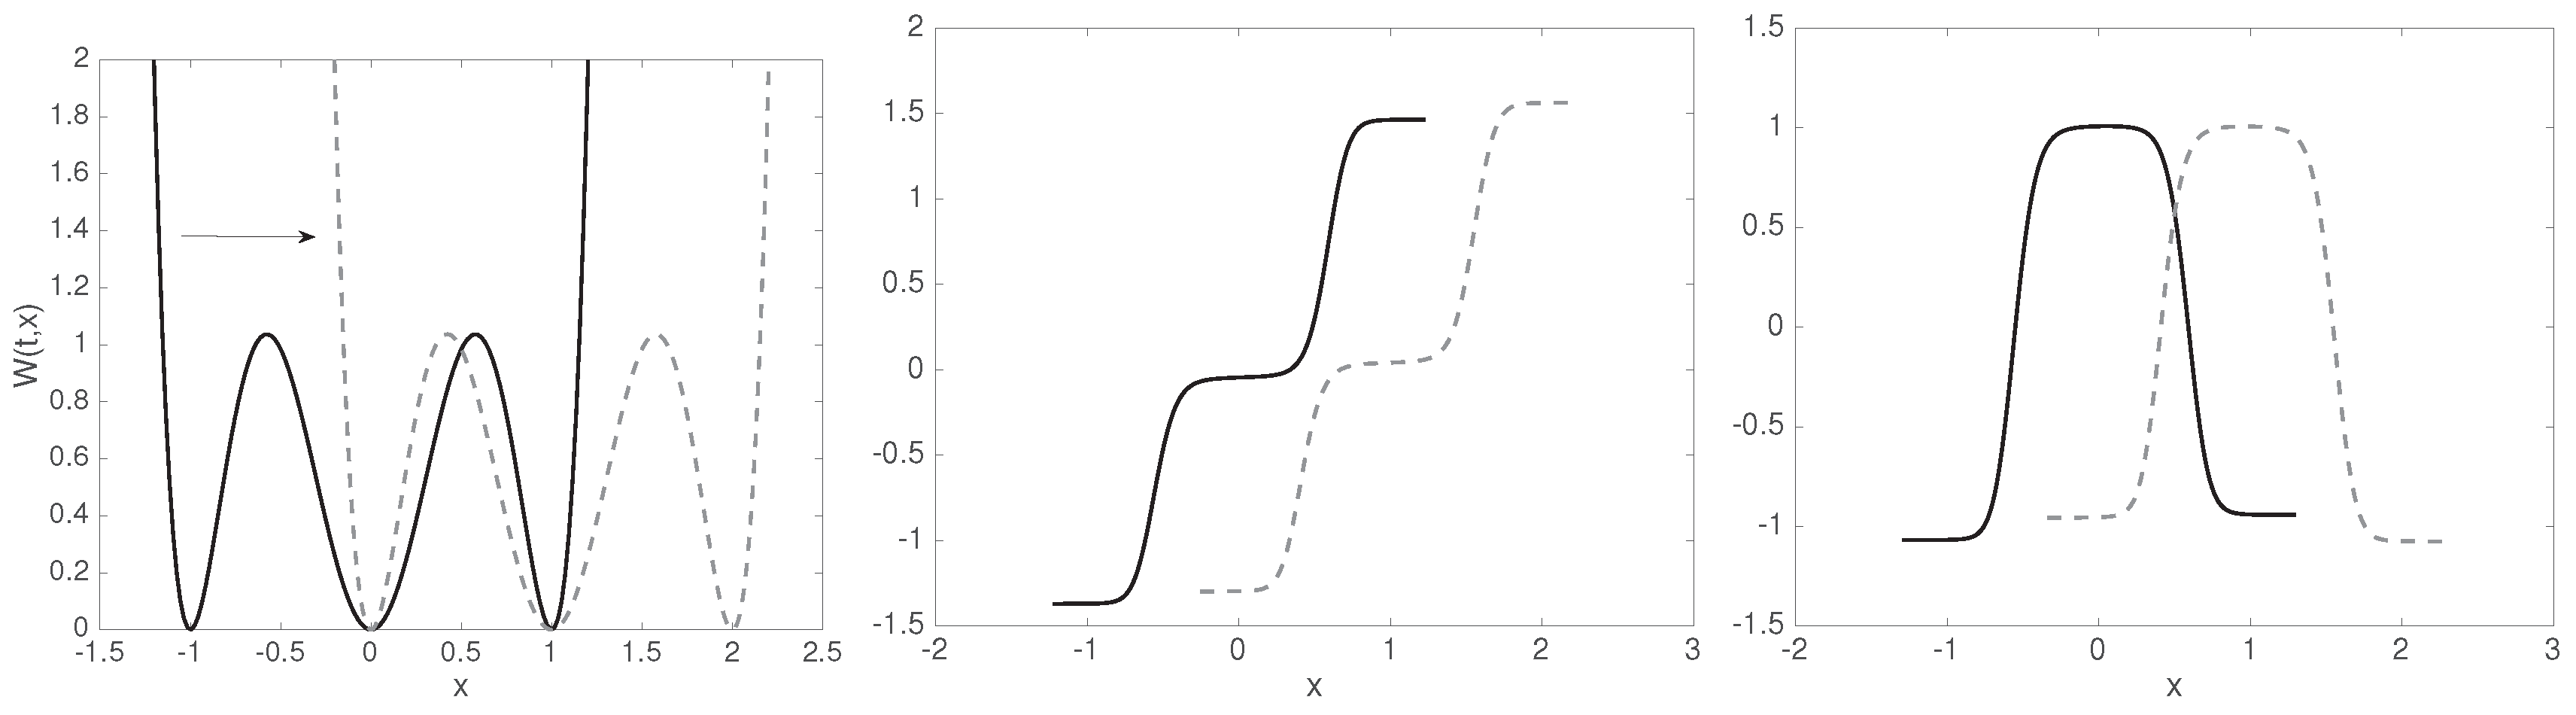
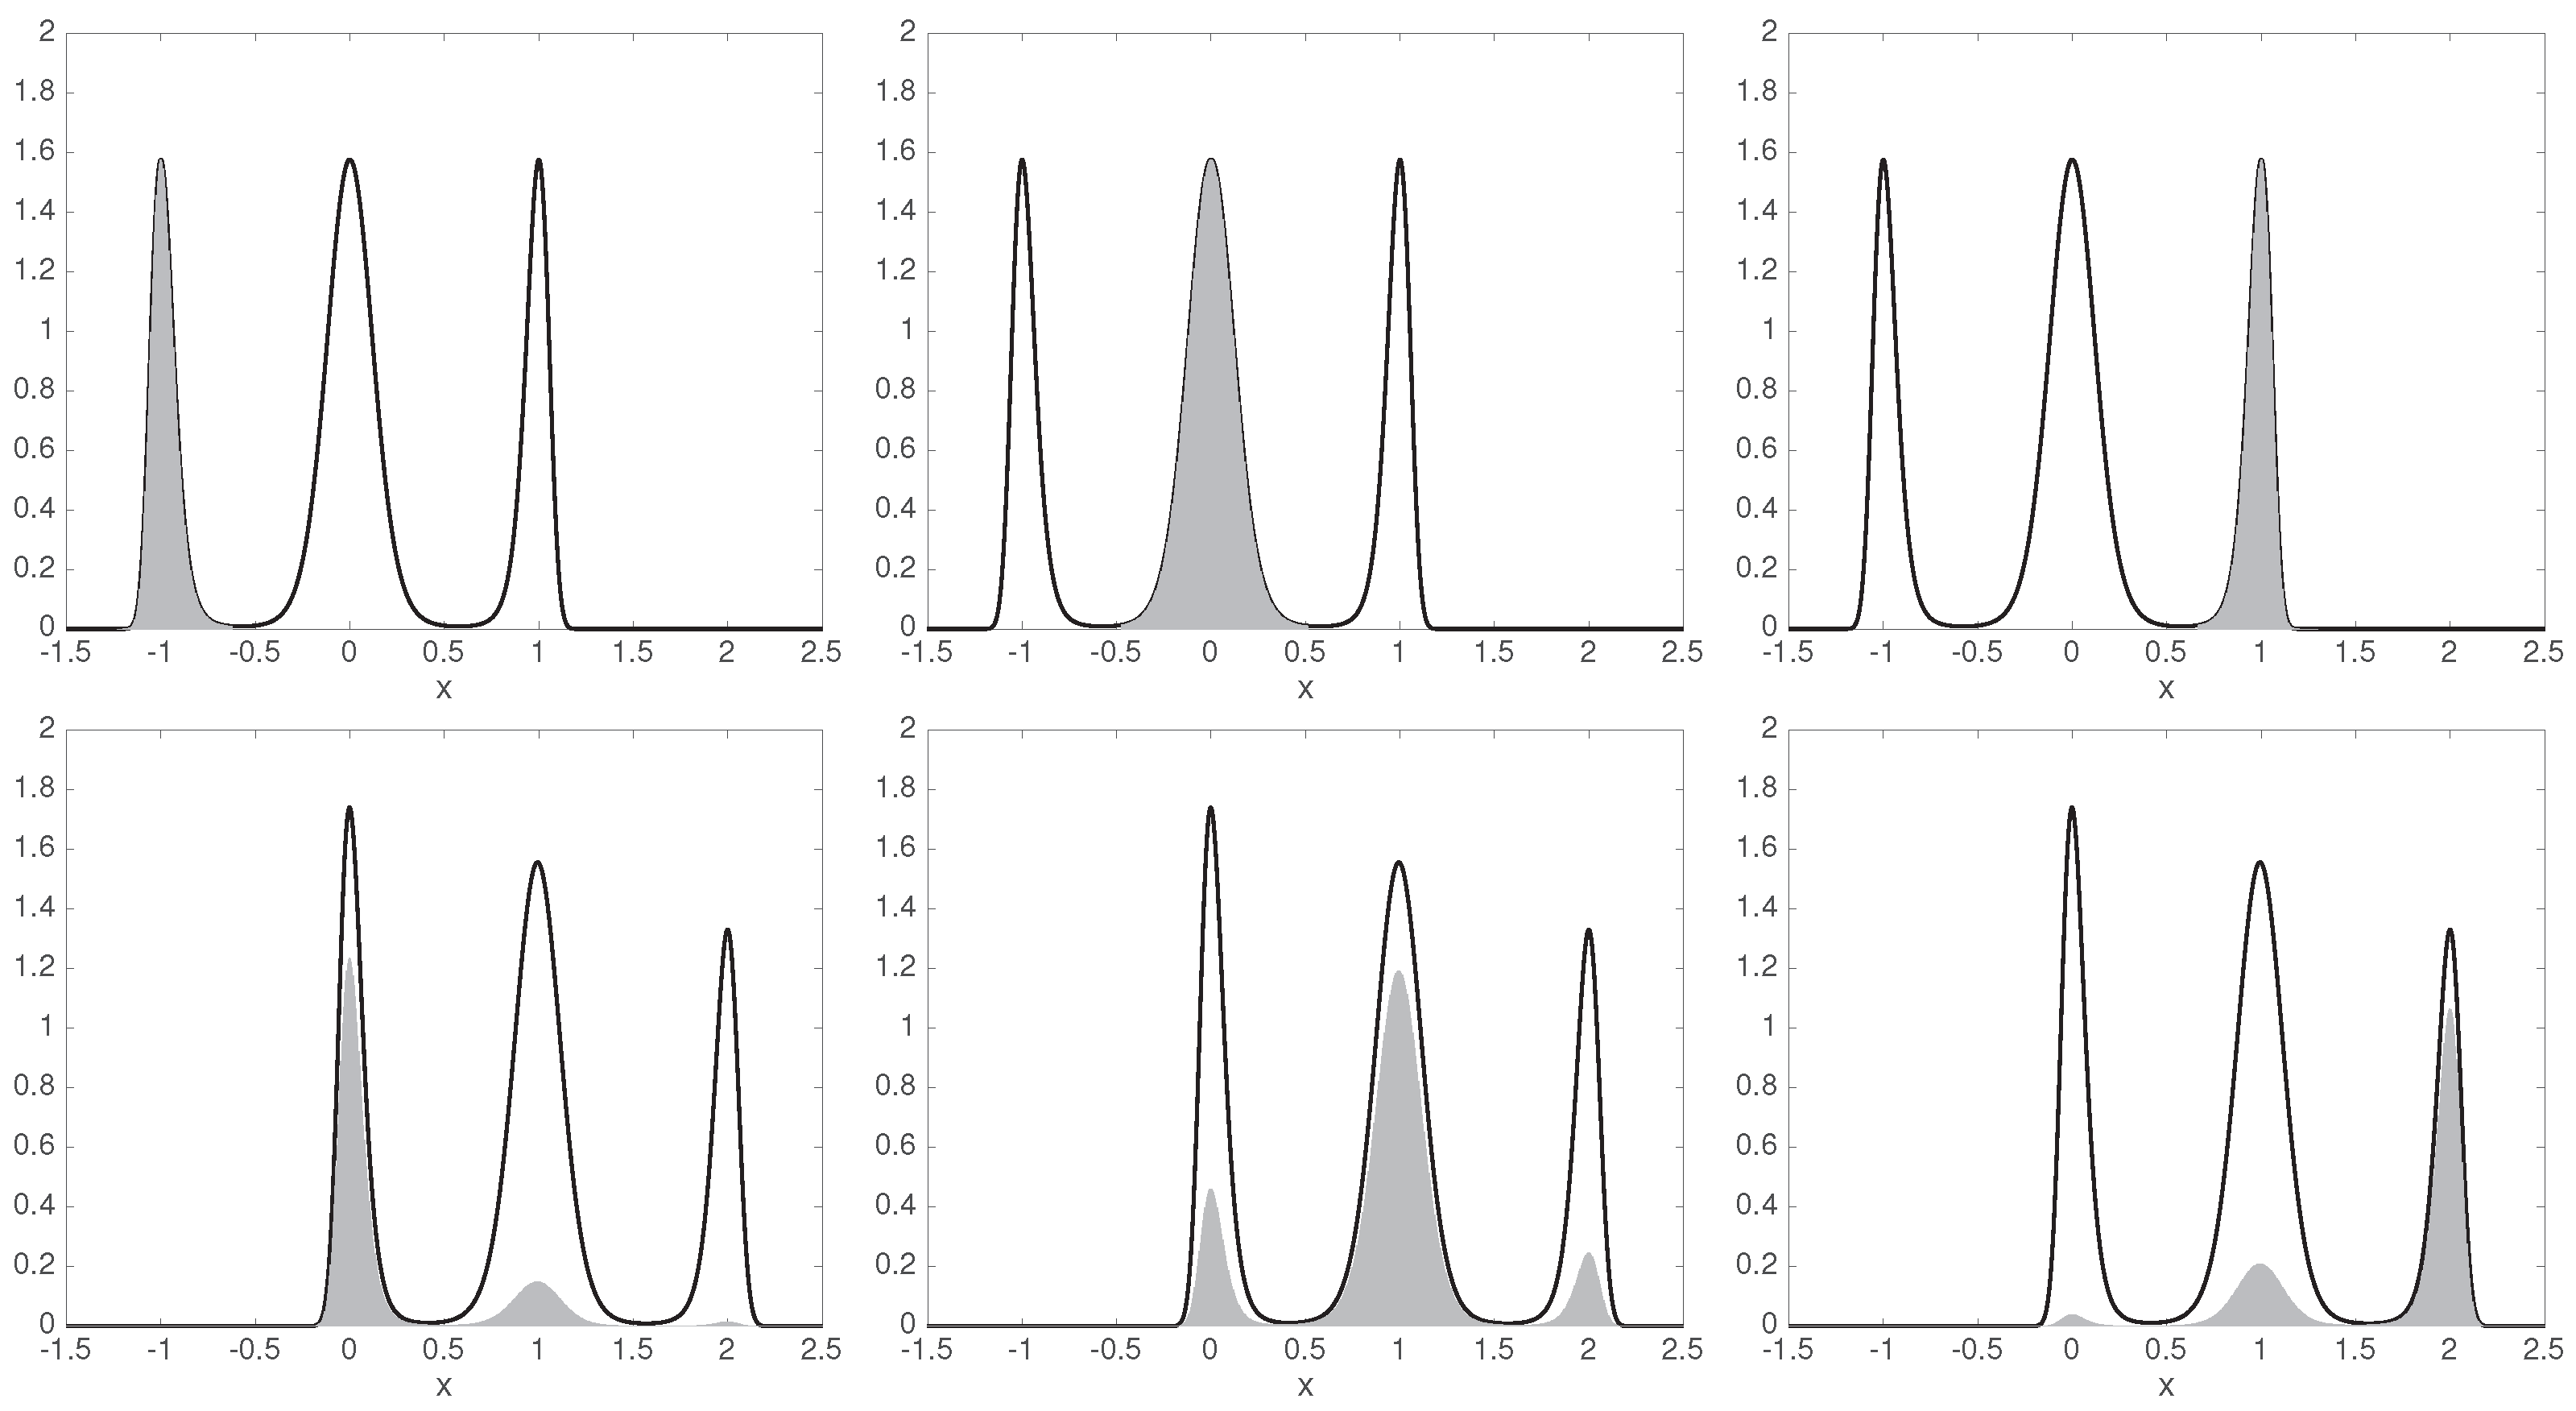
4.3. Example: Diffusion in Shifting Triple-Well Potential
Let us consider the diffusion (1) in the time-dependent potential landscape
with and on the time interval ; cf. Figure 3 (left). Taking the initial distribution , we build the transfer operator (17), and consider its dominant singular values:
This indicates that a rank-3 GMSM is sufficient to approximate the system, and that we have three coherent sets. We observe the characteristic almost constant behavior (21) of the left and right singular vectors over the respective coherent sets; Figure 3 (middle and right). Recall that right singular vectors show coherent sets at initial time, and left singular vectors the associated coherent sets at final time.
We can identify the three wells as three coherent sets. Figure 4 shows that they are coherent indeed: the respective parts of the initial ensemble is to a large extent mapped onto the corresponding part of the final ensemble , cf. Figure 2 and (23).
Computing the MSM from the transition probabilities between the coherent sets as in (22) gives the stochastic matrix
The initial distribution of this MSM is given by the probability that assigns to the respective coherent sets at initial time. Analogously, collecting the probabilities from in the coherent sets at final time gives the final distribution of the MSM. We have
The singular values of as mapping from the -weighted to the -weighted are
they are in good agreement with the true singular values of .
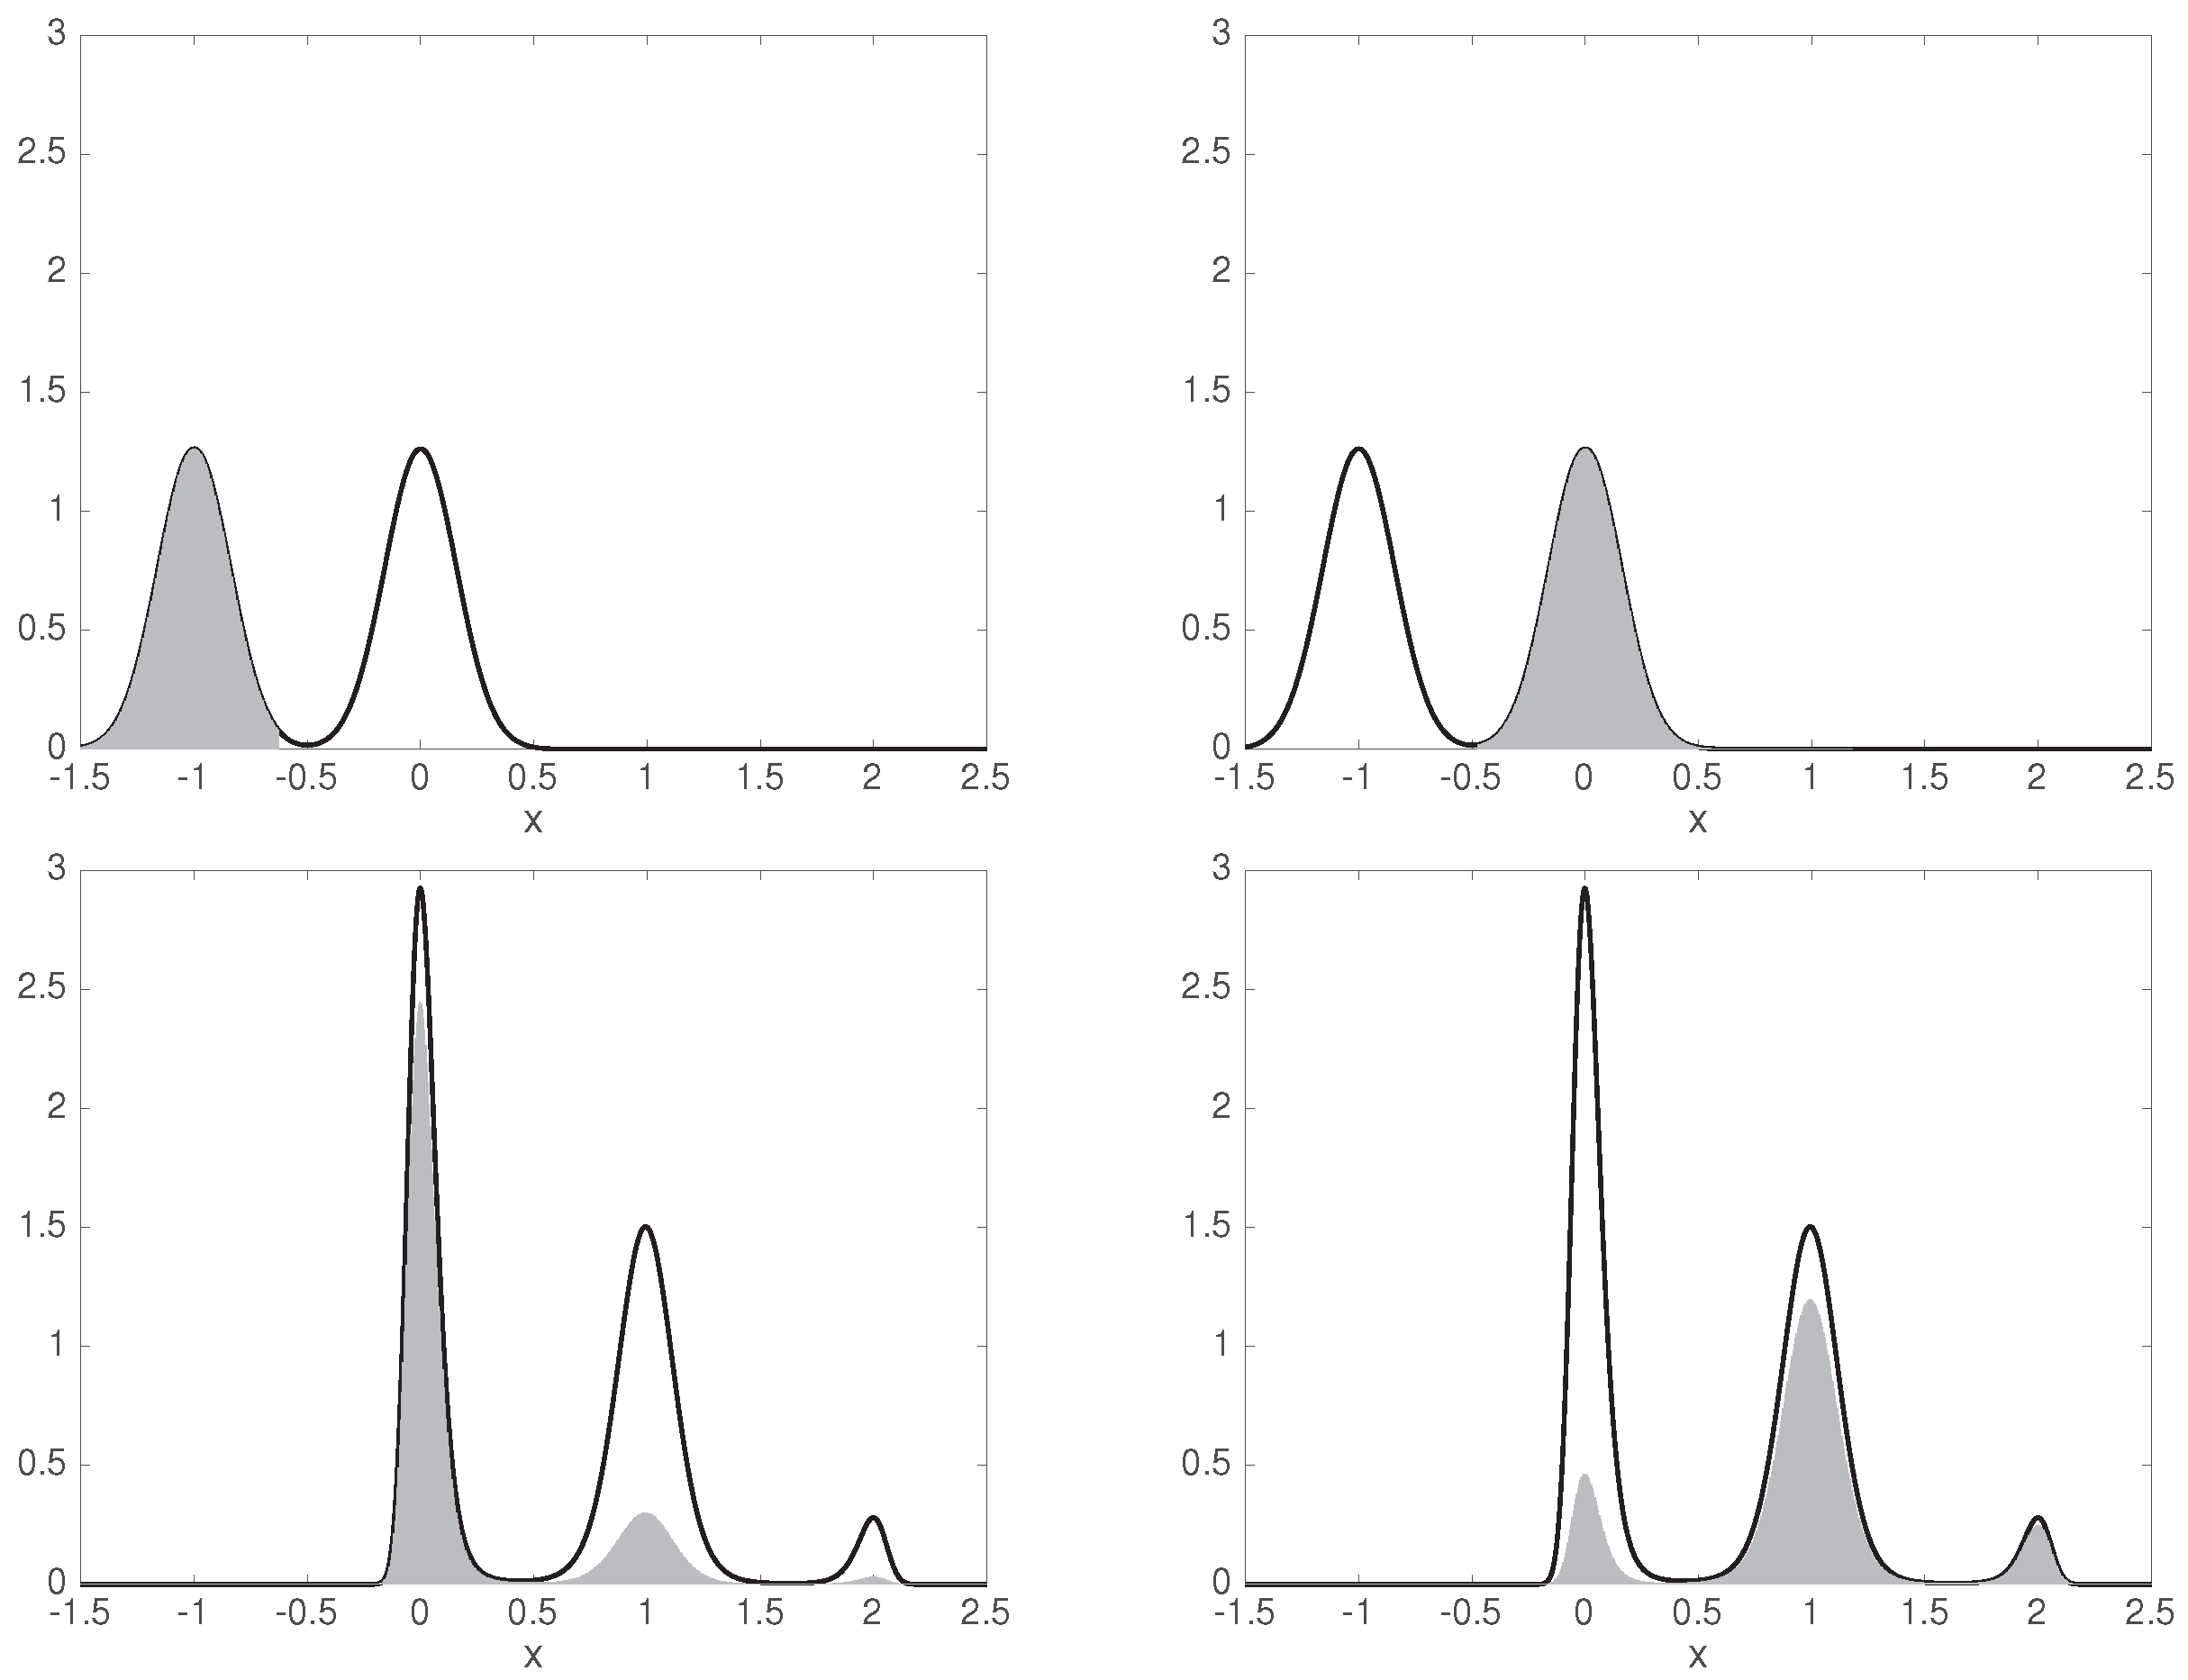
We repeat the computation with a different initial distribution , where only the left and right well are initially populated, as shown in Figure 5.
The largest singular values of ,
already show that there are only two coherent sets, as the third singular value is significantly smaller than the second one. The left well forms one coherent set, and the union of the middle and right ones form the second coherent set.
5. Data-Based Approximation
5.1. Setting and Auxiliary Objects
We would like to estimate the GMSM (18) from trajectory data. In the time-inhomogeneous setting, let us assume that we have m data points at time , and their (random) images at time , meaning that is a random sample of the underlying process at time , given it started in at time . We can think of the empirical distribution of the and being estimates of and , respectively.
Let us further define two sets of basis functions and , which we would like to use to approximate the GMSM. If we would like to estimate the first k dominant modes, the least requirement is ; in general we have . The vector-valued functions
are basis functions at initial and final times, respectively. One can take and to have different lengths too, we just chose them to have the same lengths for convenience. Now we can define the data matrices
The following correlation matrices will be needed later:
Their Monte Carlo estimates from the trajectory data are given by products of the data-matrices, as
Note that the approximations in (24) become exact if we take to be the empirical distributions and , where denotes the Dirac delta. We assume that , just as their data-based approximations in (24) are invertible. If they are not, all the occurrences of their inverses below need to be replaced by their Moore–Penrose pseudoinverses. Alternatively, one can also discard basis functions that yield redundant information, until are invertible. Further strategies to deal with the situation where the correlation matrices are singular or ill-conditioned can be found in [18].
5.2. Projection on the Basis Functions
To find the best GMSM representable with the bases and , we would like to solve (19) under the constraint that the ranges of and are in and , respectively. To the knowledge of the authors it is unknown whether this problem has an explicitly computable solution, because it involves a non-trivial interaction of and .
Instead, we will proceed in two steps. First, we compute the projected transfer operator , where and are the - and -orthogonal projections on and , respectively. Second, we reduce to its best rank-k approximation (best in the sense of density propagation).
Thus, the restriction to is simply the -orthogonal projection of on , giving the characterization
It is straightforward to compute that with respect to the bases and the matrix representation of is given by
see [30].
5.3. Best Low-Rank Approximation
To find the best rank-k projection of , let us now switch to the bases and . We can switch between representations with respect the these bases by
and similarly for and . Again, a direct calculation shows that and build orthonormal bases, i.e., and . This has the advantage, that for any operator having matrix representation with respect to the bases and we have
where denotes the spectral norm of a matrix (i.e., the matrix norm induced by the Euclidean vector norm). The matrix representation of in the new bases is
However, finding now the best rank-k approximation of amounts, written in these new bases, to
Again, by the Eckart–Young theorem [38] Theorem 4.4.7, the solution to this problem is given by
where are the matrices with columns being the right and left singular vectors of to the largest k singular values , and is the diagonal matrix with these singular values on its diagonal. Thus, the best GMSM in terms of propagation error is given with respect to the bases and by
The resulting algorithm to estimate the optimal GMSM is now identical to the time-lagged canonical correlation algorithm (TCCA) that results from VAMP and is described in [30].
| Algorithm 1 TCCA algorithm to estimate a rank-k GMSM. |
|
Remark 1 (Reversible system with equilibrium data).
If the system in consideration is reversible, the data samples its equilibrium distribution, i.e., , and also , then , and by the self-adjointness of from (6) we have . Thus, in (28) is a symmetric matrix, and as such, its singular value and eigenvalue decompositions coincide. Hence, the construction for the best GMSM in this section (disregarding the projection on the basis functions) coincides with the one from Section 3. This is not surprising, as both give the best model in terms of propagation error.
Remark 2 (Other data-based methods).
The approximation (26) of the transfer operator has natural connections to other data-based approximation methods. It can be seen as a problem-adapted generalization of the so-called Extended Dynamic Mode Decomposition (EDMD) [41,42]. Strictly speaking, however, EDMD uses an orthogonal projection with respect to the distribution of the initial data , and so approximation (32) below is equivalent to it [43]. EDMD has been shown in [33] to be strongly connected to other established analytic tools for (molecular) dynamical data, such as time-lagged independent component analysis (TICA) [44,45], blind source separation [46], and the variational approach to conformation analysis [9].
Remark 3 (Sampling the correlation matrices).
Our point of view in (24) and in the discussion following it is that without further knowledge of the system the empirical distributions are the best estimates of the actual system distributions ; and they are considered to be the same for a given finite set of data. The question how to approximate the correlation matrices efficiently if we are allowed to generate arbitrary amount of simulation data is an important and hard one. The reason for this is that in high dimensions these quantities can only be accessed via (Markov chain) Monte Carlo methods, the convergence speed of which, however, suffers immensely from the rareness of transitions between metastable regions. There are different approaches to circumvent this problem, like importance sampling, where driving the system out of equilibrium accelerates sampling, and fluctuation theorems are used to determine the original quantity of interest [47,48,49,50,51,52,53].
6. Time-Homogeneous Systems and Non-Stationary Data
In this final section, we illustrate how the above methods can be used to construct a GMSM for and assess properties of a stationary system, even if the simulation data at our disposal does not sample the stationary distribution of the system. In the first example we reconstruct the equilibrium distribution of a reversible system—hence we are able to build an equilibrium GMSM. In the second example we approximate a non-reversible stationary system (i.e., detailed balance does not hold) by a (G)MSM, again from non-stationary data.
Of course, all the examples presented so far can also be computed by the data-based algorithm of Section 5.
6.1. Equilibrium MSM from Non-Equilibrium Data
When working with simulation data, we need to take into account that this data might not be in equilibrium. Then, obviously, the empirical distribution does not reflect the stationary distribution of the system. In general, any empirical statistical analysis (e.g., counting transitions between a priori known metastable states) will be biased in such a case.
Let us consider a reversible system with equilibrium distribution , and let the available trajectory data be -distributed. Then, it is natural to describe the system by its transfer operator with respect to the reference distribution [18,42]; given explicitly by
Note that is the stationary distribution of this transfer operator, hence we can retrieve the equilibrium distribution of the system by correcting the reference distribution, .
In the data-based context, we choose the same basis for initial and final times, since the system is time-homogeneous. In complete analogy to (26) above, the -orthogonal projection of to is given by the matrix
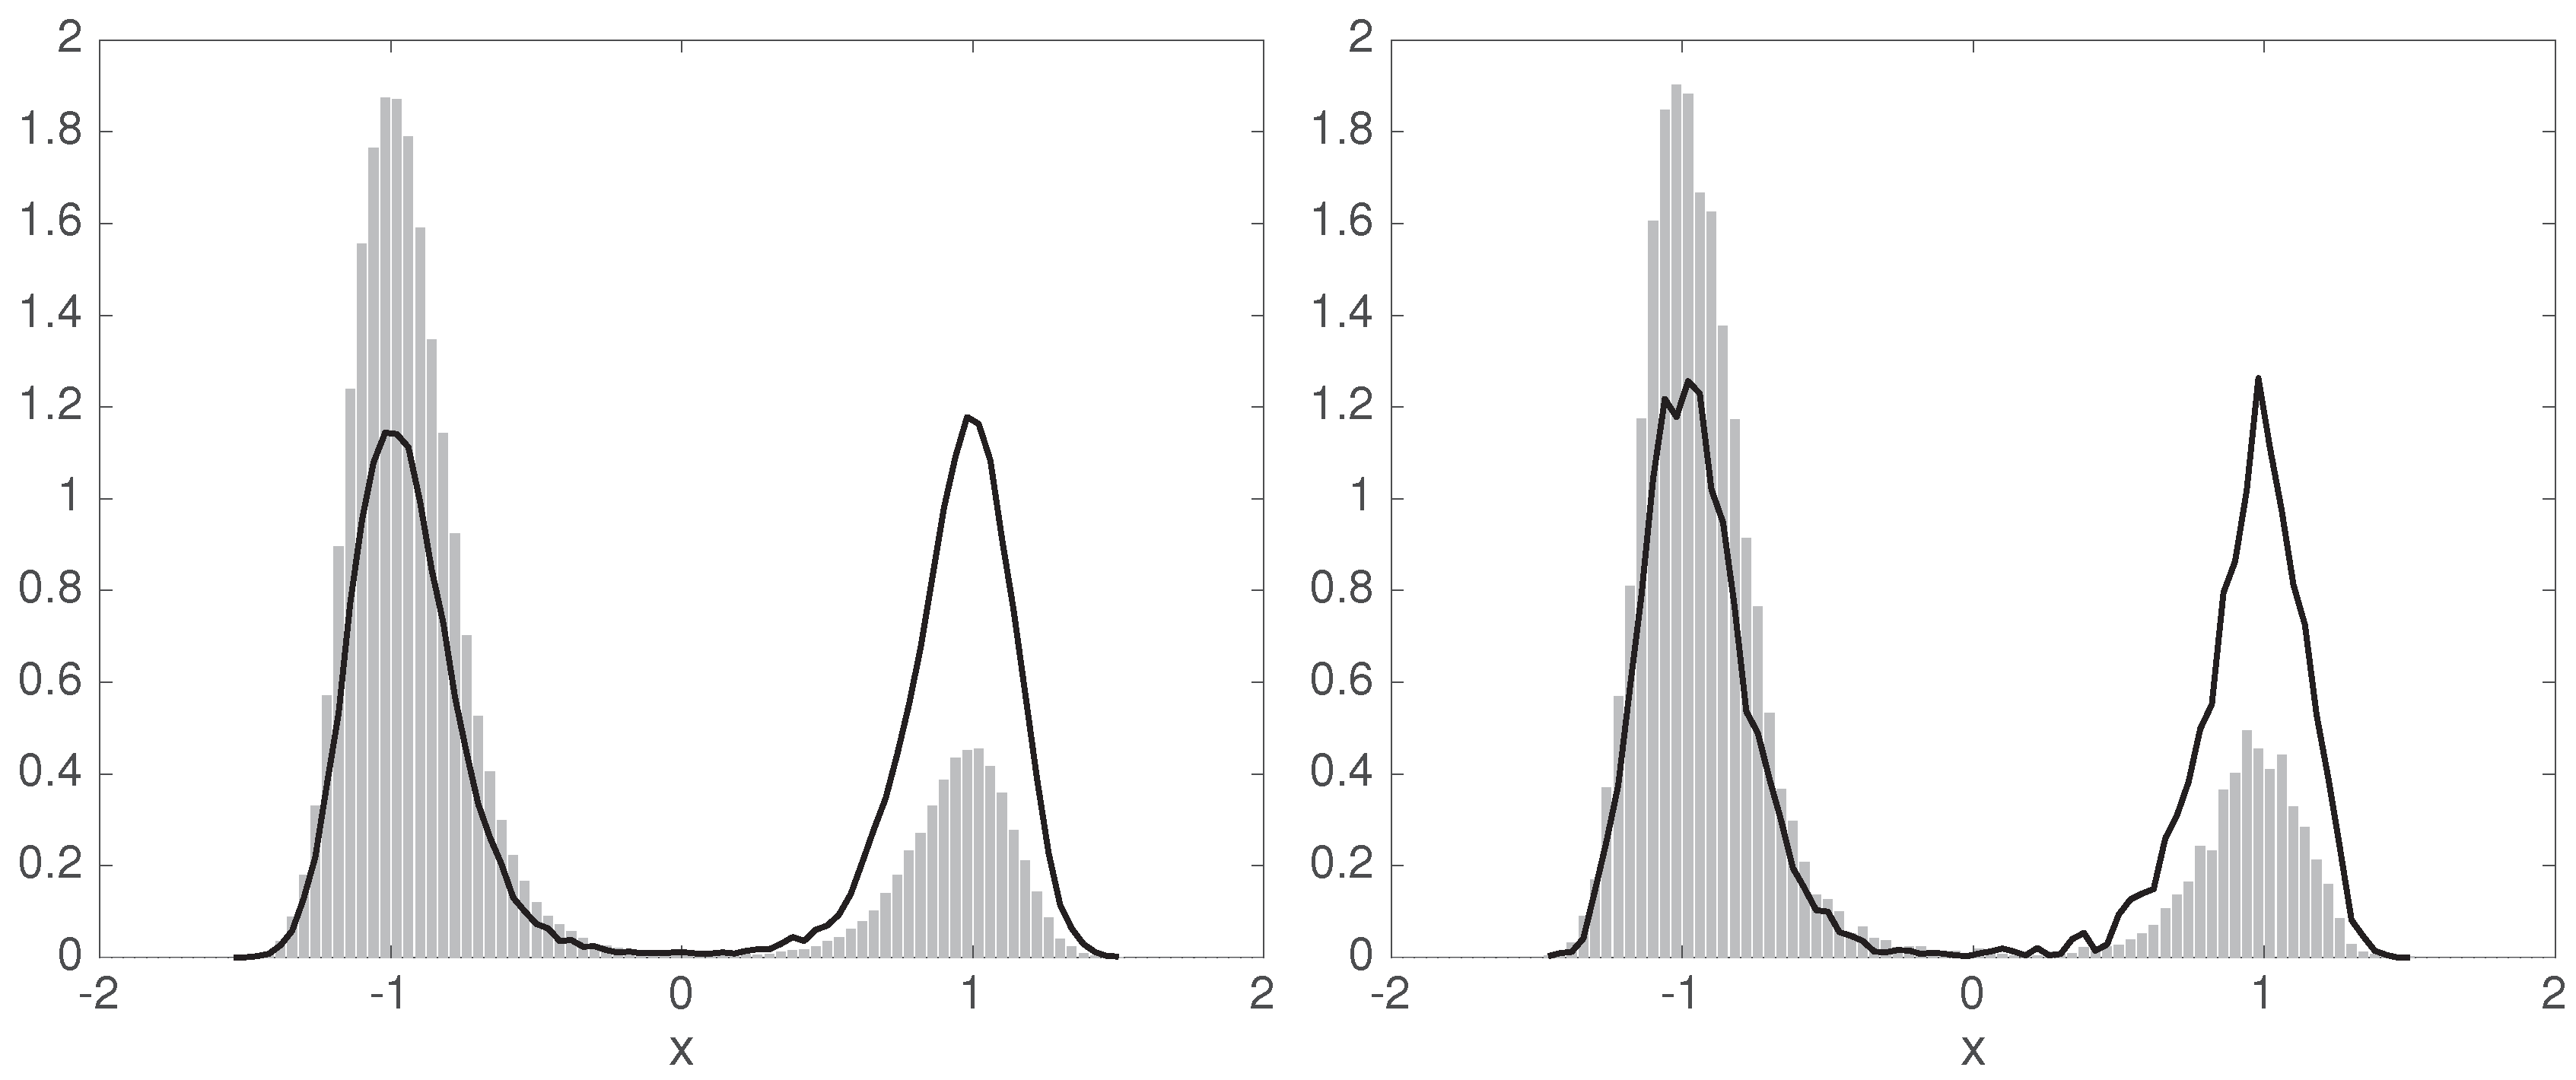
We will now apply this procedure to the double-well system from Section 3.3 with initial points distributed as shown in Figure 6 (gray histogram). We chose the number of points to be , the basis functions to be indicator functions of subintervals of an equipartition of the interval into subintervals, and the lag time . In a preprocessing step we discard all basis functions that do not have any of the points in their support, thus obtaining a non-singular , and use the remaining 77 to compute .
We obtain giving a time scale , and the corrected equilibrium distribution—, where is the right eigenvector of at eigenvalue 1—is shown in Figure 6 (left) by the black curve. The right-hand side of this figure shows the results of the same computations, but for a sample size . Then, we obtain an eigenvalue and corresponding time scale .
It is now simple to reconstruct the approximation of , the transfer operator with respect to the equilibrium density. Let denote the diagonal matrix with the elements of as diagonal entries. Then, approximates the matrix representation of with respect to our basis of step functions.
Remark 4 (Koopman reweighting).
One can make use of the knowledge that the system that one estimates is reversible, even though due to the finite sample size m this is not necessarily valid for . In [18], the authors add for each sample pair also the pair to the sample set, thus numerically forcing the estimate to be reversible. In practice, one defines the diagonal matrix with diagonal , builds the reweighted correlation matrices and , and uses them instead of .
6.2. A Non-Reversible System with Non-Stationary Data
Reversible dynamics gives rise to self-adjoint transfer operators, and their theory of Markov state modeling is well developed. However, transfer operators of non-reversible systems are not self-adjoint, hence their spectrum is in general not purely real-valued. Thus, the definition of time scales, and in general the approximation by GMSMs is not fully evolved. Complex eigenvalues indicate cyclic behavior of the process. As this topic is beyond the scope of this paper, we refer the reader to [20,54,55] and to [25,56] for Markov state modeling with cycles.
We will consider a non-reversible system here, and show that restricting its behavior to the dominant singular modes of its transfer operator is able to reproduce its dominant long-time behavior, and even allows for a good, few-state MSM. Note that the best rank-k GMSM (18) maps to the k-dimensional subspace of left singular vectors, thus its eigenvectors also fall into this subspace.
The system in consideration consists of two driving “forces”, one is a reversible part coming from the potential
and the other is a circular driving given by
where is the inverse temperature, as in (1). The dynamics now is governed by the SDE . It is a diffusion in a 7-well potential (the wells are positioned uniformly on the unit circle) with an additional clockwise driving that is strongest along the unit circle and decreases exponentially in the radial distance from this circle.
For our data-based analysis we simulate a trajectory of this system of length 500 and sample it every 0.01 time instances to obtain an initial set of points. Every point herein is taken as initial condition of 100 independent simulations of the SDE for lag time , thus obtaining point pairs .
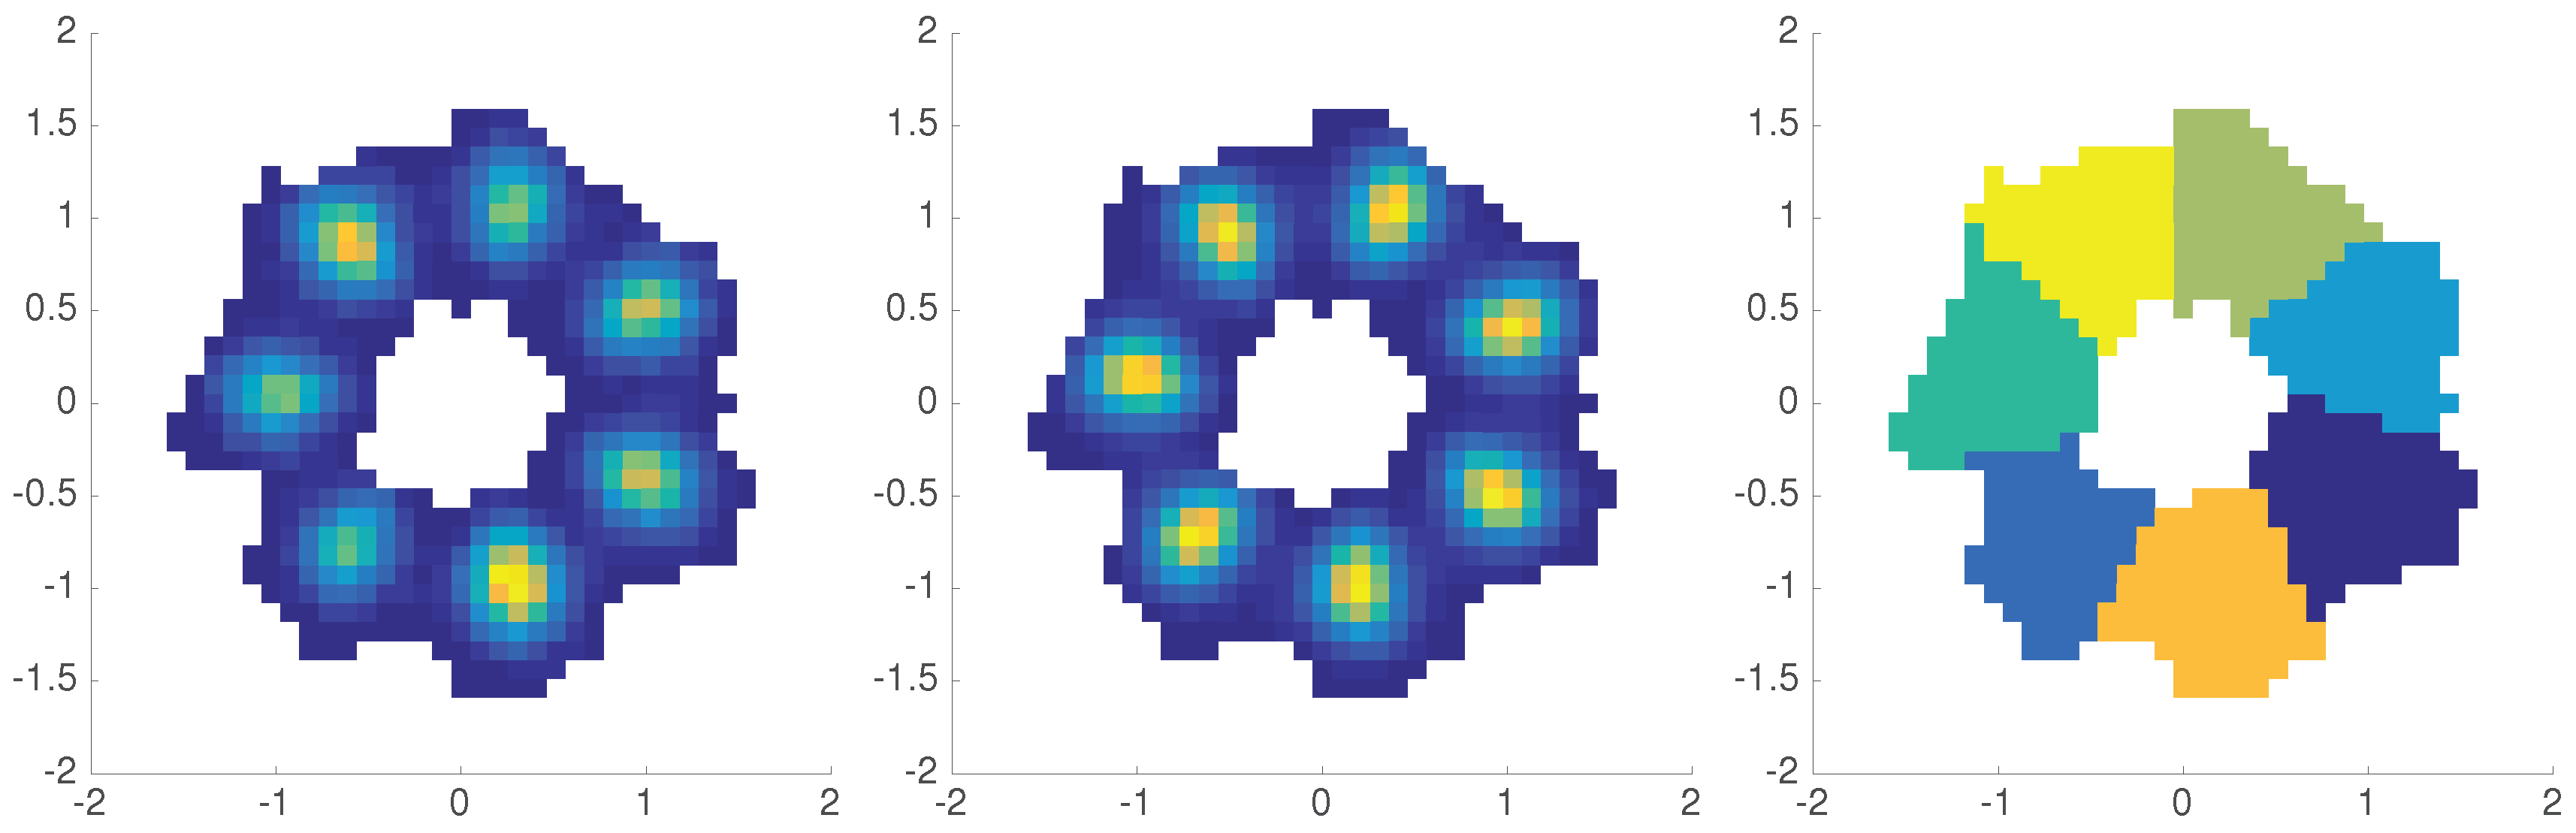
We observe in Figure 7 (left) that the empirical distribution of the did not yet converge to the invariant distribution of the system, which would populate every well evenly.
To approximate the transfer operator we use consisting of the characteristic functions of a uniform partition of , and restrict this basis set to those 683 partition elements that contain at least one and . The associated projected transfer operator, from (26) is then used to compute from (28), and its singular values
indicating a gap after seven singular values. Thus, we assemble a rank-7 GMSM via (30). This GMSM maps to , thus to make sense of its eigenmodes, we need to transform its range to densities with respect to instead of . As a density u with respect to is made by to a density with respect to ,
rescales the GMSM to map to itself. Note here that since the basis functions are characteristic functions with disjoint support, the correlation matrices are diagonal, having exactly the empirical distributions as diagonal entries—i.e., the number of data point falling into the associated partition element.
We are also interested in the system’s invariant distribution. As in Section 6.1, we can correct the reference distribution by the first eigenfunction of to yield the invariant distribution , cf. Figure 7 (middle). The dominant eigenvalues of are
Note that . This is due to our restriction of the computation to certain partition elements, as specified above. This set of partition elements is not closed under the process dynamics, and this “leakage of probability mass” (about ) is reflected by the dominant eigenvalue. All eigenvalues of are within error from the dominant eigenvalues of the transfer operator with respect to the stationary distribution (projected on the same basis set, and computed with higher accuracy), which is a surprisingly good agreement.
The 8-th eigenvalue of is smaller in magnitude than . As indicated by this spectral gap, we may obtain a few-state MSM here as well. To this end we need to find “metastable sets” (although in the case of this cyclically driven system the term metastability is ambiguous) on which we can project the system’s behavior. Let denote the i-th eigenvector of . As in the reversible case, where eigenvectors are close to constant on metastable sets, we will seek also here for regions that are characterized by almost constant behavior of the eigenvectors. More precisely, if the p-th and q-th partition elements belong to the same metastable set, then we expect for . Thus, we embed the p-th partition element into (i.e., a complex number is represented by two coordinates: its real and imaginary parts) by , and cluster the hence arising point cloud into 7 clusters by the k-means clustering algorithm. The result is shown in Figure 7 (right). Taking these sets we can assemble the MSM via (15). We obtain a MSM that maps a Markov state (i.e., a cluster) with probability to itself, with probability to the clockwise next cluster, and with probability to the second next cluster in clockwise direction. The probability to jump one cluster in the counterclockwise direction is below . The eigenvalues of ,
are also close to those of (below error), justifying this MSM.
Remark 5.
The k-means algorithm provides a hard clustering; i.e., every point belongs entirely to exactly one of the clusters. An automated way to find fuzzy metastable sets from a set of eigenvectors is given by the PCCA+ algorithm [12]. A fuzzy clustering assigns to each point a set of non-negative numbers adding up to 1, indicating the affiliations of that point to each cluster.
Acknowledgments
This work is supported by the Deutsche Forschungsgemeinschaft (DFG) through the CRC 1114 “Scaling Cascades in Complex Systems”, projects A04 and B03, and the Einstein Foundation Berlin (Einstein Center ECMath).
Author Contributions
P.K., H.W. and F.N. conceived and designed the numerical experiments; P.K. performed the simulations; P.K. analyzed the data; P.K., H.W., F.N. and C.S. wrote the paper.
Conflicts of Interest
The authors declare no conflict of interest. The founding sponsors had no role in the design of the study; in the collection, analyses, or interpretation of data; in the writing of the manuscript, and in the decision to publish the results.
Abbreviations
The following abbreviations are used in this manuscript:
| EDMD | extended dynamic mode decomposition |
| (G)MSM | (generalized) Markov state model |
| SDE | stochastic differential equation |
| TCCA | time-lagged canonical correlation algorithm |
| VAMP | variational approach for Markov processes |
Appendix A. Optimal Low-Rank Approximation of Compact Operators
For completeness, we include a proof of the Eckart–Young–Mirsky theorem for compact operators between separable Hilbert spaces. A space is separable if it has a countable basis. The Lebesgue space of -weighted square-integrable functions is separable for bounded and integrable . This is the case we consider here. In particular, the theorem shows that the optimal low-rank approximation of such an operator is obtained by an orthogonal projection on its subspace of dominant singular vectors; cf. (A1).
Theorem A1.
Let be a compact linear operator between the separable Hilbert spaces and , with inner products and , respectively. Then, the optimal rank-k approximation of in the sense that
where denotes the induced operator norm, is given by
where are the singular values (in non-increasing order), left and right normalized singular vectors of , respectively. The optimum is unique iff .
Proof.
Let be defined as in (A1). Since , we have
Let now be any rank-k operator from to . Then, there exist linear functionals and vectors , , such that
For every i, since has one-dimensional range, its kernel has co-dimension 1, thus the intersection of the kernels of all the has co-dimension at most k. Thus, any -dimensional space has a non-zero element w with for .
By this, we can find scalars such that and satisfies for . By construction holds. It follows that
This with (A2) proves the claim. □
As a corollary, if is a self-adjoint operator, then its eigenvalue and singular value decompositions coincide, giving , and thus in (A1) is the projection on the dominant eigenmodes.
References
- Schütte, C.; Sarich, M. Metastability and Markov State Models in Molecular Dynamics: Modeling, Analysis, Algorithmic Approaches; American Mathematical Society: Providence, RI, USA, 2013; Volume 24. [Google Scholar]
- Prinz, J.; Wu, H.; Sarich, M.; Keller, B.; Senne, M.; Held, M.; Chodera, J.; Schütte, C.; Noé, F. Markov models of molecular kinetics: Generation and validation. J. Chem. Phys. 2011, 134, 174105. [Google Scholar] [CrossRef] [PubMed]
- Bowman, G.R.; Pande, V.S.; Noé, F. (Eds.) An Introduction to Markov State Models and Their Application to Long Timescale Molecular Simulation. In Advances in Experimental Medicine and Biology; Springer: New York, NY, USA, 2014; Volume 797. [Google Scholar]
- Scherer, M.K.; Trendelkamp-Schroer, B.; Paul, F.; Pérez-Hernández, G.; Hoffmann, M.; Plattner, N.; Wehmeyer, C.; Prinz, J.H.; Noé, F. PyEMMA 2: A software package for estimation, validation, and analysis of Markov models. J. Chem. Theory Comput. 2015, 11, 5525–5542. [Google Scholar] [CrossRef] [PubMed]
- Harrigan, M.P.; Sultan, M.M.; Hernández, C.X.; Husic, B.E.; Eastman, P.; Schwantes, C.R.; Beauchamp, K.A.; McGibbon, R.T.; Pande, V.S. MSMBuilder: Statistical Models for Biomolecular Dynamics. Biophys. J. 2017, 112, 10–15. [Google Scholar] [CrossRef] [PubMed]
- Schütte, C.; Noé, F.; Lu, J.; Sarich, M.; Vanden-Eijnden, E. Markov State Models based on Milestoning. J. Chem. Phys. 2011, 134, 204105. [Google Scholar] [CrossRef] [PubMed]
- Sarich, M.; Noé, F.; Schütte, C. On the approximation quality of Markov state models. Multiscale Model. Simul. 2010, 8, 1154–1177. [Google Scholar] [CrossRef]
- Djurdjevac, N.; Sarich, M.; Schütte, C. Estimating the eigenvalue error of Markov State Models. Multiscale Model. Simul. 2012, 10, 61–81. [Google Scholar] [CrossRef]
- Noé, F.; Nüske, F. A variational approach to modeling slow processes in stochastic dynamical systems. Multiscale Model. Simul. 2013, 11, 635–655. [Google Scholar] [CrossRef]
- Nüske, F.; Keller, B.G.; Pérez-Hernández, G.; Mey, A.S.; Noé, F. Variational approach to molecular kinetics. J. Chem. Theory Comput. 2014, 10, 1739–1752. [Google Scholar] [CrossRef] [PubMed]
- Schütte, C.; Fischer, A.; Huisinga, W.; Deuflhard, P. A direct approach to conformational dynamics based on hybrid Monte Carlo. J. Comput. Phys. 1999, 151, 146–168. [Google Scholar] [CrossRef]
- Deuflhard, P.; Weber, M. Robust Perron cluster analysis in conformation dynamics. Linear Algebra Its Appl. 2005, 398, 161–184. [Google Scholar] [CrossRef]
- Wu, H.; Paul, F.; Wehmeyer, C.; Noé, F. Multiensemble Markov models of molecular thermodynamics and kinetics. Proc. Natl. Acad. Sci. USA 2016, 113, E3221–E3230. [Google Scholar] [CrossRef] [PubMed]
- Chodera, J.D.; Swope, W.C.; Noé, F.; Prinz, J.; Shirts, M.R.; Pande, V.S. Dynamical reweighting: Improved estimates of dynamical properties from simulations at multiple temperatures. J. Chem. Phys. 2011, 134, 06B612. [Google Scholar] [CrossRef] [PubMed]
- Froyland, G.; Santitissadeekorn, N.; Monahan, A. Transport in time-dependent dynamical systems: Finite-time coherent sets. Chaos Interdiscip. J. Nonlinear Sci. 2010, 20, 043116. [Google Scholar] [CrossRef] [PubMed]
- Froyland, G. An analytic framework for identifying finite-time coherent sets in time-dependent dynamical systems. Phys. D Nonlinear Phenom. 2013, 250, 1–19. [Google Scholar] [CrossRef]
- Koltai, P.; Ciccotti, G.; Schütte, C. On metastability and Markov state models for non-stationary molecular dynamics. J. Chem. Phys. 2016, 145, 174103. [Google Scholar] [CrossRef] [PubMed]
- Wu, H.; Nüske, F.; Paul, F.; Klus, S.; Koltai, P.; Noé, F. Variational Koopman models: Slow collective variables and molecular kinetics from short off-equilibrium simulations. J. Chem. Phys. 2017, 146, 154104. [Google Scholar] [CrossRef] [PubMed]
- Schütte, C.; Wang, H. Building Markov State Models for Periodically Driven Non-Equilibrium Systems. J. Chem. Theory Comput. 2015, 11, 1819–1831. [Google Scholar]
- Froyland, G.; Koltai, P. Estimating long-term behavior of periodically driven flows without trajectory integration. Nonlinearity 2017, 30, 1948–1986. [Google Scholar] [CrossRef]
- Seifert, U.; Speck, T. Fluctuation-dissipation theorem in nonequilibrium steady states. EPL Europhys. Lett. 2010, 89, 10007. [Google Scholar] [CrossRef]
- Lee, H.K.; Lahiri, S.; Park, H. Nonequilibrium steady states in Langevin thermal systems. Phys. Rev. E 2017, 96, 022134. [Google Scholar] [CrossRef] [PubMed]
- Yao, Y.; Cui, R.; Bowman, G.; Silva, D.; Sun, J.; Huang, X. Hierarchical Nystroem methods for constructing Markov state models for conformational dynamics. J. Chem. Phys. 2013, 138, 174106. [Google Scholar] [CrossRef] [PubMed]
- Bowman, G.; Meng, L.; Huang, X. Quantitative comparison of alternative methods for coarse-graining biological networks. J. Chem. Phys. 2013, 139, 121905. [Google Scholar] [CrossRef] [PubMed]
- Knoch, F.; Speck, T. Cycle representatives for the coarse-graining of systems driven into a non-equilibrium steady state. New J. Phys. 2015, 17, 115004. [Google Scholar] [CrossRef]
- Mori, H. Transport, collective motion, and Brownian motion. Prog. Theor. Phys. 1965, 33, 423–455. [Google Scholar] [CrossRef]
- Zwanzig, R. Nonlinear generalized Langevin equations. J. Stat. Phys. 1973, 9, 215–220. [Google Scholar] [CrossRef]
- Chorin, A.J.; Hald, O.H.; Kupferman, R. Optimal prediction and the Mori–Zwanzig representation of irreversible processes. Proc. Natl. Acad. Sci. USA 2000, 97, 2968–2973. [Google Scholar] [CrossRef] [PubMed]
- Chorin, A.J.; Hald, O.H.; Kupferman, R. Optimal prediction with memory. Phys. D Nonlinear Phenom. 2002, 166, 239–257. [Google Scholar] [CrossRef]
- Wu, H.; Noé, F. Variational approach for learning Markov processes from time series data. arXiv, 2017; arXiv:1707.04659. [Google Scholar]
- Baxter, J.R.; Rosenthal, J.S. Rates of convergence for everywhere-positive Markov chains. Stat. Probab. Lett. 1995, 22, 333–338. [Google Scholar] [CrossRef]
- Schervish, M.J.; Carlin, B.P. On the convergence of successive substitution sampling. J. Comput. Graph. Stat. 1992, 1, 111–127. [Google Scholar]
- Klus, S.; Nüske, F.; Koltai, P.; Wu, H.; Kevrekidis, I.; Schütte, C.; Noé, F. Data-Driven Model Reduction and Transfer Operator Approximation. J. Nonlinear Sci. 2018, 1–26. [Google Scholar] [CrossRef]
- Mattingly, J.C.; Stuart, A.M. Geometric ergodicity of some hypo-elliptic diffusions for particle motions. Markov Process. Relat. Fields 2002, 8, 199–214. [Google Scholar]
- Mattingly, J.C.; Stuart, A.M.; Higham, D.J. Ergodicity for SDEs and approximations: Locally Lipschitz vector fields and degenerate noise. Stoch. Process. Their Appl. 2002, 101, 185–232. [Google Scholar] [CrossRef]
- Bittracher, A.; Koltai, P.; Klus, S.; Banisch, R.; Dellnitz, M.; Schütte, C. Transition Manifolds of Complex Metastable Systems. J. Nonlinear Sci. 2017, 1–42. [Google Scholar] [CrossRef]
- Denner, A. Coherent Structures and Transfer Operators. Ph.D. Thesis, Technische Universität München, München, Germany, 2017. [Google Scholar]
- Hsing, T.; Eubank, R. Theoretical Foundations of Functional Data Analysis, with an Introduction to Linear Operators; John Wiley & Sons: Hoboken, NJ, USA, 2015. [Google Scholar]
- Froyland, G.; Horenkamp, C.; Rossi, V.; Santitissadeekorn, N.; Gupta, A.S. Three-dimensional characterization and tracking of an Agulhas Ring. Ocean Model. 2012, 52–53, 69–75. [Google Scholar] [CrossRef]
- Froyland, G.; Horenkamp, C.; Rossi, V.; van Sebille, E. Studying an Agulhas ring’s long-term pathway and decay with finite-time coherent sets. Chaos 2015, 25, 083119. [Google Scholar] [CrossRef] [PubMed]
- Williams, M.O.; Kevrekidis, I.G.; Rowley, C.W. A data–driven approximation of the Koopman operator: Extending dynamic mode decomposition. J. Nonlinear Sci. 2015, 25, 1307–1346. [Google Scholar] [CrossRef]
- Klus, S.; Koltai, P.; Schütte, C. On the numerical approximation of the Perron–Frobenius and Koopman operator. J. Comput. Dyn. 2016, 3, 51–79. [Google Scholar]
- Korda, M.; Mezić, I. On convergence of extended dynamic mode decomposition to the Koopman operator. J. Nonlinear Sci. 2017, 1–24. [Google Scholar] [CrossRef]
- Pérez-Hernández, G.; Paul, F.; Giorgino, T.; Fabritiis, G.D.; Noé, F. Identification of slow molecular order parameters for Markov model construction. J. Chem. Phys. 2013, 139, 015102. [Google Scholar] [CrossRef] [PubMed]
- Schwantes, C.R.; Pande, V.S. Improvements in Markov state model construction reveal many non-native interactions in the folding of NTL9. J. Chem. Theory Comput. 2013, 9, 2000–2009. [Google Scholar] [CrossRef] [PubMed]
- Molgedey, L.; Schuster, H.G. Separation of a mixture of independent signals using time delayed correlations. Phys. Rev. Lett. 1994, 72, 3634–3637. [Google Scholar] [CrossRef] [PubMed]
- Hammersley, J.M.; Morton, K.W. Poor man’s Monte Carlo. J. R. Stat. Soc. Ser. B Methodol. 1954, 16, 23–38. [Google Scholar]
- Rosenbluth, M.N.; Rosenbluth, A.W. Monte Carlo calculation of the average extension of molecular chains. J. Chem. Phys. 1955, 23, 356–359. [Google Scholar] [CrossRef]
- Jarzynski, C. Nonequilibrium equality for free energy differences. Phys. Rev. Lett. 1997, 78, 2690. [Google Scholar] [CrossRef]
- Crooks, G.E. Entropy production fluctuation theorem and the nonequilibrium work relation for free energy differences. Phys. Rev. E 1999, 60, 2721. [Google Scholar] [CrossRef]
- Bucklew, J. Introduction to Rare Event Simulation; Springer Science & Business Media: New York, NY, USA, 2013. [Google Scholar]
- Hartmann, C.; Schütte, C. Efficient rare event simulation by optimal nonequilibrium forcing. J. Stat. Mech. Theory Exp. 2012, 2012, P11004. [Google Scholar] [CrossRef]
- Hartmann, C.; Richter, L.; Schütte, C.; Zhang, W. Variational Characterization of Free Energy: Theory and Algorithms. Entropy 2017, 19, 626. [Google Scholar] [CrossRef]
- Dellnitz, M.; Junge, O. On the approximation of complicated dynamical behavior. SIAM J. Numer. Anal. 1999, 36, 491–515. [Google Scholar] [CrossRef]
- Djurdjevac Conrad, N.; Weber, M.; Schütte, C. Finding dominant structures of nonreversible Markov processes. Multiscale Model. Simul. 2016, 14, 1319–1340. [Google Scholar] [CrossRef]
- Conrad, N.D.; Banisch, R.; Schütte, C. Modularity of directed networks: Cycle decomposition approach. J. Comput. Dyn. 2015, 2, 1–24. [Google Scholar]
Figure 1.
Left: double-well potential. Right: invariant distribution (gray dashed) and second eigenfunction (solid black) of the associated transfer operator .
Figure 1.
Left: double-well potential. Right: invariant distribution (gray dashed) and second eigenfunction (solid black) of the associated transfer operator .
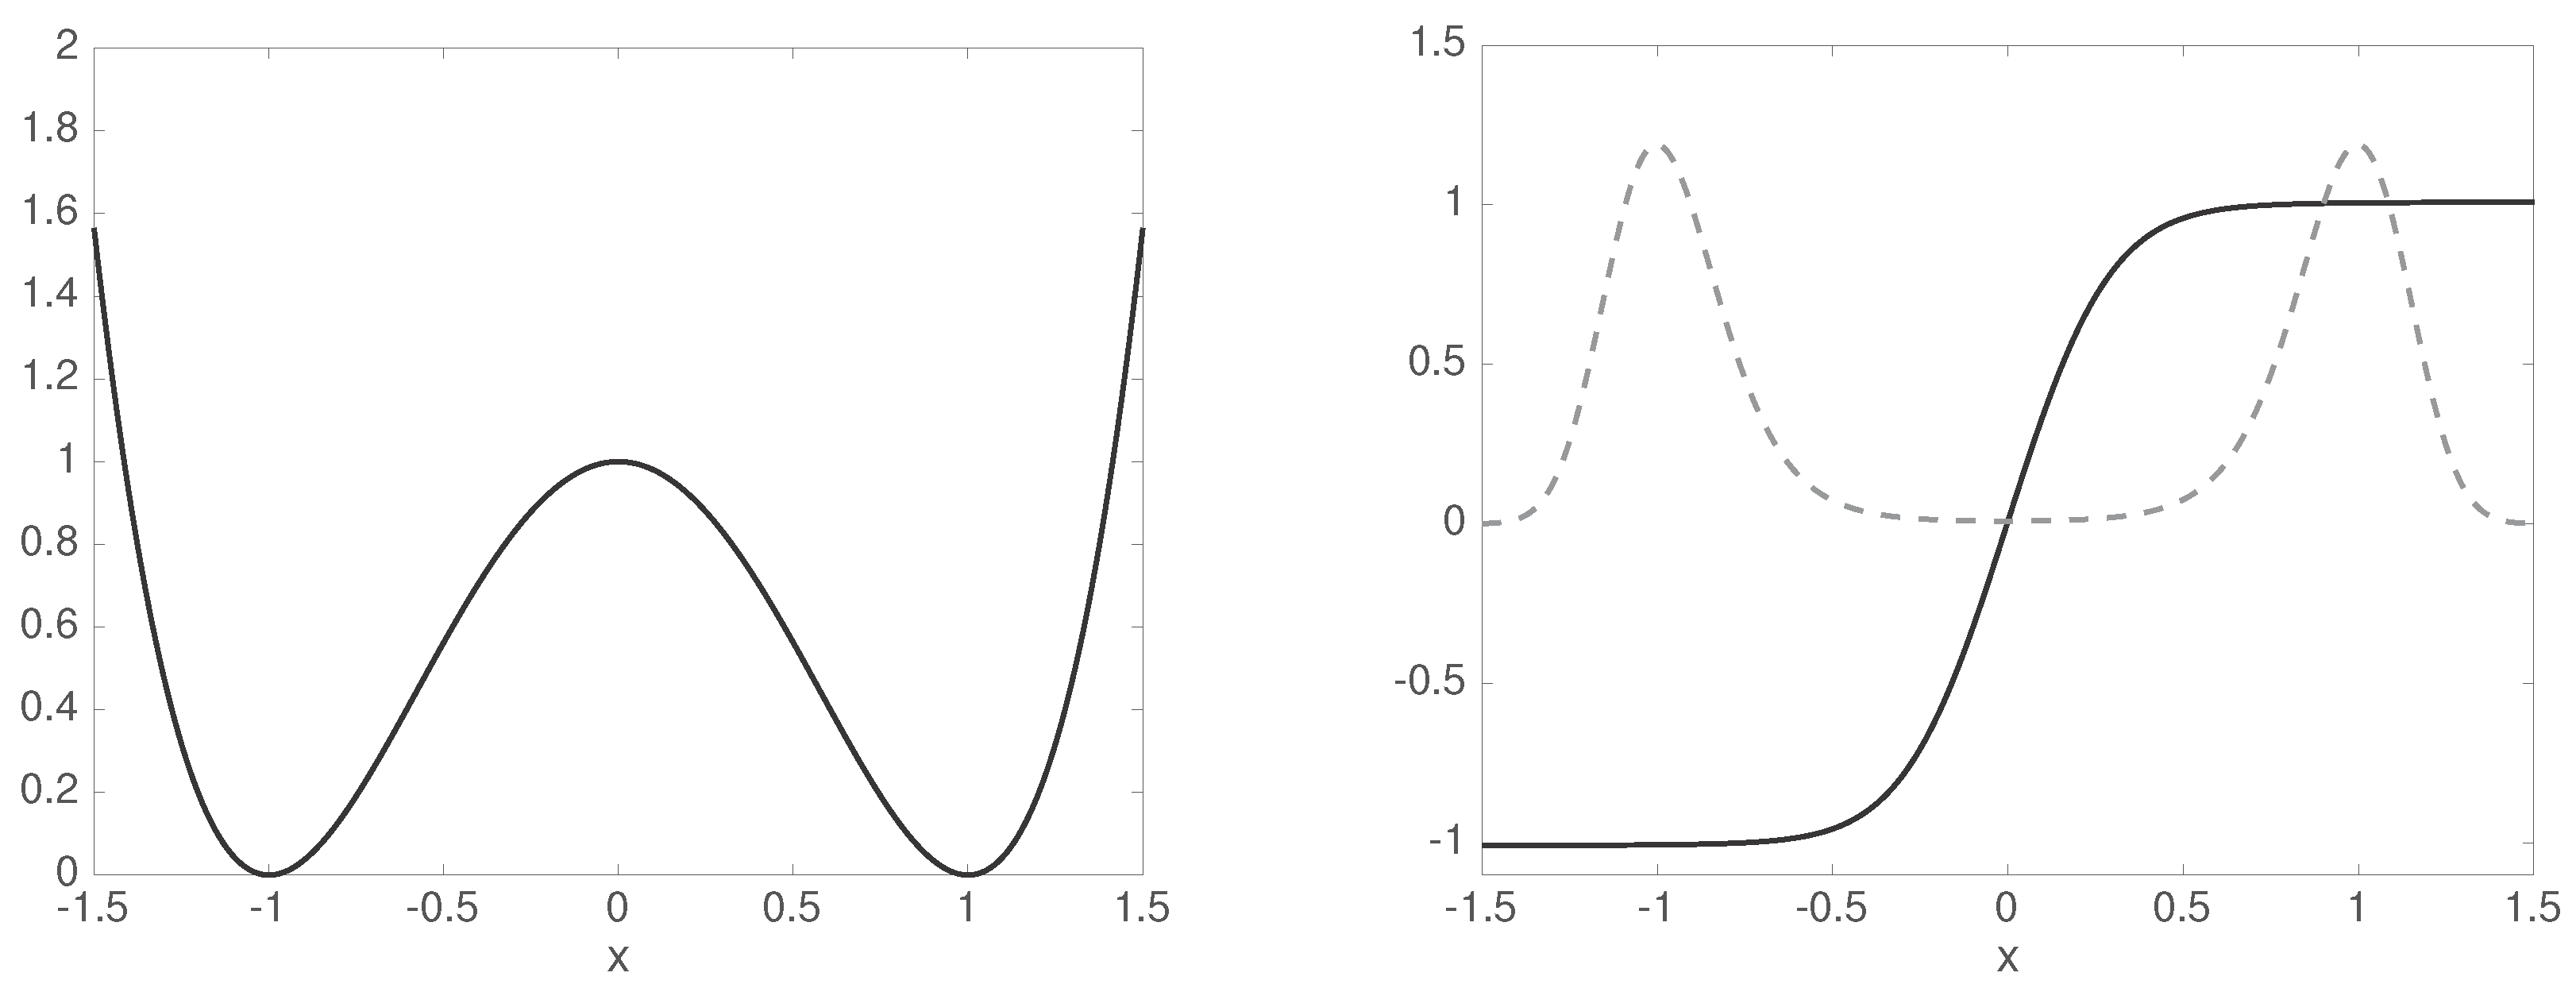
Figure 2.
Cartoon representation of (23) with a coherent pair , which are represented by the thick horizontal lines left and right, respectively. Condition (23) can be translated into , or equivalently . In other words, the part of the ensemble supported on the set (dark gray region on the left) is mapped by the propagator to an ensemble (dark gray region on the right) that is almost equal to the part of the ensemble supported on . Note that little of is supported outside of , and little of came from outside .

Figure 3.
Left: shifting triple-well potential. All three wells are coherent sets, as the plateaus of the singular vectors indicate. Middle: second right (initial) and left (final) singular vectors of the transfer operator (solid black and gray dashed lines, respectively). Right: third right (initial) and left (final) singular vectors of the transfer operator (solid black and gray dashed lines, respectively). The singular vectors are for reasons of numerical stability only computed in regions where and are, respectively, larger than machine precision.

Figure 4.
Top: initial ensemble (black solid) and its respective parts in the three coherent sets (gray shading). Bottom: final ensemble (black solid) and the image of the corresponding gray ensembles from the top row (gray shading).
Figure 4.
Top: initial ensemble (black solid) and its respective parts in the three coherent sets (gray shading). Bottom: final ensemble (black solid) and the image of the corresponding gray ensembles from the top row (gray shading).

Figure 5.
The same as Figure 4, for a different initial distribution .
Figure 5.
The same as Figure 4, for a different initial distribution .

Figure 6.
The empirical initial distribution of the simulation data, i.e., the reference distribution (gray histogram), and the corrected equilibrium distribution computed from this data (solid black line). Left: sample size , right: sample size .
Figure 6.
The empirical initial distribution of the simulation data, i.e., the reference distribution (gray histogram), and the corrected equilibrium distribution computed from this data (solid black line). Left: sample size , right: sample size .

Figure 7.
Left: empirical distribution of the (histogram with bins). Middle: corrected invariant distribution. Right: clustering of the populated partition elements based on the 7 dominant eigenfunctions of the low-rank GMSM.
Figure 7.
Left: empirical distribution of the (histogram with bins). Middle: corrected invariant distribution. Right: clustering of the populated partition elements based on the 7 dominant eigenfunctions of the low-rank GMSM.

Table 1.
Nomenclature used here for stochastic processes.
| A Stochastic (Markov) Process Is Called | |
|---|---|
| time-homogeneous | if the transition probabilities from time s to time t depend only on (in analogy to the evolution of an autonomous ordinary differential equation). |
| stationary | if the distribution of the process does not change in time (such a distribution is also called invariant, cf. (2)). |
| reversible | if it is stationary and the detailed balance condition (5) holds (reversibility means that time series are statistically indistinguishable in forward and backward time). |
© 2018 by the authors. Licensee MDPI, Basel, Switzerland. This article is an open access article distributed under the terms and conditions of the Creative Commons Attribution (CC BY) license (http://creativecommons.org/licenses/by/4.0/).
Share and Cite
MDPI and ACS Style
Koltai, P.; Wu, H.; Noé, F.; Schütte, C. Optimal Data-Driven Estimation of Generalized Markov State Models for Non-Equilibrium Dynamics. Computation 2018, 6, 22. https://doi.org/10.3390/computation6010022
AMA Style
Koltai P, Wu H, Noé F, Schütte C. Optimal Data-Driven Estimation of Generalized Markov State Models for Non-Equilibrium Dynamics. Computation. 2018; 6(1):22. https://doi.org/10.3390/computation6010022
Chicago/Turabian StyleKoltai, Péter, Hao Wu, Frank Noé, and Christof Schütte. 2018. "Optimal Data-Driven Estimation of Generalized Markov State Models for Non-Equilibrium Dynamics" Computation 6, no. 1: 22. https://doi.org/10.3390/computation6010022
Note that from the first issue of 2016, this journal uses article numbers instead of page numbers. See further details here.