Individual Differences in Developmental Change: Quantifying the Amplitude and Heterogeneity in Cognitive Change across Old Age

 , ,
, ,
Abstract
:1. Introduction
2. Materials and Methods
2.1. Participants
2.2. Experimental Setting
2.2.1. Overview
2.2.2. Tasks
2.3 Analyses
2.3.1 Group Analyses
2.3.2. Individual Bootstrap Confidence Intervals
2.3.3. Individual Analyses of Variance
2.3.4. Relationships between Cognitive Change and Other Variables
3. Results
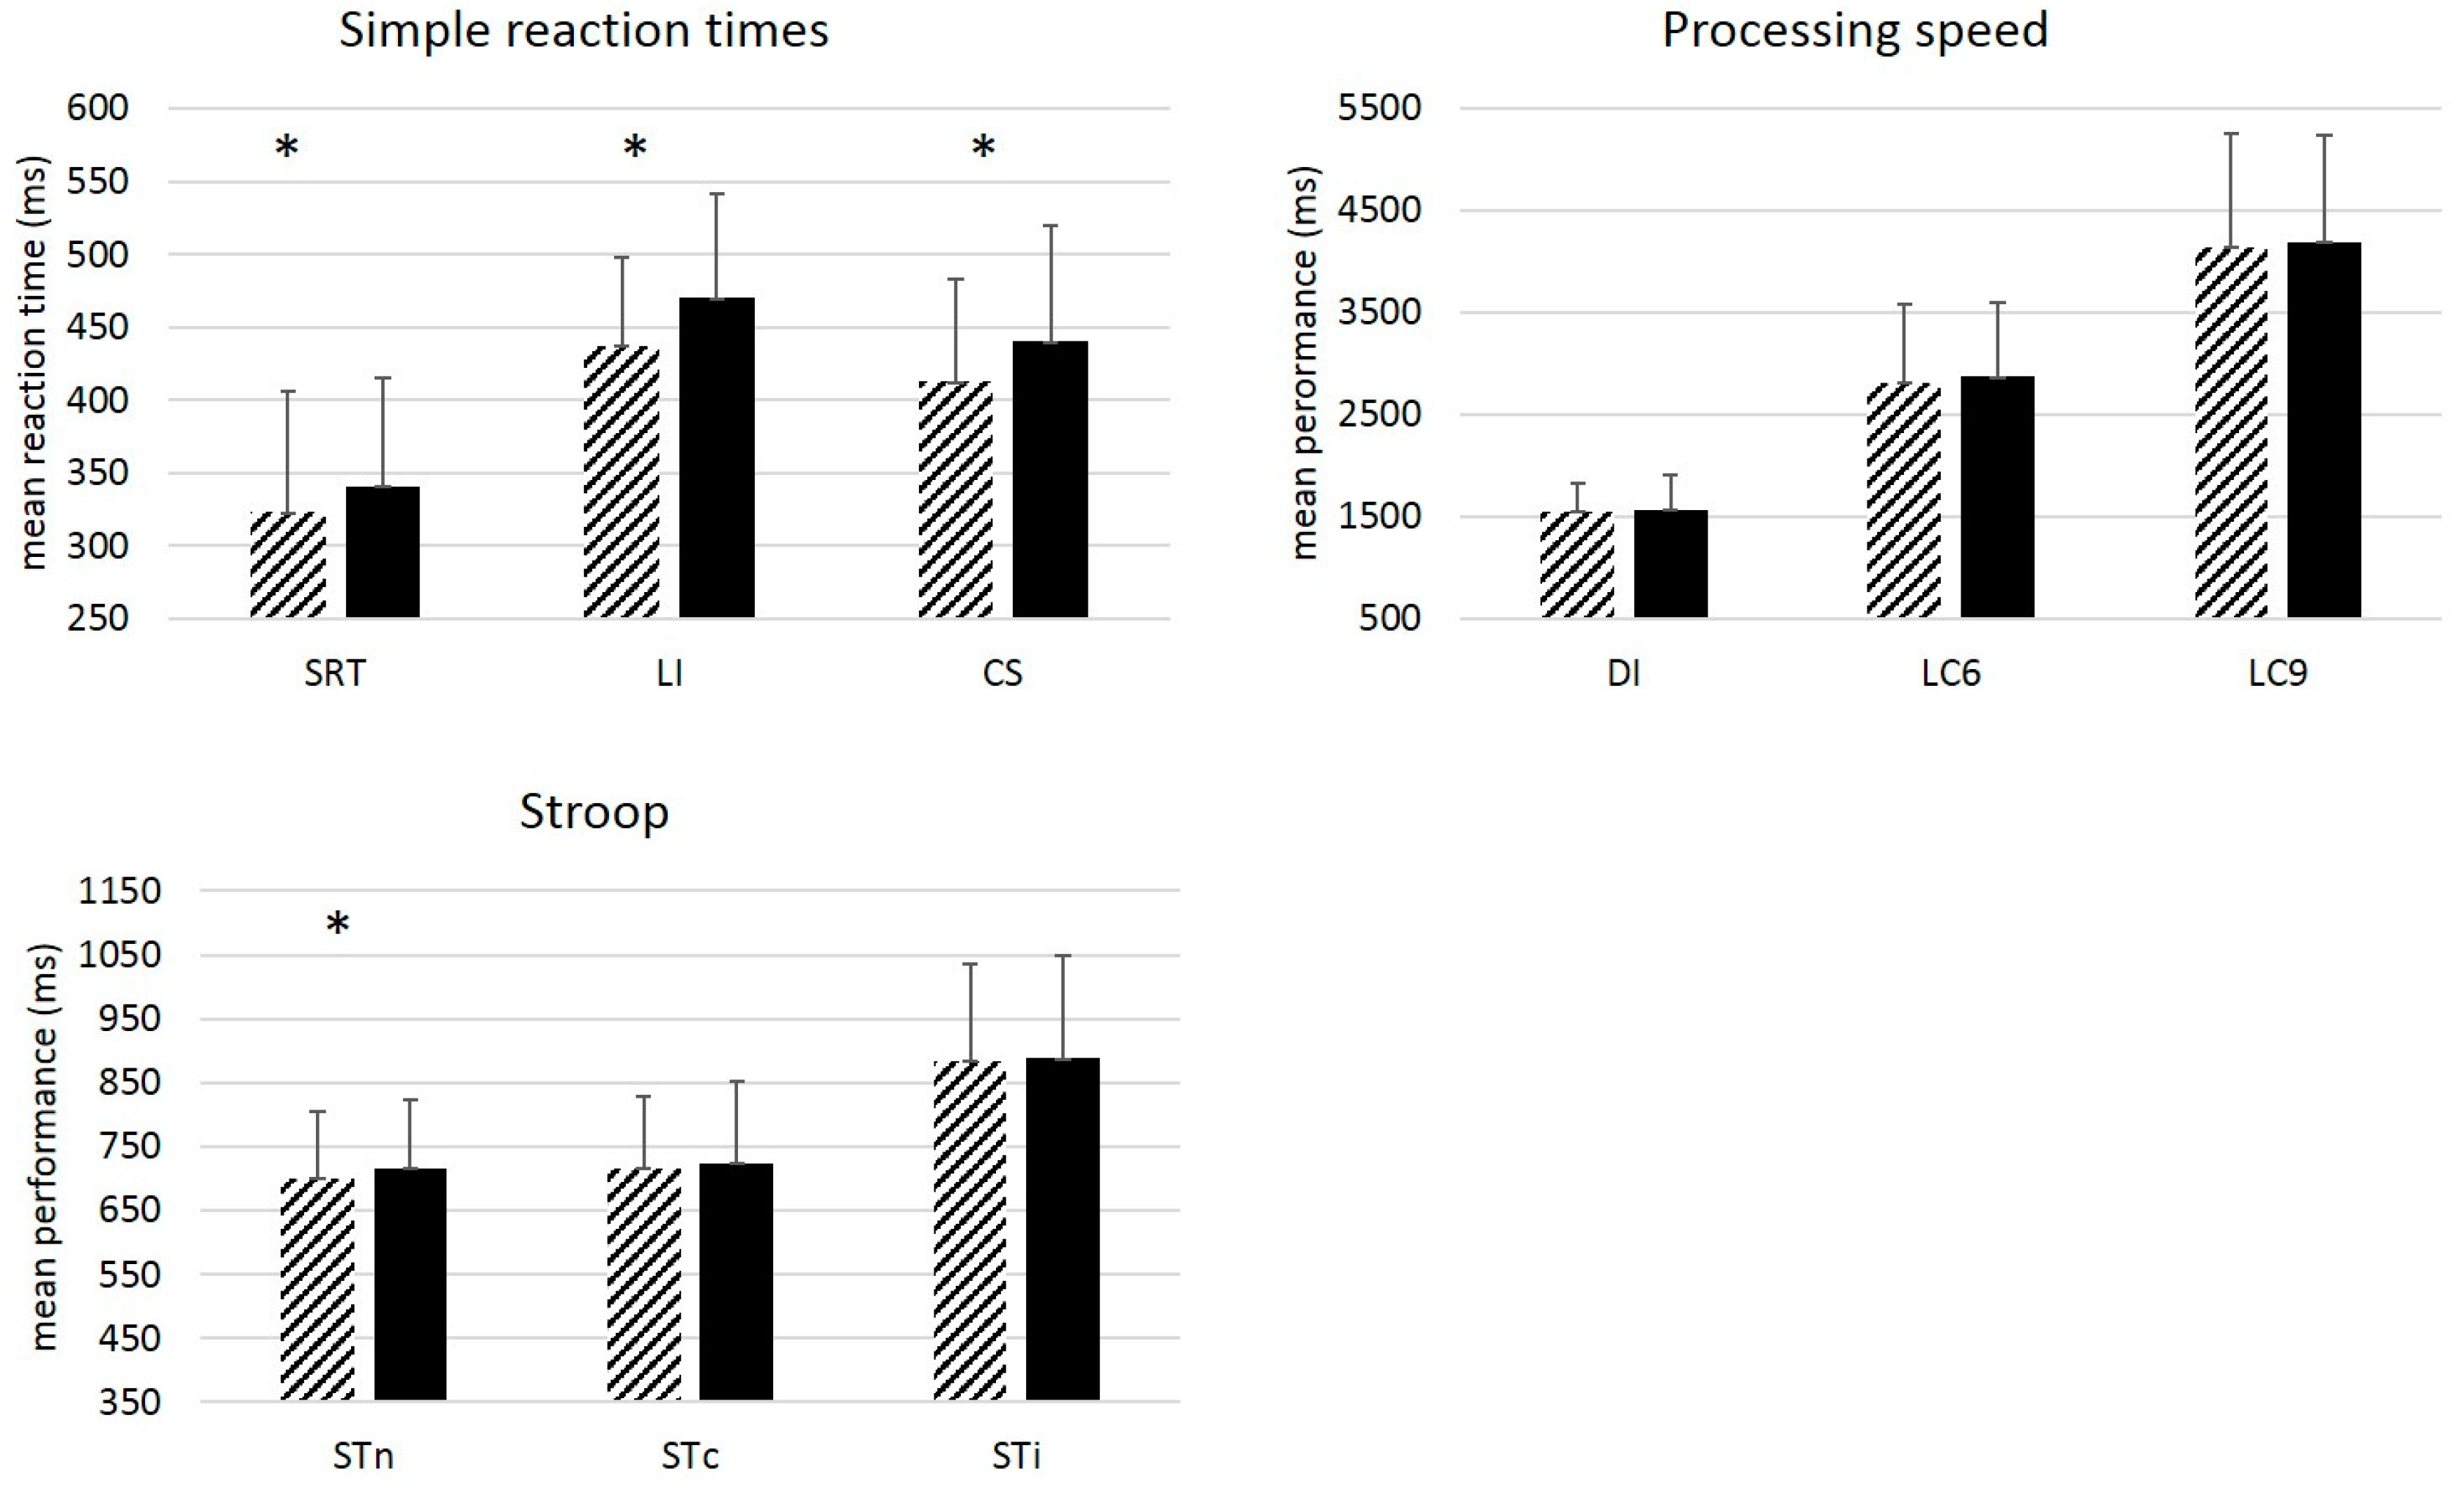
3.1. Group Analyses
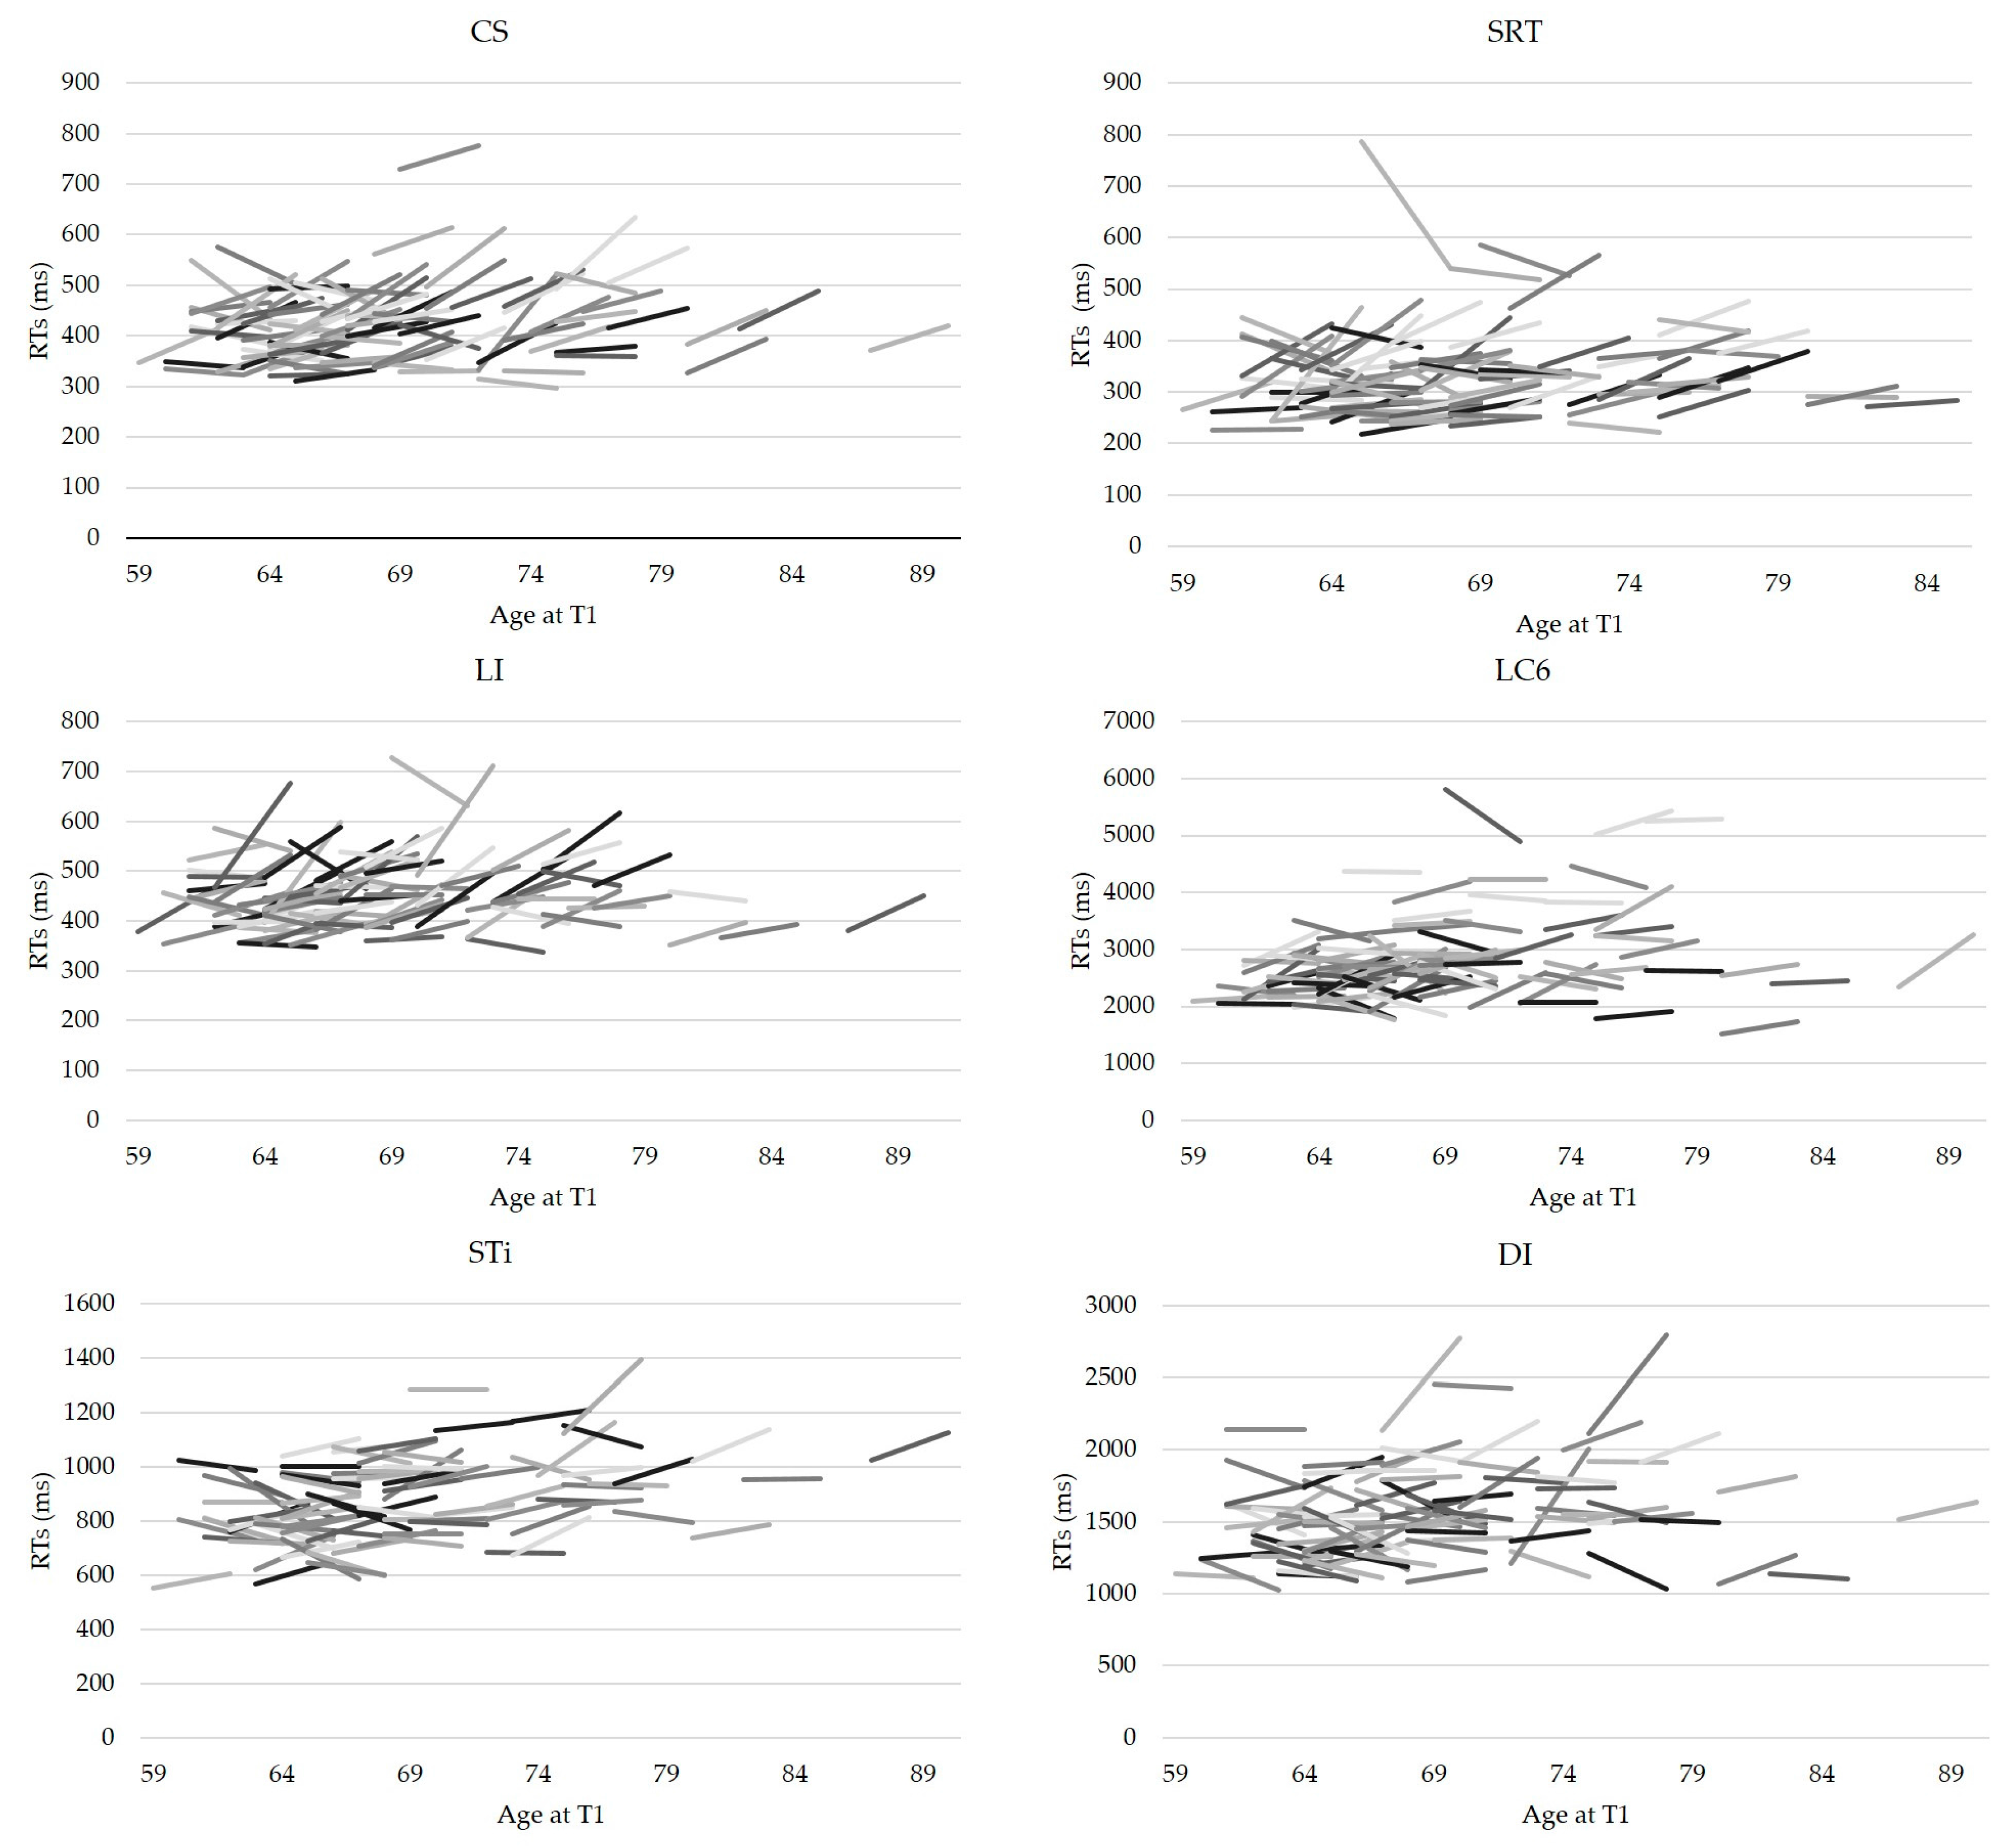
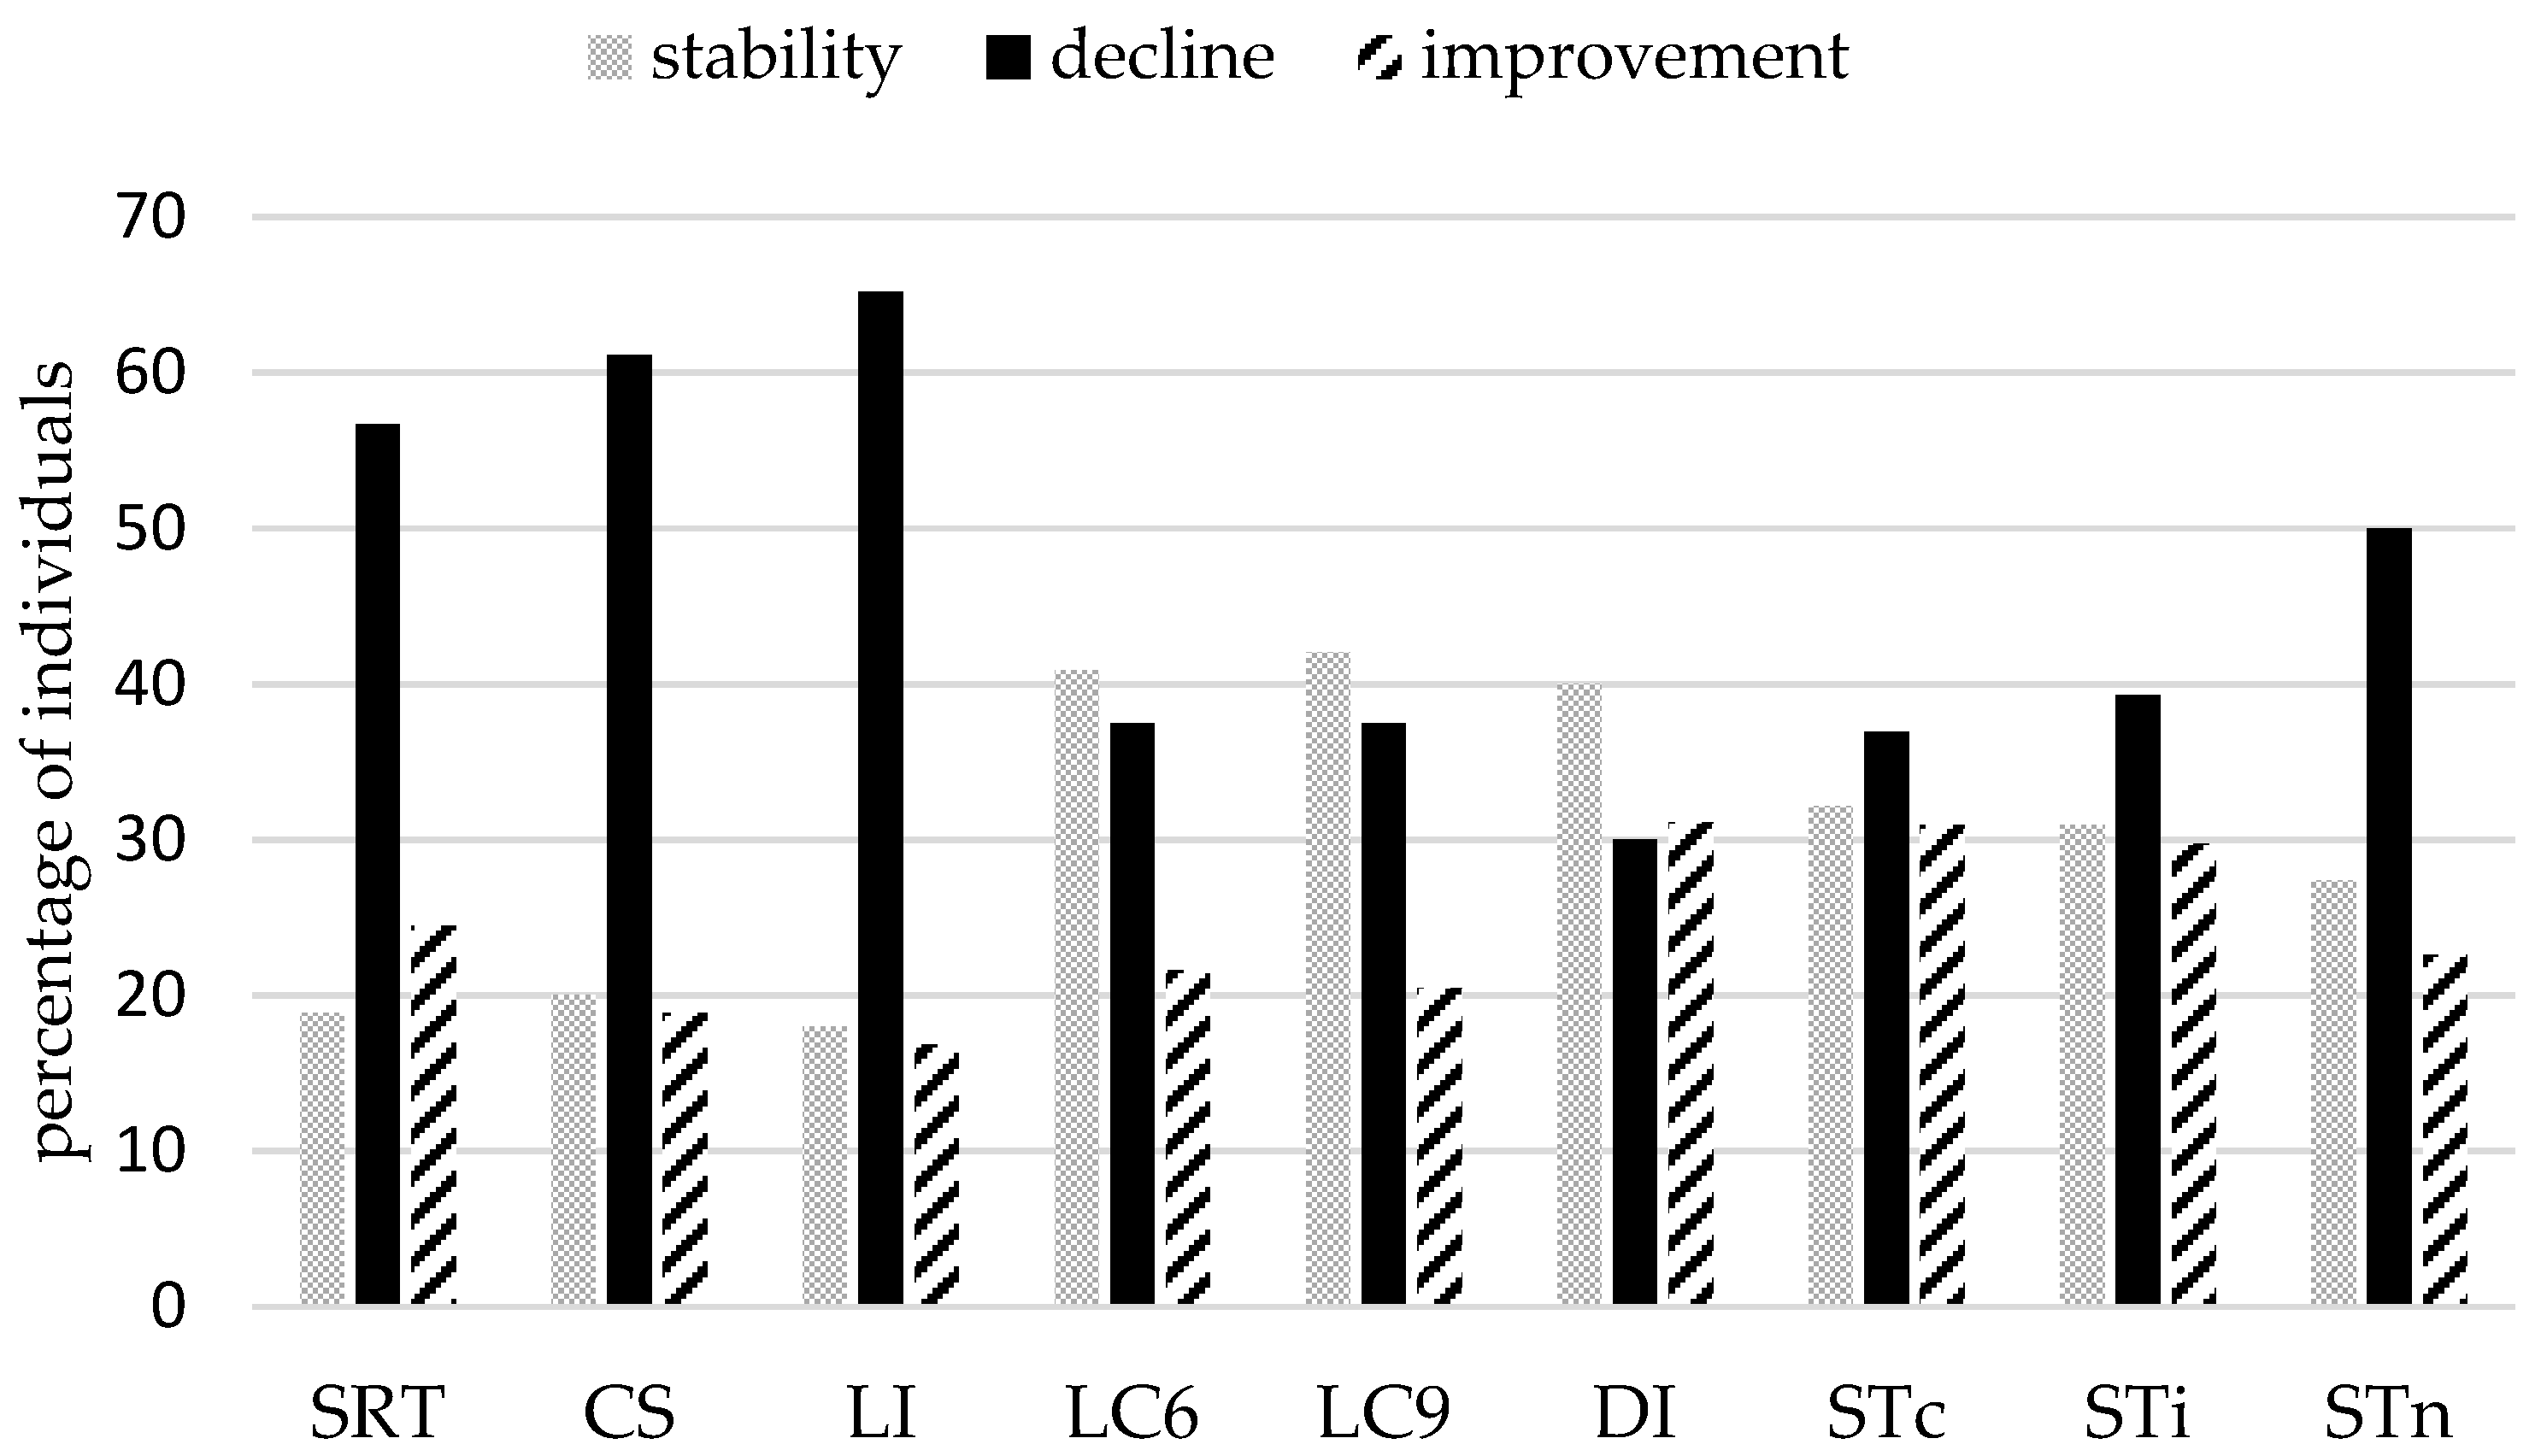
3.2. Individual Analyses
Bootstrap Confidence Intervals
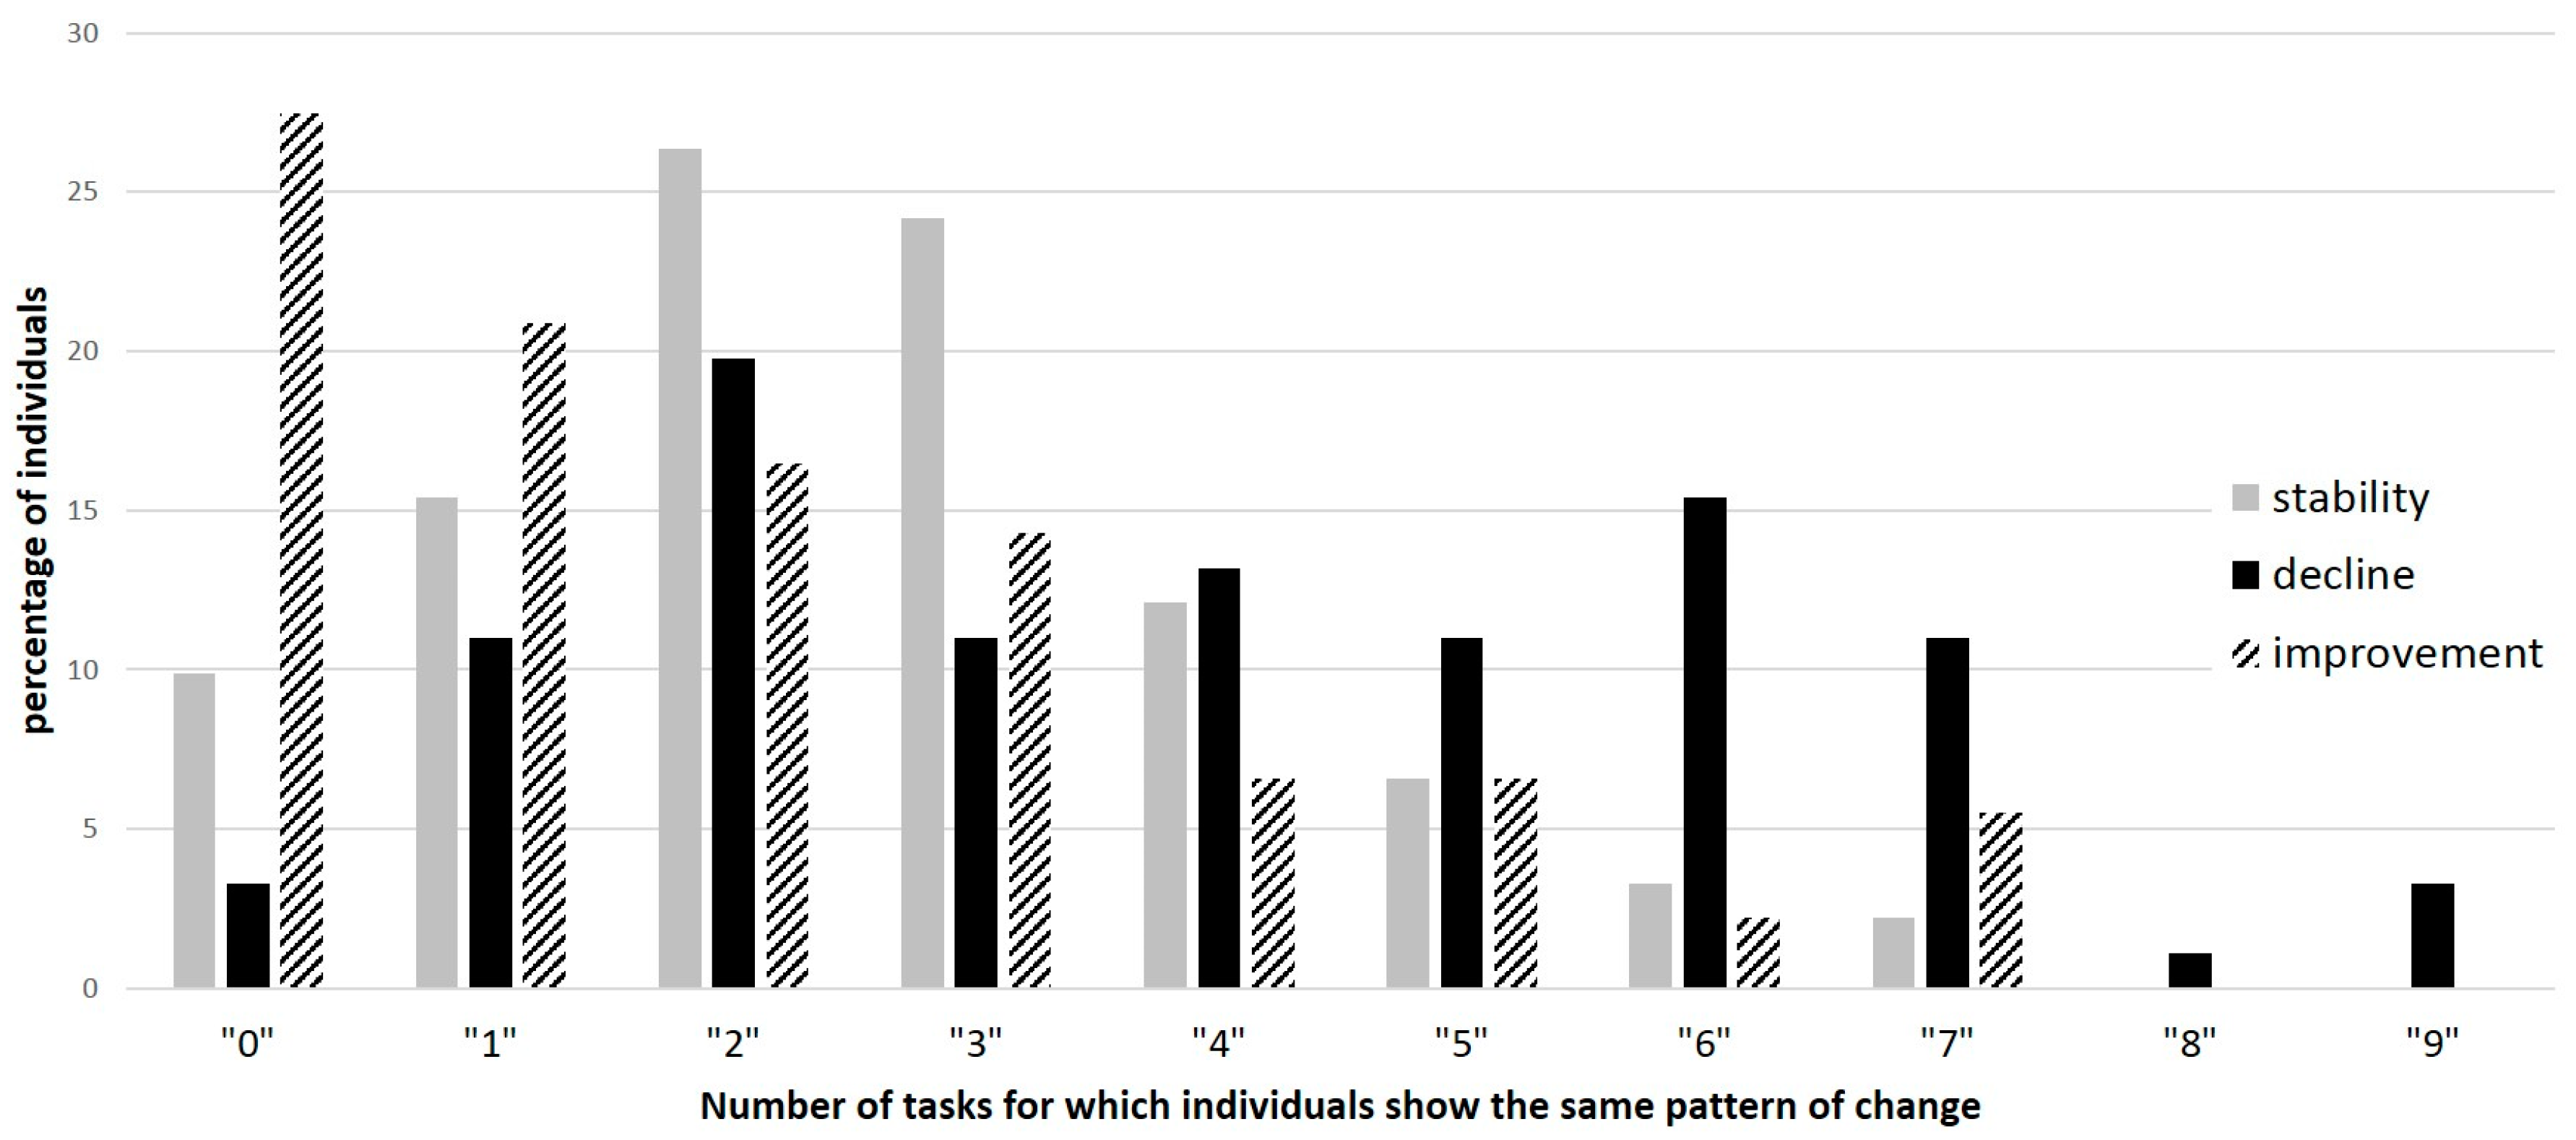
3.3. Individual Analyses of Variance
3.4. Relationships between Change and Other Variables
4. Discussion
5. Conclusions
Supplementary Materials
Acknowledgments
Author Contributions
Conflicts of Interest
References
- Salthouse, T.A.; Atkinson, T.M.; Berish, D.E. Executive functioning as a potential mediator of age-related cognitive decline in normal adults. J. Exp. Psychol. Gen. 2003, 132, 566–594. [Google Scholar] [CrossRef] [PubMed]
- Salthouse, T.A. When does age-related cognitive decline begin? Neurobiol. Aging 2009, 30, 507–514. [Google Scholar] [CrossRef] [PubMed]
- Park, H.L.; O’Connell, J.E.; Thomson, R.G. A systematic review of cognitive decline in the general elderly population. Int. J. Geriatr. Psychiatry 2003, 18, 1121–1134. [Google Scholar] [CrossRef] [PubMed]
- Salthouse, T.A. Theoretical Perspectives on Cognitive Aging; Erlbaum: Hillsdale, NJ, USA, 1991. [Google Scholar]
- Schaie, K.W. The Seattle longitudinal study: A 21-year exploration of psychometric intelligence in adulthood. In Longitudinal Studies of Adult Psychological Development; Schaie, K.W., Ed.; The Guilford Press: New York, NY, USA, 1983; pp. 64–135. [Google Scholar]
- Schaie, K.W. The Seattle longitudinal studies of adult intelligence. Curr. Dir. Psychol. Sci. 1993, 2, 171–175. [Google Scholar] [CrossRef]
- Hofer, S.M.; Rast, P.; Piccinin, A.M. Methodological issues in research on adult development and aging. In The Wiley-Blackwell Handbook of Adulthood and Aging; Whitbourne, S.K., Sliwinski, M., Eds.; Wiley-Blackwell: Malden, MA, USA, 2012; pp. 72–93. [Google Scholar]
- Rönnlund, M.; Nyberg, L.; Bäckman, L.; Nilsson, L.G. Stability, growth, and decline in adult life span development of declarative memory: Cross-sectional and longitudinal data from a population-based study. Psychol. Aging 2005, 20, 3–18. [Google Scholar] [CrossRef] [PubMed]
- Schaie, K.W. Intellectual Development in Adulthood: The Seattle Longitudinal Study; Cambridge University Press: Cambridge, UK, 1996. [Google Scholar]
- Schaie, K.W. What can we learn from the longitudinal study of adult psychological development. In Longitudinal Studies of Adult Psychological Development; Schaie, K.W., Ed.; The Guilford Press: New York, NY, USA, 1983; pp. 64–135. [Google Scholar]
- de Ribaupierre, A. On the use of longitudinal research in developmental psychology. In Transition Mechanisms in Child Development: The Longitudinal Perspective; de Ribaupierre, A., Ed.; Cambridge University Press: Cambridge, UK, 1989; pp. 297–317. [Google Scholar]
- McCall, R.B.; Appelbaum, M.I.; Hogarty, P.S. Developmental Changes in Mental Performance. Monogr. Soc. Res. Child Dev. 1973, 38, 1–84. [Google Scholar] [CrossRef] [PubMed]
- Johnson, J.K.; Gross, A.L.; Pa, J.; McLaren, D.G.; Park, L.Q.; Manly, J.J.; Alzheimer’s Disease Neuroimaging Initiative. Longitudinal change in neuropsychological performance using latent growth models: A study of mild cognitive impairment. Brain Imaging Behav. 2012, 6, 540–550. [Google Scholar] [CrossRef] [PubMed]
- Schaie, K.W. Intellectual development in adulthood. In Handbook of the Psychology of Aging; Birren, J.E., Schaie, K.W., Eds.; Academic Press: San Diego, CA, USA, 1990; pp. 291–309. [Google Scholar]
- Schaie, K.W. The optimization of cognitive functioning in old age: Predictions based on cohort-sequential and longitudinal data. In Successful Aging: Perspectives from the Behavioral Sciences; Baltes, P.B., Baltes, M.M., Eds.; Cambridge University Press: Cambridge, UK, 1990; pp. 94–117. [Google Scholar]
- Mungas, D.; Beckett, L.; Harvey, D.; Farias, S.T.; Reed, B.; Carmichael, O.; Olichney, J.; Miller, J.; DeCarli, C. Heterogeneity of cognitive trajectories in diverse older persons. Psychol. Aging 2010, 25, 606–619. [Google Scholar] [CrossRef] [PubMed]
- Christensen, H.; Mackinnon, A.J.; Korten, A.E.; Jorm, A.F.; Henderson, A.S.; Jacomb, P.; Rodgers, B. An analysis of diversity in the cognitive performance of elderly community dwellers: Individual differences in change scores as a function of age. Psychol. Aging 1999, 14, 365–379. [Google Scholar] [CrossRef] [PubMed]
- Schaie, K.W.; Willis, S.L.; Caskie, G.I.L. The Seattle longitudinal study: Relationship between personality and cognition. Aging Neuropsychol. Cognit. 2004, 11, 304–324. [Google Scholar] [CrossRef] [PubMed]
- Goh, J.O.; An, Y.; Resnick, S.M. Differential trajectories of age-related changes in components of executive and memory processes. Psychol. Aging 2012, 27, 707–719. [Google Scholar] [CrossRef] [PubMed]
- Nesselroade, J.R.; Salthouse, T.A. Methodological and Theoretical Implications of Intraindividual Variability in Perceptual-Motor Performance. J. Gerontol. Psychol. Sci. 2004, 59, 49–55. [Google Scholar] [CrossRef]
- Molenaar, P.C.M. A Manifesto on Psychology as Idiographic Science: Bringing the Person Back Into Scientific Psychology, This Time Forever. Meas. Interdiscip. Res. Perspect. 2004, 2, 201–218. [Google Scholar] [CrossRef]
- Molenaar, P.C.M. The future of analysis of intraindividual variation. In Handbookf of Intraindividual Variability across the Lifespan; Diehl, M., Hooker, K., Sliwinski, M.J., Eds.; Routledge: New York, NY, USA, 2015; pp. 343–356. [Google Scholar]
- Nesselroade, J.R.; Molenaar, P.C.M. Some Behaviorial Science Measurement Concerns and Proposals. Multivar. Behav. Res. 2016, 51, 396–412. [Google Scholar] [CrossRef] [PubMed]
- Wilson, R.S.; Beckett, L.A.; Barnes, L.L.; Schneider, J.A.; Bach, J.; Evans, D.A.; Bennett, D.A. Individual differences in rates of change in cognitive abilities of older persons. Psychol. Aging 2002, 17, 179–193. [Google Scholar] [CrossRef] [PubMed]
- Hayden, K.M.; Reed, B.R.; Manly, J.J.; Tommet, D.; Pietrzak, R.H.; Chelune, G.J.; Yang, F.M.; Revell, A.J.; Bennett, D.A.; Jones, R.N. Cognitive decline in the elderly: An analysis of population heterogeneity. Age Ageing 2011, 40, 684–689. [Google Scholar] [CrossRef] [PubMed]
- Jacobson, N.S.; Truax, P. Clinical significance: A statistical approach to defining meaningful change in psychotherapy research. J. Consult. Clin. Psychol. 1991, 59, 1–19. [Google Scholar] [CrossRef]
- Farrell, M.; Khan, A.; Rothman, B.; Karantzoulis, S. Using Reliable Change Index (RCI) and clinical change to predict Alzheimer desease. Alzheimer's Dement. J. Alzheimer's Assoc. 2014, 10, P918–P919. [Google Scholar] [CrossRef]
- Fagot, D.; Mella, N.; Borella, E.; Ghisletta, P.; Lecerf, T.; de Ribaupierre, A. Intraindividual variability from a lifespan perspective: A comparison of latency and accuracy measures. J. Intell. 2018, in press. [Google Scholar]
- Zahodne, L.B.; Glymour, M.M.; Sparks, C.; Bontempo, D.; Dixon, R.A.; MacDonald, S.W.; Manly, J.J. Education does not slow cognitive decline with aging: 12-year evidence from the Victoria Longitudinal Study. J. Int. Neuropsychol. Soc. 2011, 17, 1039–1046. [Google Scholar] [CrossRef] [PubMed]
- Van Beijsterveldt, C.; van Boxtel, M.P.; Bosma, H.; Houx, P.J.; Buntinx, F.; Jolles, J. Predictors of attrition in a longitudinal cognitive aging study:: The Maastricht Aging Study (MAAS). J. Clin. Epidemiol. 2002, 55, 216–223. [Google Scholar] [CrossRef]
- Schaie, K.W. Developmental Influences on Adult Intelligence. The Seattle Longitudinal Study, 2nd ed.; Oxford University Press: New York, NY, USA, 2013; p. 587. [Google Scholar]
- Raven, J.C.; Court, J.H.; Raven, J. Progressive Matrices Standard (PM38); Editions du Centre de Psychologie Appliquée: Paris, France, 1998. [Google Scholar]
- Deltour, J.J. Echelle de Vocabulaire de Mill Hill de J. C. Raven: Adaptation Française et Normes Comparées du Mill Hill et du Standard Progressive Matrices; Editions l’Application des Techniques Modernes: Braine-le-Château, Belgique, 1993. [Google Scholar]
- De Ribaupierre, A.; Ghisletta, P.; Lecerf, T. Etude de la Variabilité Inter-et Intra-Individuelle au Cours du Cycle de vie; Presses Universitaire: Rennes, France, 2006. [Google Scholar]
- Mella, N.; Fagot, D.; Lecerf, T.; de Ribaupierre, A. Working memory and intraindividual variability in processing speed: A lifespan developmental and individual-differences study. Mem. Cognit. 2015, 43, 340–356. [Google Scholar] [CrossRef] [PubMed]
- Mella, N.; Fagot, D.; de Ribaupierre, A. Dispersion in cognitive functioning: Age differences over the lifespan. J. Clin. Exp. Neuropsychol. 2016, 38, 111–126. [Google Scholar] [CrossRef] [PubMed]
- Salthouse, T.A. Influence of processing speed on adult age differences in working memory. Acta Psychol. 1992, 79, 155–170. [Google Scholar] [CrossRef]
- Davison, A.C.; Hinkley, D.V. Bootstrap Methods and Their Application; Cambridge University Press: Cambridge, UK, 1997; Volume 1. [Google Scholar]
- Team, R.C. R: A Language and Environment for Statistical Computing; R Foundation for Statistical Computing: Vienna, Austria, 2014. [Google Scholar]
- Borella, E.; Delaloye, C.; Lecerf, T.; Renaud, O.; Ribaupierre, A. Do age differences between young and older adults in inhibitory tasks depend on the degree of activation of information? Eur. J. Cognit. Psychol. 2009, 21, 445–472. [Google Scholar] [CrossRef]
- Hartshorne, J.K.; Germine, L.T. When does cognitive functioning peak? The asynchronous rise and fall of different cognitive abilities across the life span. Psychol. Sci. 2015, 26, 433–443. [Google Scholar] [CrossRef] [PubMed]
- Bielak, A.A.; Hultsch, D.F.; Strauss, E.; MacDonald, S.W.; Hunter, M.A. Intraindividual variability in reaction time predicts cognitive outcomes 5 years later. Neuropsychology 2010, 24, 731. [Google Scholar] [CrossRef] [PubMed]


| Time of Measurement | Age | Fluid Intelligence 1 | Vocabulary 2 |
|---|---|---|---|
| M (SD) | M (SD) | M (SD) | |
| Baseline | 67.54 (5.51) | 38.71 (8.02) | 38.49 (4.27) |
| Last experimental wave | 73.79 (5.59) | 39.68 (8.37) | 38.67 (4.16) |
| Amplitude of Change (Beta) | Heterogeneity in Change (Partial eta2) | |
|---|---|---|
| Age | −0.27 | −0.17 |
| Education 1 | 0.22 | −0.01 |
| Simple RT_mean | 0.15 | 0.10 |
| Processing speed_mean | 0.02 | −0.21 |
| Inhibition_mean | 0.14 | −0.13 |
| Simple RT_IIV | 0.09 | −0.18 |
| Processing speed_IIV | 0.11 | −0.38 * |
| Inhibition_IIV | 0.04 | −0.11 |
| Raven PM | 0.15 | 0.15 |
| Mill Hill | 0.20 | 0.14 |
| Heterogeneity in change | −0.01 |
© 2018 by the authors. Licensee MDPI, Basel, Switzerland. This article is an open access article distributed under the terms and conditions of the Creative Commons Attribution (CC BY) license (http://creativecommons.org/licenses/by/4.0/).
Share and Cite
Mella, N.; Fagot, D.; Renaud, O.; Kliegel, M.; De Ribaupierre, A. Individual Differences in Developmental Change: Quantifying the Amplitude and Heterogeneity in Cognitive Change across Old Age. J. Intell. 2018, 6, 10. https://doi.org/10.3390/jintelligence6010010
Mella N, Fagot D, Renaud O, Kliegel M, De Ribaupierre A. Individual Differences in Developmental Change: Quantifying the Amplitude and Heterogeneity in Cognitive Change across Old Age. Journal of Intelligence. 2018; 6(1):10. https://doi.org/10.3390/jintelligence6010010
Chicago/Turabian StyleMella, Nathalie, Delphine Fagot, Olivier Renaud, Matthias Kliegel, and Anik De Ribaupierre. 2018. "Individual Differences in Developmental Change: Quantifying the Amplitude and Heterogeneity in Cognitive Change across Old Age" Journal of Intelligence 6, no. 1: 10. https://doi.org/10.3390/jintelligence6010010