1. Introduction
Numerous industrial and commercial uses of single-walled carbon nanotubes (SWCNTs) have resulted in a heavy expansion of production of these materials [
1,
2]. Aquatic environments often act as sinks for both point and non-point source contaminants, therefore it is likely that SWCNTs are making their way to these systems through manufacturing waste streams and leaching. As a result, there is a growing need to characterize potential impacts of SWCNTs on aquatic environments.
Studies that have examined the toxicity of SWCNTs to fish have found that these materials, in general, do not cause overt toxicity. While there is some evidence that waterborne exposures to these materials may cause respiratory stress [
3], oral exposures through gavage and feeding have produced minimal responses [
4,
5]. But one of the biggest barriers to comprehensive toxicity assessment including uptake, distribution, and sublethal toxicity of SWCNTs, has been the difficulty in detection and quantification of these materials
in vivo. Attempts to quantify the distribution of these materials have employed such methods as transmission electron microscopy (TEM), Raman spectroscopy, fluorescent tagging, thermogravimetric analysis, size exclusion chromatography, and absorbance measurements. Each of these methods has its own set of limitations, some of which include complicated and time consuming sample preparation, low sensitivity, and heavy modification of materials [
6,
7,
8,
9,
10]. The more recent application of near-infrared fluorescence (NIRF) for imaging and quantification of SWCNTs has emerged as a rapid and sensitive technique to assess the distribution of these materials in cells and whole organisms [
5,
11,
12,
13]. This technique takes advantage of the fluorescence in the near-infrared range (900–1500 nm) of semi-conducting SWCNTs with specific chiral wrapping vectors (
n,
m) when excited with 600–800 nm wavelength lasers [
14,
15]. This application is of particular interest for
in vivo assessments as biological tissue does not typically exhibit endogenous background fluorescence in the near-infrared [
16]. As a result of these distinct advantages, NIRF imaging and quantification has been successfully demonstrated as a sensitive technique to examine distribution and effects of SWCNTs in fish through oral gavage exposures [
5]; however, further studies are needed to determine the effectiveness of this technique in more environmentally relevant exposure scenarios.
The hydrophobic nature of SWCNTs indicates that these materials are unlikely to remain suspended in aquatic systems but will more commonly sorb to sediments or biota [
12]. As a result, these materials are expected to enter aquatic food chains through dietary routes. Yet very few studies have examined dietary exposures of aquatic organisms to SWCNTs. In rainbow trout (
Oncorhynchus mykiss) exposure to SWCNTs via dietary routes did not exhibit any direct effects on survival, growth, ion regulation, biochemistry, and histopathology, but did show impacts on measures of oxidative stress in brain tissues [
4]. While it seems that the direct impacts of SWCNTs consumed through diet are likely minimal, it is quite possible that these materials may indirectly affect aquatic organisms through interactions with nutritional and chemical constituents in the diet. It has been demonstrated in numerous studies that the hydrophobic nature of SWCNTs leads to high sorption affinity for proteins and lipids from suspension environments [
17,
18,
19]. Therefore it was hypothesized that interactions of SWCNTs and nutritional components present in fish diet will cause alterations in genes responsible for nutrient transport and processing.
It has previously been demonstrated that nutrient depletion or starvation of fish leads to differential expression of genes involved in nutrient processing. For example, the intestinal peptide transporters
pept1 and
pept2 have been shown to be responsive to starvation and re-feeding and are thought to play a role in compensatory growth [
20,
21]. The peptide hormone cholecystokinin (
cck), which plays a role in stimulating digestion and signaling satiation, has been found to be differentially expressed seasonally as well as during periods of fasting [
22]. Alterations in dietary lipids have been found to impact the expression of lipoprotein lipase (
lpl), an enzyme responsible for digestion of specific lipids [
23,
24]. As a result of their responsiveness to nutrient depletion, these genes are ideal candidates for examining the impacts of SWCNTs on nutrient depletion in fish.
The objectives of this study were twofold: (1) to determine if SWCNTs present in the diet influence the uptake and distribution of these materials as measured by NIRF; (2) to assess whether SWCNTs present in the diet can influence nutritional status through the measurement of expression of genes involved in nutrient processing. Data from this study will help to further our understanding of how dietary exposure to SWCNTs may influence uptake, distribution, and toxicity of these materials; essential knowledge for determining their behavior in aquatic systems.
2. Results and Discussion
One of the major challenges in the assessment of the environmental health and safety of SWCNTs is the lack of quick, low cost, and sensitive techniques for tracking the distribution and bioaccumulation of these materials
in vivo. While techniques like TEM have been utilized to examine SWCNT uptake in aquatic organisms, they are extremely time consuming and lack the specificity to identify SWCNTs in tissue [
6]. NIRF has emerged as a sensitive quantitative technique for tracking SWCNTs in water, sediment, and biological tissues [
5,
11,
12,
13]. Though the effectiveness of this technique in tracking these materials during oral exposure by gavage has been previously demonstrated [
5], exposure through diet represents a more relevant scenario and affords the opportunity to examine novel mechanisms of sublethal toxicity.
In the current study, fathead minnows (FHMs),
Pimephales promelas, were exposed to SWCNT-containing diets for 96 h and NIRF was used to examine uptake of these materials. Exposure to these diets did not cause mortality or any observable morbidity in FHMs throughout the 96 h exposure period. This is similar to previous studies examining oral exposure of fish to SWCNTs that also found no overt toxicity [
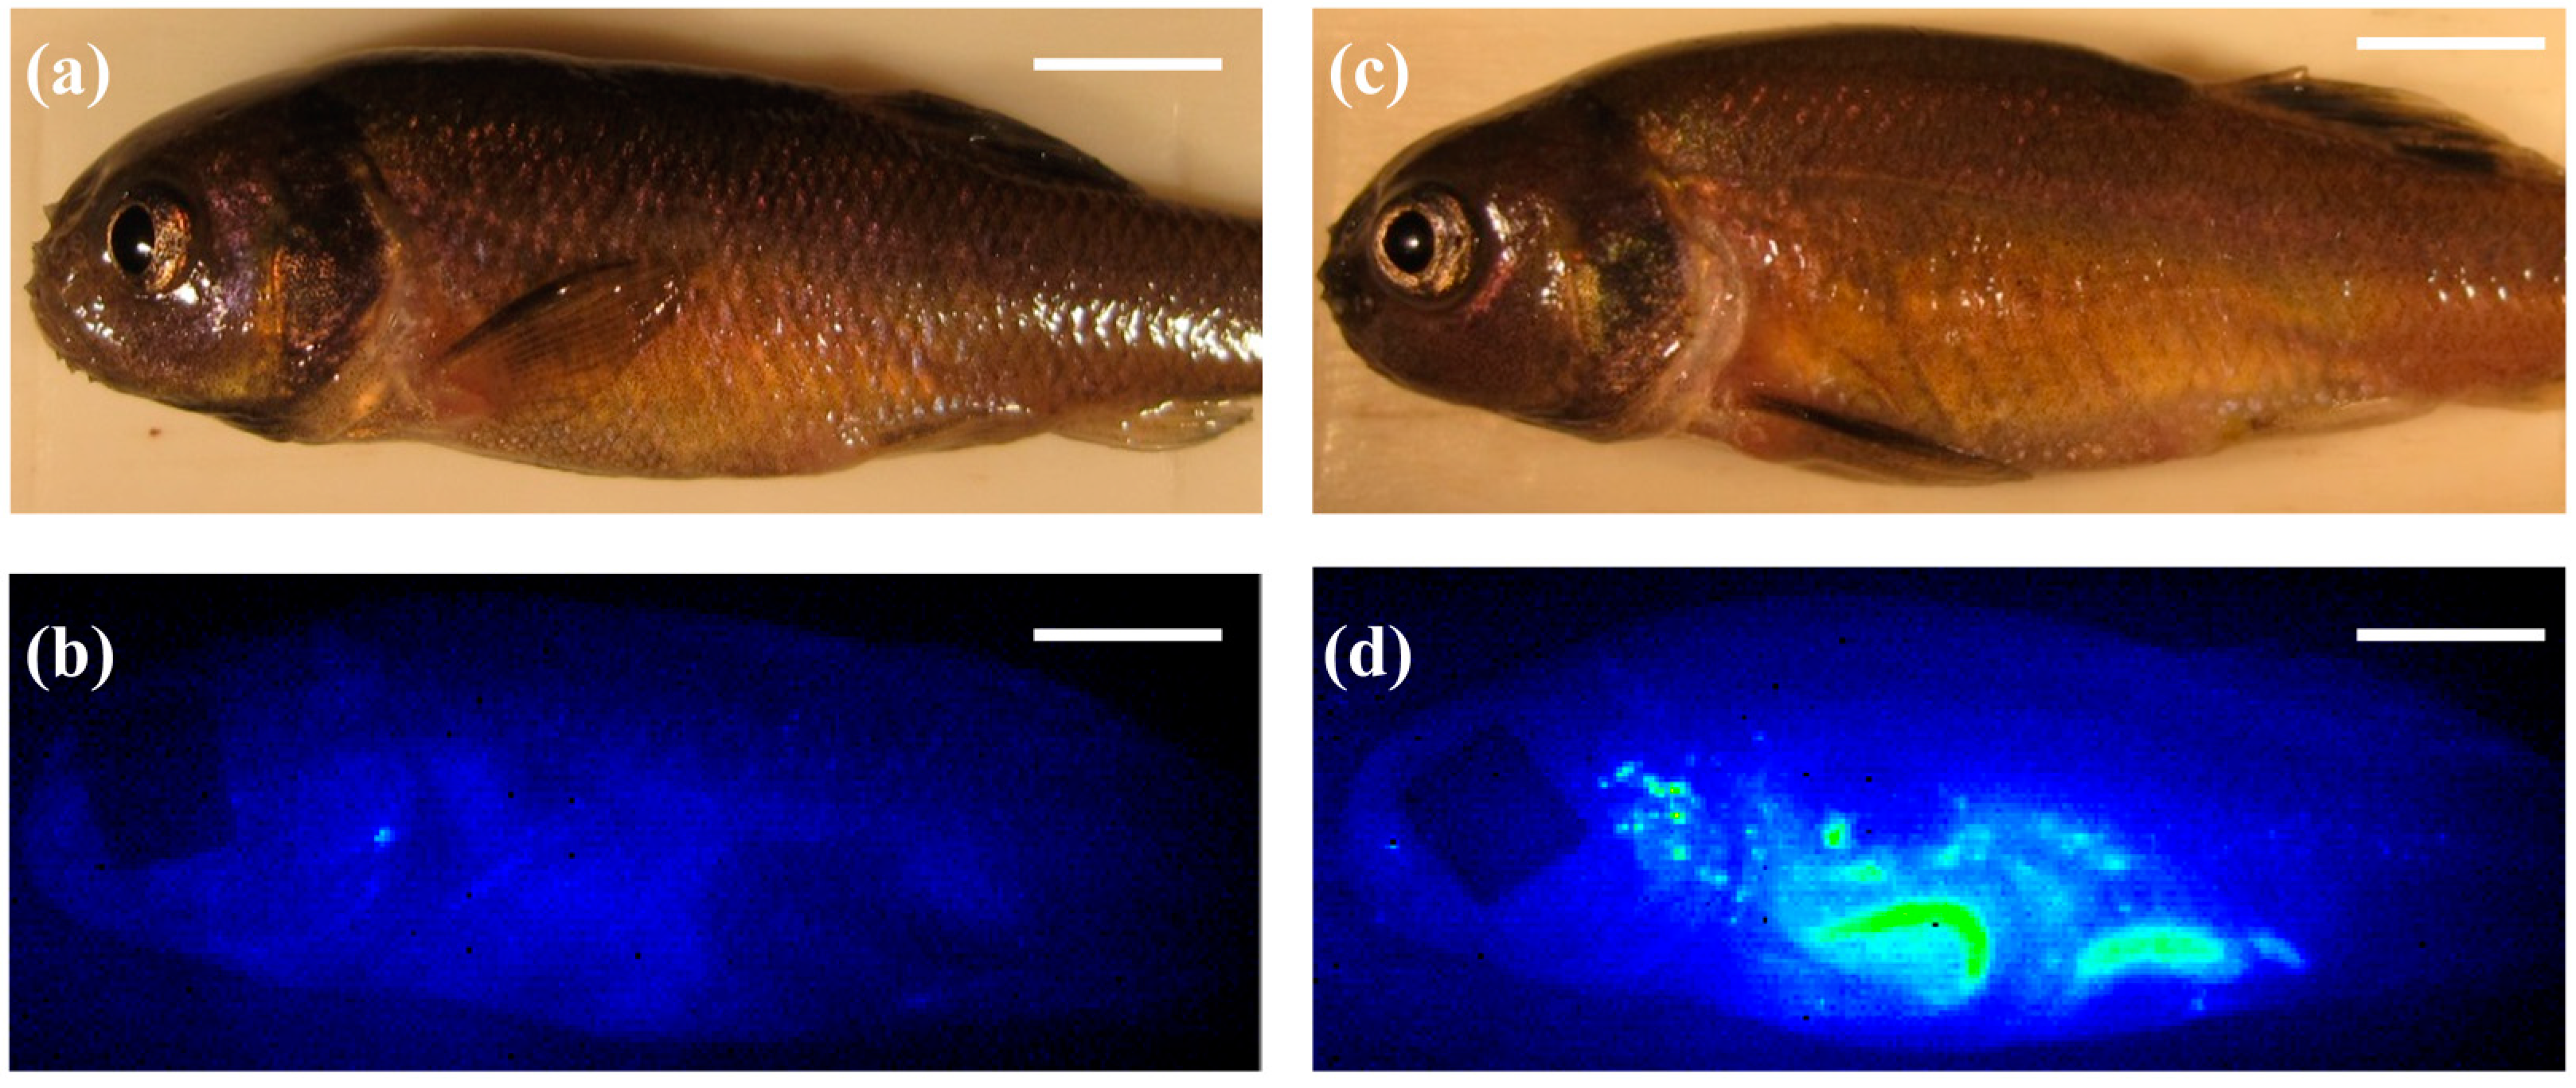
4,
5]. Mixture of SWCNTs in the fish diet did not quench their fluorescence and within 2 h of the initial SWCNT feeding, fluorescence from the SWCNTs was observed in whole live fish using NIRF imaging (
Figure 1d). The control diet also did not produce appreciable background fluorescence that would decrease the sensitivity of the NIRF imaging system (
Figure 1b). Though SWCNT fluorescence could be observed in live fish throughout the exposure, individual organs were excised at time points for qualitative imaging and quantitative measurements of SWCNTs in FHM tissues. Both intestines and livers were removed from fish and imaged separately. NIRF imaging of FHM intestines indicated distribution of SWCNTs throughout the intestine for the entire duration of the exposure (
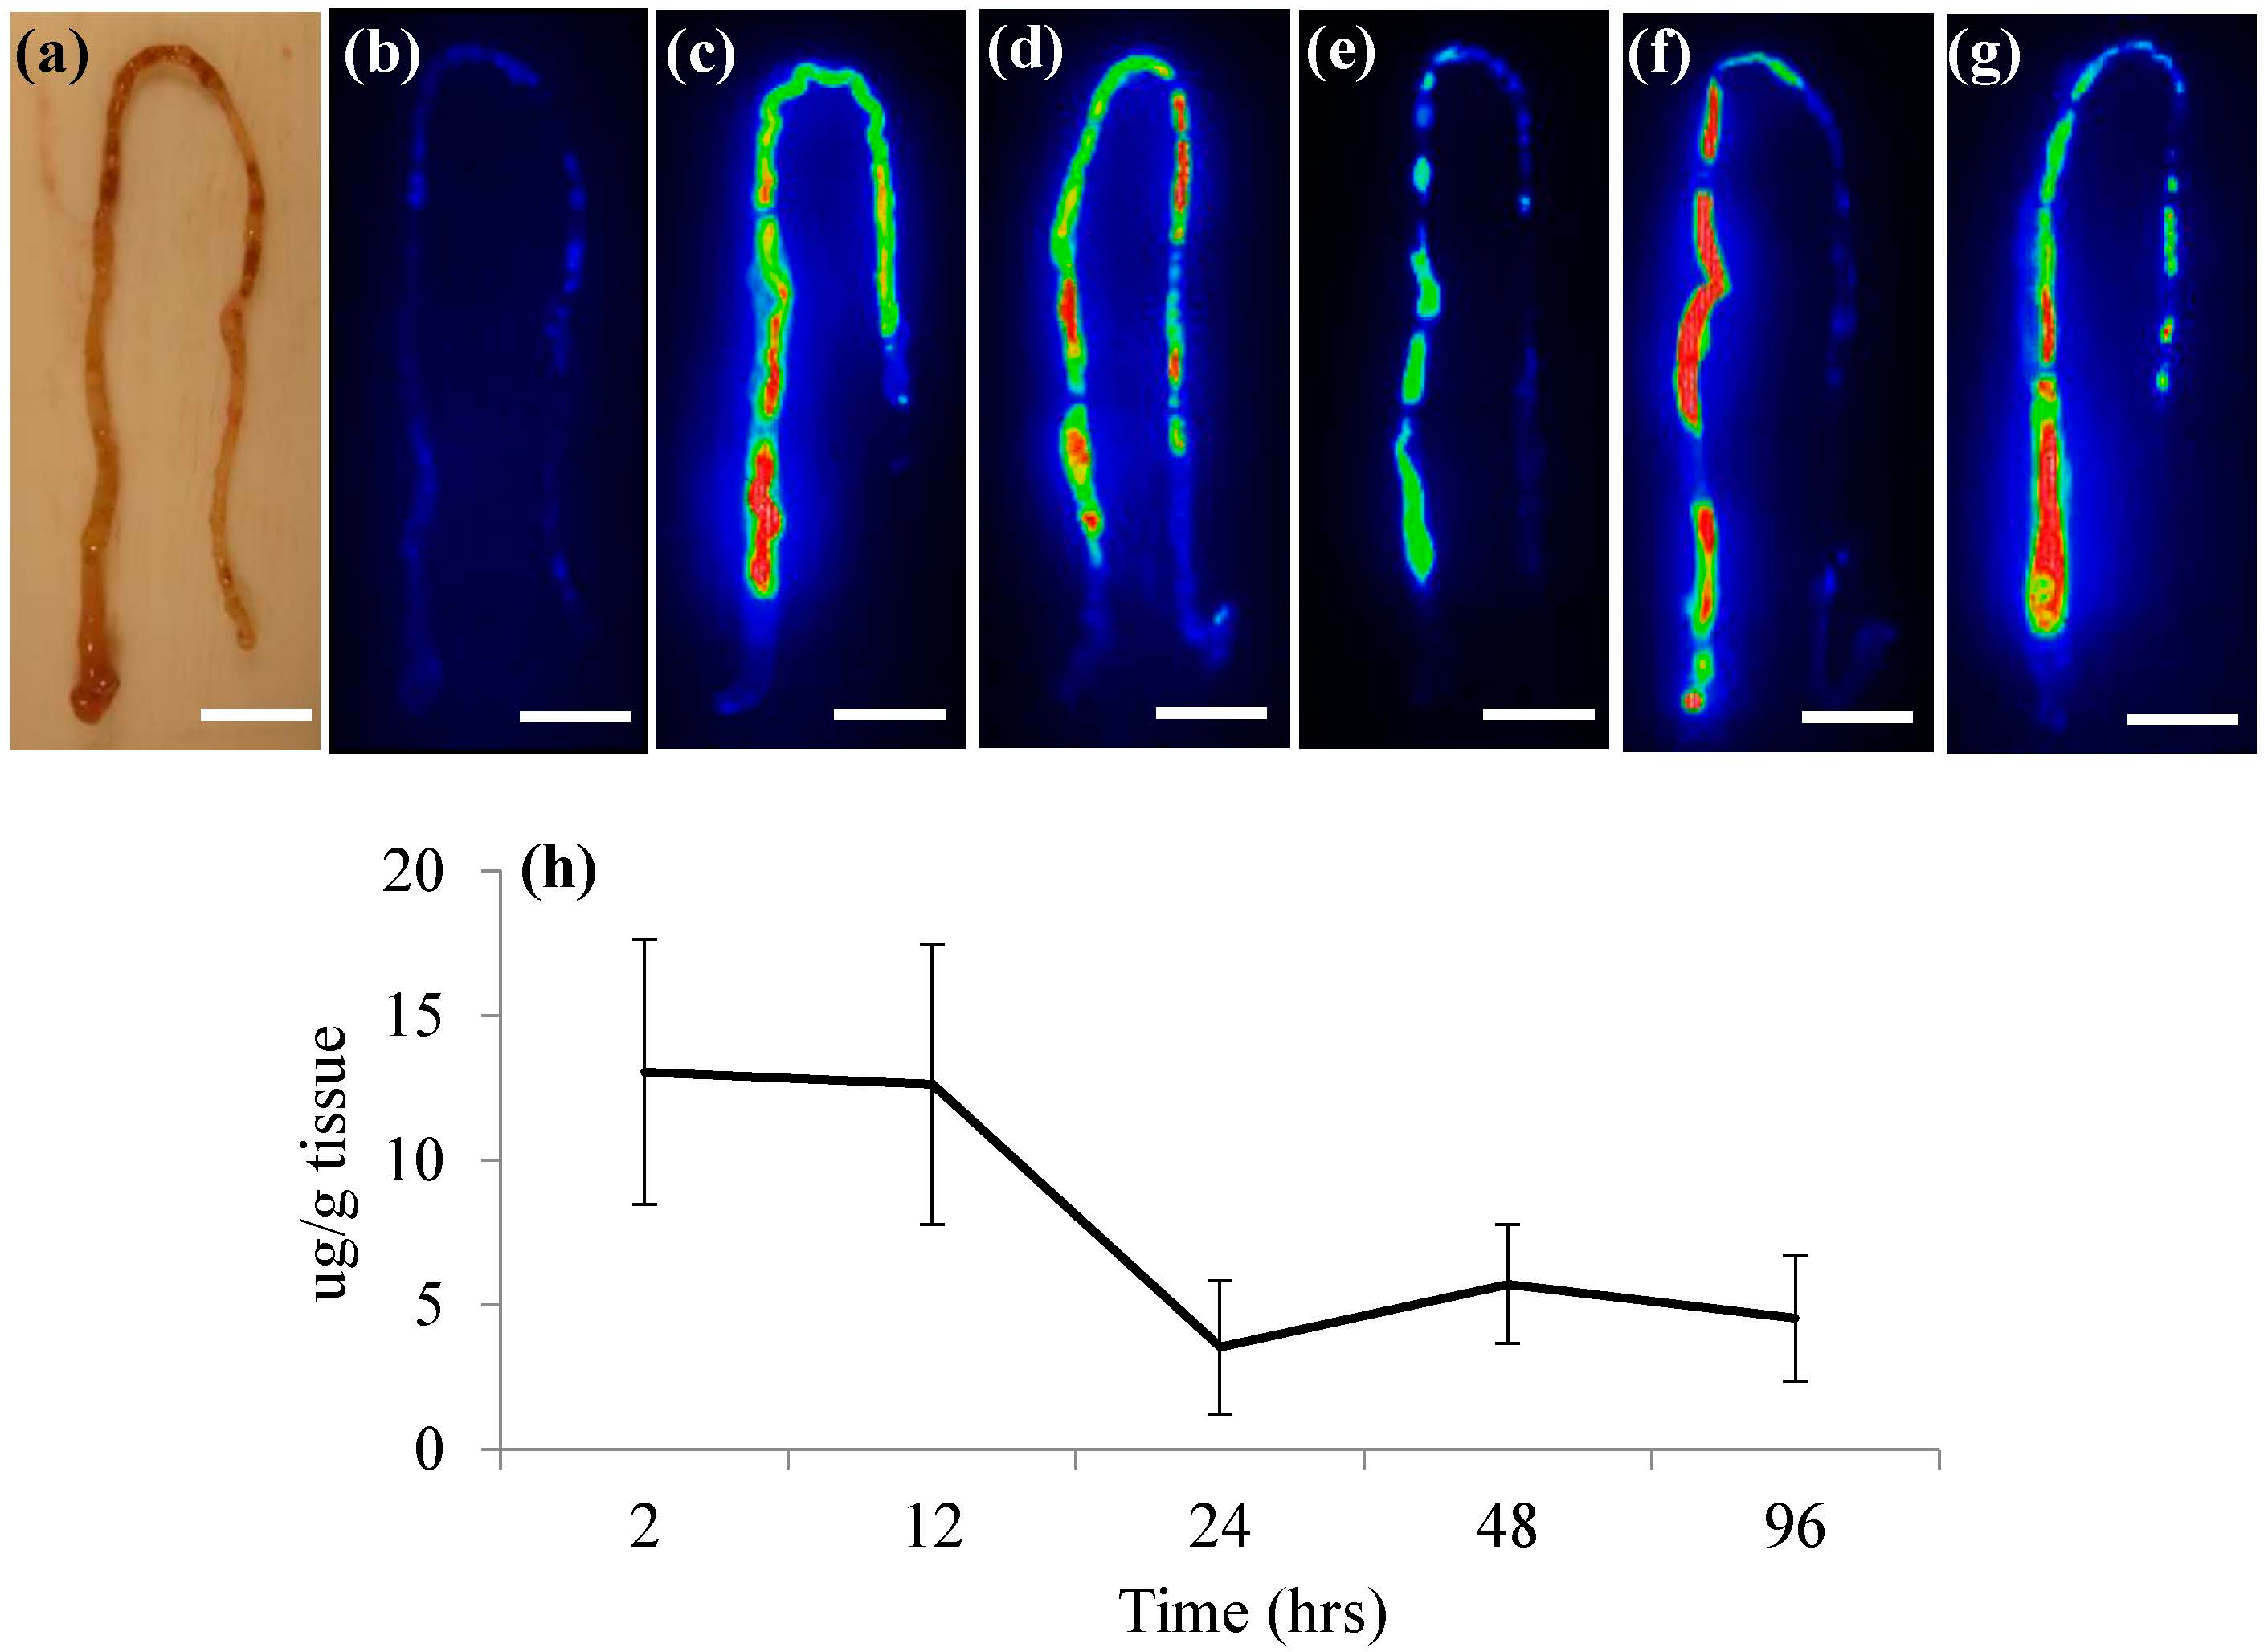
Figure 2). Further quantification of SWCNTs in intestinal tissue using NIRF spectroscopy confirmed that feeding of a SWCNT diet remained fairly consistent throughout the exposure period (
Figure 2h).
Figure 1.
Near-infrared fluorescence (NIRF) imaging of fathead minnows (FHMs) fed single-walled carbon nanotubes (SWCNT) containing feed. Images of FHM fed a diet containing SWCNTs were collected throughout the study. The solid white line is a scale bar representing 5 mm. (a) Representative light image of control FHM; (b) Corresponding NIRF image of control FHM; (c) Representative light image of FHM exposed to SWCNT diet; (d) Corresponding NIRF image of FHM fed a SWCNT diet for 12 h. SWCNTs can be observed in live fish as indicated by increased fluorescence intensity of the pseudocolor.
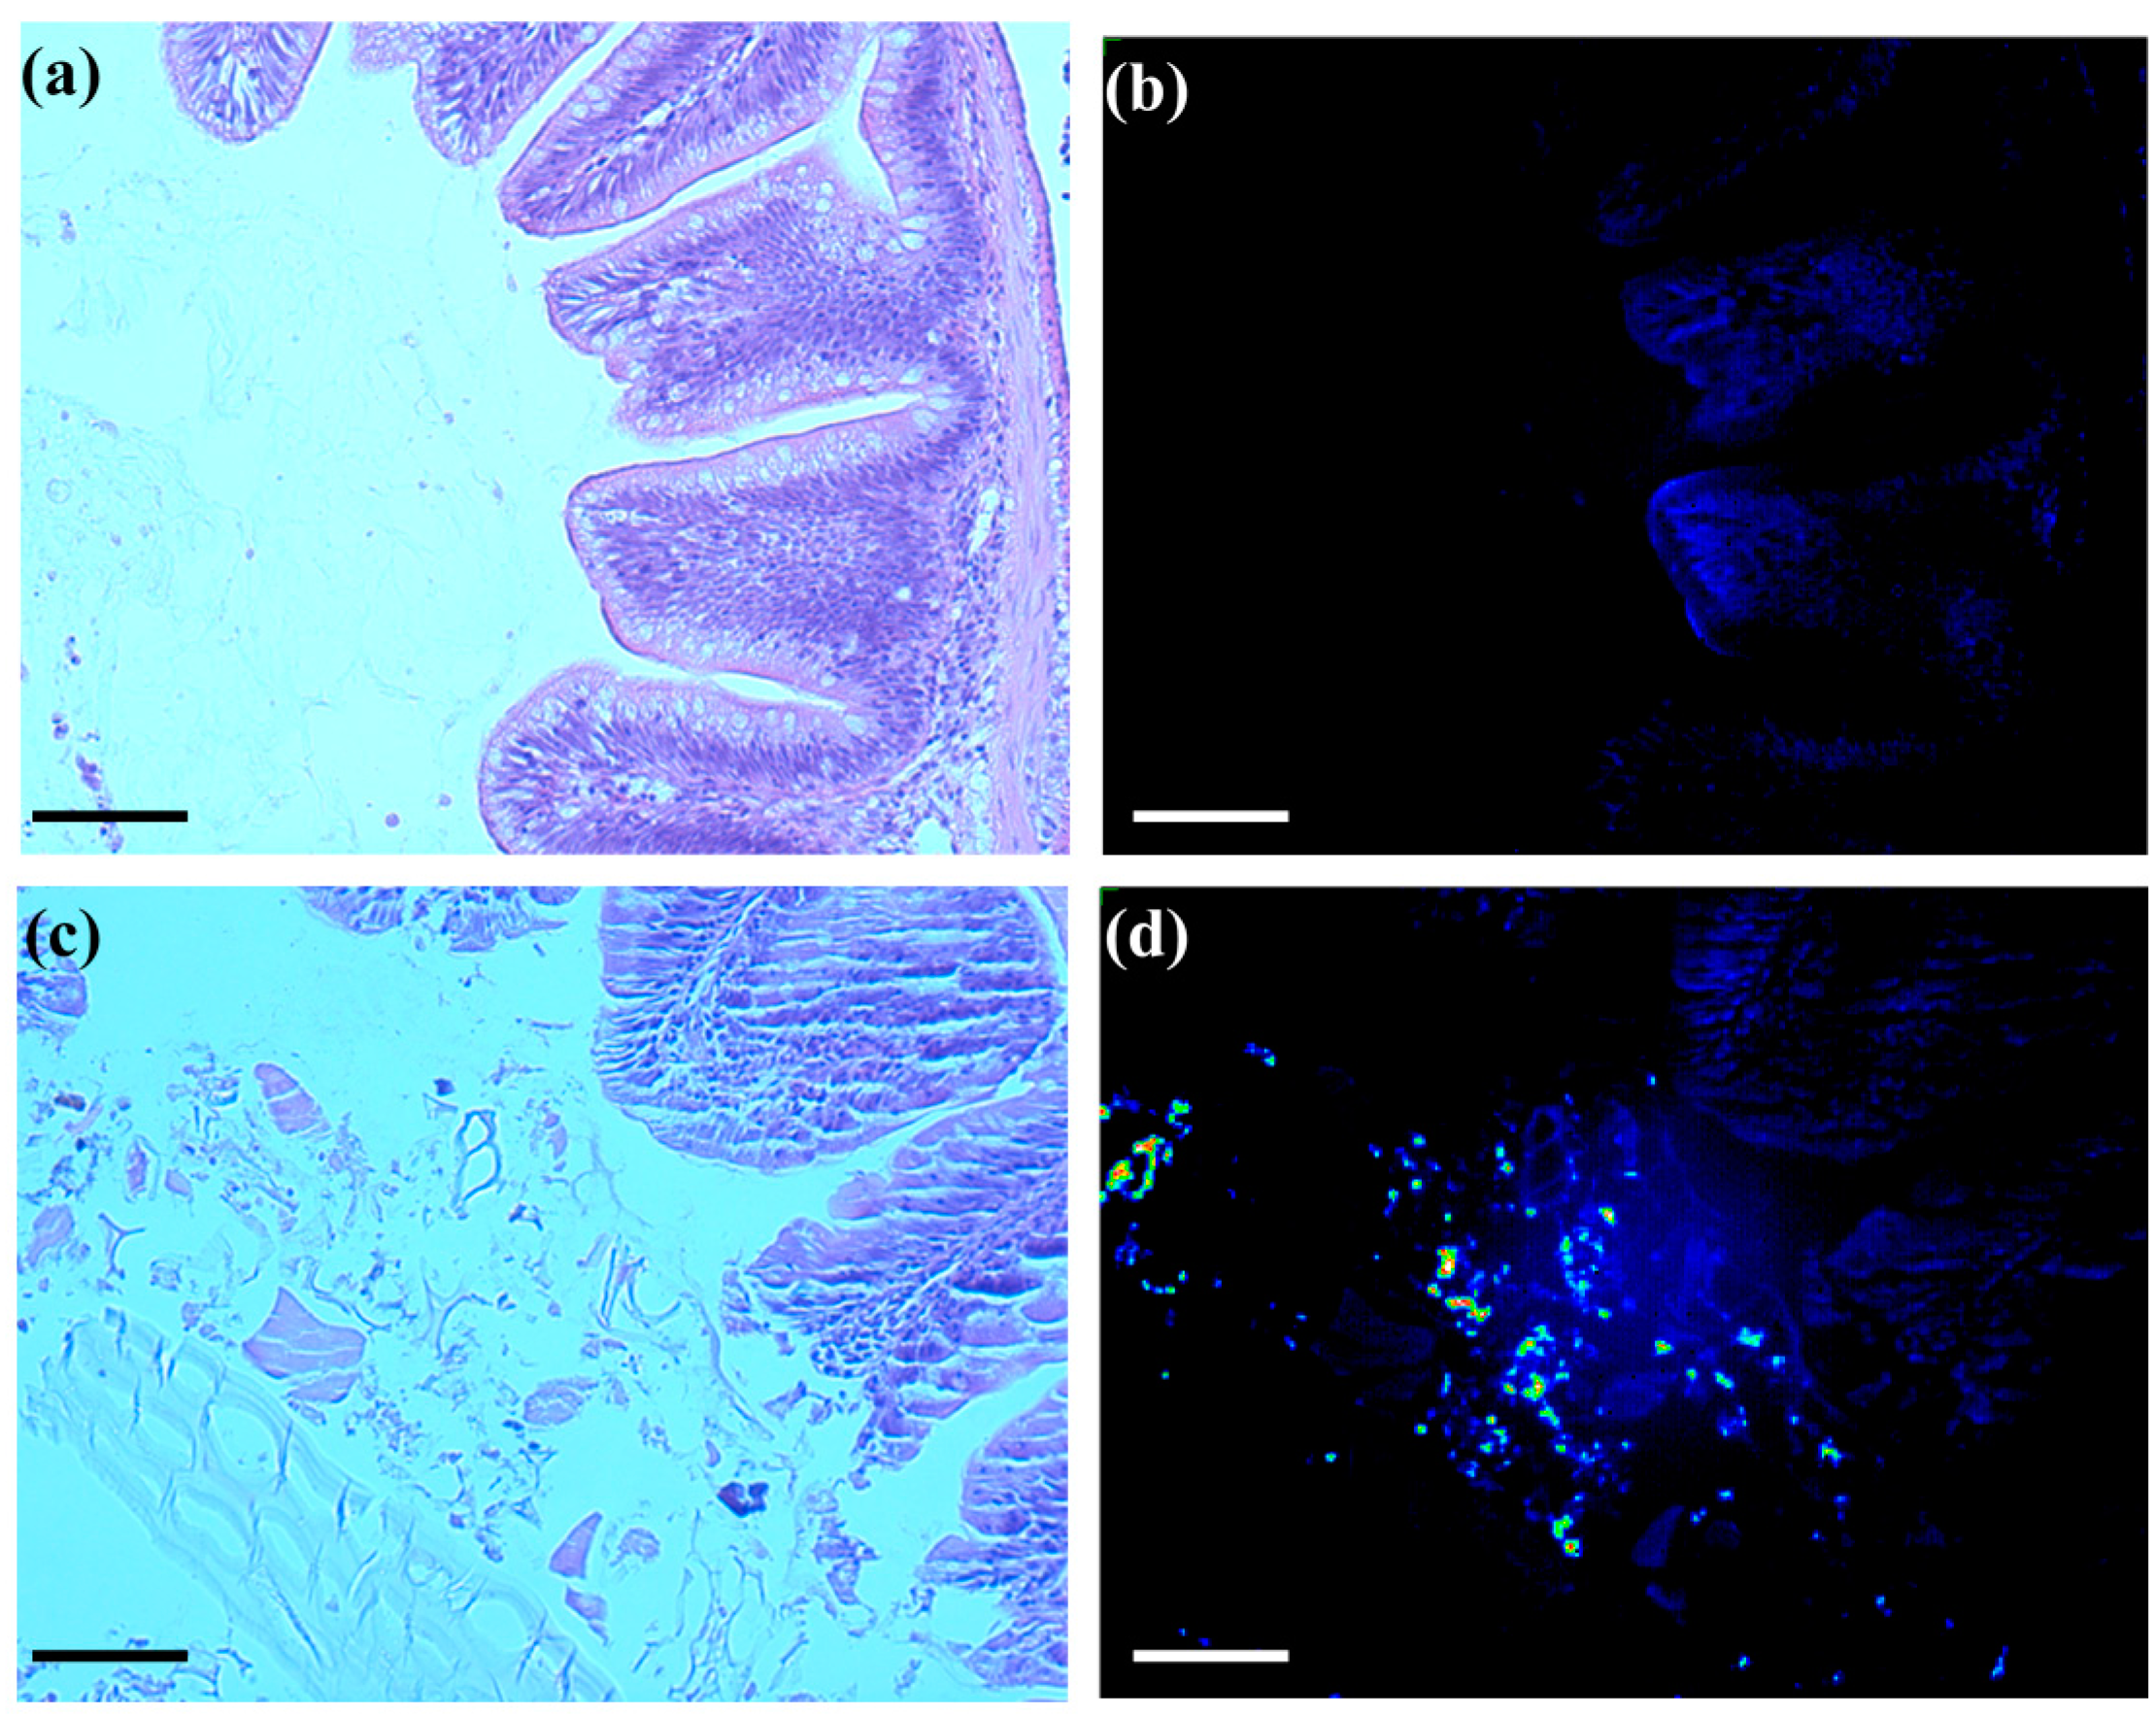
To examine the microscopic behavior of SWCNTs in the intestinal track of FHMs, NIRF microscopy was employed; a technique that has never been used in fish to date. Histological cross sections of exposed and unexposed FHM intestines were observed for SWCNT fluorescence using a microscope fitted with NIRF capability. While SWCNTs cannot be seen using light microscopy, NIRF microscopy allows for detection of the presence of SWCNTs in histological cross sections. Control cross sections exhibited low background fluorescence with no observation of significant fluorescence in the intestinal lumen or surrounding epithelia tissue (
Figure 3b). Cross sections of SWCNT-exposed intestines revealed bright fluorescent SWCNTs among the intestinal lumen contents but no apparent association with intestinal epithelia or underlying tissue was observed (
Figure 3d).
Contaminants that pass through the apical membrane of a fishes intestine and subsequently move through the basolateral membrane and into circulation are quickly transported to the liver which is involved in contaminant metabolism [
25]. Therefore, it is likely that if SWCNTs were to pass through the intestinal epithelia they would find their way to the liver. Qualitative assessment of NIRF images of livers from FHMs exposed to SWCNT containing diets did not exhibit increased fluorescence when compared to control liver (data not shown). Additionally, quantitative analysis of livers using NIRF spectroscopy failed to detect SWCNTs in any of the fish livers (data not shown).
Figure 2.
NIRF imaging and quantification of SWCNTs in FHM intestines. NIRF was used to track SWCNT movement in intestines throughout SWCNT exposures. The solid white line is a scale bar representing 5 mm. (a) Light image of typical FHM intestine with proximal portion oriented on the bottom left moving to distal portion; (b) NIRF image of control intestine; (c–g) NIRF images of representative intestines from FHM exposed to a SWCNT diet for 2, 12, 24, 48, and 96 h of feeding, respectively; (h) Quantitation of SWCNTs in FHM intestines using NIRF spectroscopy.
Using NIRF imaging of whole fish and individual organs, NIRF microscopy of intestinal cross sections, and NIRF spectroscopy of intestines and livers revealed that though FHMs readily consumed SWCNT containing feed, these materials stayed compartmentalized in the intestinal lumen and would likely be excreted. Studies have found a similar result when exposing FHMs to SWCNTs through oral gavage indicating that SWCNTs are not effectively absorbed in fish intestines [
5]. In the aquatic invertebrate
Daphnia magna, studies have shown that waterborne exposures to multi-walled carbon nanotubes (MWCNTs) and SWCNTs result in impaction of the intestine with materials but no appreciable uptake [
6,
26]. The presence of food may facilitate the absorption of organic contaminants in fish [
27], but the results of this study indicate that this is probably not the case for SWCNTs.
In vitro experiments have demonstrated that SWCNTs likely do not penetrate membranes directly but can be absorbed through endocytosis pathways [
28] but the complexity of epithelia tissue and the presence of secretory mucous may preclude direct interaction with the intestinal brush border. Therefore, it is likely that any impact of oral exposure to SWCNTs on the gastrointestinal system will be through interaction with other constituents in the intestinal environment.
Figure 3.
NIRF imaging of histological sections of FHM intestines. Histological sections of FHM intestines were examined to determine the localization of SWCNTs using NIRF. The solid lines is a scale bar representing 150 µm. (a) Representative light image of control FHM H&E stained intestinal cross section; (b) Corresponding NIRF image of control FHM intestinal cross section; (c) Representative light image of an intestinal cross section of FHM fed SWCNT diet; (d) Corresponding NIRF image of SWCNT fed intestinal cross section. SWCNT NIRF can be seen as increased fluorescence intensity of the pseudocolor. SWCNTs were only observed in the intestinal lumen with no evidence of association with or crossing the epithelia.
SWCNTs and MWCNTs have been shown to exhibit strong sorption capacity for a number of different proteins, lipids, and contaminants [
17,
18,
19,
29], which can decrease their bioavailability to aquatic organisms [
30,
31]. Based on our NIRF analysis it is unlikely that SWCNTs will be absorbed through the intestine however, interactions with nutritional components may render them unavailable for uptake, depleting essential nutrients needed by the fish for growth and reproduction. To test for potential effects of SWCNTs in the diet on nutrient uptake and processing, a suite of genes were selected that are known to be responsive to alterations in dietary nutrients. Before using these genes to test the effects of SWCNTs, they were first tested for their responsiveness to alterations in nutrient availability (starvation) as this is the first report to identify and quantify expression levels in FHMs. As the expression of these genes may not be equivalent throughout the intestine, we also probed their levels in defined sections: proximal, middle and distal.
The H
+ dependent peptide transporters,
pept1 and
pept2, are found along the apical membrane of the intestinal epithelium and are responsible for transporting digested dipeptides into intestinal tissues [
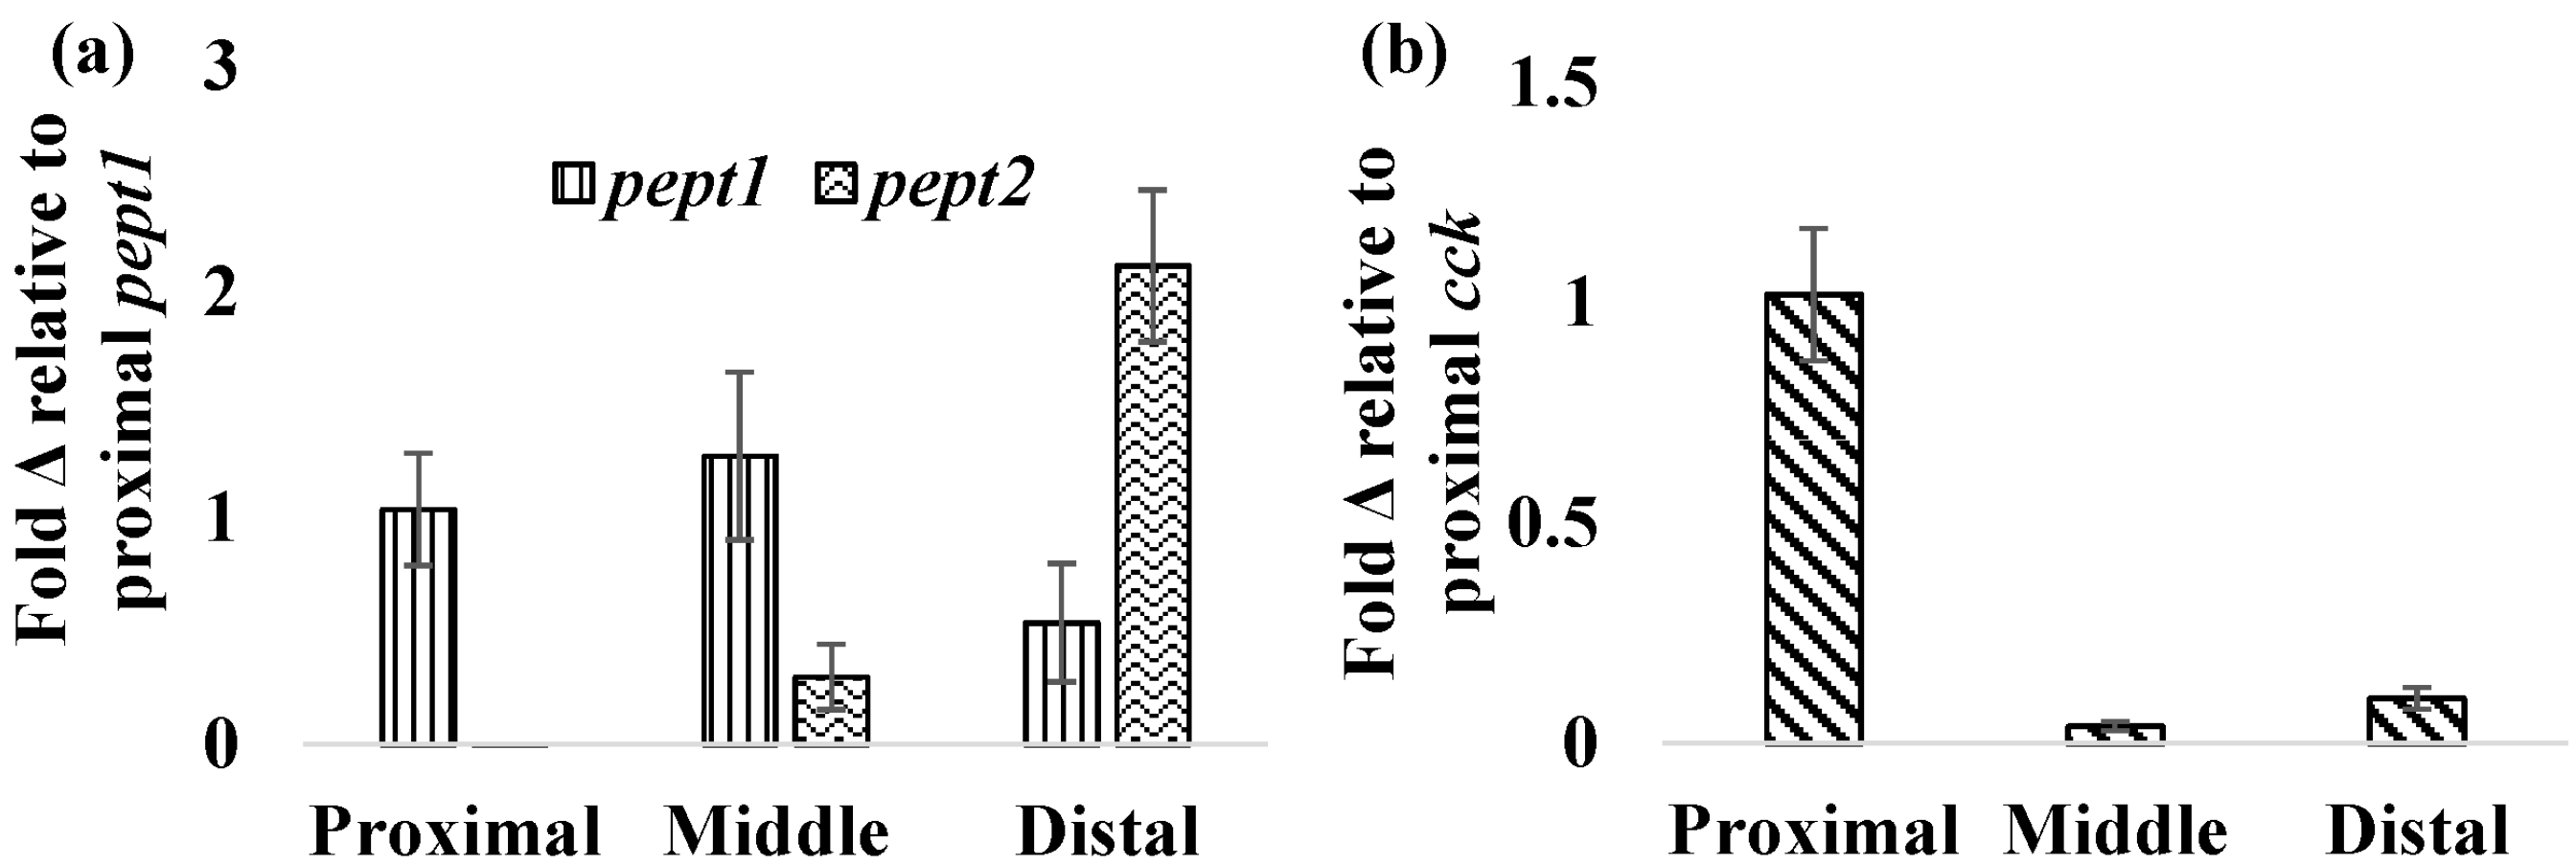
32]. In normally fed FHMs,
pept1 was more highly expressed in the proximal and middle intestine with lower levels of expression found in the distal intestine (
Figure 4a). Similar patterns were found in the European seabass with higher levels of
pept1 expression in the proximal intestine when compared to other regions and tissues [
33]. Expression of
pept2 followed an opposite trend with the lowest expression observed in the proximal intestine, which increased distally with the highest expression in the distal intestine (
Figure 4b).
Figure 4.
Relative expression of pept1, pept2, and cck in fish intestines. Expression of mRNA for pept1, pept2, and cck was measured in the proximal, middle, and distal intestines of normally fed FHMs to determine relative expression of these genes. (a) Relative mRNA expression of pept1 and pept2 throughout the FHM intestine. Expression is represented as the average ± standard error fold change from proximal pept1 expression; (b) Relative mRNA expression of cck throughout the FHM intestine. Expression is represented as the mean ± standard error fold change from proximal cck expression.
The effect of starvation on fish intestinal
pept1 expression has been examined in European sea bass and zebrafish, which exhibited opposing responses. In the European seabass, starvation for 7 days results in an increase in
pept1 expression but continued starvation for 35 days ultimately caused a decrease in expression [
33,
34]. This is likely due to fish increasing expression initially in an attempt to boost nutrient uptake followed by a decrease in expression to conserve energy during periods of extended starvation. In the zebrafish, starvation for 3 and 5 days caused decreased levels of
pept1 expression, which may be due to different feeding strategies and life histories of these fish [
20,
35]. It is also worth noting that like FHMs, zebrafish exhibit evolutionary loss of a stomach, which may also play a role in species differences. The function of the
pept2 transporter is not as well understood but one study found that during starvation of zebrafish,
pept2 expression initially decreases over a period of 6 h followed by increased expression up to 384 h [
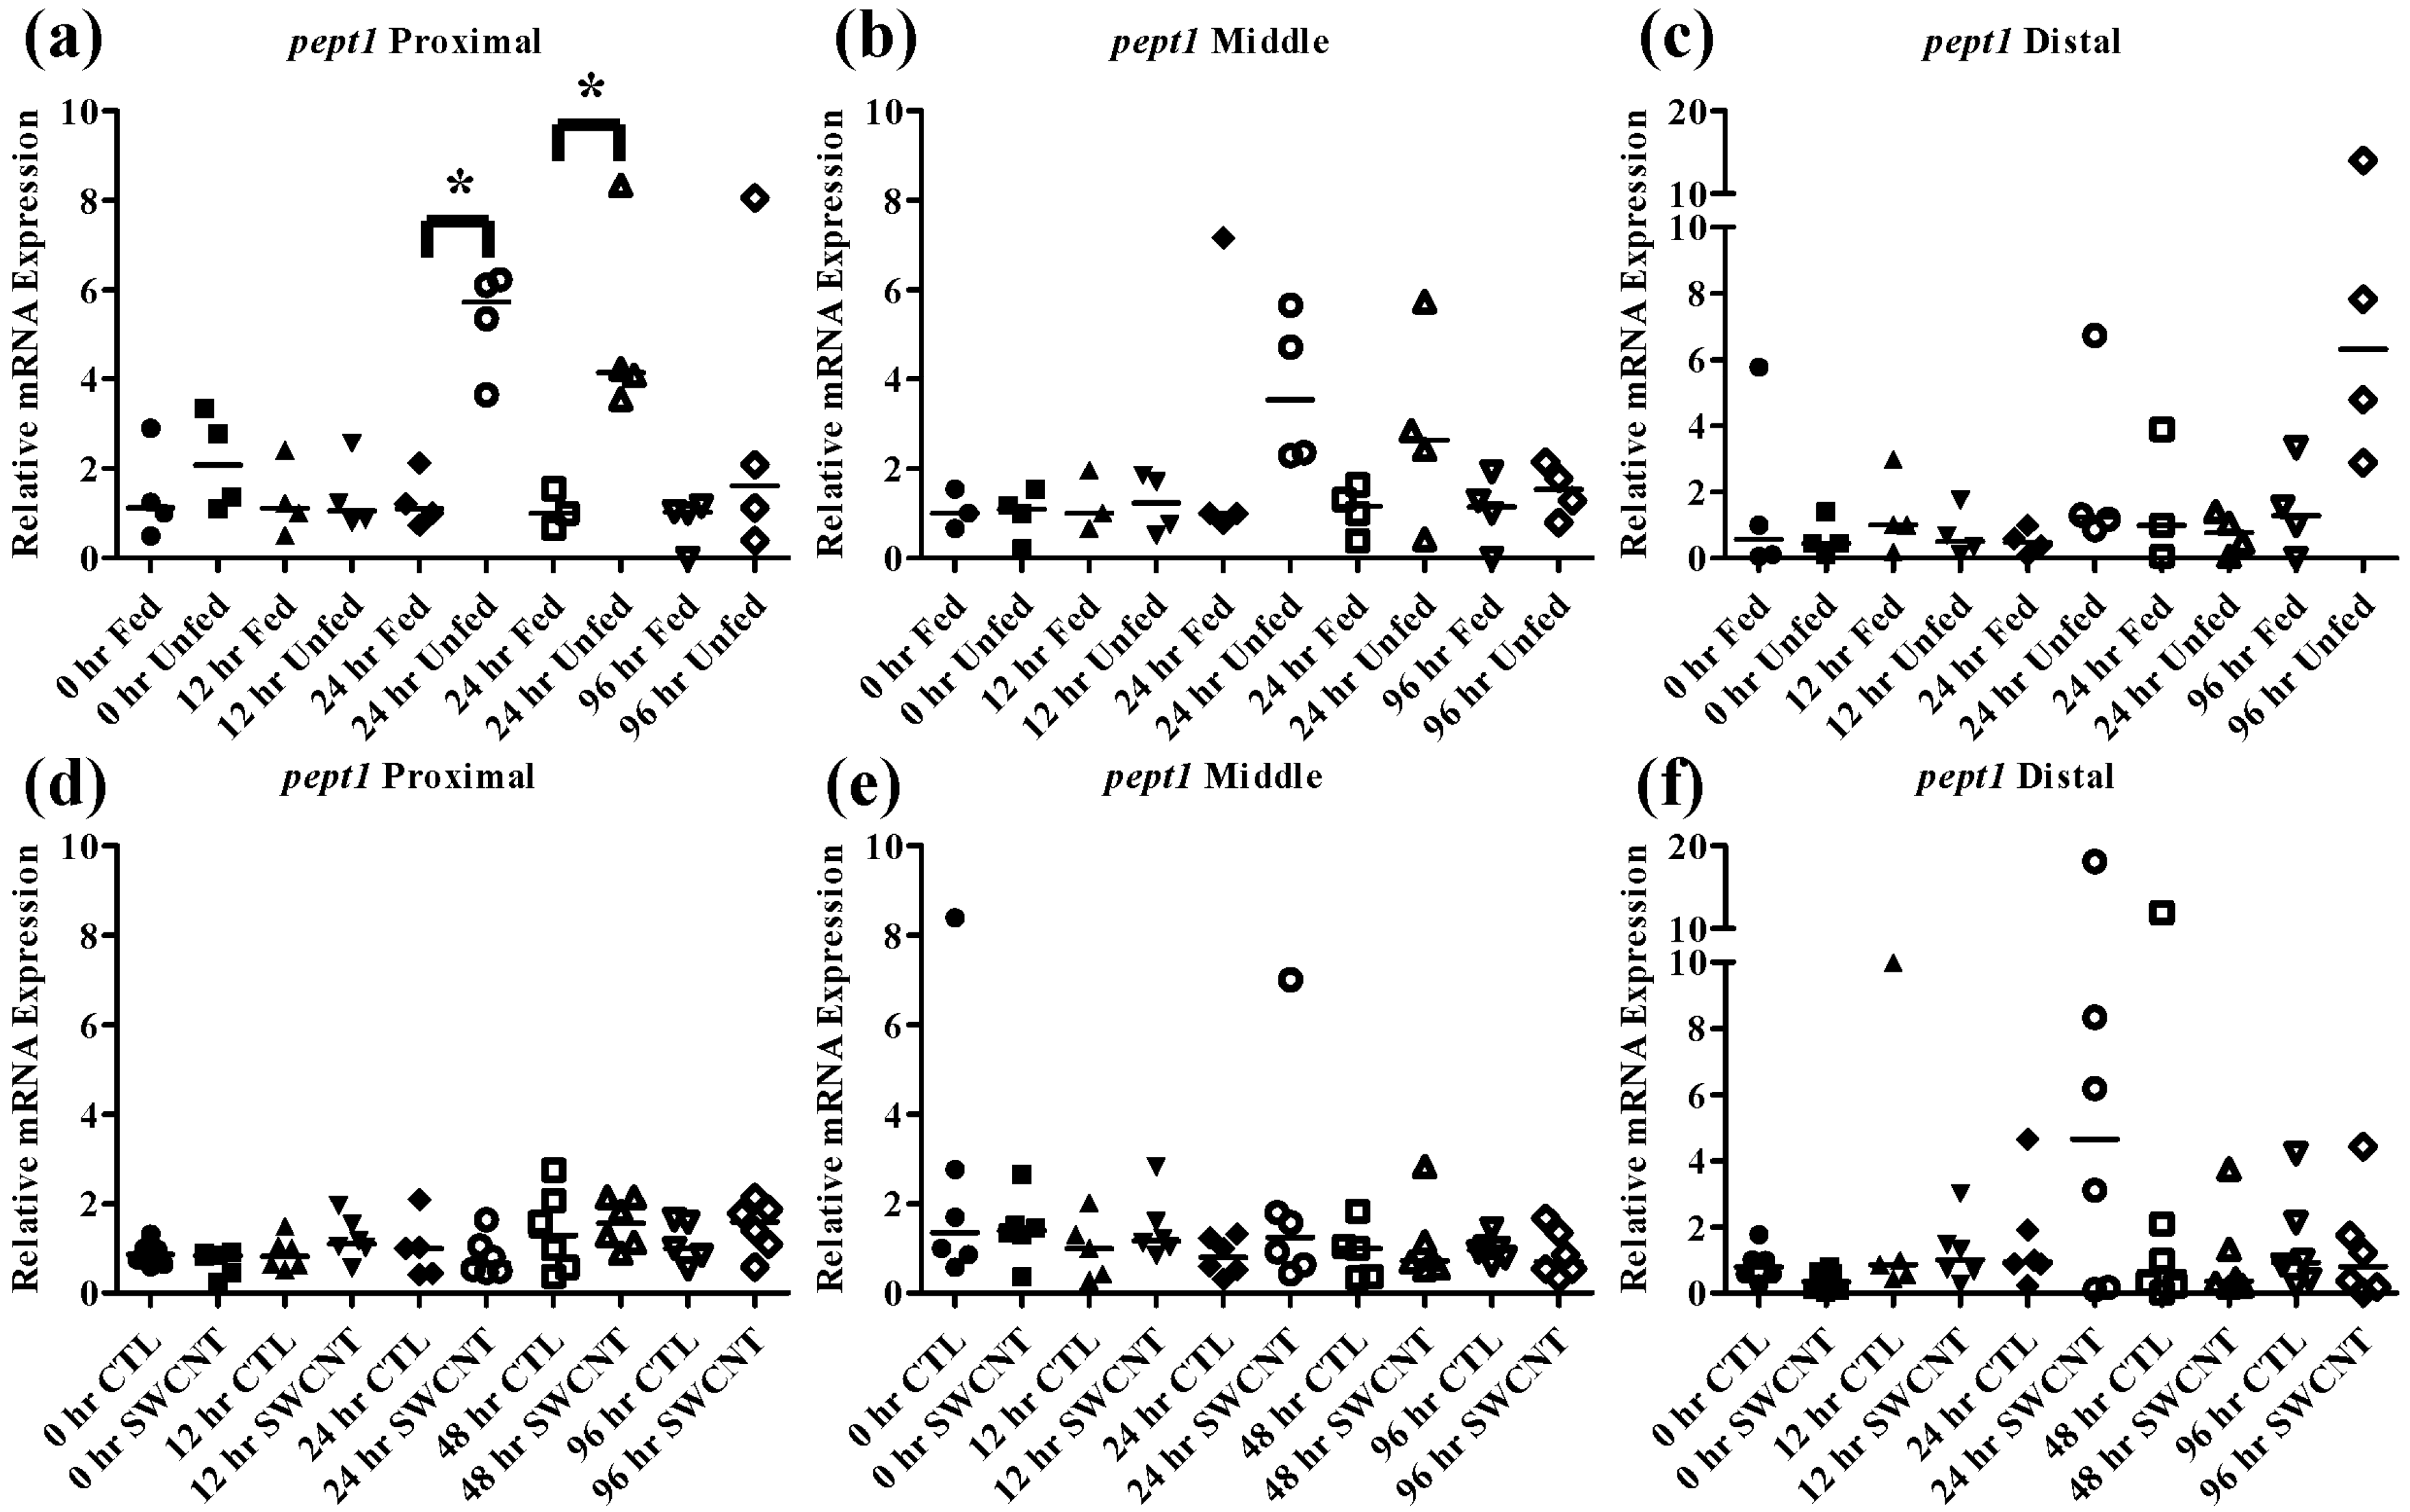
35]. In the current study, starvation of FHMs for 96 h caused increased expression of
pept1 in the proximal intestine (
Figure 5a) by 24 h and high levels of expression were maintained until 48 h before returning to slightly above control levels by 96 h. While an increasing trend in
pept1 expression at 24 and 48 h (
Figure 5b) was seen in the middle intestine, the values were not statistically significant due to high variability. Expression of
pept1 remained fairly constant in the distal intestine (
Figure 5c) during regular feeding and starvation, likely due to overall lower expression in this region. Expression of
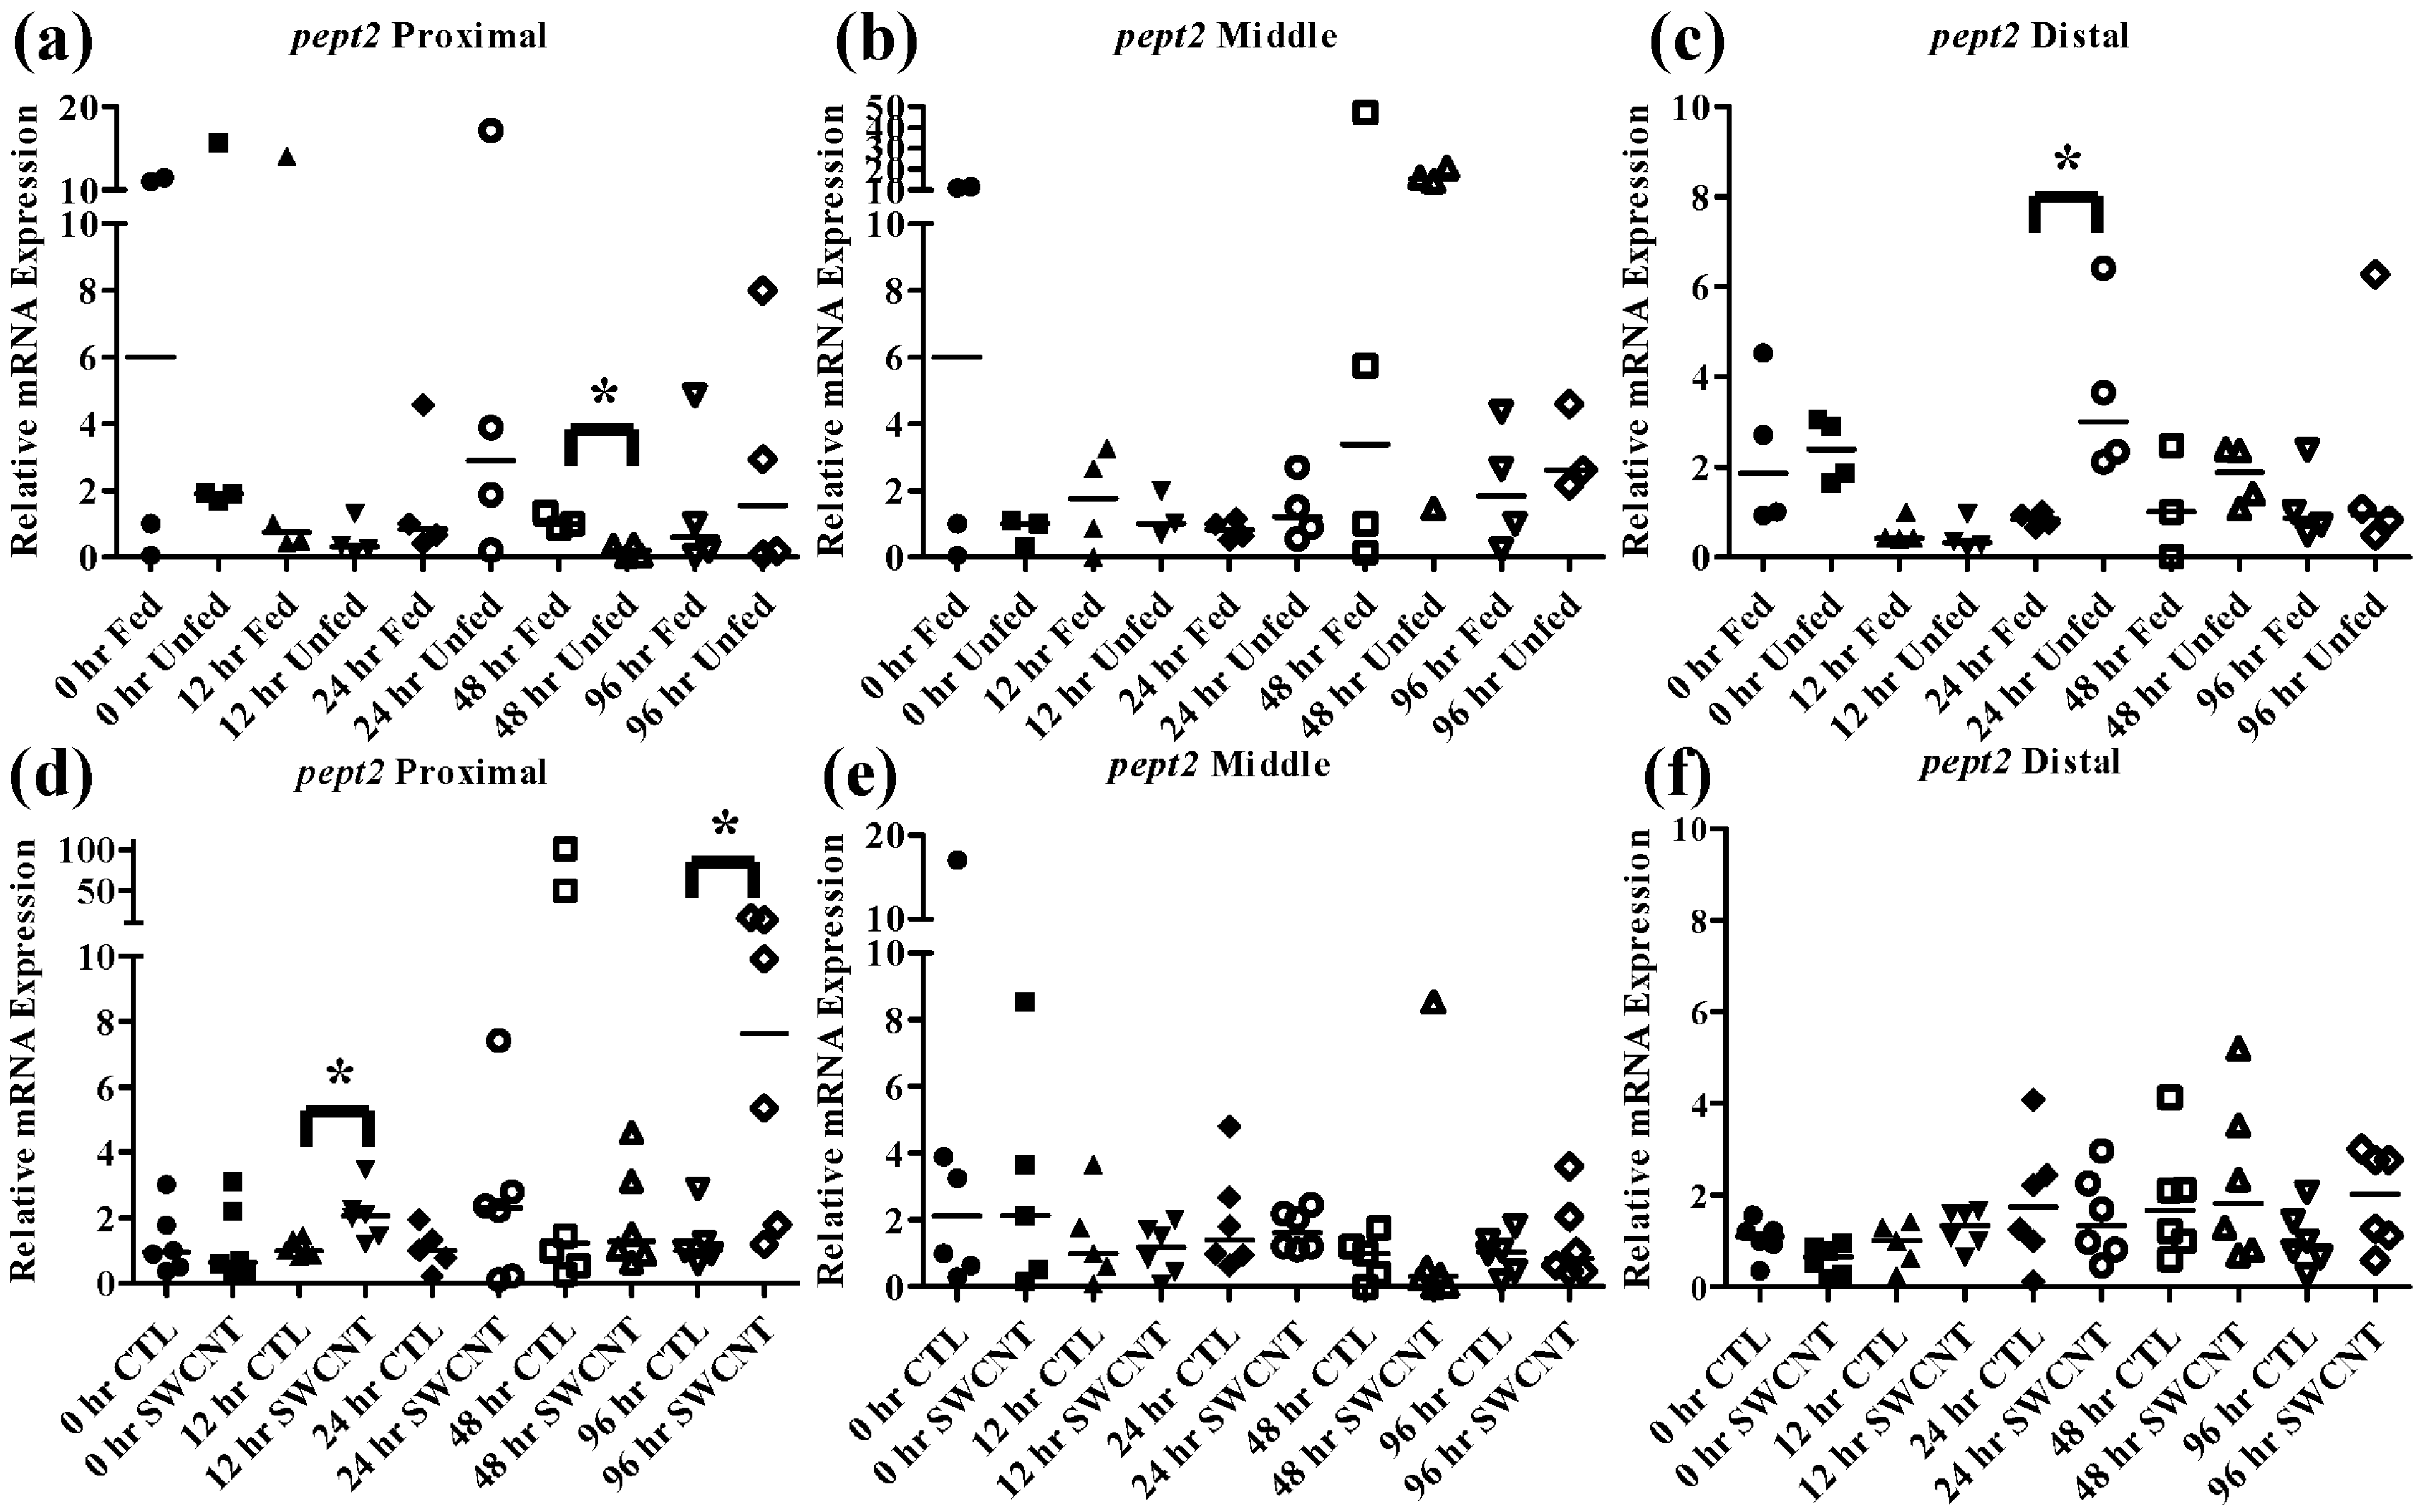
pept2 exhibited a unique pattern that was specific to the intestinal region. In the proximal intestine (
Figure 6a), expression of
pept2 decreased by 48 h but returned to control levels by 96 h; but in the distal intestine (
Figure 6c) expression of
pept2 increased at 24 h before returning to control levels by 48 h. While patterns of increasing and decreasing
pept2 expression in the intestine have been found before [
35], a mechanistic explanation has yet to be elucidated. It was hypothesized that the differences found between fish species are due to dissimilarities in life histories and foraging strategies.
The peptide hormone
cck is responsible for controlling the release of digestive enzymes into the intestines of fish as well as playing role in nervous system control of appetite [
36]. While
cck has been detected in many tissues in fish most studies have focused on its distribution in the intestine. Numerous fish species including bowfin, bluegill, dorado, and rainbow trout, exhibit similar patterns of
cck distribution throughout the intestine with high levels in the proximal intestine, varying levels in the middle intestine and low levels in the distal intestine [
37,
38,
39]. Similar results were found in the FHMs used in this study where high expression of
cck in the proximal intestine and lower levels found in the middle and distal intestine (
Figure 4b) were observed. During periods of nutrient depletion,
cck responses also appear to be conserved across species with starvation conditions causing decreased expression in winter flounder, zebrafish, and white sea bream [
20,
22,
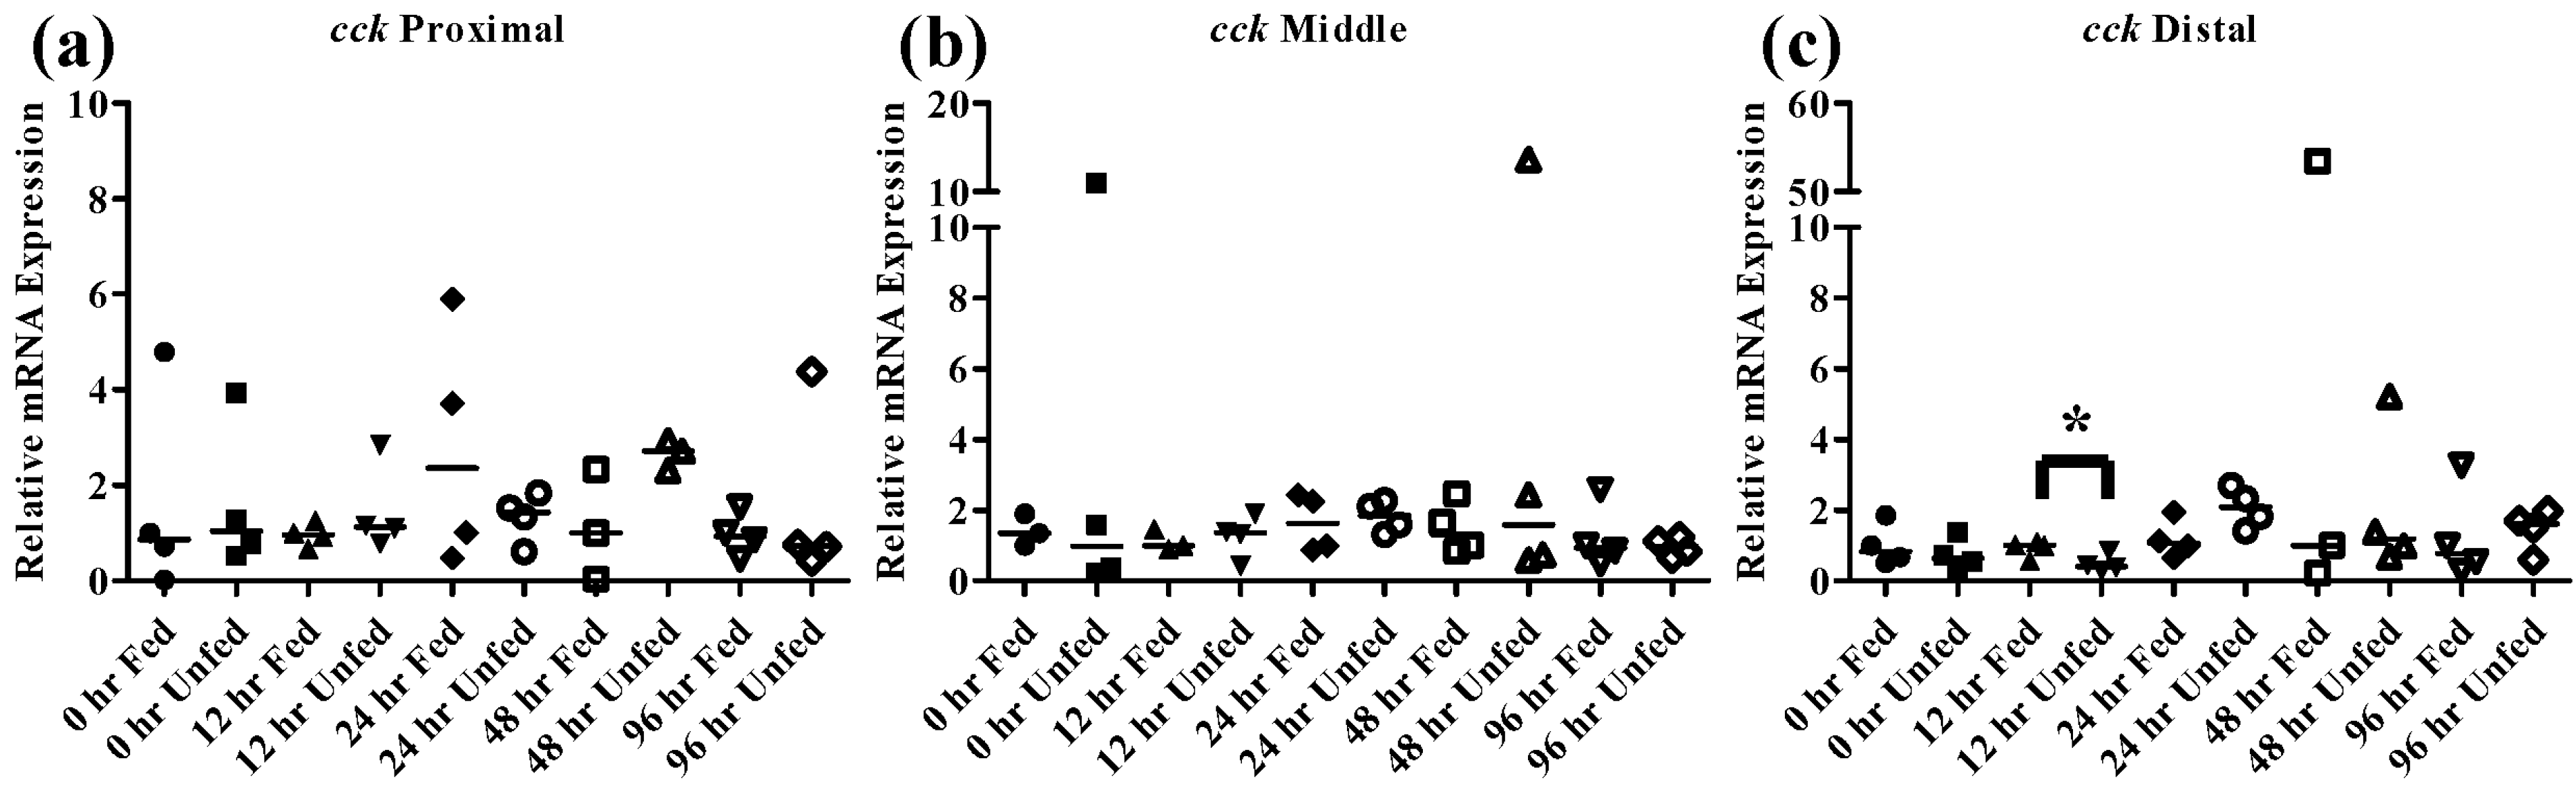
36]. While there was no significant
cck response in unfed FHMs proximal and middle intestines (
Figure 7a,b), the distal intestine (
Figure 7c) did exhibit decreased
cck expression after 12 h suggesting a signal to increase feeding due to decreased nutrient availability. Expression of
cck returned to control levels by 24 h which may indicate a switch to conservation of energy used on foraging during periods of low food availability.
Figure 5.
Intestinal pept1 mRNA expression of fed, vs. unfed and control vs. SWCNT fed FHMs. Expression of pept1 mRNA expression was measured in three intestinal sections of FHMs under different experimental conditions. Expression of individual replicate fish is presented relative to the corresponding control at that time point. Solid lines for each time point and treatment represents the median value. Statistical comparisons were made between treatments for each time point within each intestinal section and statistically significant values marked by an asterisk (p < 0.05). (a–c) Relative pept1 mRNA expression in fed and unfed FHM proximal, middle, and distal intestines, respectively; (d–f) Relative pept1 mRNA expression in proximal, middle, and distal intestines, respectively, of FHMs fed either control or SWCNT diets.
Figure 6.
Intestinal pept2 mRNA expression of fed, vs. unfed and control vs. SWCNT fed FHMs. Expression of pept2 mRNA expression was measured in three intestinal sections of FHMs under different experimental conditions. Expression of individual replicate fish is presented relative to the corresponding control at that time point. Solid lines for each time point and treatment represents the median value. Statistical comparisons were made between treatments for each time point within each intestinal section and statistically significant values marked by an asterisk (p < 0.05). (a–c) Relative pept2 mRNA expression in fed and unfed FHM proximal, middle, and distal intestines, respectively; (d–f) Relative pept2 mRNA expression in proximal, middle, and distal intestines, respectively, of FHMs fed either control or SWCNT diets.
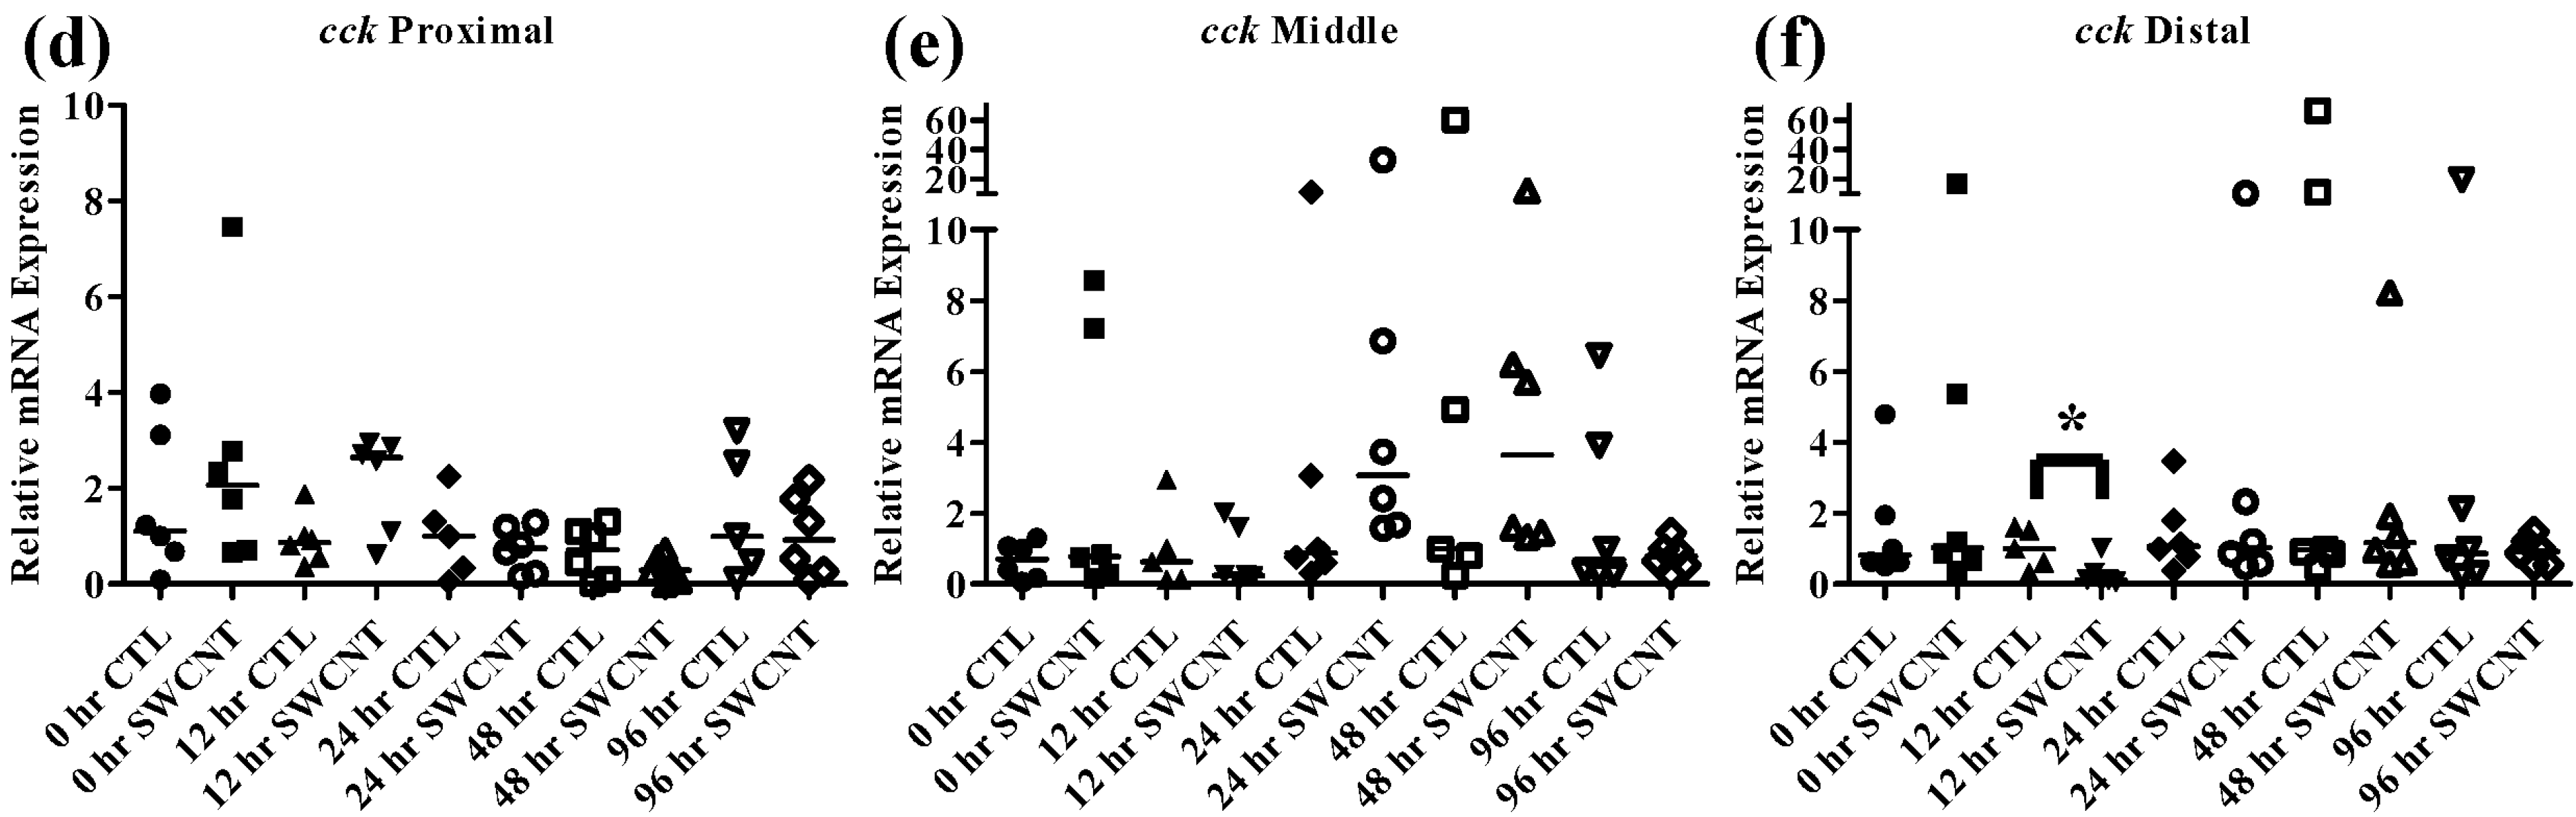
Figure 7.
Intestinal cck mRNA expression of fed, vs. unfed and control vs. SWCNT fed FHMs. Expression of total cck mRNA expression was measured in three intestinal sections of FHMs under differing experimental conditions. Expression of individual replicate fish are presented as relative to the corresponding control at that time point. Solid lines for each time point and treatment represents the median value. Statistical comparisons were made between treatments for each time point within each intestinal section and statistically significant values marked by an asterisk (p < 0.05). (a–c) Relative cck mRNA expression in fed and unfed FHM proximal, middle, and distal intestines, respectively; (d–f) Relative cck mRNA expression in proximal, middle, and distal intestines, respectively, of FHMs fed either control or SWCNT diet.
Lipoprotein lipase (
lpl) is an enzyme responsible for digestion of circulating lipids and though it is typically found in adipose and other tissues in mammals, fish exhibit
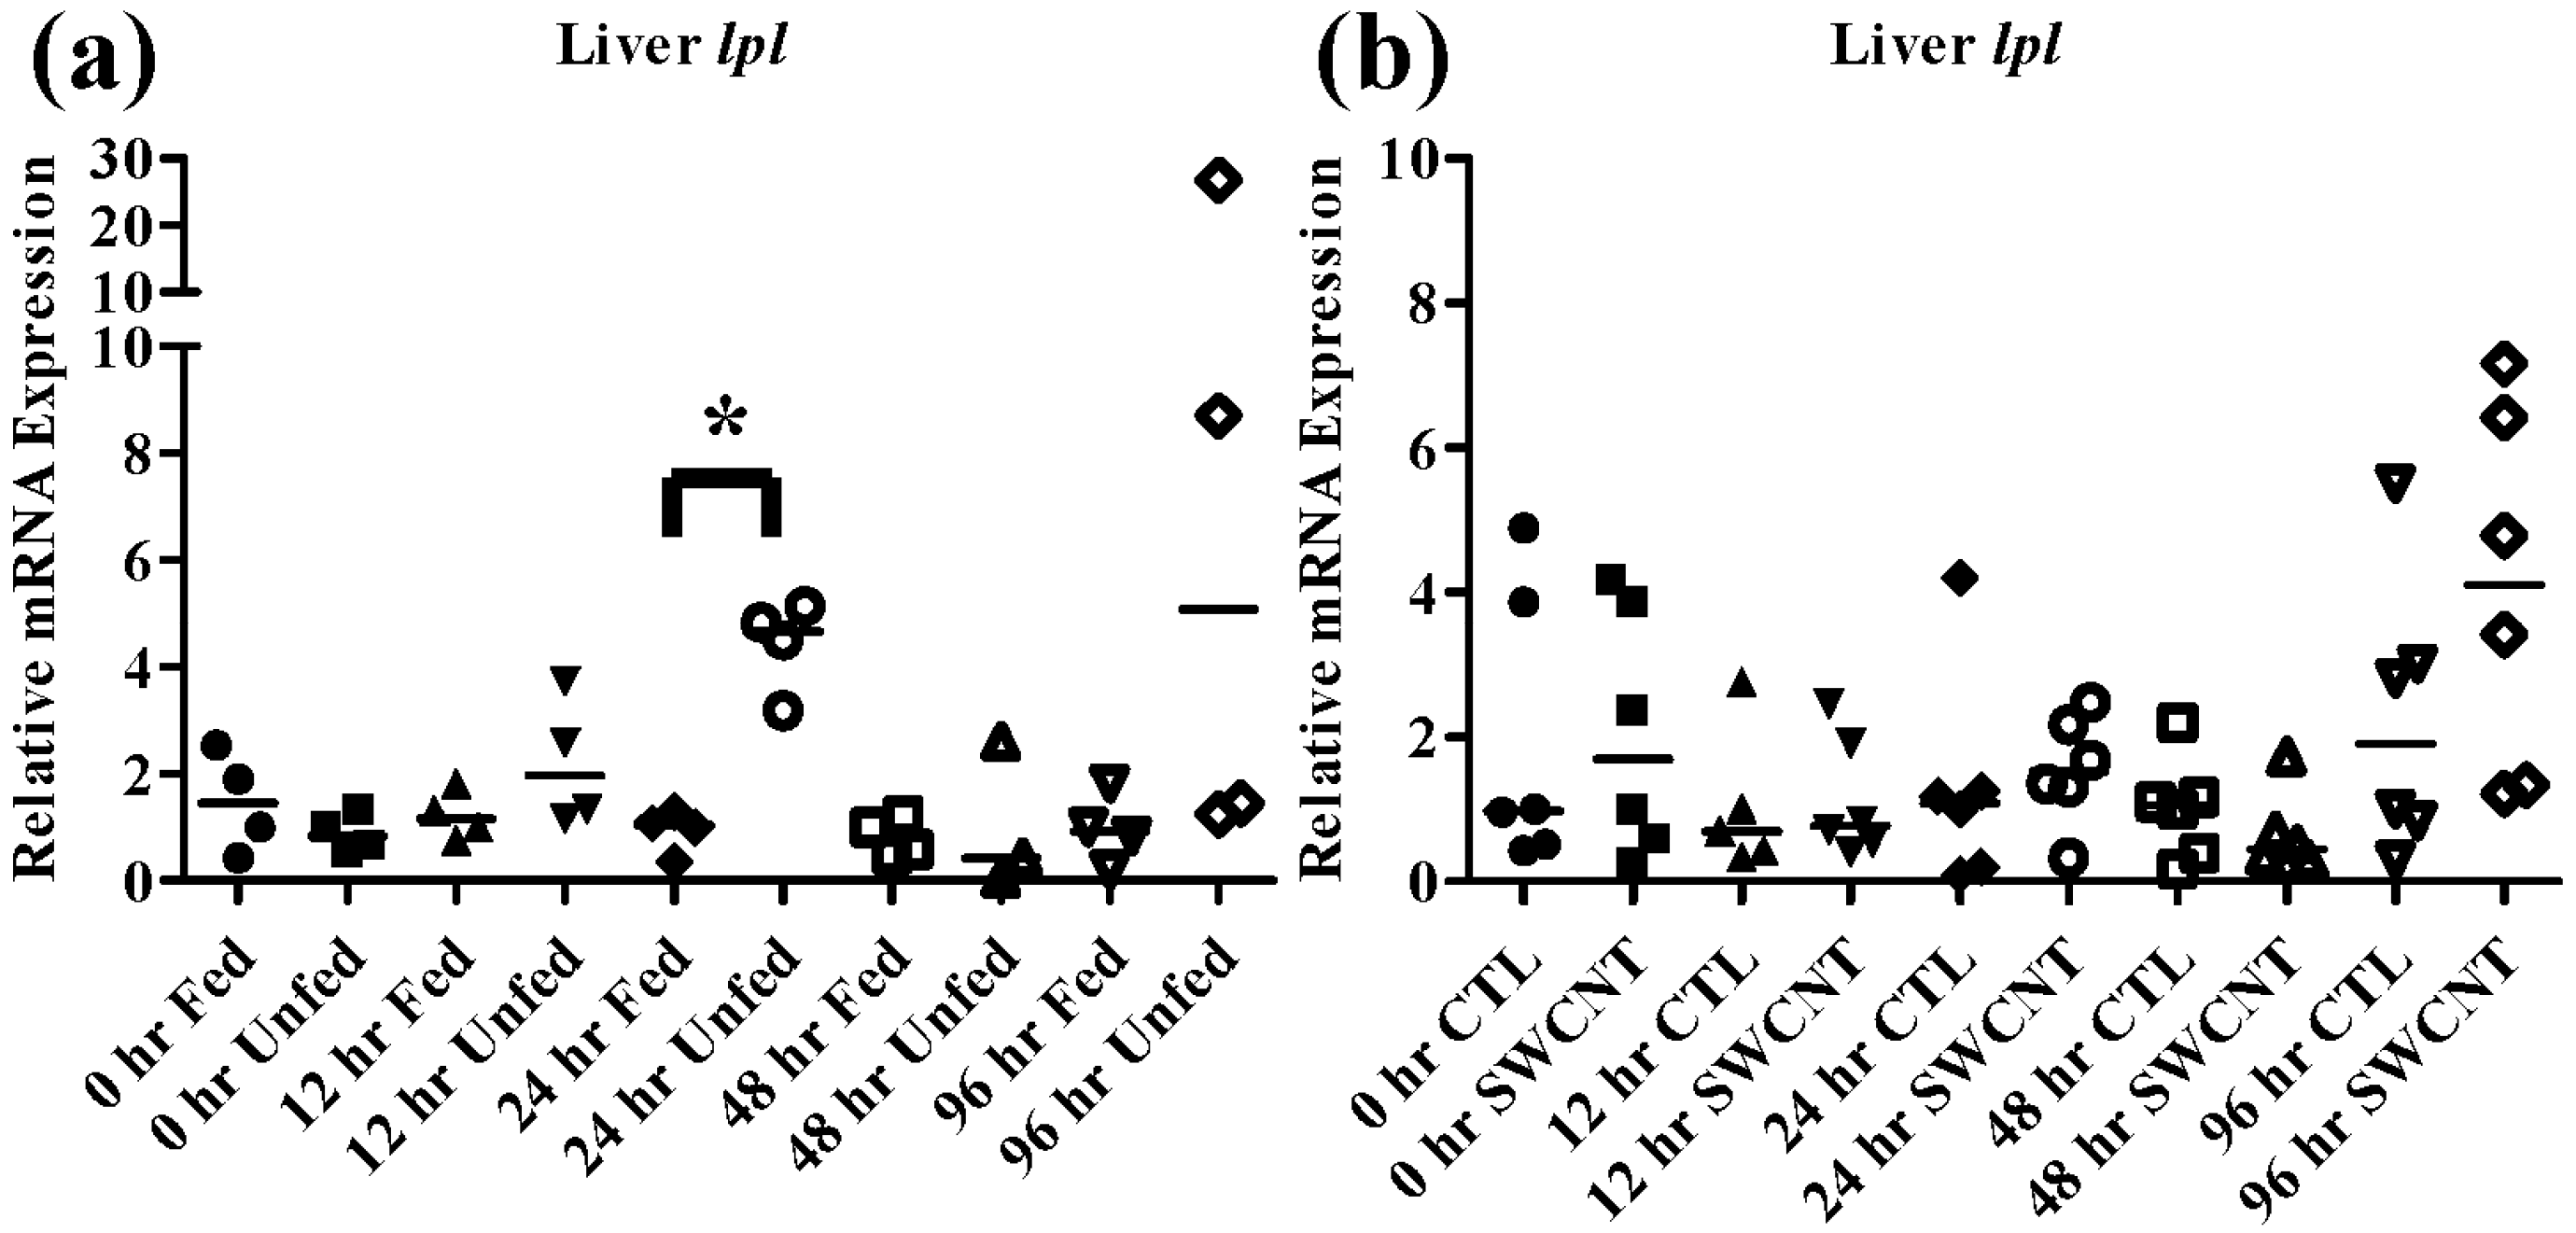
lpl expression and activity primarily in the liver. During periods of starvation expression of
lpl has been shown to increase as decreases in circulating insulin gives way for use of lipids as a primary energy source, which has been demonstrated in numerous fish species including red sea bream and tilapia [
23,
40]. In the current study FHMs that were starved for 96 h exhibited increased
lpl expression by 24 h, which returned to control levels by 48 h (
Figure 8a).
To determine whether interactions of SWCNTs and intestinal nutrients can cause nutrient depletion conditions in FHMs, fish were exposed to a SWCNT containing diet for 96 h and
pept1,
pept2, and
cck were measured in the proximal, middle, and distal intestines as well as
lpl being measured in livers. While the SWCNT diet did not impact
pept1 expression in any of the intestinal regions (
Figure 5d–f),
pept2 increased significantly at 12 h and 96 h in the proximal intestine (
Figure 6d–f). While this was quite different, and in fact opposite, from what was seen during starvation conditions, it does indicate that SWCNTs may be impacting the availability of nutrients in FHMs. Starved zebrafish have also been shown to exhibit increased expression of
pept2 which may be an indication of an attempt to increase nutrient uptake during periods of decreased nutrient availability [
35]. But the fact that
pept2 expression alternates between increased expression and basal expression levels highlight the transient nature of these peptide transporters in fish which have been shown to exhibit differential expression patterns depending on species and duration of starvation [
20,
33,
34,
35]. While a comprehensive explanation for this activity has not been elucidated it is possible that individual species have evolved different strategies to deal with times of decreased nutrient depletion.
Figure 8.
Liver lpl mRNA expression of fed, vs. unfed and control vs. SWCNT fed FHMs. Expression of lpl mRNA expression was measured in the livers of FHMs under different experimental conditions. Expression of individual replicate fish is presented relative to the corresponding control at that time point. Solid lines for each time point and treatment represents the median value. Statistical comparisons were made between treatments for each time point within each intestinal section and statistically significant values marked by an asterisk (p < 0.05). (a) Relative lpl mRNA expression in fed and unfed FHM livers; (b) Relative cck mRNA expression in livers of FHMs fed either control or SWCNT diets.
As discussed above,
cck has been shown to decrease during starvation periods, a response that has been shown to be conserved in numerous fish species [
20,
22,
36]. During exposure to SWCNTs, an identical response was observed in FHMs starved for 12 h, as expression of
cck in the distal intestine was significantly decreased (
Figure 7d–f). This may also indicate that FHMs were experiencing decreased nutrient availability and uptake due to interactions of SWCNTs with dietary nutrients. But expression of
lpl was not altered during SWCNT exposure, which could indicate preferential sorption of proteins in the diet or that a significant portion of lipids in the diet were still bioavailable.
Impacts on
pept1,
pept2,
cck, and
lpl from the fed
vs. unfed and SWCNT feeding studies are summarized in
Figure 9. Overall, starvation of FHMs causes similar responses in
pept1,
pept2,
cck, and
lpl expression as seen in a number of other fish species. It was hypothesized that SWCNT interactions with nutritional components in the FHM diet would cause similar responses to a fish lacking essential nutrients. While the presence of SWCNTs in the diet had no impact on
lpl and
pept1 expression they did cause impacts on expression of
pept2 and
cck. Interestingly, these impacts were seen in sections of the intestines where these genes are normally expressed at relatively low levels which may indicate that impacts of the SWCNTs are subtle and perhaps not significant enough to impact sections of the intestine that are primarily responsible for nutrient processing. Yet these results do represent a novel pathway through which SWCNT may indirectly cause sublethal toxicity in aquatic organisms even if the intestinal tract does not absorb them. Impaction of the intestines of
Daphnia magna by SWCNTs and MWCNTs has also been implicated as a mechanism through which these materials may alter an organism’s ability to efficiently absorb nutrients [
6,
26,
41]. But further studies are needed to consider the long-term phenotypical responses that subtle indirect effects of SWCNTs on nutrient processing may be impacting.
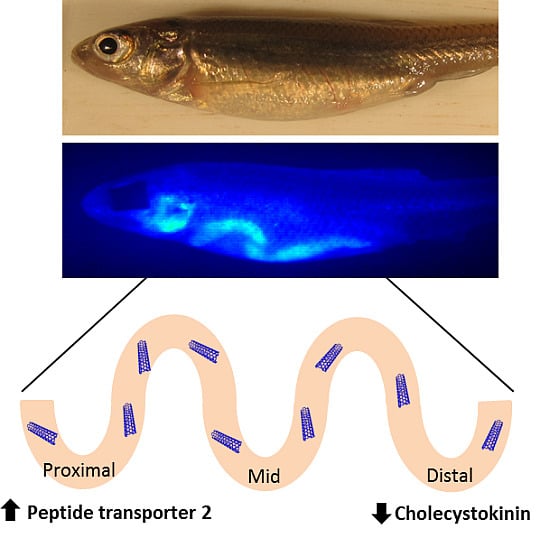
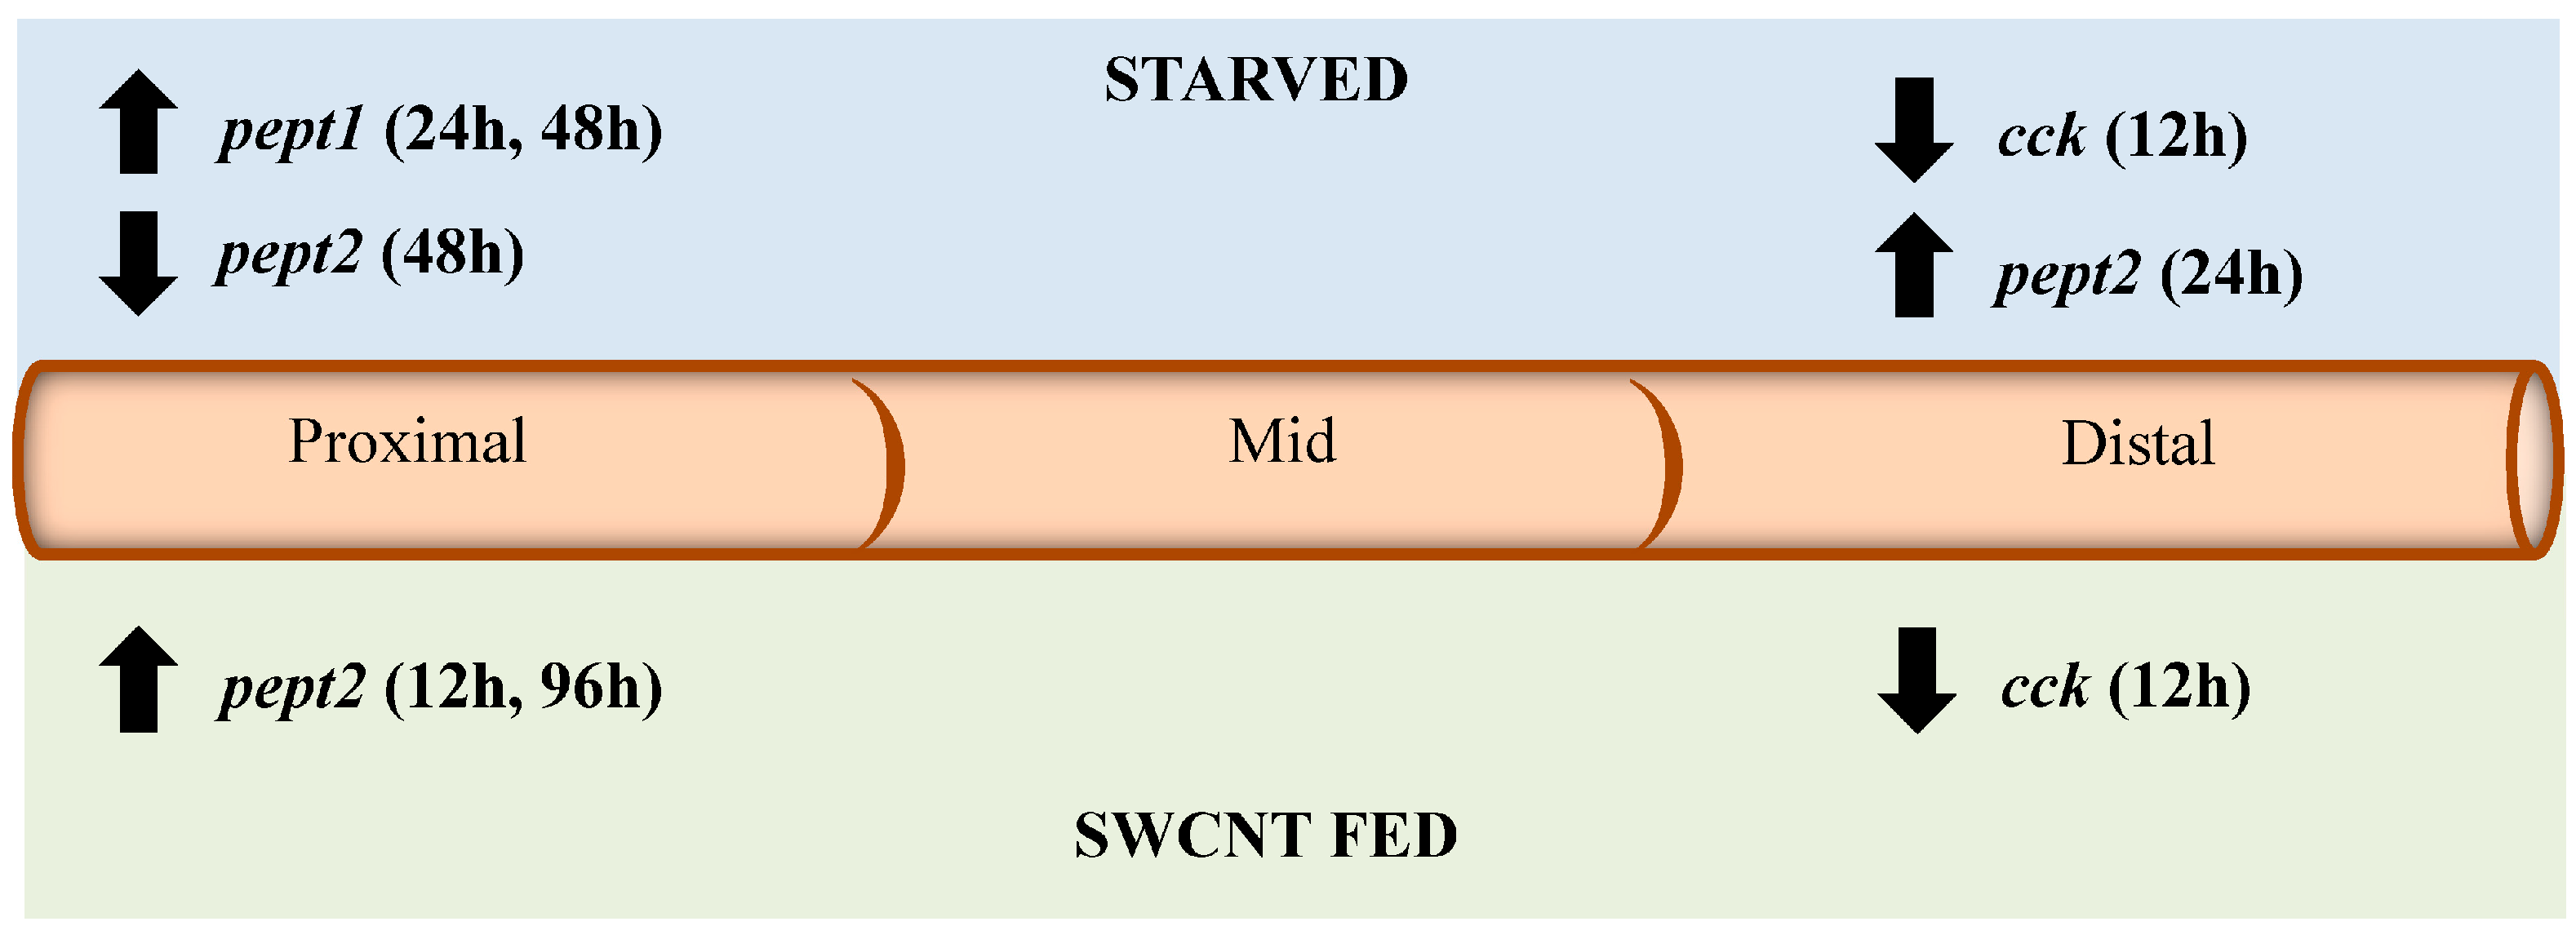
Figure 9.
Summary of impacts of starvation and SWCNT diet on pept1, pept2, cck, and lpl expression. The diagram shows the direction of expression (arrows) and time (in parenthesis) for each gene in the proximal, middle and distal sections of the intestine for both starved and SWCNT fed conditions.
Figure 9.
Summary of impacts of starvation and SWCNT diet on pept1, pept2, cck, and lpl expression. The diagram shows the direction of expression (arrows) and time (in parenthesis) for each gene in the proximal, middle and distal sections of the intestine for both starved and SWCNT fed conditions.


