Article

Dielectric Barrier Discharge (DBD) Plasma Assisted Synthesis of Ag2O Nanomaterials and Ag2O/RuO2 Nanocomposites

Plasma Applications Laboratory, Department of Chemical and Biological Engineering, Jeju National University, Jeju 690-756, Korea
*
Author to whom correspondence should be addressed.
Nanomaterials 2016, 6(3), 42; https://doi.org/10.3390/nano6030042
Submission received: 24 December 2015 / Revised: 17 February 2016 / Accepted: 22 February 2016 / Published: 26 February 2016
(This article belongs to the Special Issue Plasma Nanoengineering and Nanofabrication)

Abstract

:
Silver oxide, ruthenium oxide nanomaterials and its composites are widely used in a variety of applications. Plasma-mediated synthesis is one of the emerging technologies to prepare nanomaterials with desired physicochemical properties. In this study, dielectric barrier discharge (DBD) plasma was used to synthesize Ag2O and Ag2O/RuO2 nanocomposite materials. The prepared materials showed good crystallinity. The surface morphology of the Ag2O exhibited “garland-like” features, and it changed to “flower-like” and “leaf-like” at different NaOH concentrations. The Ag2O/RuO2 composite showed mixed structures of aggregated Ag2O and sheet-like RuO2. Mechanisms governing the material’s growth under atmospheric pressure plasma were proposed. Chemical analysis was performed using Fourier transform infrared spectroscopy (FTIR) and X-ray photoelectron spectroscopy (XPS). Thermogravimetric analysis (TGA) showed the thermal decomposition behavior and the oxygen release pattern.

Graphical Abstract

1. Introduction

Silver oxide nanomaterials (Ag2O NMs) are widely used in catalysis [1,2], sensors [3], preparation of antimicrobial materials [4], drinking water-related applications [5], etc. It is an intrinsic p-type semiconductor with a band gap of around 1.5 eV. On account of its high catalytic activity under mild reaction condition, usage of Ag2O NMs is rapidly increasing in many chemical reactions. The efficiency of a material in an application can further be improved when it is mixed with other materials. Such carefully selected nanocomposite materials (two or more metallic or metal oxide structures having the dimension of nanoscale) having excellent individual properties exhibit new and unique characteristics without affecting each other. For example, Lee et al. [6] have documented that Ag2O/RuO2 composite exhibits higher capacitance as compared to its individual performances. Ruthenium (IV) oxide (RuO2) itself is an excellent candidate material for catalysis, field emission displays, fuel cells and supercapacitor applications [6,7,8]. There are varieties of methods such as wet chemical [9], biological [10], thermal deposition [11], thin film-based and recently plasma-mediated routes [12,13,14,15,16,17] to prepare nanomaterials are currently used. The main advantage of applying plasma-based techniques to synthesize nanomaterials is the possibility of controlling the growth, surface chemistry and surface morphology. For instance, plasma-mediated synthesis does not require stabilizer molecules to prevent the aggregation (steric stabilization) which is commonly encountered in wet chemical synthesis. This is because the growth of material and the control of aggregation are entirely driven by the physical properties such as electrostatic repulsion, electric potential and conductivity (both electrical and thermal) [18]. The surface chemistry (metallic and oxide formations) is mostly decided by the composition of the feed gas used for the generation of plasma. Depending on the gas composition, the density of the active species such as electrons, ions and radicals vary and its interaction with the nucleating particles decides the chemical nature of the surface. The drawbacks of plasma techniques may be electrical safety of high voltage systems and difficulty in mass production.
Unlike other vacuum-based (for example, chemical vapor deposition (CVD), plasma enhanced CVD, etc.) or high-temperature plasma techniques, the dielectric barrier discharge (DBD) plasma-based method is non-thermal in nature, works at atmospheric pressure, and can operate at relatively low energy input, which facilitates the production of nanomaterials with unique structural features [8]. In addition, the construction of DBD plasma reactor is relatively easier than any other plasma techniques and the DBD plasma gives reproducible results. In our previous reports [8,14], RuO2 NMs were synthesized in a DBD plasma reactor, and it was found that the gas composition and the substrate materials used for the growth of NMs played main roles in determining the morphology of the NMs. To our knowledge, the investigation on the growth of composite materials having two different physicochemical properties in the presence of atmospheric pressure plasma is scarce in the literature [18,19]. With this background, this work deals with the syntheses of Ag2O NMs and Ag2O/RuO2 nanocomposite materials in the presence of DBD plasma. Investigation on the surface morphological control, growth mechanism and surface chemical analyses of the plasma-assisted materials would help to understand the importance of this method. The Ag2O/RuO2 composite material was chosen based on its potential environmental applications.

2. Results and Discussion

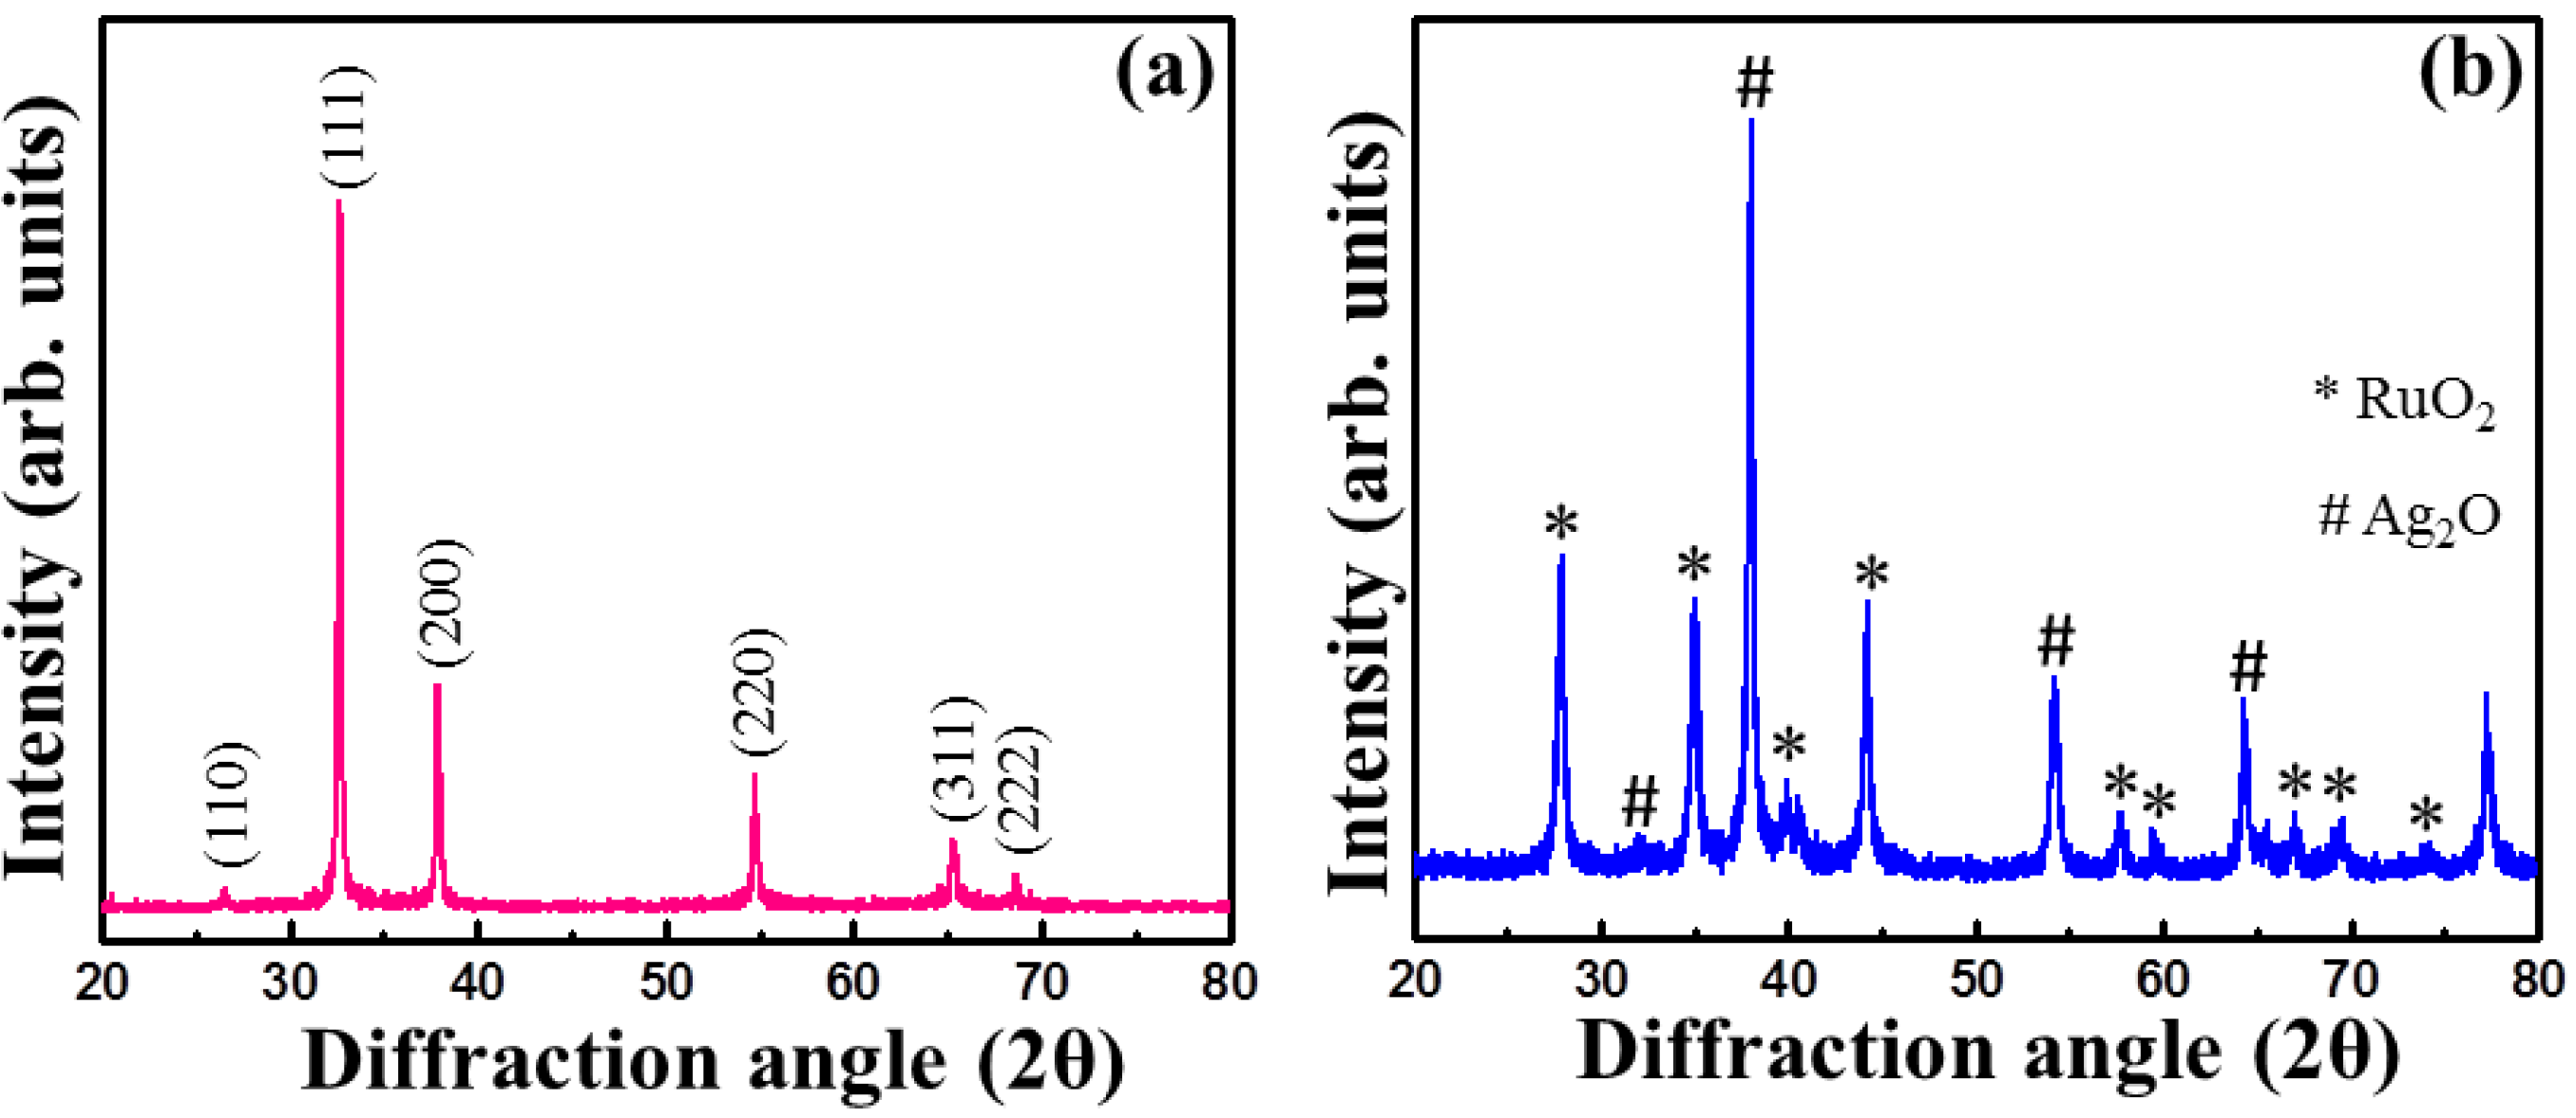
2.1. X-Ray Diffraction Study for Structural Analysis

The X-ray diffraction (XRD) spectrum of Ag2O NMs is given in Figure 1a. The peaks observed at the diffraction angle (2θ) 26.5°, 32.75°, 37.9°, 54.8°, 65.3° and 68.7° correspond to (110), (111), (200), (220), (311) and (222) set of lattice planes (cubic structure), respectively [JCPDS card No. 76-1393]. The spectrum did not contain any peaks corresponding to impurities or metallic forms, thus showing the Ag2O NMs of high purity [20]. The high intense peak (111) may refer to the arrangement of lattice atoms in an ordered structural fashion. The XRD spectra in Figure 1b shows the pattern corresponding to Ag2O/RuO2 nanocomposite, in which the Miller indices representing Ag2O and RuO2 are marked with (#) and (*). Slight shift in the diffraction peak (200), (220) and (311) of Ag2O was noted at the 2θ angle 38.21°, 54.26° and 64.5°, respectively. This kind of shift (decrease or increase) in the diffraction angle results from the difference between Ag2O and RuO2 lattice constants and lattice strain [21]. Moreover, the intensity of (111) peak decreased to a great extent and (200) increased, which may indicate a structural change (especially it may be due to the morphology, since the XRD peak intensity is closely connected with crystal morphology [22]). In comparison, the peaks corresponding to rutile type RuO2 were clearly observed without any shift [9].

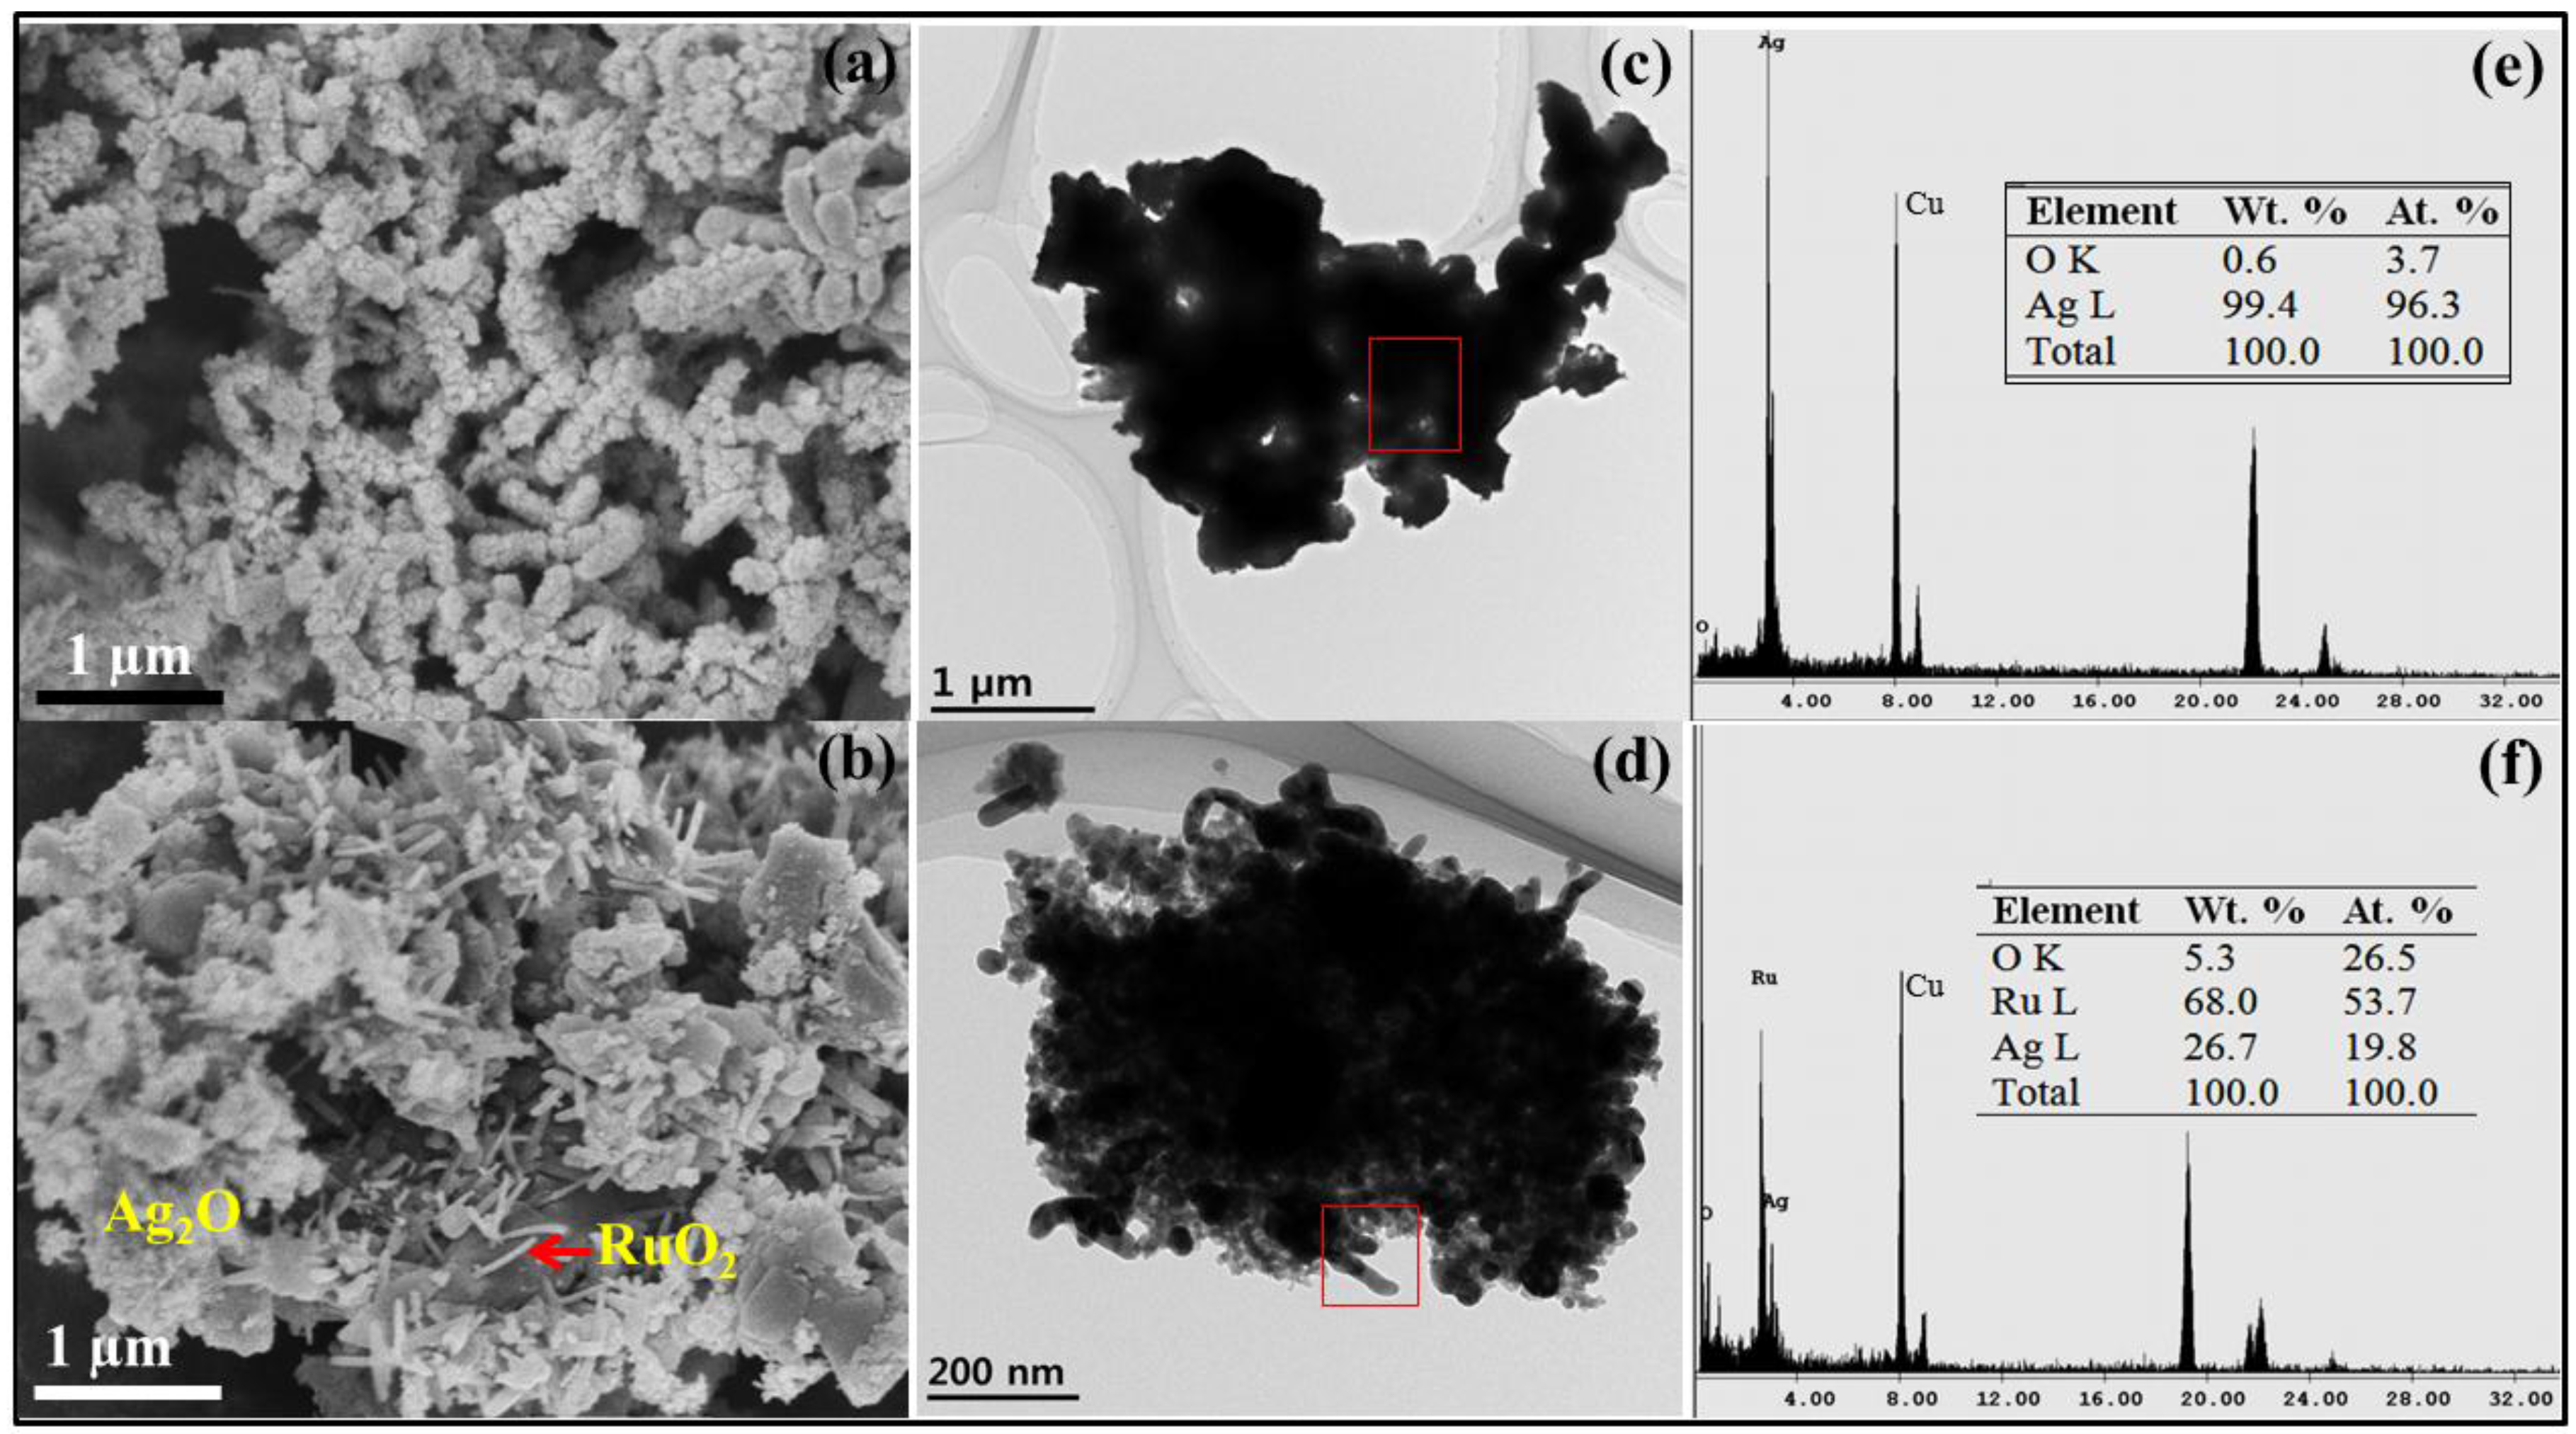
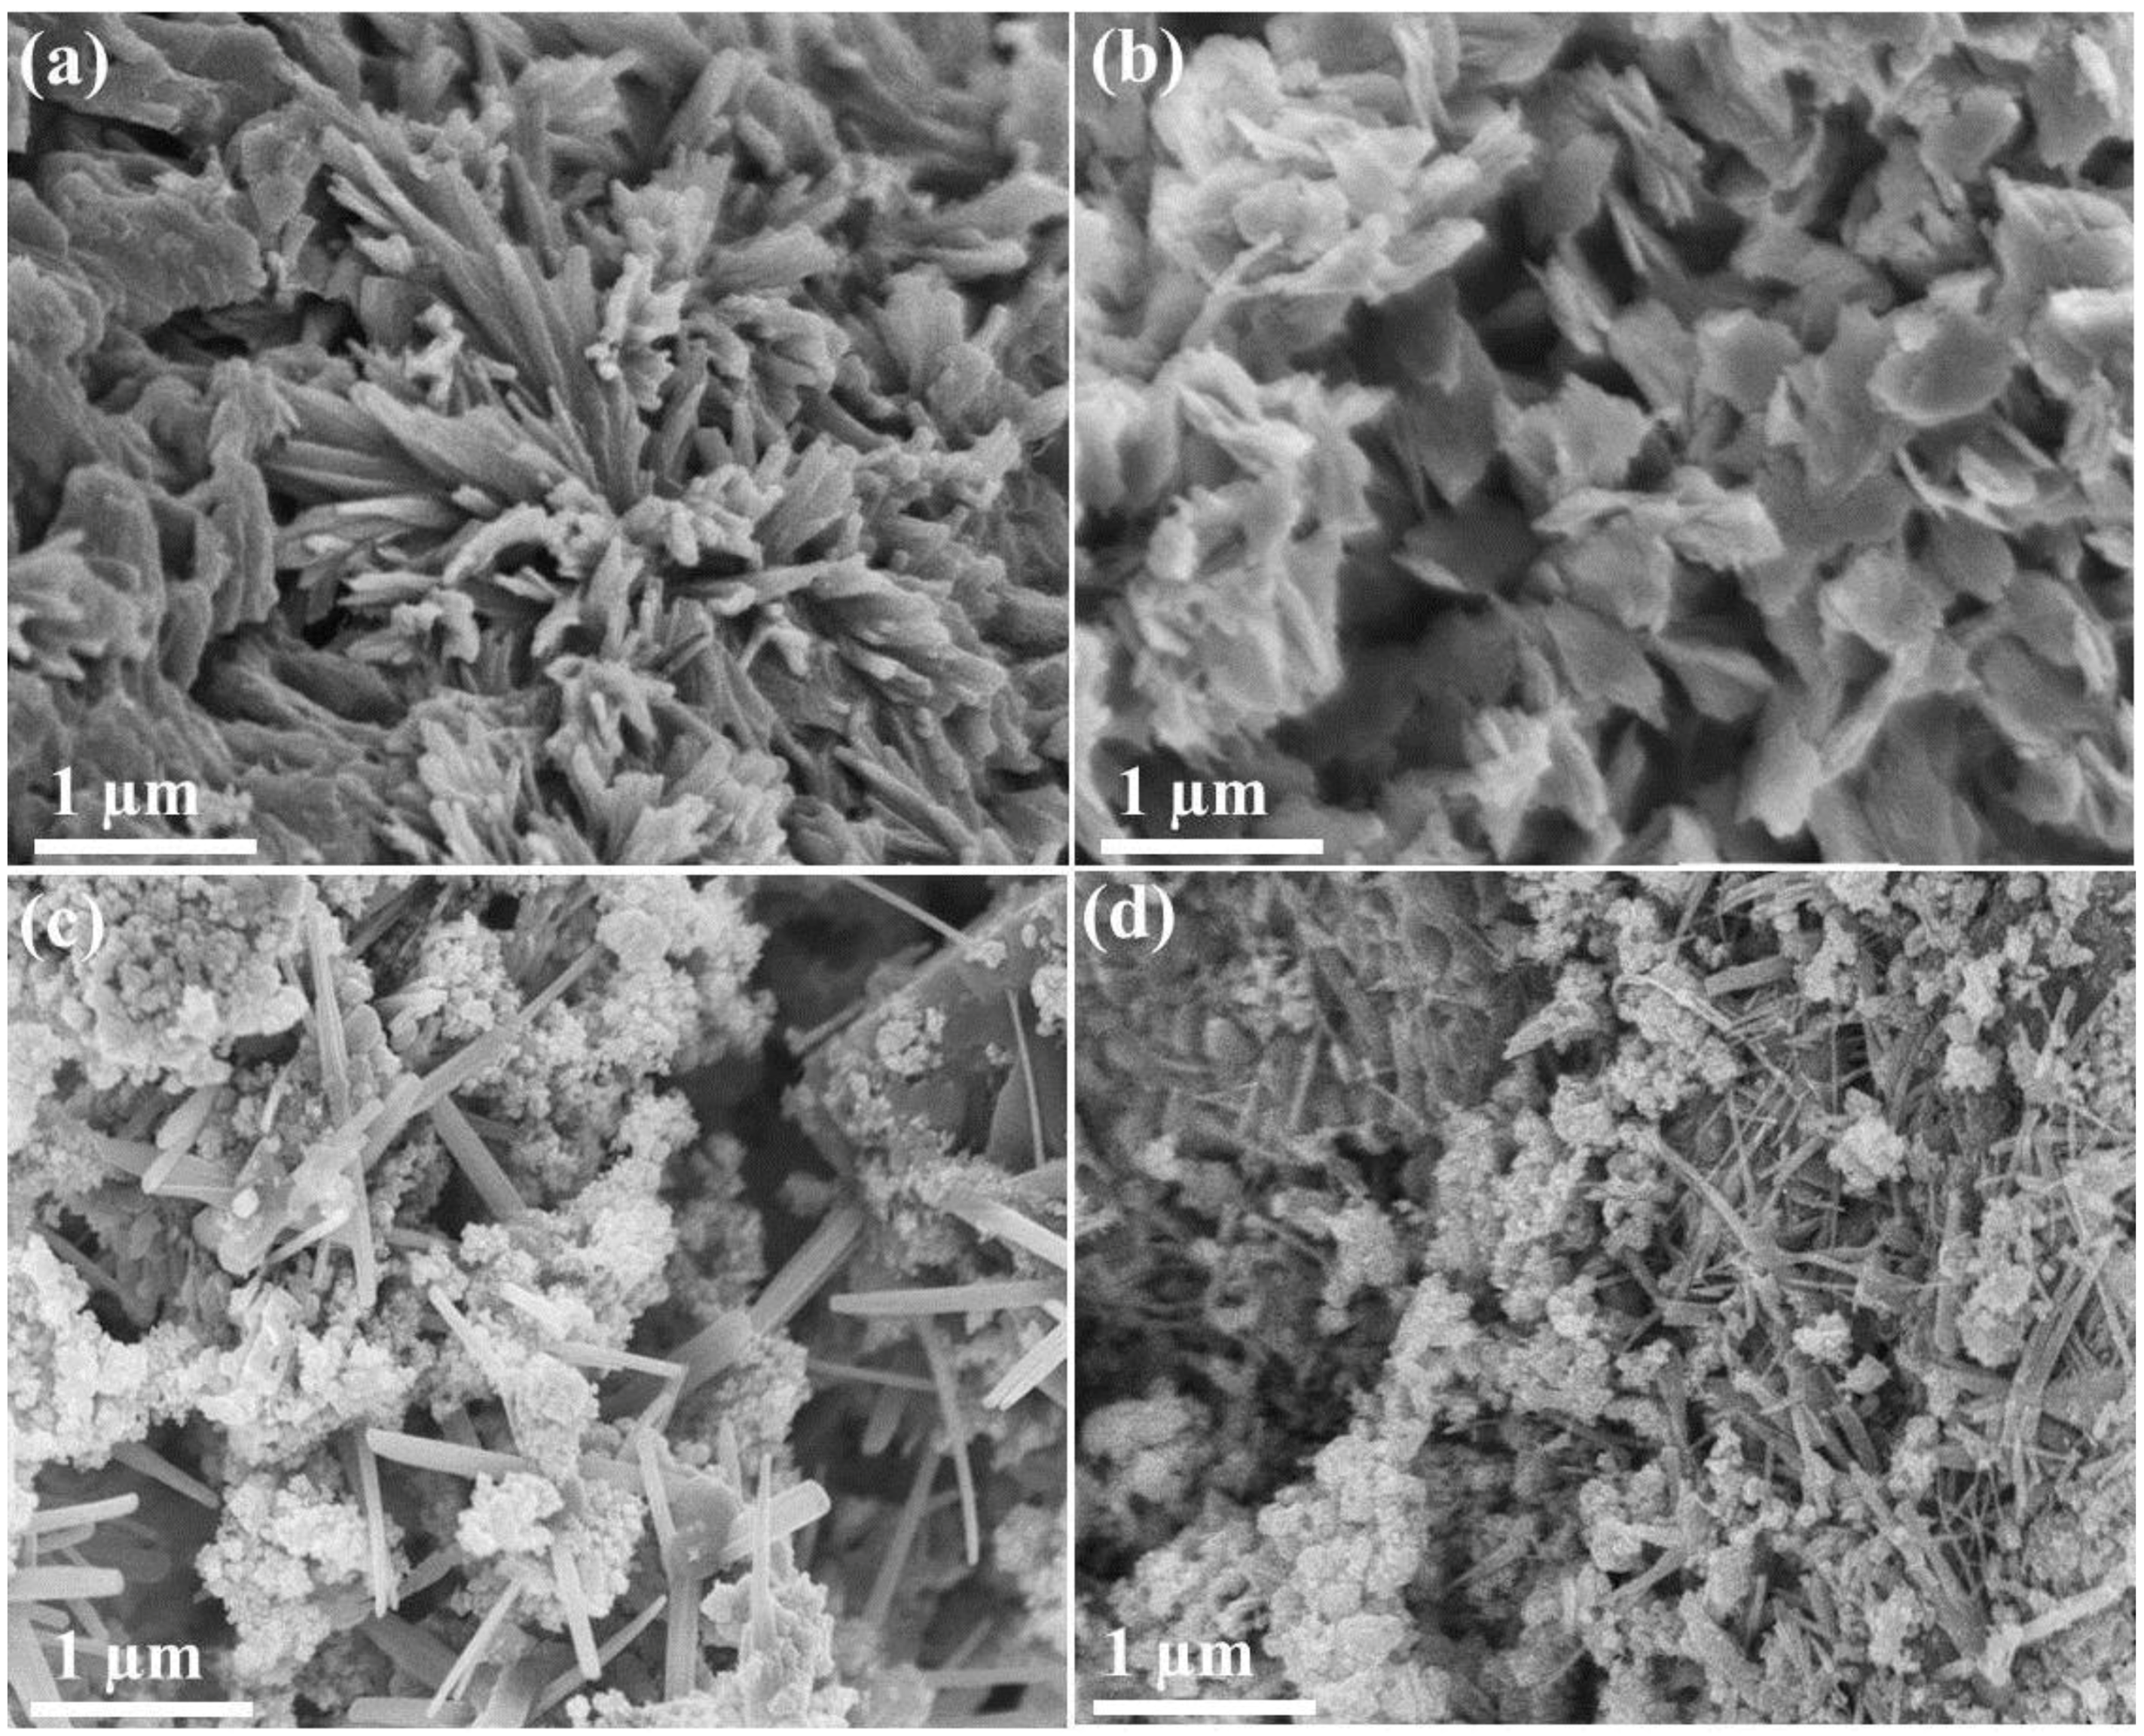
2.2. Surface Morphology and Elemental Analysis

Figure 2a,b show the field emission scanning electron microscope (FESEM) surface morphological images of the plasma-synthesized Ag2O and Ag2O/RuO2 nanocomposite powders, respectively. The Ag2O NMs exhibited bundles of spherical nanoparticles (with particle diameter < 50 nm) whereas the Ag2O/RuO2 composite showed the mixed structures of RuO2 nanosheet and aggregated Ag2O. The high resolution transmission electron microscope (TEM) images also confirmed the above observation (Figure 2c,d). The elemental composition (atomic percentage) measured by energy dispersive X-ray spectroscopy (EDX) (Figure 2e) for Ag2O consisted mainly of Ag (96.3%) and O (3.7%). The peaks corresponding to Ag2O/RuO2 nanocomposite consisted of Ag (19.8%), Ru (53.7%) and O (26.5%) (Figure 2f). The other peaks found in the spectrum refer to copper and carbon of the TEM grid. For information, the EDX analysis gives the information on the elements present in the given sample, but the exact content of each element in the sample cannot be determined by this technique because the elemental composition depends largely on the scan area.

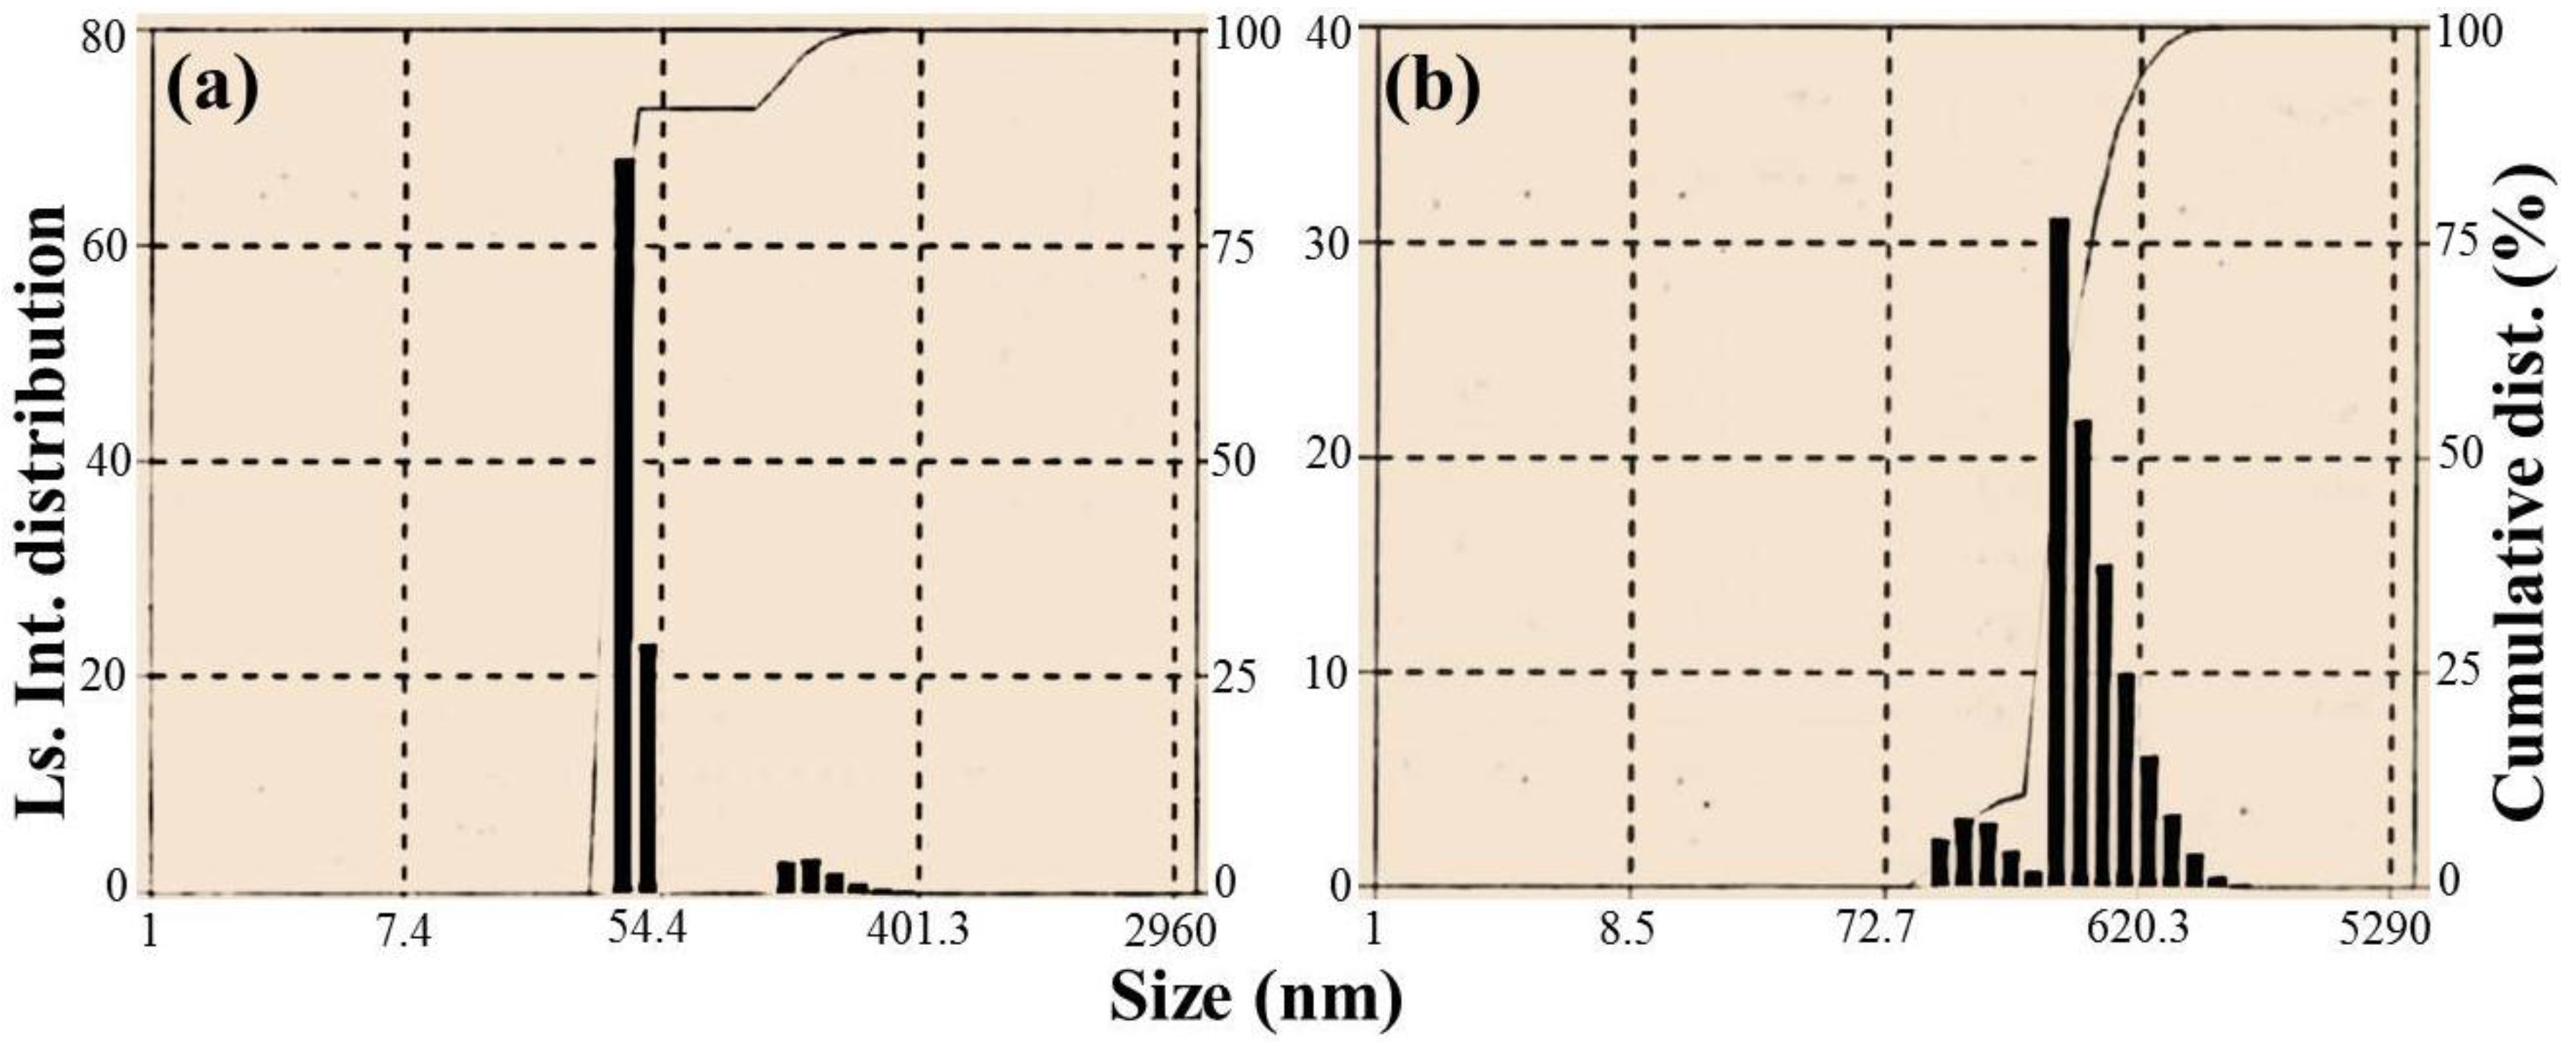
2.3. Particle Size Analysis

From particle size analysis, size distribution of nanomaterials in an aqueous media can be obtained. This property is of particular importance, considering the applications such as photocatalysis, anti-microbial studies, etc. Particles of different size exert different Brownian motion in solution, and thus, when the particles are illuminated by a beam of light, the scattered light fluctuates in response to the individual particles. This fluctuation is monitored and using photon detection method, the particle size distribution is obtained. Particle size analyses were performed for Ag2O and Ag2O/RuO2 nanocomposite, and the results are shown in Figure 3 where the size (nm) of the nanomaterials versus light scattering distribution (probability) along with the cumulative distribution is represented. The cumulative distribution refers to the probability that the particle size is less than or equal to a particular size, i.e., accumulated probability up to a particular size. The average hydrodynamic diameters (Stokes diameter) of Ag2O and Ag2O/RuO2 were found to be 44.2 and 485 nm, respectively. Since the Ag2O NMs showed uniform growth and morphology, more number of particles was observed within 100 nm range. The particles with larger size, especially in Ag2O/RuO2 composite may reflect the RuO2 length. Besides, the Ag2O NMs did not grow uniformly and exhibited more aggregation in the composite, resulting in bigger size distribution. Average size of the Ag2O and Ag2O/RuO2 nanocomposite obtained from the particle size analysis agreed well with the morphological features obtained by FESEM.

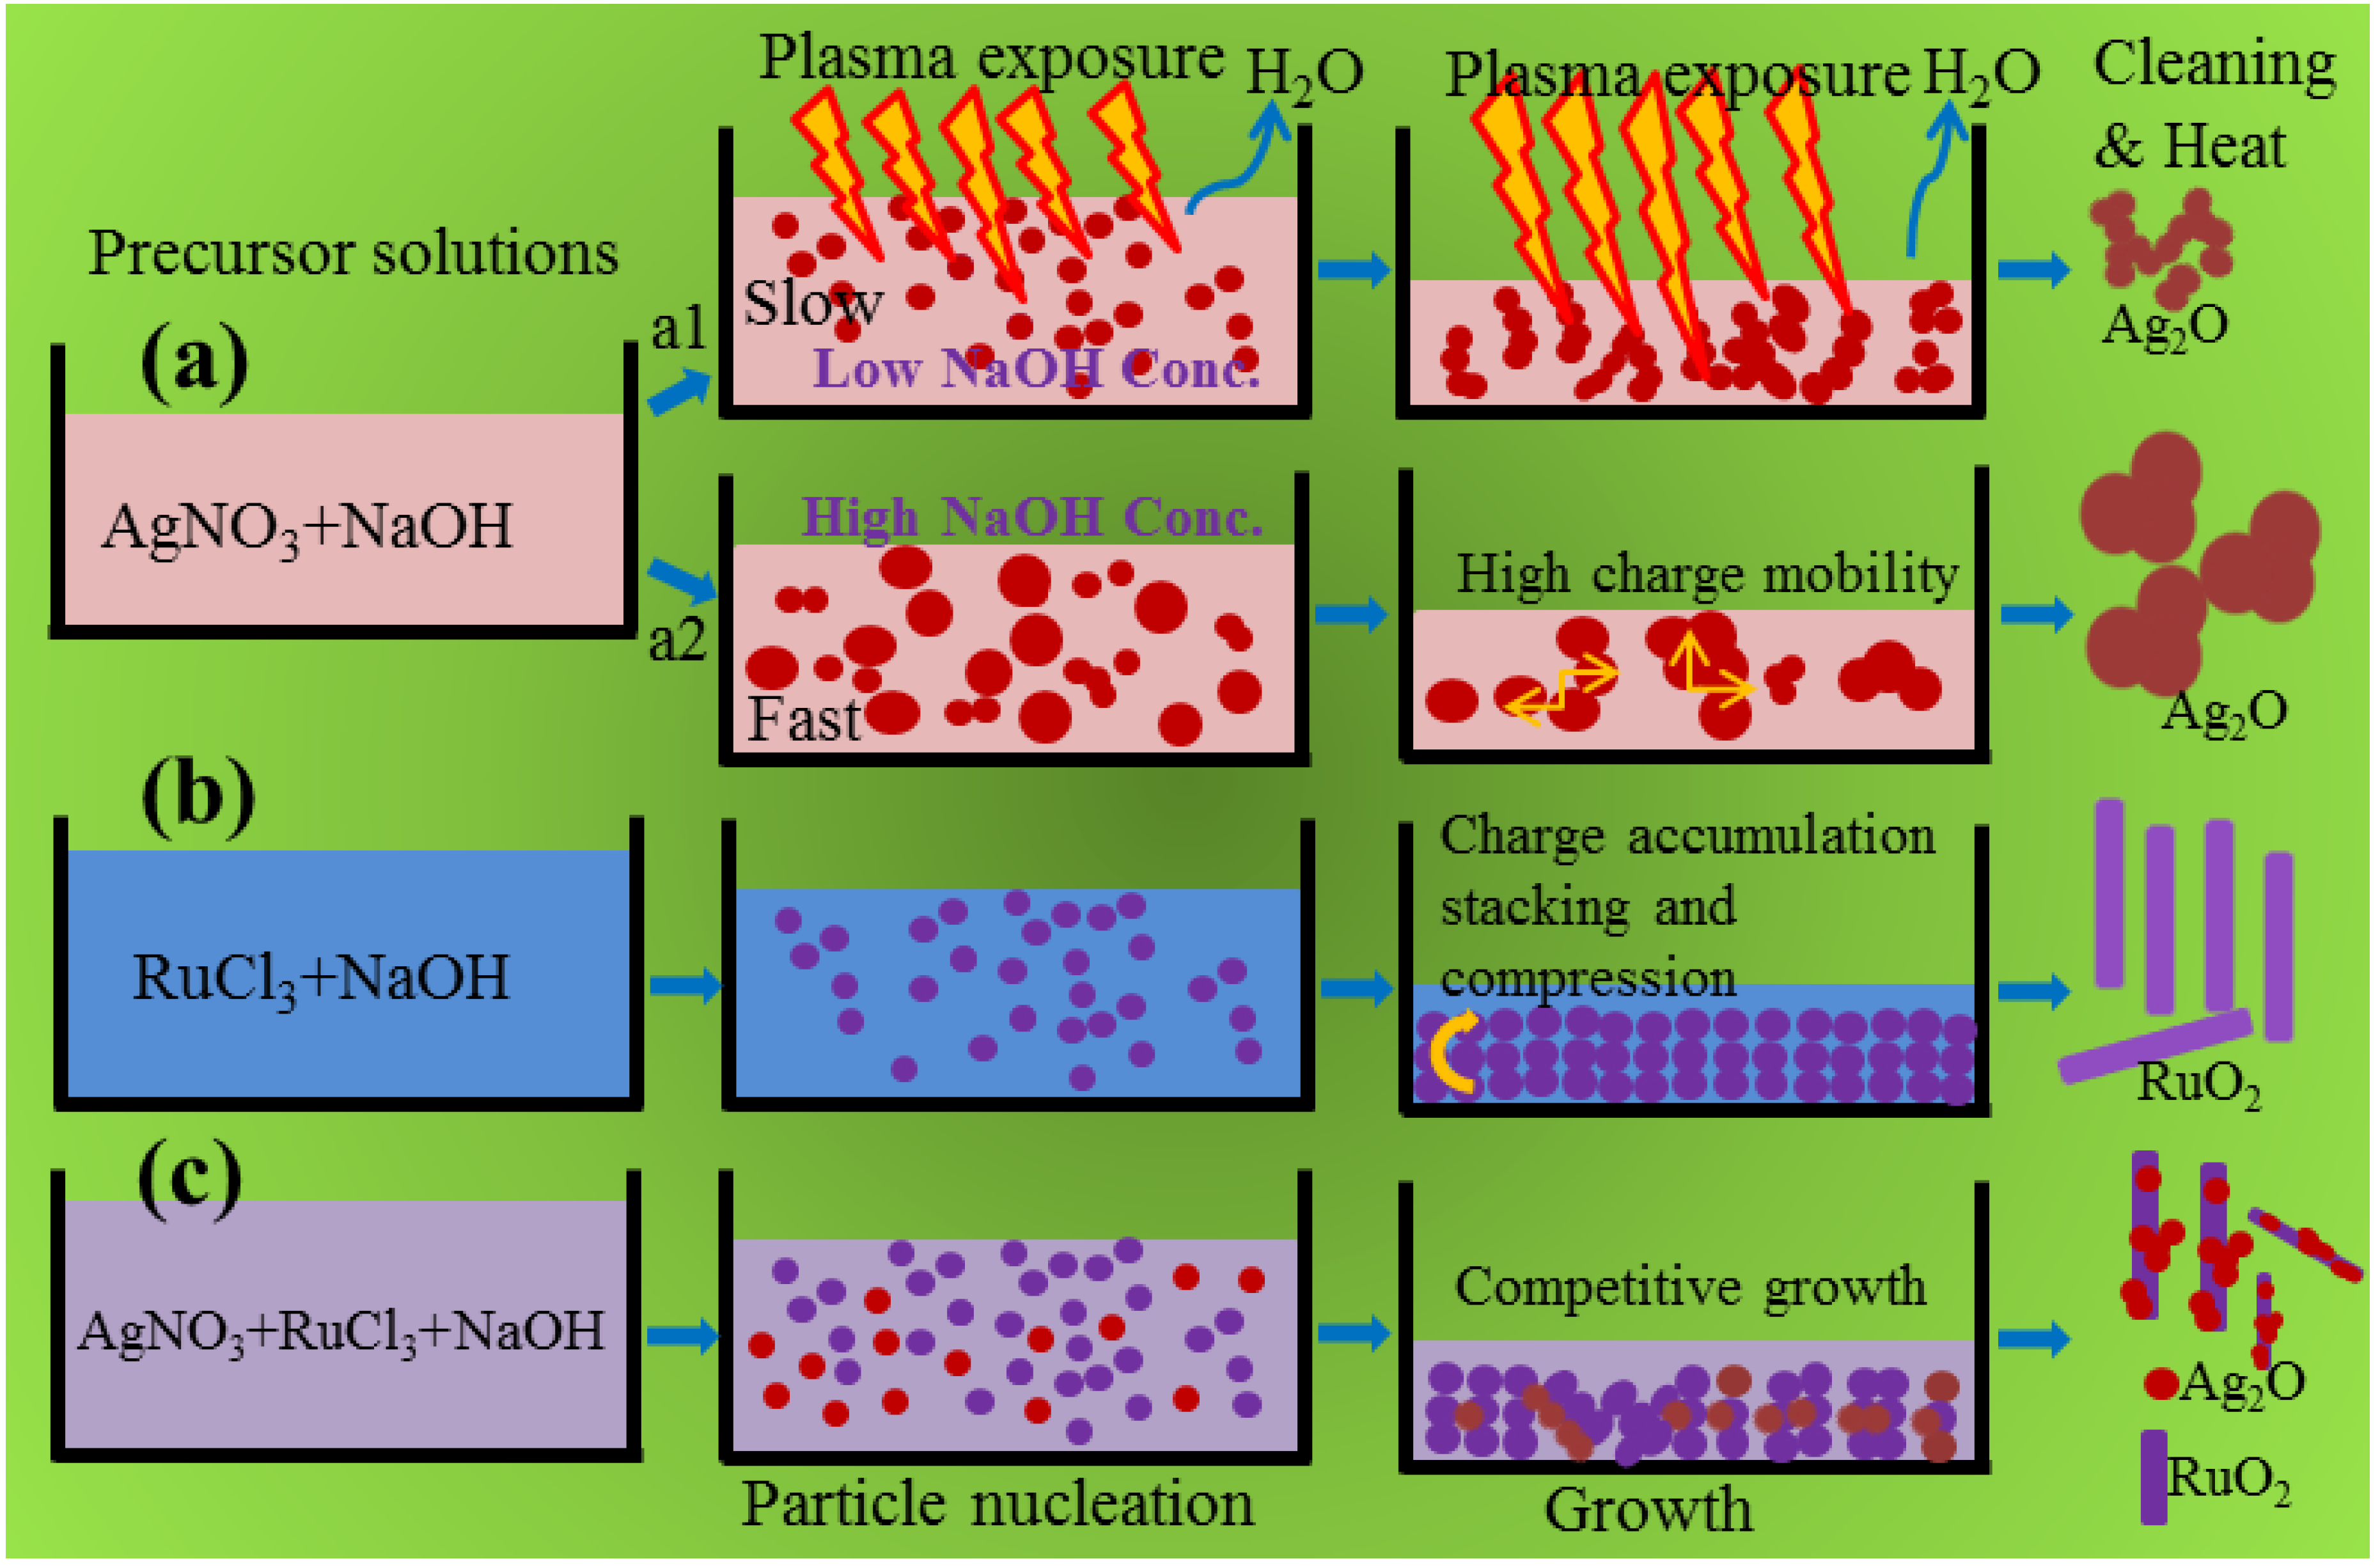
2.4. Effect of NaOH Concentration on the Morphology and Growth Mechanism

In the previous study [18], it has been reported that materials having higher electrical and thermal conductivities (for example, CuO) usually produce spherical particles in the presence of DBD plasma. Initially, supersaturation of the solution is attained as a result of the evaporation of water due to the heat generated by plasma. Then the accumulation of charged species on the surface of the growing particles favors the growth towards the oppositely charged electrode. Since the incoming electrons are highly mobile on the entire surface of the nucleated Ag2O species (Ag2O and CuO band gap values are almost similar, and thus the Ag2O follows similar growth pattern to CuO NMs), the alternating voltage does not produce any structural growth specifically. This is schematically proposed in Figure 4a (a1). In such cases, changing the NaOH concentration (pH increase) would be an alternative rather than altering the plasma parameters. Once the supersaturation is attained, the growth speed (slow or fast) of the nucleated particles may depend on the NaOH concentration. If the NaOH concentration is increased, attainment of zero charge molecules and formation of hydrated hydroxides starts earlier due to more OH ions from NaOH, which may result in bigger particles of different morphologies (Figure 4a (a2)). The mechanism was found suitable by observing the FESEM surface morphology of the Ag2O NMs obtained with 0.75 and 1.0 M NaOH concentrations, respectively (Figure 5a,b). When the concentration of NaOH was increased from 0.75 to 1.0 M, the length and thickness of the particles also increased, resulting in a flower-like and leaf-like morphology, respectively. On the other hand, the synthesis of RuO2 NMs (band gap of about 2.5 eV) by DBD plasma resulted in one dimensional structure such as nanosheets (see Figure S1b in Supplementary Materials) due to the potential gradient inside the reactor [15]. Accumulation of static electric charges results in the stacking and compression of the nucleated particles in response to the created electric potential, leading to sheet-like structures (Figure 4b). On the other hand, the length of the RuO2 nanosheet and the aggregation behavior of Ag2O were influenced to a great extent in the Ag2O/RuO2 nanocomposite when increasing the NaOH concentration (Figure 4c and Figure 5c,d). The nanocomposite exhibits mixed structures due to the competition between the nucleation and growth of the starting materials (one particle growth may suppress or hinder the other). It is learnt that the uniform growth with specific morphological features could be obtained if the NMs are prepared separately.

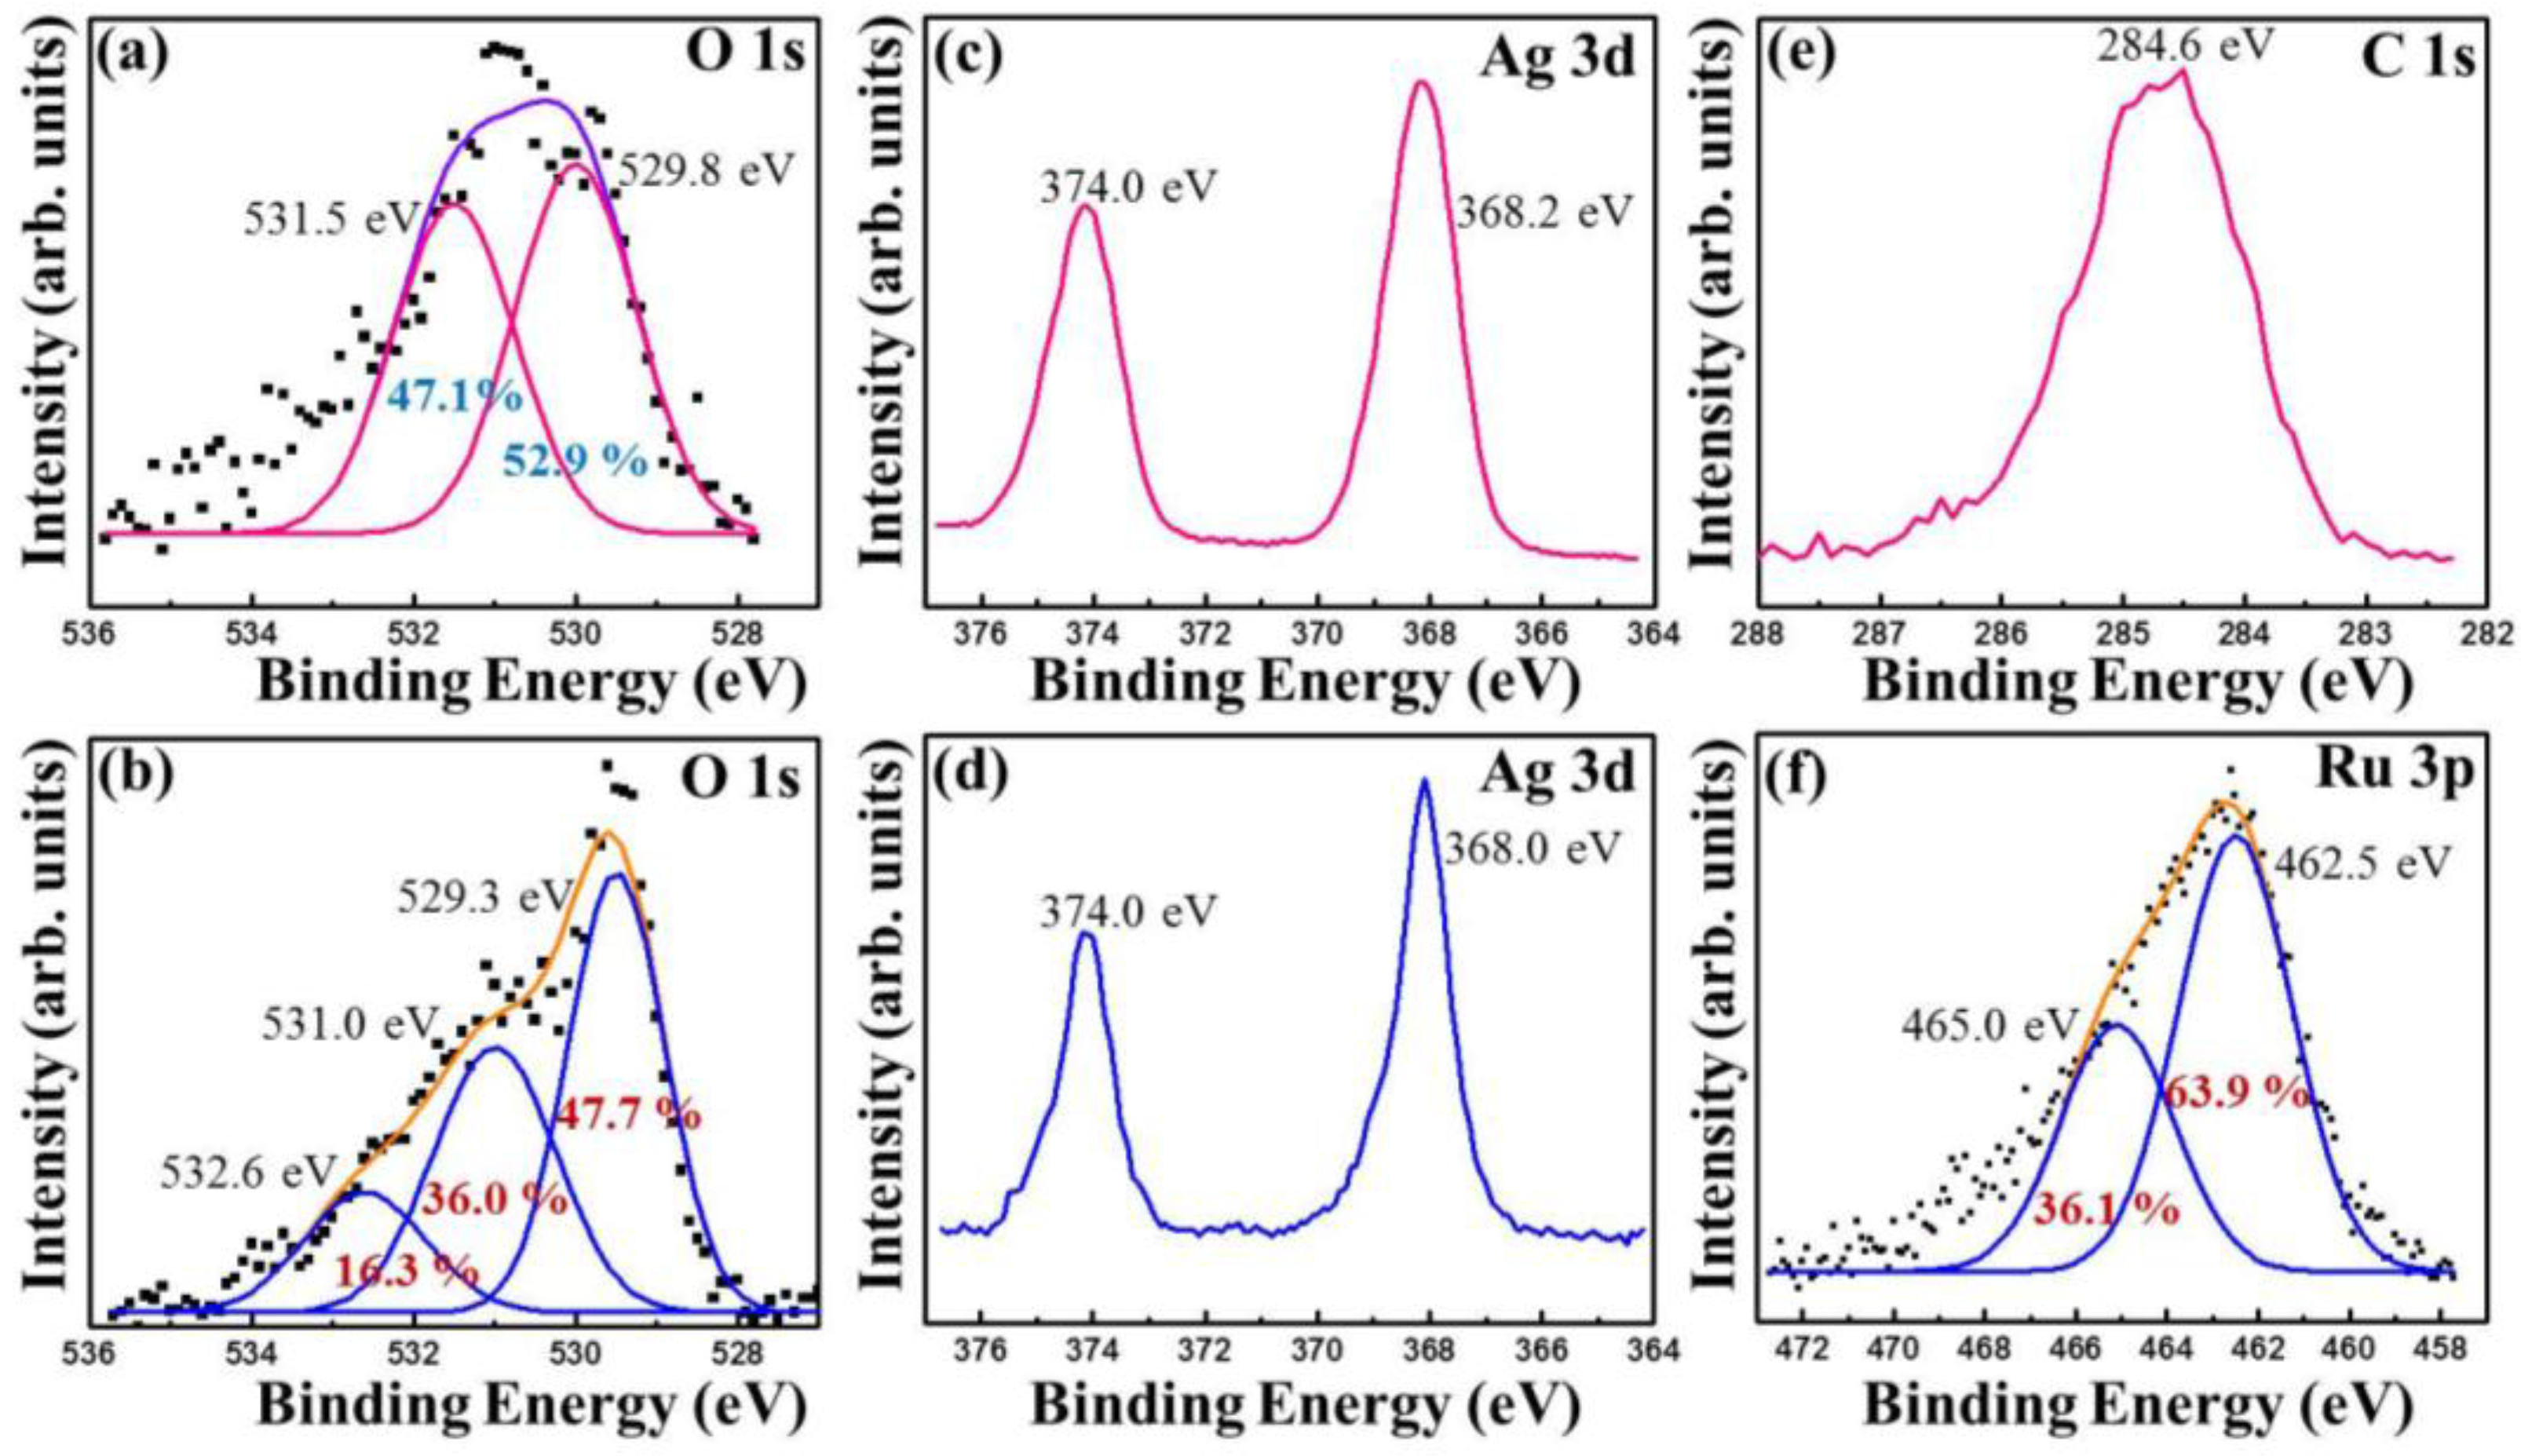
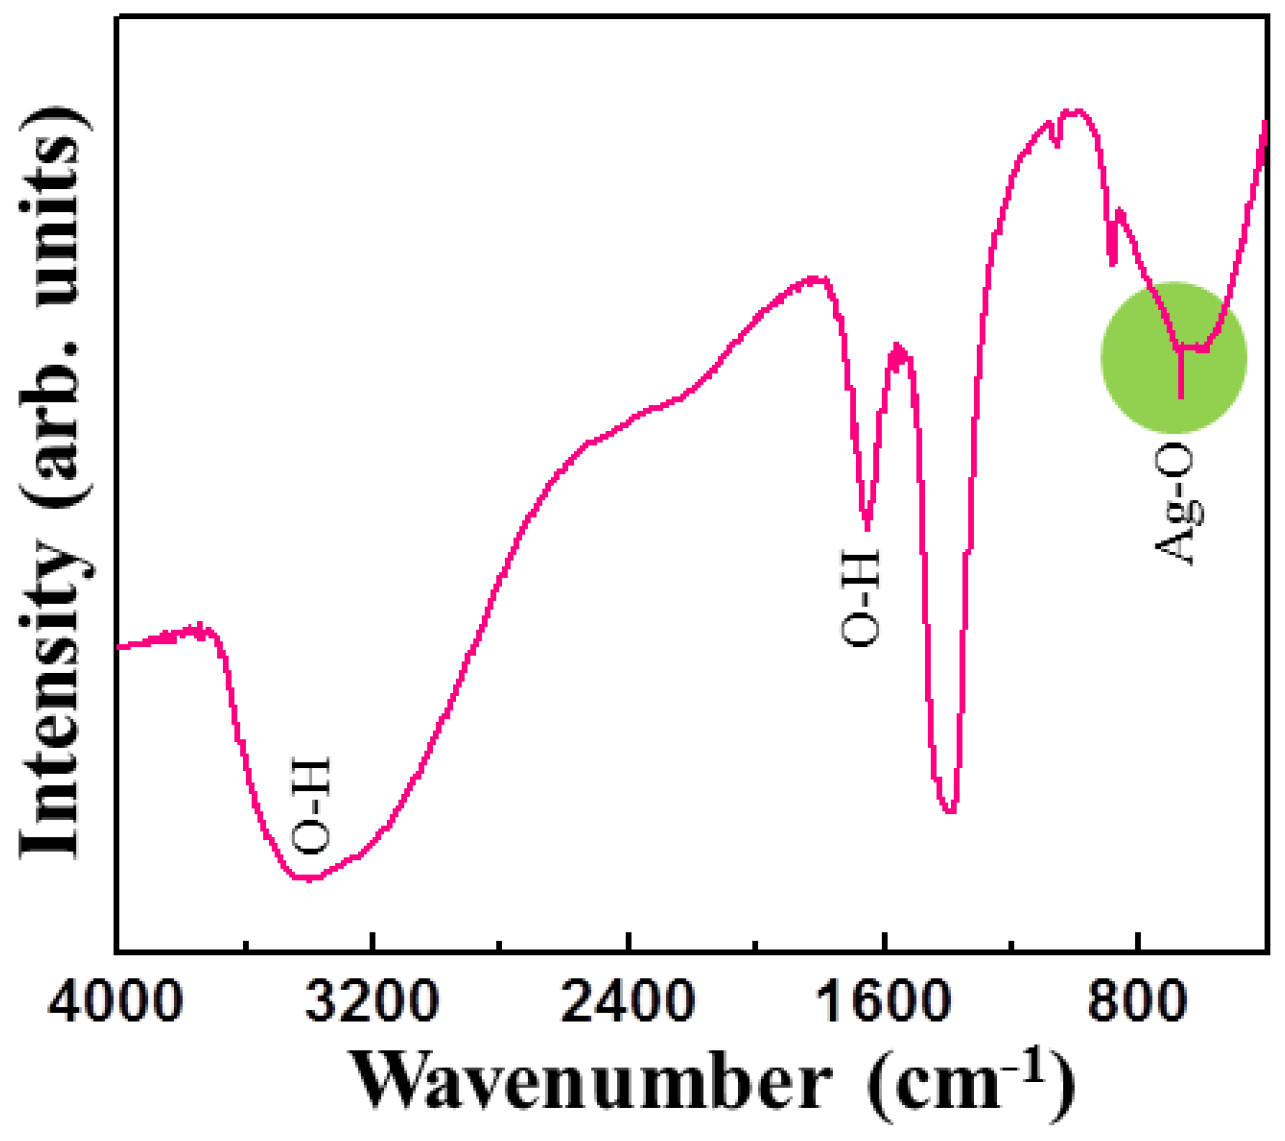
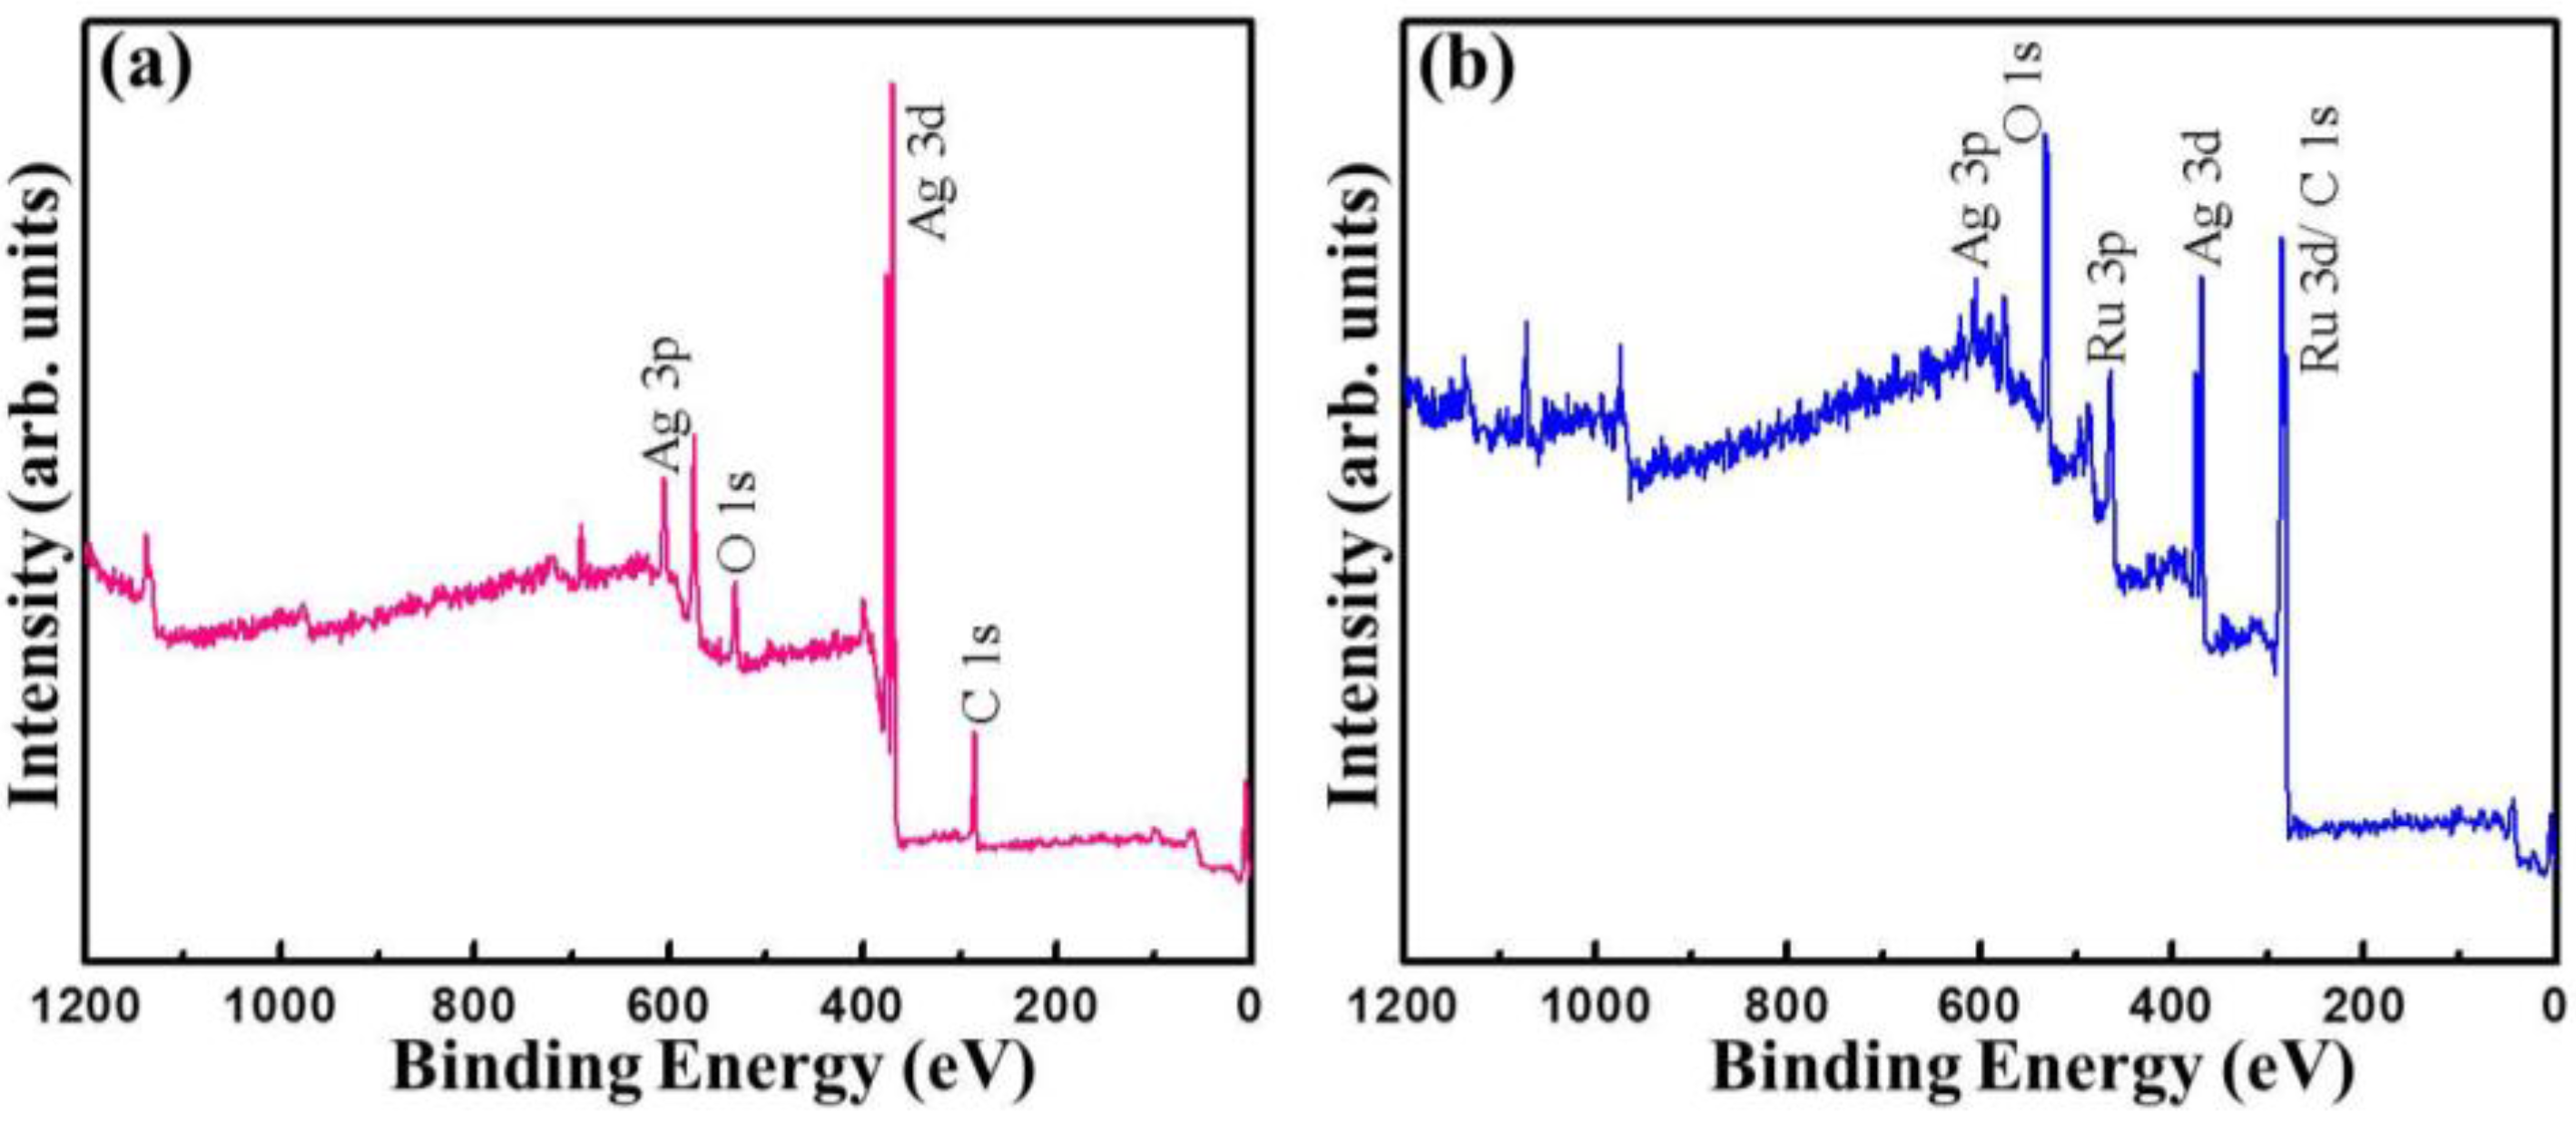
2.5. Bulk and Surface Chemical Analysis
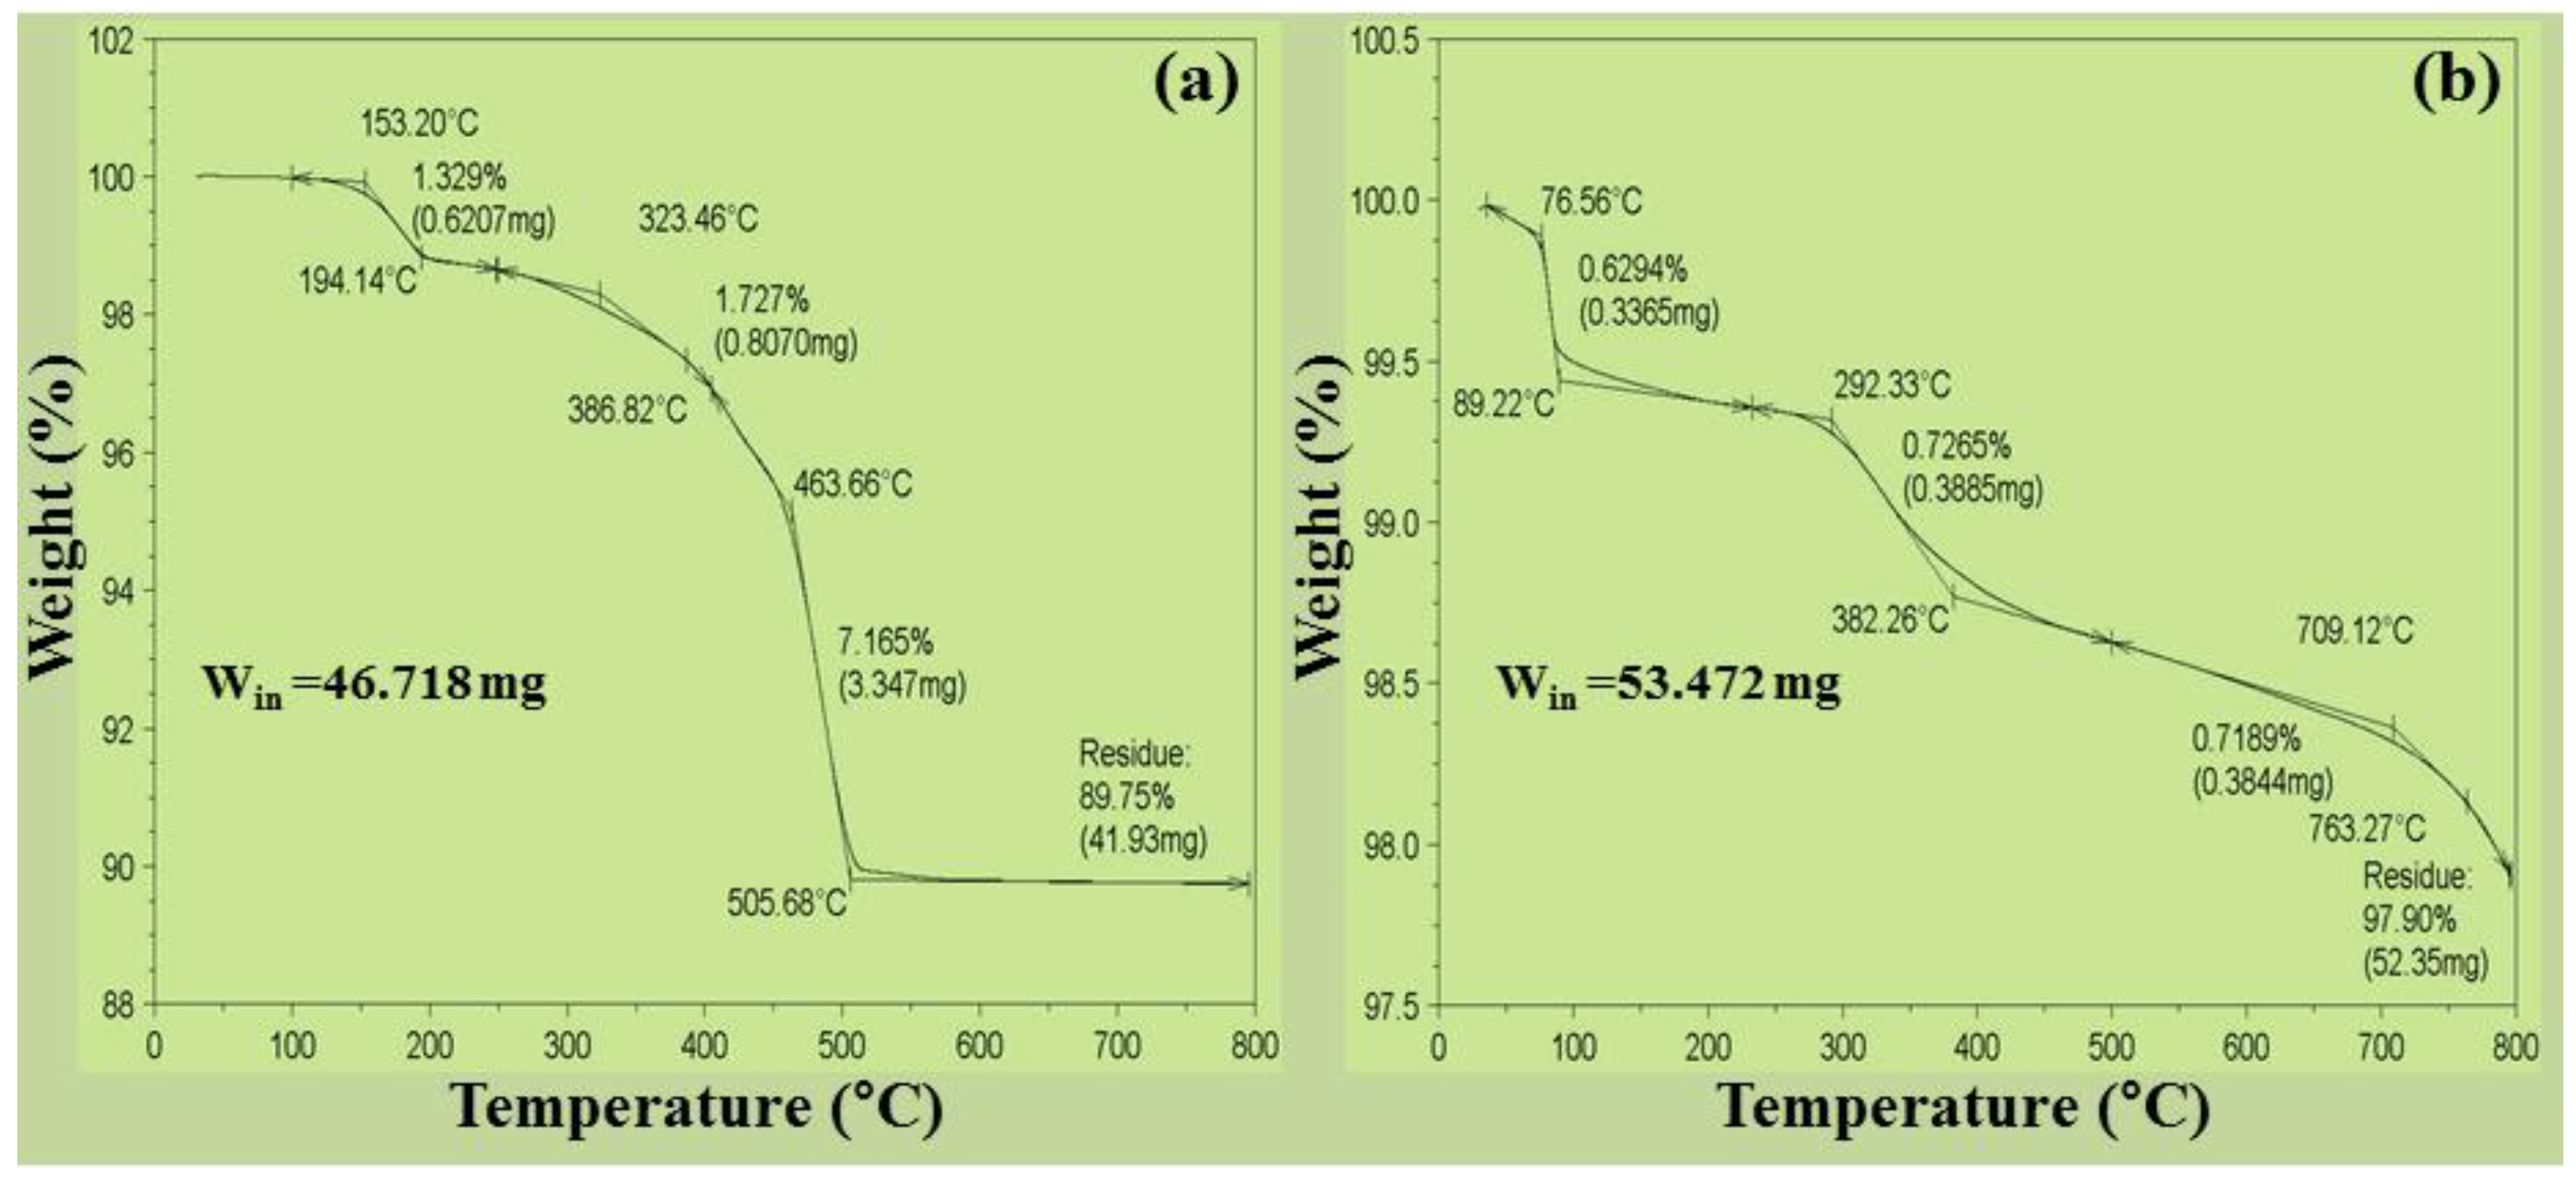
Figure 6 shows the Fourier transform infrared (FTIR) spectra of the Ag2O NMs. The Ag2O/RuO2 nanocomposite exhibited almost similar spectrum and thus not shown here. The functional groups corresponding to Ag2O nanoparticles (Ag–O bonds) were observed around 550 and 720 cm−1 (highlighted) referring to its transverse and longitudinal optical phonon vibrational frequencies, respectively [11,23,24]. The signatures at 1638 and 3400 cm−1 correspond to the vibration of OH. The metal-oxygen vibrations for Ag–O and Ru–O in Ag2O/RuO2 nanocomposite were observed between 650 and 800 cm−1. In this case, the identification of the peaks corresponding to Ag–O and Ru–O seems difficult since the composite exhibited identical FTIR spectra as observed for Ag2O.
In order to confirm the presence of chemical functional groups in a detailed manner, the X-ray photoelectron spectra (XPS) of Ag2O NMs and Ag2O/RuO2 nanocomposite were taken and given in Figure 7a,b. The Ag2O spectra showed the presence of Ag (as 3d and 3p orbital splitting), oxygen and adventitious carbon signals [25,26]. The Ag2O/RuO2 nanocomposite exhibited the presence of ruthenium, silver and oxygen. The high resolution core level XPS spectra of O 1s, Ag 3d, C 1s and Ru 3p spectra corresponding to the samples Ag2O and Ag2O/RuO2 are given in Figure 8. The O 1s spectrum of Ag2O contains two species at the binding energy 531.5 and 529.8 eV referring to oxygen from adsorbed water and Ag2O [27,28,29,30,31], which are noted with its composition (atomic %). The O 1s spectrum of Ag2O/RuO2 contains one more peak corresponding to RuOx in addition to the above (Figure 8b) [32]. The presence of other elements were found out by Gauss-Laurentian peak fitting program and listed in Table 1. The Ag spectra of the Ag2O and Ag2O/RuO2 nanocomposite consisted of a doublet peak at the binding energy 368.2 eV (3d5/2) and 374 eV (3d3/2) with the doublet separation of 5.8 eV (Figure 7c,d). The Ru 3p spectrum of Ag2O/RuO2 contains two regions corresponding to RuO2 and higher oxides of ruthenium (RuOx, where x = 3, probably) [33].

2.6. Thermal Study

The thermo-gravimetric analysis (TGA) technique is fundamentally used to track the changes in physical (phase transformation, crystallization) or chemical (redox reactions) process that occurs when heating a material. The decomposition reaction of Ag2O and Ag2O/RuO2 in the presence of N2 atmosphere can be expressed by the following equations. It is assumed that the sample contains stoichiometric oxygen and the weight loss is proportional to the amount of oxygen present originally.
Ag2O → 2Ag + 0.5 O2
Ag2O/RuO2 → 2(Ag/Ru) + 1.5 O2
The oxygen loss associated with the decomposition is as follows:
Δ W = Atomic or molecular weight of oxygen Molecular weight of metal oxide ( s ) Actual weight of metal oxide ( s )
Figure 9a shows TGA thermogram of Ag2O NMs. It showed two stage decomposition or transformation starting at 194.14 °C and 386.82 °C, which could account for the decomposition of water (and also AgO) and the conversion from Ag2O to metallic Ag [34] with the activation energy of 283.4 kJ·mol−1 at the standard atmosphere [35]. Since the decomposition was rapid, about 10.25 wt % of the sample was lost at the end of the reaction. According to the above equations, the sample contains initially 6.89 wt % oxygen and final loss amounts to 6.19 wt %. This loss was observed up to 505.68 °C and beyond it the sample exhibited molten salt or ionic liquid [36] behavior with small percentage of oxygen (0.7%, see Table 2). But the Ag2O/RuO2 nanocomposite (Figure 9b) showed multi-stage decomposition phenomena. Initial water removal was observed until the temperature reached at 150 °C, followed by maximum Ag2O decomposition at around 382.26 °C and eventually conversion into metallic Ru formation above 700 °C with mass loss of 2.1 wt %. On considering the oxygen loss, it exhibited a gradual decomposition with its initial concentration of 13.149 wt % to the final loss 12.873 wt %. The Ag2O/RuO2 nanocomposite showed a steady oxygen release and maximum decomposition to metallic nature.

3. Experimental Section

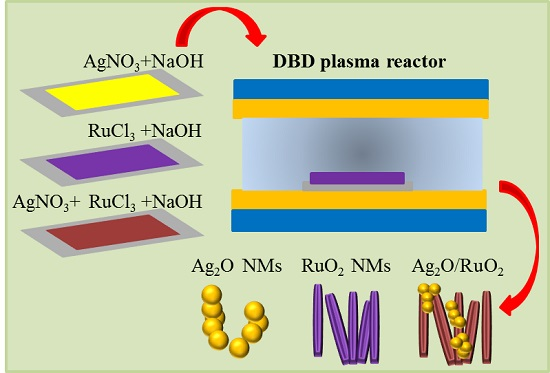
3.1. DBD Plasma Reactor Setup

The NMs were prepared in a self-designed, rectangular box type DBD plasma reactor [8,15], the photographic image of which is given in Figure S2. In brief, two electrodes (4 cm wide and 15 cm long) acted as high voltage and ground electrodes which were covered with glass dielectric of 1.5 mm thickness. The DBD plasma reactor prepared as above was fixed in an acrylic chamber with gas inlet and outlet. The discharge gap (distance between high voltage and ground electrodes) was fixed at 1.5 cm and the nanomaterial precursor solution was kept inside. Alternating current (AC) high voltage (operating frequency: 400 Hz) was applied across the electrodes to generate the plasma. Since argon was used, plasma consisting of numerous filamentary microdischarges was readily created despite the large discharge gap.

3.2. Material Synthesis

Precursor chemicals such as AgNO3 (MW 169.87 g mol−1, Sigma-Aldrich, St. Louis, MO, USA), RuCl3·xH2O (Sigma-Aldrich, St. Louis, MO, USA) and NaOH (Shinyo Pure Chemical Co., Osaka, Japan) were used as received. Exactly 0.5 M AgNO3, RuCl3·xH2O and NaOH solutions were prepared separately. For the preparation of Ag2O NMs, 500 µL of the precursor solution was mixed with 500 µL NaOH, agitated for 2 min, spread on the glass substrate and kept inside the DBD plasma reactor [14]. For Ag2O/RuO2 nanocomposite, 500 µL respective precursor solutions and 1 mL NaOH were used. Gas purging with Ar gas was done for 15 min and the solution was exposed to plasma. The input power was maintained at 38.20 W for all the samples. The input power was measured by a digital power meter (Model WT200, Yokogawa, Tokyo, Japan). Depending on the sample dryness inside the plasma region, the discharge voltage fluctuated in the range of 16–20 kV, despite the same input power. The temperature inside the reactor was found to be varying from room temperature at starting to 70–76 °C at the end of the reaction. According to our previous study, conventional wet chemical synthesis produces aggregated spherical type of NMs [9]. At the end of 3-h plasma reaction, the solid powder was collected and washed repeatedly with deionized water. Heat treatment was performed in a furnace at 200 °C for 24 h.

3.3. Material Characterization

Crystalline nature of the materials was studied using an X-ray diffractometer (D/Max Ultima III, Rigaku Corp., Tokyo, Japan) fitted with a monochromatic Cu Kα radiation (wavelength, λ = 0.154 nm) operated at 40 mA and 40 kV. The surface morphology was observed by an FESEM (JEM 1200 EX II, JEOL, Tokyo, Japan) and TEM. The elemental composition and the nanomaterial’s size were analyzed using an EDX (Model: R-TEM, CM200-UT, Philips, Ventura, CA, USA) and a particle size analyzer (ELS8000, Otsuka Electronics, Osaka, Japan), respectively. FTIR spectroscopy (IFS 66/S, Bruker, Bremen, Germany) was used to study the chemical functional groups. Chemical nature of the surface was also characterized by using an XPS (ESCA 2000, VG Microtech, East Grinstead, UK) with monochromatic Mg Kα X-ray radiation (1253.6 eV) operated with a 13 kV and 15 mA excitation source. TGA was carried out to study the thermal decomposition behavior of the prepared NMs. The samples were heated at a ramping rate of 10 °C·min−1 and simultaneous weight loss was recorded precisely (Q50 Analyzer, version 20.10, TA instruments, New Castle, DE, USA).

4. Conclusions

The DBD plasma-mediated syntheses of Ag2O NMs and Ag2O/RuO2 nanocomposite were investigated. Both materials exhibited crystalline nature with a slight shift in the diffraction angle for Ag2O in the Ag2O/RuO2 nanocomposite. The Ag2O exhibited unique morphology of spherical bundles whereas the composite showed the mixture of RuO2 nanorod and Ag2O spherical aggregates. The Ag2O morphology was significantly altered by changing the concentration of NaOH. The surface chemical analyses by XPS revealed that the sample consisted mainly of Ag2O. The ruthenium in the Ag2O/RuO2 nanocomposite was in two oxide forms such as RuO2 and RuOx. The thermal study showed a fast transformation of Ag2O into metallic Ag in the temperature range of 200–500 °C. But the Ag2O/RuO2 nanocomposite exhibited gradual decomposition without major change in the initial weight until 700 °C. This nanocomposite may exhibit superior redox properties even at high temperature and thus it would serve as a potential candidate in many applications.

Supplementary Materials

The following are available online at https://www.mdpi.com/2079-4991/6/3/42/s1.

Acknowledgments

This research was supported by Basic Science Research Program through the National Research Foundation of Korea (NRF) funded by the Ministry of Science, ICT and future Planning (Grant No. 2013R1A2A2A01067961).

Author Contributions

Antony Ananth performed the experimental work and analyzed the data; Young Sun Mok supervised all the study and participated in the interpretation of the results.

Conflicts of Interest

The authors declare no conflict of interest.

References

  1. Wang, X.; Li, S.; Yu, H.; Yu, J.; Liu, S. Ag2O as a new visible-light photocatalysts: Self-stability and high photocatalytic activity. Chem. Eur. J. 2011, 17, 7777–7780. [Google Scholar] [CrossRef] [PubMed]
  2. Wang, W.; Zhao, Q.; Dong, J.; Li, J. A novel silver oxides oxygen evolving catalyst for water splitting. Int. J. Hydrogen Energy 2011, 36, 7374–7380. [Google Scholar] [CrossRef]
  3. Rahman, M.A.; Khan, S.B.; Jamal, A.; Faisal, M.; Asiri, A.M. Fabrication of highly sensitive acetone sensor based on sonochemically prepared as-grown Ag2O nanostructures. Chem. Eng. J. 2012, 192, 122–128. [Google Scholar] [CrossRef]
  4. Jin, Y.; Dai, Z.; Liu, F.; Kim, H.; Tong, M.; Hou, Y. Bactericidal mechanisms of Ag2O/TNBs under both dark and light conditions. Water Res. 2013, 47, 1837–1847. [Google Scholar] [CrossRef] [PubMed]
  5. Fu, H.-T.; Zhao, L.-M.; Luo, M.; Zhang, H.-Y.; Zhang, J. Determination of Chloracetic Acids in Drinking Water by Ion Chromatography Using Silver Oxide as Precipitant Eliminating Interference of Chlorate in Matrix. Chin. J. Anal. Chem. 2008, 36, 1407–1410. [Google Scholar] [CrossRef]
  6. Lee, Y.; Ye, B.-U.; Yu, H.K.; Lee, J.-L.; Kim, M.H.; Baik, J.M. Facile Synthesis of Single Crystalline Metallic RuO2 Nanowires and Electromigration-Induced Transport Properties. J. Phys. Chem. C 2003, 115, 4611–4615. [Google Scholar] [CrossRef]
  7. Lee, K.-Y.; Chen, C.-A.; Lian, H.-B.; Chen, Y.-M.; Huang, Y.-S.; Keisser, G. Pattern, growth and field emission characteristics of flower-like RuO2 nanostructures. Jpn. J. Appl. Phys. 2010, 49, 105002–105005. [Google Scholar] [CrossRef]
  8. Ananth, A.; Mok, Y.S. Synthesis of RuO2 nanomaterials under dielectric barrier discharge plasma at atmospheric pressure-influence of substrates on the morphology and application. Chem. Eng. J. 2014, 239, 290–298. [Google Scholar] [CrossRef]
  9. Ananth, A.; Dharaneedharan, S.; Gandhi, M.S.; Heo, M.-S.; Mok, Y.S. Novel RuO2 nanosheets–facile synthesis, characterization and application. Chem. Eng. J. 2013, 223, 729–736. [Google Scholar] [CrossRef]
  10. Ananth, A.; Arthanareeswaran, G.; Ismail, A.F.; Mok, Y.S.; Matsura, T. Effect of bio-mediated route synthesized silver nanoparticles for modification of polyethersulfone membranes. Colloids Surf. A 2014, 451, 151–160. [Google Scholar] [CrossRef]
  11. Hosseinpour-Mashkani, S.M.; Ramezani, M. Silver and Silver-Oxide Nanoparticles: Synthesis and Characterization by Thermal Evaporation. Mater. Lett. 2014, 130, 259–262. [Google Scholar] [CrossRef]
  12. Wei, Y.; Zuo, X.; Li, X.; Song, S.; Chen, L.; Shen, J.; Meng, Y.; Zhao, Y.; Fang, S. Dry Plasma Synthesis of Graphene Oxide–Ag Nanocomposites: A Simple and Green Approach. Mater. Res. Bull. 2014, 53, 145–150. [Google Scholar] [CrossRef]
  13. Li, Y.; Zhang, Y.; Fu, H.; Wang, Z.; Li, X. Plasma-assisted speedy synthesis of mesoporous Ag2O nanotube. Mater. Lett. 2014, 126, 131–134. [Google Scholar] [CrossRef]
  14. Kim, D.W.; Park, D.-H. Preparation of indium tin oxide (ITO) nanoparticles by DC arc plasma. Surf. Coat. Technol. 2010, 205, S201–S205. [Google Scholar] [CrossRef]
  15. Ananth, A.; Gandhi, M.S.; Mok, Y.S. Dielectric barrier discharge (DBD) plasma reactor: An efficient tool to prepare novel RuO2 nanorods. J. Phys. D 2013, 46, 155202–155209. [Google Scholar] [CrossRef]
  16. Marino, E.; Huijser, T.; Creyghton, Y.; Hejiden, A.V.D. Syntheis and coating of copper oxide nanoparticles using atmospheric pressureplasmas. Surf. Coat. Technol. 2007, 201, 9205–9208. [Google Scholar] [CrossRef]
  17. Pootawang, P.; Saito, N.; Takai, O.; Lee, S.Y. Rapid synthesis of ordered hexagonal mesoporous silica and their incorporation with Ag nanoparticles by solution plasma. Mater. Res. Bull. 2012, 47, 2726–2729. [Google Scholar] [CrossRef]
  18. Ananth, A.; Mok, Y.S. Dielectric barrier discharge plasma-mediated synthesis of several oxide nanomaterials and its characterization. Powder Technol. 2015, 269, 259–266. [Google Scholar] [CrossRef]
  19. Choi, S.; Lee, M.-S.; Park, D.-W. Photocatalytic performance of TiO2/V2O5 nanocomposite powder prepared by DC arc plasma. Curr. Appl. Phys. 2014, 14, 433–438. [Google Scholar] [CrossRef]
  20. Sullivan, K.T.; Wu, C.; Piekiel, N.W.; Gaskell, K.; Zachariah, M.R. Synthesis and reactivity of nano-Ag2O as an oxidizer for energetic systems yielding antimicrobial products. Combust. Flame 2013, 160, 438–446. [Google Scholar] [CrossRef]
  21. Gultekin, D.; Alaf, M.; Akbulut, H. Synthesis and characterization of ZnO nanopowders and ZnO-CNT nanocomposites prepared by chemical precipitation route. Acta Phys. Polonica A 2013, 123, 274–276. [Google Scholar] [CrossRef]
  22. Inoue, M; Hirasawa, I. The relationship between crystal morphology and XRD peak intensity on CaSO4·2H2O. J. Cryst. Growth 2013, 380, 169–175. [Google Scholar]
  23. Banerjee, S.; Maity, A.K.; Chakravorty, D. Quantum confinement effect in heat treated silver oxide nanoparticles. J. Appl. Phys. 2000, 87, 8541–8544. [Google Scholar] [CrossRef]
  24. Yong, N.L.; Ahmad, A.; Mohammad, A.W. Synthesis and characterization of silver oxide nanoparticles by a novel method. Int. J. Sci. Eng. Res. 2013, 4, 155–158. [Google Scholar]
  25. Xie, Y.; Sherwood, P.M.A. Ultrahigh purity graphite electrode by core level and valence band XPS. Surf. Sci. Spectra 1992, 1, 367–372. [Google Scholar] [CrossRef]
  26. Borman, V.D.; Gusev, E.P.; Lebedinski, Y.Y.; Troyan, V.I. Mechanism of submonolayer oxide formation on silicon surfaces upon thermal oxidation. Phys. Rev. B 1994, 49, 5415–5423. [Google Scholar] [CrossRef]
  27. Rodriguez, J.A. Metal-Metal Bonding on Surfaces: Electronic and Chemical Properties of Ag on Ru(001). Surf. Sci. 1993, 296, 149–163. [Google Scholar] [CrossRef]
  28. Tjeng, L.H.; Meinders, M.B.J.; van Elp, J.; Ghijsen, J.; Sawatzky, G.A.; Johnson, R.L. Electronic structure of Ag2O. Phys. Rev. B 1990, 41, 3190–3199. [Google Scholar] [CrossRef]
  29. Kaushik, V.K. XPS Core Level Spectra and Auger Parameters for Some Silver Compounds. J. Electron Spectrosc. Relat. Phenom. 1991, 56, 273–277. [Google Scholar] [CrossRef]
  30. Gerenser, L.J. Photoemission investigation of silver/poly(ethylene terephthalate) interfacial chemistry: The effect of oxygen-plasma treatment. J. Vac. Sci. Technol. A 1990, 8, 3682–3691. [Google Scholar] [CrossRef]
  31. Pashutski, A.; Hoffman, A.; Folkman, M. Low temperature XPS and AES studies of O2 adsorption on Al(100). Surf. Sci. 1989, 208, L91–L97. [Google Scholar] [CrossRef]
  32. Sarma, D.D.; Rao, C.N.R. XPES studies of oxides of second- and third-row transition metals including rare earths. J. Electron Spectrosc. Relat. Phenom. 1980, 20, 25–45. [Google Scholar] [CrossRef]
  33. Shen, J.Y.; Adnot, A.; Kaliaguine, S. An ESCA study of the interaction of oxygen with the surface of ruthenium. Appl. Surf. Sci. 1991, 51, 47–60. [Google Scholar] [CrossRef]
  34. Jelic, D.; Penavin-Skundric, J.; Majstorovic, D.; Mentus, S. The thermogravimetric study of silver(I) oxide reduction by hydrogen. Thermochim. Acta 2011, 526, 252–256. [Google Scholar] [CrossRef]
  35. Waterhouse, G.I.N.; Bowmaker, G.A.; Metson, J.B. The thermal decomposition of silver (I, III) oxide: A combined XRD, FT-IR and Raman spectroscopic study. Phys. Chem. Chem. Phys. 2001, 3, 3838–3845. [Google Scholar] [CrossRef]
  36. Siddiqui, M.R.H.; Adil, S.F.; Assal, M.E.; Ali, R.; Al-Warthan, A. Synthesis and characterization of silver oxide and silver chloride nanoparticles with high thermal stability. Asian J. Chem. 2013, 25, 3405–3409. [Google Scholar]
Figure 1. X-ray diffractograms of (a) Ag2O nanomaterials (NMs); and (b) Ag2O/RuO2 nanocomposite. Arb. units stand for arbitrary units.
Nanomaterials 06 00042 g001
Figure 2. Field emission scanning electron microscope (FESEM) surface morphological images of (a) Ag2O nanomaterials (NMs); and (b) Ag2O/RuO2; high resolution transmission electron microscope (TEM) images of (c) Ag2O NMs; and (d) Ag2O/RuO2; and energy dispersive X-ray spectroscopy (EDX) spectra with the elemental composition for (e) Ag2O NMs; and (f) Ag2O/RuO2.
Nanomaterials 06 00042 g002
Figure 3. Particle size distributions of (a) Ag2O NMs (b); and (b) Ag2O/RuO2 nanocomposite. Ls. Int. distribution stands for light scattering intensity distribution.
Nanomaterials 06 00042 g003
Figure 4. The proposed growth mechanisms for (a) Ag2O and (b) RuO2 nanomaterials and (c) Ag2O/RuO2 nanocomposite in the presence of plasma. The a1 and a2 represent the Ag2O growth at 0.5 and 1.0 M NaOH concentration.
Nanomaterials 06 00042 g004
Figure 5. Morphology of Ag2O NMs obtained with an NaOH concentration of (a) 0.75 M; and (b) 1.0 M; and morphology of Ag2O/RuO2 nanocomposite obtained with an NaOH concentration of (c) 0.75 M; and (d) 1.0 M.
Nanomaterials 06 00042 g005
Figure 6. Fourier transform infrared spectroscopy (FTIR) spectrum of Ag2O NMs.
Nanomaterials 06 00042 g006
Figure 7. X-ray photoelectron spectroscopy (XPS) survey spectra of (a) Ag2O NMs (b); and (b) Ag2O/RuO2 nanocomposite.
Nanomaterials 06 00042 g007
Figure 8. High-resolution core level XPS spectra of (a) O 1s in Ag2O; (b) O 1s in Ag2O/RuO2 nanocomposite; (c) Ag 3d in Ag2O; (d) Ag 3d in Ag2O/RuO2 nanocomposite; (e) C 1s in Ag2O; and (f) Ru 3p in Ag2O/RuO2 nanocomposite.
Nanomaterials 06 00042 g008
Figure 9. Thermogravimetric analysis (TGA) thermogram of (a) Ag2O NMs and (b) Ag2O/RuO2 nanocomposite (b). Win : initial weight of the sample.
Nanomaterials 06 00042 g009
Table 1. Results of the X-ray photoelectron spectroscopy (XPS) analysis.
Binding Energy (eV)Species AssignmentReference
284.6Carbon [25]
368.2, 374.0, 529.3, 529.8Ag2O[27,28,29,30,31]
462.5RuO2[32]
531.5Oxygen from adsorbed water[31]
531.0, 465.0RuOx/Ru[33]
532.6Diffused oxygen atoms[26]
Table 2. Amount of oxygen before and after Thermogravimetric analysis (TGA) analysis.
SampleInitial Sample Mass (mg)Initial O2 Mass (mg)Final Sample Mass (mg)Lost O2 Mass (mg)Remaining O2 Mass (mg)Remaining O2 Mass (%)
Ag2O46.7183.2241.932.890.3300.700
Ag2O/RuO253.4727.03152.356.8830.1480.276
* RuO242.98810.38840.849.8220.5661.192

