Enhancing Photovoltaic Performance Using Broadband Luminescent Down-Shifting by Combining Multiple Species of Eu-Doped Silicate Phosphors


Abstract
:
1. Introduction
2. Experiments
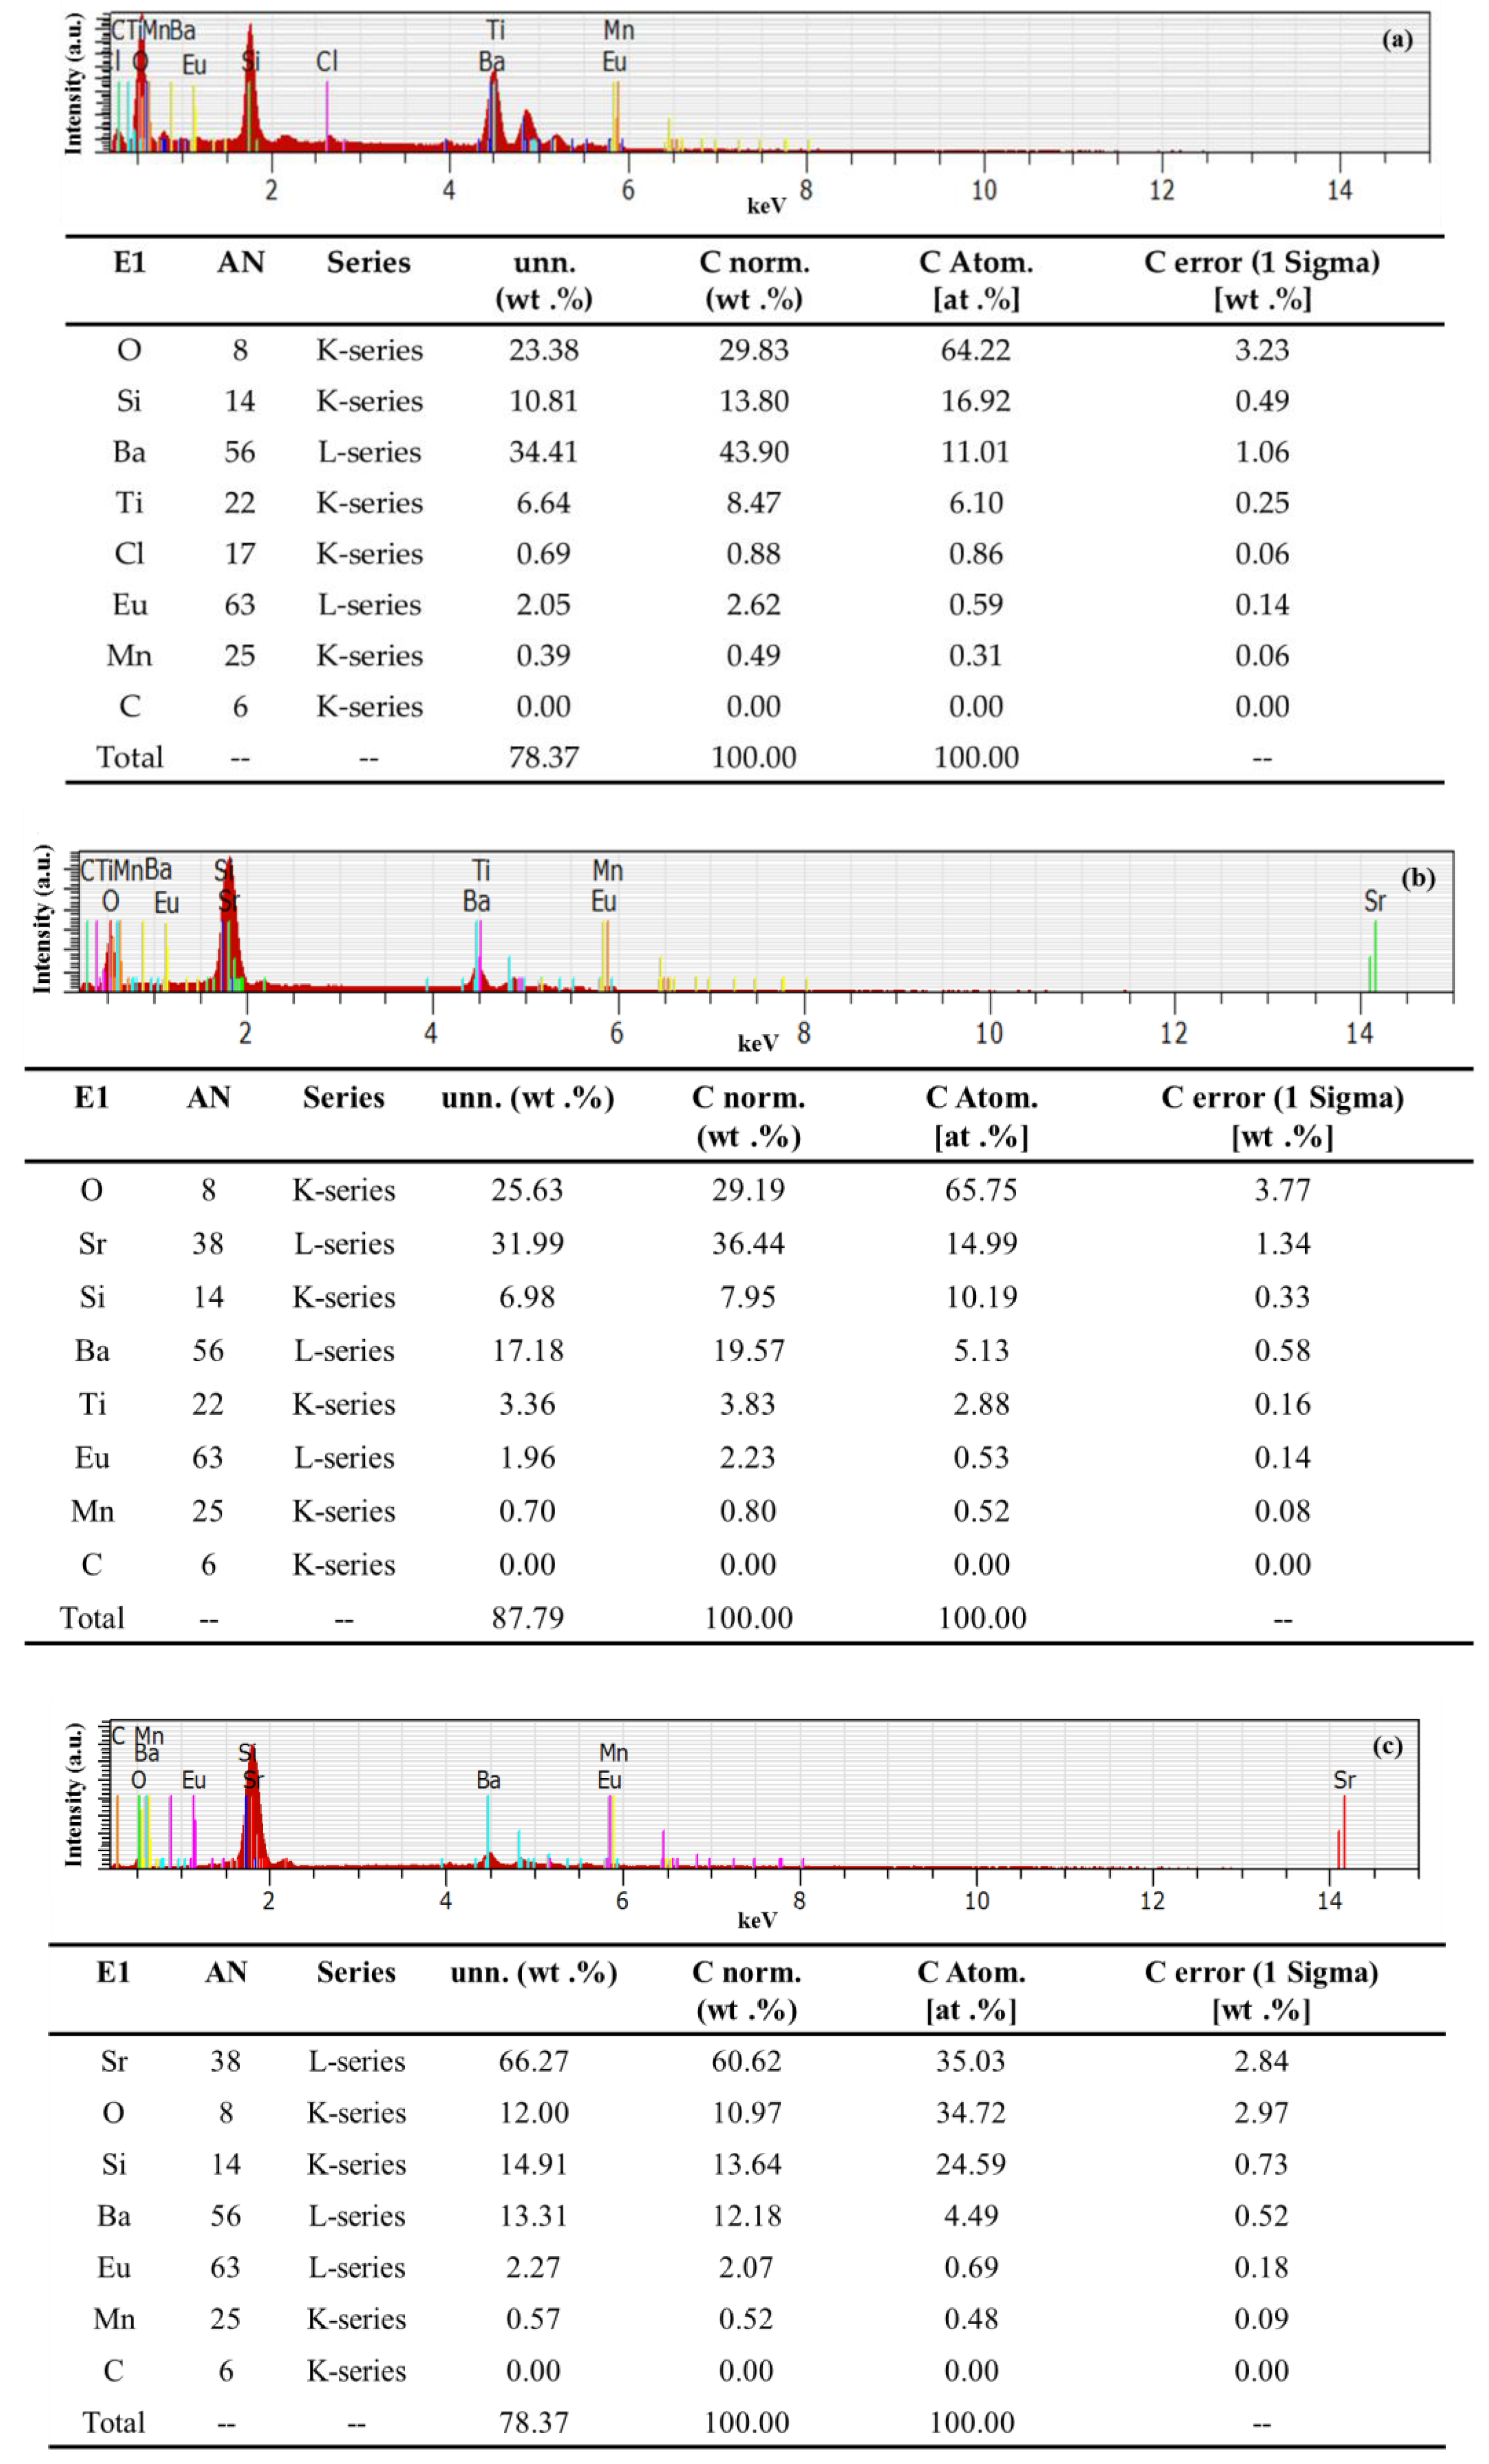
2.1. Preparation and Characterization of Eu-Doped Silicate Phosphors Layer
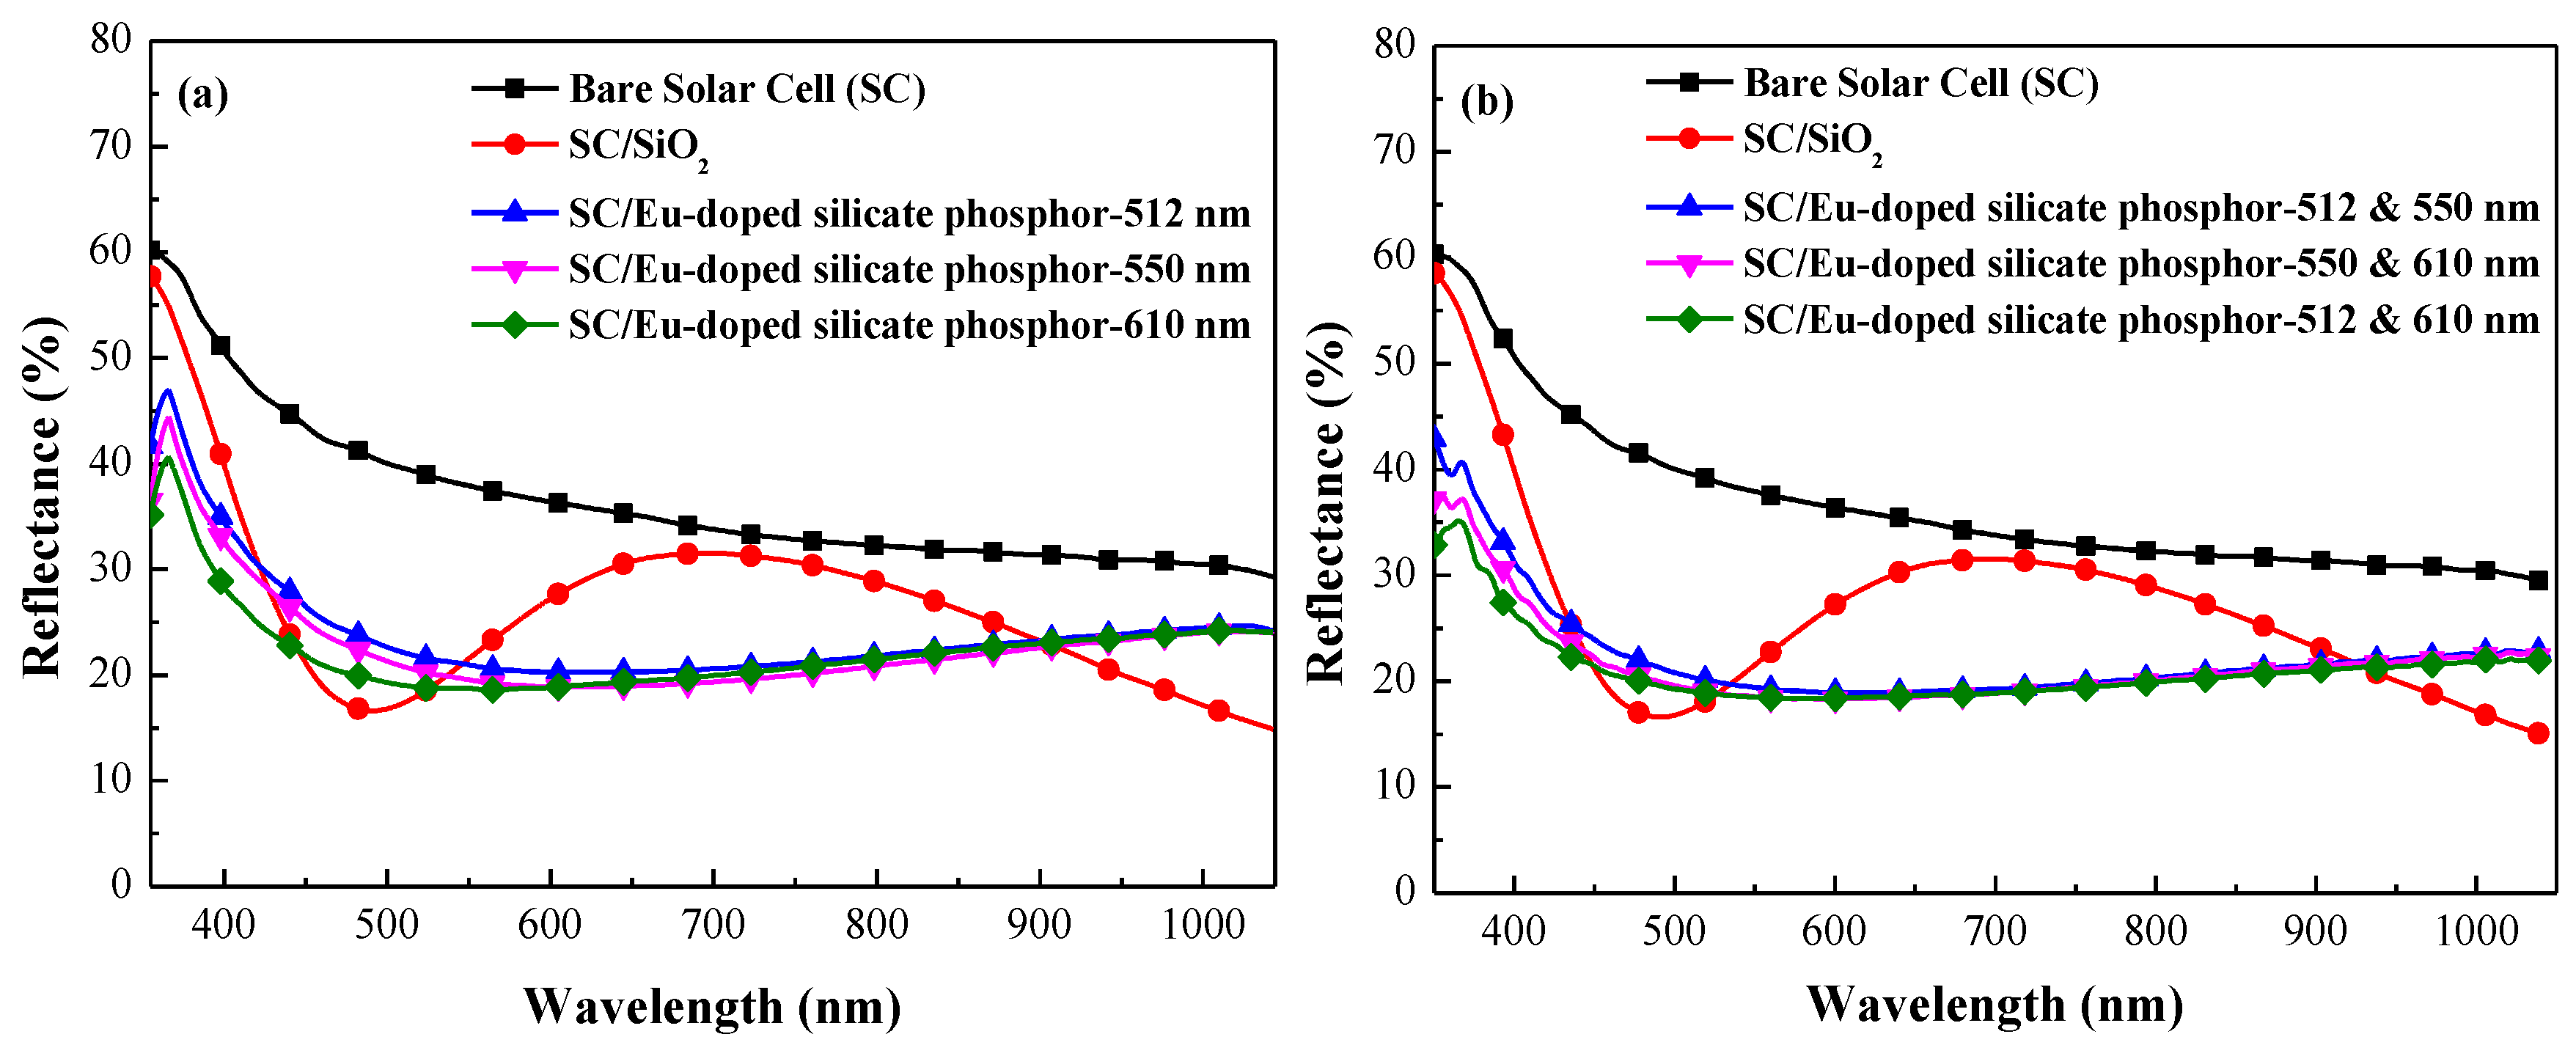
2.2. Fabrication and Characterization of Silicon Solar Cells Coated with Eu-Doped Silicate Phosphors
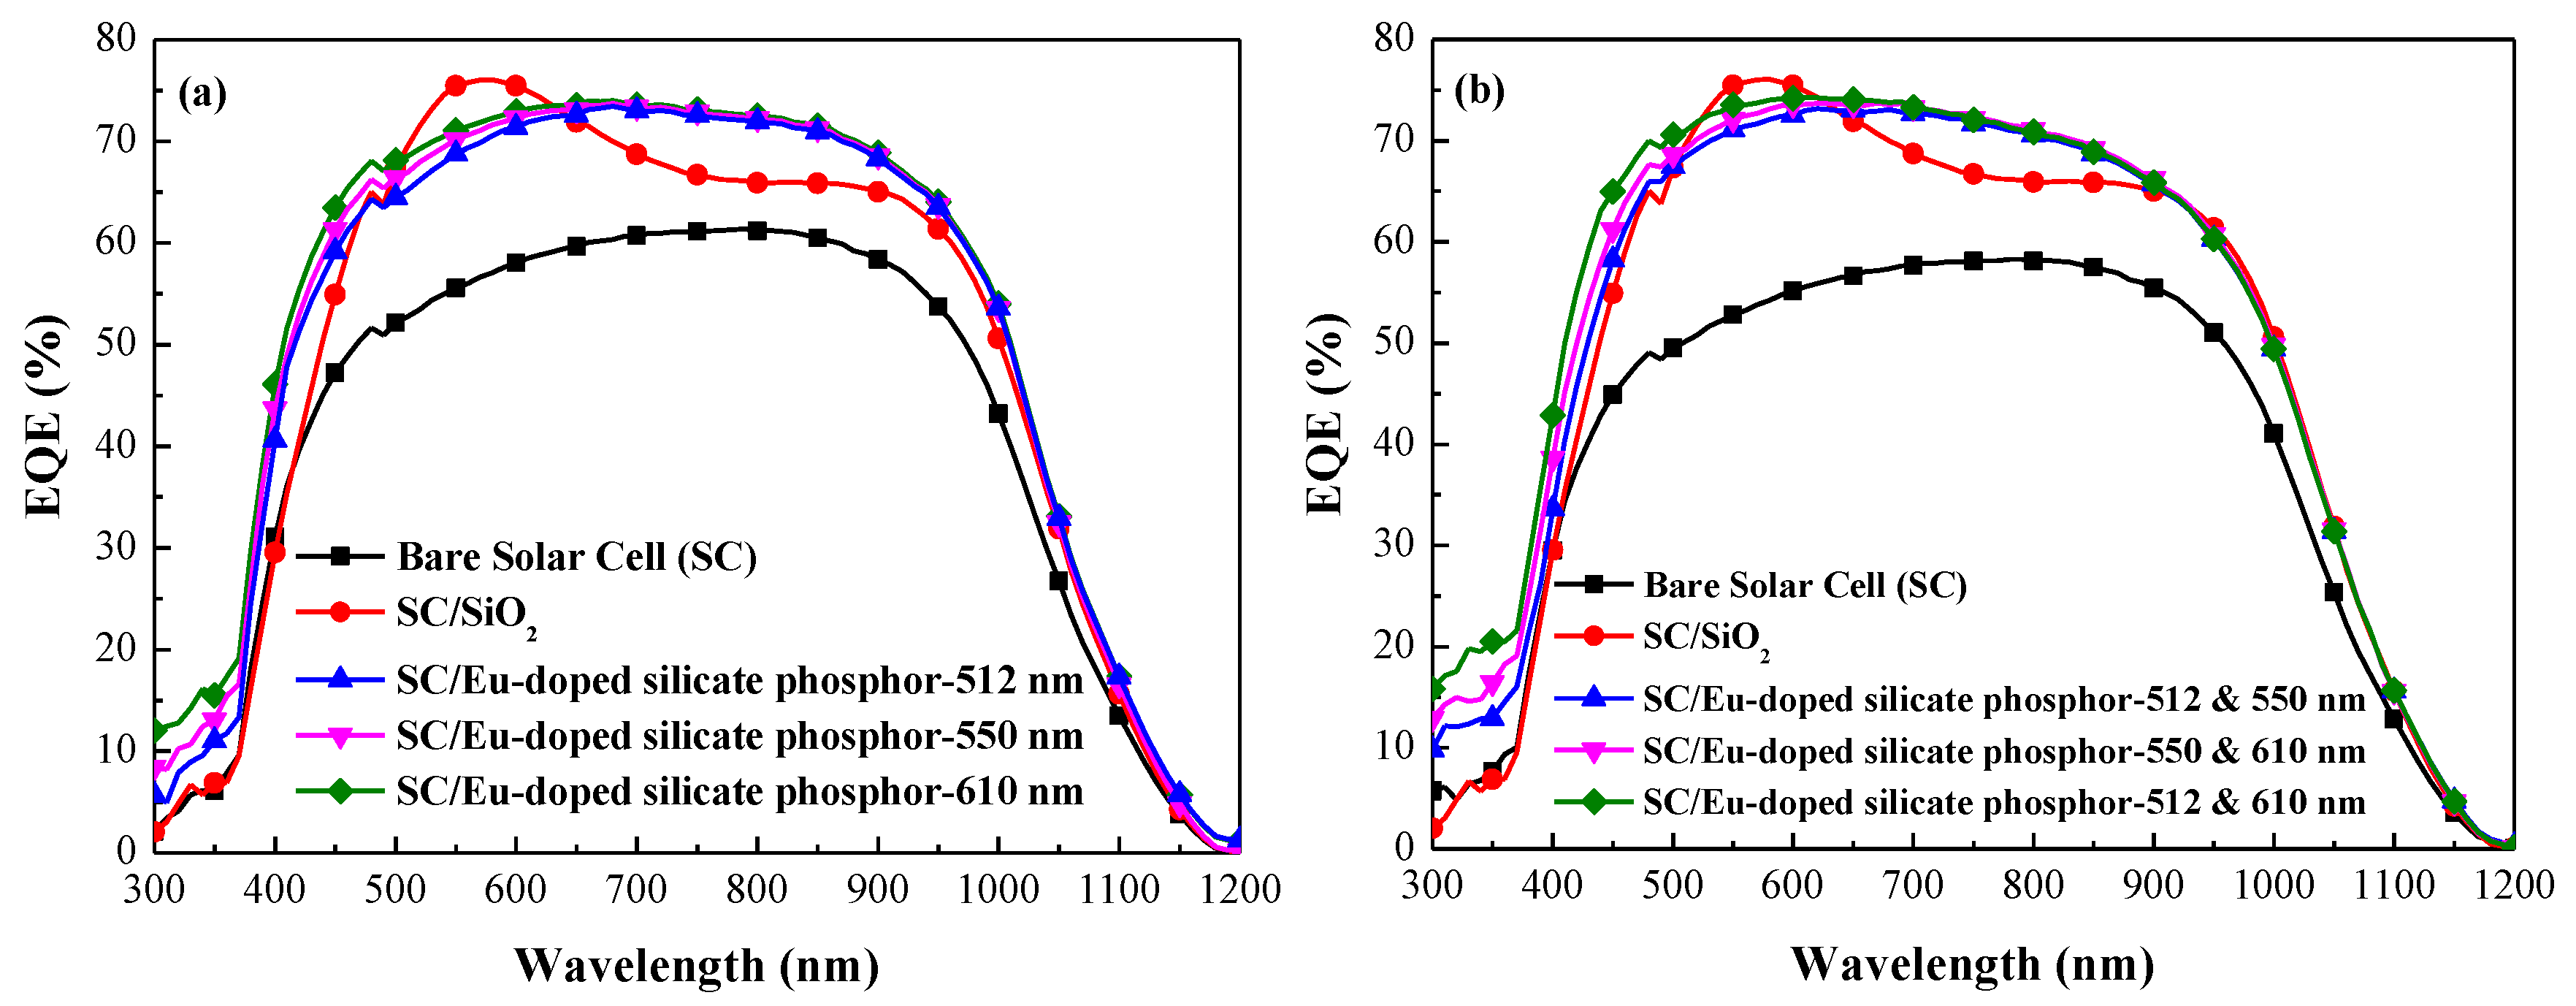
3. Results and Discussion
4. Conclusions
Acknowledgments
Author Contributions
Conflicts of Interest
References
- Shockley, W.; Queisser, H.J. Detailed balance limit of efficiency of p-n junction solar cells. J. Appl. Phys. 1961, 32, 510–519. [Google Scholar] [CrossRef]
- Chander, N.; Sardana, S.K.; Parashar, P.K.; Khan, A.F.; Chawla, S.; Komarala, V.K. Improving the short-wavelength spectral response of silicon solar cells by spray deposition of YVO4: Eu3+ downshifting phosphor nanoparticles. IEEE J. Photovolt. 2015, 5, 1373–1379. [Google Scholar] [CrossRef]
- Zhao, J.; Green, M.A. Optimized antireflection coatings for high-efficiency silicon solar cells. IEEE Trans. Electron. Devices 1991, 38, 1925–1934. [Google Scholar] [CrossRef]
- Campbell, P.; Green, M.A. High performance light trapping textures for monocrystalline silicon solar cells. Sol. Energy Mater. Sol. Cells 2001, 65, 369–375. [Google Scholar] [CrossRef]
- Strümpel, C.; McCann, M.; Beaucarne, G.; Arkhipov, V.; Slaoui, A.; Švrček, V.; del Cañizo, C.; Tobias, I. Modifying the solar spectrum to enhance silicon solar cell efficiency—An overview of available materials. Sol. Energy Mater. 2007, 91, 238–249. [Google Scholar] [CrossRef]
- Abrams, Z.R.; Niv, A.; Zhang, X. Solar energy enhancement using down-converting particles: A rigorous approach. J. Appl. Phys. 2011, 109, 114905. [Google Scholar] [CrossRef]
- Oskam, K.D.; Wegh, R.T.; Donker, H.; Van Loef, E.V.D.; Meijerink, A. Downconversion: A new route to visible quantum cutting. J. Alloys Compd. 2000, 300, 421–425. [Google Scholar] [CrossRef]
- Richards, B.S. Luminescent layers for enhanced silicon solar cell performance: Down-conversion. Sol. Energy Mater. Sol. Cells 2006, 90, 1189–1207. [Google Scholar] [CrossRef]
- Hovel, H.J.; Hodgson, R.T.; Woodall, J.M. The effect of fluorescent wavelength shifting on solar cell spectral response. Sol. Energy Mater. 1979, 2, 19–29. [Google Scholar] [CrossRef]
- Chung, P.; Chung, H.-H.; Holloway, P.H. Phosphor coating to enhance Si photovoltaic cell performance. J. Vac. Sci. Technol. A 2007, 25, 61–66. [Google Scholar] [CrossRef]
- Chen, J.-Y.; Huang, C.K.; Hung, W.B.; Sun, K.W.; Chen, T.M. Efficiency improvement of Si solar cells using metal-enhanced nanophosphor fluorescence. Sol. Energy Mater. Sol. Cells 2014, 120, 168–174. [Google Scholar] [CrossRef]
- Klampaftis, E.; Ross, D.; McIntosh, K.R.; Richards, B.S. Enhancing the performance of solar cells via luminescent down-shifting of the incident spectrum: A review. Sol. Energy Mater. Sol. Cells 2009, 93, 1182–1194. [Google Scholar] [CrossRef]
- Thomas, C.P.; Wedding, A.B.; Martin, S.O. Theoretical enhancement of solar cell efficiency by the application of an ideal “down-shifting” thin film. Sol. Energy Mater. Sol. Cells 2012, 98, 455–464. [Google Scholar] [CrossRef]
- Trupke, T.; Green, M.A.; Würfel, P. Improving solar cell efficiency by down-conversion of high-energy photons. J. Appl. Phys. 2002, 92, 1668–1674. [Google Scholar] [CrossRef]
- Badescu, V.; De Vos, A. Influence of some design parameters on efficiency of solar cells with down-conversion and down-shifting of the high-energy photons. J. Appl. Phys. 2007, 102, 073102. [Google Scholar] [CrossRef]
- Macdougall, S.K.W.; Ivaturi, A.; Marques-Hueso, J.; Krämer, K.W.; Richards, B.S. Broadband photoluminescent quantum yield optimisation of Er3+-doped β-NaYF4 for upconversion in silicon solar cells. Sol. Energy Mater. Sol. Cells 2014, 128, 18–26. [Google Scholar] [CrossRef]
- Moudam, O.; Rowan, B.C.; Alamiry, M.; Richardson, P.; Richards, B.S.; Jones, A.C.; Robertson, N. Europium complexes with high total photoluminescence quantum yields in solution and PMMA. Chem. Commun. 2009, 43, 6649–6651. [Google Scholar] [CrossRef] [PubMed]
- Lian, H.; Hou, Z.; Shang, M.; Geng, D.; Zhang, Y.; Lin, J. Rare earth ions doped phosphors for improving efficiencies of solar cells. Energy 2013, 57, 270–283. [Google Scholar] [CrossRef]
- McIntosh, K.R.; Lau, G.; Cotsell, J.N.; Hanton, K.; Bätzner, D.L.; Bettiol, F.; Richards, B.S. Increase in external quantum efficiency of encapsulated silicon solar cells from a luminescent down-shifting layer. Prog. Photovolt. Res. Appl. 2009, 17, 191–197. [Google Scholar] [CrossRef]
- Shao, G.; Lou, C.; Xiao, D. Enhancing the efficiency of solar cells by down shifting YAG: Ce3+ phosphors. J. Lumin. 2015, 157, 344–348. [Google Scholar] [CrossRef]
- Le Donne, A.; Acciarri, M.; Narducci, D.; Marchionna, S.; Binetti, S. Encapsulating Eu3+ complex doped layers to improve Si-based solar cell efficiency. Prog. Photovolt. Res. Appl. 2009, 17, 519–525. [Google Scholar] [CrossRef]
- Hung, W.B.; Chen, J.Y.; Sung, K.W.; Chen, T.M. Enhanced conversion efficiency of crystalline Si solar cells via luminescent down-shifting using Ba2SiO4: Eu2+ phosphor. J. Ceram. Process. Res. 2014, 15, 157–161. [Google Scholar]
- Huang, C.K.; Chen, Y.C.; Hung, W.B.; Chen, T.M.; Sun, K.W.; Chang, W.-L. Enhanced light harvesting of Si solar cells via luminescent down-shifting using YVO4:Bi3+, Eu3+ nanophosphors. Prog. Photovolt. Res. Appl. 2013, 21, 1507–1513. [Google Scholar] [CrossRef]
- Liu, J.; Wang, K.; Zheng, W.; Huang, W.; Li, C.-H.; You, X.-Z. Improving spectral response of monocrystalline silicon photovoltaic modules using high efficient luminescent down-shifting Eu3+ complexes. Prog. Photovolt. Res. Appl. 2013, 21, 668–675. [Google Scholar] [CrossRef]
- Wegh, R.T.; Donker, H.; Oskam, K.D.; Meijerink, A. Visible quantum cutting in LiGdF4:Eu3+ through downconversion. Science 1999, 283, 663–666. [Google Scholar] [CrossRef] [PubMed]
- Ho, W.-J.; Yang, G.-C.; Shen, Y.-T.; Deng, Y.-J. Improving efficiency of silicon solar cells using europium-doped silicate-phosphor layer by spin-on film coating. Appl. Surf. Sci. 2016, 365, 120–124. [Google Scholar] [CrossRef]
- Ho, W.-J.; Deng, Y.-J.; Liu, J.-J.; Feng, S.-K.; Lin, J.-C. Photovoltaic performance characterization of textured silicon solar cells using luminescent down-shifting Eu-doped phosphor particles of various dimensions. Materials 2017, 10, 21. [Google Scholar] [CrossRef] [PubMed]


| Species of Phosphor | Average Coverage (%) |
|---|---|
| G2060TM | 11.97 |
| EY4156 | 11.87 |
| O6040 | 12.15 |
| G2060TM + EY4156 | 11.91 |
| EY4156 + O6040 | 12.05 |
| G2060TM + O6040 | 11.75 |
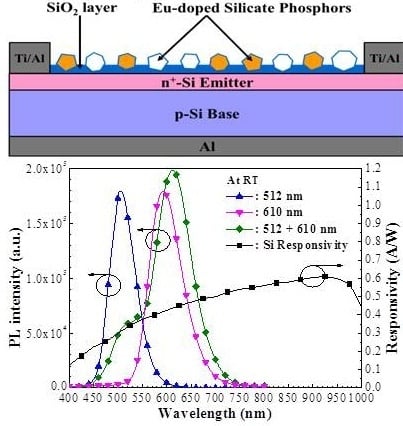
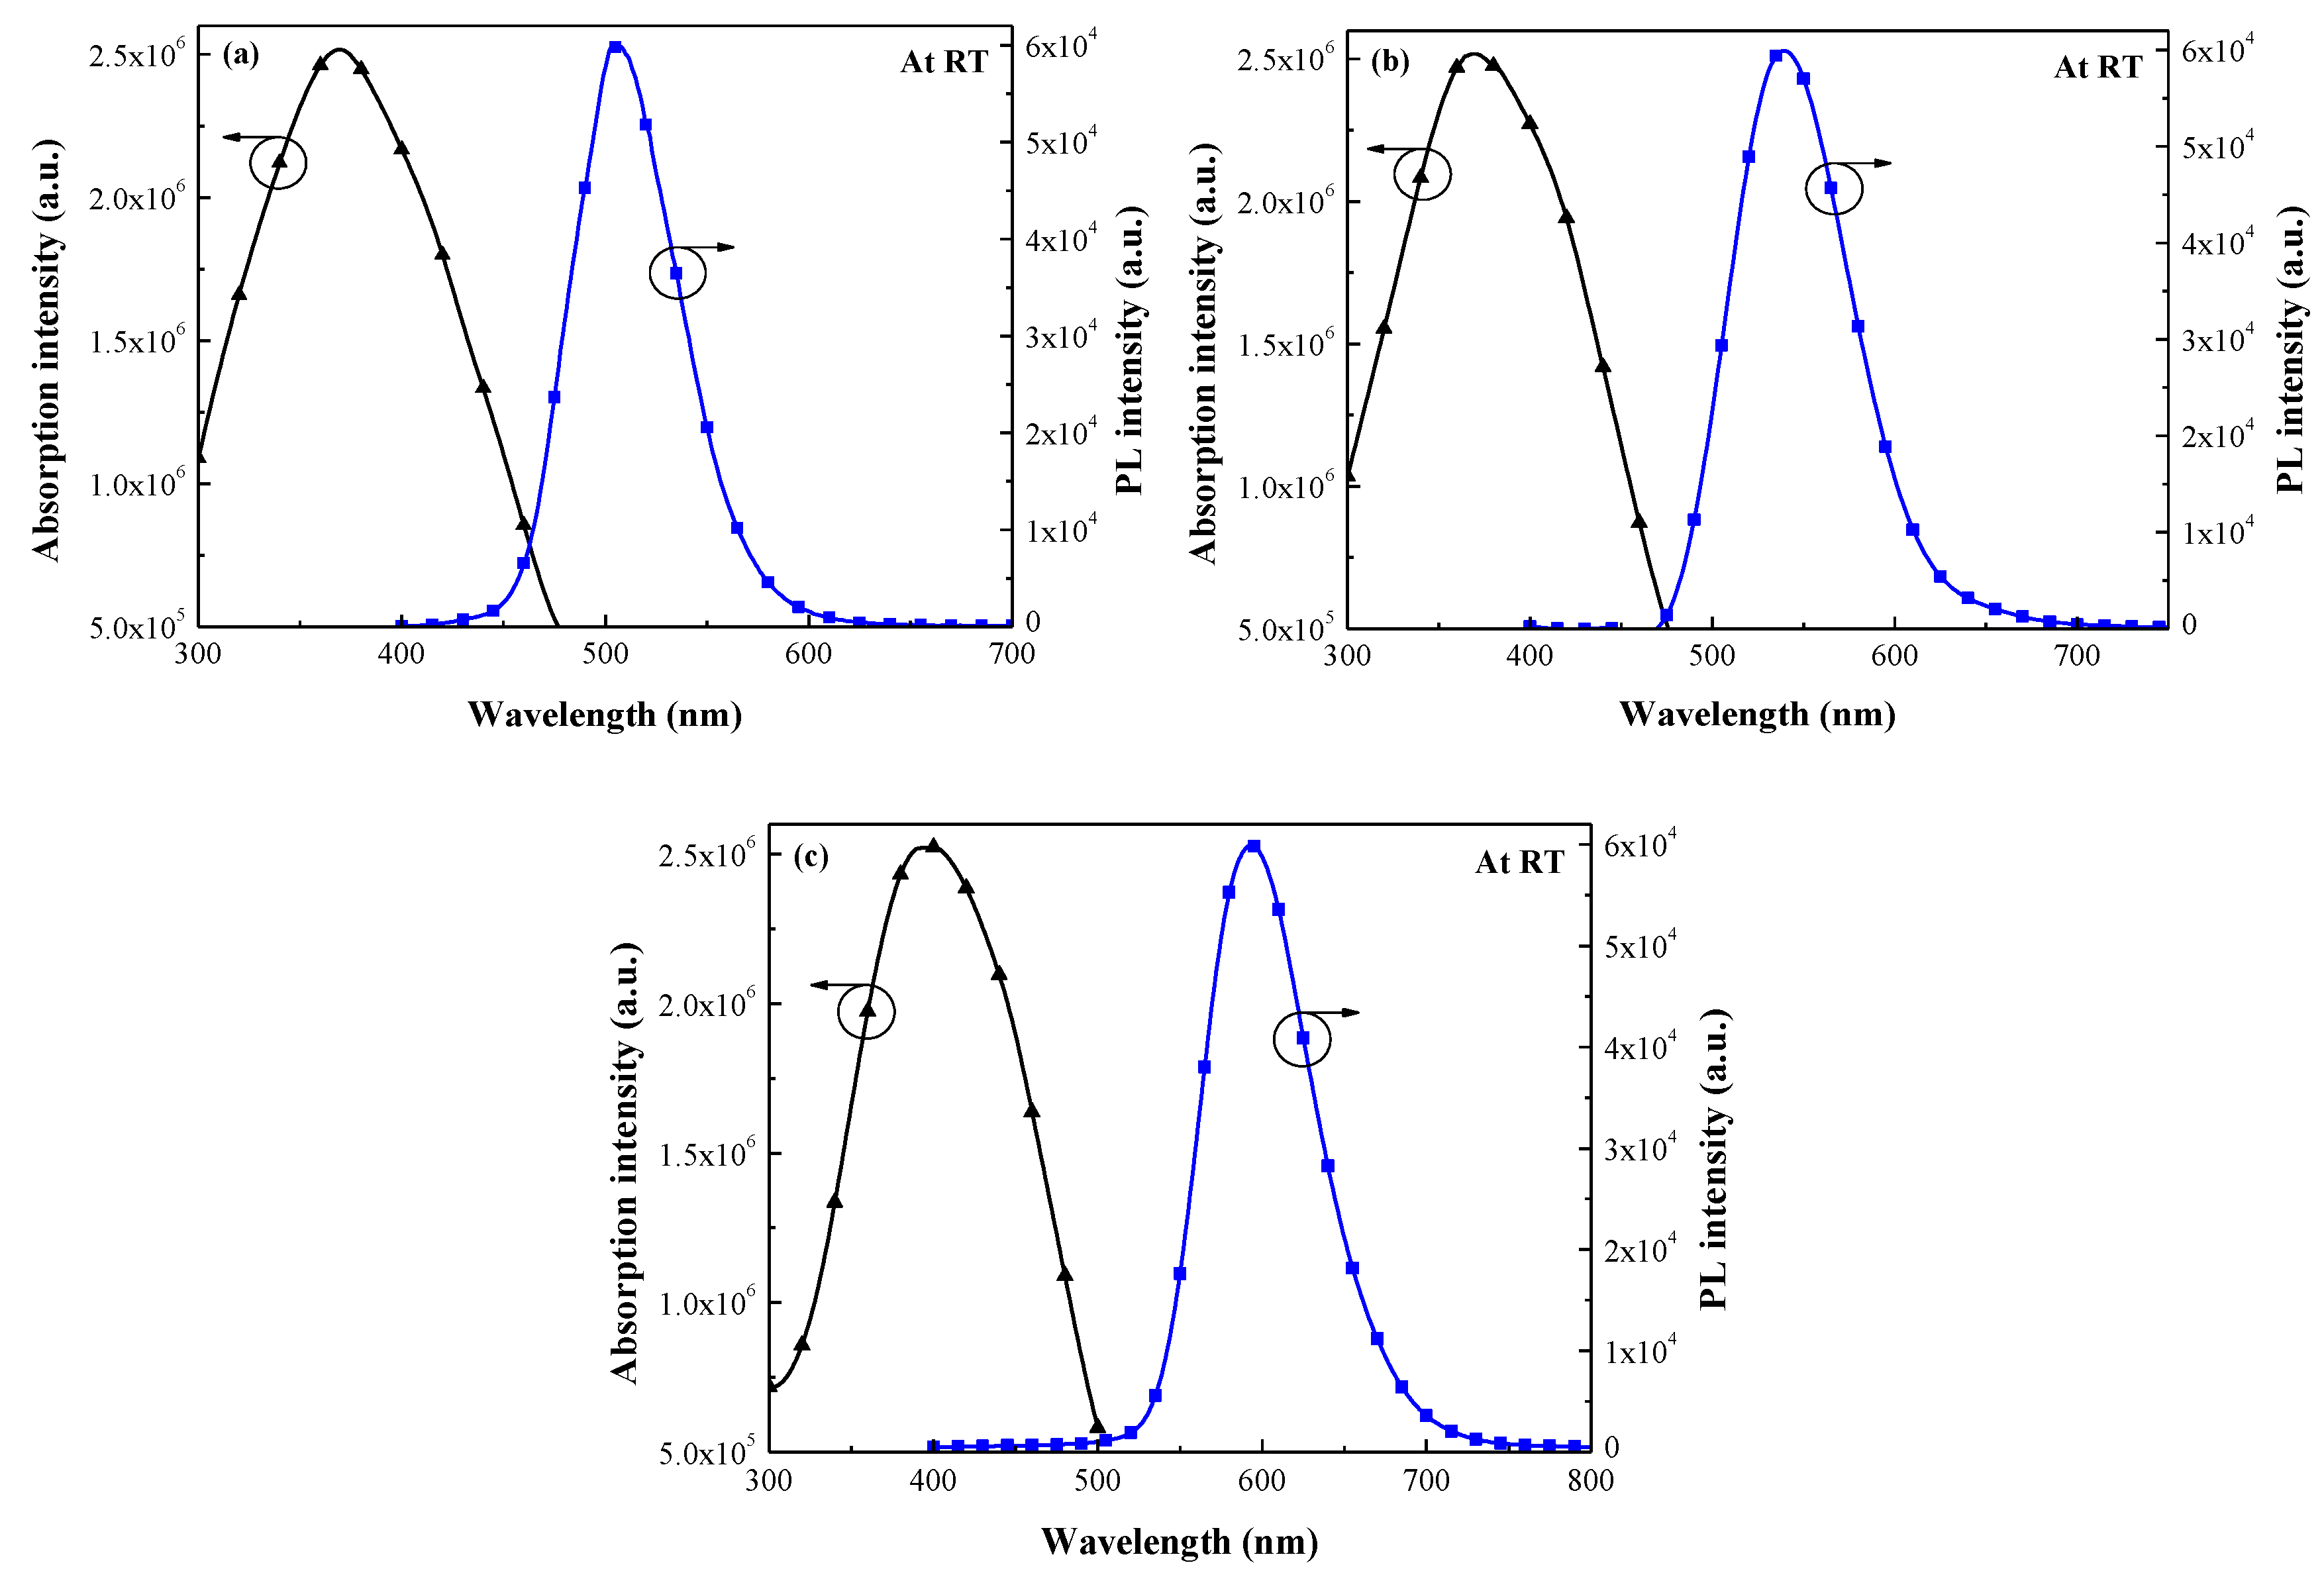
| Species of Phosphor | Absorption Peak (nm) | PL Emission Peak (nm) | Stokes Shifting (nm) |
|---|---|---|---|
| G2060TM | 369 | 506 | 137 |
| EY4156 | 370 | 539 | 169 |
| O6040 | 397 | 596 | 199 |
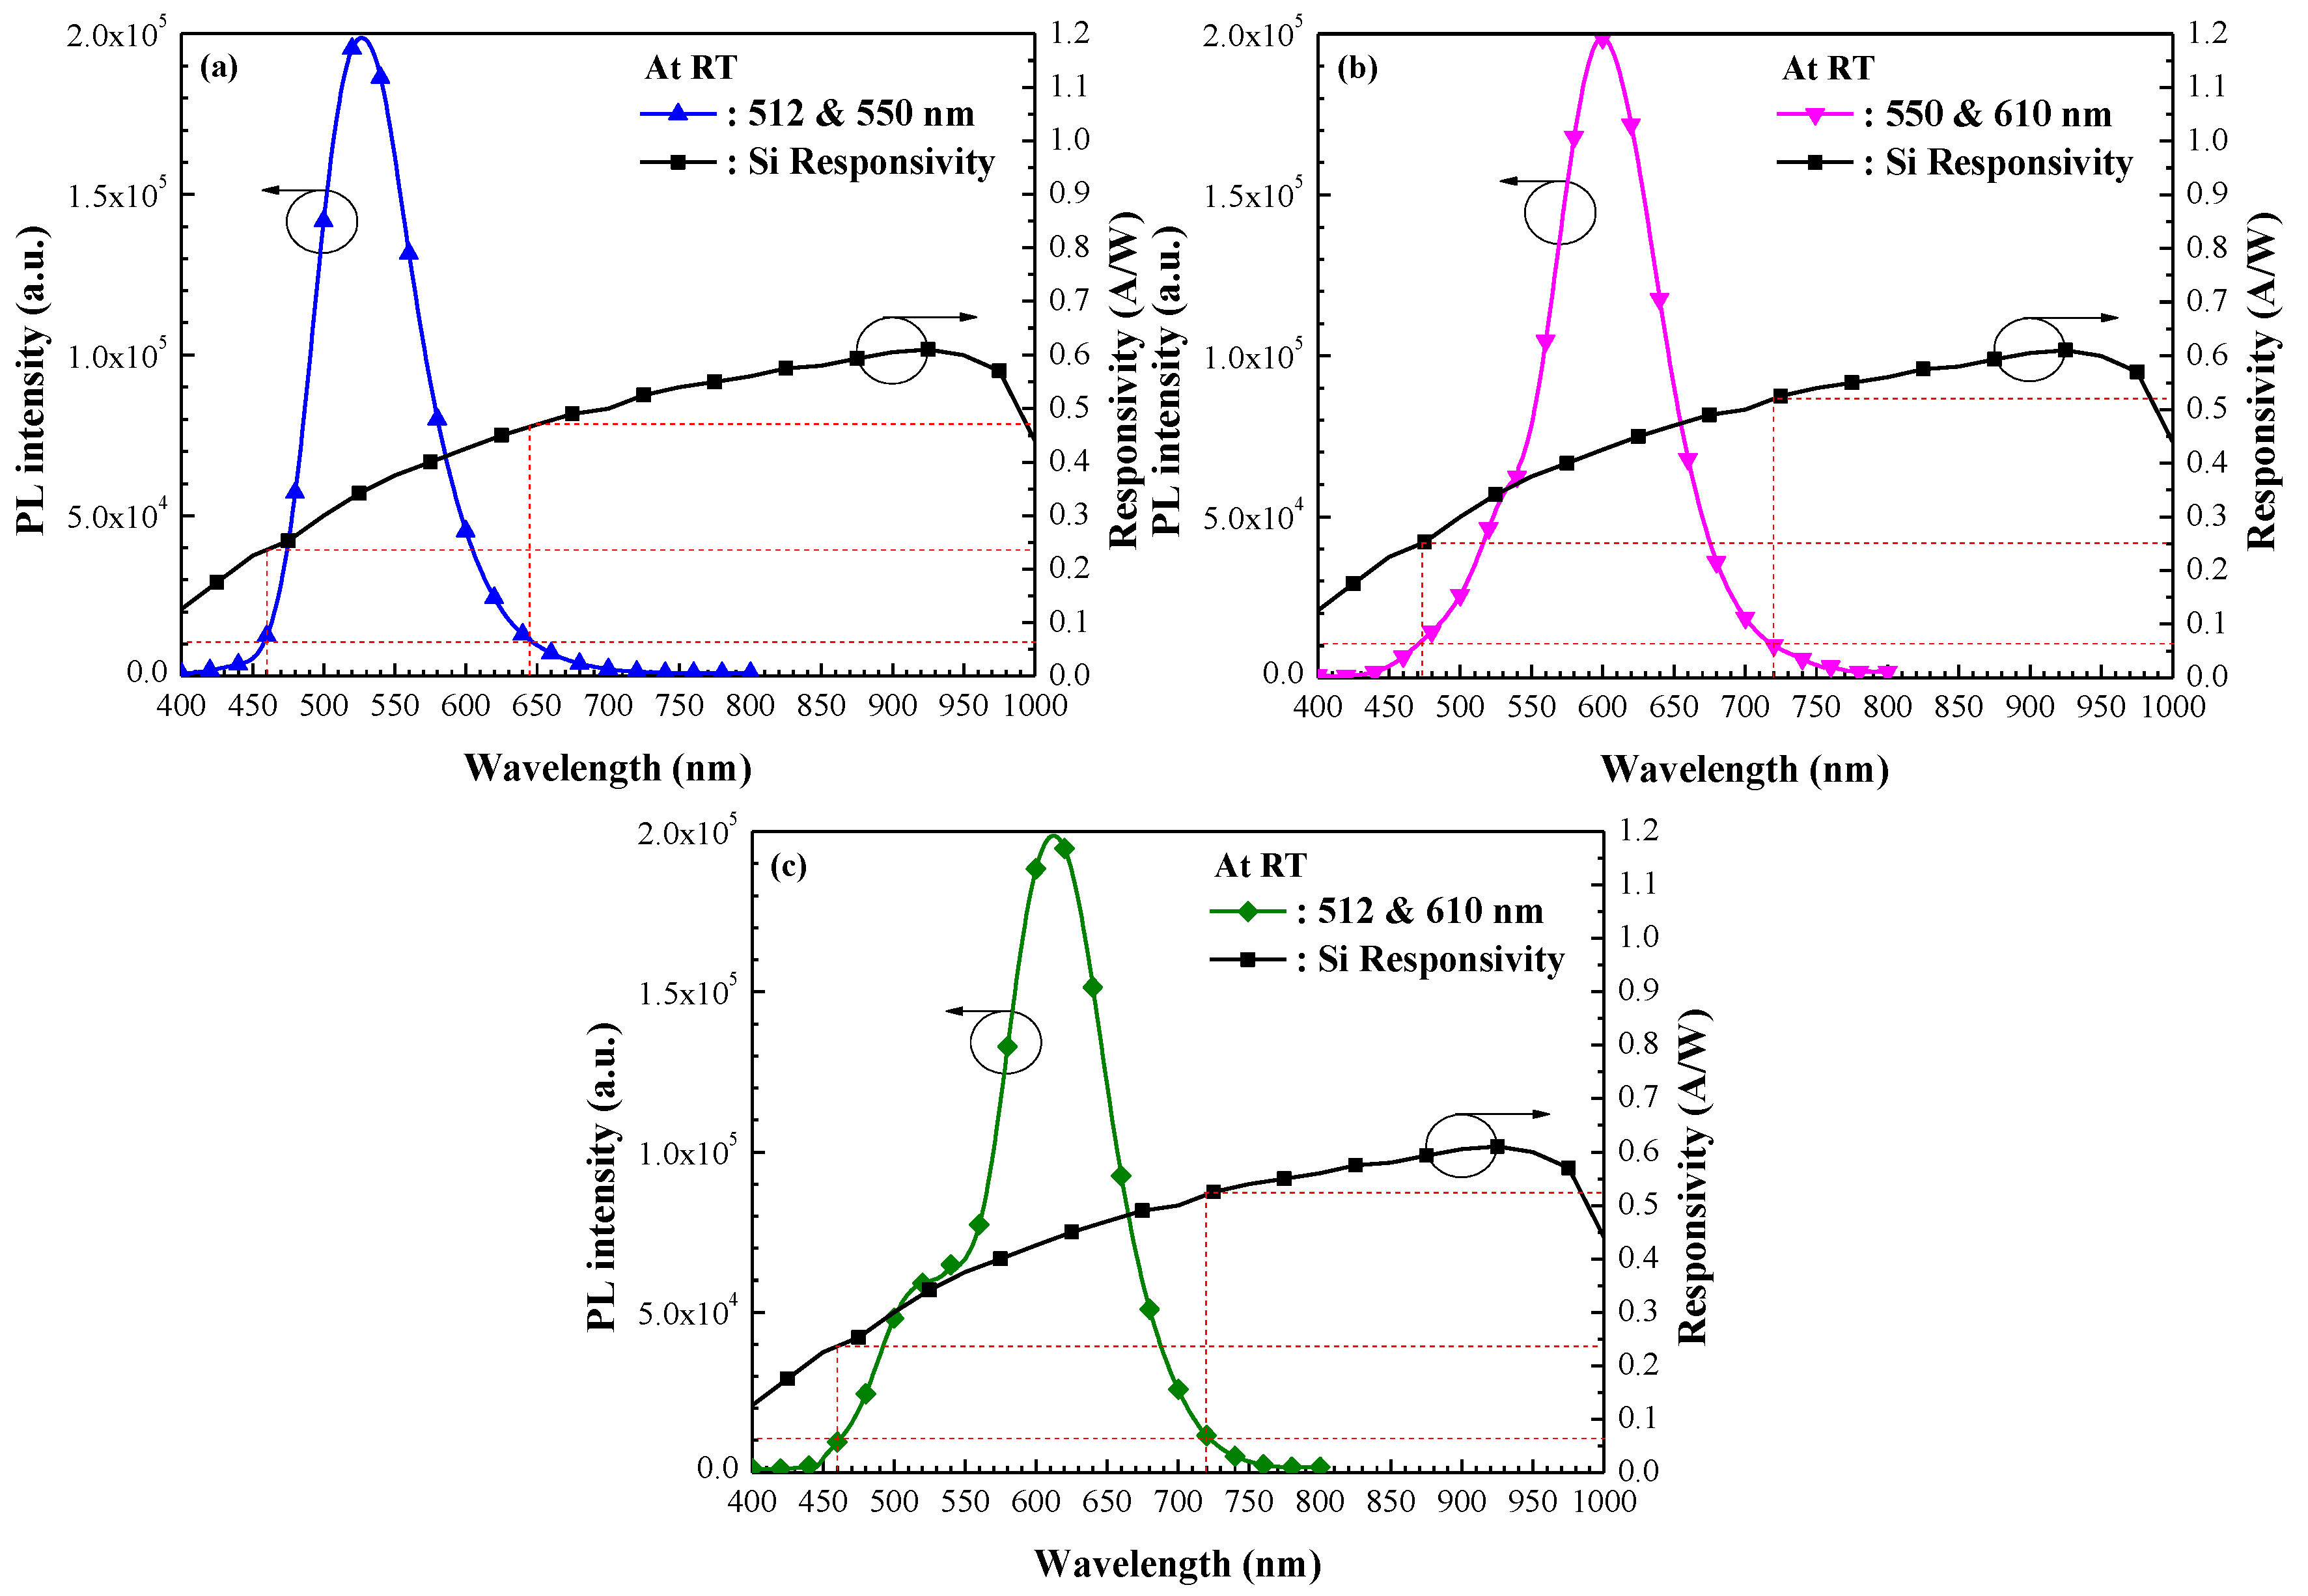
| Two-Species Combination of Eu-Doped Silicate Phosphors | PL Emission Wavelength Range (nm) @ 5% of Max. Intensity | Responsivity (R; A/W) @ PL Emission Wavelength Range |
|---|---|---|
| 512 + 550 nm | 460–645 | 0.24–0.47 |
| 550 + 610 nm | 472–720 | 0.25–0.52 |
| 512 + 610 nm | 460–720 | 0.24–0.53 |
| Silicon Solar Cell | EQEW (%) @ 320–1000 nm | EQEW (%) @ 320–470 nm |
|---|---|---|
| Bare Solar Cell (SC) | 49.60 | 32.26 |
| SC/SiO2 | 61.49 | 37.20 |
| SC/Eu-doped silicate phosphor-512 + 550 nm | 62.97 | 41.45 |
| SC/Eu-doped silicate phosphor-550 + 610 nm | 64.22 | 44.92 |
| SC/Eu-doped silicate phosphor-512 + 610 nm | 65.35 | 48.83 |
| (a) | ||||||
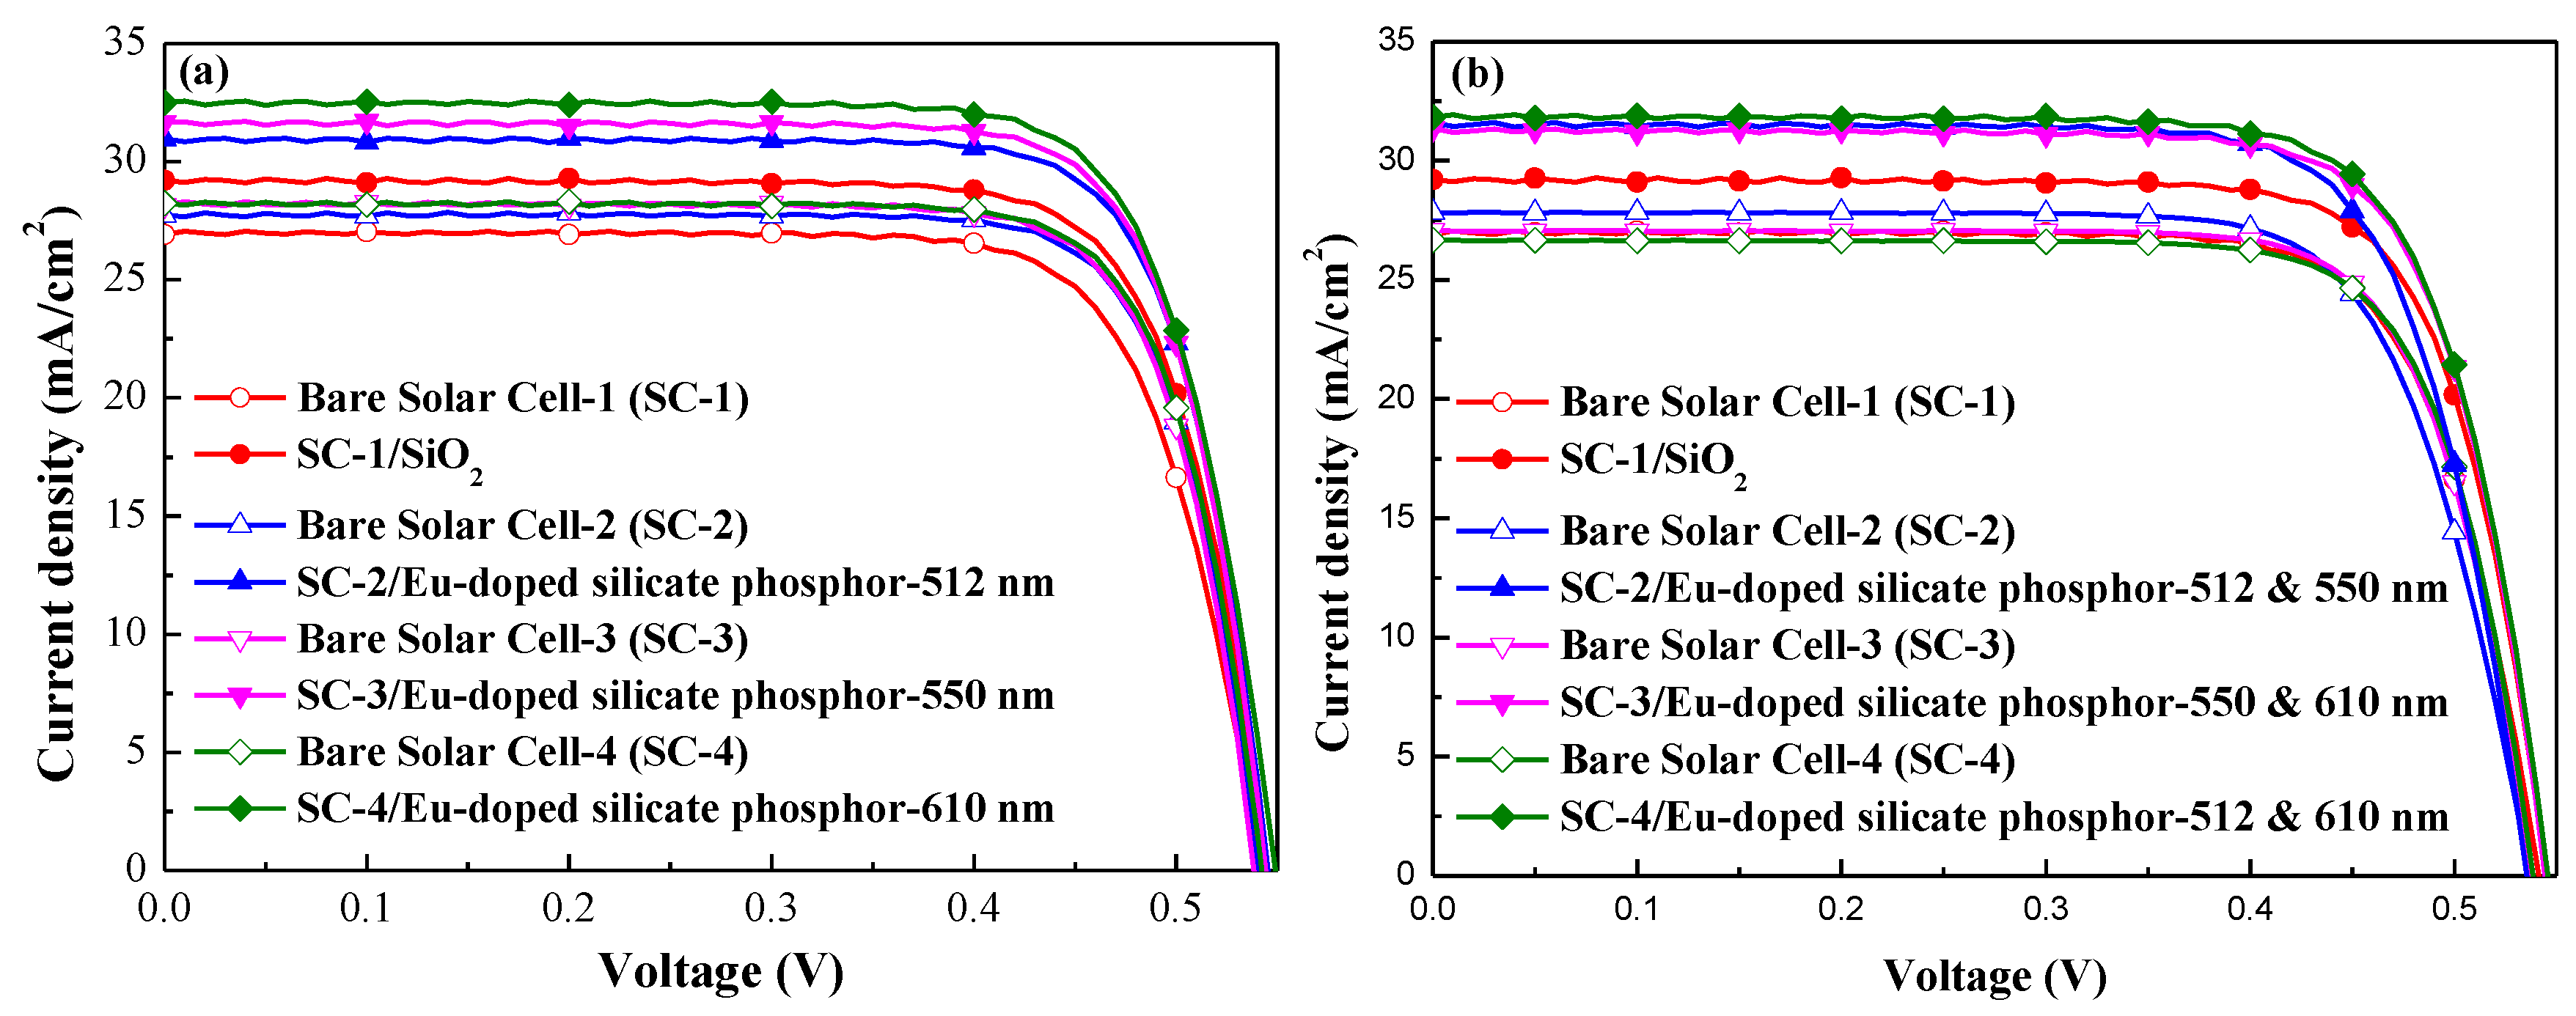
| Silicon Solar Cell | Voc (mV) | Jsc (mA/cm2) | Fill Factor (FF) (%) | η (%) | ΔJsc (%) | Δη (%) |
| Bare Solar Cell-1 (SC-1) | 541.3 | 26.92 | 76.45 | 11.14 | 8.51 | 10.23 |
| SC-1/SiO2 | 544.8 | 29.21 | 77.22 | 12.28 | ||
| Bare Solar Cell-2 (SC-2) | 539.9 | 27.74 | 78.79 | 11.80 | 11.64 | 11.69 |
| SC-2/Eu-doped silicate phosphor-512 nm | 545.4 | 30.97 | 78.07 | 13.18 | ||
| Bare Solar Cell-3 (SC-3) | 538.4 | 28.16 | 78.54 | 11.90 | 12.43 | 13.03 |
| SC-3/Eu-doped silicate phosphor-550 nm | 544.2 | 31.66 | 78.08 | 13.45 | ||
| Bare Solar Cell-4 (SC-4) | 542.3 | 28.24 | 78.21 | 11.97 | 15.08 | 14.79 |
| SC-4/Eu-doped silicate phosphor-610 nm | 549.1 | 32.50 | 77.01 | 13.74 | ||
| (b) | ||||||
| Silicon Solar Cell | Voc (mV) | Jsc (mA/cm2) | FF (%) | η (%) | ΔJsc (%) | Δη (%) |
| Bare Solar Cell-1 (SC-1) | 541.3 | 26.92 | 76.45 | 11.14 | 8.51 | 10.23 |
| SC-1/SiO2 | 544.8 | 29.21 | 77.22 | 12.28 | ||
| Bare Solar Cell-2 (SC-2) | 536.6 | 27.83 | 75.0 | 11.20 | 13.58 | 14.02 |
| SC-2/Eu-doped silicate phosphor-512 + 550 nm | 535.5 | 31.61 | 75.5 | 12.77 | ||
| Bare Solar Cell-3 (SC-3) | 537.3 | 27.08 | 77.1 | 11.22 | 15.81 | 16.49 |
| SC-3/Eu-doped silicate phosphor-550 + 610 nm | 544.3 | 31.36 | 76.5 | 13.07 | ||
| Bare Solar Cell-4 (SC-4) | 538.8 | 26.66 | 77.5 | 11.11 | 19.39 | 19.35 |
| SC-4/Eu-doped silicate phosphor-512 + 610 nm | 545.8 | 31.83 | 76.4 | 13.26 | ||
© 2017 by the authors. Licensee MDPI, Basel, Switzerland. This article is an open access article distributed under the terms and conditions of the Creative Commons Attribution (CC BY) license (http://creativecommons.org/licenses/by/4.0/).
Share and Cite
Ho, W.-J.; Shen, Y.-T.; Liu, J.-J.; You, B.-J.; Ho, C.-H. Enhancing Photovoltaic Performance Using Broadband Luminescent Down-Shifting by Combining Multiple Species of Eu-Doped Silicate Phosphors. Nanomaterials 2017, 7, 340. https://doi.org/10.3390/nano7100340
Ho W-J, Shen Y-T, Liu J-J, You B-J, Ho C-H. Enhancing Photovoltaic Performance Using Broadband Luminescent Down-Shifting by Combining Multiple Species of Eu-Doped Silicate Phosphors. Nanomaterials. 2017; 7(10):340. https://doi.org/10.3390/nano7100340
Chicago/Turabian StyleHo, Wen-Jeng, Yu-Tang Shen, Jheng-Jie Liu, Bang-Jin You, and Chun-Hung Ho. 2017. "Enhancing Photovoltaic Performance Using Broadband Luminescent Down-Shifting by Combining Multiple Species of Eu-Doped Silicate Phosphors" Nanomaterials 7, no. 10: 340. https://doi.org/10.3390/nano7100340