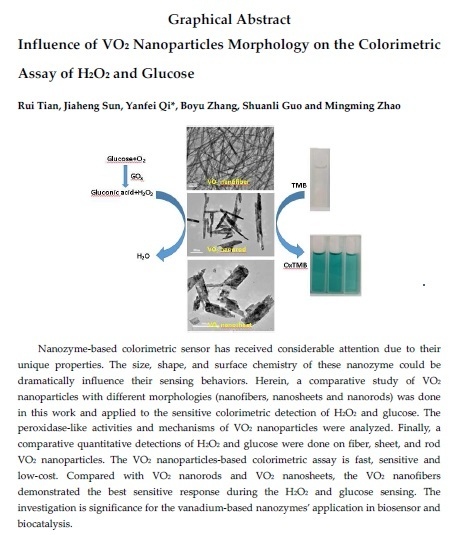
Influence of VO2 Nanoparticle Morphology on the Colorimetric Assay of H2O2 and Glucose

School of Public Health, Jilin University, Changchun 130021, Jilin, China
*
Author to whom correspondence should be addressed.
Nanomaterials 2017, 7(11), 347; https://doi.org/10.3390/nano7110347
Submission received: 30 September 2017
/
Revised: 19 October 2017
/
Accepted: 20 October 2017
/
Published: 25 October 2017
Abstract
:Nanozyme-based colorimetric sensors have received considerable attention due to their unique properties. The size, shape, and surface chemistry of these nanozymes could dramatically influence their sensing behaviors. Herein, a comparative study of VO2 nanoparticles with different morphologies (nanofibers, nanosheets, and nanorods) was conducted and applied to the sensitive colorimetric detection of H2O2 and glucose. The peroxidase-like activities and mechanisms of VO2 nanoparticles were analyzed. Among the VO2 nanoparticles, VO2 nanofibers exhibited the best peroxidase-like activity. Finally, a comparative quantitative detections of H2O2 and glucose were done on fiber, sheet, and rod nanoparticles. Under the optimal reaction conditions, the lower limit of detection (LOD) of the VO2 nanofibers, nanosheets, and nanorods for H2O2 are found to be 0.018, 0.266, and 0.41 mM, respectively. The VO2 nanofibers, nanosheets, and nanorods show the linear response for H2O2 from 0.025–10, 0.488–62.5, and 0.488–15.625 mM, respectively. The lower limit of detection (LOD) of the VO2 nanofibers, nanosheets, and nanorods for glucose are found to be 0.009, 0.348, and 0.437 mM, respectively. The VO2 nanofibers, nanosheets, and nanorods show the linear response for glucose from 0.01–10, 0.625–15, and 0.625–10 mM, respectively. The proposed work will contribute to the nanozyme-based colorimetric assay.
1. Introduction
Natural enzymes with great catalytic capacity and high substrate specificity have attracted much research interest in the fields of medicine, biology, and food industry. Despite these broad developments, natural enzymes often have inherent drawbacks, such as high preparation and purification costs, low operational stability, sensitivity of catalytic activity to environmental conditions, and difficulty of recovery. These shortcomings are limited to its practical application [1]. Artificial mimic enzymes have the characteristics of high catalytic efficiency, stability, economy, and large-scale preparation which has been rapidly developed in the fields of medicine, chemical industry, food, agriculture, environmental science, and analytical chemistry [2]. Among the various artificial mimic enzymes, nanozymes as the new-generation emzyme-mimetic have attracted considerable interest since the ferroferric oxide nanomaterial has the catalytic properties similar to horseradish peroxidase (HRP) [3]. Many nanoparticles have been studied as enzyme mimetics, including ferromagnetic NPs [3,4,5,6,7,8,9,10,11], cerium oxide NP [12,13,14], metal NPs [15,16,17,18,19,20,21,22,23], carbon-based nanomaterials [24,25,26,27,28], V2O5 nanowires [29,30], and perovskite oxide [31,32].
Vanadium dioxide (VO2) have received considerable attention for their redox activity and layered structures, which can serve as very good intercalation materials and smart sensors [33]. The VO2 exists in multiple morphologies, such as fibers, nanorods, nanosheets, spheres, and hollow spheres [34,35]. The shape of the nanoparticle has attracted growing interest due to its effect on the catalytic, optical, electronic, and magnetic properties [9,36,37,38,39,40,41]. For example, one-dimensional (1D) nanostructures—such as nanotubes, nanorods, and nanowires—exhibit higher activity and durability, compared with zero-dimensional (0D) nanostructures, due to possessing fewer lattice boundaries, fewer defect sites, and longer segments of surface crystalline planes [36]. Therefore, we focused on the effect of different morphology on the catalytic activities of VO2 nanoparticles in order to obtain more information for their potential applications in biosensor and biocatalysts.
Herein, different morphologies VO2 nanoparticles—including fibers, sheets, and rods—were synthesized. The catalysis activities and kinetic mechanic of various VO2 nanoparticles were investigated upon the reaction of hydrogen peroxide with its reducing substrates 3,3′,5,5′-tetramethybenzidine (TMB). The hydrogen peroxide and glucose colorimetric sensors were developed based on VO2 nanoparticles with different shapes. In this colorimetric assay, different analytical parameters—such as concentrations of nanoparticles, buffer solution, and pH of the analyte medium—were determined. Under optimal reaction conditions, the detection system of fiber-like VO2 nanoparticles shows the most sensitive response to H2O2 and glucose than the other two VO2 nanoparticles.
2. Results and Discussions
2.1. Characterization of VO2 Nanoparticles
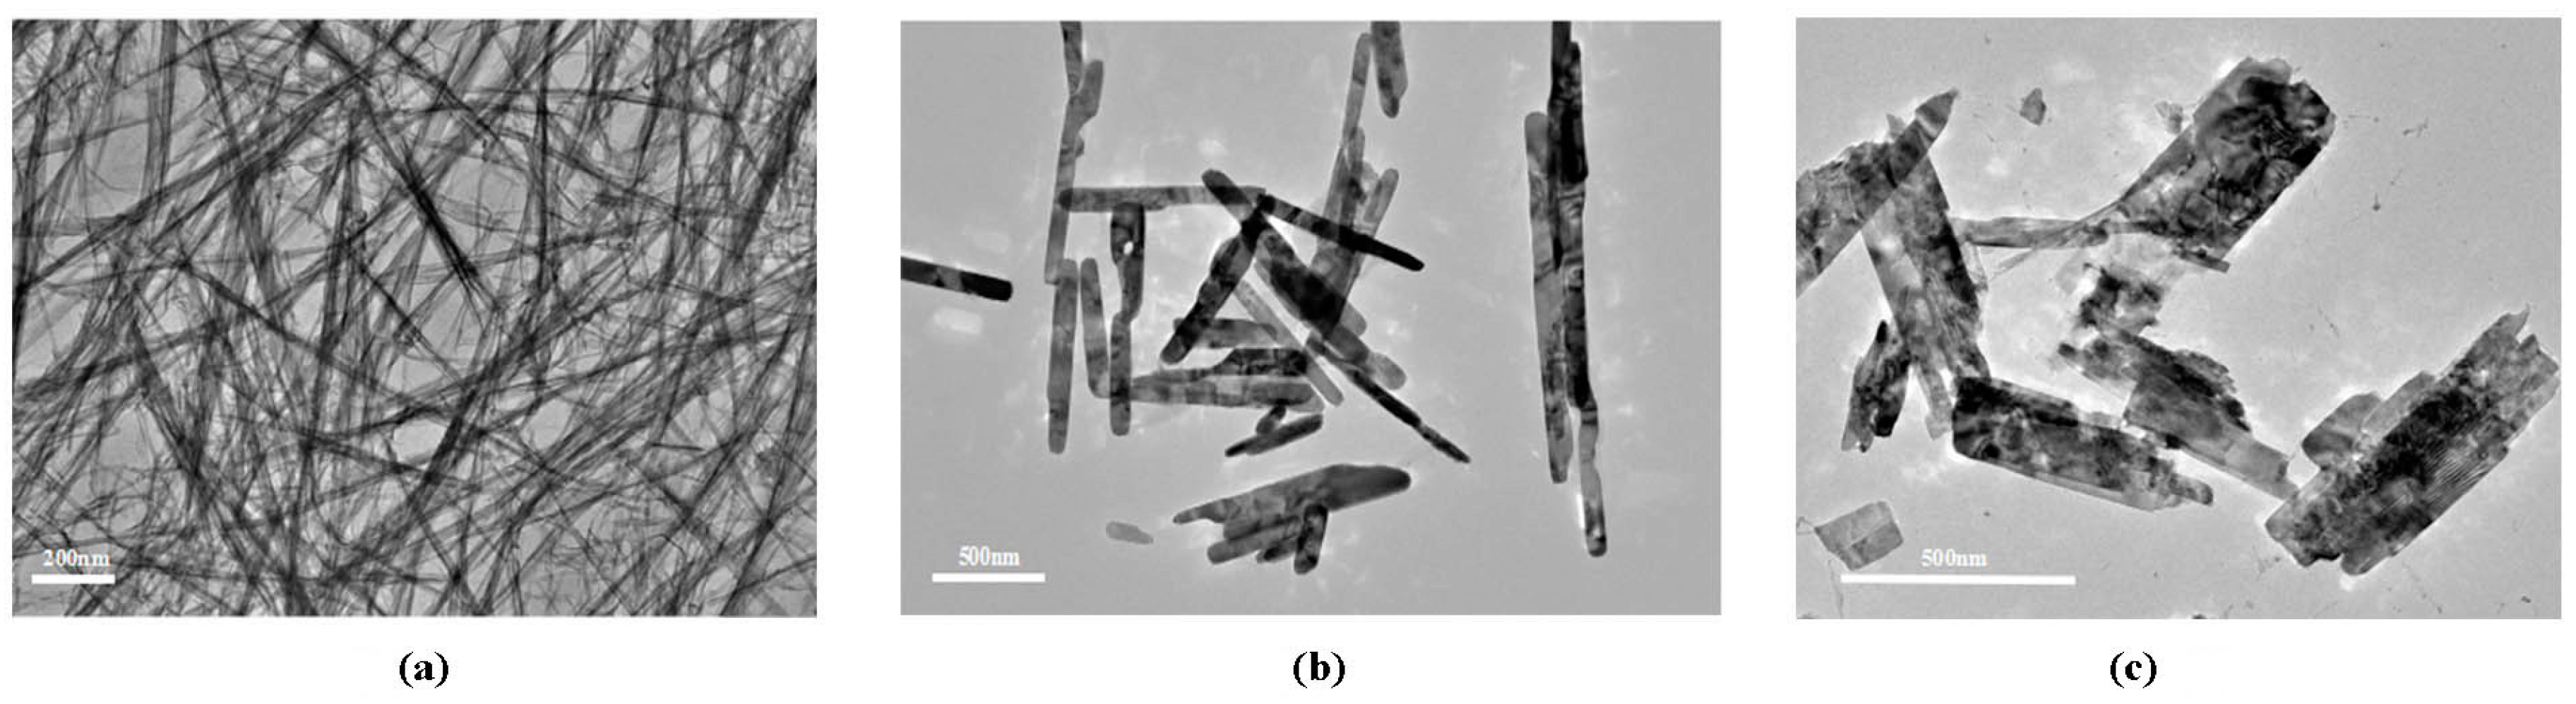
The structural characterizations of the VO2 nanoparticles were done by transmission electron microscopy (TEM) and X-ray powder Diffraction (XRD). TEM images indicate the VO2 nanoparticles of different morphology, fibers, rods, and sheets (Figure 1). The formation of VO2 nanoparticles is confirmed from the X-ray diffraction pattern (Figure 2). The VO2 nanoparticles with fiber, sheet, and rod shapes have the same crystal structures as those reported in the literature [34,35], and are monoclinic VO2 (Joint Committee on Powder Diffraction Standards card No. 31-1438 and No. 65-7960: see Figure 2).
2.2. Principle
In pH 4 citrate buffer solution at room temperature, VO2 nanoparticles with different morphologies catalyzed the oxidation of a peroxidase substrate 3,3′,5,5′-tetramethylbenzidine (TMB) in the presence of H2O2 to obtain the TMB oxidized product with blue color. As shown in Figure 3, when various VO2 nanoparticles were added into the TMB/H2O2 solution, the strong absorption peaks were obtained at 656 nm. However, there were no strong absorption peaks when the solution did not contain H2O2 or VO2 nanoparticles. The absorbance becomes stronger due to more TMB being oxidized with the increasing of the concentration of H2O2. The absorbance also showed a linear trend depending on the concentration of H2O2.
2.3. Effect of pH
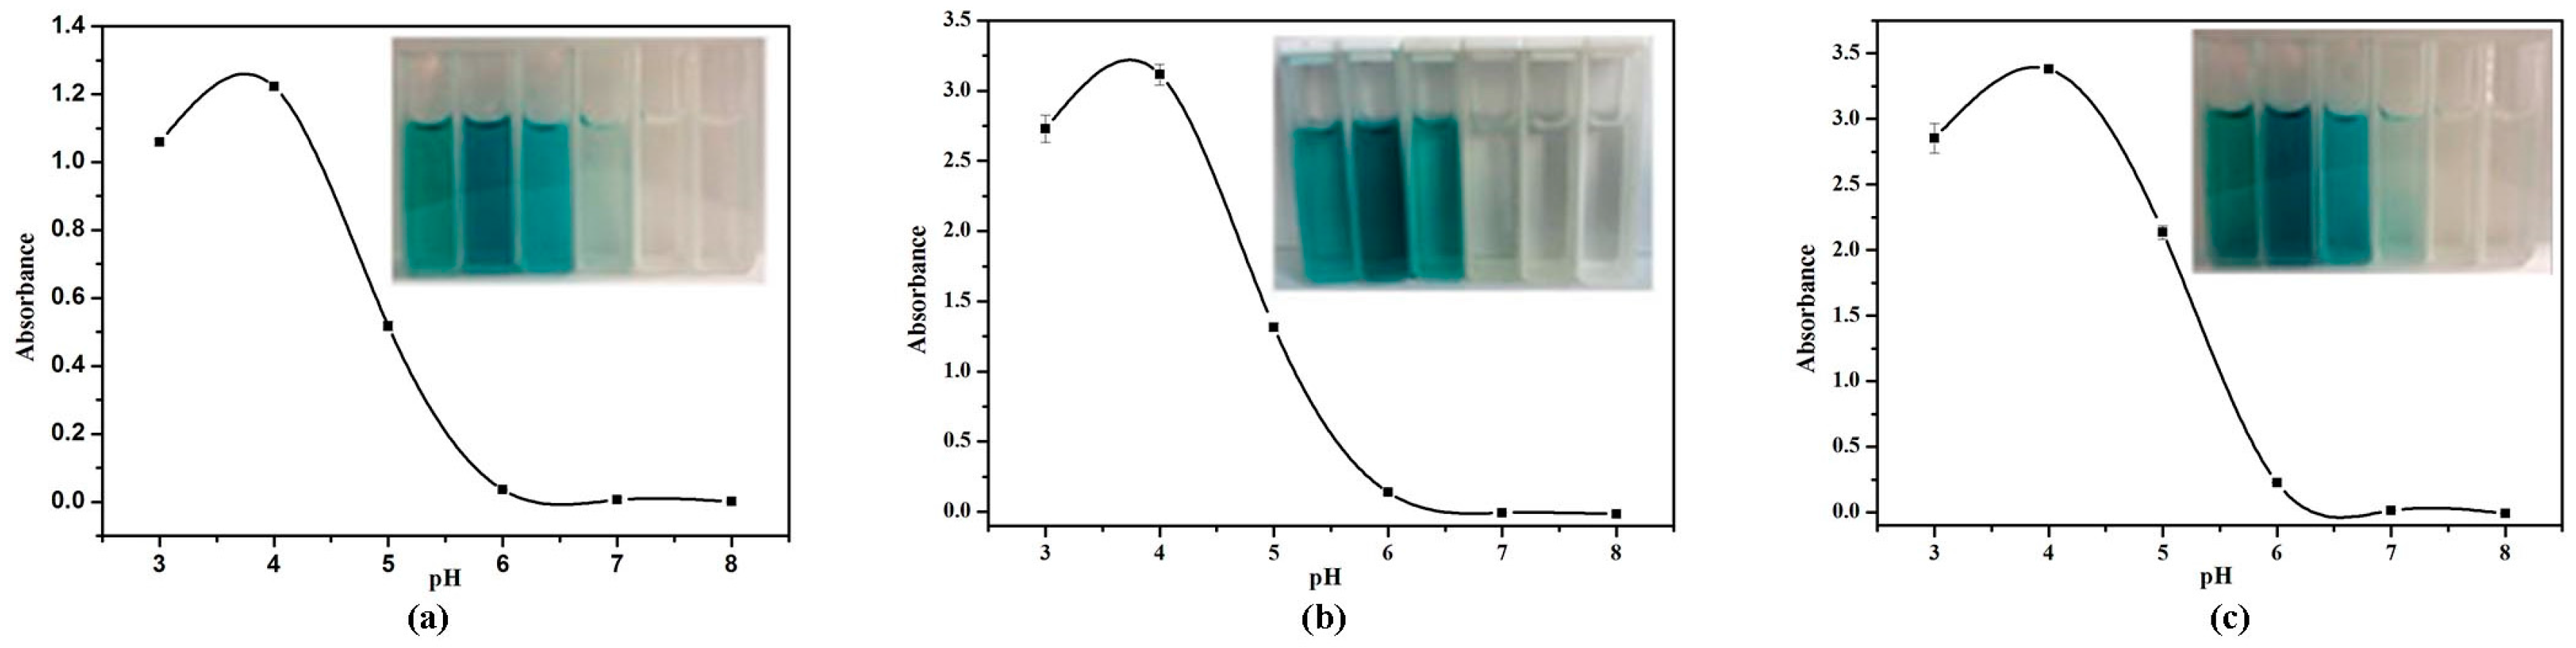
The effect of pH value (pH 3.0–8.0) on absorption value with TMB was investigated in the citrate buffer system, as shown in Figure 4. Each of the VO2 nanofibers, nanosheets, and nanorods of the system reached their maximum peaks when the pH value was 4.0. Therefore, pH 4.0 was selected to detect H2O2 and glucose with various VO2 nanoparticles.
2.4. Effect of Buffers
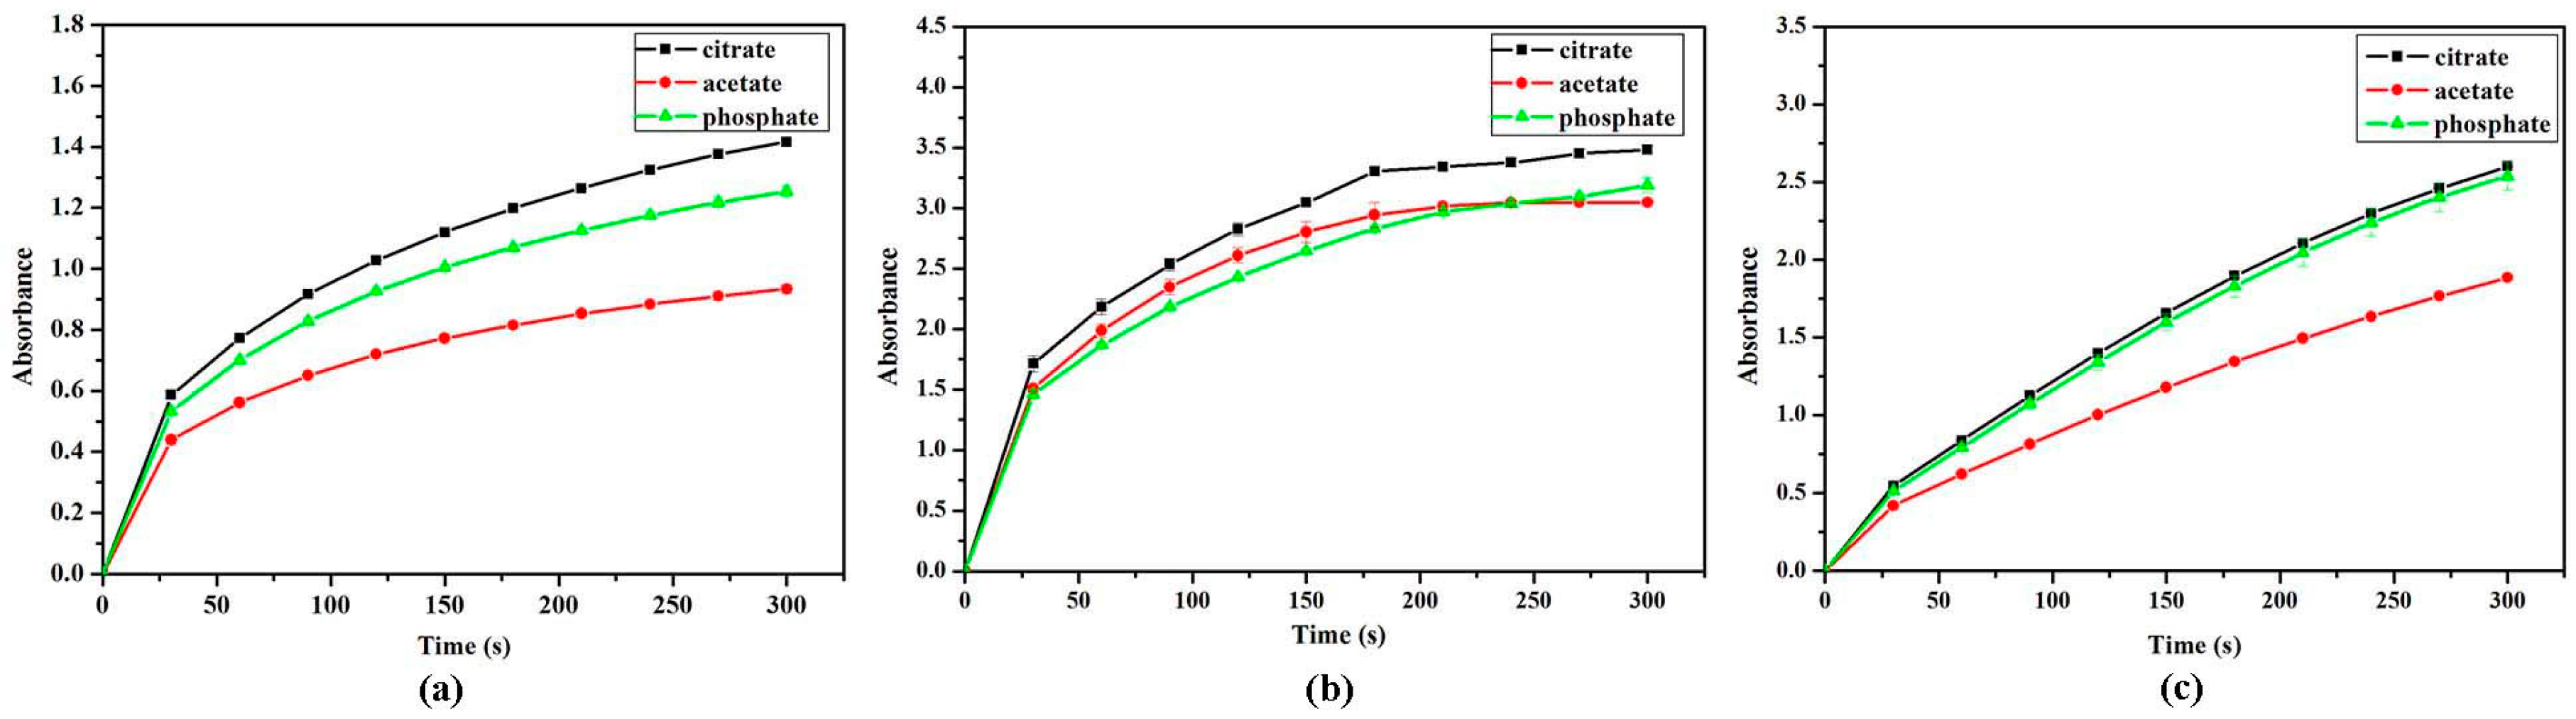
The effect of buffers on absorption value of TMB oxide product was examined. The time response curves of TMB with H2O2 catalyzed by VO2 with different morphologies, in pH 4.0, 0.2 M acetate, phosphate, and citrate buffers. The results were shown in Figure 5. Up to 300 s, the VO2 nanoparticles were more active in the citrate buffer solution. Thus, the citrate buffer solution (pH = 4.0, 0.2 M), was chosen as the optimal reaction solution for the H2O2 and glucose colorimetric assay.
2.5. Effect of VO2 Nanoparticle Morphologies and Concentrations
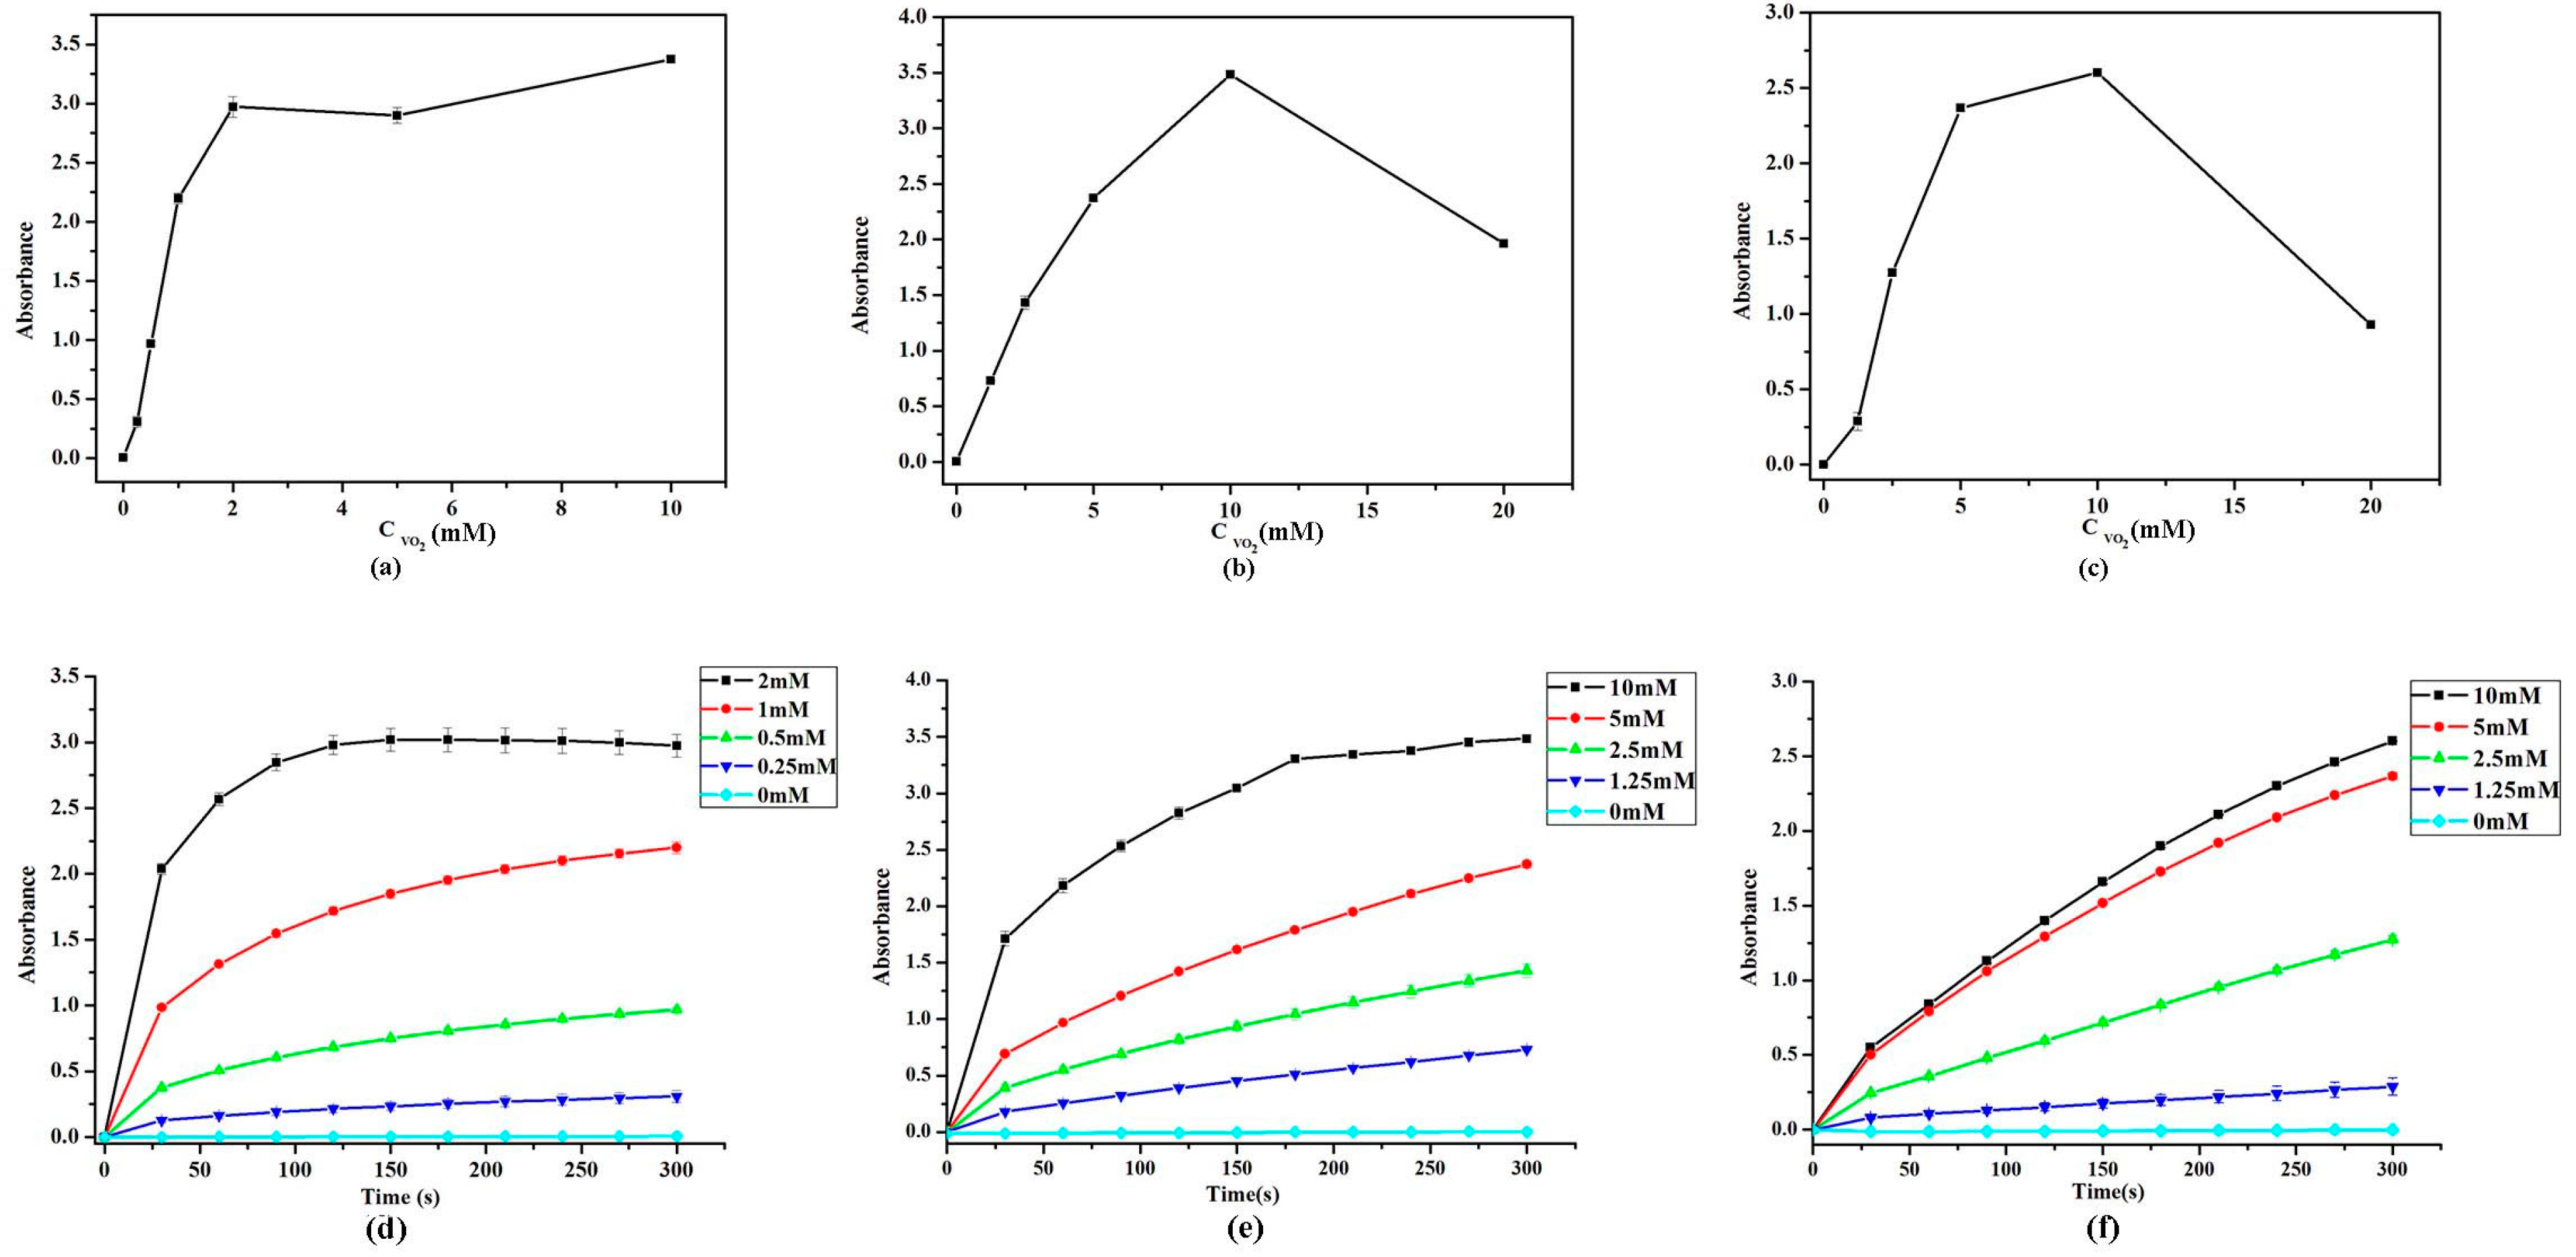
As shown in Figure 6, the absorption values at OD656nm of TMB oxide product increased gradually with the concentration of VO2 nanoparticles. The system reached its maximum absorption value when the concentrations of VO2 nanofibers, nanosheets, and nanorods were 10, 10, and 2 mM, respectively. The results show that the catalytic activity of VO2 nanofibers is stronger than the other two, shown in the Figure 6.
2.6. Steady-State Kinetic Assay
For further understanding the influence of particle morphology on the catalytic mechanism of VO2 nanoparticles, the steady-state kinetic assay for VO2 nanoparticles were determined in detail. As shown in Figure 7, the typical Michaelis-Menten curve were obtained for VO2 nanozymes. Michaelis-Menten constant (KM) and maximum initial velocity (Vmax) were known from Michaelis-Menten curve use a Lineweaver-Burk plot. A comparison of the kinetic parameters of VO2 nanozymes, V2O5 nanozymes, Fe3O4 magnetic nanoparticle (MNPS), and HRP was given in Table 1. The KM of VO2 nanofibers, nanosheets, and nanorods with TMB were 0.518, 0.111, and 0.801 mM, respectively. The Vmax of VO2 nanofibers, nanosheets, and nanorods with TMB were 9.3 × 10⁻⁵, 1.68 × 10⁻⁴, and 3.99 × 10⁻⁴ M·s−1, respectively. The KM of VO2 nanofibers, nanosheets, and nanorods with H2O2 were 1.043, 2.924, and 6.469 mM. The Vmax of VO2 nanofibers, nanosheets, and nanorods with H2O2 were 4.66 × 10⁻⁴, 9.73 × 10⁻⁴, and 1.46 × 10⁻³ M·s−1, respectively. The KM values shows that VO2 nanosheets with TMB as the substrate was apparently lower than VO2 nanofibers, VO2 nanorods, V2O5 nanozymes, Fe3O4 MNPS, and HRP. It shows that the VO2 nanosheets have a higher affinity to TMB compared with VO2 nanofibers, VO2 nanorods, Fe3O4 MNPS, and HRP. Which means that a lower TMB concentration was required to reach the maximal activity for VO2 nanosheets. The apparent KM values of VO2 nanofibers with H2O2 as the substrate was apparently lower than VO2 nanorods, VO2 nanosheets, Fe3O4 MNPS, and HRP. It shows that the VO2 nanofibers have a higher affinity for H2O2 compared with VO2 nanosheets, VO2 nanorods, Fe3O4 MNPS, and HRP. That means a lower H2O2 concentration was required to reach the maximal activity for VO2 nanofibers.
2.7. Calibration Curve for H2O2 and Glucose Detection
Under the optimal conditions (pH 4.0 citrate buffer, the concentrations of VO2 nanofibers, nanosheets and nanorods were 2, 10, and 10mM, respectively.) the calibration curves of H2O2 were obtained with VO2 nanoparticles different morphologies (Figure 8). The correlation between the absorbance values and H2O2 concentration are linear over the range of 0–100 mM (nanofibers), 0–500 mM (nanosheets) and 0–500 mM (nanorods) with correlation coefficients 0.99981, 0.99364, and 0.99222, respectively. The lower limit of detection (LOD) of the VO2 nanofibers, nanosheets, and nanorods for H2O2 are found to be 0.018, 0.266, and 0.41 mM, respectively.
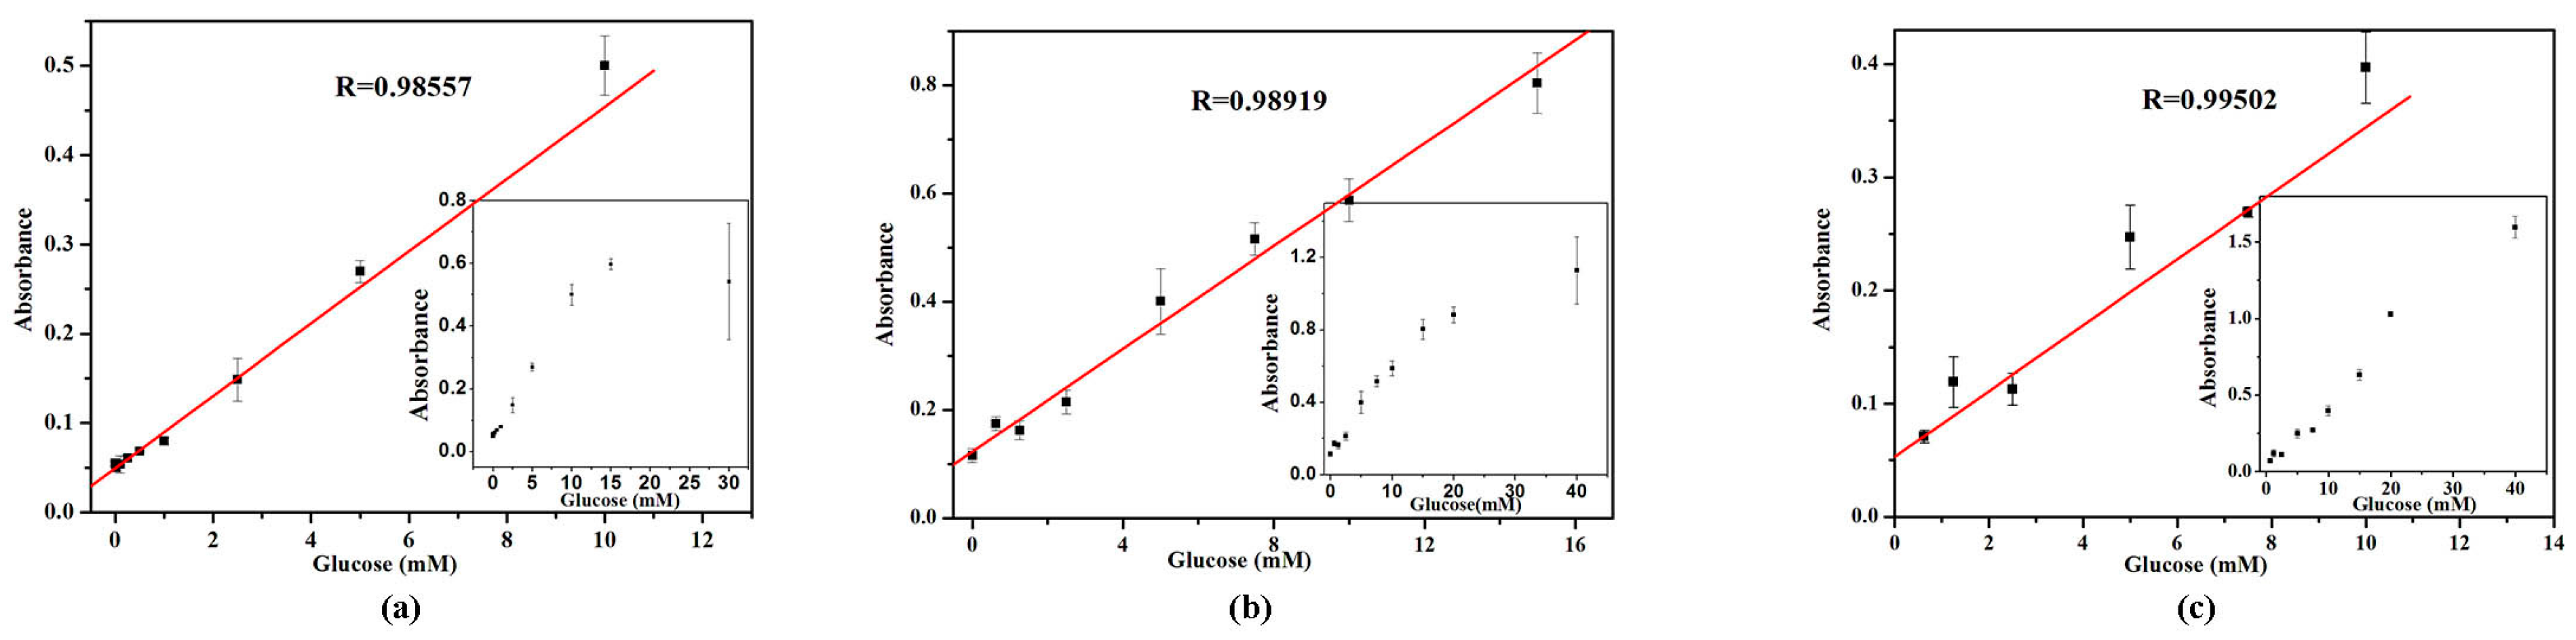
As glucose oxidase (GOx) can catalyze the oxidation of glucose and produce H2O2, the absorption value with TMB was changing by H2O2 in presence of VO2 nanoparticles. Because the GOx would be denatured in pH 4.0 buffer, the glucose detection was produced in two steps: first, H2O2 was induced by GOx oxidation of glucose and then the reaction solutions were detected by TMB/different VO2 nanoparticles system. As shown in Figure 9, the absorbtion increases gradually with the increasing of glucose concentration. The correlation between the absorbance at 656 nm and glucose concentration are linear over the range of 0–30 mM (nanofibers), 0–40 mM (nanosheets) and 0–40 mM (nanorods) with the correlation coefficient of 0.98557, 0.98919, and 0.99502, respectively. The lower limit of detection (LOD) of the VO2 nanofibers, nanosheets, and nanorods for glucose are found to be 0.009, 0.348, and 0.437 mM, respectively.
The VO2 nanofibers showed the highest peroxidase activity in the H2O2 and glucose colorimetric assay, followed by VO2 nanosheets, and finally VO2 nanorods. Additionally, it was reported that the specific surface area of VO2 nanoparticles greatly influences their catalytic activities. The specific surface area of VO2 nanofibers (185 to 122 m2 g−1) [34] is also much larger than that of other VO2 micro/nanoparticles, such as hollow microspheres (22.3 m2 g−1), nanowires (12.3 m2 g−1) [42], nanobelts (18.6 m2 g−1) [43], nanorods (42 m2 g−1) [44], VO2 mesocrystals (28.4 m2 g−1) [45], mesoporous VO2 nanowires (46.7 m2 g−1) [46], and 3D GO-VO2 nanosheet flowers (71.6 m2 g−1) [47]. Therefore, the VO2 nanofibers demonstrated the most sensitive response during the H2O2 and glucose sensing. By comparing with other nanozymes to further understanding the catalytic activity of VO2 nanozymes as peroxidase mimetics, as shown in Table 2, the VO2 nanofibers have a wider linear range.
3. Materials and Methods
3.1. Chemicals and Materials
All the chemicals used were of analysis grade without further purification. 3,3′,5,5′-Tetramethylbenzidine (TMB) was obtained from Tokyo Chemical Industry Co., Ltd. (Tokyo, Japan). Glucose oxidase (GOx) was obtained from Aladdin Reagent Co., Ltd. (Shanghai, China). V2O5, oxalic acid, methanol, glucose, hydrogen peroxide (H2O2, 30%), etc., were purchased from Beijing Chemical Works (Beijing, China). The water used in the experiments was purified.
3.2. Synthesis of VO2 Nanoparticles
The synthesis of VO2 nanofiber contains two steps: synthesis of VO2 hollow sphere and the supernatant collecting and drying. According to the literature procedure [35] synthesis of VO2 hollow sphere, with minor adjustment. Briefly, V2O5 and oxalic acid (the ratio of molar is 1:3) were first dissolved in 7 mL distilled water and stirred for 10 min at room temperature. Then the 23 mL methanol was added in the solution and stirred for another 10 min. The mix solution was transferred to a Teflon-lined autoclave with stainless steel, and heated at 200 °C for 24 h. The sample was cooled down naturally. The black precipitates were filtered off and washed with distilled water and ethanol, and then dried at 80 °C overnight, and finally the VO2 hollow spheres were dissolved, the supernatant was collected and dried. Similar procedures were adopted to prepare nanorods and nanosheets: when the water content is 10 mL, the product is nanorods, and when the solution is completely water, the product is just nanosheets (with water and methanol measures maintained at 30 mL).
3.3. Physical Characterization
The morphology and size of the VO2 nanoparticles were acquired using a transmission electron microscopy (TEM) by JEM-1011 transmission electron microscopy (JEOL, Tokyo, Japan) with a working voltage at 100 kV. The X-ray powder diffraction method was carried out in a D/max-rα power diffractometer (Rigaku, Tokyo, Japan) using Cu-Kα monochromatic radiation (λ = 1.5418 Å).
3.4. H2O2 Detection Using VO2 Nanoparticles as Peroxidase Mimetics
To discover the peroxidase-like character of VO2 nanoparticles, the experiments were performed as follows: 60 μL VO2 nanoparticles solution (the concentrations of nanofibers, nanosheets, and nanorods are 2, 10, and 10 mM, respectively) in a reaction volume of 2400 μL citrate buffer solution (pH = 4.0) and 480 μL TMB solution (1.5 mM in ethanol), followed by the addition of 60 μL H2O2 (30%). The mixed solution was reacted for 5 min at room temperature. Then used for the UV-Vis spectrophotometer (Metash Instruments Inc., Shanghai, China) record the spectra at 656 nm for TMB.
To investigate the influence of buffer solution on the VO2 nanoparticle characteristics, the pH—ranging from 3.0 to 8.0 of the buffer solution—was examined, under conditions identical to these used above.
To investigate the influence of different reaction buffers on the VO2 nanoparticles characteristics, catalytic reactions incubated in difference buffer solution—including citrate, phosphate, and acetate—were examined, under conditions identical to these used in above. For a blank, only substrate solution was used. All experiments were conducted at room temperature (25 °C).
3.5. Glucose Detection Using VO2 Nanoparticles
Glucose detection was examined as follows: (a) 200 μL of GOx (1 mg/mL) and 200 μL of glucose of different concentrations in 400 μL of phosphate buffered saline (PBS, pH = 7.0) were incubated at 37 °C for 60 min; (b) 400 μL of TMB (1.5 mM in ethanol) and 50 μL of VO2 nanoparticles solution (the concentrations of nanofibers, nanosheets, and nanorods are 2, 10, and 10 mM, respectively) in 1750 μL of citrate buffer solution (pH = 4.0) were added into the above glucose reaction solution; (c) The mixed solutions with different concentrations of glucose were incubated for 5 min; the (d) the UV-Vis spectrophotometer was used to record the spectra.
4. Conclusions
VO2 nanoparticles with different structures—nanofibers, nanosheets, and nanorods—have been successfully fabricated and show peroxidase-like activities. The catalytic behaviors of VO2 nanoparticles show Michaelis-Menten kinetics and good affinity to both H2O2 and TMB. The VO2 nanoparticle-based colorimetric assay provides fast, sensitive, and low-cost H2O2 and glucose sensors. Compared with VO2 nanorods and VO2 nanosheets, the VO2 nanofibers demonstrated the most sensitive response during the H2O2 and glucose sensing. This investigation is significant for vanadium-based nanozyme application in biosensor and biocatalysis.
Acknowledgments
This work was financially supported by NSFC (81402719) and Norman Bethune Program of Jilin University (2015228).
Author Contributions
Yanfei Qi conceived and designed the experiments; Rui Tian performed the experiments and analyzed the data; Yanfei Qi contributed reagents, materials, and analysis tools; Boyu Zhang, Yanfei Qi, Rui Tian, Shuanli Guo, Jiaheng Sun, and Mingming Zhao wrote the paper.
Conflicts of Interest
The authors declare no conflict of interest. The founding sponsors had no role in the design of the study; in the collection, analyses, or interpretation of data; in the writing of the manuscript, or in the decision to publish the results.
References
- Huang, Y.Y.; Ran, X.; Lin, Y.H.; Ren, J.S.; Qu, X.G. Self-assembly of an organic-inorganic hybrid nanoflower as an efficient biomimetic catalyst for self-activated tandem reactions. Chem. Commun. 2015, 51, 4386–4389. [Google Scholar] [CrossRef] [PubMed]
- Liang, A.H.; Wang, X.L.; Wen, G.Q.; Jiang, Z.L. A sensitive and selective Victoria blue 4R SERS molecular probe for sodium lauryl sulfate in AuNP/AgCl sol substrate. Sens. Actuators B 2017, 244, 275–281. [Google Scholar] [CrossRef]
- Gao, L.Z.; Zhuang, J.; Nie, L.; Zhang, J.B.; Zhang, Y.; Gu, N.; Wang, T.H.; Feng, J.; Yang, D.L.; Perrett, S.; et al. Intrinsic peroxidase-like activity of ferromagnetic nanoparticles. Nat. Nanotechnol. 2007, 2, 577–583. [Google Scholar] [CrossRef] [PubMed]
- Srikanth Vallabani, N.V.; Karakoti, A.S.; Singh, S. ATP-mediated intrinsic peroxidase-like activity of Fe3O4-based nanozyme: One step detection of blood glucose at physiological pH. Colloids Surfaces B 2017, 153, 52–60. [Google Scholar] [CrossRef] [PubMed]
- Wei, H.; Wang, E. Fe3O4 Magnetic Nanoparticles as Peroxidase Mimetics and Their Applications in H2O2 and Glucose Detection. Anal. Chem. 2008, 80, 2250–2254. [Google Scholar] [CrossRef] [PubMed]
- Zhang, X.Q.; Gong, S.W.; Zhang, Y.; Yang, T.; Wang, C.Y.; Gu, N. Prussian blue modified iron oxide magnetic nanoparticles and their high peroxidase-like activity. Mater. Chem. 2010, 20, 5110–5116. [Google Scholar] [CrossRef]
- Shi, W.B.; Zhang, X.D.; He, S.H.; Huang, Y.M. CoFe2O4 magnetic nanoparticles as a peroxidase mimic mediated chemiluminescence for hydrogen peroxide and glucose. Chem. Commun. 2011, 47, 10785–10787. [Google Scholar] [CrossRef] [PubMed]
- Yu, F.Q.; Huang, Y.Z.; Cole, A.J.; Yang, V.C. The artificial peroxidase activity of magnetic iron oxide nanoparticles and its application to glucose detection. Biomaterials 2009, 30, 4716–4722. [Google Scholar] [CrossRef] [PubMed]
- Liu, S.H.; Lu, F.; Xing, R.M.; Zhu, J.J. Structural Effects of Fe3O4 Nanocrystals on Peroxidase-Like Activity. Chem. Eur. J. 2011, 17, 620–625. [Google Scholar] [CrossRef] [PubMed]
- Park, K.S.; Kim, M.I.; Cho, D.Y.; Park, H.G. Label-Free Colorimetric Detection of Nucleic Acids Based on Target-Induced Shielding Against the Peroxidase-Mimicking Activity of Magnetic Nanoparticles. Small 2011, 7, 1521–1525. [Google Scholar] [CrossRef] [PubMed]
- Wang, N.; Zhu, L.H.; Wang, M.Q.; Wang, D.L.; Tang, H.Q. Sono-enhanced degradation of dye pollutants with the use of H2O2 activated by Fe3O4 magnetic nanoparticles as peroxidase mimetic. Ultrason. Sonochem. 2010, 17, 78–83. [Google Scholar] [CrossRef] [PubMed]
- Korsvik, C.; Patil, S.; Seal, S.; Self, W.T. Superoxide dismutase mimetic properties exhibited by vacancy engineered ceria nanoparticles. Chem. Commun. 2007, 14, 1056–1058. [Google Scholar] [CrossRef] [PubMed]
- Asati, A.; Santra, S.; Kaittanis, C.; Nath, S.; Perez, J.M. Oxidase-Like Activity of Polymer-Coated Cerium Oxide Nanoparticles. Angew. Chem. Int. Ed. 2009, 48, 2308–2312. [Google Scholar] [CrossRef] [PubMed]
- Pirmohamed, T.; Dowding, J.M.; Singh, S.; Wasserman, B.; Heckert, E.; Karakoti, A.S.; King, J.E.; Seal, S.S.; Self, W.T. Nanoceria exhibit redox state-dependent catalase mimetic activity. Chem. Commun. 2010, 46, 2736–2738. [Google Scholar] [CrossRef] [PubMed]
- He, W.W.; Wu, X.C.; Liu, J.B.; Hu, X.N.; Zhang, K.; Hou, S.; Zhou, W.Y.; Xie, S.S. Design of AgM Bimetallic Alloy Nanostructures (M = Au, Pd, Pt) with Tunable Morphology and Peroxidase-Like Activity. Chem. Mater. 2010, 22, 2988–2994. [Google Scholar] [CrossRef]
- Jv, Y.; Li, B.X.; Cao, R. Positively-charged gold nanoparticles as peroxidiase mimic and their application in hydrogen peroxide and glucose detection. Chem. Commun. 2010, 46, 8017–8019. [Google Scholar] [CrossRef] [PubMed]
- Fan, J.; Yin, J.J.; Ning, B.; Wu, X.C.; Hu, Y.; Ferrari, M.; Anderson, G.J.; Wei, J.Y.; Zhao, Y.L.; Nie, G.J. Direct evidence for catalase and peroxidase activities of ferritine—platinum nanoparticles. Biomaterials 2011, 32, 1611–1618. [Google Scholar] [CrossRef] [PubMed]
- He, W.W.; Liu, Y.; Yuan, J.S.; Yin, J.J.; Wu, X.C.; Hu, X.N.; Zhang, K.; Liu, J.B.; Chen, C.Y.; Ji, Y.L.; et al. Au@Pt nanostructures as oxidase and peroxidase mimetics for use in immunoassays. Biomaterials 2011, 32, 1139–1147. [Google Scholar] [CrossRef] [PubMed]
- Liu, J.B.; Hu, X.N.; Hou, S.; Wen, T.; Liu, W.Q.; Zhu, X.; Wu, X.C. Screening of inhibitors for oxidase mimics of Au@Pt nanorods by catalytic oxidation of OPD. Chem. Commun. 2011, 47, 10981–10983. [Google Scholar] [CrossRef] [PubMed]
- Wang, X.X.; Wu, Q.; Shan, Z.; Huang, Q.M. BSA-stabilized Au clusters as peroxidase mimetics for use in xanthine detection. Biosens. Bioelectron. 2011, 26, 3614–3619. [Google Scholar] [CrossRef] [PubMed]
- Jiang, H.; Chen, Z.H.; Cao, H.Y.; Huang, Y.M. Peroxidase-like activity of chitosan stabilized silver nanoparticles for visual and colorimetric detection of glucose. Analyst 2012, 137, 5560–5564. [Google Scholar] [CrossRef] [PubMed]
- Wang, S.S.; Chen, Z.P.; Choo, J.; Chen, L.X. Naked-eye sensitive ELISA-like assay based on gold-enhanced peroxidase-like immunogold activity. Anal. Bioanal. Chem. 2016, 408, 1015–1022. [Google Scholar] [CrossRef] [PubMed]
- Chen, W.; Chen, J.; Liu, A.L.; Wang, L.M.; Li, G.W.; Lin, X.H. Peroxidase-like activity of cupric oxide nanoparticle. Chem. Cat. Chem. 2011, 3, 1151–1154. [Google Scholar] [CrossRef]
- Song, Y.J.; Qu, K.G.; Zhao, C.; Ren, J.S.; Qu, X.G. Graphene Oxide: Intrinsic Peroxidase Catalytic Activity and Its Application to Glucose Detection. Adv. Mater. 2010, 22, 2206–2210. [Google Scholar] [CrossRef] [PubMed]
- Song, Y.J.; Wang, X.H.; Zhao, C.; Qu, K.G.; Ren, J.S.; Qu, X.G. Label-Free Colorimetric Detection of Single Nucleotide Polymorphism by Using Single-Walled Carbon Nanotube Intrinsic Peroxidase-Like Activity. Chem. Eur. J. 2010, 16, 3617–3621. [Google Scholar] [CrossRef] [PubMed]
- Shi, W.B.; Wang, Q.L.; Long, Y.J.; Cheng, Z.L.; Chen, S.H.; Zheng, H.Z.; Huang, Y.M. Carbon nanodots as peroxidase mimetics and their applications to glucose detection. Chem. Commun. 2011, 47, 6695–6697. [Google Scholar] [CrossRef] [PubMed]
- Song, Y.J.; Chen, Y.; Feng, L.Y.; Ren, J.S.; Qu, X.G. Selective and quantitative cancer cell detection using target-directed functionalized graphene and its synergetic peroxidase-like activity. Chem. Commun. 2011, 47, 4436–4438. [Google Scholar] [CrossRef] [PubMed]
- Wang, X.H.; Qu, K.G.; Xu, B.L.; Ren, J.S.; Qu, X.G. Multicolor Luminescent Carbon Nanoparticles: Synthesis, Supramolecular Assembly with Porphyrin, Intrinsic Peroxidase-Like Catalytic Activity and Applications. Nano Res. 2011, 4, 908–920. [Google Scholar] [CrossRef]
- Andre, R.; Natalio, F.; Humanes, M.; Leppin, J.; Heinze, K.; Wever, R.; Schroder, H.C.; Muller, W.E.G.; Tremel, W. V2O5 Nanowires with an Intrinsic Peroxidase-Like Activity. Adv. Funct. Mater. 2011, 21, 501–509. [Google Scholar] [CrossRef]
- Sun, J.H.; Li, C.Y.; Qi, Y.F.; Guo, S.L.; Liang, X. Optimizing Colorimetric Assay Based on V2O5 Nanozymes for Sensitive Detection of H2O2 and Glucose. Sensors 2016, 16, 584. [Google Scholar] [CrossRef] [PubMed]
- Xiao, P.; Hong, J.P.; Wang, T.; Xu, X.L.; Yuan, Y.H.; Li, J.L. Oxidative Degradation of Organic Dyes Over Supported Perovskite Oxide LaFeO3/SBA-15 Under Ambient Conditions. Springer 2013, 143, 887–894. [Google Scholar] [CrossRef]
- Li, Z.Y.; Zhou, Y.; Qi, H.; Pan, Q.W.; Zhang, Z.; Shi, N.N.; Lu, M.; Stein, A.C.; Li, Y.; Ramanathan, S.; et al. Correlated Perovskites as a New Platform for Super-Broadband-Tunable Photonics. Adv. Mater. 2016, 28, 9117–9125. [Google Scholar] [CrossRef] [PubMed]
- Nie, G.D.; Zhang, L.; Lei, J.Y.; Yang, L.; Zhang, Z.; Lu, X.F.; Wang, C. Monocrystalline VO2 (B) nanobelts: Large-scale synthesis, intrinsic peroxidase-like activity and application in biosensing. J. Mater. Chem. A 2014, 2, 2910–2914. [Google Scholar] [CrossRef]
- Baudrin, E.; Sudant, G.; Larcher, D.; Dunn, B.; Tarascon, J.M. Preparation of Nanotextured VO2[B] from Vanadium Oxide Aerogels. Chem. Mater. 2006, 18, 4369–4374. [Google Scholar] [CrossRef]
- Pan, J.; Zhong, L.; Li, M.; Luo, Y.Y.; Li, G.H. Microwave-Assisted Solvothermal Synthesis of VO2 Hollow Spheres and Their Conversion into V2O5 Hollow Spheres with Improved Lithium Storage Capability. Chem. Eur. J. 2016, 22, 1461–1466. [Google Scholar] [CrossRef] [PubMed]
- Xiao, Q.F.; Cai, M.; Balogh, M.P.; Tessema, M.M.; Lu, Y.F. Symmetric Growth of Pt Ultrathin Nanowires from Dumbbell Nuclei for Use as Oxygen Reduction Catalysts. Nano Res. 2012, 5, 145–151. [Google Scholar] [CrossRef]
- Han, X.G.; Jin, M.S.; Xie, S.F.; Kuang, Q.; Jiang, Z.Y.; Jiang, Y.Q.; Xie, Z.X.; Zheng, L.S. Synthesis of Tin Dioxide Octahedral Nanoparticles with Exposed High-Energy {221} Facets and Enhanced Gas-Sensing Properties. Angew. Chem. Int. Ed. 2009, 48, 9180–9183. [Google Scholar] [CrossRef] [PubMed]
- Yang, H.G.; Liu, G.; Qiao, S.Z.; Sun, C.H.; Jin, Y.G.; Smith, S.C.; Zou, J.; Cheng, H.M.; Lu, G.Q. Solvothermal Synthesis and Photoreactivity of Anatase TiO2 Nanosheets with Dominant {001} Facets. J. Am. Chem. Soc. 2009, 131, 4078–4083. [Google Scholar] [CrossRef] [PubMed]
- Fan, D.B.; Thomas, P.J.; O’Brien, P. Pyramidal Lead Sulfide Crystallites with High Energy {113} Facets. J. Am. Chem. Soc. 2008, 130, 10892–10894. [Google Scholar] [CrossRef] [PubMed]
- Tao, A.R.; Habas, S.; Yang, P.D. Shape control of colloidal metal nanocrystals. Small 2008, 4, 310–325. [Google Scholar] [CrossRef]
- Zhou, Y.; Park, J.W.; Shi, J.; Chhowalla, M.; Park, H.; Weitz, D.A.; Ramanathan, S. Control of Emergent Properties at a Correlated Oxide Interface with Graphene. Nano Lett. 2015, 15, 1627–1634. [Google Scholar] [CrossRef] [PubMed]
- Niu, C.J.; Meng, J.S.; Han, C.H.; Zhao, K.N.; Yan, M.Y.; Mai, L.Q. VO2 Nanowires Assembled into Hollow Microspheres for High-Rate and Long-Life Lithium Batteries. Nano Lett. 2014, 14, 2873–2878. [Google Scholar] [CrossRef] [PubMed]
- Mai, L.Q.; Wei, Q.L.; An, Q.Y.; Tian, X.C.; Zhao, Y.L.; Xu, X.; Xu, L.; Chang, L.; Zhang, Q.J. Nanoscroll Buffered Hybrid Nanostructural VO2 (B) Cathodes for High-Rate and Long-Life Lithium Storage. Adv. Mater. 2013, 25, 2969–2973. [Google Scholar] [CrossRef] [PubMed]
- Quites, F.J.; Pastore, H.O. Hydrothermal synthesis of nanocrystalline VO2 from poly (diallyldimethylammonium) chloride and V2O5. Mater. Res. Bull. 2010, 45, 892–896. [Google Scholar] [CrossRef]
- Uchaker, E.; Gu, M.; Zhou, N.; Li, Y.W.; Wang, C.M.; Cao, G.Z. Enhanced Intercalation Dynamics and Stability of Engineered Micro/Nano-Structured Electrode Materials: Vanadium Oxide Mesocrystals. Small 2013, 9, 3880–3886. [Google Scholar] [CrossRef] [PubMed]
- Zhang, L.; Zhao, K.N.; Xu, W.W.; Meng, J.S.; He, L.; An, Q.Y.; Xu, X.; Luo, Y.Z.; Zhao, T.W.; Mai, L.Q. Mesoporous VO2 nanowires with excellent cycling stability and enhanced rate capability for lithium batteries. RSC Adv. 2014, 4, 33332–33337. [Google Scholar] [CrossRef]
- Nethravathi, C.; Rajamathi, C.R.; Rajamathi, M.; Gautam, U.K.; Wang, X.; Golberg, D.; Bando, Y. N-Doped Graphene—VO2 (B) Nanosheet-Built 3D Flower Hybrid for Lithium Ion Battery. ACS Appl. Mater. Interfaces 2013, 5, 2708–2714. [Google Scholar] [CrossRef] [PubMed]
- Kim, M.I.; Shim, J.; Li, T.; Lee, J.; Park, H.G. Fabrication of Nanoporous Nanocomposites Entrapping Fe3O4 Magnetic Nanoparticles and Oxidases for Colorimetric Biosensing. Chem. Eur. J. 2011, 17, 10700–10707. [Google Scholar] [CrossRef] [PubMed]
- Edgar, P.; Yona, K. A Simple Colorimetric Method for the Measurement of Hydrogen Peroxide Produced by Cells in Culture. J. Immunol. Methods 1980, 38, 161–170. [Google Scholar]
- Chen, X.; Zhou, X.D.; Hu, J. Pt-DNA complexes as peroxidase mimetics and their applications in colorimetric detection of H2O2 and glucose. Anal. Methods 2012, 4, 2183–2187. [Google Scholar] [CrossRef]
Figure 1.
TEM images of VO2 nanoparticles. (a) VO2 nanofibers (b) VO2 nanosheets (c) VO2 nanorods.

Figure 2.
XRD patterns of VO2 nanoparticles. (A) VO2 nanofiber; (B) VO2 nanosheets; (C) VO2 nanorods.
Figure 2.
XRD patterns of VO2 nanoparticles. (A) VO2 nanofiber; (B) VO2 nanosheets; (C) VO2 nanorods.
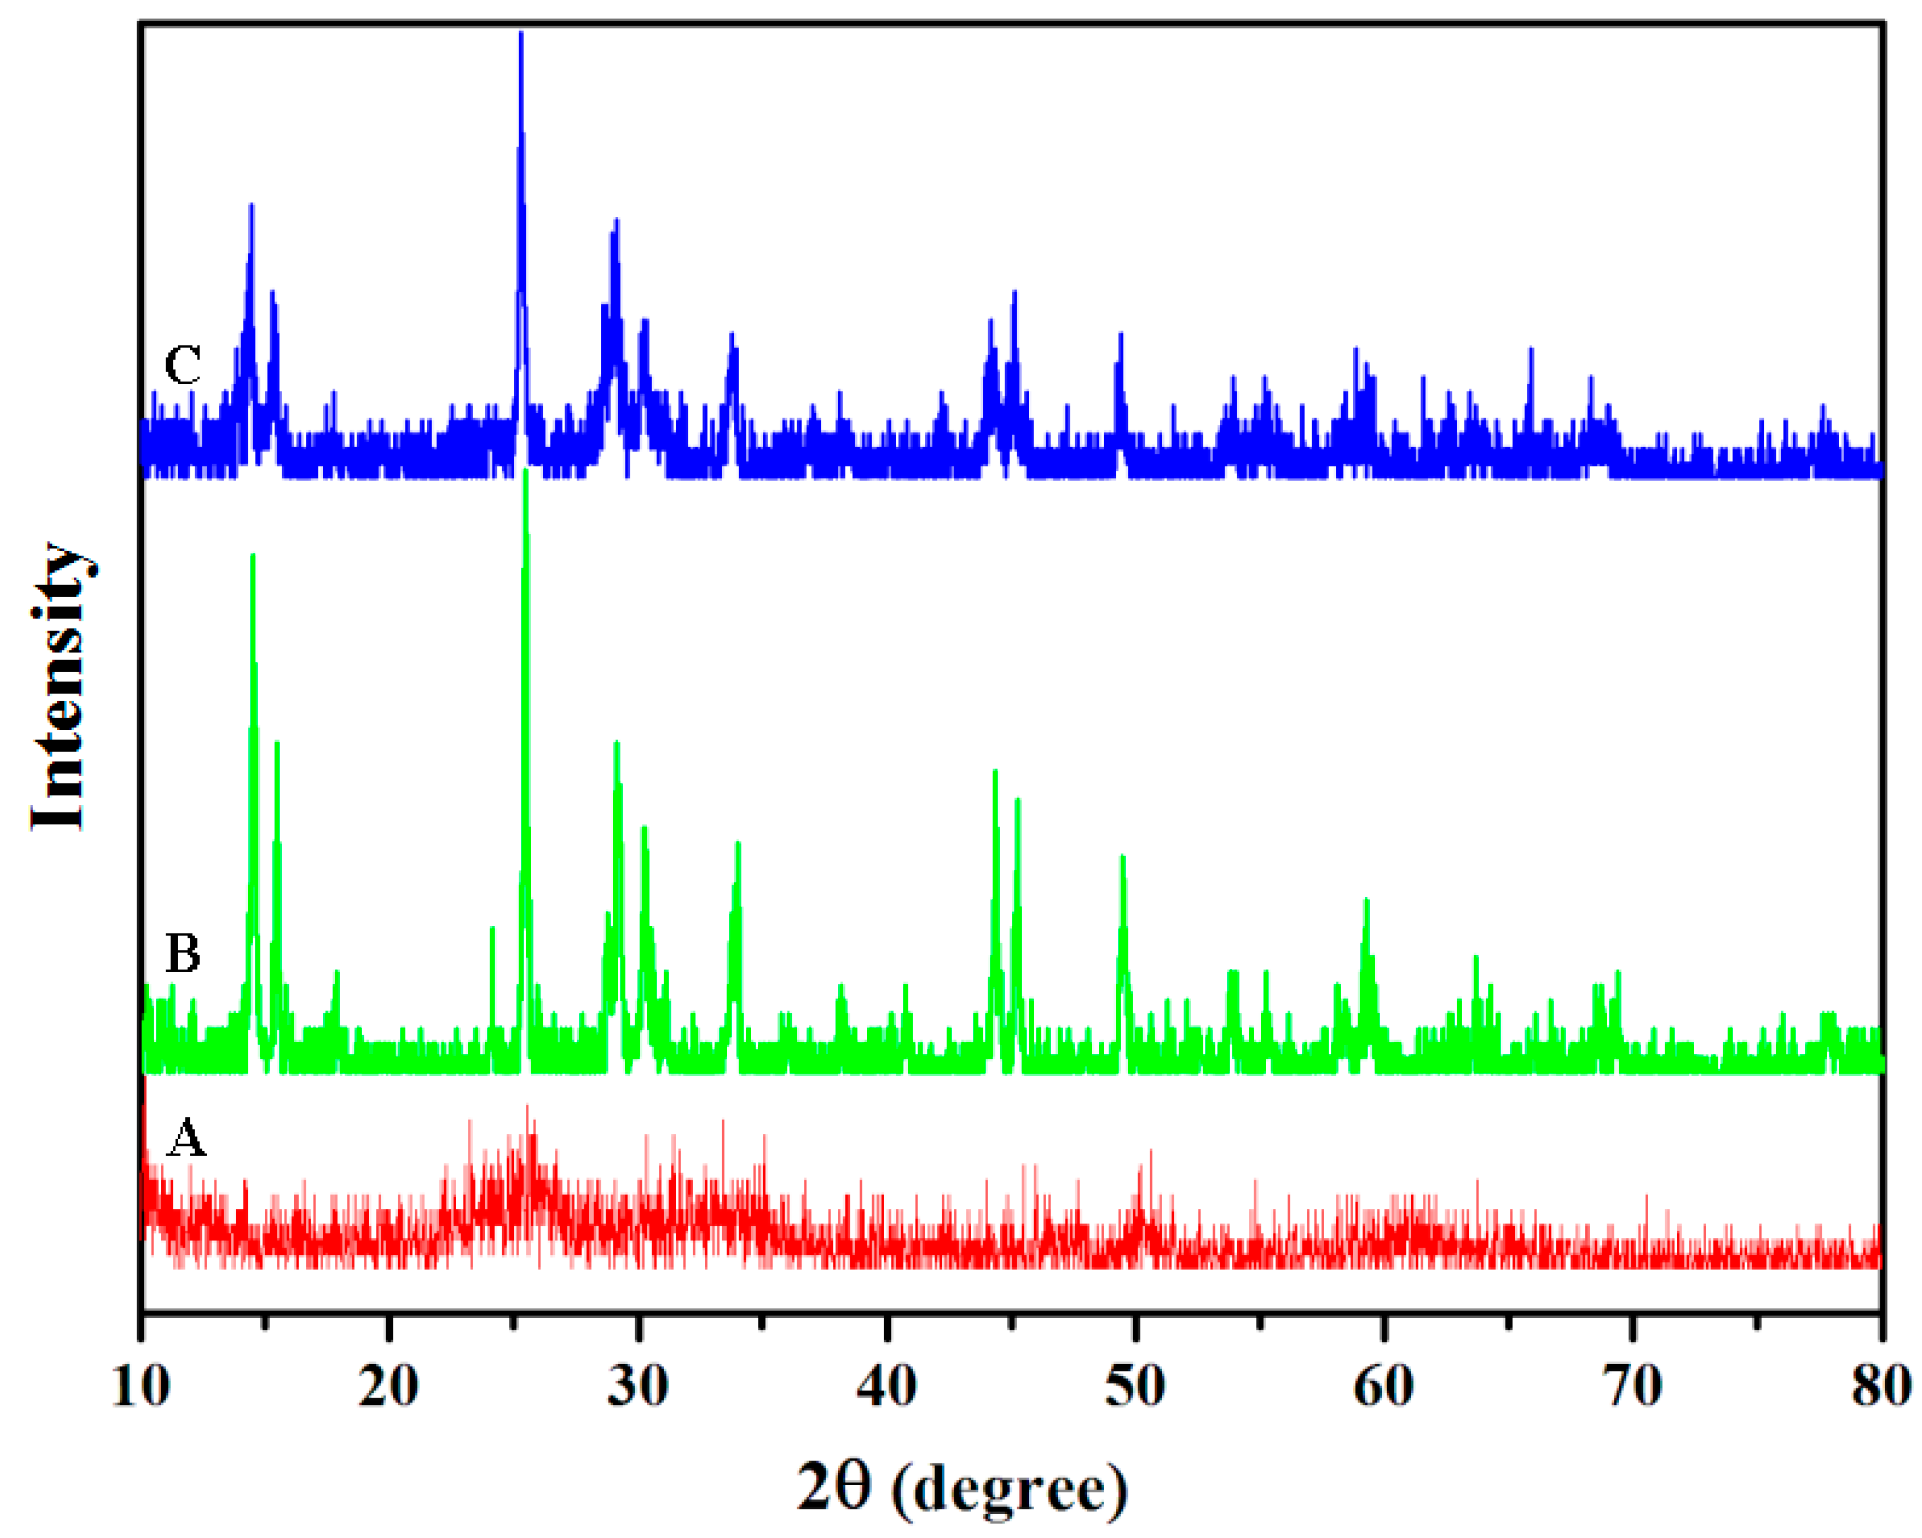
Figure 3.
UV-Visible absorption spectra (a) and color changes (b) of different reaction systems. ((A) TMB + H2O2, (B) TMB + VO2 nanorod, (C) TMB + VO2 nanosheet, (D) TMB + VO2 nanofiber, (E) TMB + VO2 nanorod + H2O2, (F) TMB + VO2 nanosheet + H2O2, (G) TMB + VO2 nanofiber + H2O2).
Figure 3.
UV-Visible absorption spectra (a) and color changes (b) of different reaction systems. ((A) TMB + H2O2, (B) TMB + VO2 nanorod, (C) TMB + VO2 nanosheet, (D) TMB + VO2 nanofiber, (E) TMB + VO2 nanorod + H2O2, (F) TMB + VO2 nanosheet + H2O2, (G) TMB + VO2 nanofiber + H2O2).
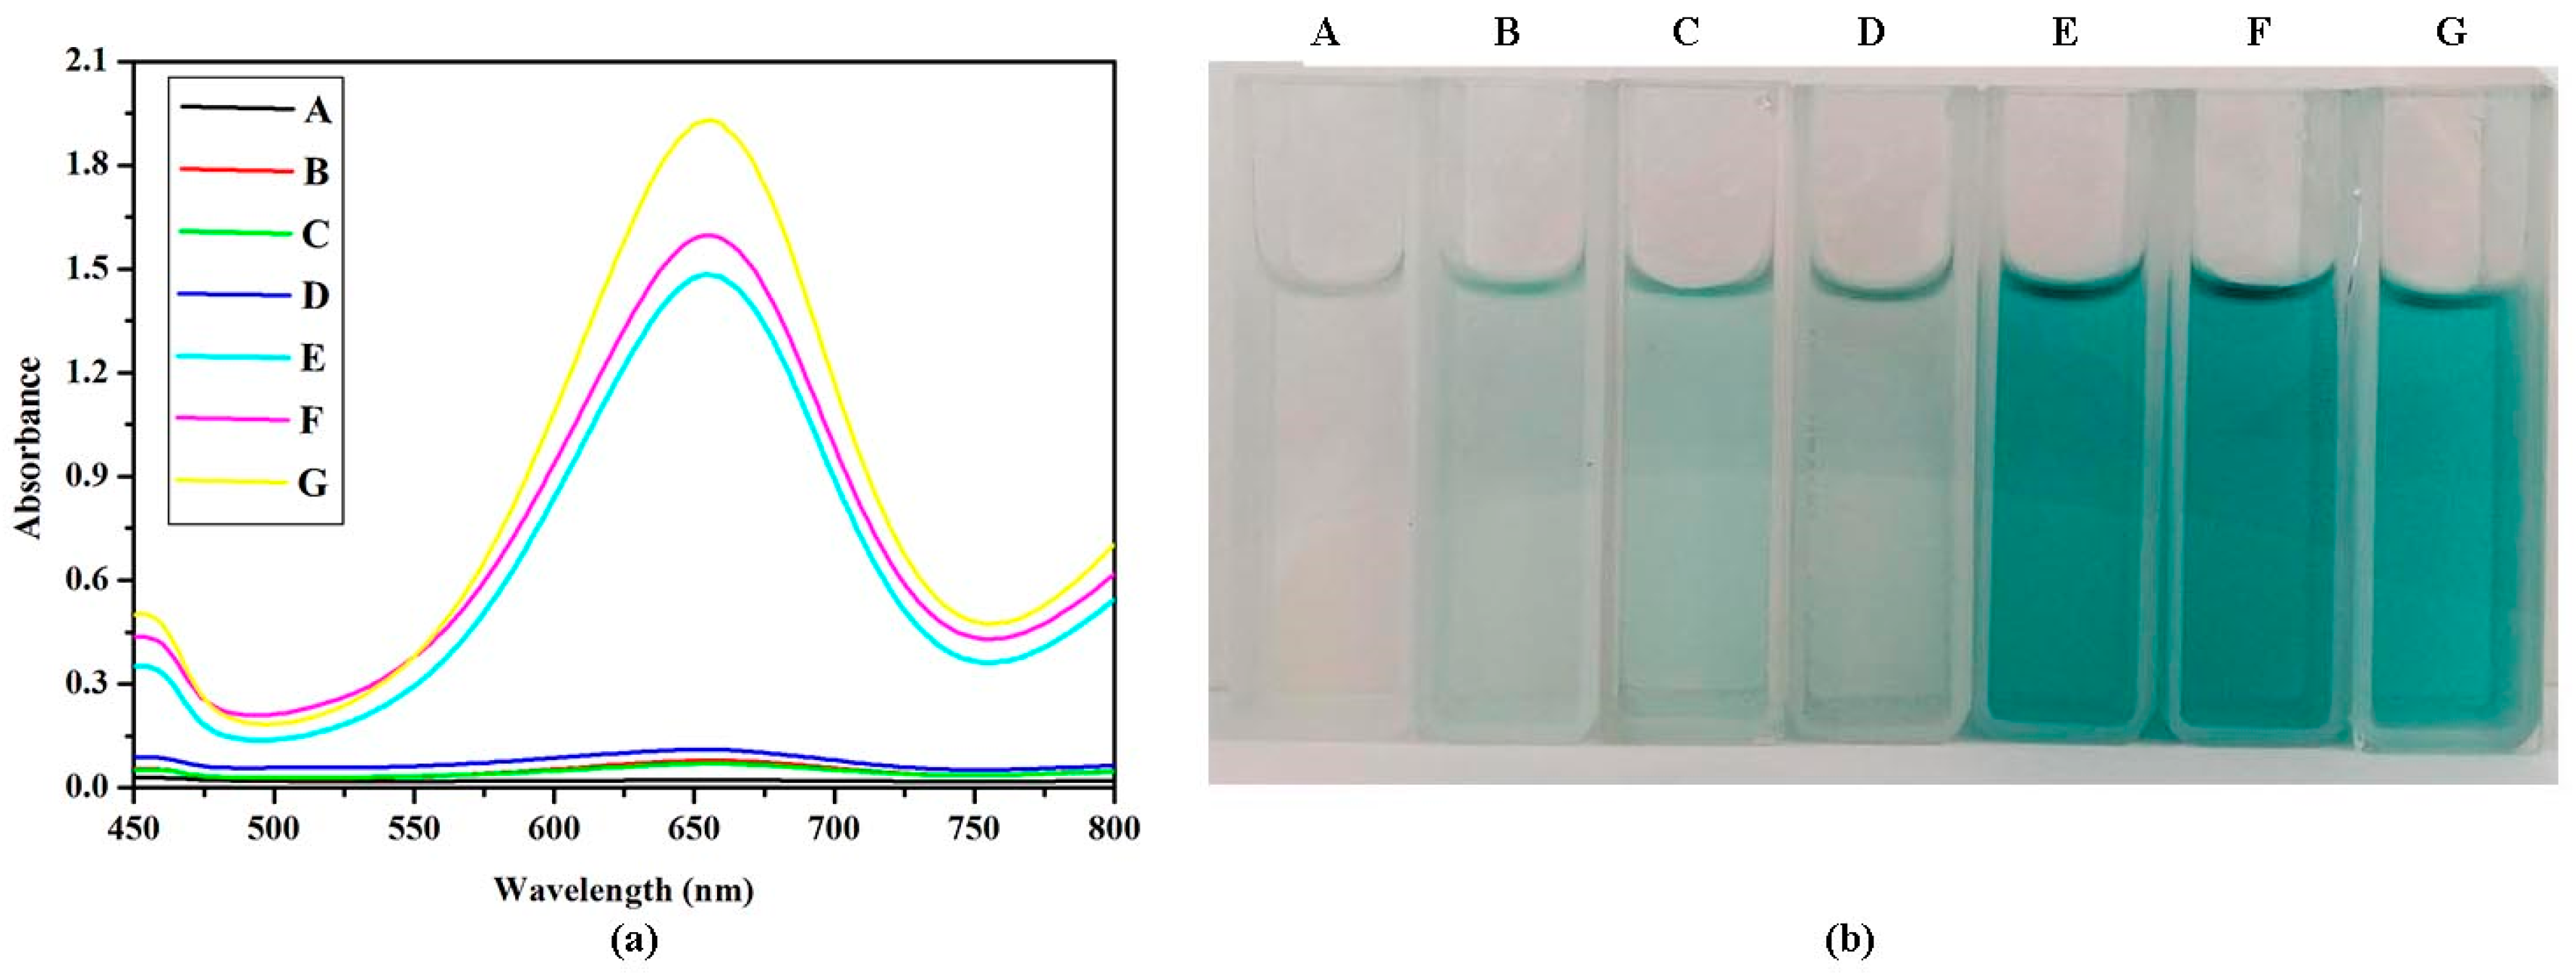
Figure 4.
The effect of pH on absorption value with TMB and color changes. (a) VO2 nanofibers; (b) VO2 nanosheets; (c) VO2 nanorods. The error bars represent the standard deviation of three measurements.
Figure 4.
The effect of pH on absorption value with TMB and color changes. (a) VO2 nanofibers; (b) VO2 nanosheets; (c) VO2 nanorods. The error bars represent the standard deviation of three measurements.

Figure 5.
The effect of buffer solution on absorption value with TMB. (a) VO2 nanofibers; (b) VO2 nanosheets; (c) VO2 nanorods. The error bars represent the standard deviation of three measurements.
Figure 5.
The effect of buffer solution on absorption value with TMB. (a) VO2 nanofibers; (b) VO2 nanosheets; (c) VO2 nanorods. The error bars represent the standard deviation of three measurements.

Figure 6.
The effect of VO2 nanofibers (a,d); VO2 nanosheets (b,e); and VO2 nanorods (c,f) concentrations on absorption value with TMB in pH 4.0 citrate buffer solution. The error bars represent the standard deviation of three measurements.
Figure 6.
The effect of VO2 nanofibers (a,d); VO2 nanosheets (b,e); and VO2 nanorods (c,f) concentrations on absorption value with TMB in pH 4.0 citrate buffer solution. The error bars represent the standard deviation of three measurements.

Figure 7.
The steady-state kinetic assay and catalytic mechanism of VO2 nanofibers (a,b); VO2 nanosheets (c,d); and VO2 nanorods (e,f) as peroxidase mimics. Conditions: pH, 4.0 (0.2 M citrate buffer); temperature, 25 °C; incubation time, 5 min.
Figure 7.
The steady-state kinetic assay and catalytic mechanism of VO2 nanofibers (a,b); VO2 nanosheets (c,d); and VO2 nanorods (e,f) as peroxidase mimics. Conditions: pH, 4.0 (0.2 M citrate buffer); temperature, 25 °C; incubation time, 5 min.
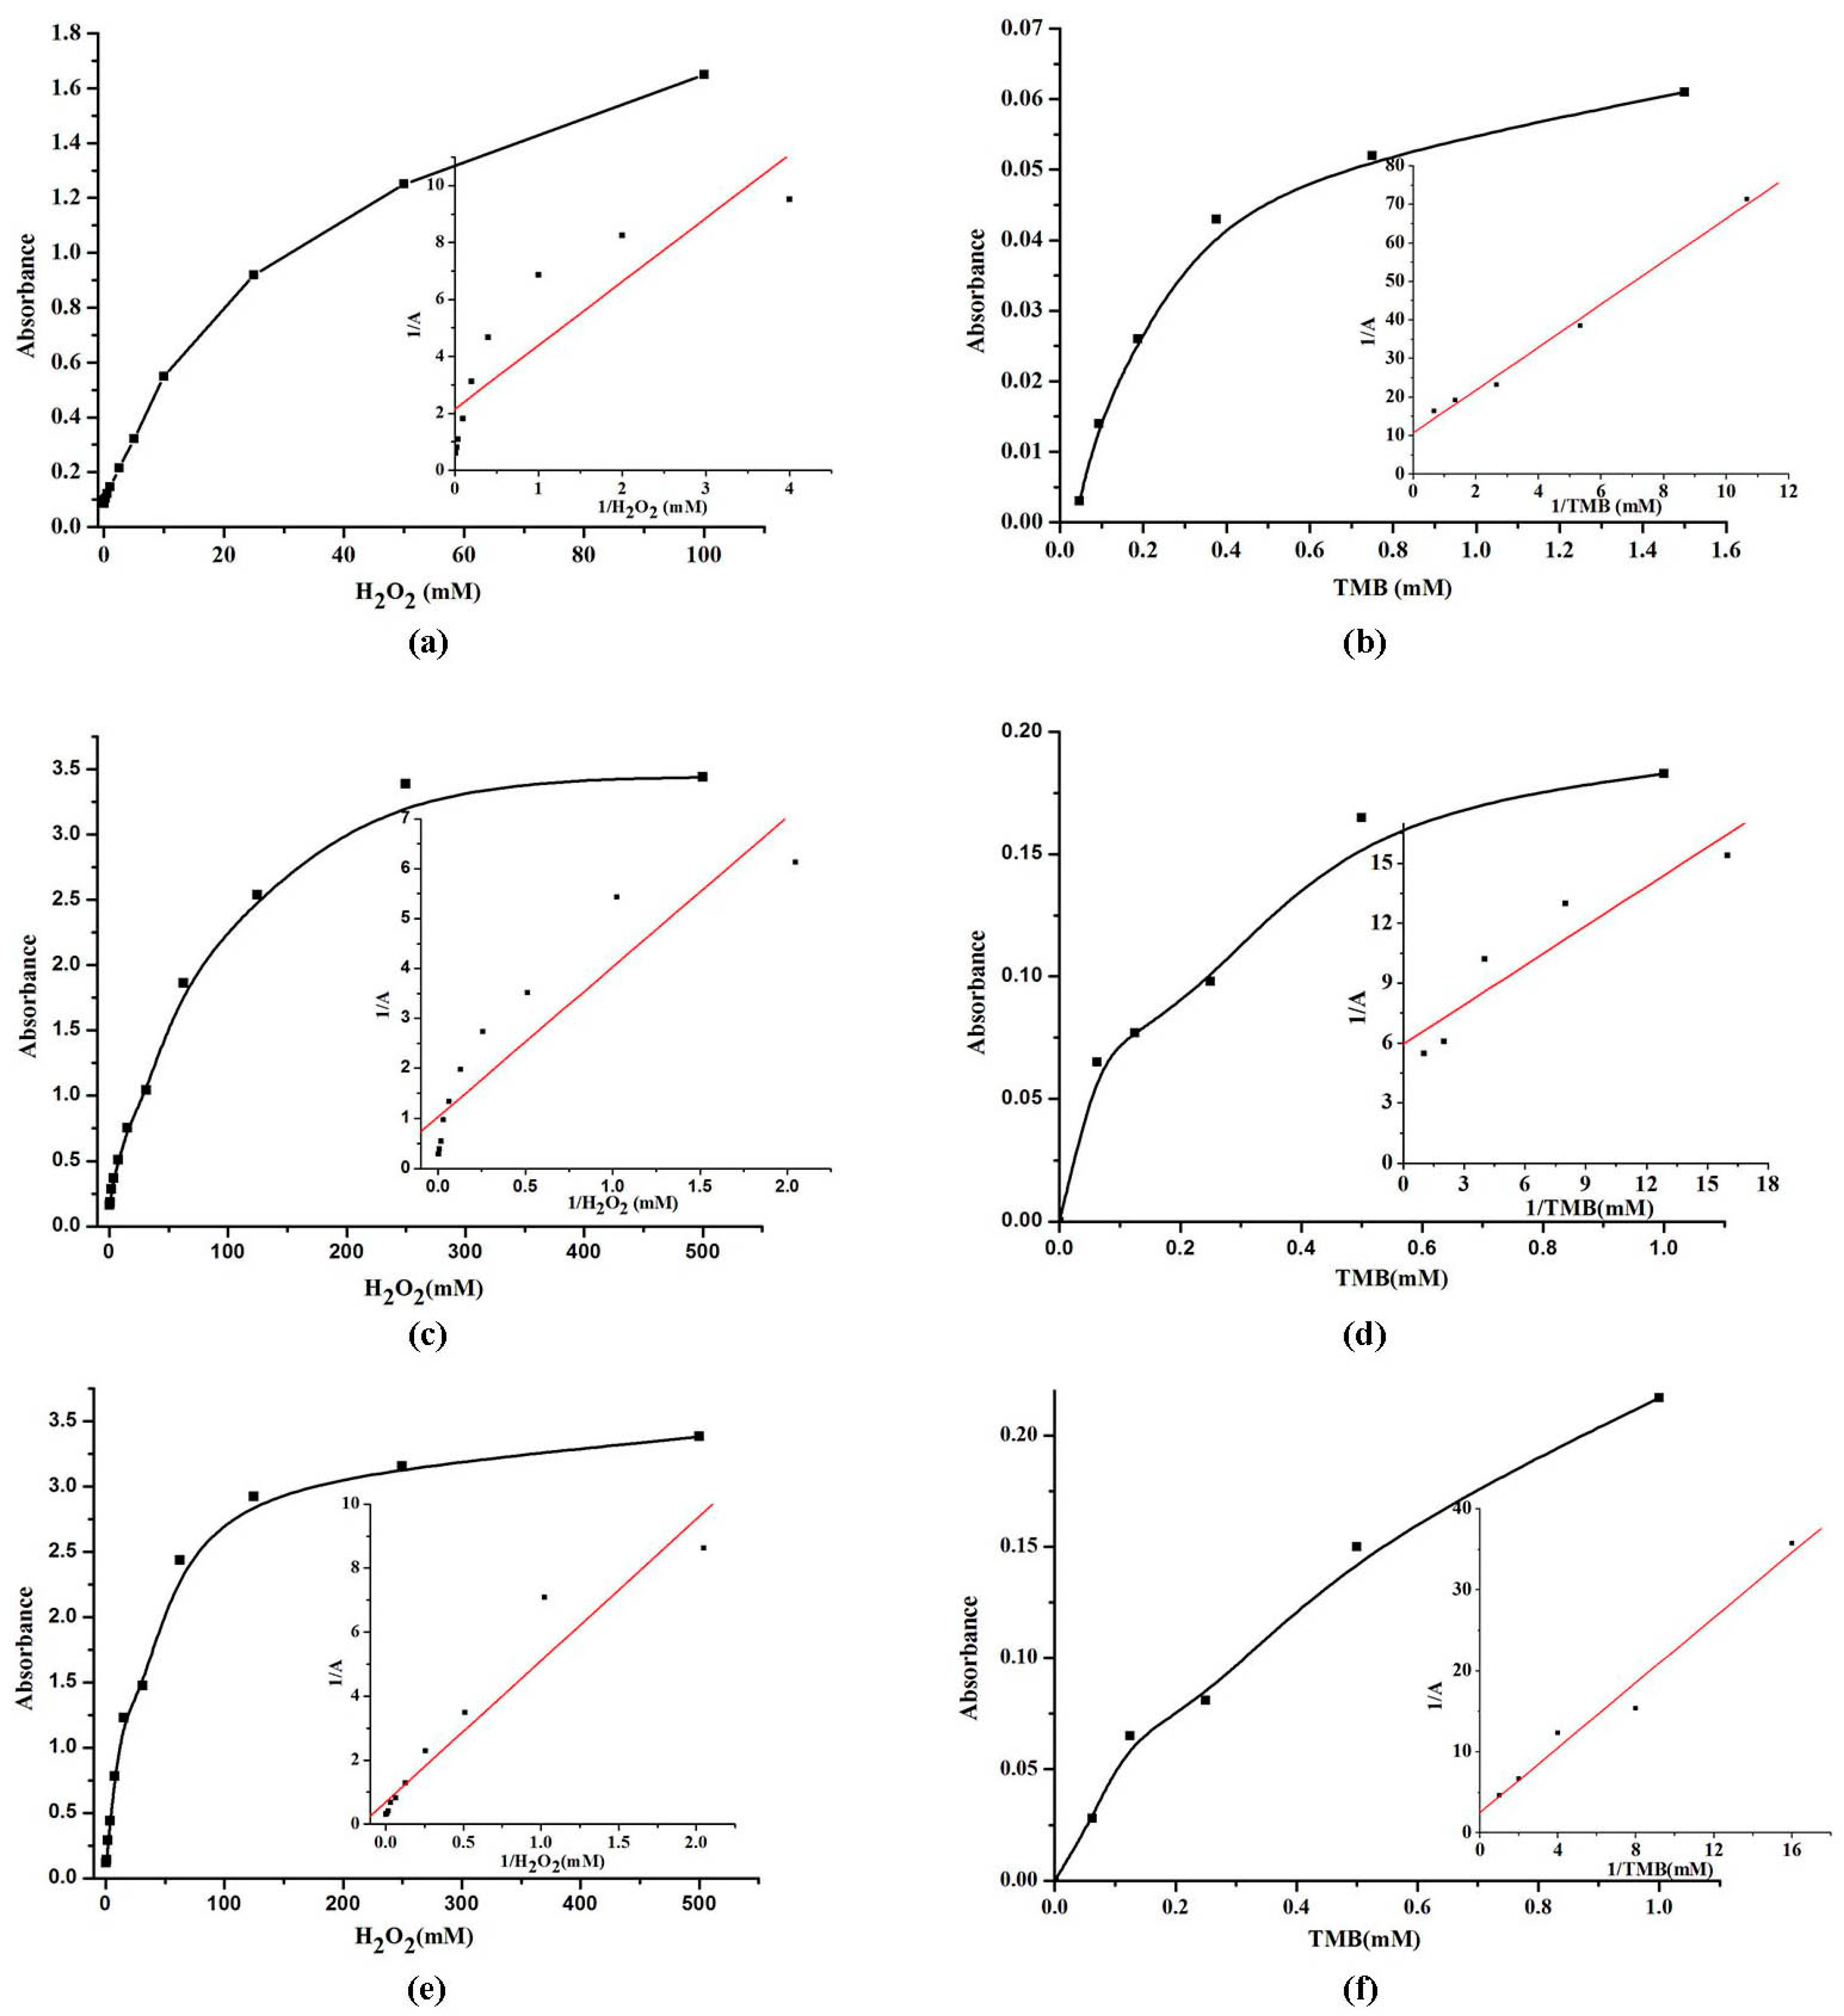
Figure 8.
A dose-response curve depending of the absorbance at 656 nm in the presence of different concentrations of H2O2. (a) VO2 nanofibers; (b) VO2 nanosheets; (c) VO2 nanorods. Error bars represent the standard deviation of three measurements. Conditions: pH, 4.0 (0.2 M citrate buffer); temperature, 25 °C; incubation time, 5 min.
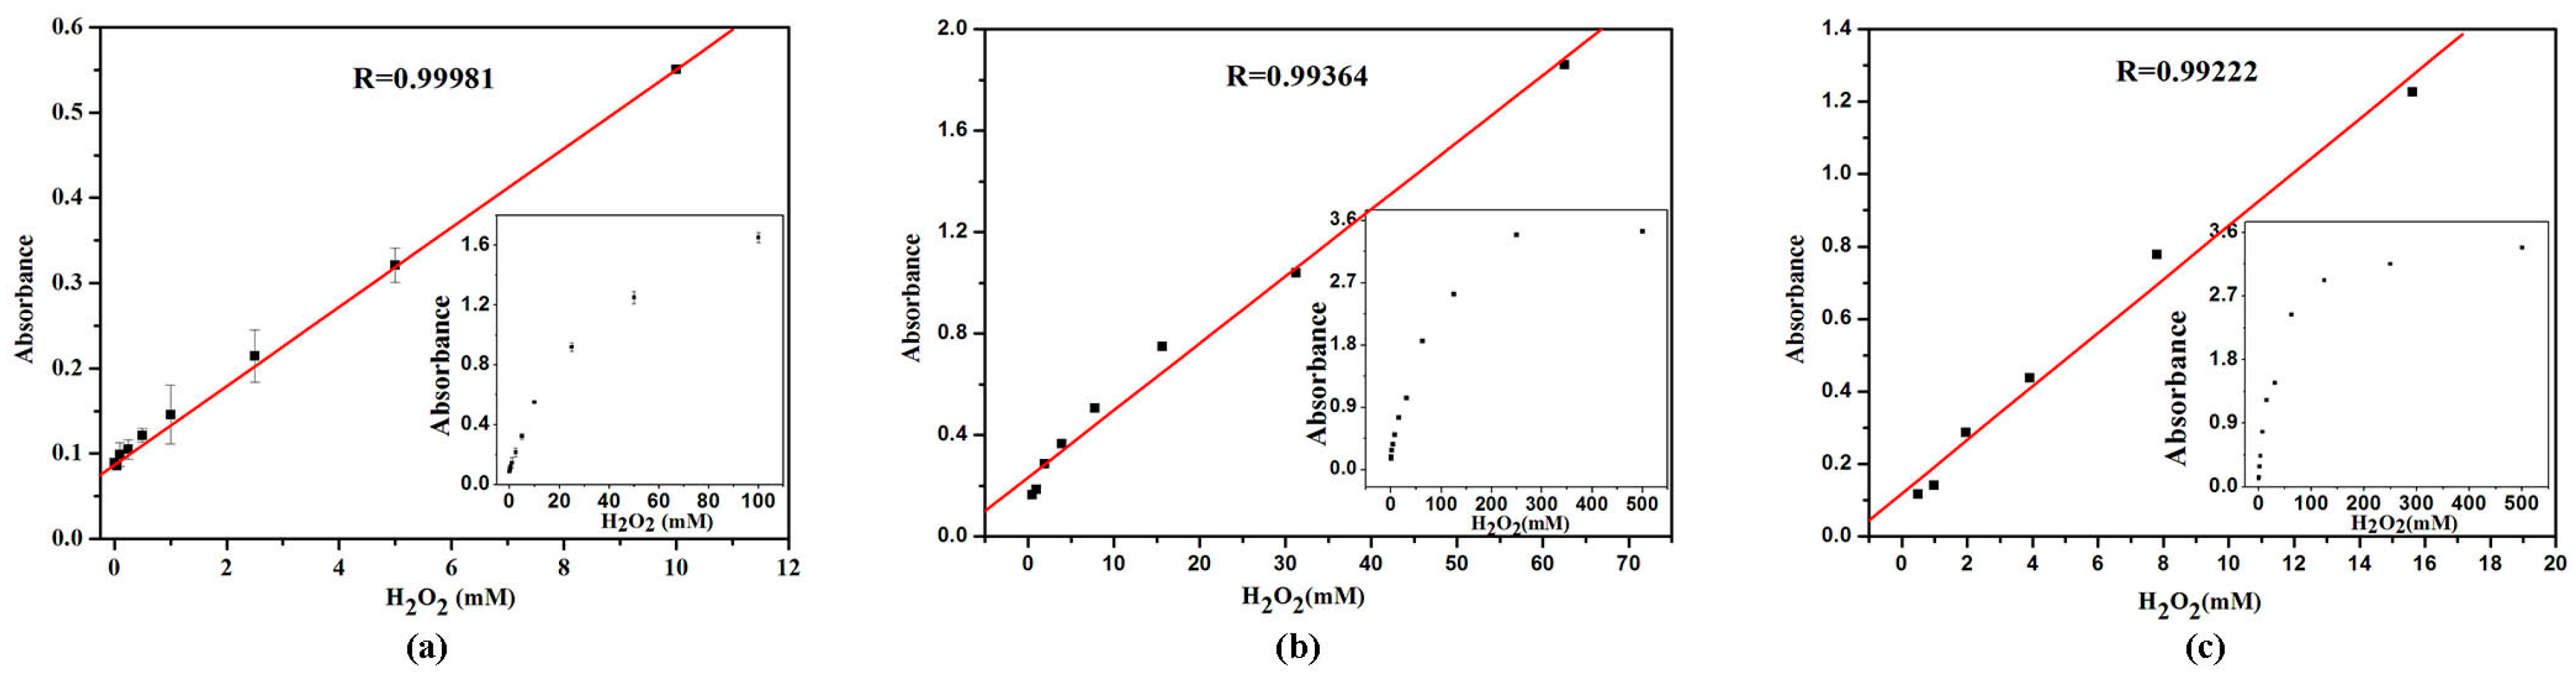
Figure 9.
A dose-response curve depending of the absorbance at 656 nm in the presence of different concentrations of glucose. (a) VO2 nanofibers; (b) VO2 nanosheets; (c) VO2 nanorods, in which error bars represent the standard deviation of three measurements. Conditions: pH, 4.0 (0.2 M citrate buffer); temperature, 25 °C; incubation time, 5 min.


Table 1.
Comparison of the KM and Vmax of VO2 nanozymes, V2O5 nanozymes, Fe3O4 MNPS, and HRP, respectively.
Table 1.
Comparison of the KM and Vmax of VO2 nanozymes, V2O5 nanozymes, Fe3O4 MNPS, and HRP, respectively.
| Nanozymes | Substrate | KM (mM) | Vmax (M·S−1) |
|---|---|---|---|
| VO2 nanofibers | TMB | 0.518 | 9.3 × 10⁻⁵ |
| VO2 nanofibers | H2O2 | 1.043 | 4.66 × 10⁻⁴ |
| VO2 nanosheets | TMB | 0.111 | 1.68 × 10⁻⁴ |
| VO2 nanosheets | H2O2 | 2.924 | 9.73 × 10⁻⁴ |
| VO2 nanorods | TMB | 0.801 | 3.99 × 10⁻⁴ |
| VO2 nanorods | H2O2 | 6.469 | 1.46 × 10⁻³ |
| V2O5 nanozymes | TMB | 0.738 | 1.85 × 10⁻⁵ |
| V2O5 nanozymes | H2O2 | 0.232 | 1.29 × 10⁻⁵ |
| Fe3O4 MNPS | TMB | 0.434 | 10.00 × 10⁻⁸ |
| Fe3O4 MNPS | H2O2 | 154 | 9.78 × 10⁻⁸ |
| HRP | TMB | 0.434 | 1.24 × 10⁻⁸ |
| HRP | H2O2 | 3.70 | 2.46 × 10⁻⁸ |
Table 2.
Comparison of different nanozymes for the detection of H2O2.
| Nanozymes | Linear Range | Limit of Detection | Reference |
|---|---|---|---|
| Fe3O4 MNPS | 1–100 μΜ | 0.5 μΜ | [48] |
| HRP | 1–60 μΜ | 1 μΜ | [49] |
| Pt-DNA complexes | 0.979–17.6 mΜ | 0.392 mΜ | [50] |
| V2O5 nanozymes | 1–500 μΜ | 1 μΜ | [30] |
| VO2 nanofibers | 0.025–10 mM | 0.018 mM | This work |
| VO2 nanosheets | 0.488–62.5 mM | 0.266 mΜ | This work |
| VO2 nanorods | 0.488–15.6 mM | 0.41 mΜ | This work |
© 2017 by the authors. Licensee MDPI, Basel, Switzerland. This article is an open access article distributed under the terms and conditions of the Creative Commons Attribution (CC BY) license (http://creativecommons.org/licenses/by/4.0/).
Share and Cite
MDPI and ACS Style
Tian, R.; Sun, J.; Qi, Y.; Zhang, B.; Guo, S.; Zhao, M. Influence of VO2 Nanoparticle Morphology on the Colorimetric Assay of H2O2 and Glucose. Nanomaterials 2017, 7, 347. https://doi.org/10.3390/nano7110347
AMA Style
Tian R, Sun J, Qi Y, Zhang B, Guo S, Zhao M. Influence of VO2 Nanoparticle Morphology on the Colorimetric Assay of H2O2 and Glucose. Nanomaterials. 2017; 7(11):347. https://doi.org/10.3390/nano7110347
Chicago/Turabian StyleTian, Rui, Jiaheng Sun, Yanfei Qi, Boyu Zhang, Shuanli Guo, and Mingming Zhao. 2017. "Influence of VO2 Nanoparticle Morphology on the Colorimetric Assay of H2O2 and Glucose" Nanomaterials 7, no. 11: 347. https://doi.org/10.3390/nano7110347
Note that from the first issue of 2016, this journal uses article numbers instead of page numbers. See further details here.