Sol-Gel-Synthesis of Nanoscopic Complex Metal Fluorides

1
Institut für Chemie, Humboldt-Universität zu Berlin, Brook-Taylor- Str. 2, D-12489 Berlin, Germany
2
Nanofluor GmbH, Rudower Chaussee 29, D-12489 Berlin, Germany
*
Author to whom correspondence should be addressed.
Nanomaterials 2017, 7(11), 362; https://doi.org/10.3390/nano7110362
Submission received: 14 September 2017
/
Revised: 17 October 2017
/
Accepted: 24 October 2017
/
Published: 2 November 2017
(This article belongs to the Special Issue Sol-Gel Preparation of Nanomaterials)
Abstract
:The fluorolytic sol-gel synthesis for binary metal fluorides (AlF3, CaF2, MgF2) has been extended to ternary and quaternary alkaline earth metal fluorides (CaAlF5, Ca2AlF7, LiMgAlF6). The formation and crystallization of nanoscopic ternary CaAlF5 and Ca2AlF7 sols in ethanol were studied by 19F liquid and solid state NMR (nuclear magnetic resonance) spectroscopy, as well as transmission electron microscopy (TEM). The crystalline phases of the annealed CaAlF5, Ca2AlF7, and LiMgAlF6 xerogels between 500 and 700 °C could be determined by X-ray powder diffraction (XRD) and 19F solid state NMR spectroscopy. The thermal behavior of un-annealed nanoscopic ternary and quaternary metal fluoride xerogels was ascertained by thermal analysis (TG/DTA). The obtained crystalline phases of CaAlF5 and Ca2AlF7 derived from non-aqueous sol-gel process were compared to crystalline phases from the literature. The corresponding nanoscopic complex metal fluoride could provide a new approach in ceramic and luminescence applications.
1. Introduction
The interest in complex metal fluorides (KMgF3, CaAlF5, SrAlF5, LiCaAlF6, LiSrAlF6, and LiMgAlF6) is mainly caused by their thermoluminescent and chemical properties. These complex metal fluorides are often used as host materials for a wide range of applications in the optical luminescence field. They can be applied, for instance, as laser materials, thermoluminescent detectors, or phosphors for lamps and displays [1,2,3,4,5,6,7]. Furthermore, complex fluorides are appropriated in the ceramic field because of their good physical properties like high ionic strength, piezoelectric characteristics, and nonmagnetic insulator behavior [8]. Notably, the ternary metal fluorides (CaAlF5, Ca2AlF7, SrAlF5, and Sr2AlF7) are used as fluoroaluminate substrates due to their very good chemical stability and remarkable optical properties [9,10,11,12]. LiCaAlF6, LiMgAlF6, and LiSrAlF6 are suitable hosts for solid-state lasers [2].
Generally, the synthesis of complex metal fluorides is predominantly based on solid state reactions at high temperatures and/or high pressures or by solvothermal synthesis [13]. The obtained particles usually exhibit diameters in the micrometer range. On the other hand, the fluorolytic sol-gel synthesis, discovered a few years ago, provides in general very convenient and easy access to nanoscopic fluorides [14]. Unfortunately, so far, this synthesis approach has not been deeply investigated for its applicability for the synthesis of complex fluorometallates. Therefore, it was the intention of this work to find out whether or not the applicability of the fluorolytic sol-gel approach can be extended to complex metal fluorides. As we will outline, this non-aqueous fluorolytic sol-gel approach seems to be a universal synthesis route.
Thus, we present an easy room temperature synthesis route to obtain nanoscopic complex metal fluorides which, as a result of thermal treatment between 500 and 700 °C for two minutes, transform into microcrystalline ternary and quaternary metal fluoride compounds. The synthesis of alkali and alkaline earth metal complex fluorides such as KAlF4, Na3AlF6, BaAlF5, BaMgF4, and K2MgF4 was successfully developed via the non-aqueous fluorolytic sol-gel route [15,16]. It has to be noted that the synthesis of ternary transition metal fluoride Li3MF6 (M = transition metal) has also been performed by the non-aqueous fluorolytic sol-gel route [16]. In this work, we adapted the metal chloride-based approach for the synthesis of transparent and stable MgF2 sols [17] on complex metal fluorides (CaAlF5, Ca2AlF7, LiMgAlF6) because of their good solubility and the practical handling of CaCl2 and MgCl2 at ambient conditions. Thus, the chloride approach turned out to be a quite robust method compared to the alkoxide-based sol-gel route and enables transparent and long-time stable metal fluoride sols.
2. Results and Discussion
The fluorolytic sol-gel synthesis of binary metal fluorides (HS-AlF3, MgF2, and CaF2) derived from different metal precursors such as metal alkoxides, [18,19] metal acetates [20], and metal chlorides [21,22] allows access to monodisperse nanoscopic particles with a broad range of potential applications including optic, catalysis, and ceramic [23]. Notably, we succeeded in the synthesis of transparent and long-time stable CaF2 sols prepared from calcium ethoxide and calcium isopropoxide for the first time just by increasing the polarity of the solvent in the CaF2 system. We used ethylene glycol instead of methanol or ethanol as the solvent. Thus, the calcium alkoxides (Ca(OEt)2 and Ca(OiPr)2) are soluble at room temperature [24]. We assume that the long-time sol stability of the CaF2 nanoparticles could be due to the higher viscosity and polarity of ethylene glycol compared to methanol and ethanol, respectively.
Due to the access of nanoscaled binary metal fluorides via the fluorolytic sol-gel route, we have adapted the synthesis principle for nanoscopic ternary and quaternary alkaline earth metal fluorides, e.g., by following the chloride approach as developed for MgF2 sols [17]. The general synthesis of complex metal fluorides via the chloride approach is represented by Equations (1)–(4).
Ternary metal fluorides
Quaternary metal fluorides
By using Al(OiPr)3, CaCl2, and EtOH, the formation of transparent ternary calcium fluoroaluminate sols like CaAlF5 and Ca2AlF7 is favored. Further complex metal fluorides such as LiMgAlF6, BaCaAlF7, and LiMgF3 were investigated. It turned out that a stoichiometric composition of LiMgAlF6 and LiMgF3 resulted in transparent sols (see Figure S1, Supplementary Material). Transparent sols of nanoscopic BaCaAlF7 were not obtained under all conditions tested. In the case of LiMgF3, there was no indication for its formation under either reaction conditions. Almost nanoscopic MgF2 particles, as well as a magnesium alkoxide fluoride species like MgF2−xORx (R = H, Et) [25], were identified by liquid 19F NMR spectroscopy of the sol and XRD of the dried xerogel (Figures S2 and S4, supplementary material), which is probably caused by a preferential oxygen donation. Interestingly, the XRD pattern of the annealed nominal LiMgF3 compound revealed unidentified reflections in addition to LiF and MgF2 (Figure S5, Supplementary Material). Furthermore, the determination of the particle size distribution of all complex metal fluorides by dynamic light scattering (DLS) failed. Although no turbidity of the corresponding sols was observed, there are either invisible agglomerates of primary nanoparticles disturbing the measurements or the very low refractive index of these compounds limits the application of DLS under these circumstances. Even the presence of non-spherical nanoparticles might cause the inappropriateness of DLS for particle size distribution.
2.1. CaAlF5
The CaF2-AlF3 binary system is well investigated [26,27]. The first study of CaF2-AlF3 was described by Fedotiev and Ylinskii [28]. A simple eutectic diagram with an invariant eutectic point at 820 °C and 37.5 mol% AlF3 was suggested. There are two compounds in the binary CaF2-AlF3 system; a dimorphic CaAlF5 which has a reversible α ↔ β transition around 740 °C and Ca2AlF7.
CaAlF5 was first identified by Holm by differential thermal analysis (DTA) experiments [29]. It melts incongruently at 873 °C ± 3 °C to form AlF3 and an un-identified liquid phase. Powder diffraction measurements and 19F MAS NMR spectroscopy were performed to confirm the crystal structure of CaAlF5 [30,31,32] and Ca2AlF7 [32,33,34,35]. Both crystal structures correspond to those found in the naturally occurring phases in Jakobssonite [36] (CaAlF5) and Carlhintzeite [37] (Ca2AlF7∙H2O), respectively. However, to the best of our knowledge, no synthetic phase of CaAl2F8, which occurs in Prosopite (CaAl2(F,OH)8), has been reported so far.
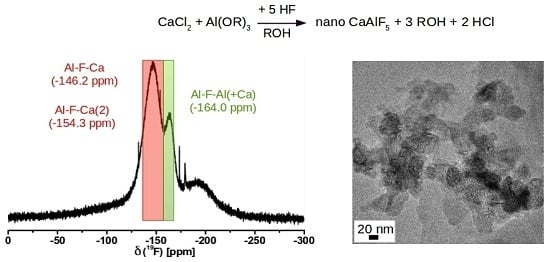
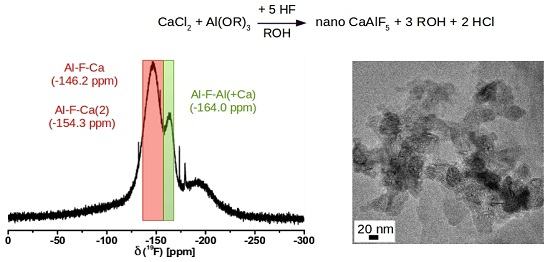
In Figure 1, the 19F liquid NMR spectrum of CaAlF5 sol is shown. Due to the formation of nanoparticles in the sol, the line width of the NMR signals for CaAlF5 species is very broad. The crystal structure of α-CaAlF5 reveals three 19F NMR peaks which correspond to three distinct fluorine sites with multiplicities of 2, 2, and 1. The fluorine sites in CaAlF5 are connected with one aluminum and two calcium Al-F-Ca(2), one aluminum and calcium Al-F-Ca, and between two aluminum and one calcium Al-F-Al(+Ca), with chemical shifts relative to CF3Cl of −146.2, −154.3, and −164 ppm, respectively [32,35]. Furthermore, the liquid NMR spectrum of the CaAlF5 sol shows two small signals (line width around 350 Hz) at −174 ppm and −179 ppm, which can probably be assigned to unreacted HF adsorbed at the particle surface in a mix of isopropanol and ethanol [21,22,38]. The presence of isopropanol in the CaAlF5 sol is probably caused by the reaction of Al(OiPr)3 with HF-solution. The broad main signals at about −146 and −164 ppm in the liquid NMR spectrum can be indicated as known species of CaAlF5. A 19F NMR signal for CaF2 (−108 ppm) in the spectrum could not be observed. The broad signal around −190 ppm is the known background from the fluorine NMR probe.
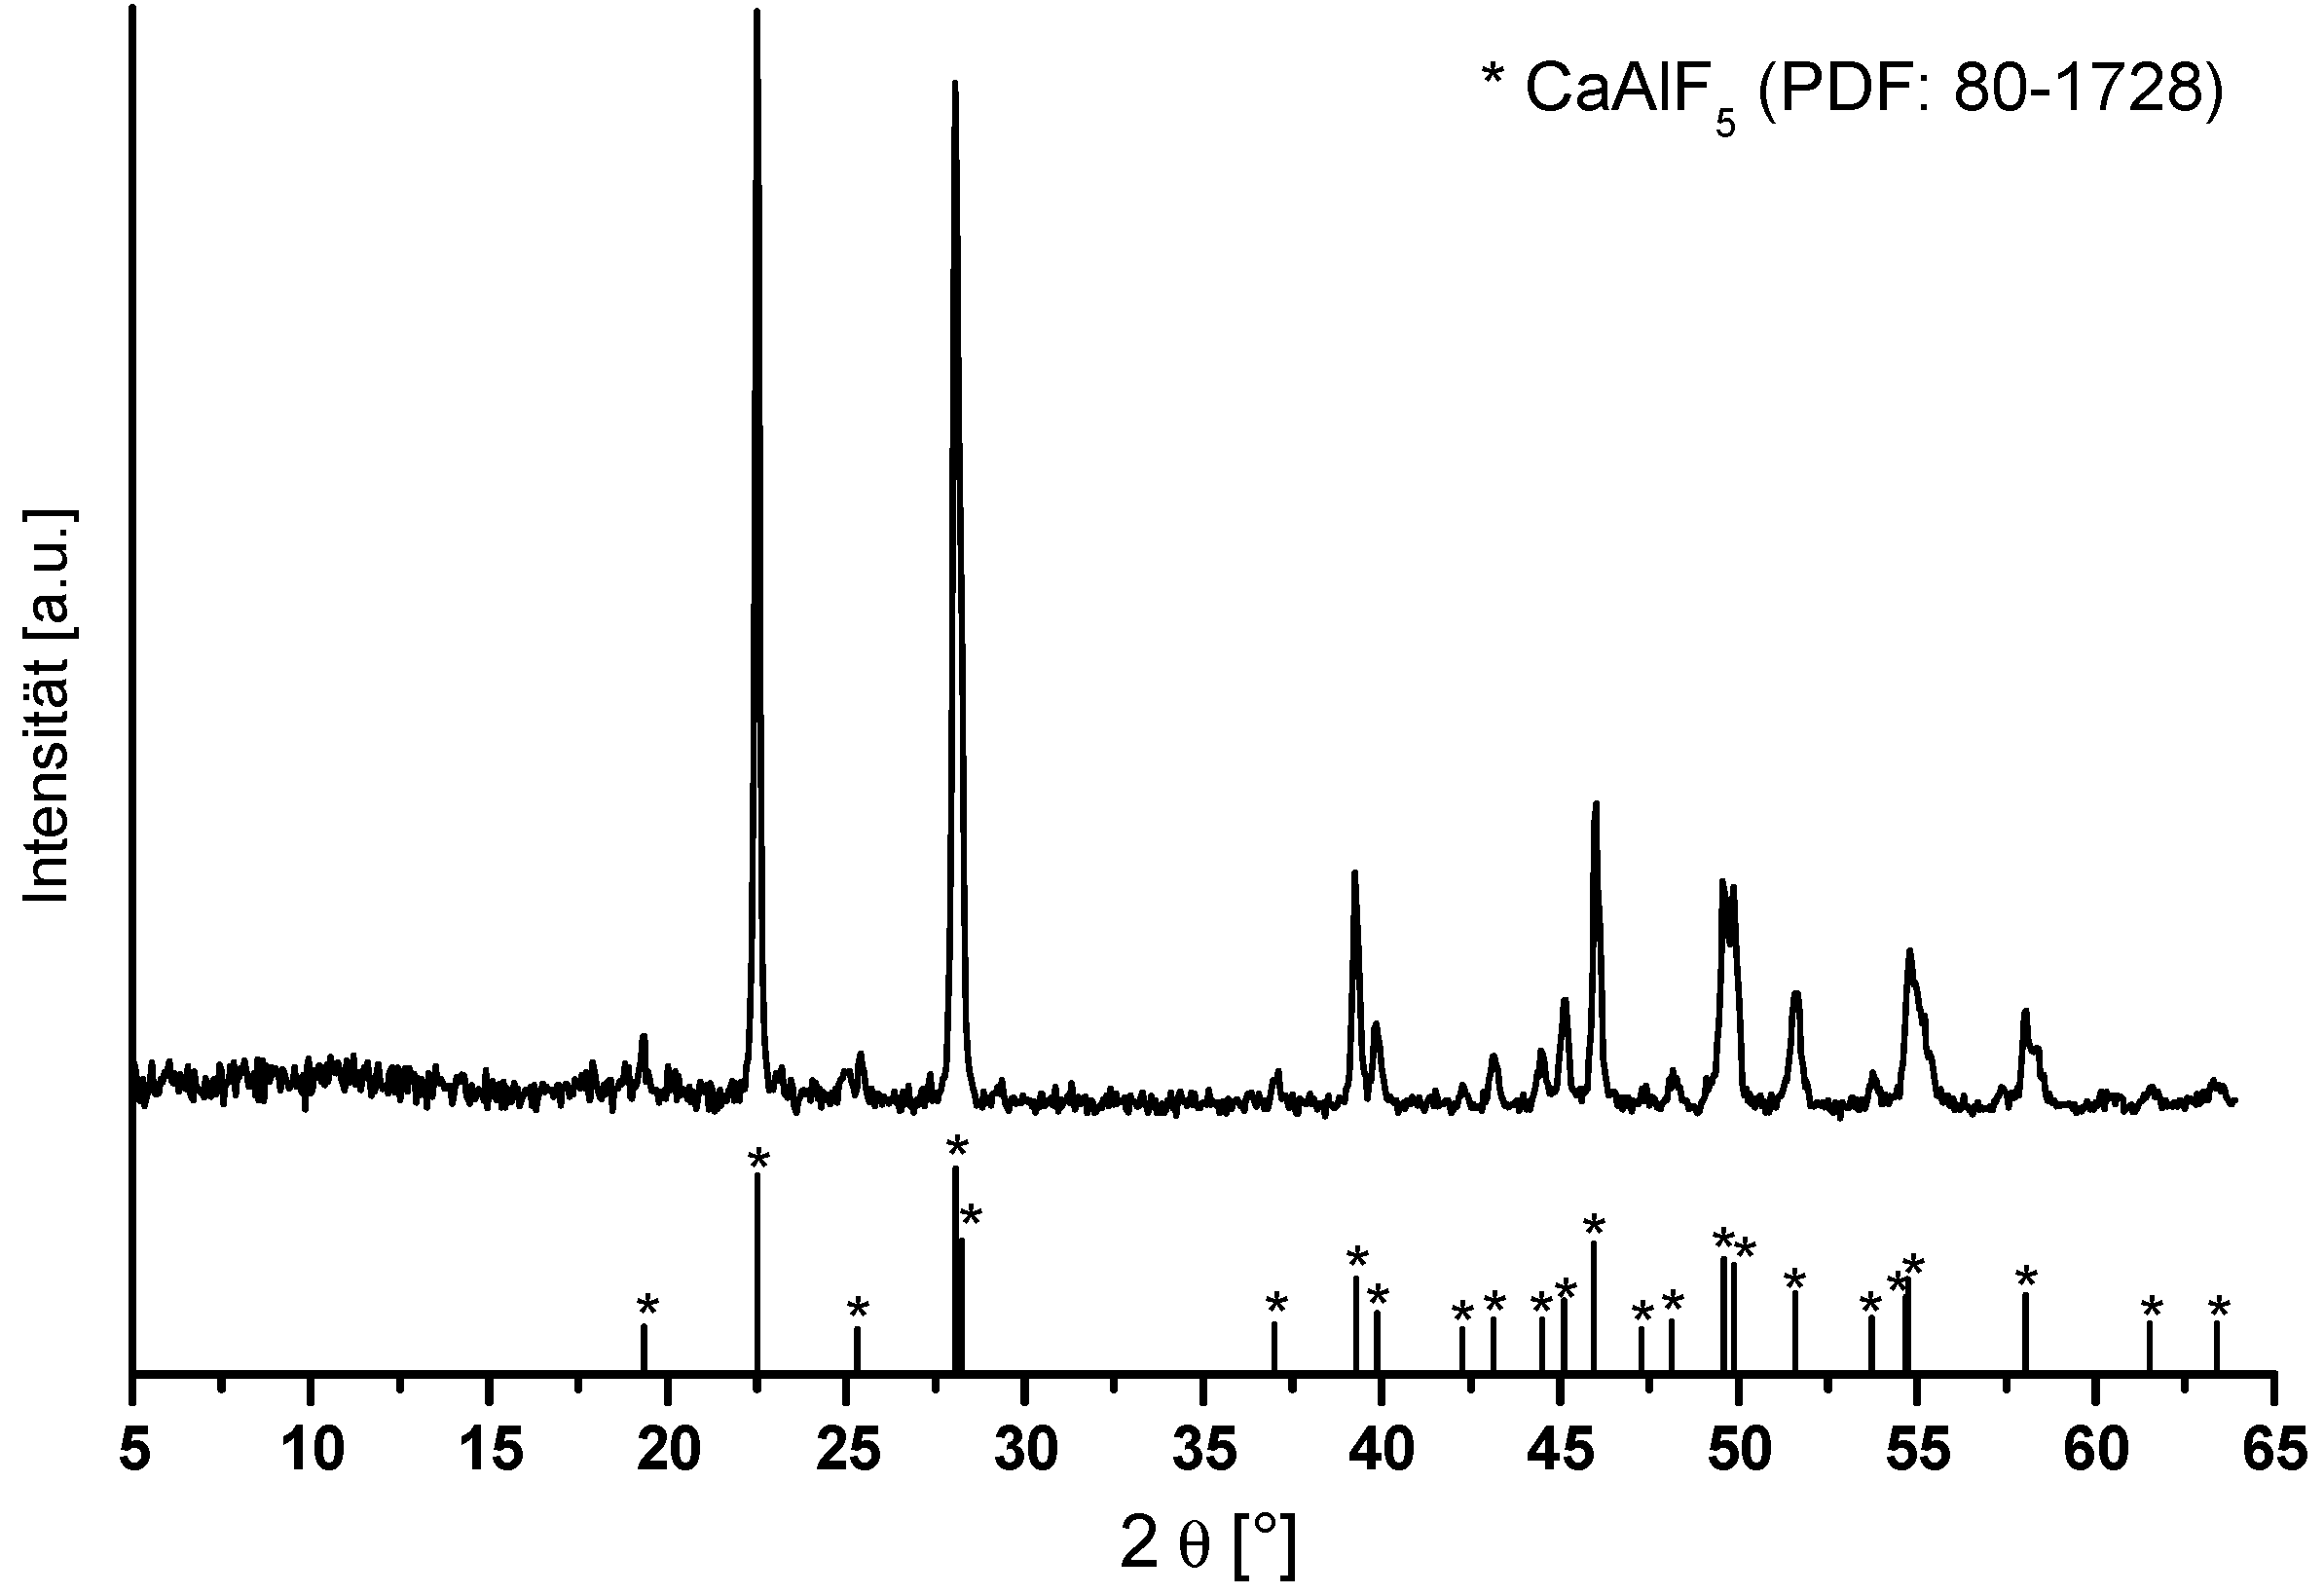
Due to the problem of the particle size characterization by DLS, the particle size and shape were investigated by TEM. Figure 1b shows a group of several agglomerated particles showing diameters above 20 nm, but it seems that the particles exhibit a nearly spherical shape. After evaporation of the solvent from CaAlF5 sol, the CaAlF5 xerogel was characterized by XRD and 19F MAS NMR spectroscopy. Calcination below 500 °C revealed still X-ray amorphous samples. Samples calcined at 500 °C for 5 h gave reflections of CaF2 as indicated in the diffractogram (Figure 2). No X-ray patterns of CaAlF5 could be identified. Interestingly, if the xerogel was annealed at 700 °C for only a two minute calcination time in a closed crucible, the reflections of CaAlF5 can be observed (Figure 3). It is crucial to determine whether an open or closed crucible and whether a preheated or non-preheated oven is used. Probably, the calcination process of CaAlF5 results in a sublimation of AlF3. This could explain the formation of CaF2 in the CaAlF5 xerogel after calcination at 500 °C for 2 h.
In Figure 4, the 19F MAS NMR spectra and the TG/DTA heating curves of CaAlF5 xerogel confirm the formation of crystalline CaAlF5. The spectrum of the un-annealed xerogel exhibits one broad signal around −149 ppm and two small signals (−128 ppm and −152 ppm). Both small signals can be indicated as SiF62− (−128 ppm) and BF4− (−152 ppm) species, which result from the unreacted HF with the glass flask. It is obvious that the thermal treatment of the xerogel at 700 °C reveals three signals in the 19F NMR spectrum, which correspond to crystalline α-CaAlF5 with a relative intensity of 45, 36, and 18. In the literature, α-CaAlF5 has three 19F signals with a relative intensity of 40, 40, and 20, whereas β-CaAlF5 has four 19F signals with a relative intensity of 15, 57, 15, and 13 [32]. Thus, we think that the annealed xerogel correlates more α-CaAlF5 than β-CaAlF5 phase. Especially, the phase diagram of the CaF2-AlF3 binary system with 50 mol% CaF2 confirms the presence of α-CaAlF5 until 743 °C ± 3 °C [26]. Furthermore, the thermal behavior of the CaAlF5 xerogel was investigated by thermogravimetry and DTA. The DTA heating curve of the CaAlF5 xerogel shows several exothermic peaks below 600 °C and a melting point at 894 °C. Craig and Brown found a melting point for β-CaAlF5 at 879 °C in the CaF2-AlF3 binary system [26]. Due to the synthesis in ethanol and the aluminum alkoxide precursor, the organic residue of ethanol in the xerogel is still present. Thus, the peak at 321 °C is probably the decomposition of the organic residue. At around 458 °C, we assume that the polymorphic inversion of AlF3 occurs (454 °C), which is noted by Holm [39].
2.2. Ca2AlF7
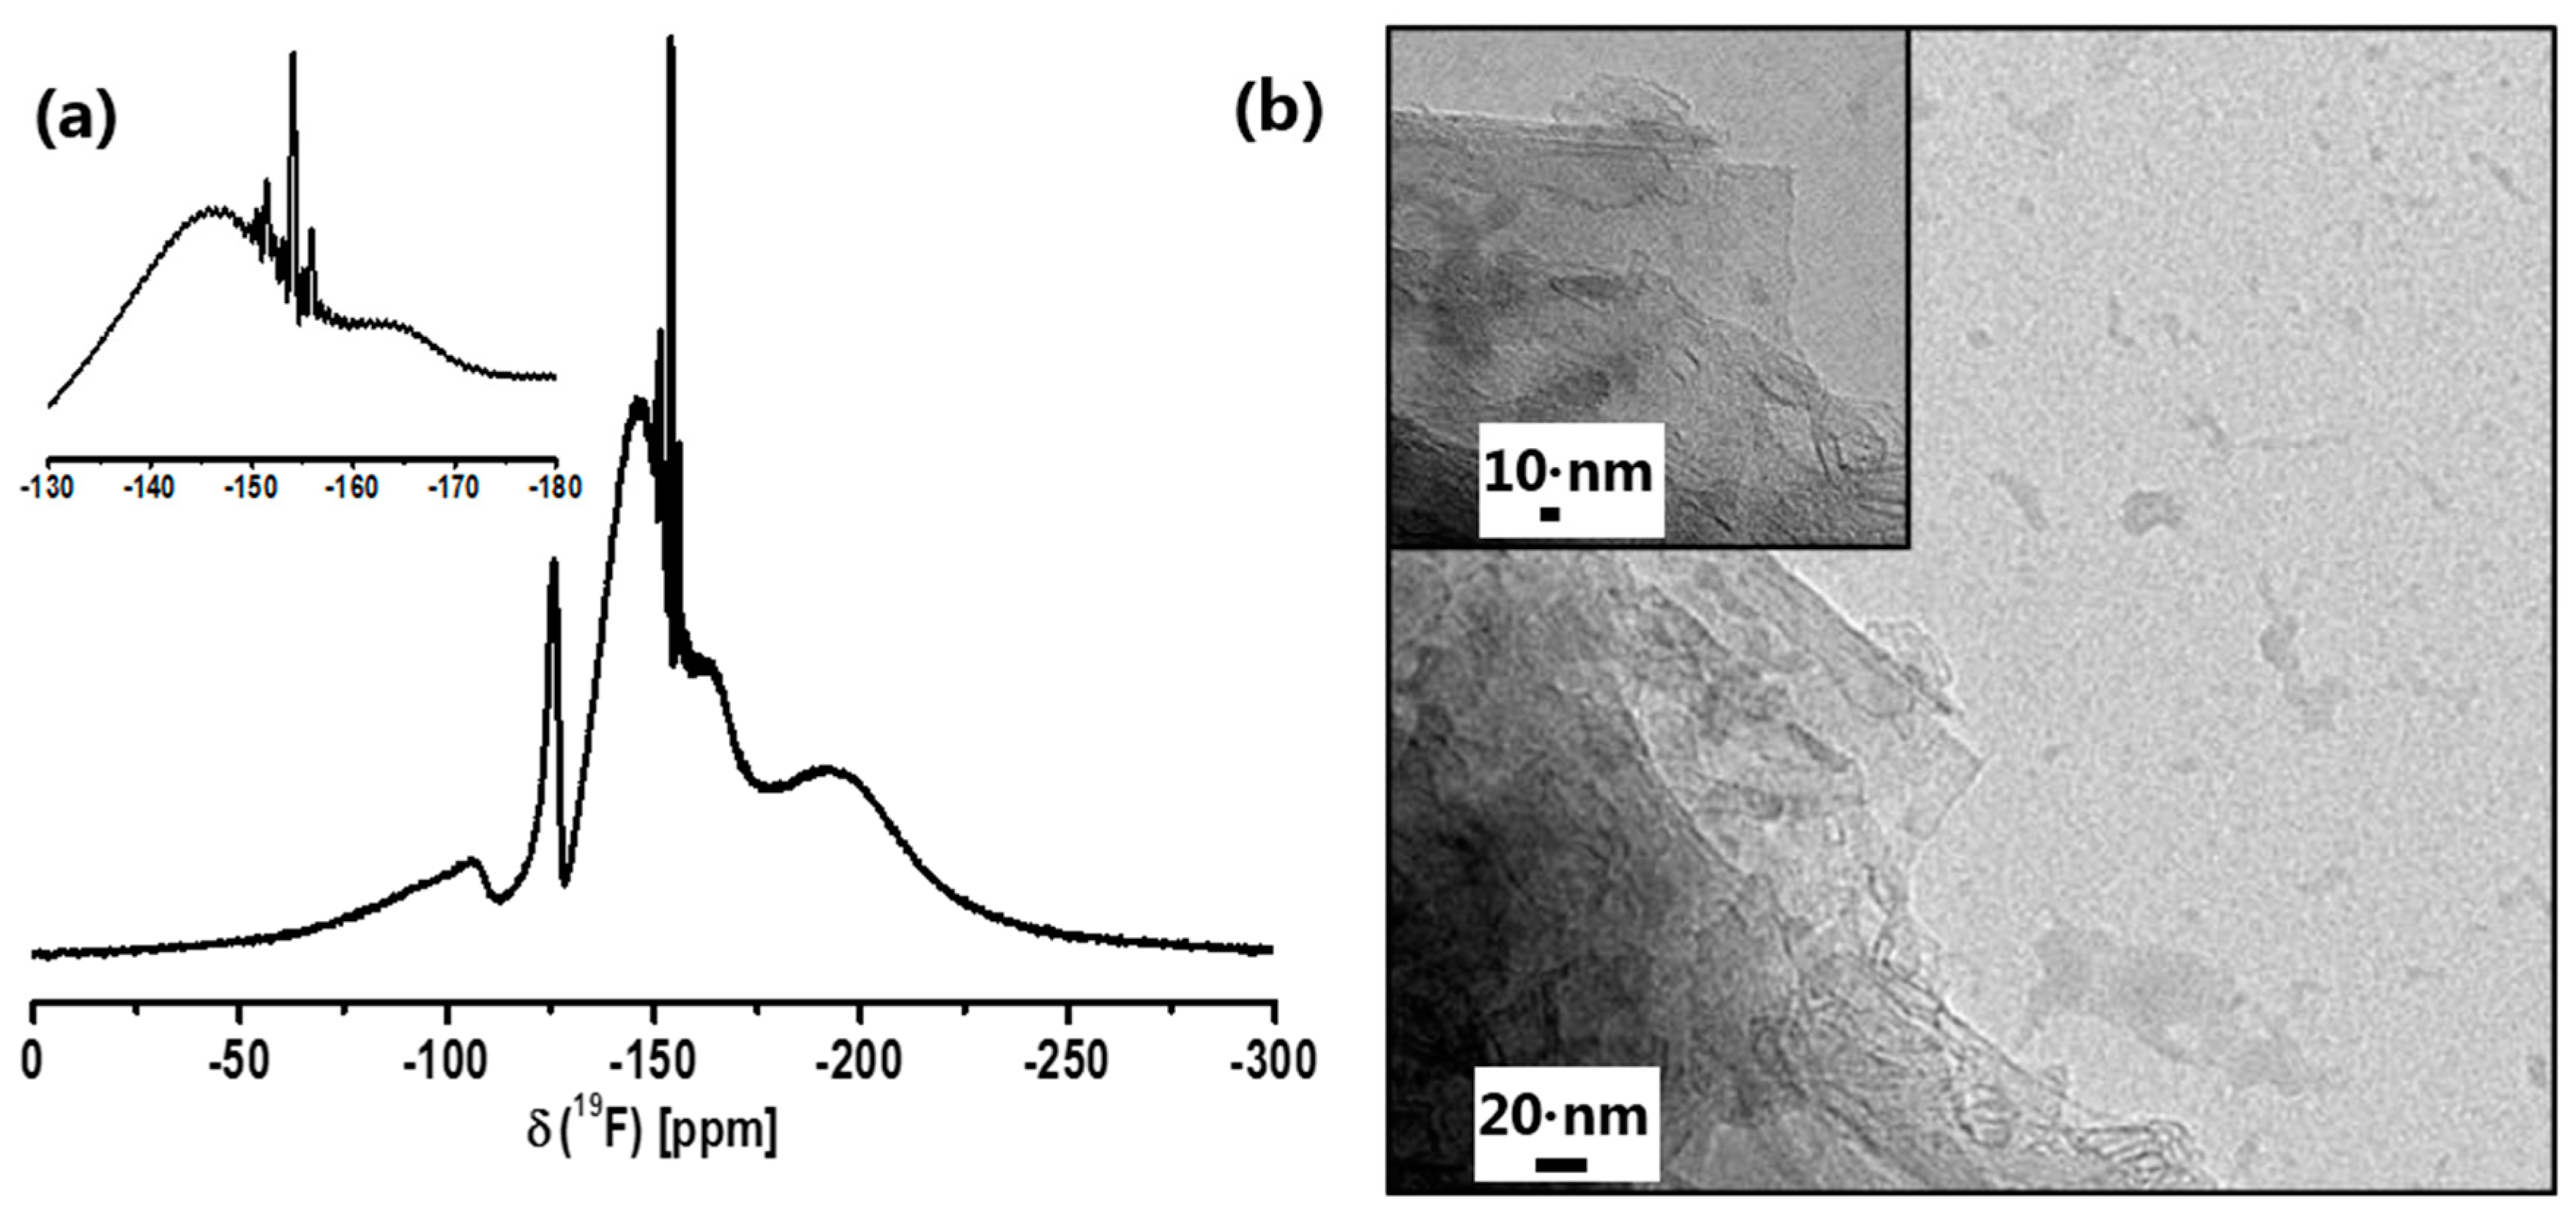
In the Ca2AlF7 system, we only obtained a transparent and long-time stable sol by the addition of 5 mol% TMOS (tetramethyl orthosilicate). Apparently, the amount of 66 mol% Cl instead of 50 mol% Cl results in a faster agglomeration of the particles followed by sedimentation. According to pure CaF2 sols from CaCl2 in EtOH, we observed the same effect of particle agglomeration. The addition of 5 mol% TMOS to an opaque CaF2 sol that was formed after HF addition resulted in a transparent sol that was obtained within a few minutes [22]. Hence, the chloride amount in the calcium fluoroaluminate system is crucial to determing whether a transparent or turbid sol is formed. 19F liquid NMR spectrum and TEM images of Ca2AlF7 sol are shown in Figure 5.
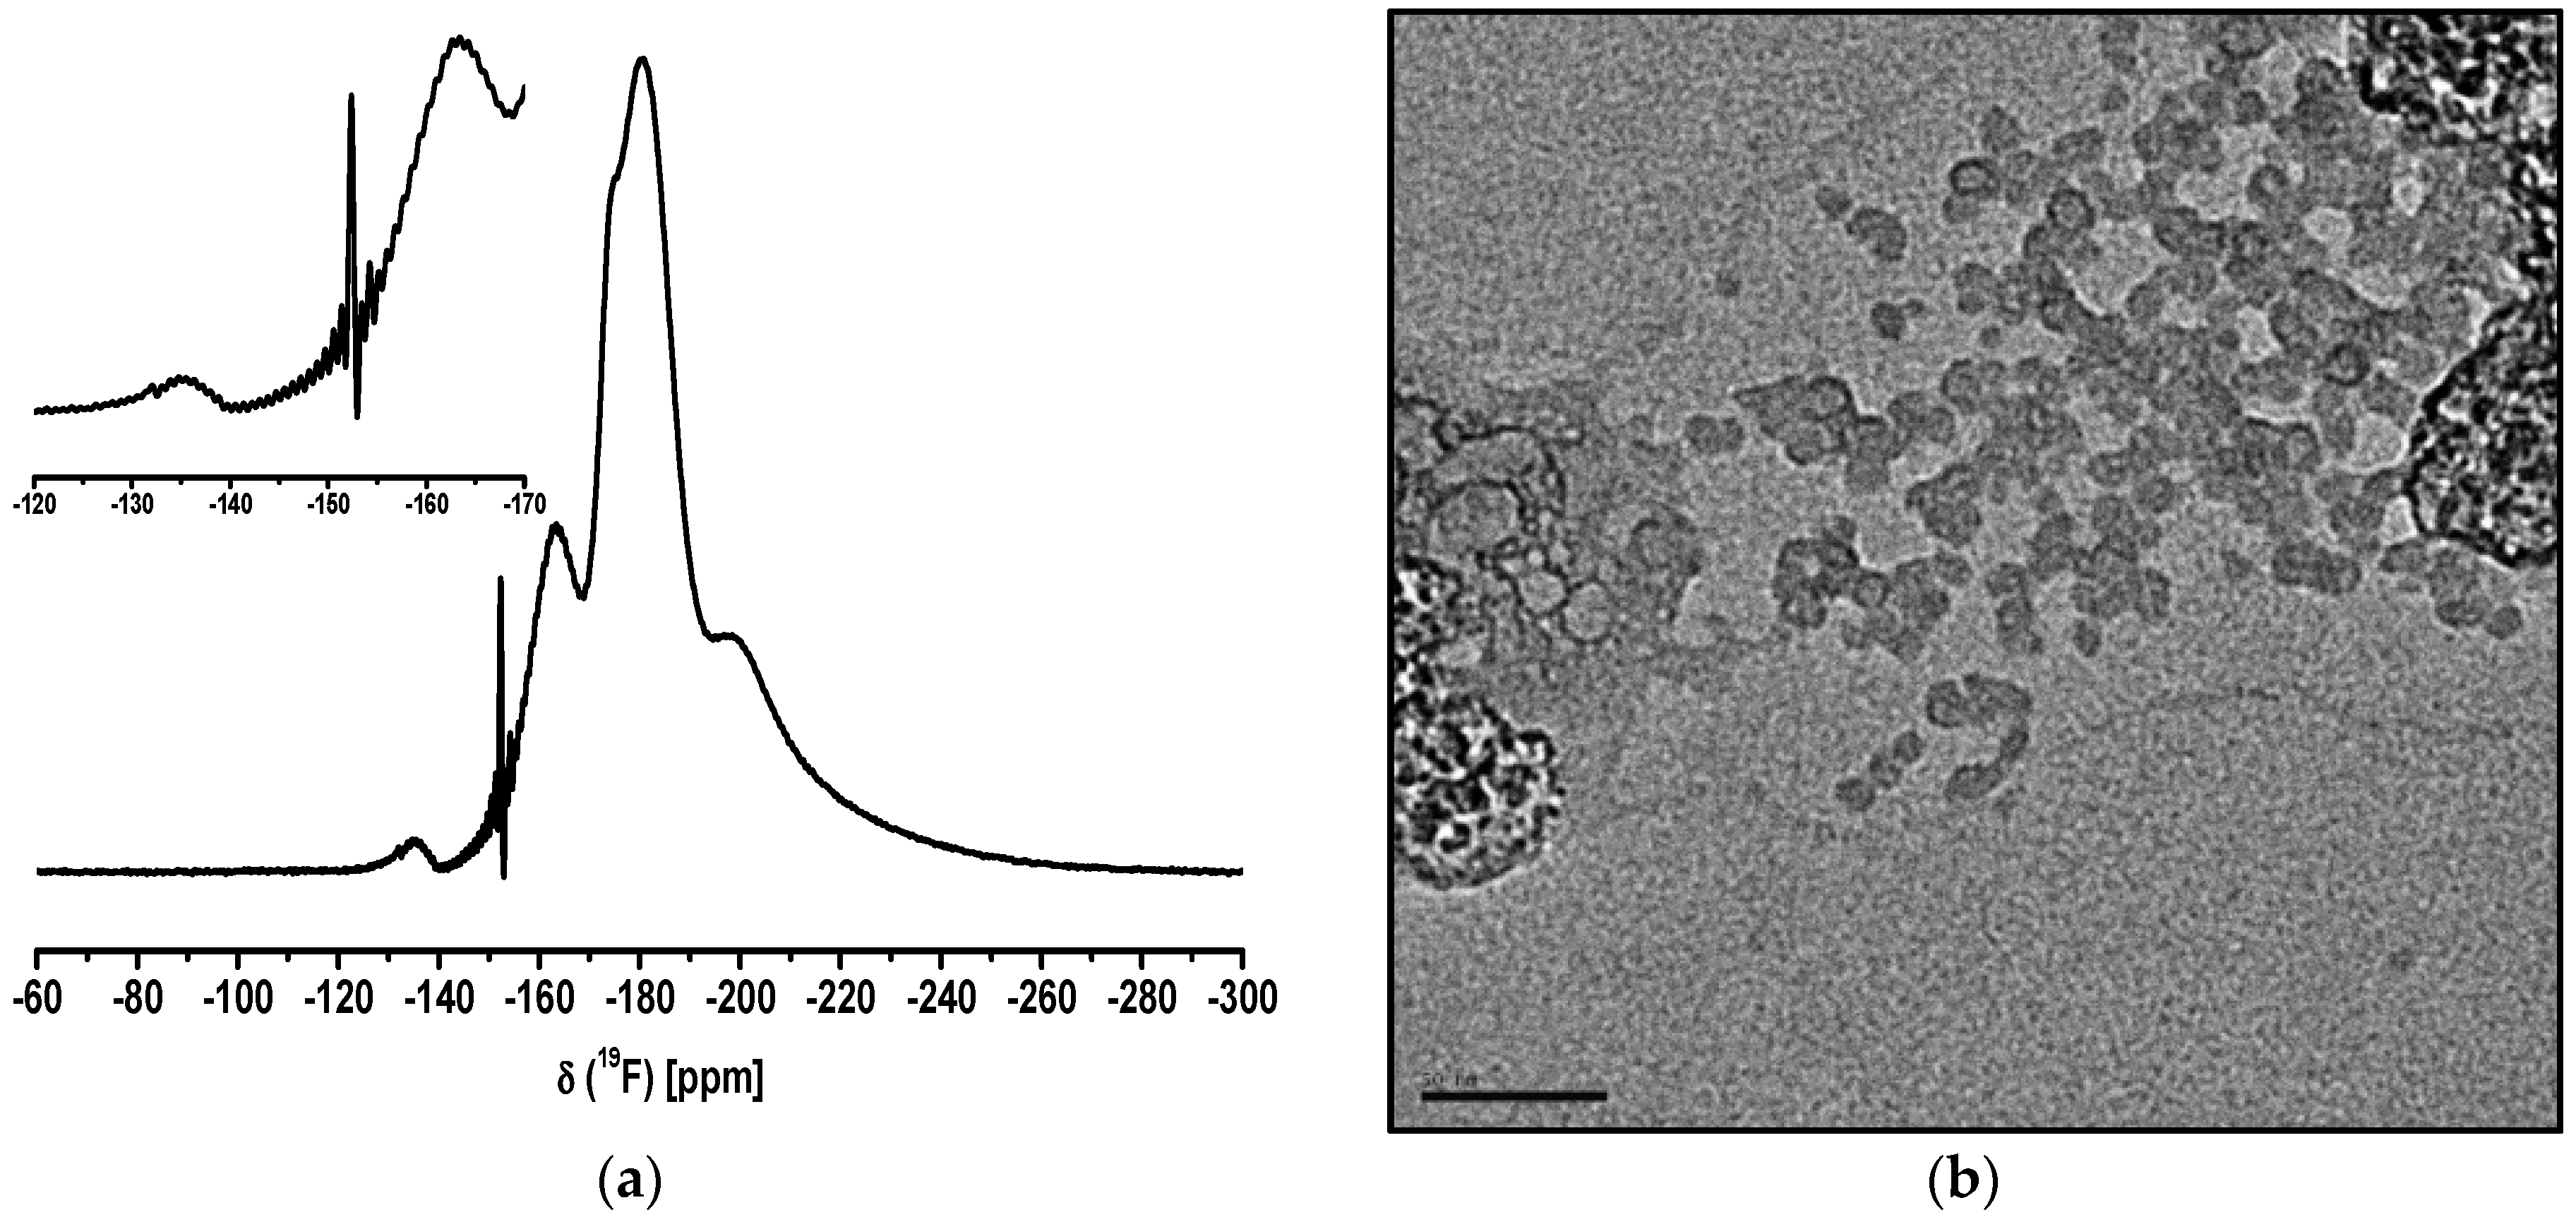
In the 19F liquid NMR spectrum of the Ca2AlF7 sol, the corresponding broad signals at around −146 ppm and −163 ppm can be assigned to Ca2AlF7 and CaAlF5, respectively. Moreover, the signals at −106 and −125 ppm are characteristic for CaF2 and SiF62−-species. The small signals between −150 and −156 ppm are related to alkoxyfluorosilanes (RO)4−x-SiFx (R = Me, Et). [40] The crystal structure of Ca2AlF7 has five distinct fluorine sites. One fluorine site is connected to three calcium F-Ca(3) and four fluorine sites are connected to aluminum and calcium with varying numbers of calcium Al-F-Ca(n) [33]. The corresponding 19F MAS NMR spectrum of Ca2AlF7 reveals three signals with chemical shifts relative to CF3Cl of −104.0, −146.7, and −152.2 ppm [35].
The TEM image of the Ca2AlF7 sol represents small spherical-like particles. Remarkably, the agglomeration partially leads to an angular shape of bigger particles, which is shown in the insight of the TEM image.
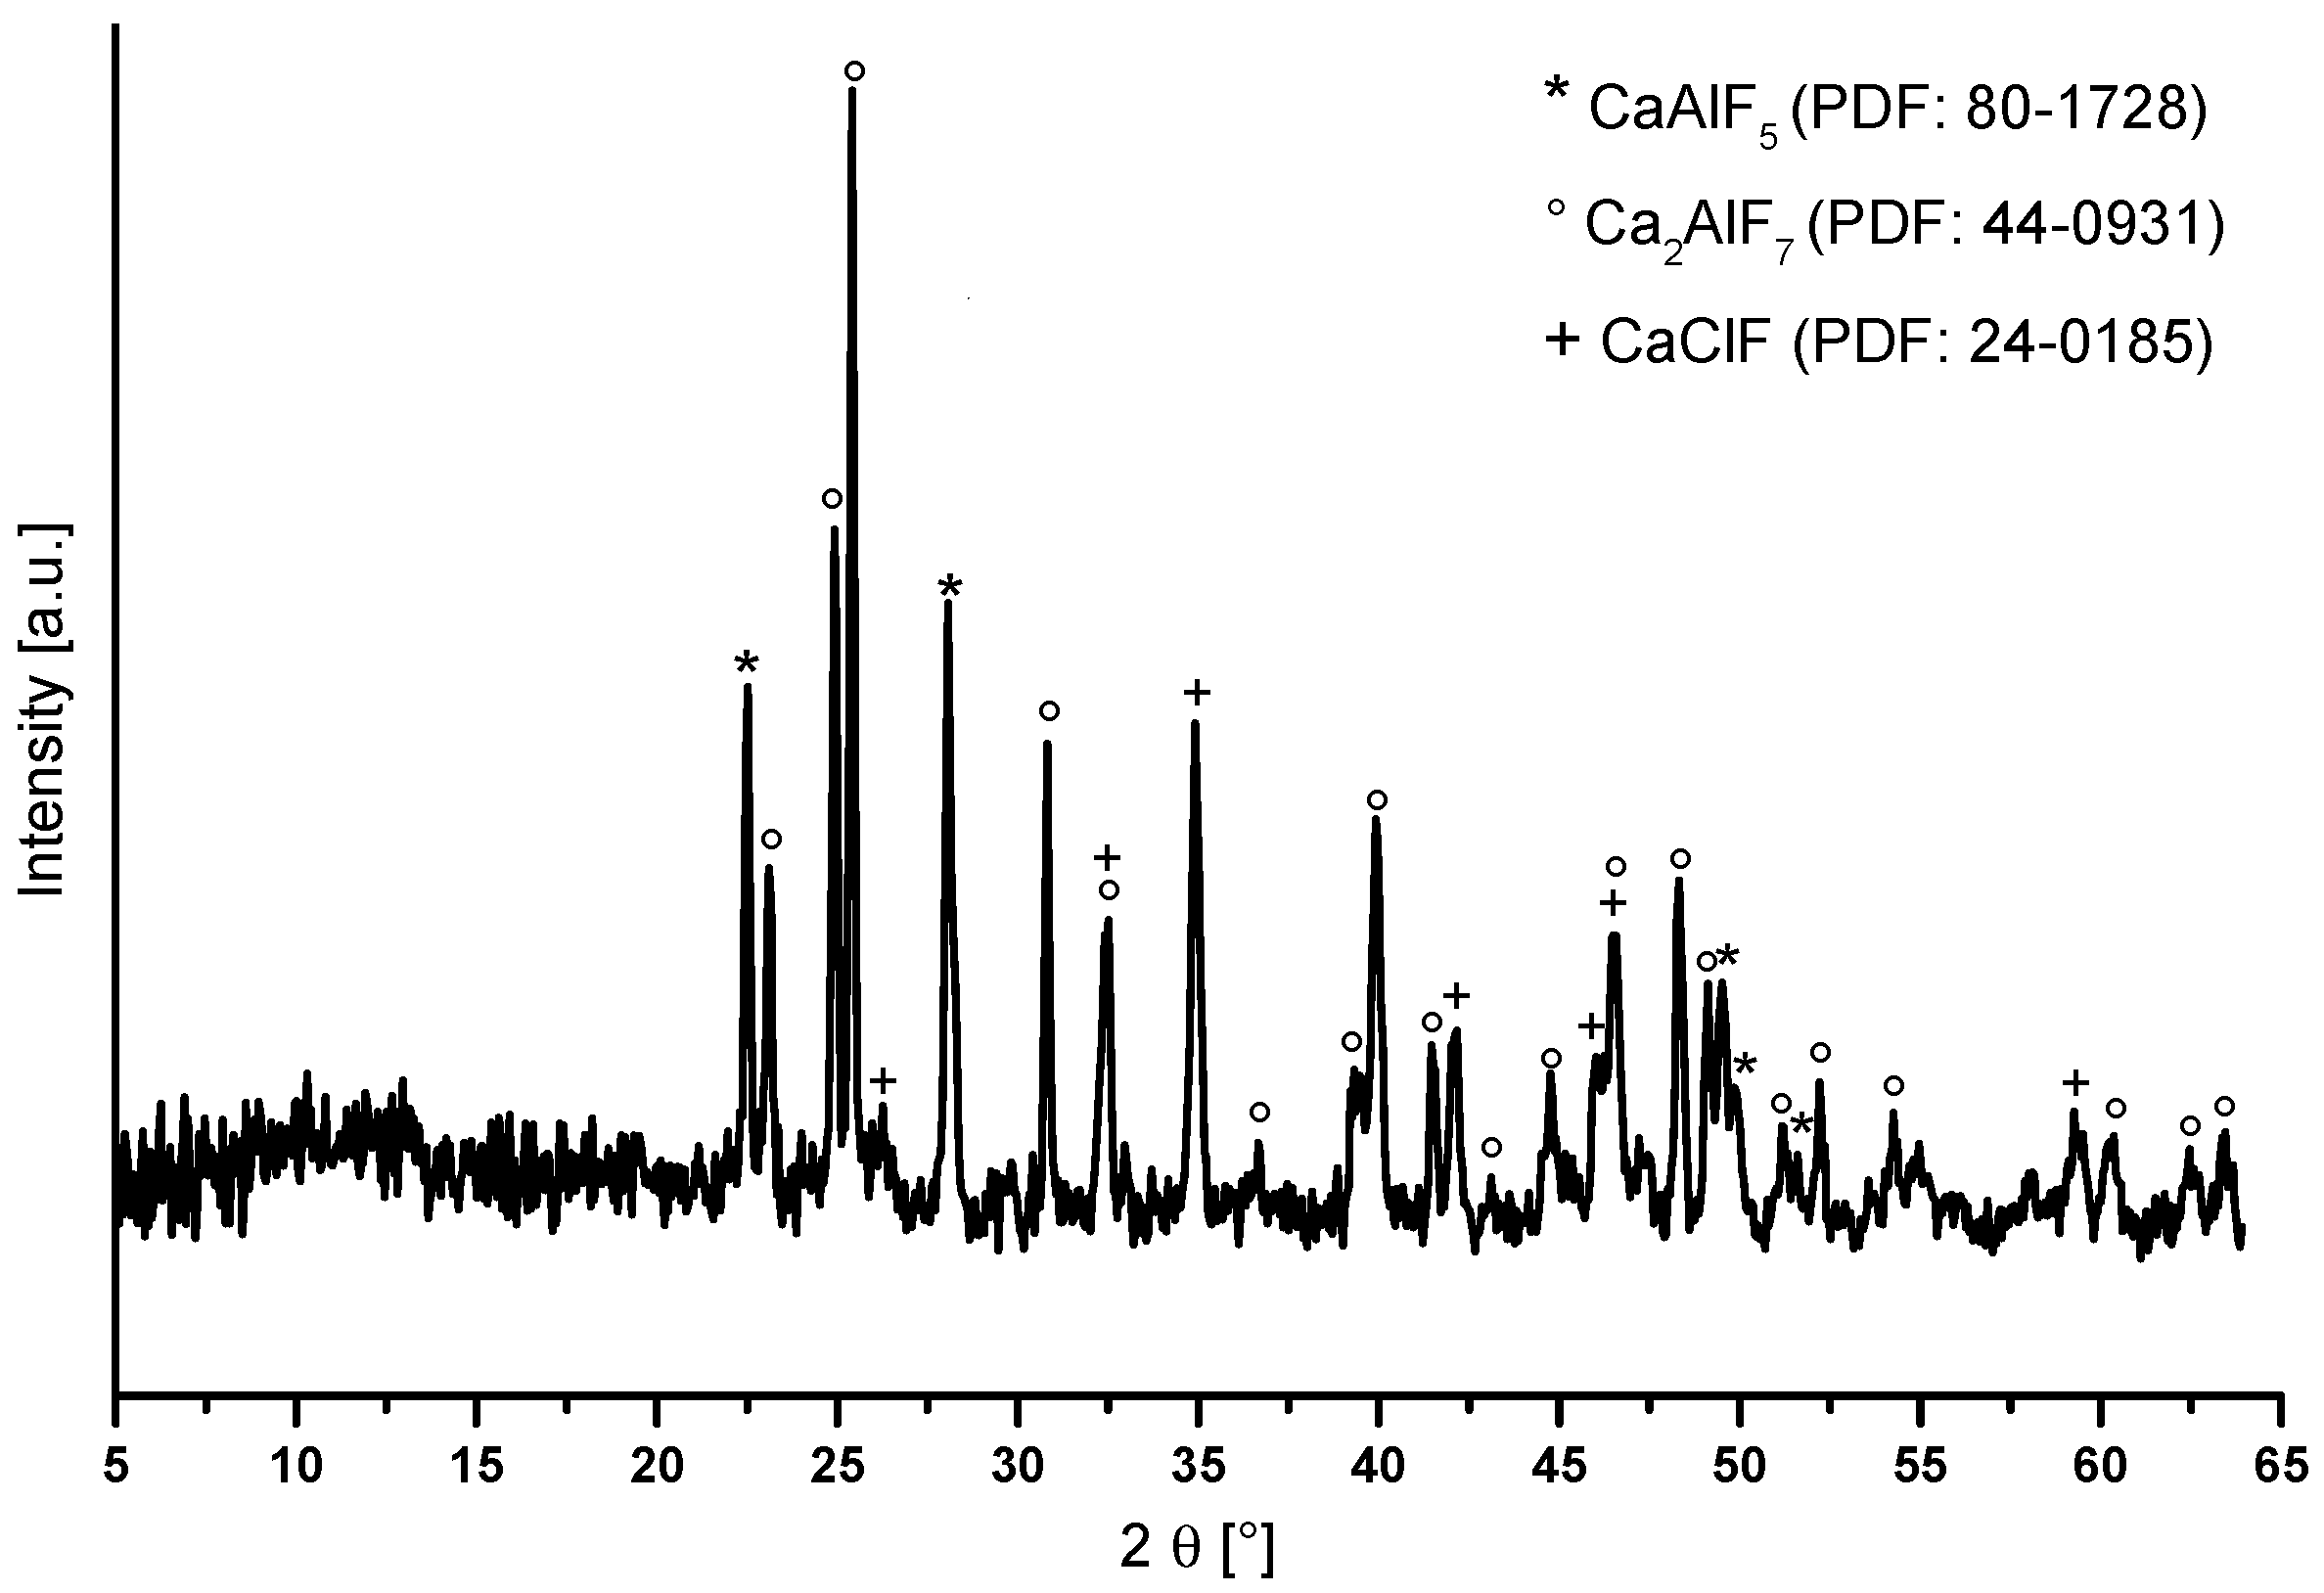
The powder diffractogram of the annealed Ca2AlF7 xerogel shows reflections of Ca2AlF7, CaAlF5, and CaClF (Figure 6). The phase diagram of CaF2-AlF3 with a composition of 66 mol% CaF2 predicts CaAlF5 and Ca2AlF7. The formation of CaClF was already reported and discussed in the synthesis of CaF2 sols derived from CaCl2 [22].
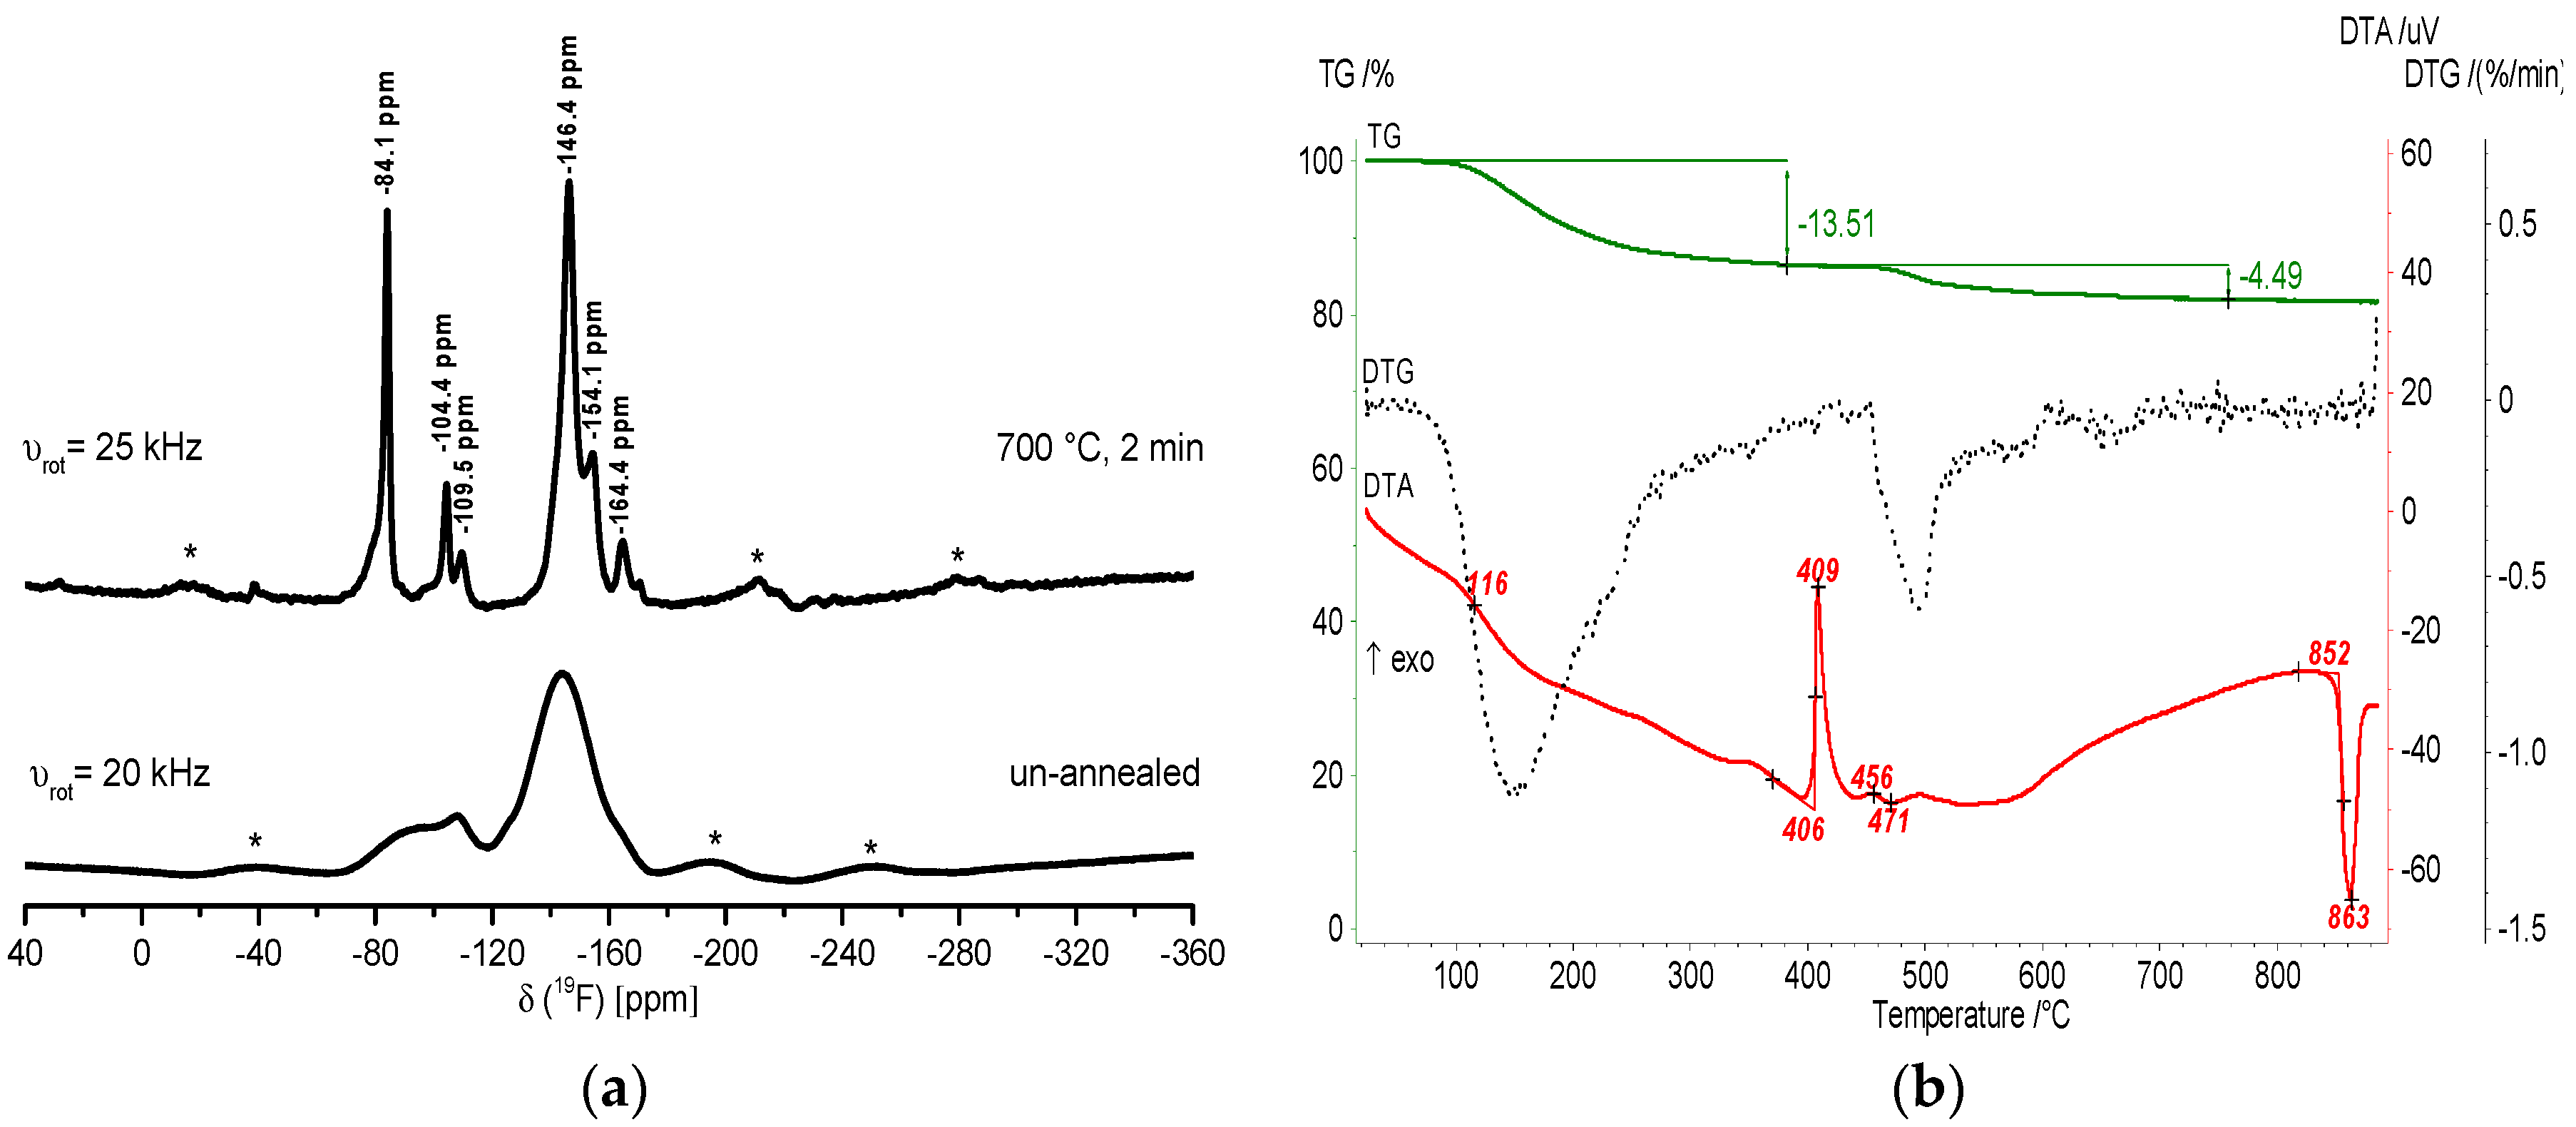
In Figure 7, the recorded 19F MAS NMR spectra of an un-annealed and annealed xerogel and the corresponding TG/DTA heating curves confirm the formation of crystalline Ca2AlF7. In the NMR spectrum of the un-annealed sample, there are two very broad signals between −70 and −110 ppm and −120 and −170 ppm. After calcination of the Ca2AlF7 xerogel at 700 °C, the spectrum represents three signals at −104.4, −146.4, and −154.1 ppm, which stand for Ca2AlF7. The signals at −84.1, −109.5, and −164.4 ppm correspond to CaClF, CaF2, and CaAlF5, respectively.
The DTA curve of the Ca2AlF7 xerogel shows one exothermic peak at 409 °C. We assume that the crystallization of CaClF occurred at this temperature. The peak at 863 °C corresponds to the melting point of Ca2AlF7, which is lower than the melting point of the CaAlF5 xerogel at 893 °C. The temperature difference of both melting points is approximately 30 °C. Thus, the melting point of Ca2AlF7 in the phase diagram of the CaF2-AlF3 binary system is 850 °C. The temperature difference of both melting points from the literature and that of our investigations reveals nearly the same temperature difference of 30 °C. Hence, we are convinced that the calcium fluoroaluminates synthesized via the fluorolytic sol-gel route exhibit a similar thermal behavior to microcrystalline calcium fluoroaluminates. Therefore, we also investigated the third calcium fluoroaluminate compound CaAl2F8 with a metal content of 66 mol% Al, which is discussed in the next section.
2.3. CaAl2F8
Although there are no reports on the synthetic calcium fluoroaluminate, CaAl2F8, we prepared a sol with a nominal stoichiometry of CaAl2F8. A water clear sol was obtained in this case without the addition of TMOS. In Figure 8, the 19F liquid NMR spectrum of the nominal “CaAl2F8” sol resembles the spectrum of the CaAlF5 sol (Figure 1). There are two broad and two small signals. The two broad signals at around −147 and −163 ppm correspond to CaAlF5 and the two signals at −173 and −179 ppm could probably be assigned to unreacted HF adsorbed at the particle surface. The particle size is about 10–20 nm. But the particles have a rather non-spherical shape and tend to agglomerate to form big secondary particles of a 200 nm diameter.
The annealed “CaAl2F8” xerogel was further investigated by powder X-ray diffraction. Figure 9 shows the recorded diffractogram of the “CaAl2F8” xerogel. There are reflections of CaAlF5 and AlF3, and a reflection that cannot be assigned to any known phase. It is obvious that no “CaAl2F8” phase has been formed under these conditions. This is also in agreement with the CaF2-AlF3 binary phase diagram. At a ratio of 66 mol% Al and 33% mol% Ca at 700 °C, the formation of crystalline α-CaAlF5 and β-AlF3 is expected.
In line with this, the 19F MAS spectrum of the un-annealed sample reveals one broad signal between −125 and −175 ppm, and the “CaAl2F8” xerogel after annealing at 700 °C for two minutes in a closed crucible exhibits five signals in the spectrum. Three signals at −145.8, −154.4, and −164.7 ppm stand for CaAlF5. The signal at −141.9 ppm can probably be assigned to β-CaAlF5, which has four different fluorine sites. The last signal at −173.5 ppm can be assigned to AlF3 (Figure 10a). The DTA heating curve of the “CaAl2F8” xerogel shows two exothermic peaks at 347 and 427 °C, which stand for the crystallization and polymorphic inversion of α-AlF3. The peak at 904 °C indicates the melting of CaAlF5, which is consistent with the phase diagram of the binary CaF2-AlF3 system. The “CaAl2F8” xerogel in fact consists of CaAlF5 and AlF3 (Figure 10b). This means that no formation of a “CaAl2F8” phase was detected under these conditions.
2.4. LiMgAlF6
The possibility to achieve quaternary metal fluorides by fluorolytic sol-gel synthesis was also tested. We achieved transparent and stable LiMgAlF6 sols in EtOH. The 19F liquid NMR spectrum of the LiMgAlF6 sol is shown in Figure 11a and reveals two broad signals at −164 and −182 ppm. The signal at −164 ppm is probably a fluorinated aluminum alkoxide species. The signal at −182 ppm with the corresponding shoulder can either be ascribed to a high amount of unreacted HF adsorbed at the particle surface or incompletely fluorinated MgCl2. The small broad signal (−135 ppm) and the small signal (−153 ppm) are due to the reaction of the unreacted HF with the glass flask. Hence, the signals at −135 ppm and −153 ppm are SiFx and BF4− species, respectively. The TEM image in Figure 11b shows nearly spherical shape particles with a size of about 10 nm.
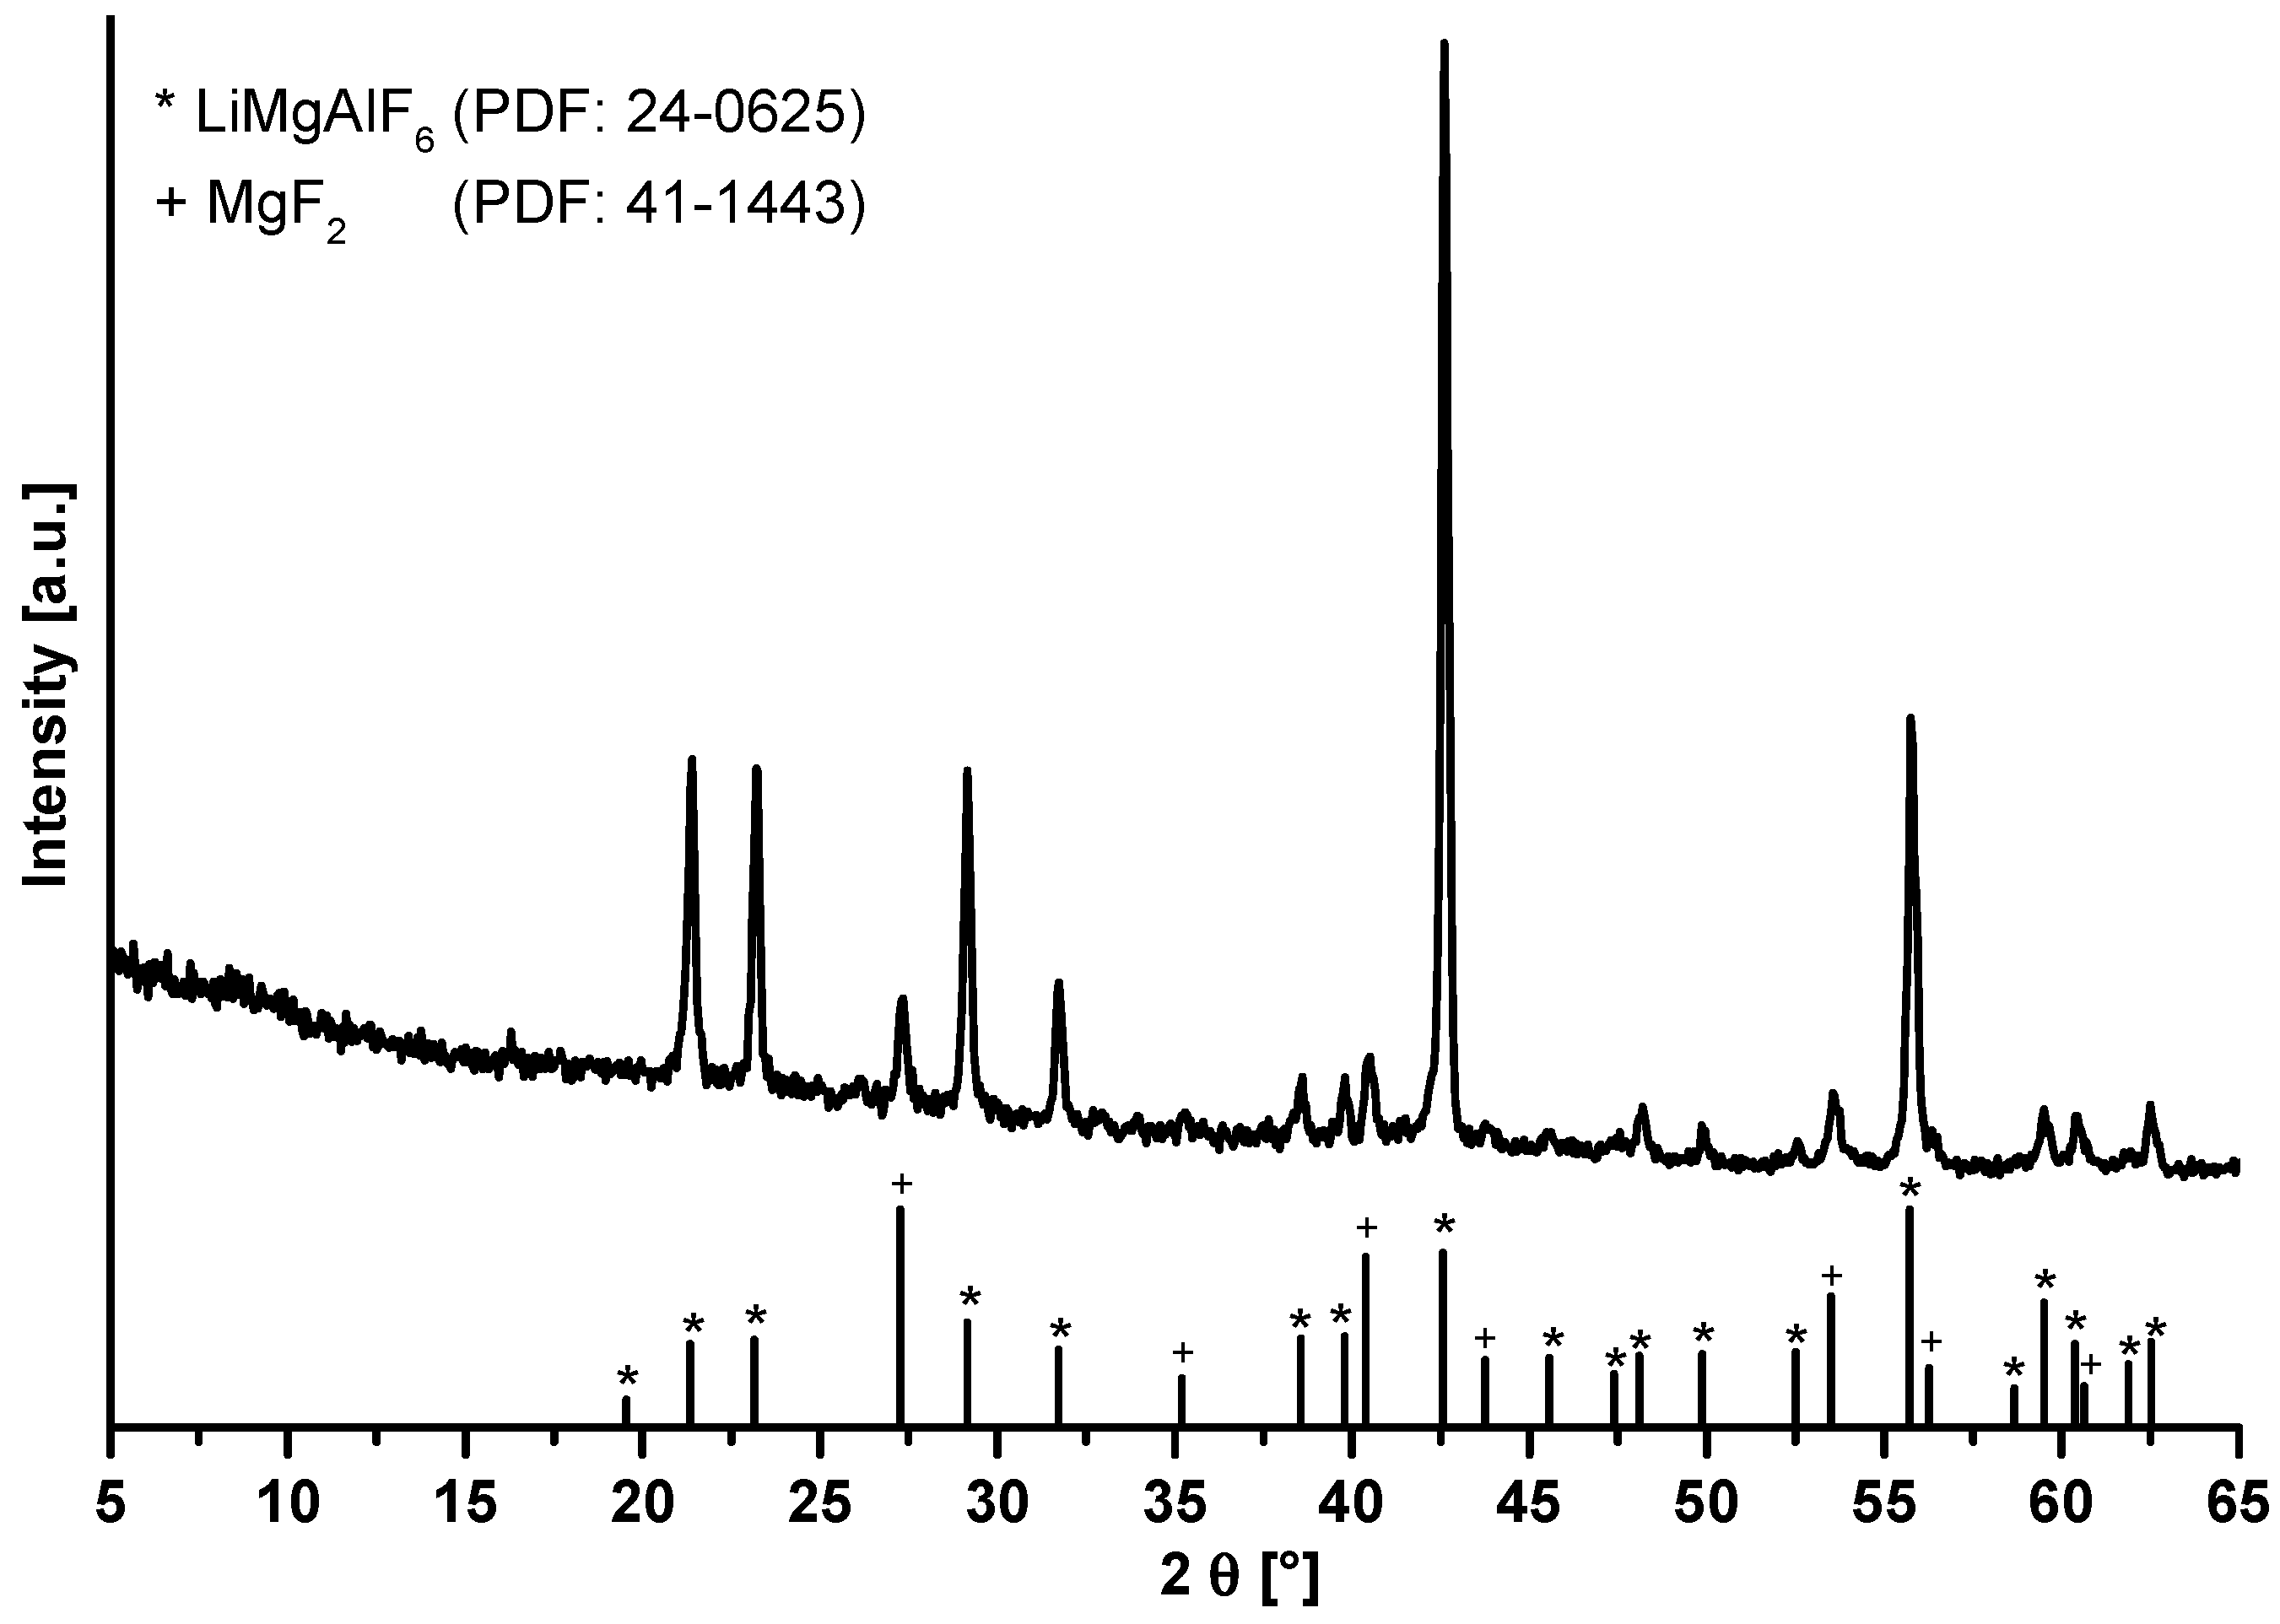
The annealed LiMgAlF6 xerogel was measured by powder X-ray diffraction. As can be seen in Figure 12, there are reflections of the LiMgAlF6 phase and MgF2 in the diffractogram. Surprisingly, the use of a closed crucible is not necessary. It can be assumed that the formation of AlF3 is thermodynamically not favored in this reaction system, unlike the formation of MgF2.
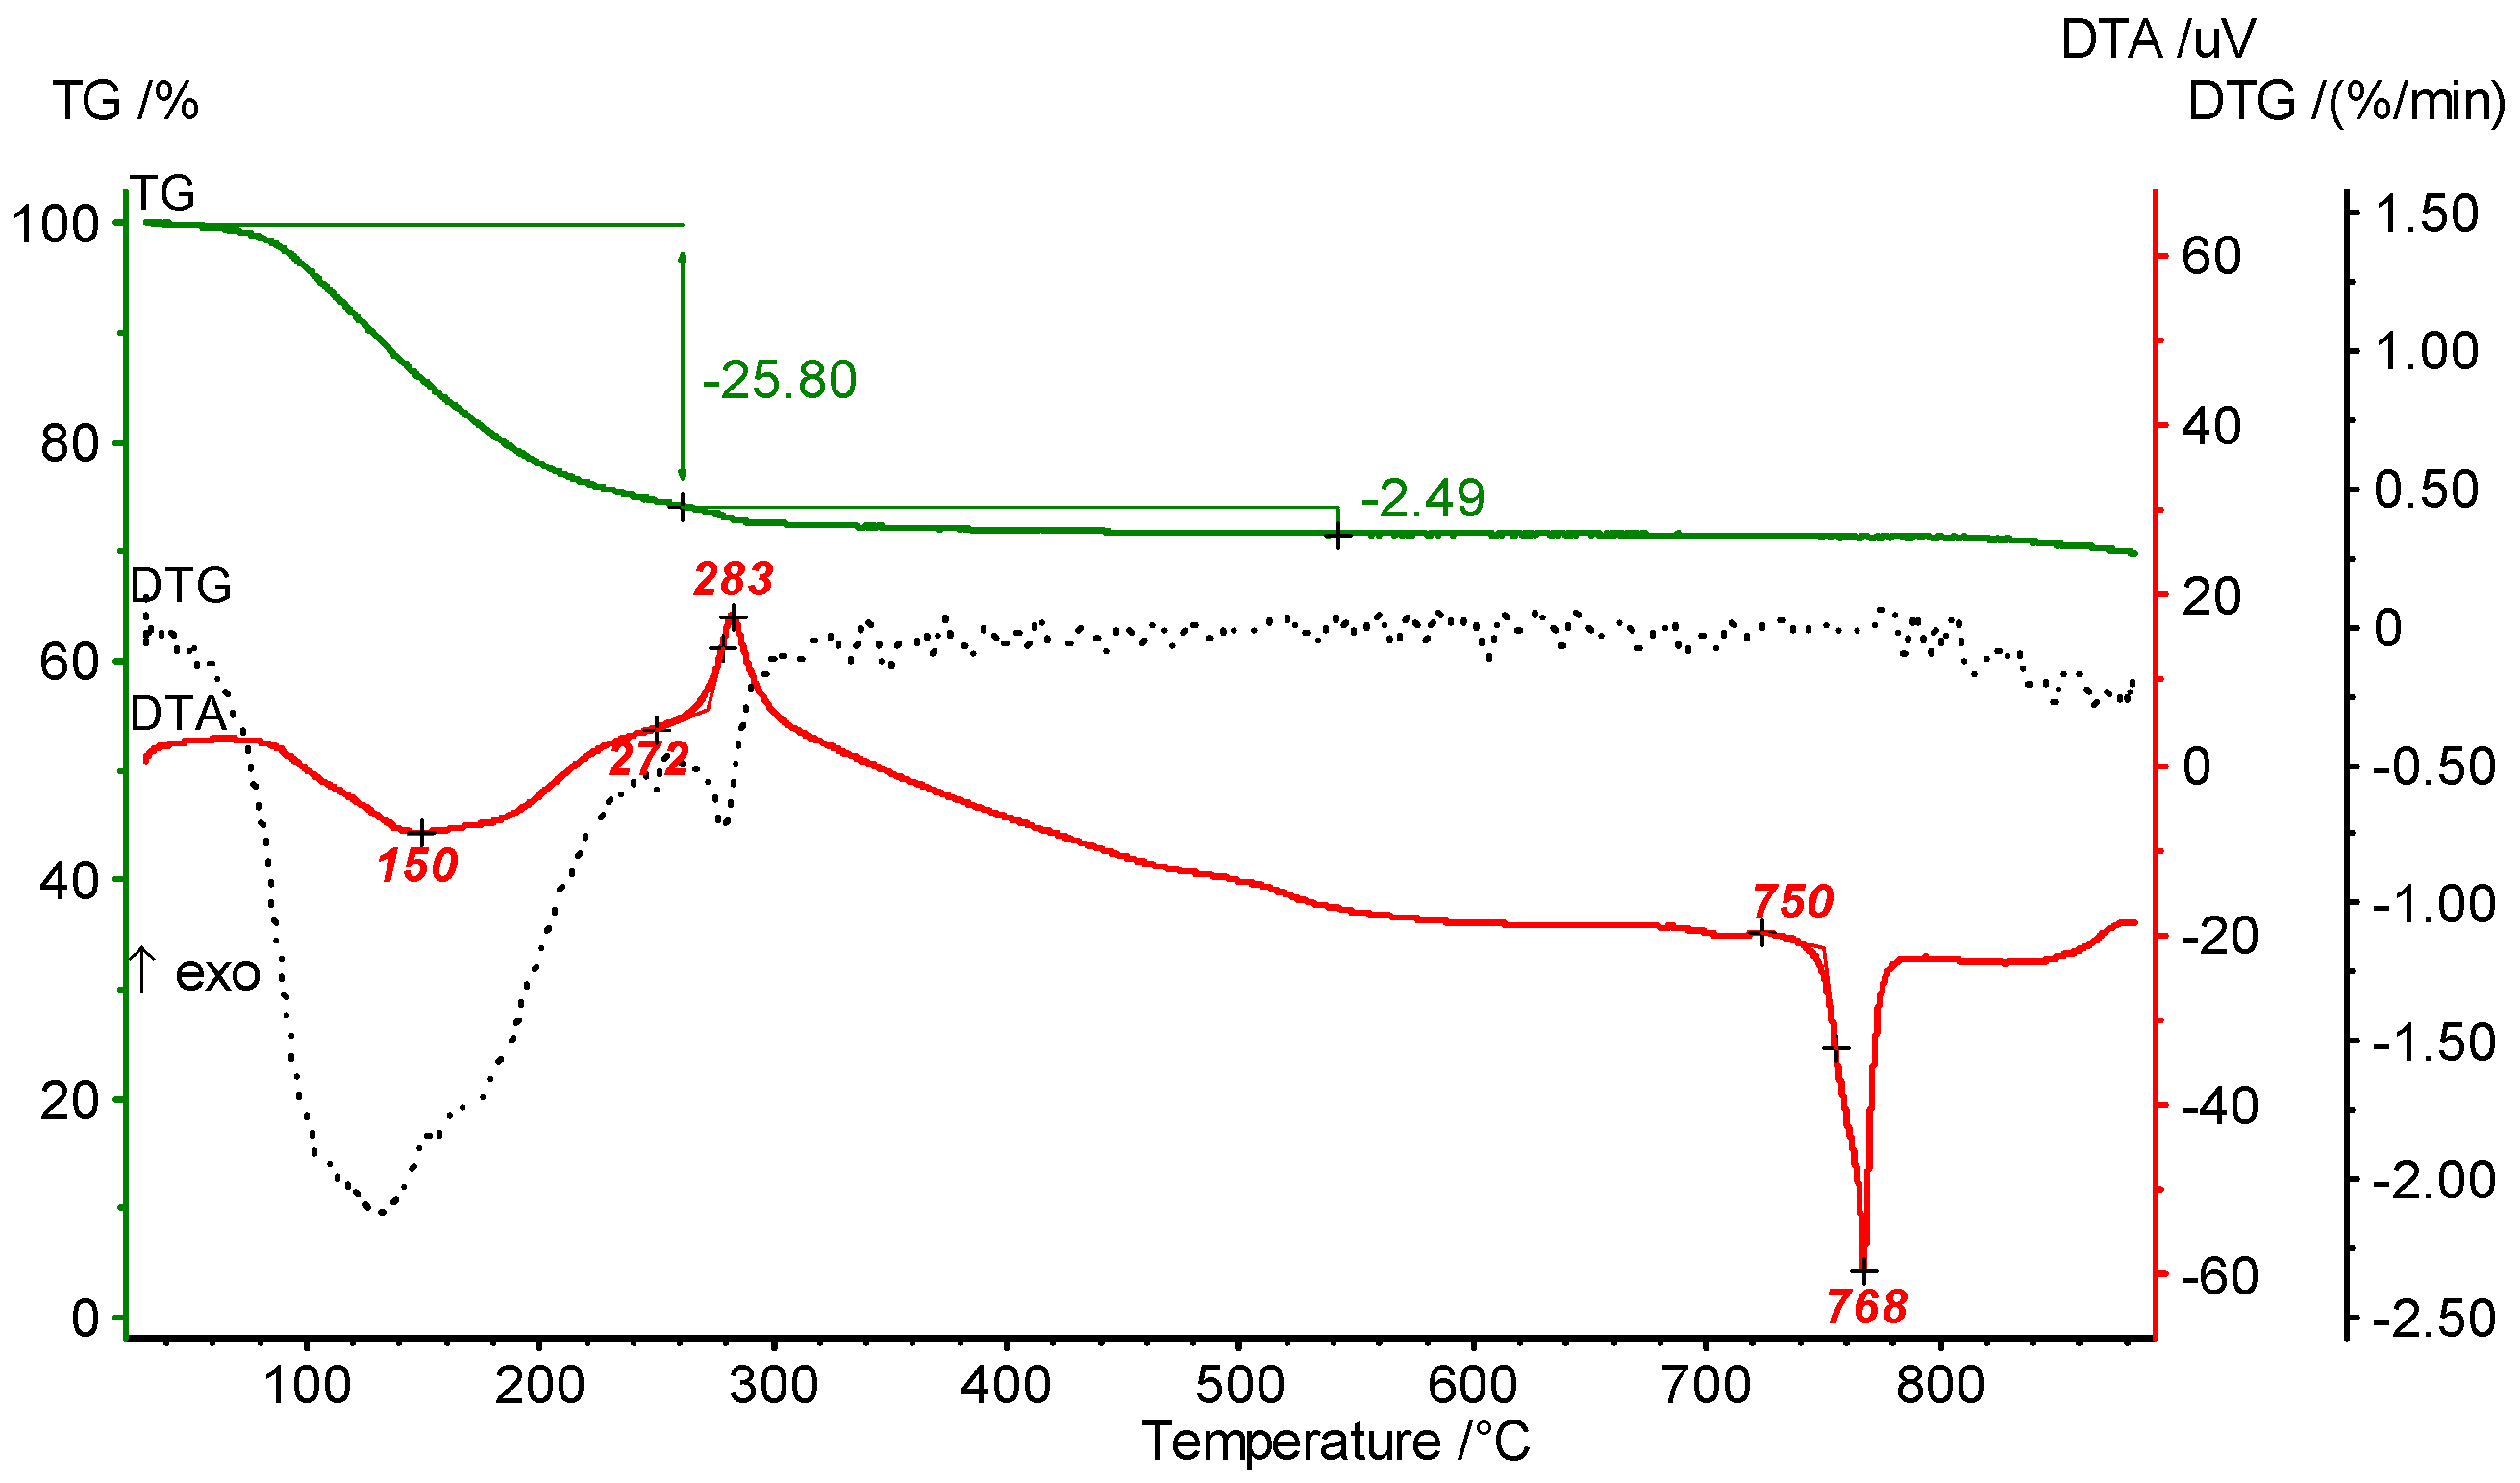
The DTA heating curve of the LiMgAlF6 xerogel (Figure 13) shows an exothermic peak at 383 °C which stands for crystallization and the peak at 768 °C compares very well to the melting point of LiMgAlF6.
3. Materials and Methods
3.1. Synthesis of Complex Metal Fluoride Sols
All chemicals for the synthesis of ternary and quaternary metal fluorides are commercially available and need no drying or further processing. The 19.05 M HF-solution was prepared by dissolving anhydrous HF in ethanol. The molar concentration of the sols refers to the total metal concentration of 0.4 M in the corresponding complex metal fluoride compound.
The stoichiometric fluoride compounds CaAl2F8, CaAlF5, LiMgF3, and LiMgAlF6 were prepared as follows: Anhydrous CaCl2 (97%, Sigma-Aldrich), MgCl2 (98%, Sigma-Aldrich, Schnelldorf, Germany), and LiOMe (95%, Strem Chemicals, Kehl, Germany), respectively, were dissolved in 50 mL ethanol (99.8%, Roth, Karlsruhe, Germany). Afterwards, Al(OiPr)3 (98%, Sigma-Aldrich) was suspended into the solution. Under vigorous stirring at ambient conditions, the required amount of HF-solution was added dropwise to the suspension. In case of Ca2AlF7, the addition of 5 mol% tetramethyl orthosilicate (TMOS) after fluorination turns an opaque sol into a transparent Ca2AlF7 sol. Apparently, the presence of metal chloride in the sol and the addition of TMOS after fluorination ensures a higher electrostatic repulsion of the nanoparticles than without the addition of TMOS which increases the particle stabilization. The sols were dried under vacuum at 80 °C to obtain the corresponding xerogels.
3.2. Analytical Measurements
The 19F NMR spectra of the sols were obtained by using a Bruker AVANCE II (liquid state NMR spectrometer with a Larmor frequency of 282.4 MHz). The 19F isotropic chemical shifts are given with respect to the CFCl3 standard.
Transmission Electron Microscope (TEM) analysis was carried out using a Philips CM200 LaB6 microscope operating at 200 kV. A few drops of the solution (0.1 mM) containing the nanoparticles were deposited on a carbon-coated copper grid and were left to dry prior to the inspection.
Thermal analysis experiments of the complex metal fluorides were performed on a STA 409 °C (Netzsch Gerätebau GmbH, Selb, Germany). A DTA-TG sample-holder system (Pt/PtRh10 thermocouple) was used. The thermoanalytical curves (TG, DTA and DTG) were recorded under air atmosphere with a constant heating rate of 10 K/min.
The xerogels were characterized by an X-ray powder diffractometer from Seifert (XRD 3003 TT) and by 19F solid state NMR spectroscopy. Phases were identified by a comparison with the ICDD (international center for diffraction data) powder diffraction file [41]. The 19F MAS NMR spectra were recorded with a Bruker AVANCE 400 (solid state spectrometer, Larmor frequency of 376.4 MHz) with a π/2 pulse duration of 3.6 μs in a 2.5 mm Bruker probe, a recycle delay of 5 s, and accumulation number of 64. The experiments were performed with a rotation frequency of 20 kHz. The 19F isotropic chemical shifts are given with respect to the CFCl3 standard. The xerogels were calcined in a preheated vented air-oven (Barnstead thermolyne F47900, Dubuque, IA, USA) at 500 °C and 700 °C, respectively. The dwell time was 2 and 60 min, respectively. After the dwell time, the sample was quickly taken out of the oven and cooled down to room temperature.
4. Conclusions
The fluorolytic sol-gel synthesis, so far mainly used for the synthesis of binary or ternary metal fluorides, has been successfully applied for the synthesis of nanoscaled, homodispersed complex metal fluoride sols (CaAlF5, Ca2AlF7, LiMgAlF6) using CaCl2, MgCl2, LiOMe, and Al(OiPr)3 as metal precursors, which were reacted with anhydrous HF in ethanol. All complex metal fluoride sols showed long-time stability and transparency even after months. These complex metal fluorides recently gained an enormous amount of interest as hosts for fluorescent materials [1,2,3,4,5,6,7] due to the suitable sizes of the ionic radii of alkaline earth cations. In addition, they exhibit high ionic strength, hardness, good isolation behavior, and are stable over a wide temperature range. Hence, based on the new synthesis approach reported here, an alternative and very effective synthesis approach for such fluorescent materials is provided. Even bulk ceramics are accessible starting from such nano powdered complex metal fluorides. Based on XRD and MAS-NMR-investigations, the formation of these complex metal fluorides already at room temperature was unambiguously proven. Thus, these results show that the fluorolytic sol gel synthesis is not limited to binary metal fluorides, but can also be successfully adapted for even more complex metal fluoride systems.
Thus, a new synthesis path has been explored for a variety of new, optically very interesting complex metal fluoride-based materials.
Supplementary Materials
The following are available online at www.mdpi.com/2079-4991/7/11/362/s1, Figure S1: Photograph of a typical transparent LiMgF3 sol, Figure S2: 19F liquid NMR spectrum of LiMgF3 sol, Figure S3: TEM image of LiMgF3 sol, Figure S4: X-Ray powder diffractogram of un-annealed LiMgF3 xerogel, Figure S5: Comparison of X-ray powder patterns of annealed LiMgF3 xerogel at 700 °C (a), 850 °C (b) for 2 min and crystalline MgF2 (PDF: 41-1443) and LiF (PDF: 04-0857), Figure S6: TG/DTA heating curves of LiMgF3 xerogel.
Acknowledgments
This work was financed by the graduate school GRK 1582 “Fluorine as a key element” by the Deutsche Forschungsgemeinschaft (DFG). We thank Michael Feist for DTA/TG- and Stefan Mahn for TEM-measurements.
Author Contributions
Alexander Rehmer performed the syntheses and wrote the paper. Kerstin Scheurell and Gudrun Scholz analyzed, evaluated and discussed the data. Erhard Kemnitz was responsible for coordinating the experiments and correcting the manuscript.
Conflicts of Interest
The authors declare no conflict of interest.
References
- Du, M.H. Chemical stability and Ce doping of LiMgAlF6 neutron scintillator. J. Alloys Compd. 2015, 622, 925–928. [Google Scholar] [CrossRef]
- Belsare, P.D.; Joshi, C.P.; Moharil, S.V.; Omanwarc, S.K.; Muthald, P.L.; Dhopted, S.M. Preparation and characterization of LiAEAlF6 Eu (AE = Mg, Ca, Sr or Ba) phosphors. J. Lumin. 2009, 129, 135–139. [Google Scholar] [CrossRef]
- Samtleben, T.A.; Hulliger, E. LiCaAlF6 and LiSrAlF6: Tunable solid state laser host materials. Opt. Lasers Eng. 2005, 43, 251–262. [Google Scholar] [CrossRef]
- Van der Kolk, E.; Dorenbos, P.; van Eijk, C.W.E. Luminescence excitation study of the higher energy states of Pr3+ and Mn2+ in SrAlF5, CaAlF5, and NaMgF3. J. Appl. Phys. 2004, 95, 7867–7872. [Google Scholar] [CrossRef]
- Gektin, A.; Shiran, N.; Neicheva, S.; Gavrilyuk, V.; Bensalah, A.; Fukuda, T.; Shimamura, K. LiCaAlF6:Ce crystal: A new scintillator. Nucl. Instrum. Methods Phys. Res. Sect. A 2002, 486, 274–277. [Google Scholar] [CrossRef]
- Tao, F.; Hong, G.Y.; Zhu, S.F.; You, H.; Zhou, X.; Zhao, B. Synthesis and spectroscopic characteristics of LiMgAlF6: RE3+ (RE = Eu, Tm, Gd). Phys. Status Solidi A-Appl. Res. 1998, 165, 303–308. [Google Scholar] [CrossRef]
- Tao, F.; Zhou, X.J.; Zhu, S.F.; Zhao, B.; Hong, G.; You, H. Synthesis and luminescence characteristics of LiMgAlF6:Ln3+ (Ln = Ce, Eu, Tb). Cryst. Res. Technol. 1997, 32, 849–855. [Google Scholar] [CrossRef]
- Bessoi, M.; Soren, S.; Parhi, P. Rapid microwave mediated hydrothermal synthesis of complex ternary fluorides. Ceram. Int. 2016, 42, 3697–3700. [Google Scholar] [CrossRef]
- Zakalyukin, R.M.; Fedorov, P.P. Classification of fluoroaluminate glasses. Inorg. Mater. 2003, 39, 640–644. [Google Scholar] [CrossRef]
- Ehrt, D.; Vogel, W. Fluoroaluminate glass. J. Fluorine Chem. 1985, 29, 54. [Google Scholar] [CrossRef]
- Krauß, M.; Ehrt, D.; Heide, K.; Vogel, W. Phasenanalytische Untersuchungen im System CaF2-AlF3. Z. Chem. 1984, 24, 247–250. [Google Scholar] [CrossRef]
- Ehrt, D.; Krauß, M.; Erdmann, C.; Vogel, W. Fluoroaluminatgläser;1) Systeme CaF2-AlF3 und MgF2-CaF2-AlF3. Z. Chem. 1982, 22, 315–316. [Google Scholar] [CrossRef]
- Zhang, X.; Quan, Z.; Yang, J.; Yang, P.; Lian, H.; Lin, J. Solvothermal synthesis of well-dispersed NaMgF3 nanocrystals and their optical properties. J. Colloid Interface Sci. 2009, 329, 103–106. [Google Scholar] [CrossRef] [PubMed]
- Kemnitz, E.; Gross, U.; Rudiger, S.; Shekar, S.H. Amorphous Metal Fluorides with Extraordinary High Surface Areas. Angew. Chem. Int. Ed. 2003, 42, 4251–4254. [Google Scholar] [CrossRef] [PubMed]
- Gross, U.; Ruediger, S.; Kemnitz, E. Alkaline earth fluorides and their complexes: A sol-gel fluorination study. Solid State Sci. 2007, 9, 838–842. [Google Scholar] [CrossRef]
- Ahrens, M.; Scholz, G.; Feist, M.; Kemnitz, E. Application of an alkoxide sol-gel route for the preparation of complex fluorides of the MAlF4 (M = K, Cs), M3AlF6 (M = Li, Na, K), and Na5Al3F14 type. Solid State Sci. 2006, 8, 798–806. [Google Scholar] [CrossRef]
- Kohl, J.; Wiedemann, D.; Nakhal, S.; Bottke, P.; Ferro, N.; Bredow, T.; Kemnitz, E.; Wilkening, M.; Heitjanse, P.; Lerch, M. Synthesis of ternary transition metal fluorides Li3MF6 via a sol-gel route as candidates for cathode materials in lithium-ion batteries. J. Mater. Chem. 2012, 22, 15819–15827. [Google Scholar] [CrossRef]
- Krahl, T.; Scheurell, K.; Kemnitz, E. Novel aspects in the chemistry of the non-aqueous fluorolytic sol-gel synthesis of nanoscaled homodisperse MgF2 sols for antireflective coatings. J. Mater. Chem. C 2016, 4, 1454–1466. [Google Scholar] [CrossRef]
- Ruediger, S.K.; Gross, U.; Feist, M.; Prescott, H.A.; Shekar, S.C.; Troyanova, S.I.; Kemnitz, E. Non-aqueous synthesis of high surface area aluminium fluoride—A mechanistic investigation. J. Mater. Chem. 2005, 15, 588–597. [Google Scholar] [CrossRef]
- Scheurell, K.; Kemnitz, E.; Garcia-Juan, P.; Eicher, J.; Lintner, B.; Hegmann, J.; Jahn, R.; Hofmann, T.; Löbmann, P. Porous MgF2 antireflective λ/4 films prepared by sol-gel processing: Comparison of synthesis approaches. J. Sol-Gel Sci. Technol. 2015, 76, 82–89. [Google Scholar] [CrossRef]
- Noack, J.; Scheurell, K.; Kemnitz, E.; Garcia-Juan, P.; Rau, H.; Lacroix, M.; Eicher, J.; Lintner, B.; Sontheimer, T.; Hofmann, T.; et al. MgF2 antireflective coatings by sol-gel processing: Film preparation and thermal densification. J. Mater. Chem. 2012, 22, 18535–18541. [Google Scholar] [CrossRef]
- Rehmer, A.; Scheurell, K.; Kemnitz, E. Formation of nanoscopic CaF2 via a fluorolytic sol-gel process for antireflective coatings. J. Mater. Chem. C 2015, 3, 1716–1723. [Google Scholar] [CrossRef]
- Kemnitz, E.; Noack, J. The non-aqueous fluorolytic sol-gel synthesis of nanoscaled metal fluorides. Dalton Trans. 2015, 44, 19411–19431. [Google Scholar] [CrossRef] [PubMed]
- Carta, D.; Pickup, D.M.; Knowles, J.C.; Smith, M.E.; Newport, R.J. Sol-gel synthesis of the P2O5-CaO-Na2O-SiO2 system as a novel bioresorbable glass. J. Mater. Chem. 2005, 15, 2134–2140. [Google Scholar] [CrossRef]
- Scholz, G.; Stosiek, C.; Noack, J.; Kemnitz, E. Local fluorine environments in nanoscopic magnesium hydr(oxide) fluorides studied by 19F MAS NMR. J. Fluorine Chem. 2011, 132, 1079–1085. [Google Scholar] [CrossRef]
- Craig, D.F.; Brown, J.J. Phase equilibria in system CaF2-AlF3. J. Am. Ceram. Soc. 1977, 60, 396–398. [Google Scholar] [CrossRef]
- Millet, J.P.; Rolin, M. Study of the median part of the phase CaF2-AlF3—Confirmation of a stability field for the compound Ca2AlF7. Rev. Int. Hautes Temp. Refract. 1981, 18, 287–292. [Google Scholar]
- Fedotiev, P.P.; Ilyinskii, V. Fusibility of the ternary system NaF-CaF2-AIF3. Z. Anorg. Allgem. Chem. 1923, 129, 93–107. [Google Scholar]
- Holm, J.L. Phase equilibria in system CaF2-AlF3. Acta Chem. Scand. 1965, 19, 1512–1514. [Google Scholar] [CrossRef]
- Hemon, A.; Courbion, G. Refinement of the room temperature structure of α-CaAlF5. Acta Crystallogr. Sect. C-Cryst. Struct. Commun. 1991, 47, 1302–1303. [Google Scholar] [CrossRef]
- Body, M.; Silly, G.; Legein, C.; Buzaréa, J.-Y.; Calvayraca, F.; Blahad, P. Structural investigations of beta-CaAlF5 by coupling powder XRD, NMR, EPR and spectroscopic parameter calculations. J. Solid State Chem. 2005, 178, 3655–3661. [Google Scholar] [CrossRef]
- Body, M.; Silly, G.; Legein, C.; Buzare, J.Y. Correlation between 19F environment and isotropic chemical shift in barium and calcium fluoroaluminates. Inorg. Chem. 2004, 43, 2474–2485. [Google Scholar] [CrossRef] [PubMed]
- Domesle, R.; Hoppe, R. The crystal structure of Ca2AlF7. Z. Kristall. 1980, 153, 317–328. [Google Scholar]
- Kiczenski, T.J.; Du, L.-S.; Stebbins, J.F. F-19 NMR study of the ordering of high field strength cations at fluoride sites in silicate and aluminosilicate glasses. J. Non-Cryst. Solids 2004, 337, 142–149. [Google Scholar] [CrossRef]
- Kiczenski, T.J.; Stebbins, J.F. Fluorine sites in calcium and barium oxyfluorides: F-19 NMR on crystalline model compounds and glasses. J. Non-Cryst. Solids 2002, 306, 160–168. [Google Scholar] [CrossRef]
- Balic-Zunic, T.; Garavelli, A.; Mitolo, D.; Acquafredda, P.; Leonardsen, E. Jakobssonite, CaAlF5, a new mineral from fumaroles at the Eldfell and Hekla volcanoes, Iceland. Mineral. Mag. 2012, 76, 751–760. [Google Scholar] [CrossRef]
- Kampf, A.R.; Colombo, F.; del Tanago, J.G. Carlhintzeite, Ca2AlF7 center dot H2O, from the Gigante granitic pegmatite, Cordoba province, Argentina: Description and crystal structure. Mineral. Mag. 2010, 74, 623–632. [Google Scholar] [CrossRef]
- Karg, M.; Scholz, G.; Koenig, R.; Kemnitz, E. Mechanistic insight into formation and changes of nanoparticles in MgF2 sols evidenced by liquid and solid state NMR. Dalton Trans. 2012, 41, 2360–2366. [Google Scholar] [CrossRef] [PubMed]
- Holm, J.L.; Holm, B.J. Phase relations and thermodynamic properties in the ternary reciprocal system LiF-NaF-Na3AlF6-Li3AlF6. Thermochim. Acta 1973, 6, 375–398. [Google Scholar] [CrossRef]
- Voronkov, M.G.; Boyarkina, E.V.; Gebel, I.A.; Albanov, A.I.; Basenko, S.V. Cleavage of the C-Si bond in trifluoro(phenyl)silane with aliphatic alcohols. Russ. J. Gen. Chem. 2005, 75, 1927–1929. [Google Scholar] [CrossRef]
- JCPDS-ICDD, International Centre for Diffraction Data: PDF-2 Database; PCPDFWIN Version 2.2; ICDD: Newtown Square, PA, USA, 2001.
Figure 1.
19F liquid NMR spectrum (a) and TEM image (b) CaAlF5 sol in EtOH (scale bar = 20 nm).
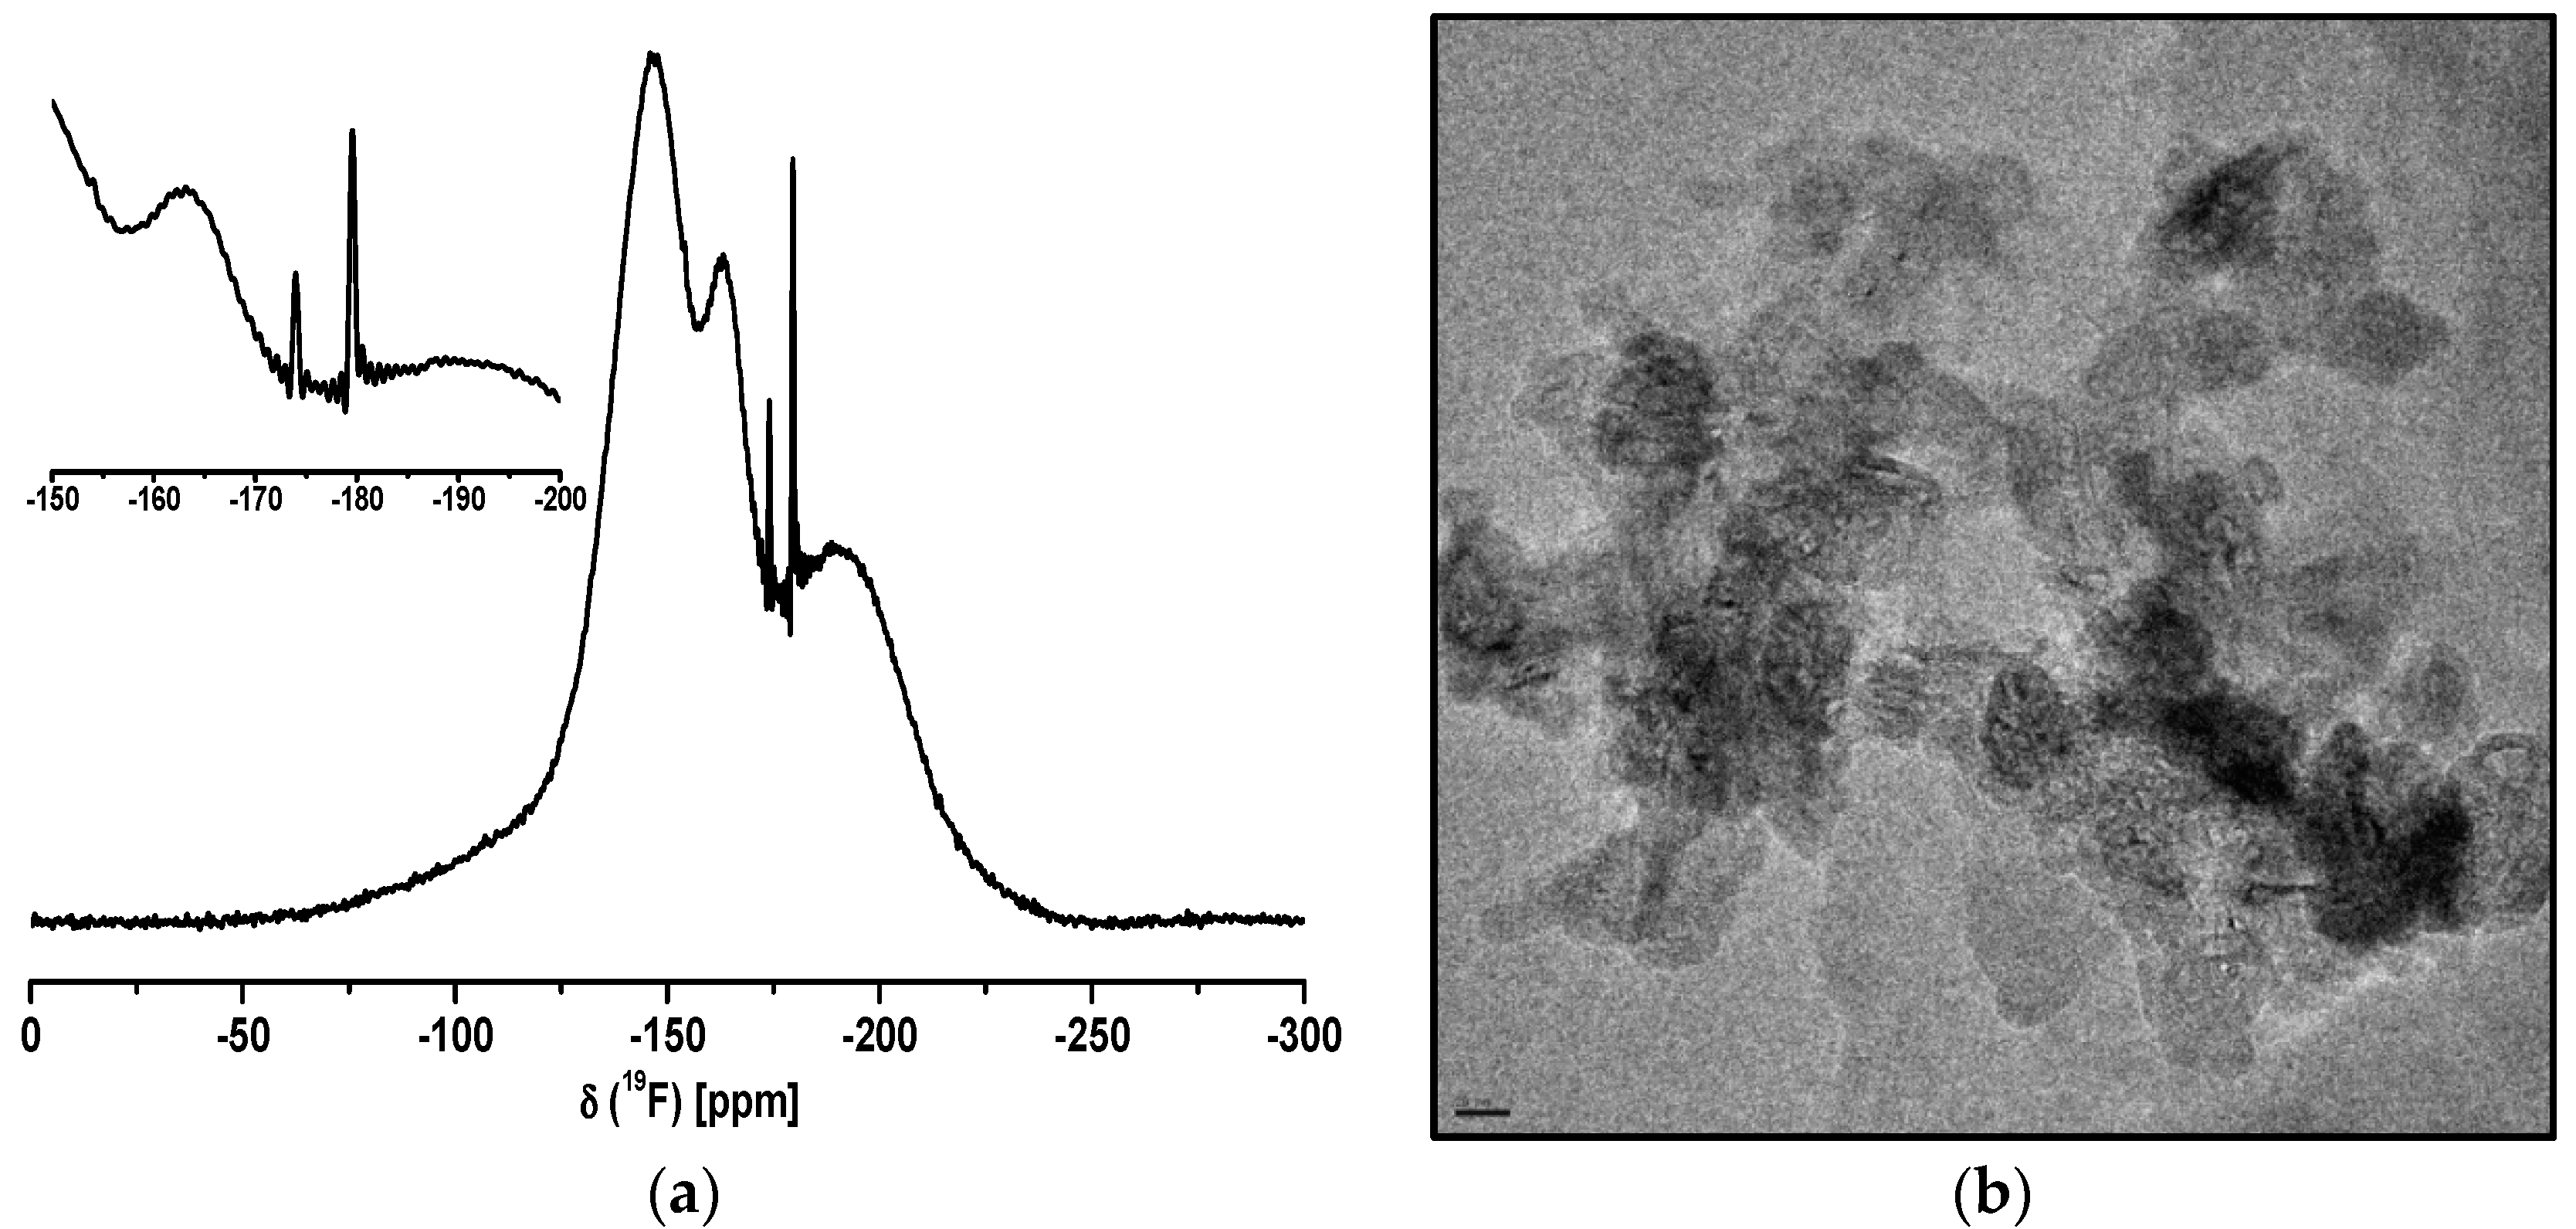
Figure 2.
Powder diffractograms of CaAlF5 xerogel in a normal crucible at different thermal treatment in a non-preheating oven (* sample holder, ° CaF2).
Figure 2.
Powder diffractograms of CaAlF5 xerogel in a normal crucible at different thermal treatment in a non-preheating oven (* sample holder, ° CaF2).
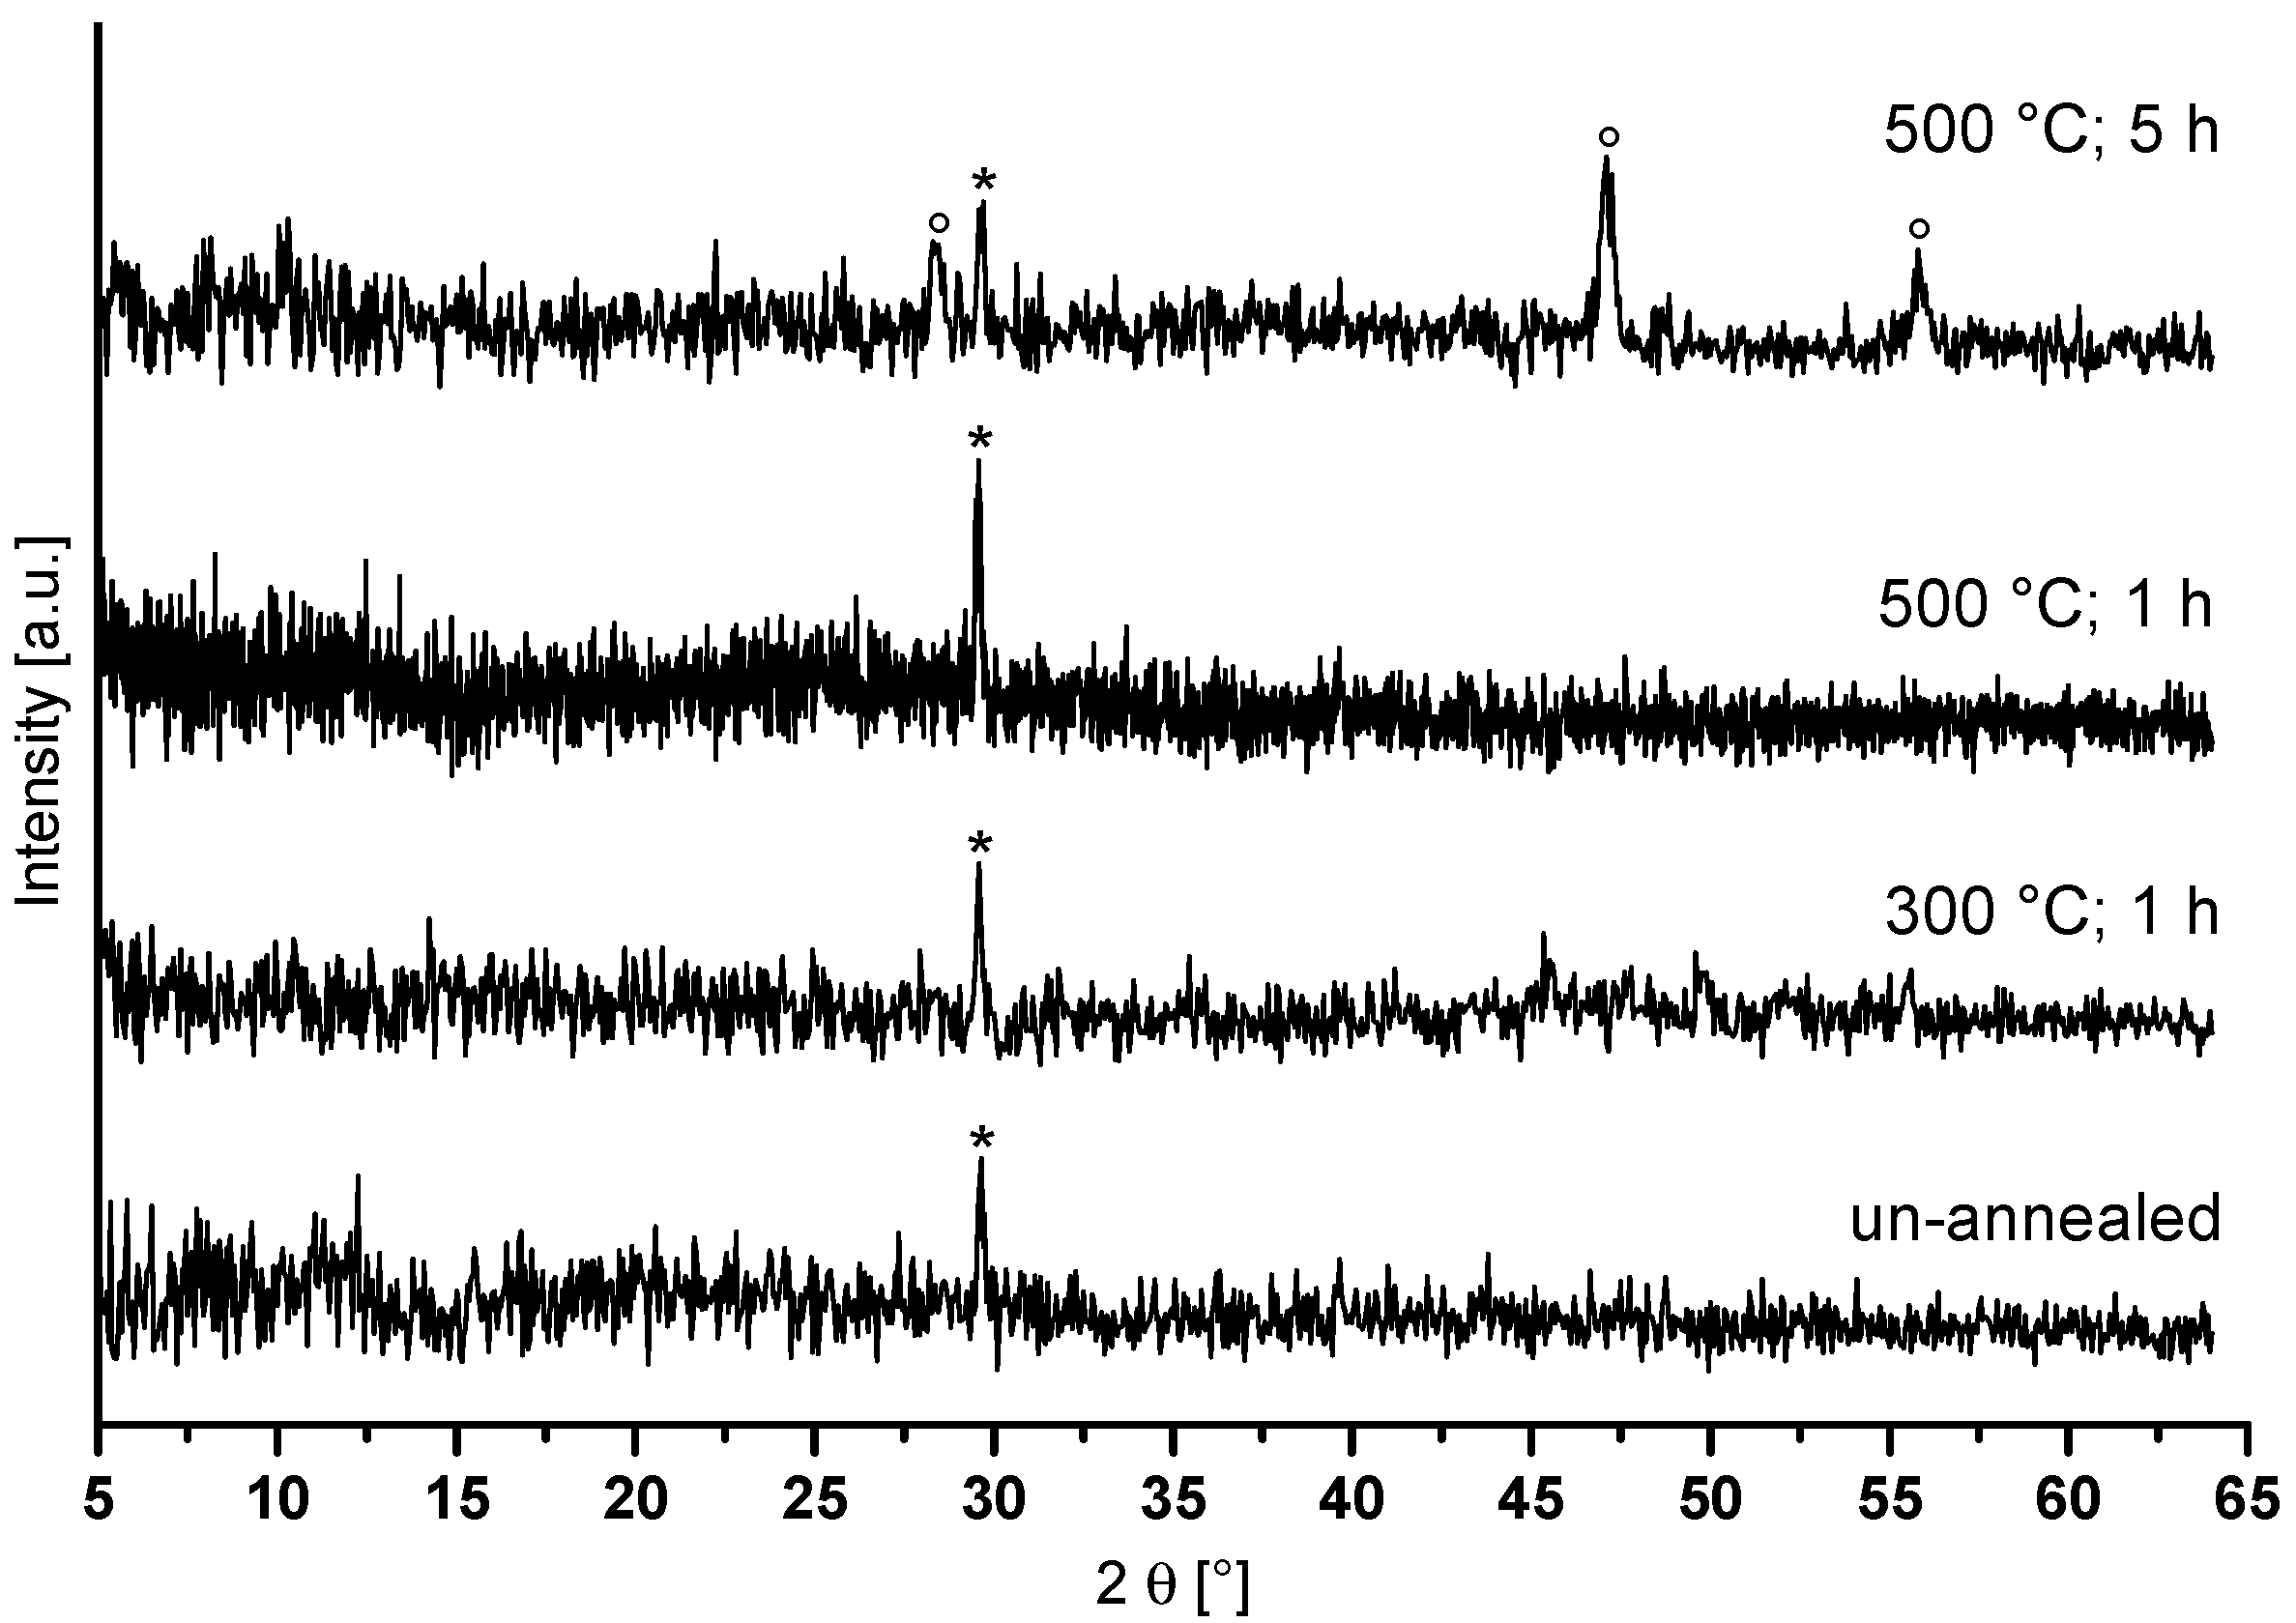
Figure 3.
Comparison of powder X-ray patterns of CaAlF5 xerogel in a closed crucible at 700 °C for a two minute calcination time in a preheated oven at 700 °C with crystalline CaAlF5 phase (PDF: 80–1728).
Figure 3.
Comparison of powder X-ray patterns of CaAlF5 xerogel in a closed crucible at 700 °C for a two minute calcination time in a preheated oven at 700 °C with crystalline CaAlF5 phase (PDF: 80–1728).

Figure 4.
19F MAS NMR spectra of un-annealed and annealed CaAlF5 xerogel at 700 °C for two minutes (a) and TG/DTA heating curves (b). The spinning sidebands in the MAS NMR spectrum are located under the * symbols.
Figure 4.
19F MAS NMR spectra of un-annealed and annealed CaAlF5 xerogel at 700 °C for two minutes (a) and TG/DTA heating curves (b). The spinning sidebands in the MAS NMR spectrum are located under the * symbols.
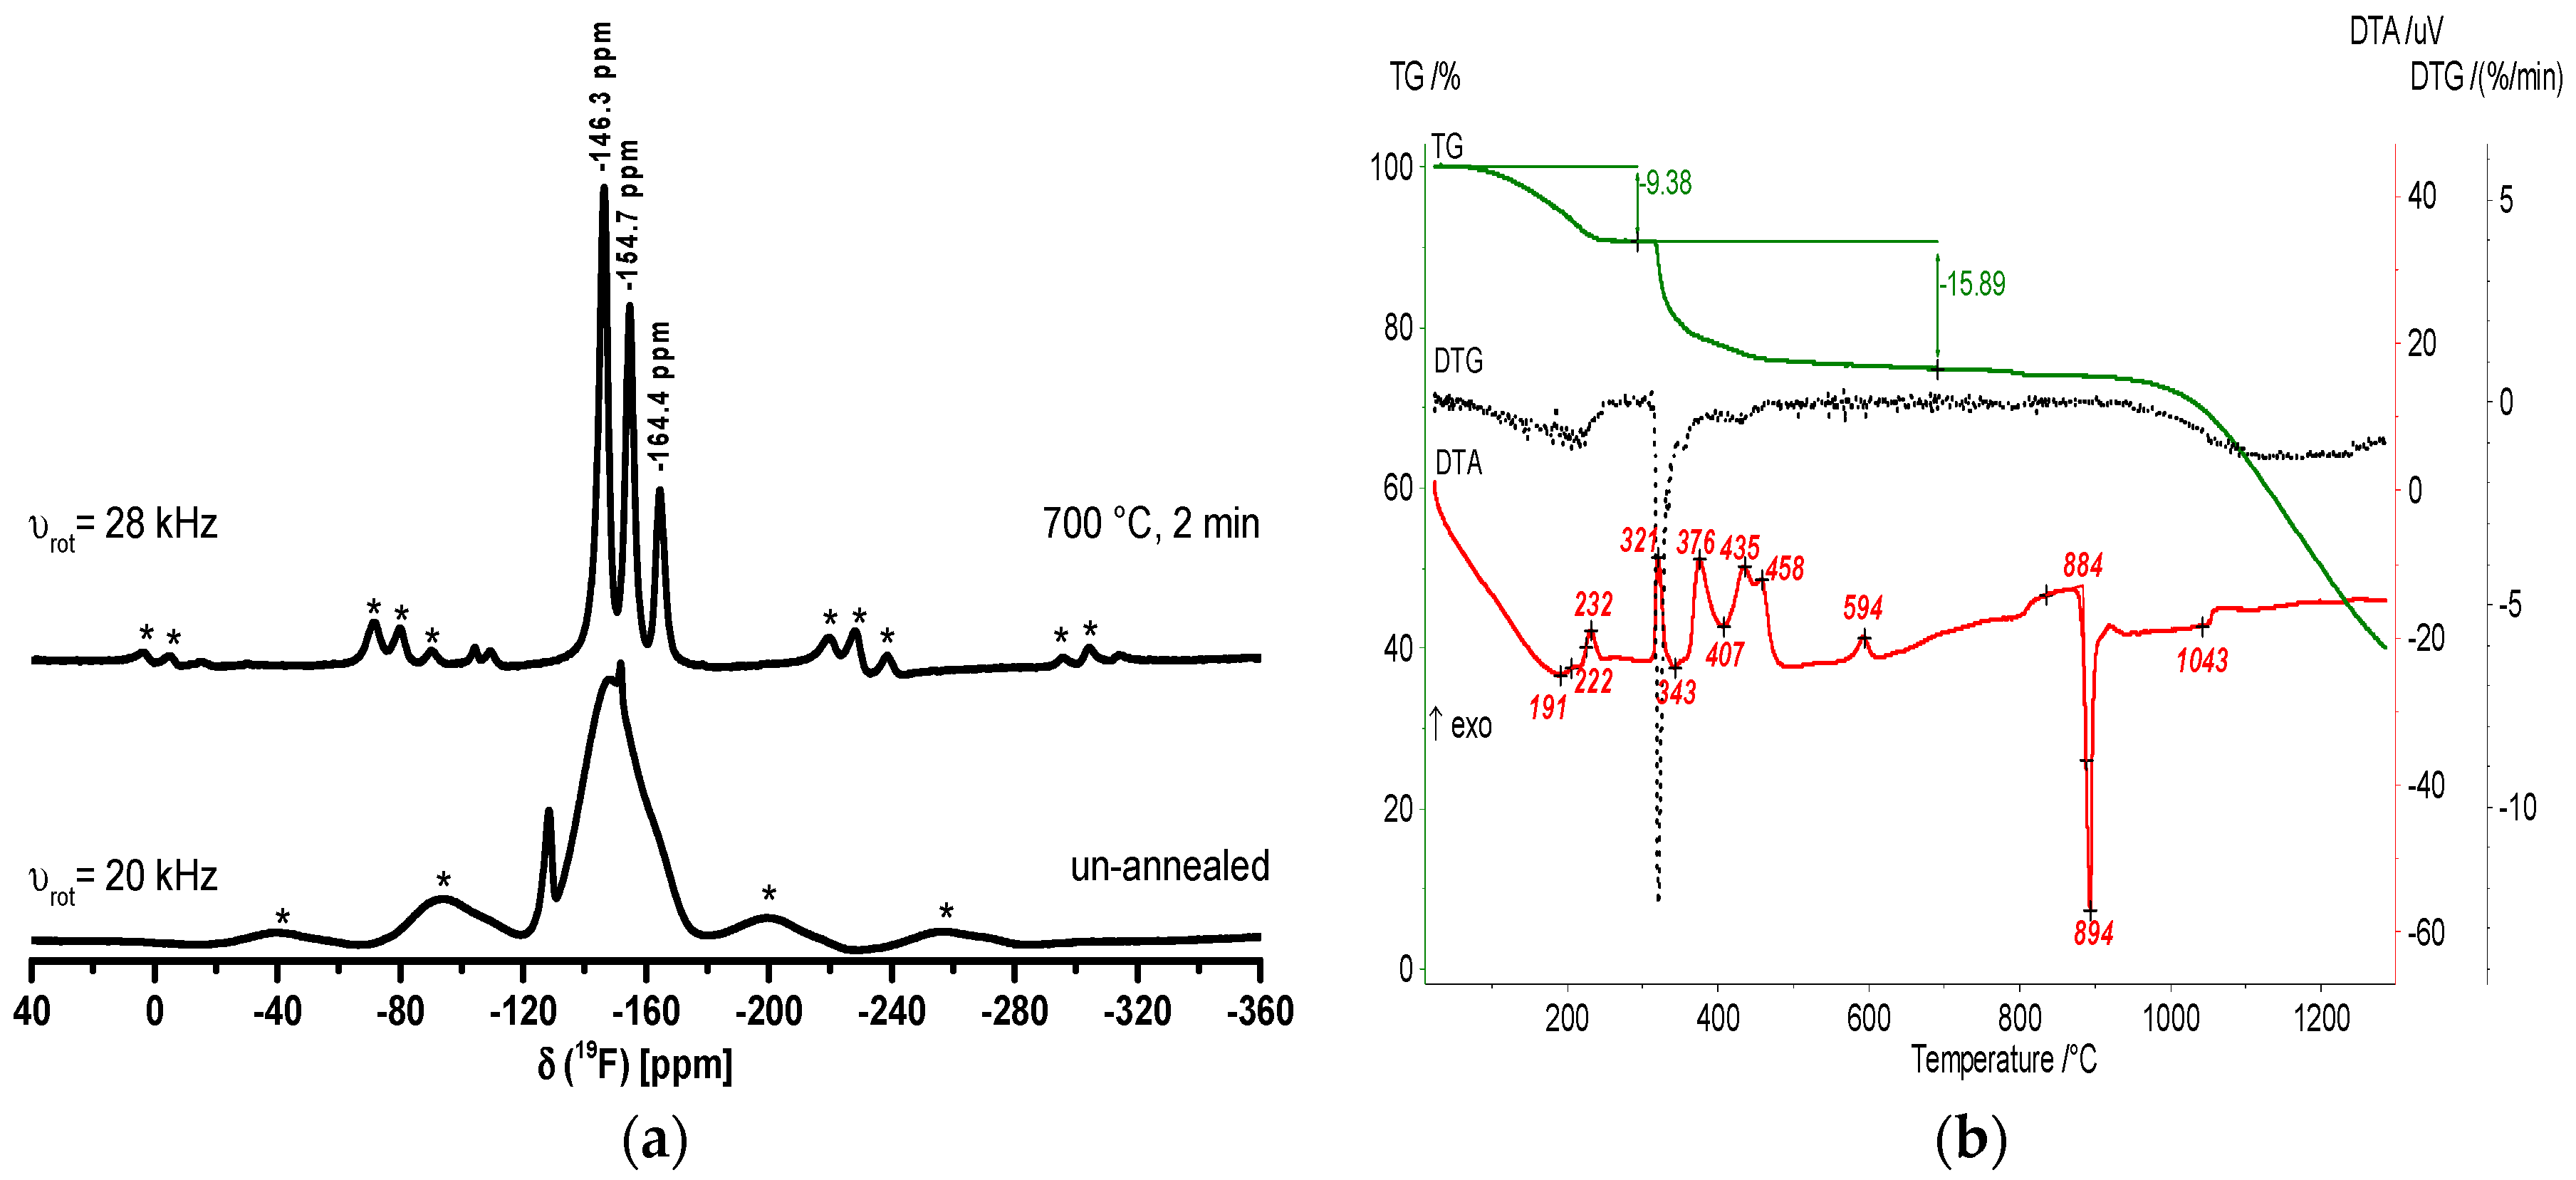
Figure 5.
19F liquid NMR spectrum (a) and TEM image (b) of Ca2AlF7 sol in EtOH.

Figure 6.
Powder diffractogram of annealed Ca2AlF7 xerogel at 700 °C for two minutes with reflections of Ca2AlF7, CaAlF5, and CaClF.
Figure 6.
Powder diffractogram of annealed Ca2AlF7 xerogel at 700 °C for two minutes with reflections of Ca2AlF7, CaAlF5, and CaClF.

Figure 7.
19F MAS spectra of un-annealed and annealed Ca2AlF7 xerogel at 700 °C for two minutes (a) and TG/DTA heating curves (b). The spinning sidebands in the NMR spectrum are located under the * symbols.
Figure 7.
19F MAS spectra of un-annealed and annealed Ca2AlF7 xerogel at 700 °C for two minutes (a) and TG/DTA heating curves (b). The spinning sidebands in the NMR spectrum are located under the * symbols.

Figure 8.
19F liquid NMR spectrum (a) and TEM image (b) of the nominal “CaAl2F8” sol in EtOH (scale bar = 50 nm).
Figure 8.
19F liquid NMR spectrum (a) and TEM image (b) of the nominal “CaAl2F8” sol in EtOH (scale bar = 50 nm).

Figure 9.
Powder diffractogram of the annealed nominal “CaAl2F8” xerogel at 700 °C for two minutes with reflections of CaAlF5 and AlF3.
Figure 9.
Powder diffractogram of the annealed nominal “CaAl2F8” xerogel at 700 °C for two minutes with reflections of CaAlF5 and AlF3.
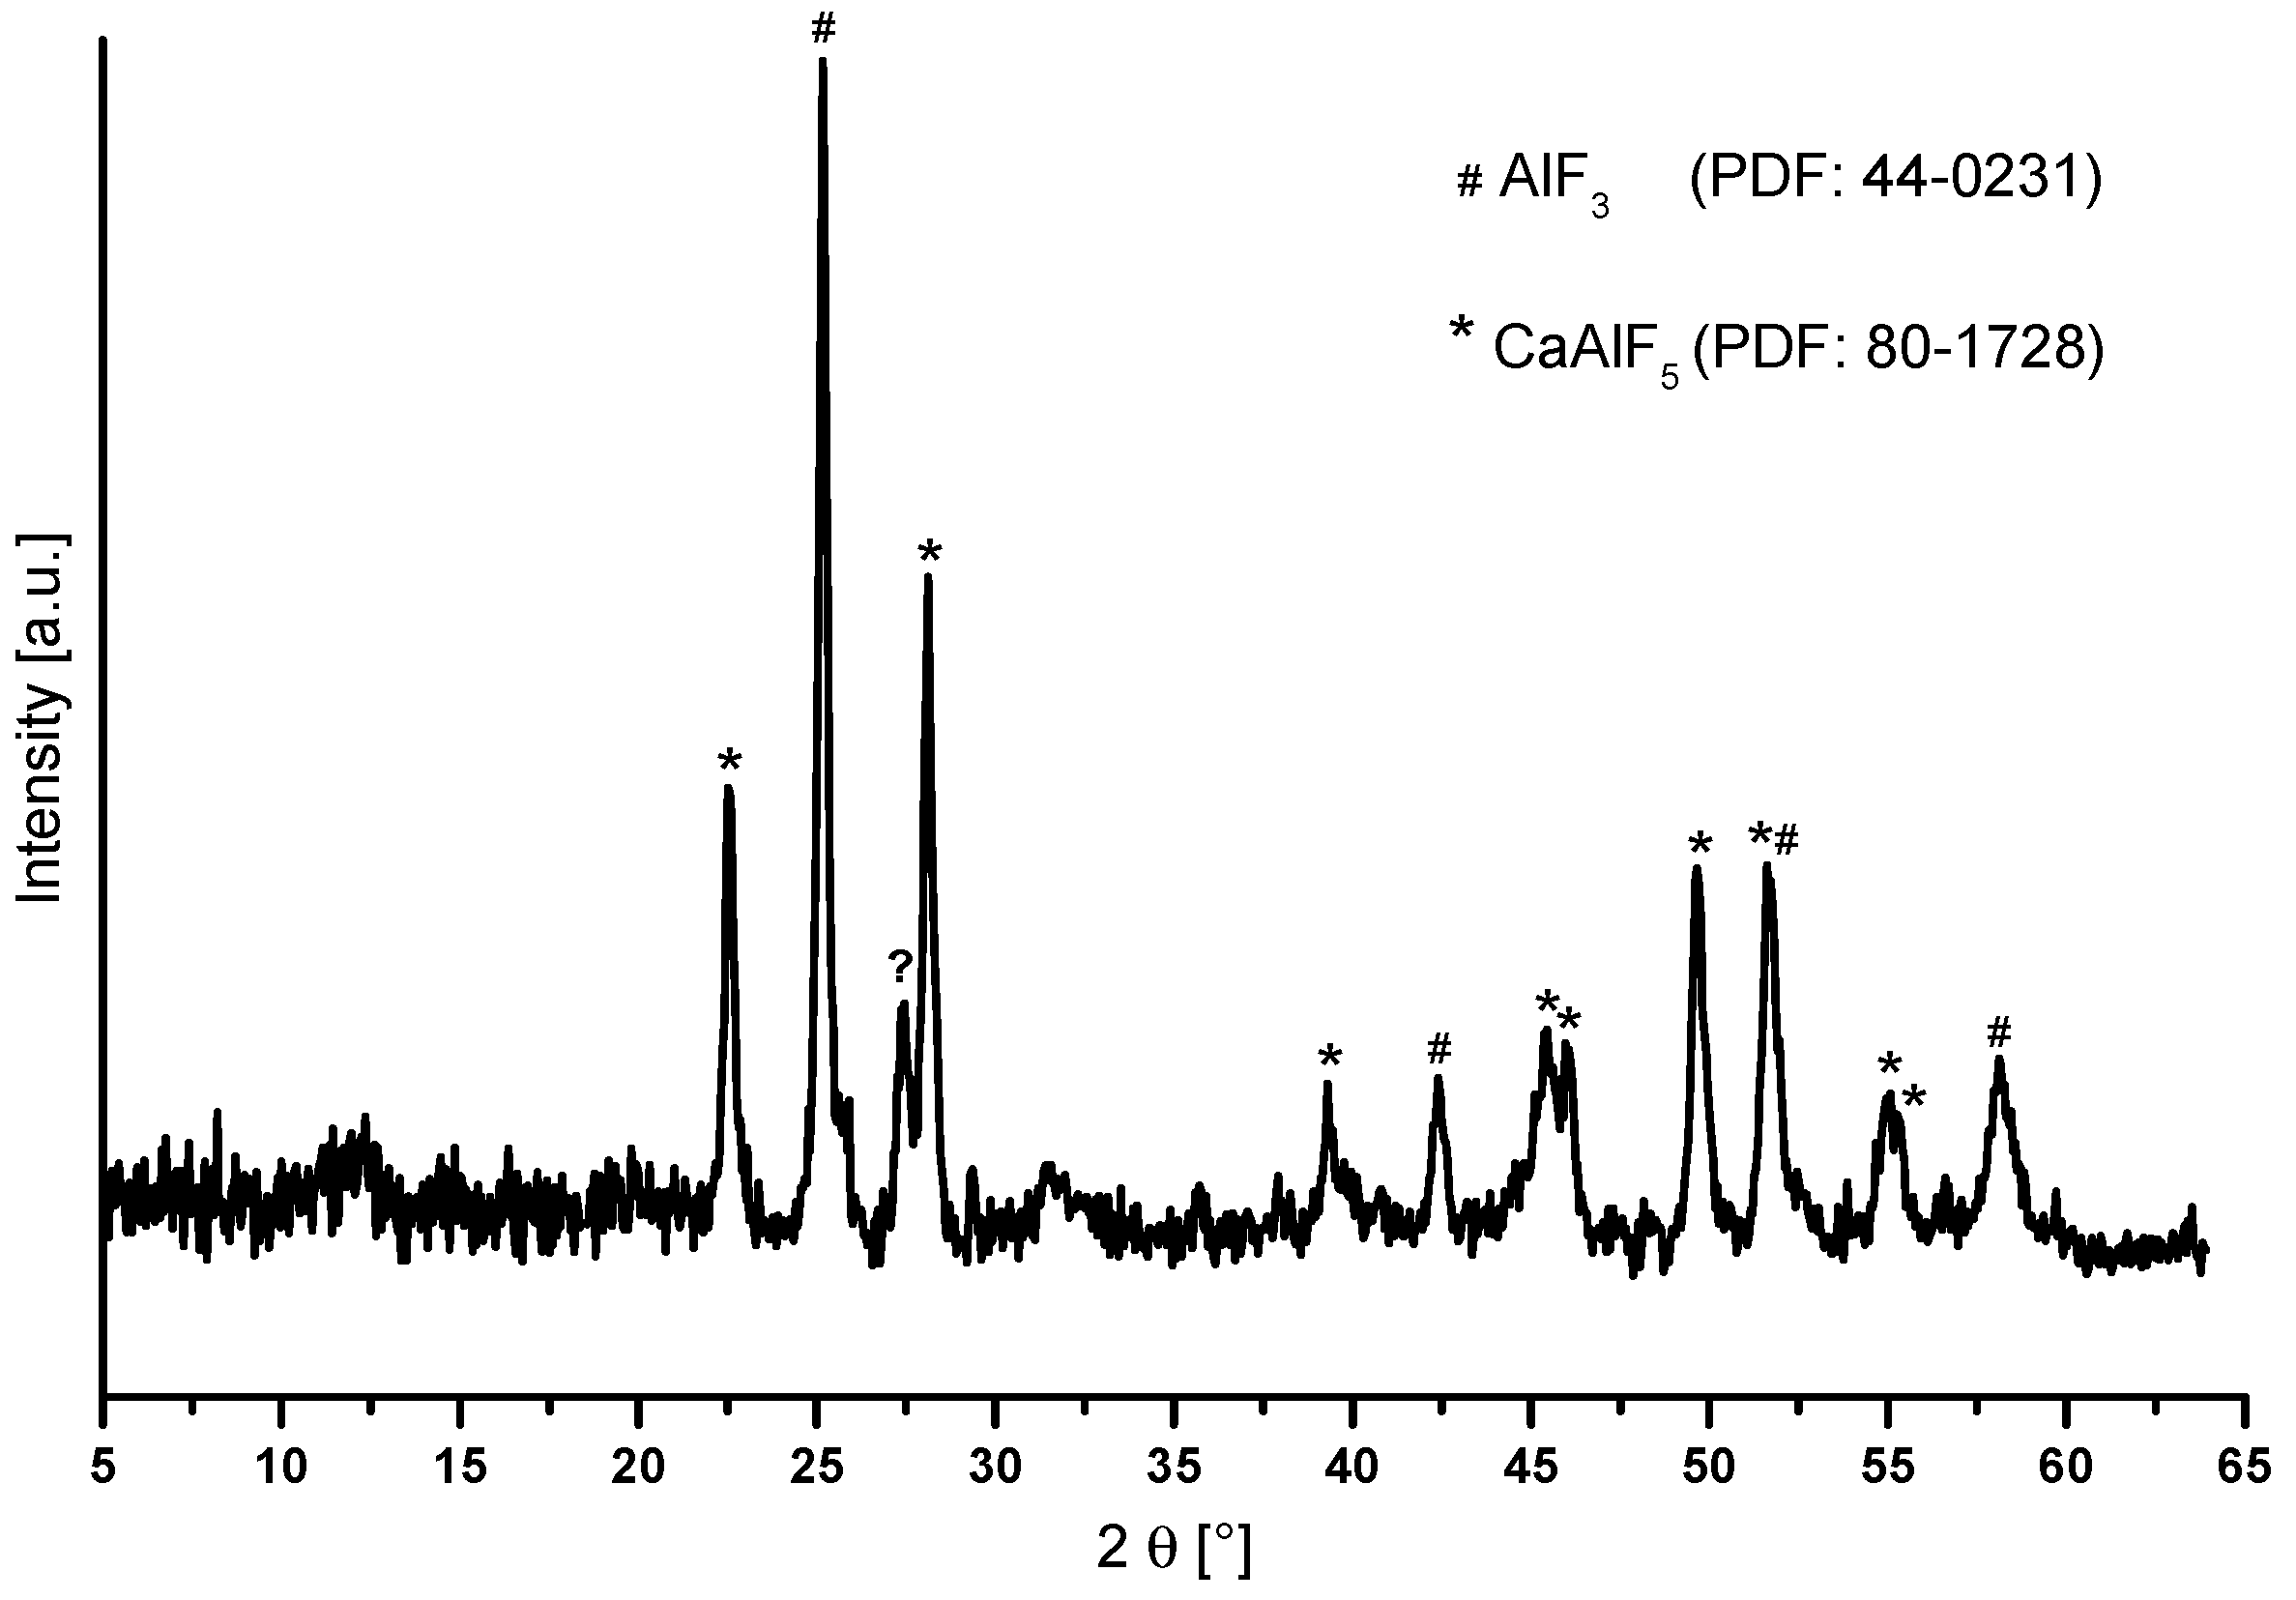
Figure 10.
19F MAS spectra of un-annealed and annealed CaAl2F8 xerogel at 700 °C for two minutes (a) and TG/DTA heating curves (b). The spinning sidebands in the NMR spectrum are located under the * symbols.
Figure 10.
19F MAS spectra of un-annealed and annealed CaAl2F8 xerogel at 700 °C for two minutes (a) and TG/DTA heating curves (b). The spinning sidebands in the NMR spectrum are located under the * symbols.
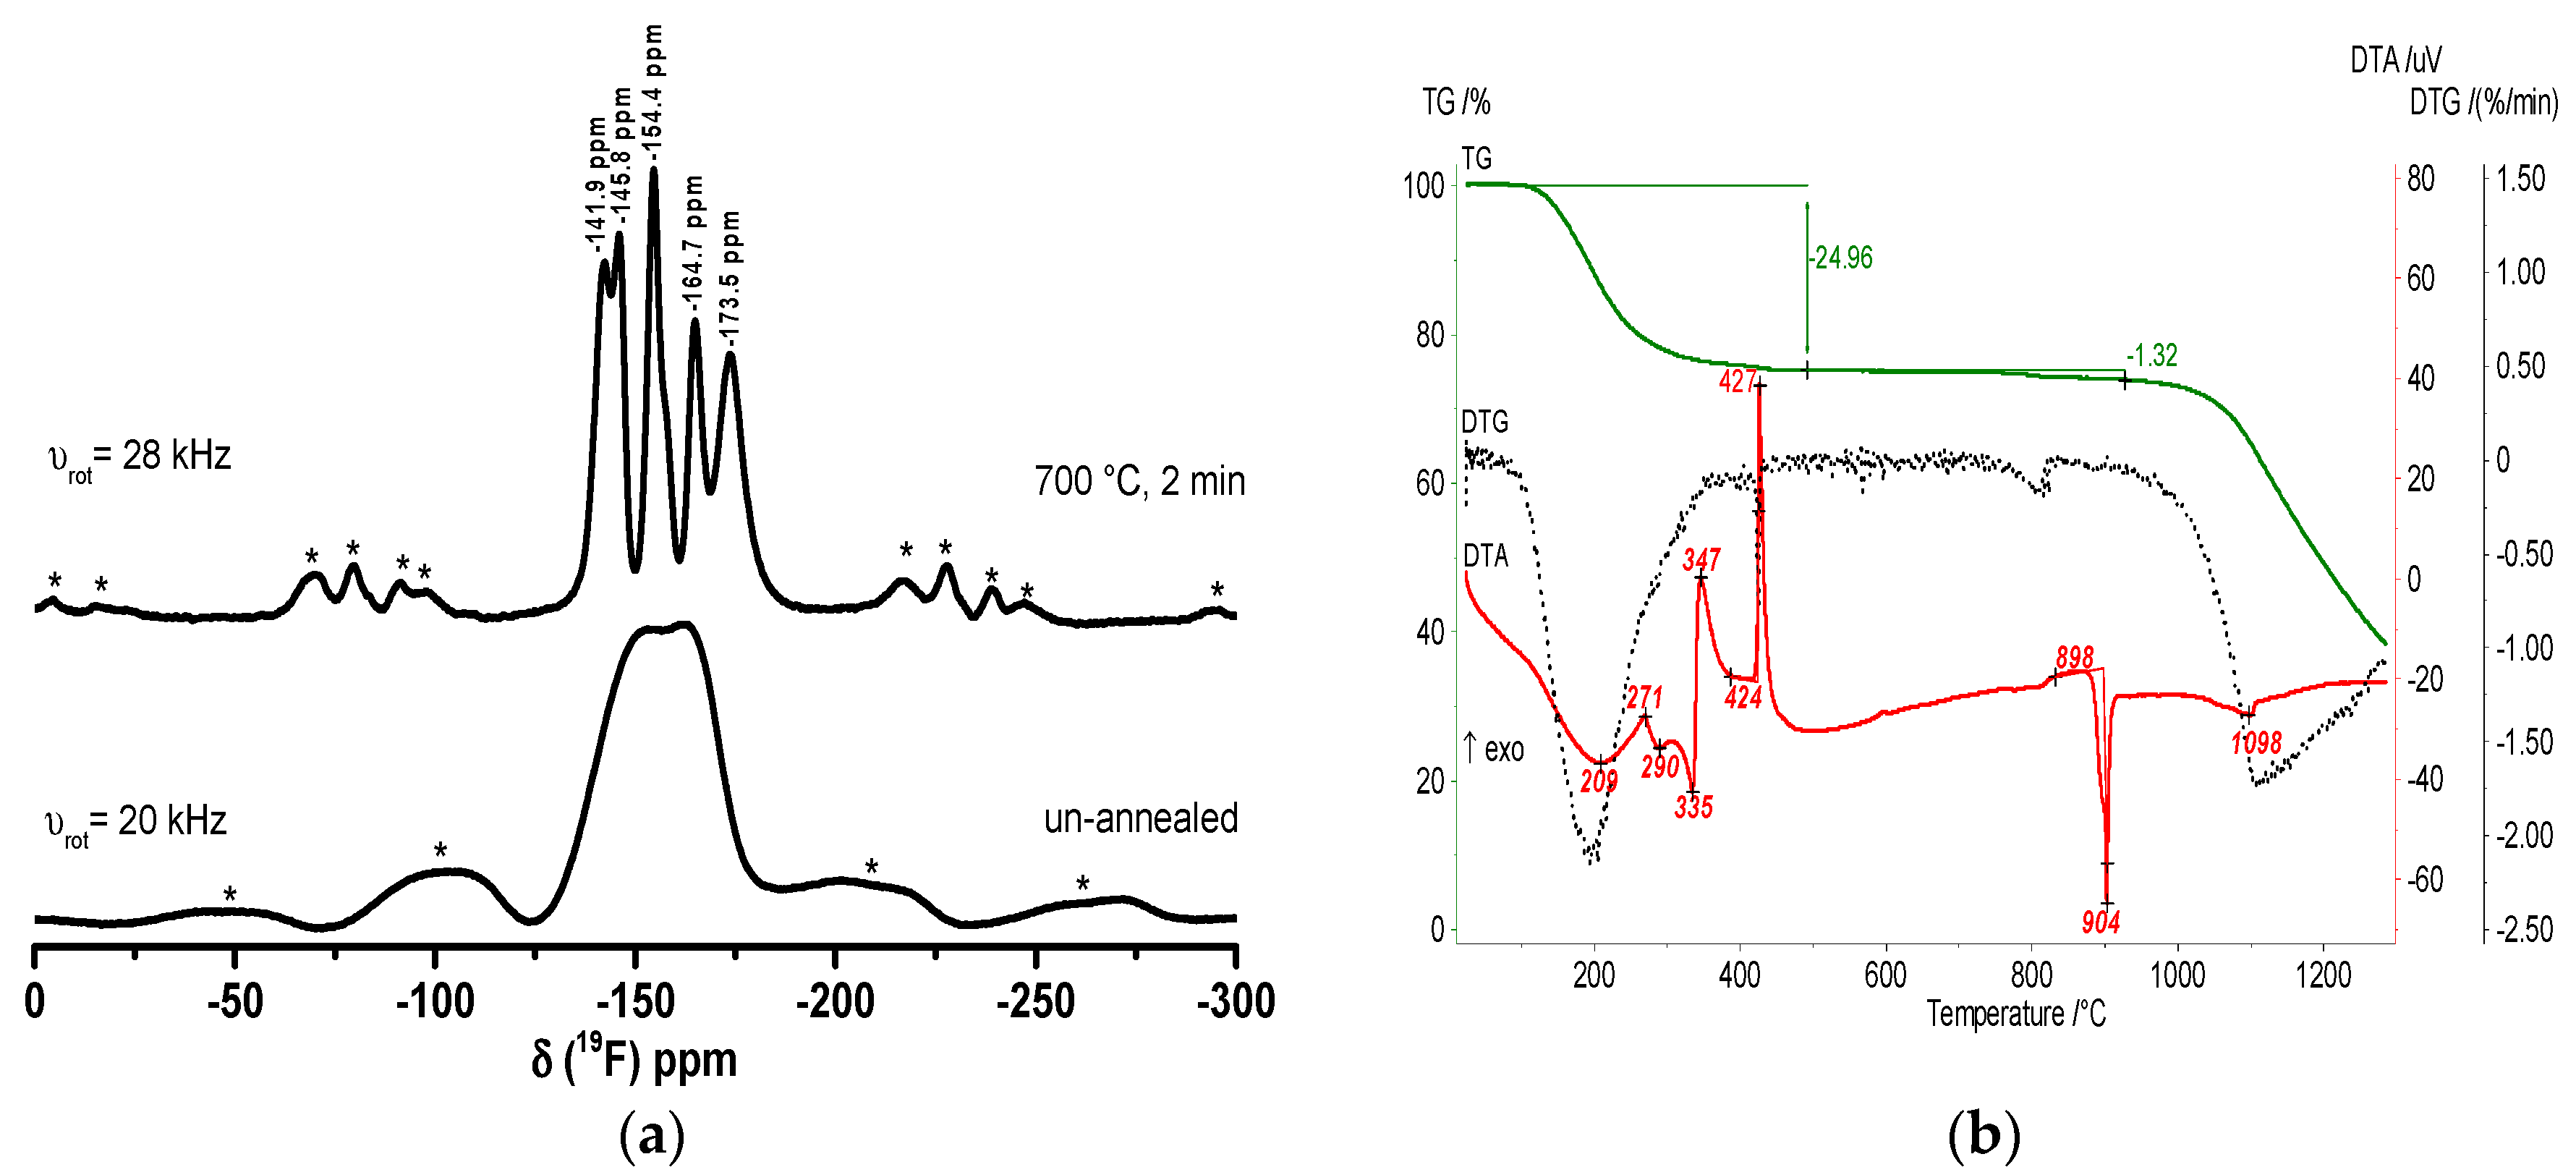
Figure 11.
19F liquid NMR spectrum (a) and TEM image (b) of LiMgAlF6 sol in EtOH (scale bar = 50 nm).
Figure 11.
19F liquid NMR spectrum (a) and TEM image (b) of LiMgAlF6 sol in EtOH (scale bar = 50 nm).

Figure 12.
Comparison of powder X-ray patterns of LiMgAlF6 xerogel in an open crucible at 500 °C for a one hour calcination time in a non-preheated oven with crystalline LiMgAlF6 phase (PDF: 24-0625) and MgF2 phase (PDF: 41-1443).
Figure 12.
Comparison of powder X-ray patterns of LiMgAlF6 xerogel in an open crucible at 500 °C for a one hour calcination time in a non-preheated oven with crystalline LiMgAlF6 phase (PDF: 24-0625) and MgF2 phase (PDF: 41-1443).

Figure 13.
TG/DTA heating curves of LiMgAlF6.
© 2017 by the authors. Licensee MDPI, Basel, Switzerland. This article is an open access article distributed under the terms and conditions of the Creative Commons Attribution (CC BY) license (http://creativecommons.org/licenses/by/4.0/).
Share and Cite
MDPI and ACS Style
Rehmer, A.; Scheurell, K.; Scholz, G.; Kemnitz, E. Sol-Gel-Synthesis of Nanoscopic Complex Metal Fluorides. Nanomaterials 2017, 7, 362. https://doi.org/10.3390/nano7110362
AMA Style
Rehmer A, Scheurell K, Scholz G, Kemnitz E. Sol-Gel-Synthesis of Nanoscopic Complex Metal Fluorides. Nanomaterials. 2017; 7(11):362. https://doi.org/10.3390/nano7110362
Chicago/Turabian StyleRehmer, Alexander, Kerstin Scheurell, Gudrun Scholz, and Erhard Kemnitz. 2017. "Sol-Gel-Synthesis of Nanoscopic Complex Metal Fluorides" Nanomaterials 7, no. 11: 362. https://doi.org/10.3390/nano7110362
Note that from the first issue of 2016, this journal uses article numbers instead of page numbers. See further details here.