3D-Hydrogel Based Polymeric Nanoreactors for Silver Nano-Antimicrobial Composites Generation

 , and
, and
Abstract
:
1. Introduction
2. Materials and Methods
2.1. Materials
2.2. Hydrogels Synthesis and Characterization
2.2.1. Thiol-Acrylate Hydrogels (PSAs)
2.2.2. Polyurethane Based Hydrogels (PUs)
2.3. Ag-Hydrogel Nanocomposite Synthesis and Characterization
2.3.1. AgNPs within Thiol-Acrylate Hydrogels (Ag–PSA)
2.3.2. AgNPs within PU Hydrogels (Ag–PU)
2.4. Equilibrium Swelling Values as Function of Temperature
2.5. Antibacterial Activity
3. Results and Discussion
3.1. Hydrogel Characterization
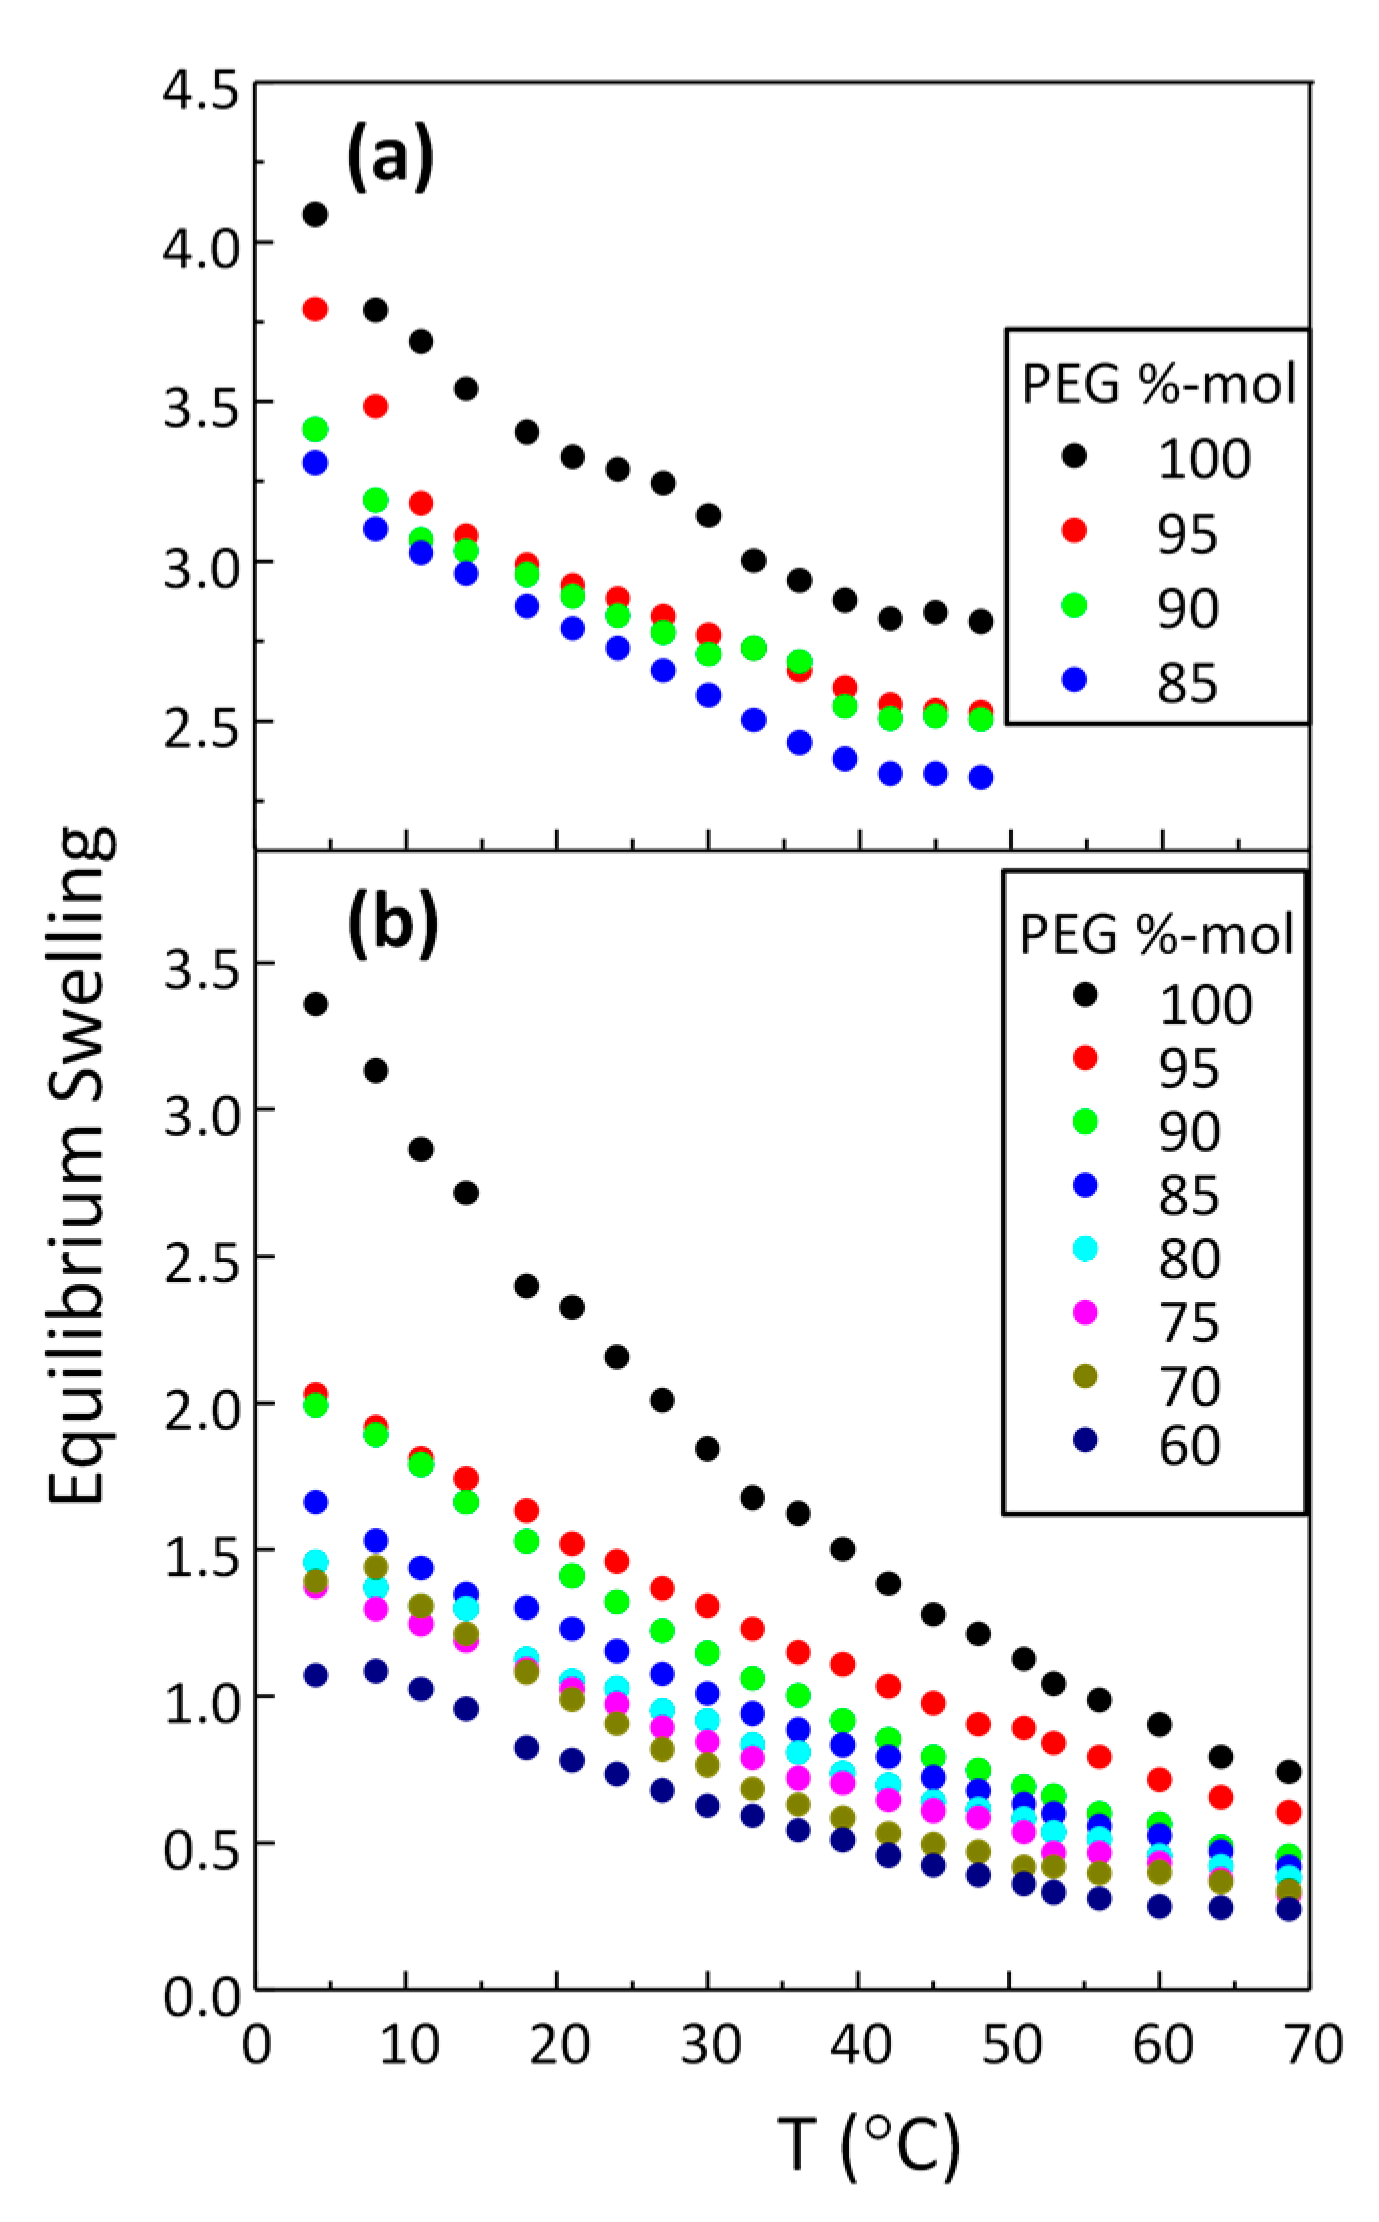
3.2. Swelling as a Function of Temperature
3.3. Silver/Hydrogel Nanocomposites
3.3.1. AgNPs within Thiol-Acrylate Hydrogels (Ag–PSA)
3.3.2. AgNPs within Polyurethane Hydrogels (Ag–PU)
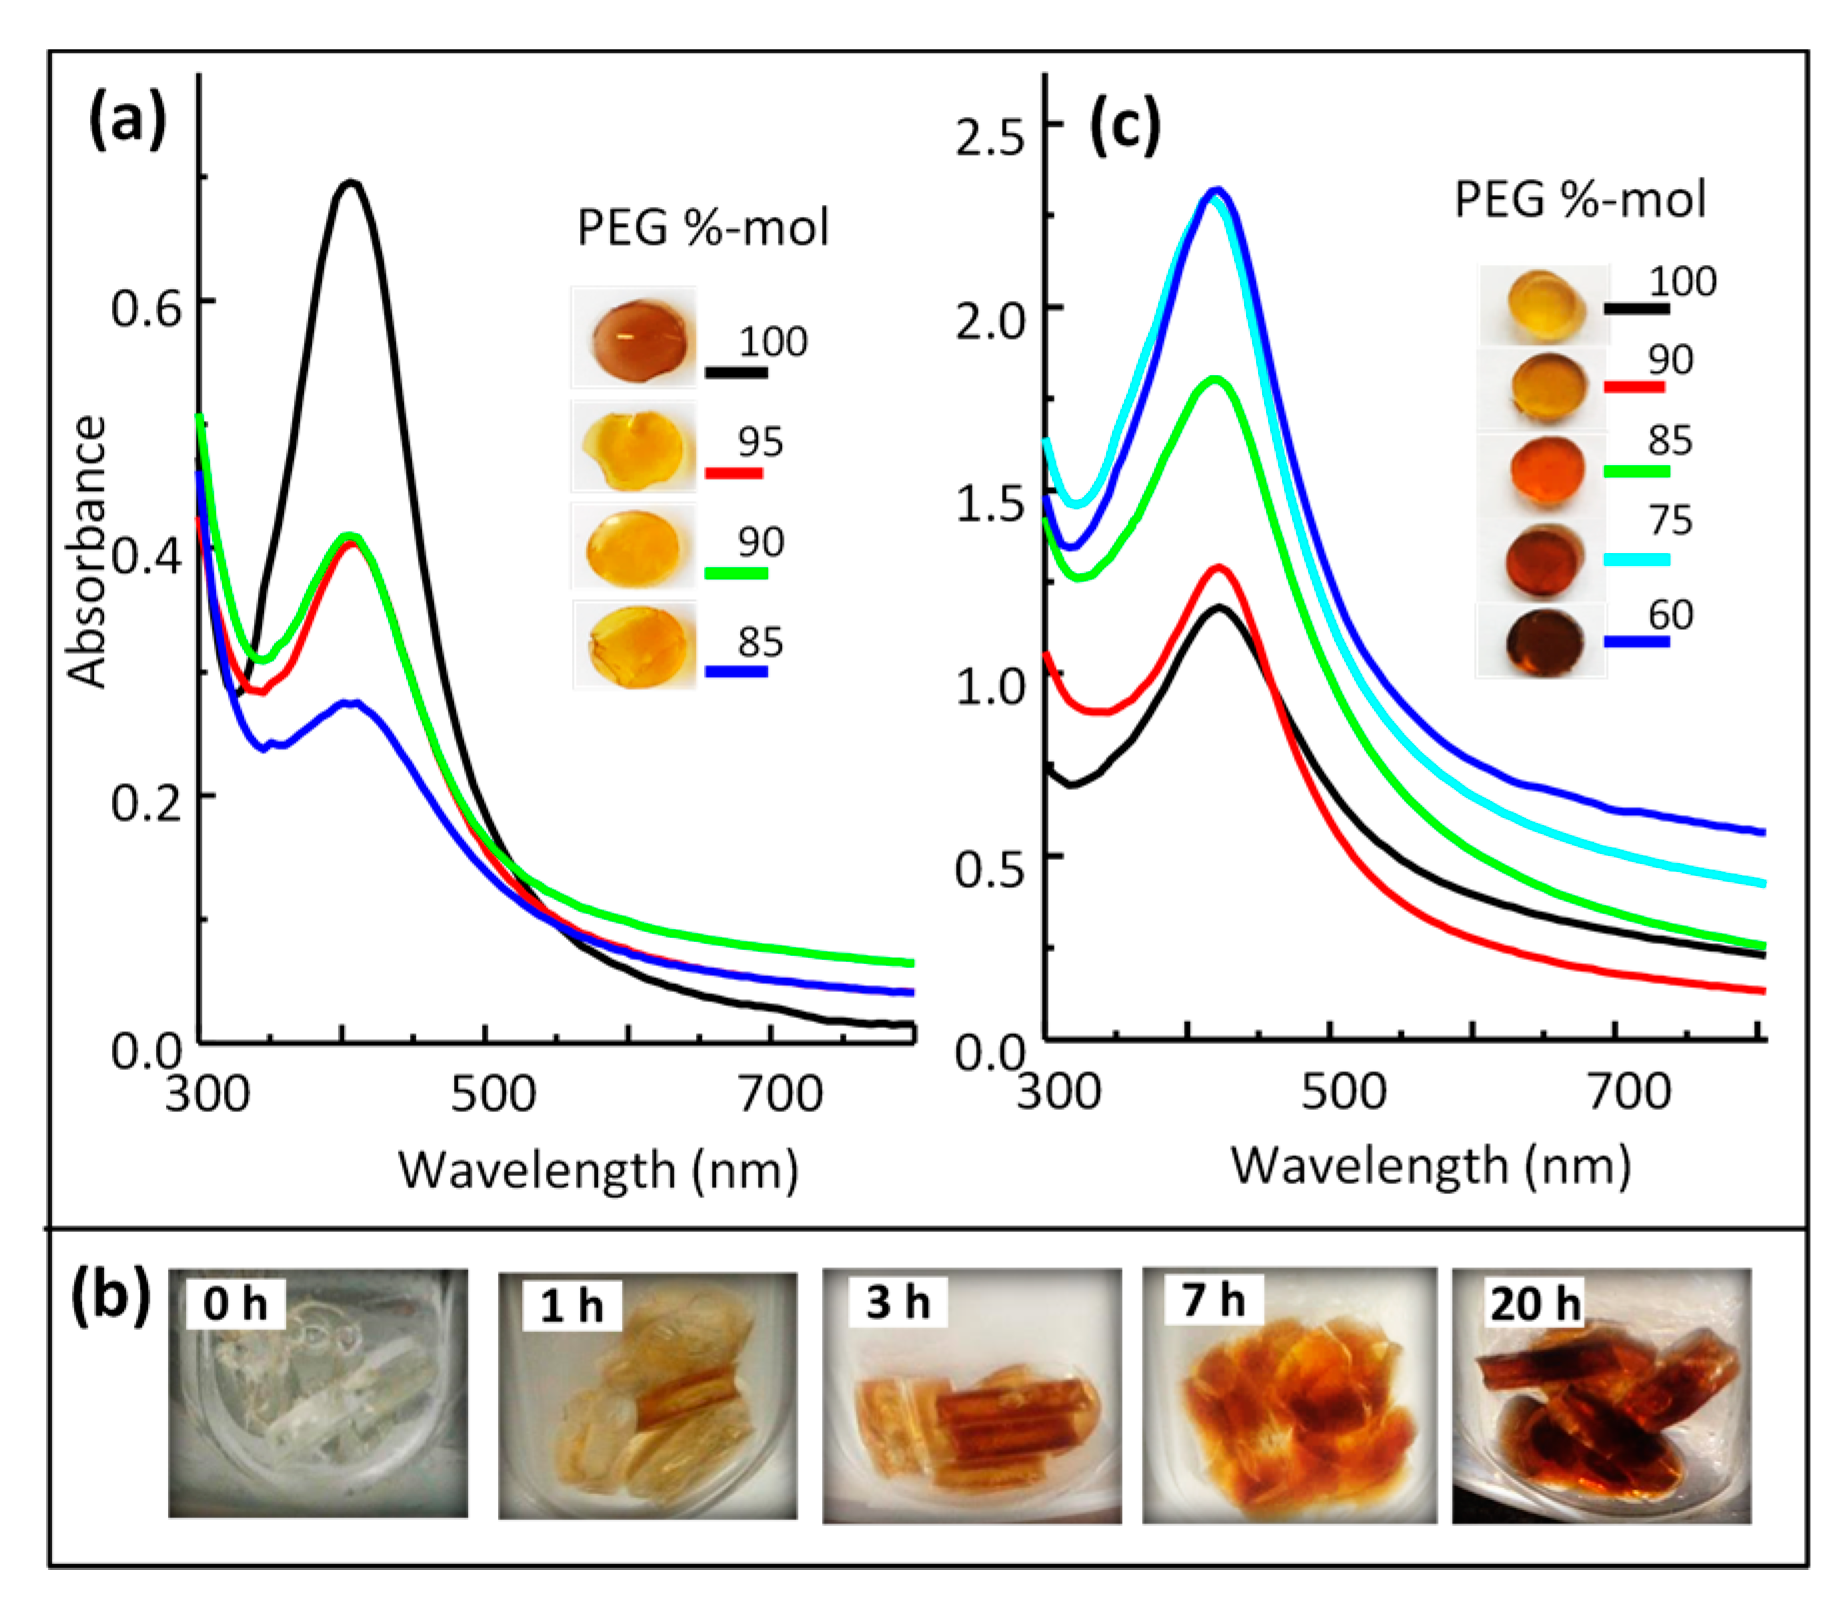
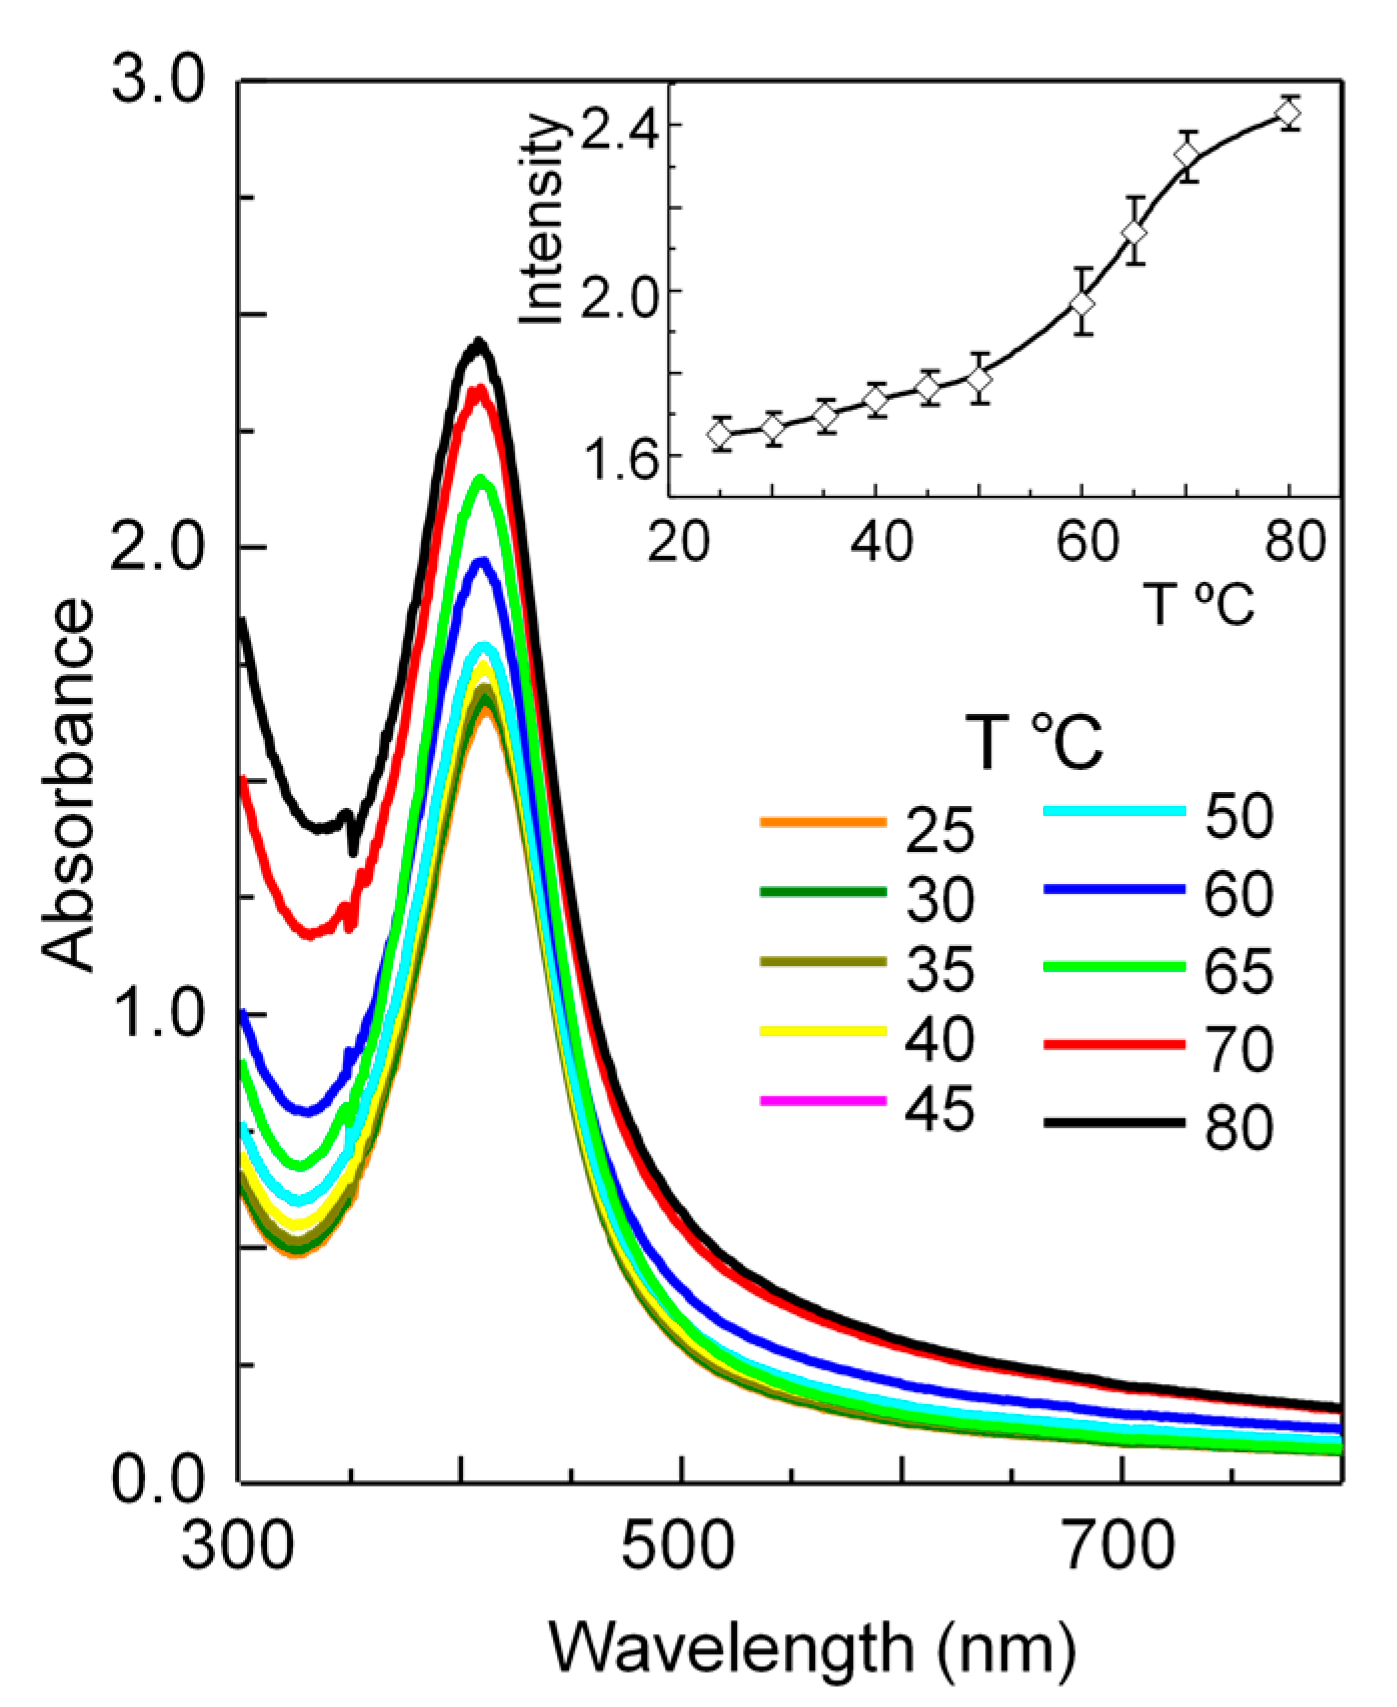
3.4. Optical Properties of Silver/Hydrogel Nanocomposites
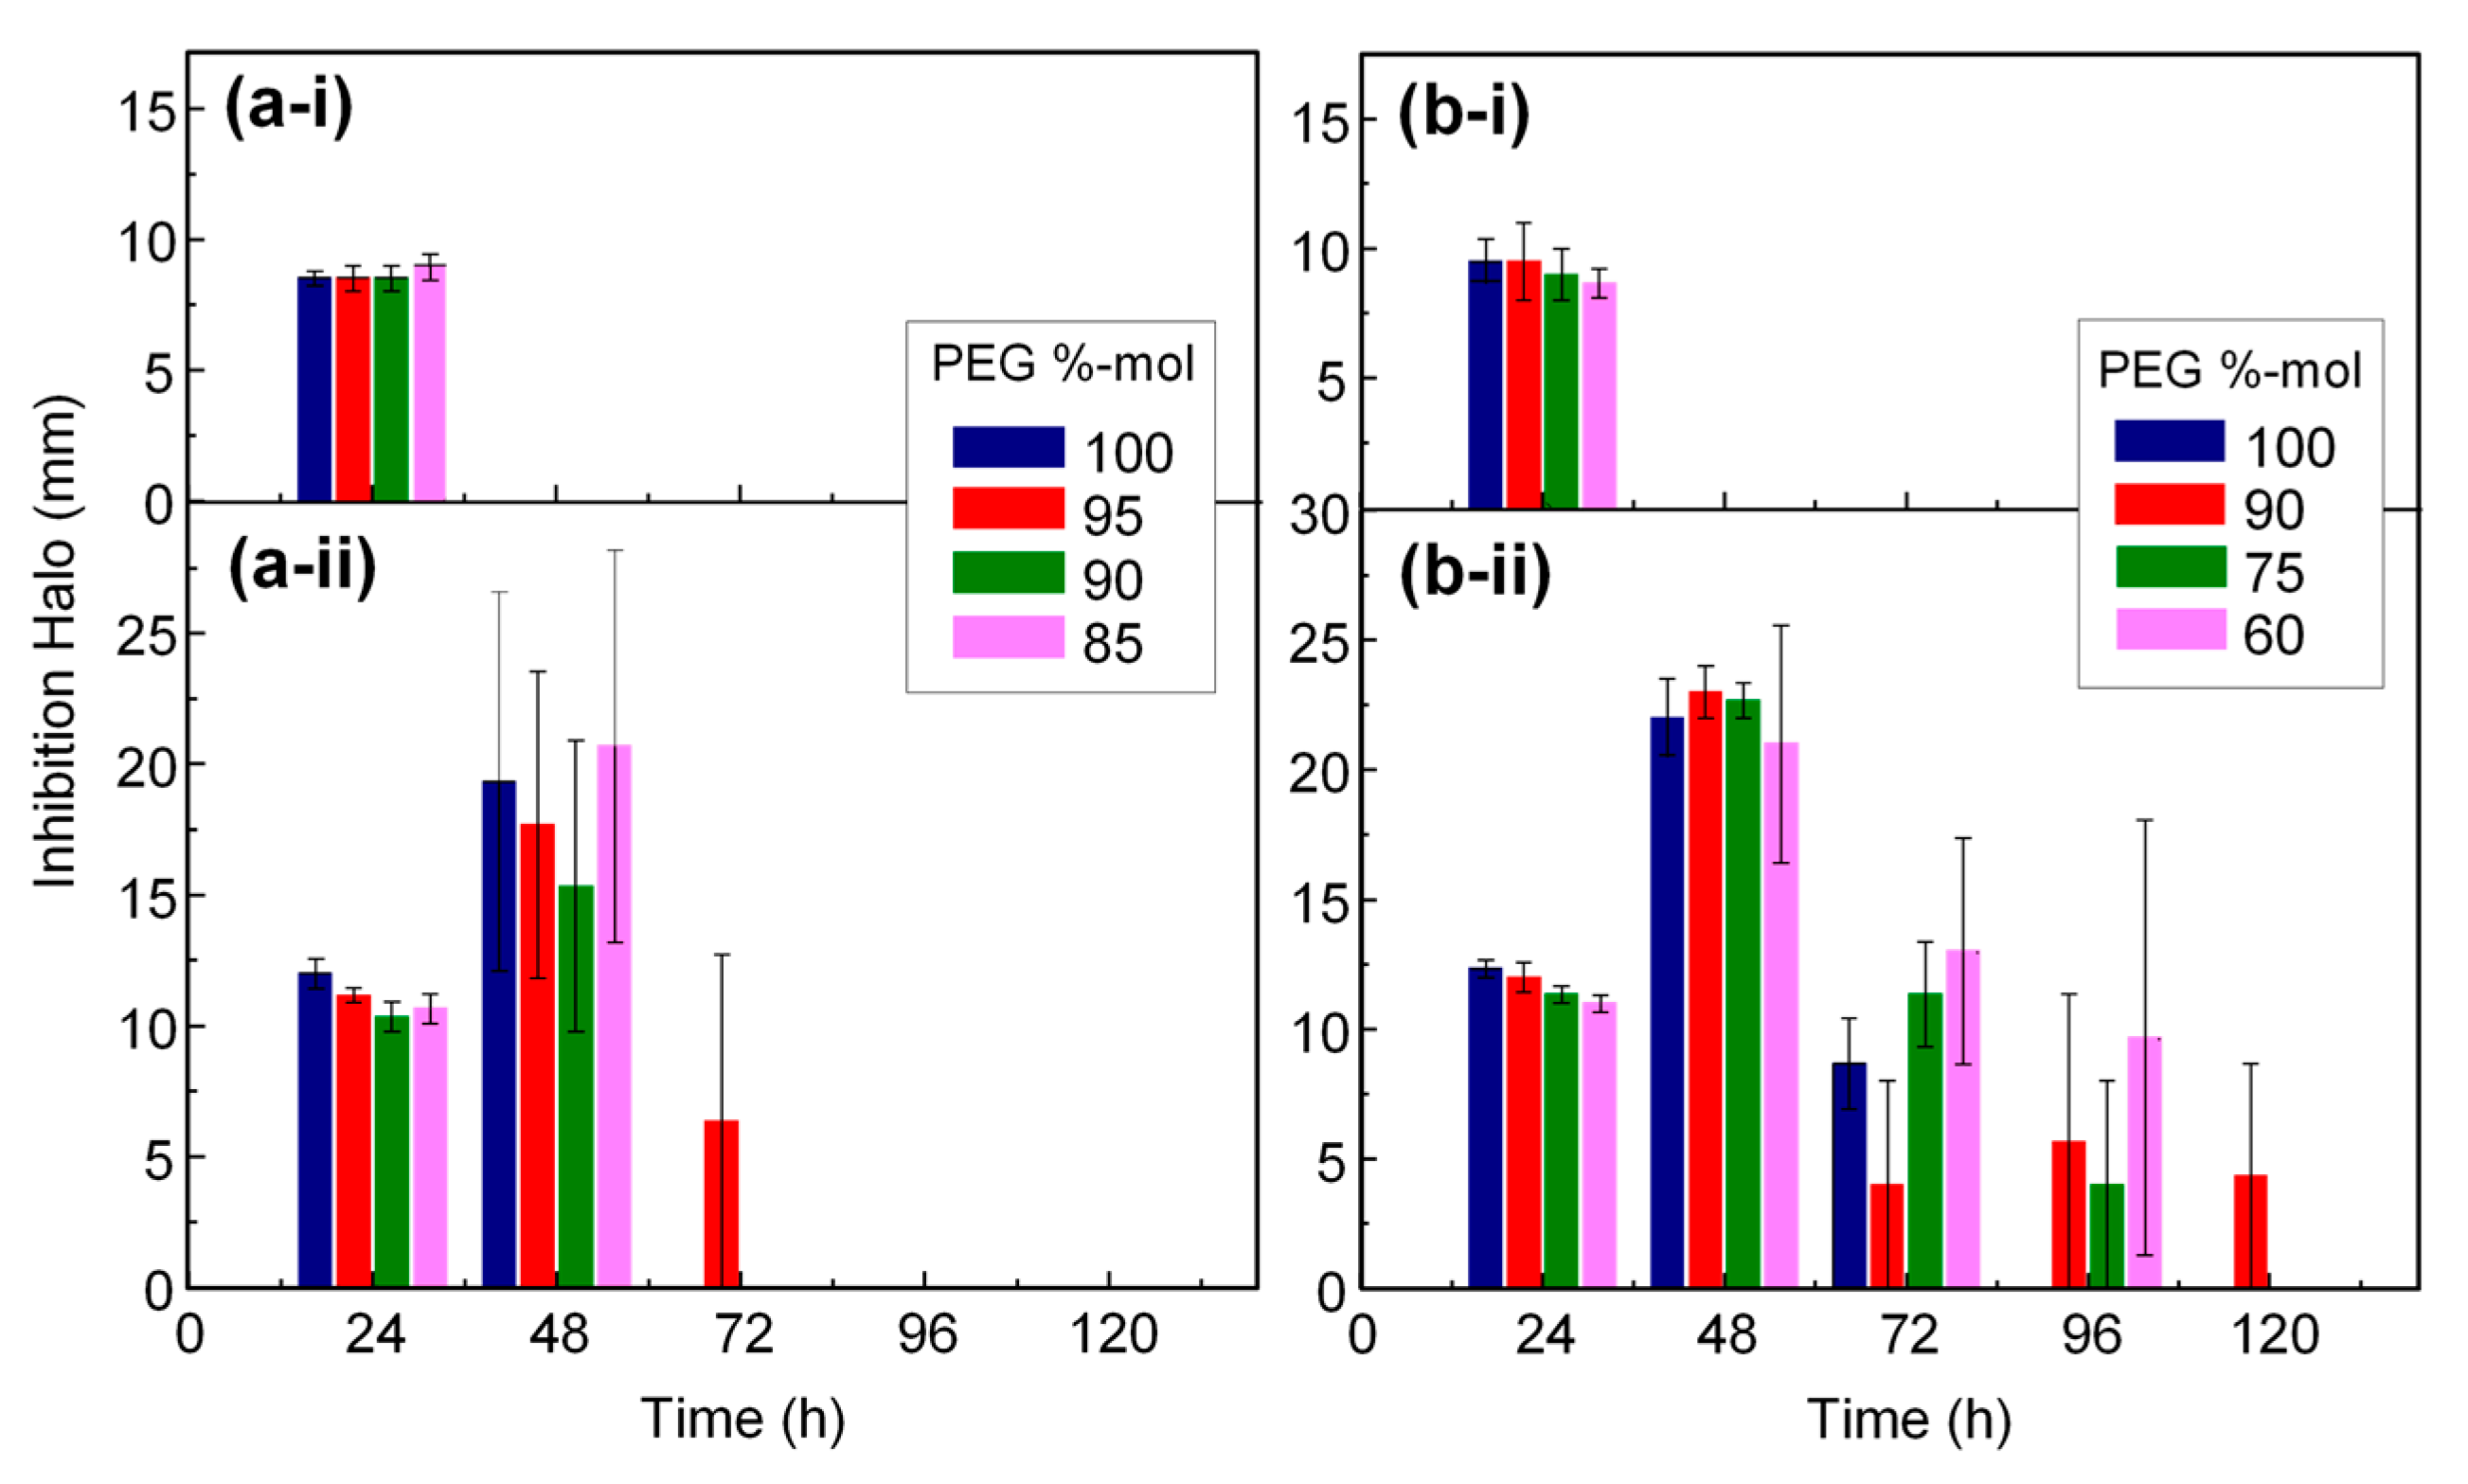
3.5. Antimicrobial Properties
4. Conclusions
Supplementary Materials
Acknowledgments
Author Contributions
Conflicts of Interest
References
- Rizzello, L.; Pompa, P.P. Nanosilver-based antibacterial drugs and devices: Mechanisms, methodological drawbacks, and guidelines. Chem. Soc. Rev. 2014, 43, 1501–1518. [Google Scholar] [CrossRef] [PubMed]
- Rai, M.K.; Deshmukh, S.D.; Ingle, A.P.; Gade, A.K. Silver nanoparticles: the powerful nanoweapon against multidrug-resistant bacteria. J. Appl. Microbiol. 2012, 112, 841–852. [Google Scholar] [CrossRef] [PubMed]
- Hajipour, M.J.; Fromm, K.M.; Akbar Ashkarran, A.; Jimenez de Aberasturi, D.; Ruiz de Larramendi, I.; Rojo, T.; Serpooshan, V.; Parak, W.J.; Mahmoudi, M. Antibacterial properties of nanoparticles. Trends Biotechnol. 2012, 30, 499–511. [Google Scholar] [CrossRef] [PubMed]
- Eckhardt, S.; Brunetto, P.S.; Gagnon, J.; Priebe, M.; Giese, B.; Fromm, K.M. Nanobio Silver: Its Interactions with Peptides and Bacteria, and Its Uses in Medicine. Chem. Rev. 2013, 113, 4708–4754. [Google Scholar] [CrossRef] [PubMed]
- Wang, L.; Hu, C.; Shao, L. The antimicrobial activity of nanoparticles: Present situation and prospects for the future. Int. J. Nanomed. 2017, 12, 1227–1249. [Google Scholar] [CrossRef] [PubMed]
- Nowack, B.; Krug, H.F.; Height, M. 120 years of nanosilver history: Implications for policy makers. Environ. Sci. Technol. 2011, 45, 1177–1183. [Google Scholar] [CrossRef] [PubMed]
- Brett, D.W. A discussion of silver as an antimicrobial agent: Alleviating the confusion. Ostomy Wound Manag. 2006, 52, 34–41. [Google Scholar]
- Reithofer, M.R.; Lakshmanan, A.; Ping, A.T.K.; Chin, J.M.; Hauser, C.A.E. In situ synthesis of size-controlled, stable silver nanoparticles within ultrashort peptide hydrogels and their anti-bacterial properties. Biomaterials 2014, 35, 7535–7542. [Google Scholar] [CrossRef] [PubMed]
- Leawhiran, N.; Pavasant, P.; Soontornvipart, K.; Supaphol, P. Gamma irradiation synthesis and characterization of AgNP/gelatin/PVA hydrogels for antibacterial wound dressings. J. Appl. Polym. Sci. 2014, 131. [Google Scholar] [CrossRef]
- Gil, E.S.; Hudson, S.M. Stimuli-reponsive polymers and their bioconjugates. Prog. Polym. Sci. 2004, 29, 1173–1222. [Google Scholar] [CrossRef]
- Hoffman, A.S. Hydrogels for biomedical applications. Adv. Drug Deliv. Rev. 2002, 54, 3–12. [Google Scholar] [CrossRef]
- Peppas, N.A.; Bures, P.; Leobandung, W.; Ichikawa, H. Hydrogels in pharmaceutical formulations. Eur. J. Pharm. Biopharm. 2000, 50, 27–46. [Google Scholar] [CrossRef]
- Castellano, J.J.; Shafii, S.M.; Ko, F.; Donate, G.; Wright, T.E.; Mannari, R.J.; Payne, W.G.; Smith, D.J.; Robson, M.C. Comparative evaluation of silver-containing antimicrobial dressings and drugs. Int. Wound J. 2007, 4, 114–122. [Google Scholar] [CrossRef] [PubMed]
- Travan, A.; Pelillo, C.; Donati, I.; Marsich, E.; Benincasa, M.; Scarpa, T.; Semeraro, S.; Turco, G.; Gennaro, R.; Paoletti, S. Non-cytotoxic Silver Nanoparticle-Polysaccharide Nanocomposites with Antimicrobial Activity. Biomacromolecules 2009, 10, 1429–1435. [Google Scholar] [CrossRef] [PubMed]
- GhavamiNejad, A.; Park, C.H.; Kim, C.S. In Situ Synthesis of Antimicrobial Silver Nanoparticles within Antifouling Zwitterionic Hydrogels by Catecholic Redox Chemistry for Wound Healing Application. Biomacromolecules 2016, 17, 1213–1223. [Google Scholar] [CrossRef] [PubMed]
- Huang, J.-F.; Zhong, J.; Chen, G.-P.; Lin, Z.-T.; Deng, Y.; Liu, Y.-L.; Cao, P.-Y.; Wang, B.; Wei, Y.; Wu, T.; et al. A Hydrogel-Based Hybrid Theranostic Contact Lens for Fungal Keratitis. ACS Nano 2016, 10, 6464–6473. [Google Scholar] [CrossRef] [PubMed]
- Fazly Bazzaz, B.S.; Khameneh, B.; Jalili-Behabadi, M.M.; Malaekeh-Nikouei, B.; Mohajeri, S.A. Preparation, characterization and antimicrobial study of a hydrogel (soft contact lens) material impregnated with silver nanoparticles. Contact Lens Anterior Eye 2014, 37, 149–152. [Google Scholar] [CrossRef] [PubMed]
- Alarcon, E.I.; Udekwu, K.I.; Noel, C.W.; Gagnon, L.B.P.; Taylor, P.K.; Vulesevic, B.; Simpson, M.J.; Gkotzis, S.; Islam, M.M.; Lee, C.-J.; et al. Safety and efficacy of composite collagen-silver nanoparticle hydrogels as tissue engineering scaffolds. Nanoscale 2015, 7, 18789–18798. [Google Scholar] [CrossRef] [PubMed]
- Marsich, E.; Bellomo, F.; Turco, G.; Travan, A.; Donati, I.; Paoletti, S. Nano-composite scaffolds for bone tissue engineering containing silver nanoparticles: Preparation, characterization and biological properties. J. Mater. Sci. Mater. Med. 2013, 24, 1799–1807. [Google Scholar] [CrossRef] [PubMed]
- Alarcon, E.I.; Vulesevic, B.; Argawal, A.; Ross, A.; Bejjani, P.; Podrebarac, J.; Ravichandran, R.; Phopase, J.; Suuronen, E.J.; Griffith, M. Coloured cornea replacements with anti-infective properties: Expanding the safe use of silver nanoparticles in regenerative medicine. Nanoscale 2016, 8, 6484–6489. [Google Scholar] [CrossRef] [PubMed]
- Sheeney-Haj-Ichia, L.; Sharabi, G.; Willner, I. Control of the electronic properties of thermosensitive poly(N-isopropylacrylamide) and Au-nanoparticle/poly(N-isopropylacrylamide) composite hydrogels upon phase transition. Adv. Funct. Mater. 2002, 12, 27–32. [Google Scholar] [CrossRef]
- Wang, C.; Flynn, N.T.; Langer, R. Controlled structure and properties of thermoresponsive nanoparticle-hydrogel composites. Adv. Mater. 2004, 16, 1074–1079. [Google Scholar] [CrossRef]
- Zhao, X.; Ding, X.; Deng, Z.; Zheng, Z.; Peng, Y.; Long, X. Thermoswitchable electronic properties of a gold nanoparticle/hydrogel composite. Macromol. Rapid Comm. 2005, 26, 1784–1787. [Google Scholar] [CrossRef]
- Sershen, S.R.; Westcott, S.L.; Halas, N.J.; West, J.L. Temperature-sensitive polymer-nanoshell composites for photothermally modulated drug delivery. J. Biomed. Mater. Res. 2000, 51, 293–298. [Google Scholar] [CrossRef]
- Uygun, M.; Kahveci, M.U.; Odaci, D.; Timur, S.; Yagci, Y. Antibacterial acrylamide hydrogels containing silver nanoparticles by simultaneous photoinduced free radical polymerization and electron transfer processes. Macromol. Chem. Phys. 2009, 210, 1867–1875. [Google Scholar] [CrossRef]
- Saez, S.; Fasciani, C.; Stamplecoskie, K.G.; Gagnon, L.B.-P.; Mah, T.-F.; Marin, M.L.; Alarcon, E.I.; Scaiano, J.C. Photochemical synthesis of biocompatible and antibacterial silver nanoparticles embedded within polyurethane polymers. Photochem. Photobiol. Sci. 2015, 14, 661–664. [Google Scholar] [CrossRef] [PubMed]
- Zhang, Z.; Ni, J.; Chen, L.; Yu, L.; Xu, J.; Ding, J. Biodegradable and thermoreversible PCLA–PEG–PCLA hydrogel as a barrier for prevention of post-operative adhesion. Biomaterials 2011, 32, 4725–4736. [Google Scholar] [CrossRef] [PubMed]
- Soto-Quintero, A.; Meneses-Acosta, A.; Romo-Uribe, A. Tailoring the viscoelastic, swelling kinetics and antibacterial behavior of poly(ethylene glycol)-based hydrogels with polycaprolactone. Eur. Polym. J. 2015, 70, 1–17. [Google Scholar] [CrossRef]
- Alvarado-Tenorio, B.; Romo-Uribe, A.; Mather, P.T. Microstructure and phase behavior of POSS/PCL shape memory nanocomposites. Macromolecules 2011, 44, 5682–5692. [Google Scholar] [CrossRef]
- Kweon, H.; Yoo, M.K.; Park, I.K.; Kim, T.H.; Lee, H.C.; Lee, H.S.; Oh, J.S.; Akaike, T.; Cho, C.S. A novel degradable polycaprolactone networks for tissue engineering. Biomaterials 2003, 24, 801–808. [Google Scholar] [CrossRef]
- París, R.; Marcos-Fernández, A.; Quijada-Garrido, I. Synthesis and characterization of poly(ethylene glycol)-based thermo-responsive polyurethane hydrogels for controlled drug release. Polym. Adv. Technol. 2013, 24, 1062–1067. [Google Scholar] [CrossRef]
- Rydholm, A.E.; Bowman, C.N.; Anseth, K.S. Degradable thiol-acrylate photopolymers: polymerization and degradation behavior of an in situ forming biomaterial. Biomaterials 2005, 26, 4495–4506. [Google Scholar] [CrossRef] [PubMed]
- Díez-Peña, E.; Quijada-Garrido, I.; Barrales-Rienda, J.M. Hydrogen-Bonding Effects on the Dynamic Swelling of P(N-iPAAm-co-MAA) Copolymers. A Case of Autocatalytic Swelling Kinetics. Macromolecules 2002, 35, 8882–8888. [Google Scholar] [CrossRef]
- Grassie, N.; Perdomo Mendoza, G.A. Thermal degradation of polyether-urethanes: Part 1-Thermal degradation of poly(ethylene glycols) used in the preparation of polyurethanes. Polym. Degrad. Stab. 1984, 9, 155–165. [Google Scholar] [CrossRef]
- Fu, H.; Gao, H.; Wu, G.; Wang, Y.; Fan, Y.; Ma, J. Preparation and tunable temperature sensitivity of biodegradable polyurethane nanoassemblies from diisocyanate and poly(ethylene glycol). Soft Matter 2011, 7, 3546–3552. [Google Scholar] [CrossRef]
- Saeki, S.; Kuwahara, N.; Nakata, M.; Kaneko, M. Upper and lower critical solution temperatures in poly (ethylene glycol) solutions. Polymer 1976, 17, 685–689. [Google Scholar] [CrossRef]
- Dormidontova, E.E. Influence of End Groups on Phase Behavior and Properties of PEO in Aqueous Solutions. Macromolecules 2004, 37, 7747–7761. [Google Scholar] [CrossRef]
- Lee, K.J.; Jun, B.H.; Choi, J.; Lee, Y.I.; Joung, J.; Oh, Y.S. Environmentally friendly synthesis of organic-soluble silver nanoparticles for printed electronics. Nanotechnology 2007, 18, 335601. [Google Scholar] [CrossRef]
- Shankar, R.; Groven, L.; Amert, A.; Whites, K.W.; Kellar, J.J. Non-aqueous synthesis of silver nanoparticles using tin acetate as a reducing agent for the conductive ink formulation in printed electronics. J. Mater. Chem. 2011, 21, 10871–10877. [Google Scholar] [CrossRef]
- Karak, N.; Konwarh, R.; Voit, B. Catalytically Active Vegetable-Oil-Based Thermoplastic Hyperbranched Polyurethane/Silver Nanocomposites. Macromol. Mater. Eng. 2010, 295, 159–169. [Google Scholar] [CrossRef]
- Van Hyning, D.L.; Klemperer, W.G.; Zukoski, C.F. Characterization of colloidal stability during precipitation reactions. Langmuir 2001, 17, 3120–3127. [Google Scholar] [CrossRef]
- Graves, J.L.; Tajkarimi, M.; Cunningham, Q.; Campbell, A.; Nonga, H.; Harrison, S.H.; Barrick, J.E. Rapid evolution of silver nanoparticle resistance in Escherichia coli. Front. Genet. 2015, 6, 1–13. [Google Scholar] [CrossRef] [PubMed]
- Raho, R.; Paladini, F.; Lombardi, F.A.; Boccarella, S.; Zunino, B.; Pollini, M. In-situ photo-assisted deposition of silver particles on hydrogel fibers for antibacterial applications. Mater. Sci. Eng. C 2015, 55, 42–49. [Google Scholar] [CrossRef] [PubMed]
- Martínez-Castañón, G.A.; Niño-Martínez, N.; Martínez-Gutierrez, F.; Martínez-Mendoza, J.R.; Ruiz, F. Synthesis and antibacterial activity of silver nanoparticles with different sizes. J. Nanopart. Res. 2008, 10, 1343–1348. [Google Scholar] [CrossRef]
- Ng, V.W.L.; Chan, J.M.W.; Sardon, H.; Ono, R.J.; García, J.M.; Yang, Y.Y.; Hedrick, J.L. Antimicrobial hydrogels: A new weapon in the arsenal against multidrug-resistant infections. Adv. Drug Deliv. Rev. 2014, 78, 46–62. [Google Scholar] [CrossRef] [PubMed]
- Salick, D.A.; Pochan, D.J.; Schneider, J.P. Design of an injectable β-hairpin peptide hydrogel that kills methicillin-resistant staphylococcus aureus. Adv. Mater. 2009, 21, 4120–4123. [Google Scholar] [CrossRef]


| Hydrogel a | Tmax (°C) | Tg (°C) | Tm (°C) | Ag-Nanocomposites | Tmax (°C) | Tg (°C) | Tm (°C) |
|---|---|---|---|---|---|---|---|
| PSA100 | 376 | −45 | 43 | Ag–PSA PEG 100 | 378 | −46 | 44 |
| PSA95 | 367 | −47 | 44 | Ag–PSA PEG 95 | 365 | −48 | 46 |
| PSA90 | 394 | −51 | 42 | Ag–PSA PEG 90 | 383 | −52 | 44 |
| PSA85 | 389 | −53 | 41 | Ag–PSA PEG 85 | 385 | −52 | 43 |
| PSA PCL | 403 | −58 | 54 | Ag–PSA PCL | - | - | - |
| PU100 | 351 | −44 | - | Ag–PU PEG 100 | 376 | −44 | - |
| PU95 | 341 | −42 | - | Ag–PU PEG 95 | - | - | - |
| PU90 | 360 | −43 | - | Ag–PU PEG 90 | 382 | −45 | - |
| PU85 | 356 | −43 | - | Ag–PU PEG 85 | 350 | −43 | - |
| PU80 | 364 | −42 | - | Ag–PU PEG 80 | - | - | - |
| PU75 | 356 | −43 | - | Ag–PU PEG 75 | 351 | −43 | - |
| PU70 | 357 | −41 | - | Ag–PU PEG 70 | - | - | - |
| PU60 | 357 | −41 | - | Ag–PU PEG 60 | 358 | −43 | - |
| PU–PCL | 330 | −35 | - | Ag–PU PCL | - | - | - |
| Sample | Temperature of Synthesis (°C) | SPR Maximum Wavelength (nm) | SPR Maximum Absorbance |
|---|---|---|---|
| Ag–PSA PEG 100 | 103 | 405.7 ± 0.6 | 0.83 ± 0.05 |
| Ag–PSA PEG 95 | 409.2 ± 0.7 | 0.41 ± 0.03 | |
| Ag–PSA PEG 90 | 406.2 ± 0.7 | 0.25 ± 0.02 | |
| Ag–PSA PEG 85 | 406.5 ± 0.8 | 0.37 ± 0.02 | |
| Ag–PU PEG 100 | 4 | 419.9 ± 0.8 | 1.02 ± 0.05 |
| Ag–PU PEG 90 | 421.3 ± 1.1 | 1.22 ± 0.04 | |
| Ag–PU PEG 85 | 416.8 ± 0.6 | 1.61 ± 0.06 | |
| Ag–PU PEG 75 | 416.1 ± 0.9 | 1.60 ± 0.05 | |
| Ag–PU PEG 60 | 418.7 ± 0.9 | 1.75 ± 0.05 |
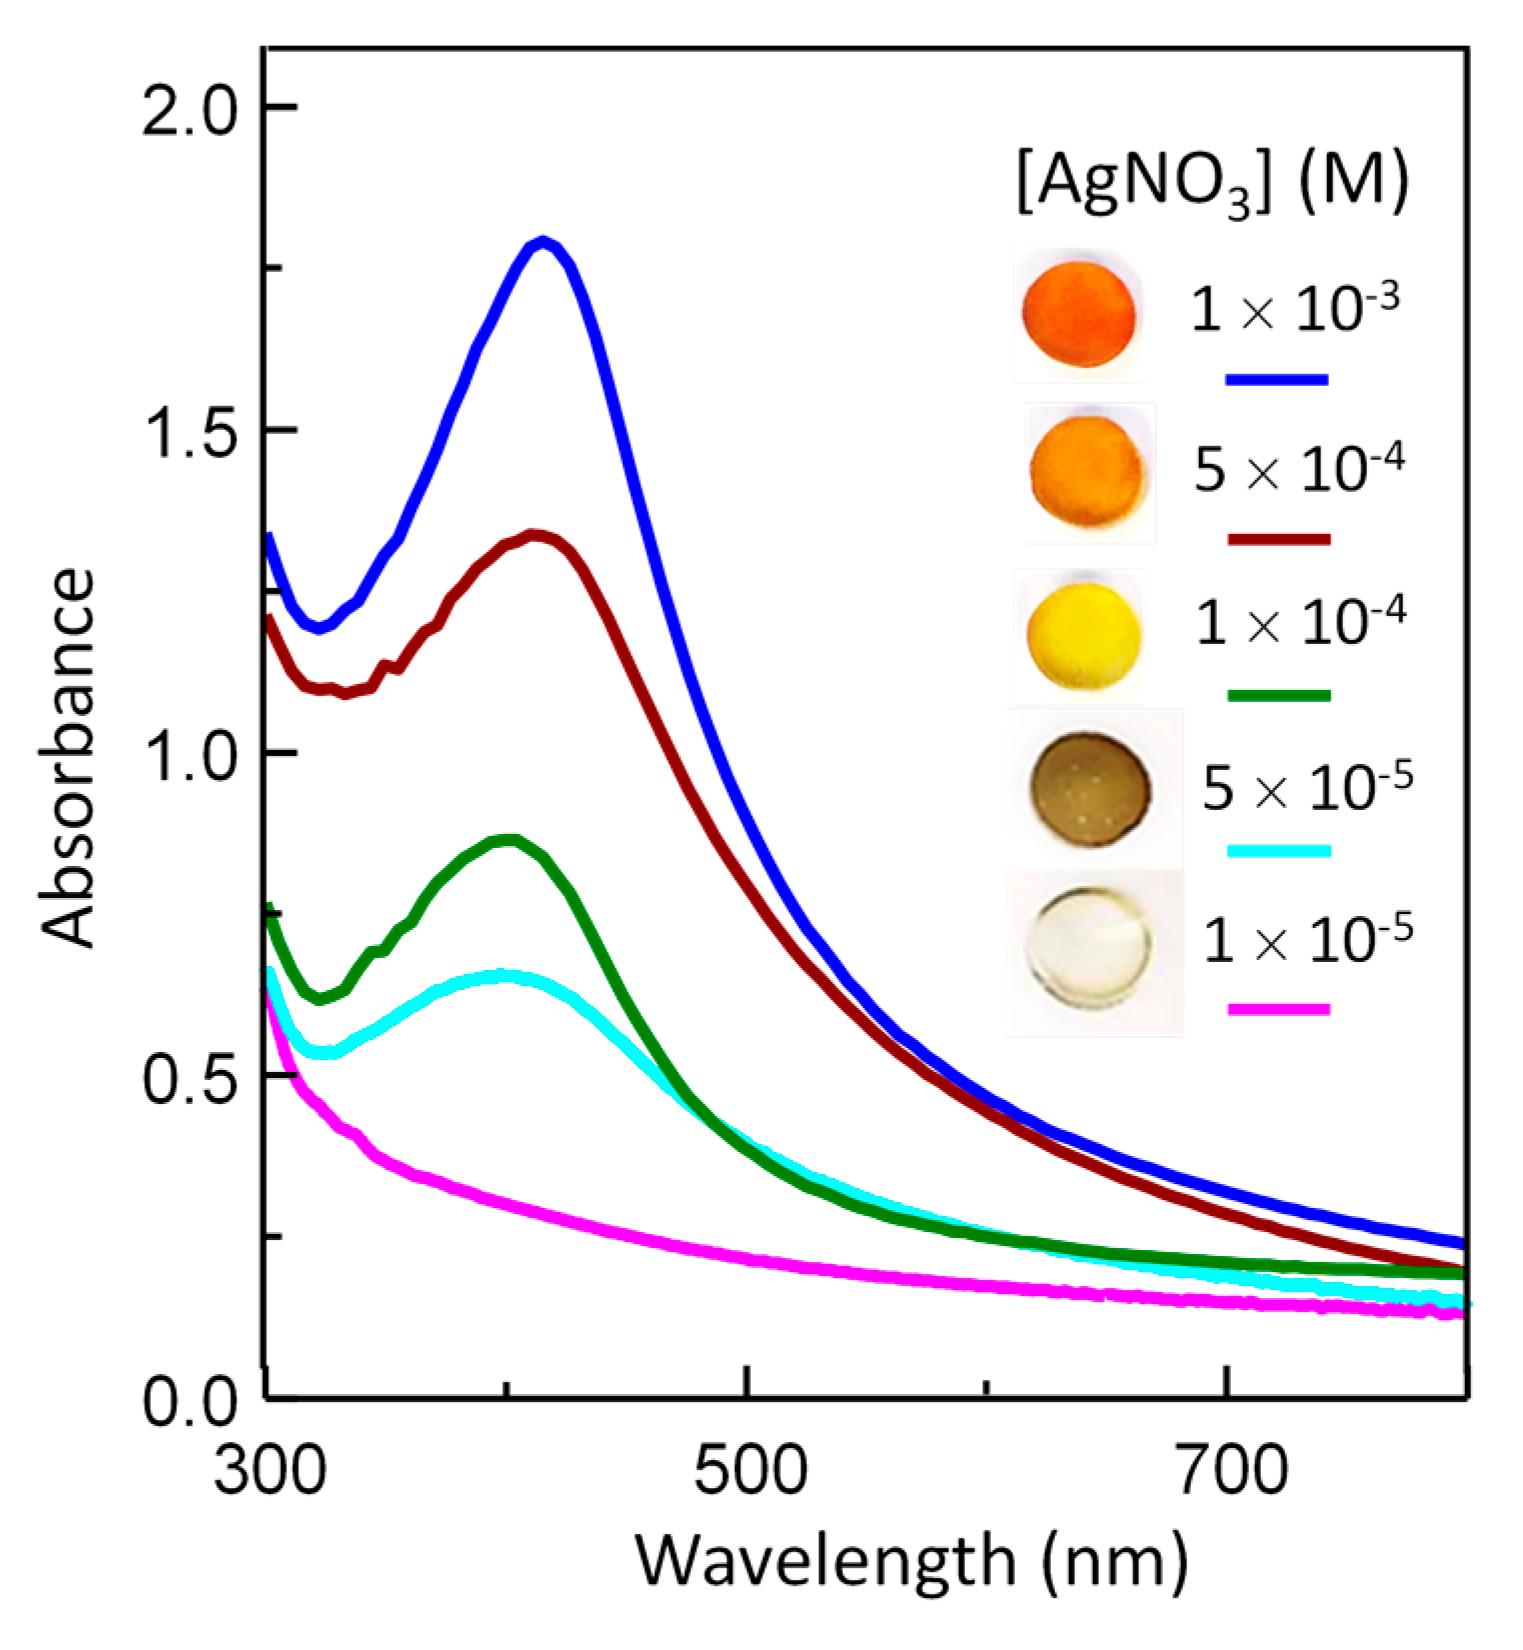
| Sample | AgNO3 (M) | SPR Maximum Wavelength (nm) | SPR Maximum Absorbance |
|---|---|---|---|
| Ag–PU PEG 85-1 | 1 × 10⁻³ | 416.8 ± 0.6 | 1.61 ± 0.06 |
| Ag–PU PEG 85-2 | 5 × 10⁻⁴ | 412.9 ± 0.4 | 1.15 ± 0.05 |
| Ag–PU PEG 85-3 | 1 × 10⁻⁴ | 400.8 ± 0.7 | 0.64 ± 0.03 |
| Ag–PU PEG 85-3 | 5 × 10⁻⁵ | 397.7 ± 0.5 | 0.52 ± 0.02 |
| Ag–PU PEG 85-3 | 1 × 10⁻⁵ | - | 0 |
© 2017 by the authors. Licensee MDPI, Basel, Switzerland. This article is an open access article distributed under the terms and conditions of the Creative Commons Attribution (CC BY) license (http://creativecommons.org/licenses/by/4.0/).
Share and Cite
Soto-Quintero, A.; Romo-Uribe, Á.; Bermúdez-Morales, V.H.; Quijada-Garrido, I.; Guarrotxena, N. 3D-Hydrogel Based Polymeric Nanoreactors for Silver Nano-Antimicrobial Composites Generation. Nanomaterials 2017, 7, 209. https://doi.org/10.3390/nano7080209
Soto-Quintero A, Romo-Uribe Á, Bermúdez-Morales VH, Quijada-Garrido I, Guarrotxena N. 3D-Hydrogel Based Polymeric Nanoreactors for Silver Nano-Antimicrobial Composites Generation. Nanomaterials. 2017; 7(8):209. https://doi.org/10.3390/nano7080209
Chicago/Turabian StyleSoto-Quintero, Albanelly, Ángel Romo-Uribe, Víctor H. Bermúdez-Morales, Isabel Quijada-Garrido, and Nekane Guarrotxena. 2017. "3D-Hydrogel Based Polymeric Nanoreactors for Silver Nano-Antimicrobial Composites Generation" Nanomaterials 7, no. 8: 209. https://doi.org/10.3390/nano7080209