Rapid Evaporation of Water on Graphene/Graphene-Oxide: A Molecular Dynamics Study

1
Chongqing Key Laboratory of Heterogeneous Material Mechanics, College of Aerospace Engineering, Chongqing University, Chongqing 400044, China
2
Key Laboratory of Low-Grade Energy Utilization Technology & System, Ministry of Education, College of Power Engineering, Chongqing University, Chongqing 400044, China
3
Department of Earth and Environmental Engineering, Columbia University, New York, NY 10027, USA
*
Author to whom correspondence should be addressed.
Nanomaterials 2017, 7(9), 265; https://doi.org/10.3390/nano7090265
Submission received: 6 August 2017
/
Revised: 2 September 2017
/
Accepted: 5 September 2017
/
Published: 7 September 2017
(This article belongs to the Special Issue Nanomaterials for Renewable and Sustainable Energy)
Abstract
:To reveal the mechanism of energy storage in the water/graphene system and water/grapheme-oxide system, the processes of rapid evaporation of water molecules on the sheets of graphene and graphene-oxide are investigated by molecular dynamics simulations. The results show that both the water/graphene and water/grapheme-oxide systems can store more energy than the pure water system during evaporation. The hydroxyl groups on the surface of graphene-oxide are able to reduce the attractive interactions between water molecules and the sheet of graphene-oxide. Also, the radial distribution function of the oxygen atom indicates that the hydroxyl groups affect the arrangement of water molecules at the water/graphene-oxide interface. Therefore, the capacity of thermal energy storage of the water/graphene-oxide system is lower than that of the water/graphene system, because of less desorption energy at the water/graphene-oxide interface. Also, the evaporation rate of water molecules on the graphene-oxide sheet is slower than that on the graphene sheet. The Leidenfrost phenomenon can be observed during the evaporation process in the water/grapheme-oxide system.

1. Introduction
The development of modern society is accompanied by severe problems such as energy crises, environmental pollution and greenhouse effects [1], etc. Enhancing the efficiency of energy utilization is one of the effective ways to ease these problems. Using nanofluids to improve the thermophysical properties of working fluid is an ideal approach to optimize energy utilization [2,3]. Studies have reported [4,5,6,7] that the thermal conductivity of working fluid can be enhanced by adding nanoparticles. As a novel working medium, nanofluids have great applications in the fields of energy, biochemistry, automotive, construction, aerospace and so on [8,9,10,11].
Also, the unique mechanism of energy storage of nanofluids has been proposed. A large amount of fluid molecules is able to adhere to the surface of nanoporous materials due to the attractive fluid–solid interaction. More energy is needed to desorb the fluid molecules from the surface of nanoporous materials. Therefore, this kind of nanofluid will store more energy than pure working fluid via the adsorption/desorption processes. Chen et al. [12,13] performed extensive research on the energy absorption of nanofluids in carbon nanotube under the actions of heat, force, and electric coupling fields. McGrail et al. [14] proposed using the metal-organic heat carrier nanofluids to improve the efficiency of the organic Rankine cycle. The novel working nanofluids have the potential to increase the power output by up to 15%.
One method to enhance the energy storage in nanofluids is to increase the surface area of nanomaterials. Graphene and graphene-oxide are the novel carbon-based nanomaterials which can be considered as the ultimate case of the family of flat polycyclic aromatic hydrocarbons. The specific surface area of graphene and graphene-oxide is ultra large, and the thermal conductivity of graphene is up to 5200 W/(m∙K) [15]. Therefore, graphene based materials have great prospects in the field of energy storage based on the absorption/desorption process at the fluid–solid interface.
So far, the reported experiments about phase transition of fluid on graphene based materials have focused on nucleation or condensation. Kimmel et al. [16] observed a metastable ice on graphene by experiments and ab initio molecular dynamics simulations. Severin et al. [17,18] investigated the properties of condensed water and water/ethanol in the grapheme–mica slit by scanning force microscopy. Algara-Siller et al. [19] found a novel structure of ice (square ice) in graphene nanosheets based on experiments and molecular dynamics (MD) simulations. Zheng et al. [20] observed the ice nucleation on graphite. Bampoulis et al. [21,22,23,24] studied the ice and water/alcohol in graphene/mica/MoS2 slits by atomic force microscopy.
2. Model and Computational Method
MD is a method which can describe the movement, structure and geometry of molecules by classical mechanics. MD has been proven to be an efficient tool to reveal the micro/nano-mechanisms of novel materials.
2.1. Simulation Model
The configurations of water molecules on graphene and graphene-oxide are shown in Figure 1. The configurations of atoms are visualized by the open software OVITO [27]. The water/graphene system is composed of a single graphene layer (880 carbon atoms) and 2560 water molecules. The size of the simulation box is X: 0–50 Å, Y: 0–50 Å, Z: 0–115 Å. The water molecules form a thin film on the XOY plane. The system expands in the direction of the Z axis during evaporation. Similarly, the water/grapheme-oxide system is composed of a single graphene-oxide layer (880 carbon atoms and 81 hydroxyl, –OH) and 2560 water molecules, which are in a simulation box of the same size. As noted, experiments have shown that the hydroxyl groups and epoxy groups are randomly distributed on a monolayer of graphene-oxide [20]. Here, the monolayer of graphene-oxide is only constructed by carbon atoms and hydroxyl groups for simplicity [28].
2.2. Modeling Parameters
MD simulations are performed by using LAMMPS (large-scale atomic molecular massively parallel simulator) [29]. The OPLS [30] (Optimized Potentials for Liquid Simulations) potential is employed to describe the interactions between particles,
where Enb(φ) is the non-bonding energy, Ebond(φ) is the stretching energy, Eangle(φ) is the bending energy, Etorsion(φ) is the dihedral energy. The details of these energies are shown as follows,
where kr is the elastic constant of the bond, req is the equilibrium bond length, kθ is the bond angle bending elastic constant, θeq is the equilibrium angle.
where , are the charges of two particles, rij is the distance between two atoms, εij is the potential energy, σij is the length parameters.
is the distortion constant of the dihedral angle, Φi is the dihedral angle, fi is the phase angle. Note the phase angle is 0 in the model. The potential parameters of the studied particles in the manuscript are shown in Table 1.
Periodic boundary conditions are applied to the X, Y and Z directions. The Nose–Hoover algorithm [31] controls the temperature of the system. The cutoff radius is 12 Å and the timestep is 0.1 fs in the simulations. Initially, the systems in Figure 1 are equilibrated at 300 K for 1,000,000 steps in NVT ensemble. Then, the systems are heated to 1000 K in 1,000,000 steps. Next, the systems are maintained at 1000 K for 1,000,000 steps. The three simulation periods are denoted as 300 K, 300–1000 K, and 1000 K in the next section. Also, the water/graphene system and water/graphene-oxide system are denoted as “G system” and “GO system”, respectively.
In addition, a pure water system (i.e., the G system in Figure 1a without the layer of graphene) is also simulated, which experiences the same simulation periods (300 K, 300–1000 K, and 1000 K). The energy changes during the process of evaporation in the pure water system are compared with the changes in the G system and the GO system.
3. Results and Discussion
3.1. Distribution of Water Molecules
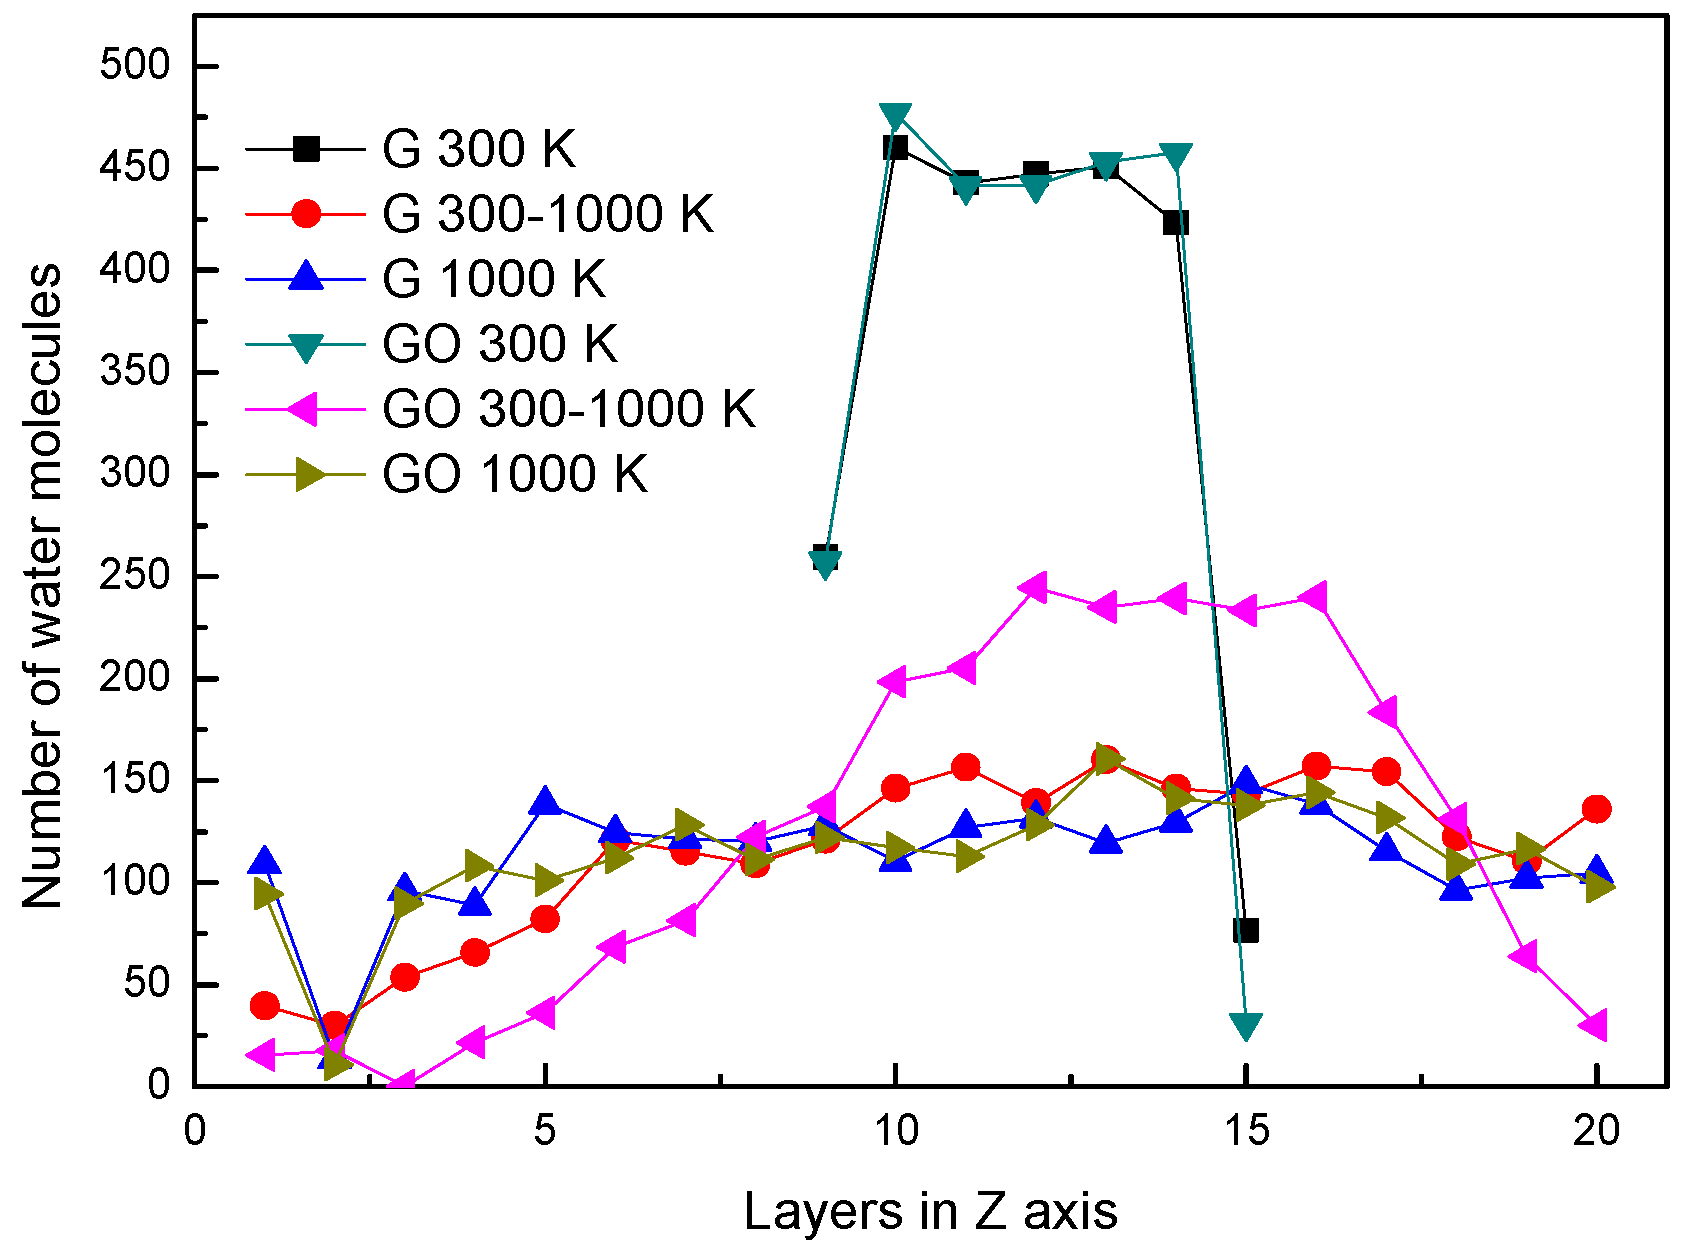
In the two systems, the distributions of water molecules during the end of each simulation period in the Z direction are shown in Figure 2. The simulation box is divided into 20 layers along the Z direction, in order to analyze the properties of water molecules. At the conditions of 300 K and 1000 K, the distributions of water molecules along the Z direction are similar in the G system and GO system. At the condition of 300 K, the water molecules clustered as a liquid state in several layers at the end of the simulation. At the condition of 1000 K, the water molecules distribute uniformly in the simulation box at the end of the simulation. This means that the water molecules in both systems have already evaporated. Note that at 300–1000 K, the number of water molecules in the layers of 10–14 in the GO system is larger than that in the G system. This indicates that a large amount of water molecules are still agglomerated in the GO system. In other words, the amount of evaporated water molecules in the GO system is less than that in the G system during the end of the heating process at 300–1000 K.
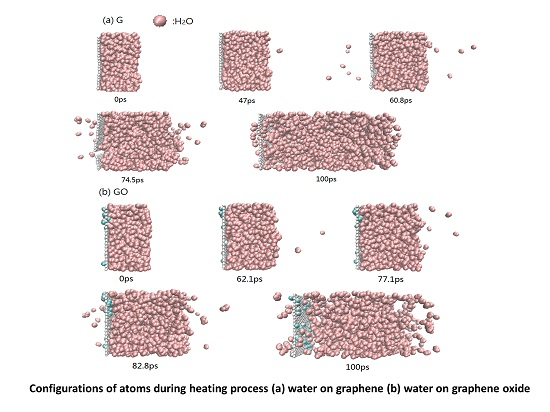
The snapshots of the heating process during 300–1000 K in the G system and GO system are shown in Figure 3. During the heating process, the first evaporated water molecule is observed at 47.0 ps in the G system, while the other is observed at 62.1 ps in the GO system. As the heating continues, more water molecules evaporate from both systems. At the end of the simulation, the Leidenfrost phenomenon [32] is obviously observed in the GO system: the water clusters are separated from the surface of grapheme-oxide sheet. The phenomenon is due to the interaction force between the fluid and solid. Because the interaction force between water molecules and the sheet of graphene is larger than that between water molecules and the sheet of grapheme-oxide, the Leidenfrost phenomenon is only observed in the GO system. The existence of hydroxyl groups in the GO system could increase the distance between water molecules and the carbon atoms on the surface of grapheme-oxide. The enlarged distance will reduce the attractive force between the carbon atoms of the grapheme-oxide sheet and the water molecules. In other words, the existence of hydroxyl groups reduces the adsorption capacity of the grapheme-oxide sheet. Therefore, in the evaporation process, the water molecules on the surface of grapheme-oxide will be separated from the surface of the grapheme-oxide sheet, resulting in the Leidenfrost phenomenon which could slow the evaporation rate of the water molecules.
3.2. Radial Distribution Function
The radial distribution function (RDF) represents how the density of a particle varies as a function of distance from a reference particle. Usually, RDF is used to analyze the phase state of particles in a system. Here, the RDFs of oxygen atoms of water molecules in the two systems are plotted in Figure 4. The similarity of the curves in the G system and the GO system indicates that the trends of phase transition of the water molecules are similar in the two systems. At the condition of 300 K, the RDFs have two peaks in both systems. The first peak of the RDF is at 2.82 Å and the second peak is at 4.41 Å in both systems. The positions of the two peaks are in accordance with our previous study of liquid water [26,33]. Also, the RDFs indicate that water molecules at 300 K are in a denser state than those at 300–1000 K and 1000 K; the RDFs of 300–1000 K and 1000 K only have one peak which indicates that the water molecules are in gaseous form. By comparing the RDFs in the two systems, the G(r) in the GO system is larger than that in the G system at the corresponding simulation period, especially at the condition of 300–1000 K. This indicates that the water molecules are denser and more agglomerative in the GO system at 300–1000 K. Therefore, the phase transition in the GO system needs more time to break the network of hydrogen bonds among water molecules, thereby reducing the evaporation rate.
3.3. F3 Order Parameter of Water Molecules
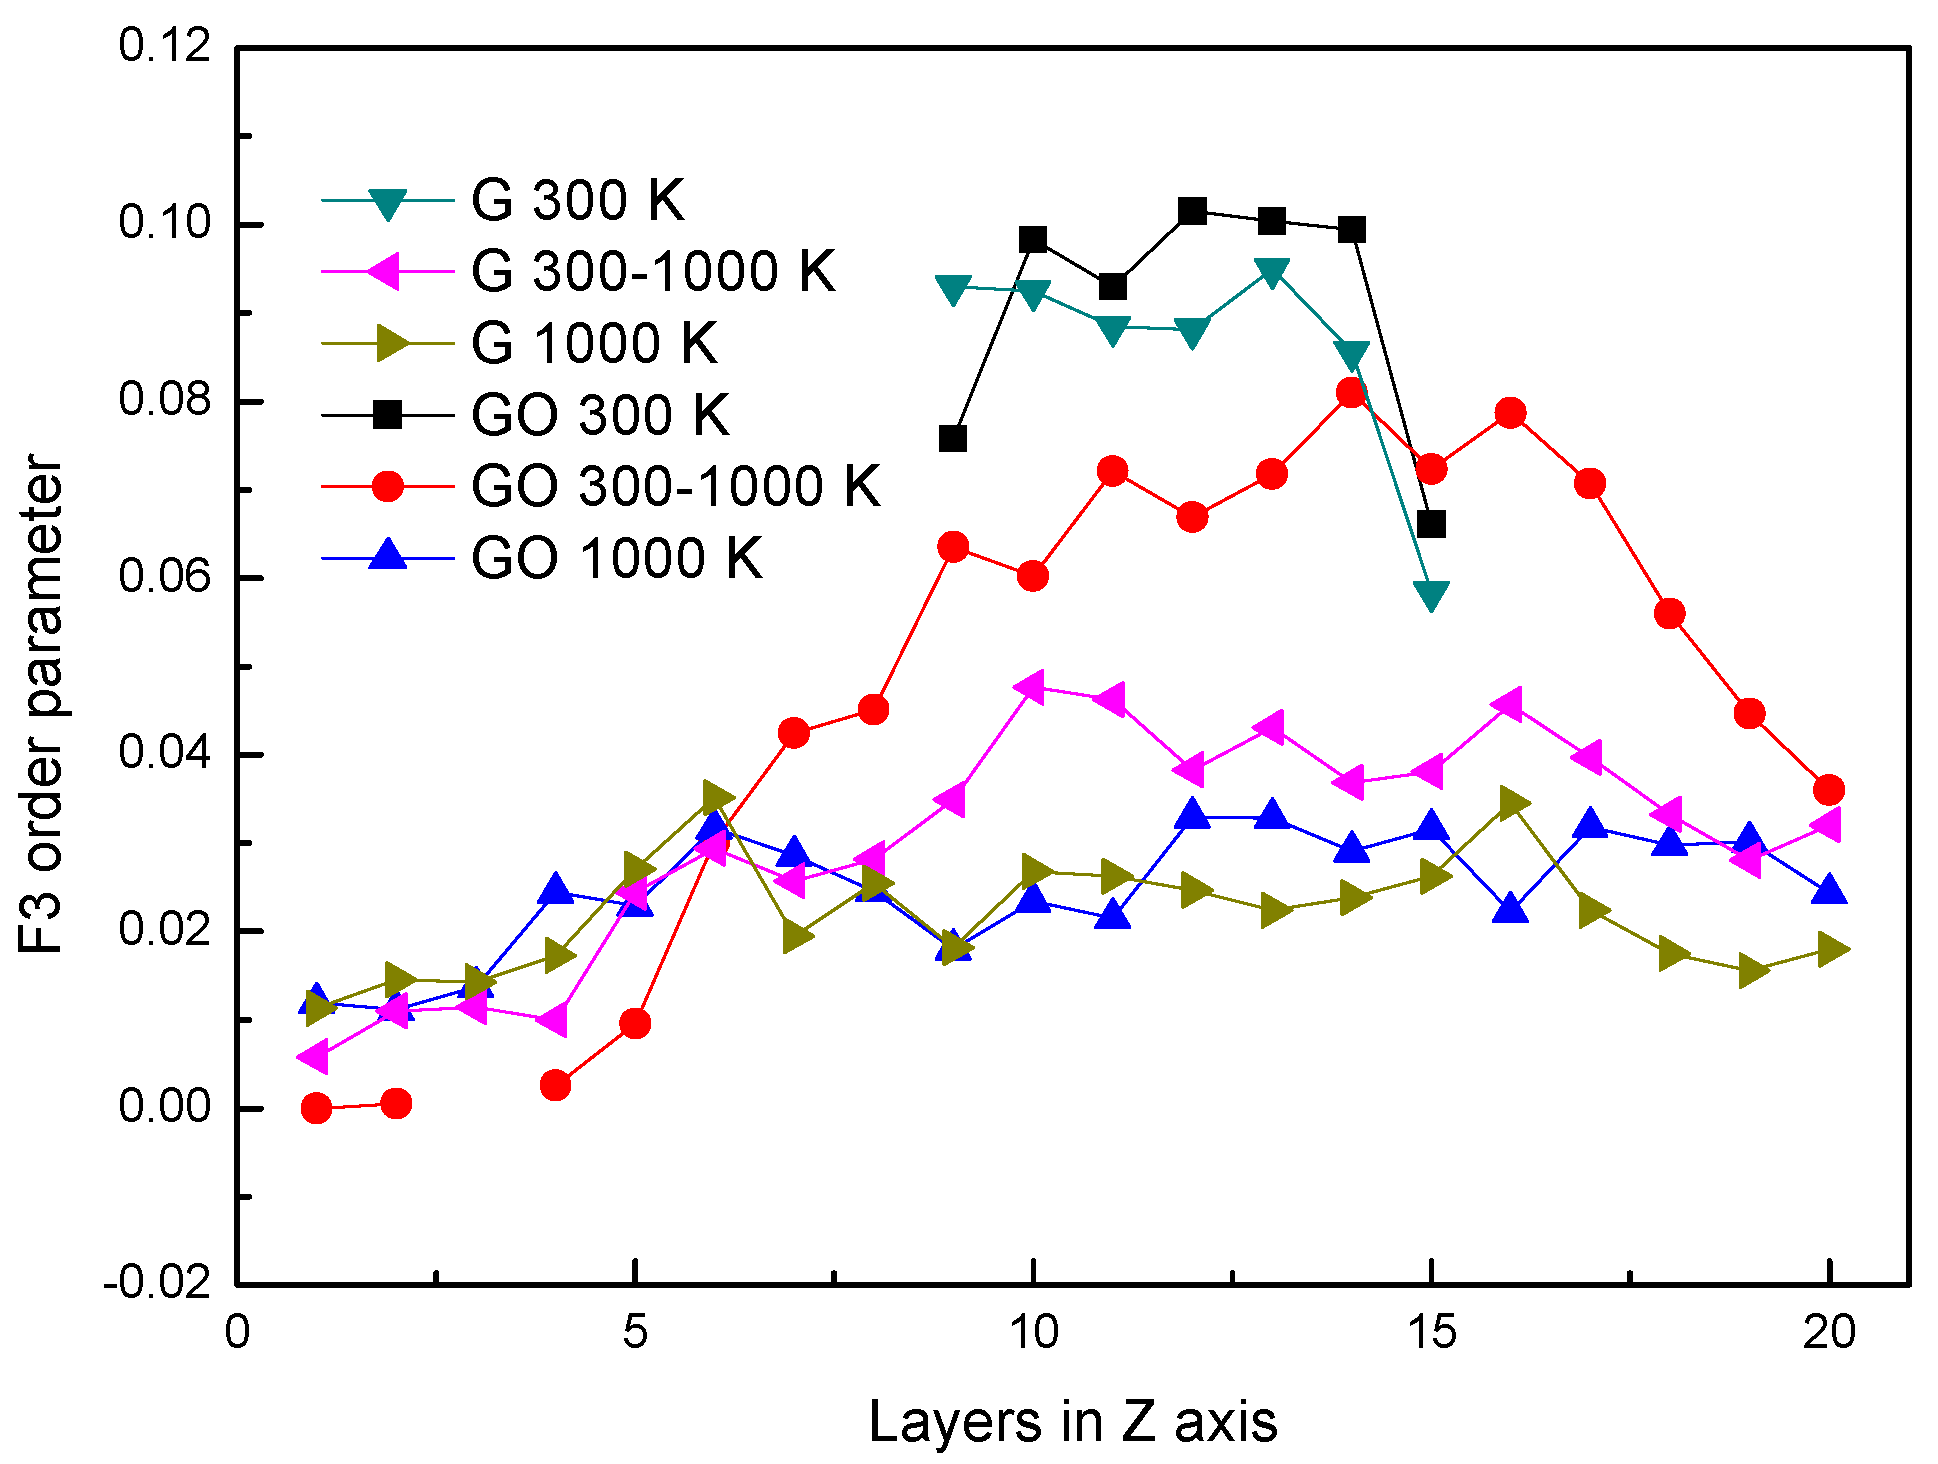
It has been reported [34] that the water molecules are orderly arranged in the microscopic form which can be expressed by the order parameter. Although the order parameter of water molecules is usually applied to analyze condensed water molecules, the F3 order parameter is employed to investigate the difference of microstructures of water molecules in the G system and the GO system during the evaporation process. The F3 consists of a three-body configuration, which indicates that the degree of tetrahedral arrangement is formed by any one oxygen atom and other oxygen atoms around it, defined as,
where φjik is the angle between the specified oxygen atom i and the other two oxygen atoms around it; 109.47° is the angle of H–O–H. For the crystal structure of water (hydrate and ice), the oxygen atom and the surrounding four oxygen atoms in water molecules form a saturated hydrogen bond. The F3 is zero in the whole system, while F3 is 0.1 in the case of liquid water.
In Figure 5, the distributions of F3 in different systems are similar to Figure 2. The distributions of F3s are almost the same at 300 K in both systems. However, at the same period, the F3 in the GO system is smaller than that in the leftmost part of the G system. It shows that the existence of hydroxyl groups could influence the arrangement of oxygen atoms in water molecules at the fluid–solid interface. The F3s have little difference in both systems after evaporation.
3.4. Energy Storage in the Systems
Theoretically, the thermal energy storage in the novel nanofluids consists of three parts: (1) the phase transition energy of the working fluid, (2) the energy change of the solid nanoparticles during heating, and (3) the desorption energy at the fluid–solid interface. The total energy change of the system during evaporation is regarded as the sum of the three energies. The total energy change in the G system (EG) and the GO system (EGO) are compared in Table 2. Note that the energy change in the pure water system is designated as EWater. The results show that both the G system and GO system can store more energy than the pure water system, and the G system can store more energy than the GO system. This is because hydroxyl groups in grapheme-oxide can reduce the adsorption capacity between the sheet of grapheme-oxide and water molecules, which results in lower desorption energy at the fluid–solid interface.
4. Conclusions
The rapid evaporation processes of water molecules on the graphene and graphene-oxide sheets were studied by molecular dynamics in this paper. The results draw the following conclusions:
The water molecules in the water/graphene system evaporate faster than that in the water/graphene-oxide system. The water molecules are denser in the water/graphene-oxide system. The Leidenfrost phenomenon can be observed in the water/graphene-oxide system, which is caused by hydroxyl groups on the surface of graphene-oxide. The hydroxyl groups also result in the disorder arrangement of the oxygen atoms in water molecules in the water/graphene-oxide system. Both the water/graphene system and the water/graphene-oxide system can store more energy than the pure water system. However, the existence of hydroxyl groups will reduce the desorption energy at the fluid–solid interface and result in less energy storage in the water/graphene-oxide system than that in the water/graphene system.
Acknowledgments
This work is supported by National Natural Science Foundation of China (No. 51506013). Thanks to Evvan Morton at School of Sustainable Engineering & Built Environment, Arizona State University for English proofing.
Author Contributions
Yitian Xiao and Qibin Li conceived and designed the simulations; Yitian Xiao performed the simulations; Yitian Xiao, Sufeng Song, Qibin Li and Xiaoyang Shi analyzed the data; Sufeng Song, Qibin Li and Xiaoyang Shi wrote the paper.
Conflicts of Interest
The authors declare no conflict of interest.
References
- Shi, X.; Xiao, H.; Lackner, K.S.; Chen, X. Capture CO2 from ambient air using nanoconfined ion hydration. Angew. Chem. Int. Ed. 2016, 55, 4026–4029. [Google Scholar] [CrossRef] [PubMed]
- Choi, S.U.S.; Zhang, Z.G.; Yu, W.; Lockwood, F.E.; Grulke, E.A. Anomalous thermal conductivity enhancement in nanotube suspensions. Appl. Phys. Lett. 2001, 79, 2252–2254. [Google Scholar] [CrossRef]
- Saidur, R.; Leong, K.Y.; Mohammad, H.A. A review on applications and challenges of nanofluids. Renew. Sustain. Energy Rev. 2011, 15, 1646–1668. [Google Scholar] [CrossRef]
- Xuan, Y.; Li, Q. Heat transfer enhancement of nanofluids. Int. J. Heat Fluid Flow 2000, 21, 58–64. [Google Scholar] [CrossRef]
- Eastman, J.A.; Choi, S.U.S.; Li, S.; Yu, W.; Thompson, L.J. Anomalously increased effective thermal conductivities of ethylene glycol-based nanofluids containing copper nanoparticles. Appl. Phys. Lett. 2001, 78, 718–720. [Google Scholar] [CrossRef]
- Das, S.K.; Putra, N.; Thiesen, P.; Roetzel, W. Temperature dependence of thermal conductivity enhancement for nanofluids. J. Heat Transf. 2003, 125, 567–574. [Google Scholar] [CrossRef]
- Li, Q.; Yu, Y.; Liu, Y.; Liu, C.; Lin, L. Thermal properties of the mixed n-octadecane/Cu nanoparticle nanofluids during phase transition: A molecular dynamics study. Materials 2017, 10, 38. [Google Scholar] [CrossRef] [PubMed]
- Ashrafmansouri, S.S.; Nasr Esfahany, M. Mass transfer in nanofluids: A review. Int. J. Therm. Sci. 2014, 82, 84–99. [Google Scholar] [CrossRef]
- Mahian, O.; Kianifar, A.; Kalogirou, S.A.; Pop, I.; Wongwises, S. A review of the applications of nanofluids in solar energy. Int. J. Heat Mass Transf. 2013, 57, 582–594. [Google Scholar] [CrossRef]
- Chan, C.W.; Ling-Chin, J.; Roskilly, A.P. A review of chemical heat pumps, thermodynamic cycles and thermal energy storage technologies for low grade heat utilisation. Appl. Therm. Eng. 2013, 50, 1257–1273. [Google Scholar] [CrossRef]
- Sparreboom, W.; van den Berg, A.; Eijkel, J.C. Principles and applications of nanofluidic transport. Nat. Nanotechnol. 2009, 4, 713–720. [Google Scholar] [CrossRef] [PubMed]
- Chen, X.; Xu, B.; Liu, L. Nanoscale fluid mechanics and energy conversion. Appl. Mech. Rev. 2014, 66, 050803. [Google Scholar] [CrossRef]
- Xu, B.; Liu, L.; Lim, H.; Qiao, Y.; Chen, X. Harvesting energy from low-grade heat based on nanofluids. Nano Energy 2012, 1, 805–811. [Google Scholar] [CrossRef]
- McGrail, B.P.; Thallapally, P.K.; Blanchard, J.; Nune, S.K.; Jenks, J.J.; Dang, L.X. Metal-organic heat carrier nanofluids. Nano Energy 2013, 2, 845–855. [Google Scholar] [CrossRef]
- Balandin, A.A.; Ghosh, S.; Bao, W.; Calizo, I.; Teweldebrhan, D.; Miao, F.; Lau, C.N. Superior thermal conductivity of single-layer graphene. Nano Lett. 2008, 8, 902–907. [Google Scholar] [CrossRef] [PubMed]
- Kimmel, G.A.; Matthiesen, J.; Baer, M.; Mundy, C.J.; Petrik, N.G.; Smith, R.S.; Dohnalek, Z.; Kay, B.D. No confinement needed: Observation of a metastable hydrophobic wetting two-layer ice on graphene. J. Am. Chem. Soc. 2009, 131, 12838–12844. [Google Scholar] [CrossRef] [PubMed]
- Severin, N.; Lange, P.; Sokolov, I.M.; Rabe, J.P. Reversible dewetting of a molecularly thin fluid water film in a soft graphene–mica slit pore. Nano Lett. 2012, 12, 774–779. [Google Scholar] [CrossRef] [PubMed]
- Severin, N.; Sokolov, I.M.; Rabe, J.P. Dynamics of ethanol and water mixtures observed in a self-adjusting molecularly thin slit pore. Langmuir 2014, 30, 3455–3459. [Google Scholar] [CrossRef] [PubMed]
- Algara-Siller, G.; Lehtinen, O.; Wang, F.C.; Nair, R.R.; Kaiser, U.; Wu, H.A.; Geim, A.K.; Grigorieva, I.V. Square ice in graphene nanocapillaries. Nature 2015, 519, 443–445. [Google Scholar] [CrossRef] [PubMed]
- Zheng, Y.; Su, C.; Lu, J.; Loh, K.P. Room-temperature ice growth on graphite seeded by nano-graphene-oxide. Angew. Chem. Int. Ed. 2013, 52, 8708–8712. [Google Scholar] [CrossRef] [PubMed]
- Bampoulis, P.; Witteveen, J.P.; Kooij, E.S.; Lohse, D.; Poelsema, B.; Zandvliet, H.J.W. Structure and dynamics of confined alcohol–water mixtures. ACS Nano 2016, 10, 6762–6768. [Google Scholar] [CrossRef] [PubMed]
- Bampoulis, P.; Teernstra, V.J.; Lohse, D.; Zandvliet, H.J.W.; Poelsema, B. Hydrophobic ice confined between graphene and MoS2. J. Phys. Chem. C 2016, 120, 27079–27084. [Google Scholar] [CrossRef]
- Bampoulis, P.; Lohse, D.; Zandvliet, H.J.W.; Poelsema, B. Coarsening dynamics of ice crystals intercalated between graphene and supporting mica. Appl. Phys. Lett. 2016, 108, 011601. [Google Scholar] [CrossRef]
- Bampoulis, P.; Siekman, M.H.; Kooij, E.S.; Lohse, D.; Zandvliet, H.J.W.; Poelsema, B. Latent heat induced rotation limited aggregation in 2D ice nanocrystals. J. Chem. Phys. 2015, 143, 034702. [Google Scholar] [CrossRef] [PubMed]
- Frenkel, D.; Smit, B. Understanding Molecular Simulation: From Algorithms to Applications, 2nd ed.; Academic Press: New York, NY, USA, 2002; pp. 63–107. [Google Scholar]
- Li, Q.; Tang, Q.; Peng, T.; Zhang, X.; Liu, C.; Shi, X. Molecular characteristics of H2O in hydrate/ice/liquid water mixture. Int. J. Mod. Phys. B 2015, 29, 1550185. [Google Scholar] [CrossRef]
- Alexander, S. Visualization and analysis of atomistic simulation data with OVITO–the Open Visualization Tool. Model. Simul. Mater. Sci. 2010, 18, 015012. [Google Scholar]
- Liu, Y.; Xu, Z. Multimodal and self-healable interfaces enable strong and tough graphene-derived materials. J. Mech. Phys. Solids 2014, 70, 30–41. [Google Scholar] [CrossRef]
- Plimpton, S. Fast parallel algorithms for short-range molecular dynamics. J. Comput. Phys. 1995, 117, 1–19. [Google Scholar] [CrossRef]
- Jorgensen, W.L.; Madura, J.D.; Swenson, C.J. Optimized intermolecular potential functions for liquid hydrocarbons. J. Am. Chem. Soc. 1984, 106, 6638–6646. [Google Scholar] [CrossRef]
- Evans, D.J.; Holian, B.L. The Nose–Hoover thermostat. J. Chem. Phys. 1985, 83, 4069–4074. [Google Scholar] [CrossRef]
- Leidenfrost, J.G. On the fixation of water in diverse fire. Int. J. Heat Mass Transf. 1966, 9, 1153–1166. [Google Scholar] [CrossRef]
- Li, Q.; Liu, C.; Chen, X. Molecular characteristics of dissociated water with memory effect from methane hydrates. Int. J. Mod. Phys. B 2014, 28, 1450062. [Google Scholar] [CrossRef]
- BÁEz, L.A.; Clancy, P. Computer simulation of the crystal growth and dissolution of natural gas hydrates. Ann. N. Y. Acad. Sci. 1994, 715, 177–186. [Google Scholar] [CrossRef]
Figure 1.
Evaporation models. (a) Water/Graphene system; (b) Water/Graphene oxide system.
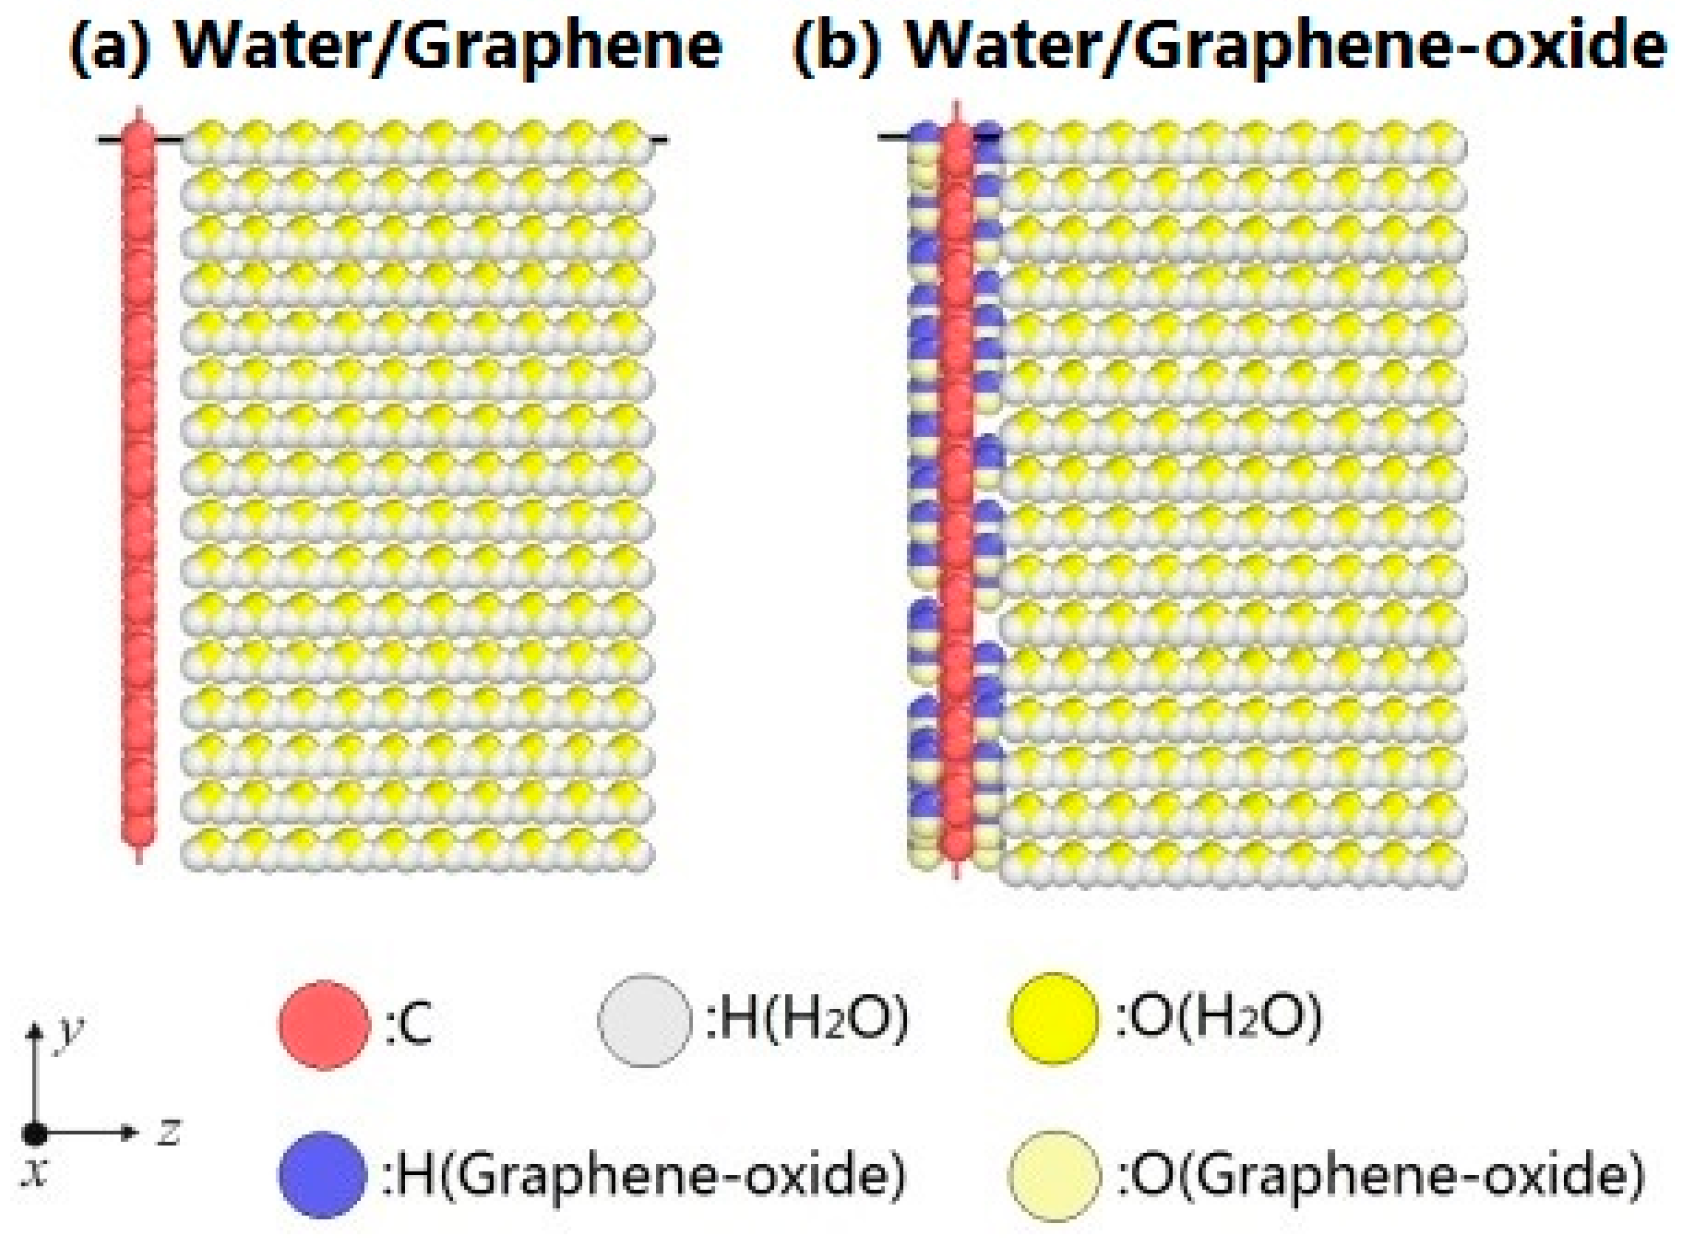
Figure 2.
Distribution of water molecules in the Z-axis.

Figure 3.
Configuration of atoms during the heating process at 300–1000 K (a) G system; (b) GO system.
Figure 3.
Configuration of atoms during the heating process at 300–1000 K (a) G system; (b) GO system.
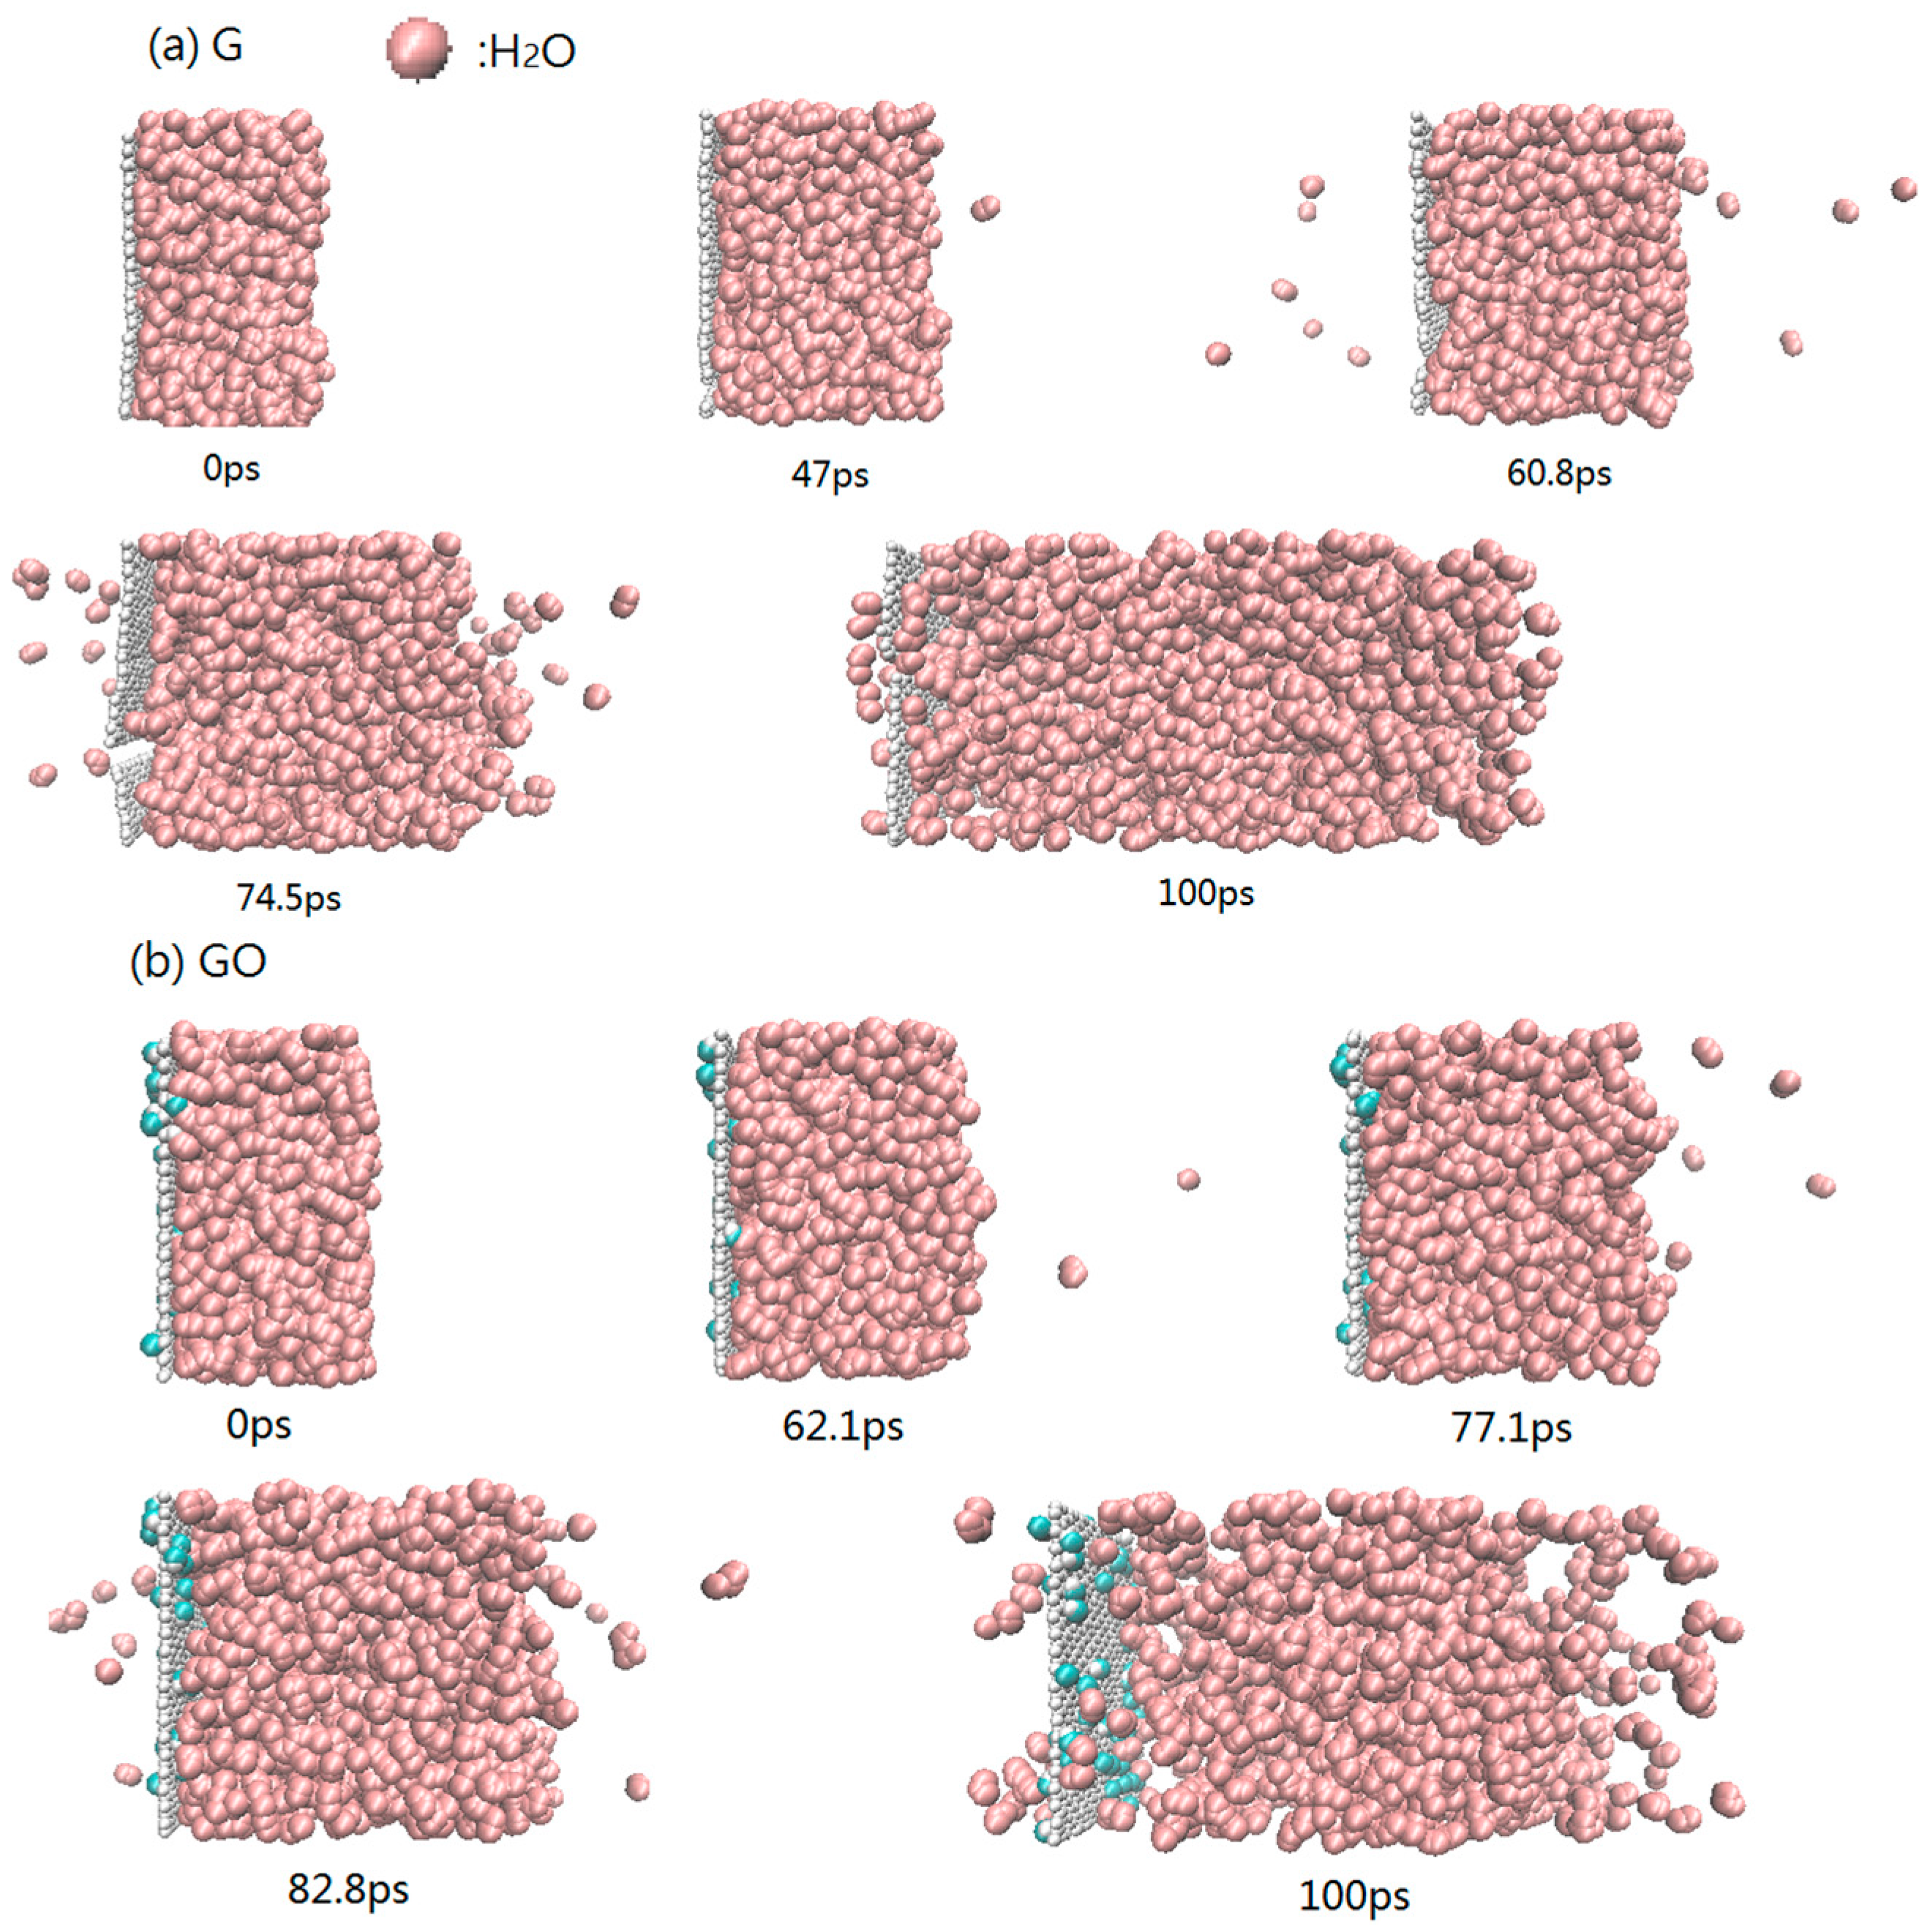
Figure 4.
Radial distribution function (RDF) of O–O atoms.
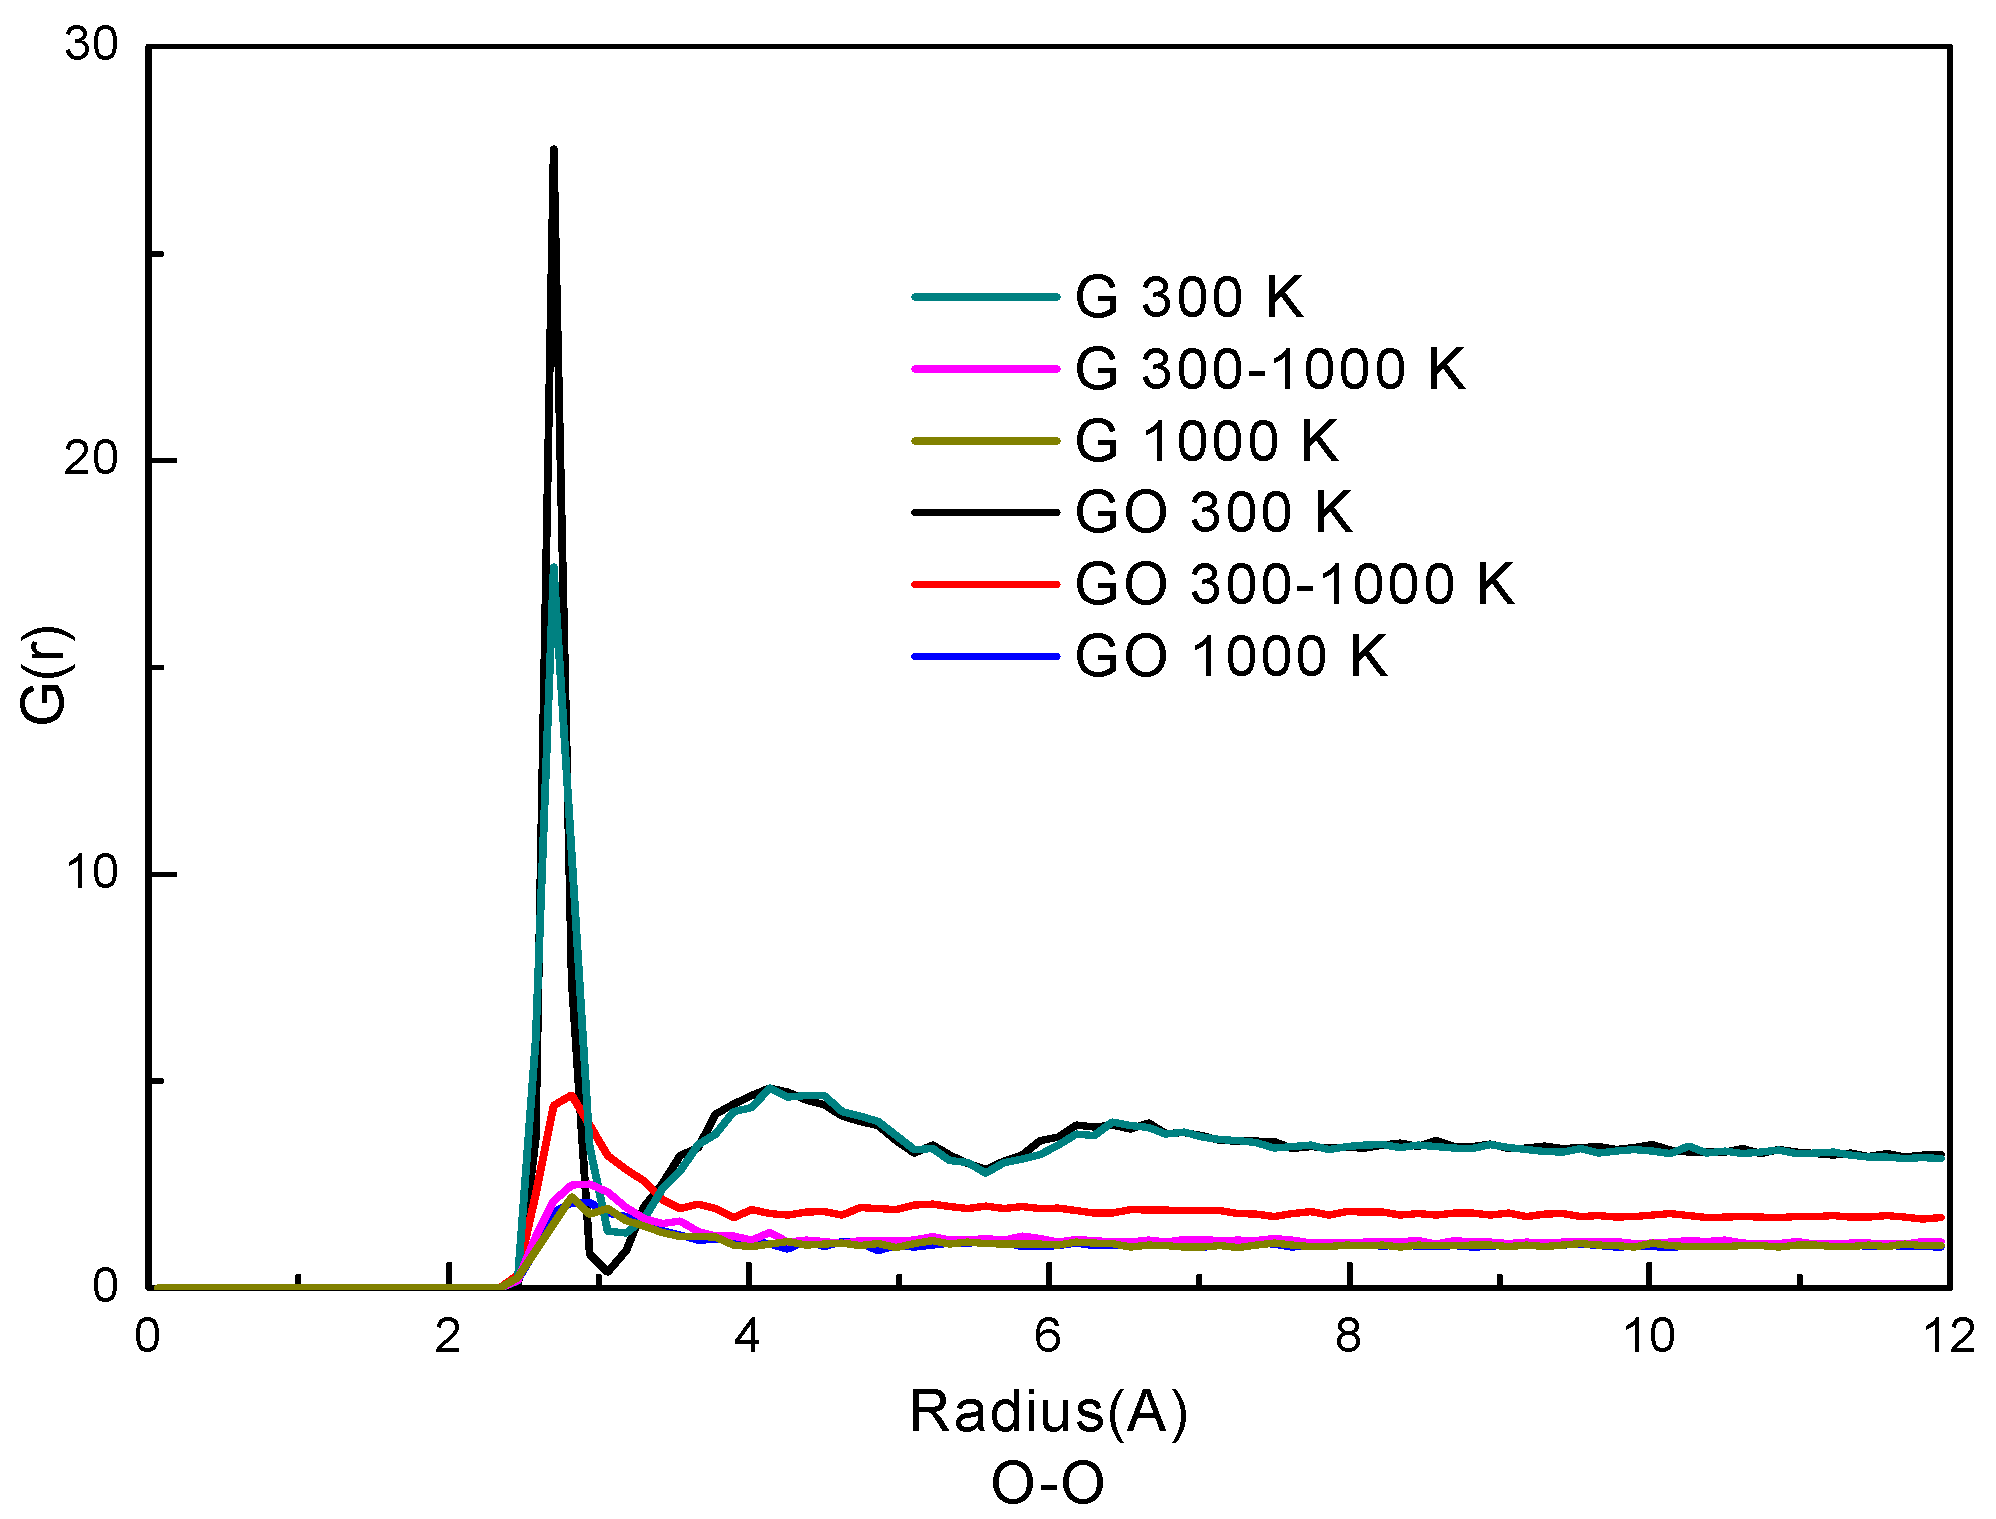
Figure 5.
F3 order parameter.


Table 1.
Optimized Potentials for Liquid Simulations (OPLS) potential parameters of particles [28].
Table 1.
Optimized Potentials for Liquid Simulations (OPLS) potential parameters of particles [28].
| Graphene | Graphene Oxide | H2O |
|---|---|---|
Note: Units of the parameters: ε (J/mol); σ (Å); r (Å); kr (J/(mol·Å2)); kθ (J/(mol·rad2)); θ (°); q (e).
Table 2.
The comparison of energy change in different systems.
| Ratio | Value |
|---|---|
| EG/EWater | 1.18 |
| EGO/EWater | 1.06 |
© 2017 by the authors. Licensee MDPI, Basel, Switzerland. This article is an open access article distributed under the terms and conditions of the Creative Commons Attribution (CC BY) license (http://creativecommons.org/licenses/by/4.0/).
Share and Cite
MDPI and ACS Style
Li, Q.; Xiao, Y.; Shi, X.; Song, S. Rapid Evaporation of Water on Graphene/Graphene-Oxide: A Molecular Dynamics Study. Nanomaterials 2017, 7, 265. https://doi.org/10.3390/nano7090265
AMA Style
Li Q, Xiao Y, Shi X, Song S. Rapid Evaporation of Water on Graphene/Graphene-Oxide: A Molecular Dynamics Study. Nanomaterials. 2017; 7(9):265. https://doi.org/10.3390/nano7090265
Chicago/Turabian StyleLi, Qibin, Yitian Xiao, Xiaoyang Shi, and Shufeng Song. 2017. "Rapid Evaporation of Water on Graphene/Graphene-Oxide: A Molecular Dynamics Study" Nanomaterials 7, no. 9: 265. https://doi.org/10.3390/nano7090265
Note that from the first issue of 2016, this journal uses article numbers instead of page numbers. See further details here.